classification of stars - ps.uci.eduyodh/physics20a/starpropertieslec.pdf · classification of...
TRANSCRIPT
Classification of StarsChapter 11
Topics :1. Colors, Temperature and Spectra of Stars.
2. Stellar distances: Astrometry
3. Stellar Luminosities or Power emitted
4. Herzsprung-Russell (Luminosity versus Temperature) distribution
5. Detecting stellar motions: Proper motions and radial velocities
6. Stellar binaries: How do we weigh stars.
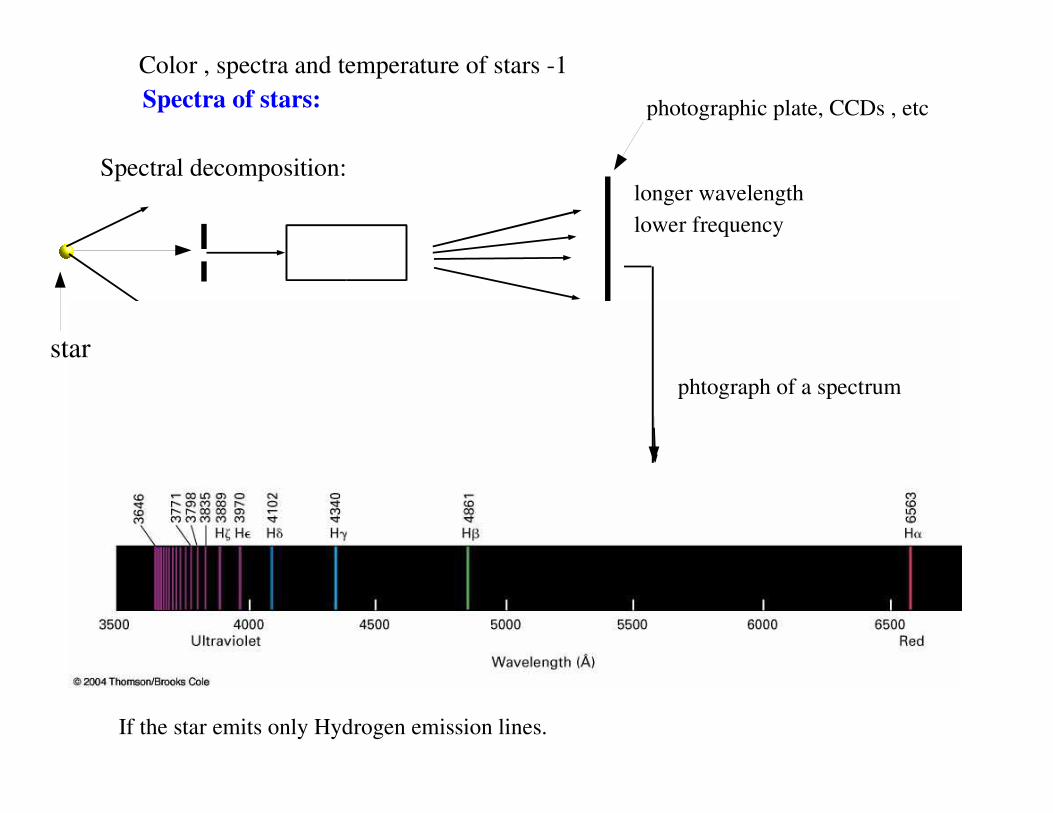
Spectra of stars:
Spectral decomposition:
slitspectrometerDisperses lightaccording to wavelength
shorter wavelengthhigher frequency
longer wavelengthlower frequency
If the star emits only Hydrogen emission lines.
Color , spectra and temperature of stars -1
star
photographic plate, CCDs , etc
phtograph of a spectrum
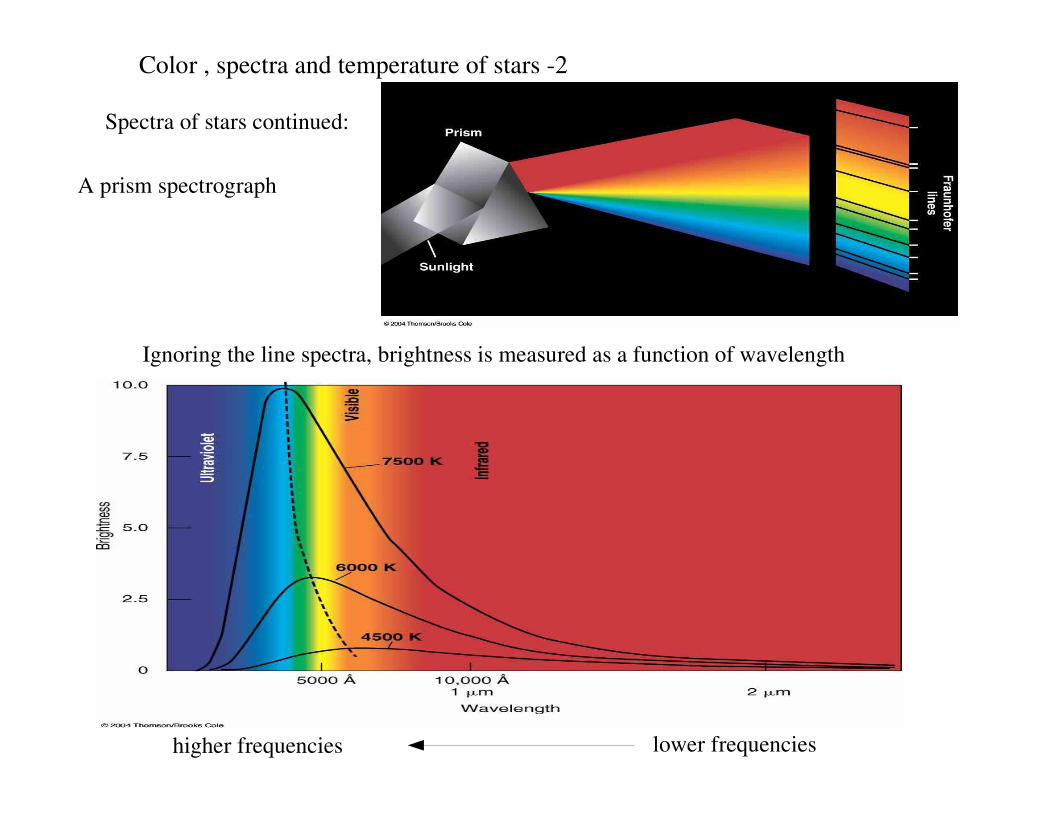
Spectra of stars continued:
Ignoring the line spectra, brightness is measured as a function of wavelength
lower frequencieshigher frequencies
Color , spectra and temperature of stars -2
A prism spectrograph

Spectra of stars with different surface temperatures and color index B-V as measure of temperature.
Color , spectra and temperature of stars -3
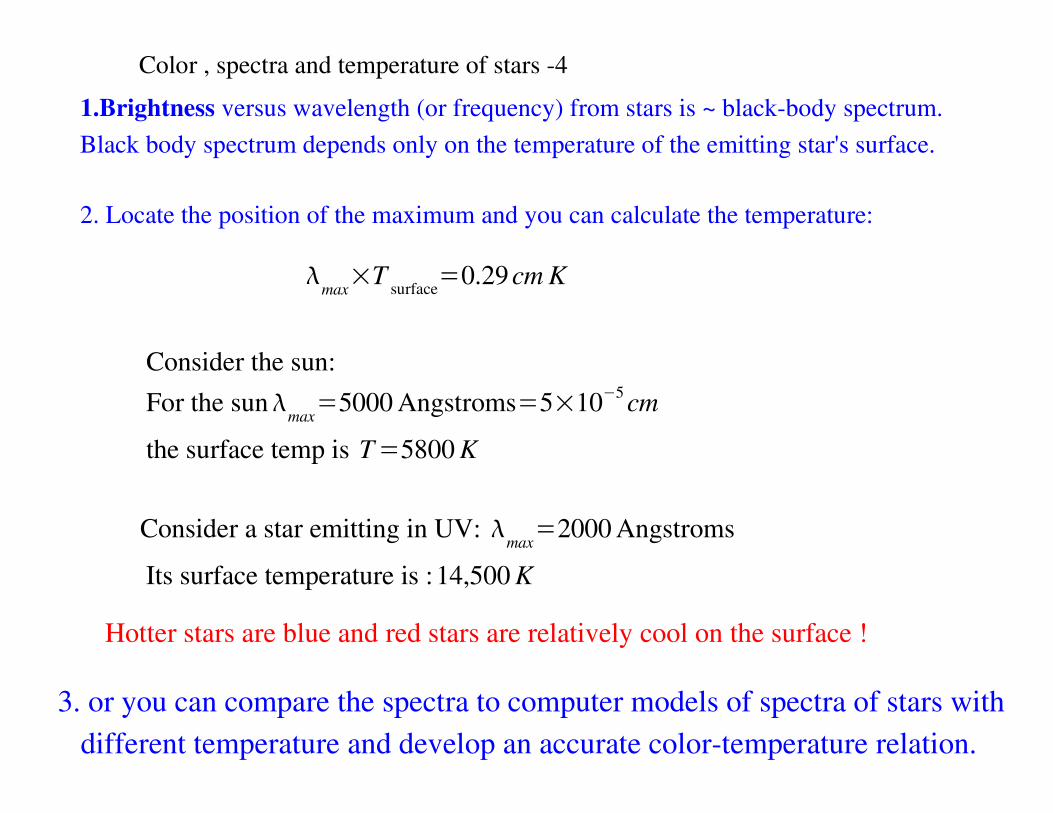
1.Brightness versus wavelength (or frequency) from stars is ~ black-body spectrum.Black body spectrum depends only on the temperature of the emitting star's surface.
2. Locate the position of the maximum and you can calculate the temperature:
�max�T surface�0.29cm K
Consider the sun: For the sun�max�5000 Angstroms�5�10�5 cm the surface temp is T�5800 K
Consider a star emitting in UV: �max�2000 Angstroms
Its surface temperature is :14,500 K
Hotter stars are blue and red stars are relatively cool on the surface !
Color , spectra and temperature of stars -4
3. or you can compare the spectra to computer models of spectra of stars with different temperature and develop an accurate color-temperature relation.
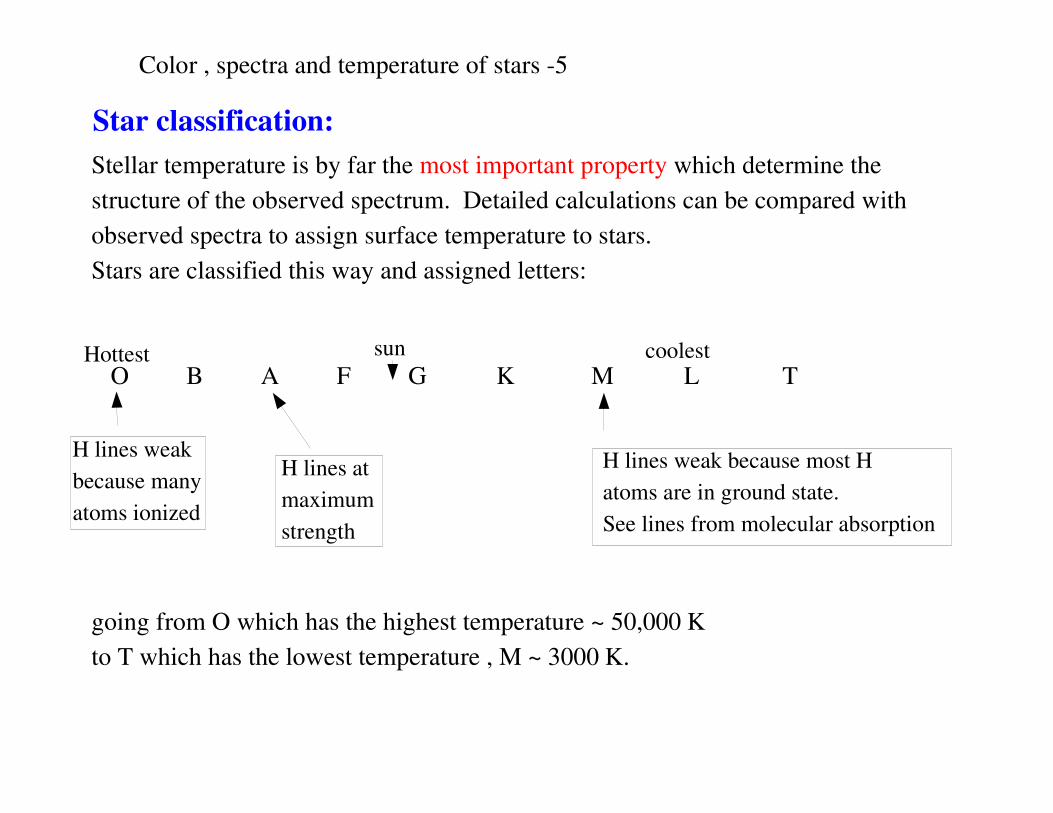
Star classification: Stellar temperature is by far the most important property which determine the structure of the observed spectrum. Detailed calculations can be compared withobserved spectra to assign surface temperature to stars.Stars are classified this way and assigned letters:
O B A F G K M L T
going from O which has the highest temperature ~ 50,000 Kto T which has the lowest temperature , M ~ 3000 K.
Color , spectra and temperature of stars -5
Hottest sun coolest
H lines weakbecause manyatoms ionized
H lines atmaximumstrength
H lines weak because most Hatoms are in ground state.See lines from molecular absorption
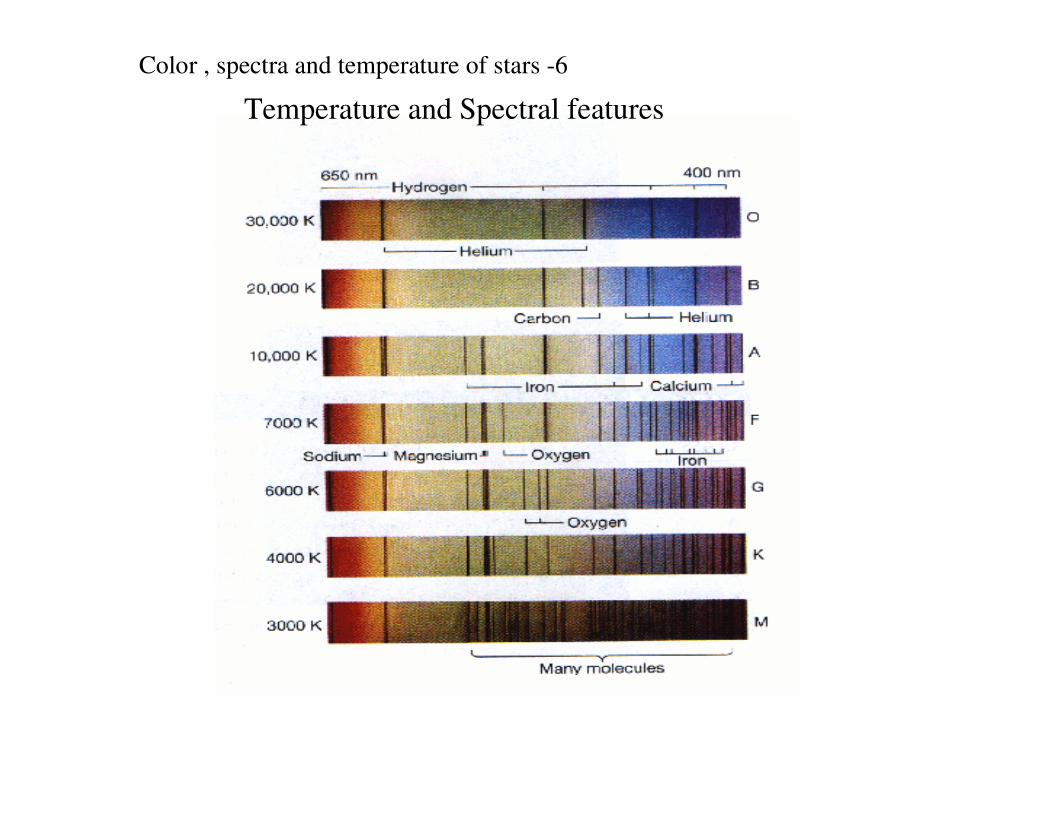
Temperature and Spectral featuresColor , spectra and temperature of stars -6
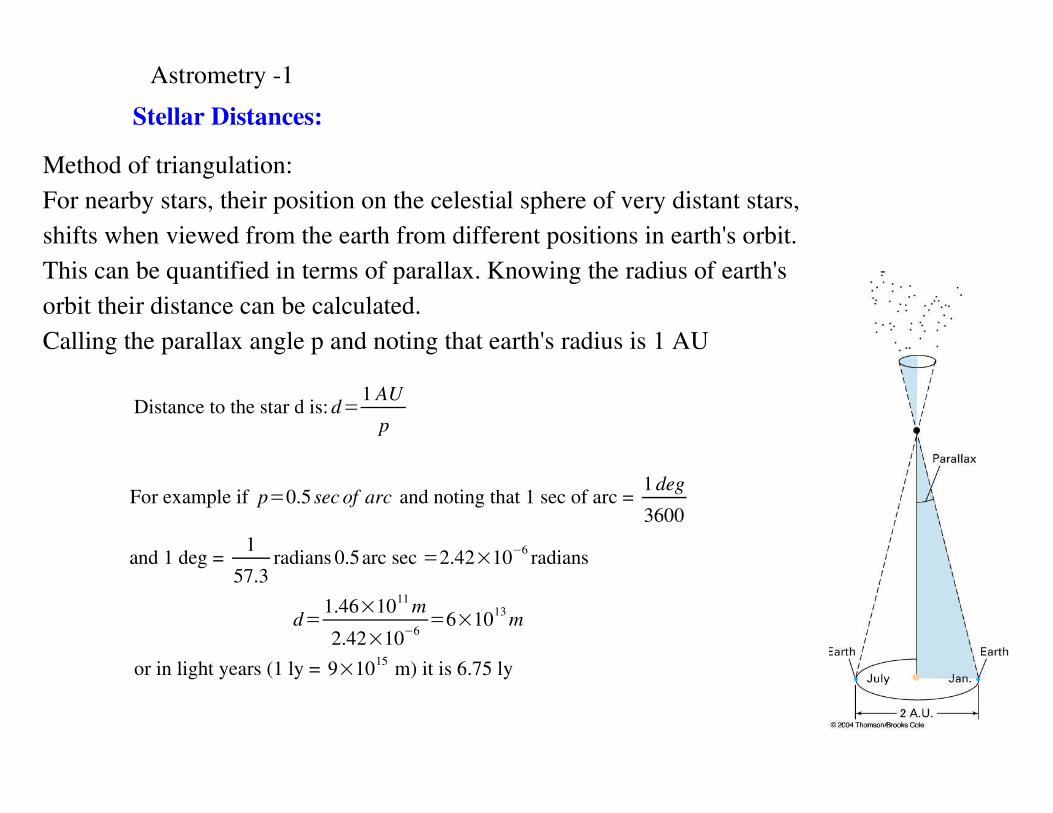
Astrometry -1Stellar Distances:
Method of triangulation: For nearby stars, their position on the celestial sphere of very distant stars,shifts when viewed from the earth from different positions in earth's orbit.This can be quantified in terms of parallax. Knowing the radius of earth's orbit their distance can be calculated. Calling the parallax angle p and noting that earth's radius is 1 AU
Distance to the star d is: d�1 AUp
For example if p�0.5 sec of arc and noting that 1 sec of arc = 1 deg3600
and 1 deg = 157.3
radians 0.5arc sec �2.42�10�6 radians
d�1.46�1011 m2.42�10�6
�6�1013 m
or in light years (1 ly = 9�1015 m) it is 6.75 ly
The Hipparcos satellite instrument launched in 1989 has measuredsome 118,000 stars out to about 300 ly !
Our galaxy has a much larger size than 300 ly ! Some 100,000 lyrs.
So different techniques have to be developed to get distances to stars that are further away. One method is to calculate luminosity distance.This is called the method of spectroscopic parallax.
Astrometry -2
Spectral Type and Distance :
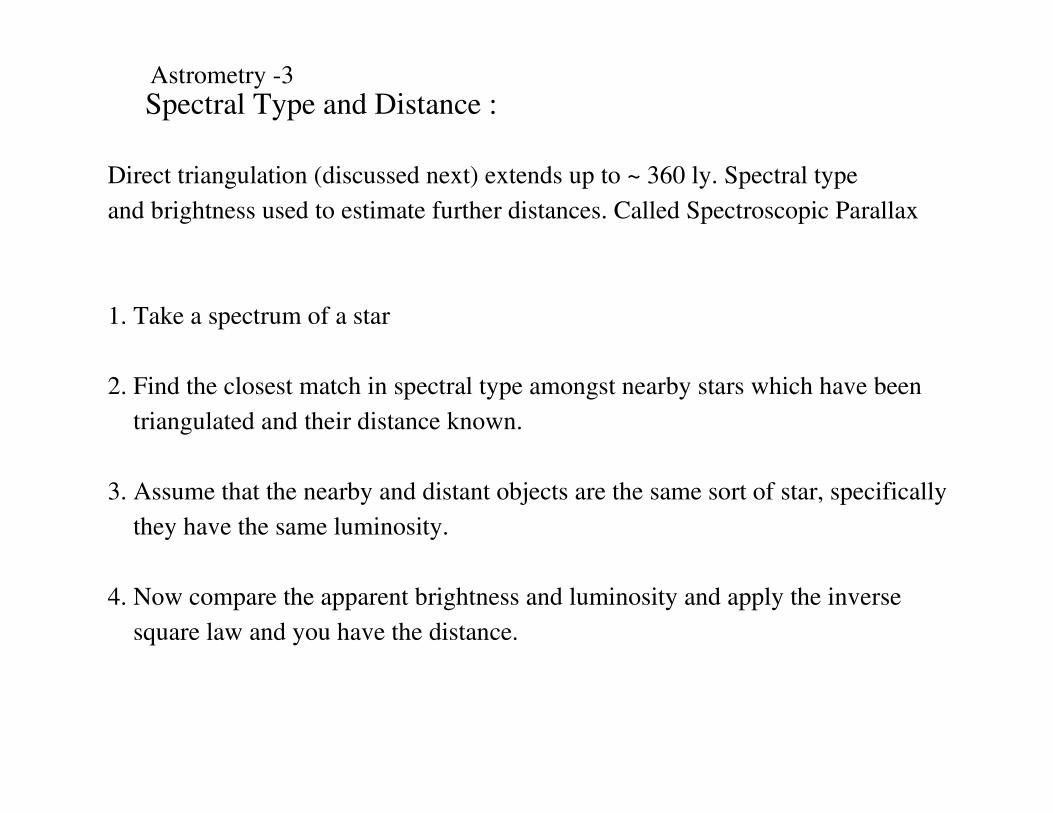
Direct triangulation (discussed next) extends up to ~ 360 ly. Spectral typeand brightness used to estimate further distances. Called Spectroscopic Parallax
1. Take a spectrum of a star
2. Find the closest match in spectral type amongst nearby stars which have been triangulated and their distance known.
3. Assume that the nearby and distant objects are the same sort of star, specifically they have the same luminosity.
4. Now compare the apparent brightness and luminosity and apply the inverse square law and you have the distance.
Astrometry -3
Now we have a set of stars for which we know:
1. Apparent magnitude of brightness2. Temperature and intrinsic luminosity3. Distance
To compare these stars and look for some order, we calculate theabsolute magnitude or brightness at a standard distance and plot the absolute magnitude versus surface temperature. We getthe Herzsprung Russell diagram.
A star which appears faint, but whose intrinsic luminosity we knowfrom analysis of its spectra, should be much brighter at the standarddistance if it is far away.
Next Step:We use the sample of stars whose distances are known and whose apparent brightnesses have been measured.
We want to find out if there is some connection between their surface temperature and their brightness.
To do this we find out the brightness of all these stars if they had all been placed at some fixed distance. We can do this in two different ways:
1. Calculate using inverse square law their absolute brightness at this fixed distance – knowing their actual distance from triangulation or
2. Look at the apparent brightness versus color(surface temp) for a set of stars which belong to a cluster of stars – which can be safely be assumedto be at the same distance.
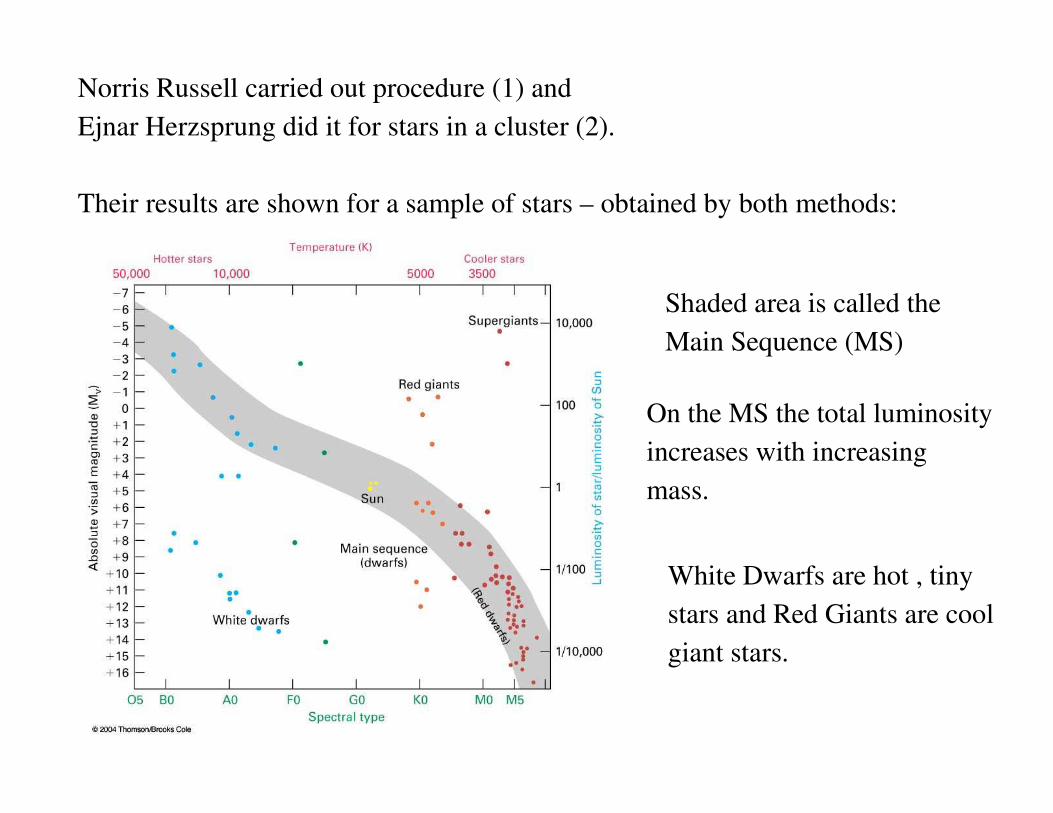
Norris Russell carried out procedure (1) and Ejnar Herzsprung did it for stars in a cluster (2).
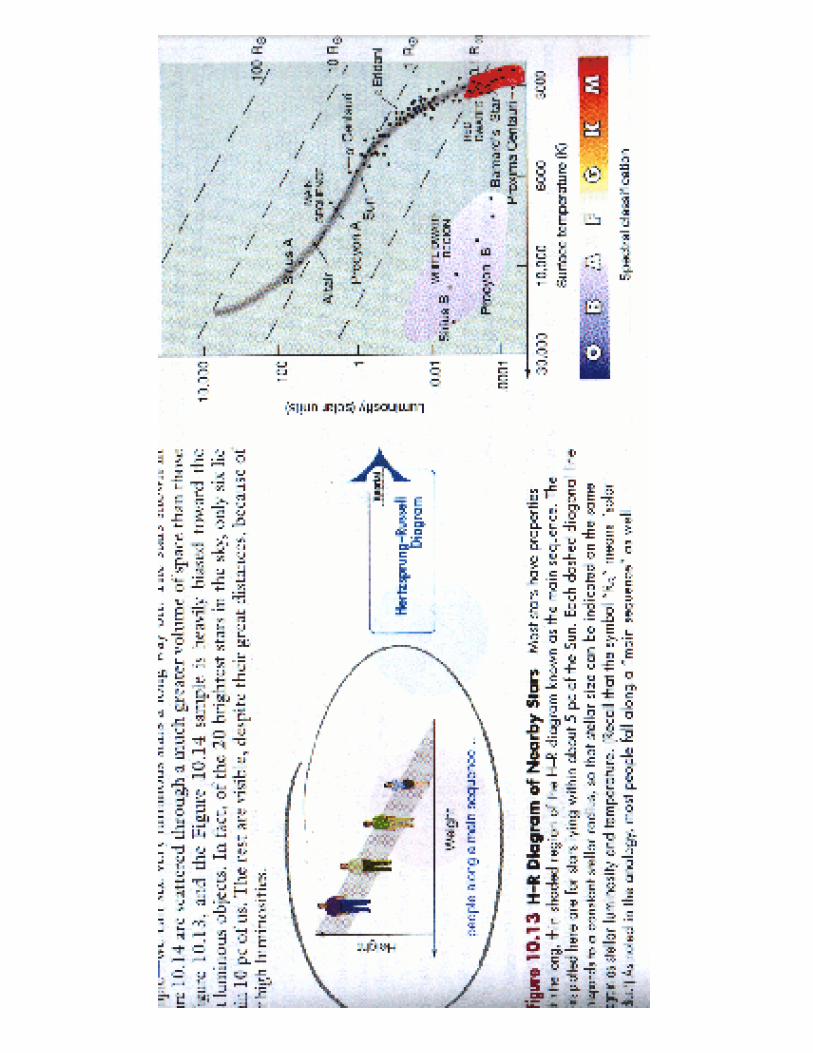
Their results are shown for a sample of stars – obtained by both methods:
Shaded area is called the Main Sequence (MS)
On the MS the total luminosityincreases with increasing mass.
White Dwarfs are hot , tinystars and Red Giants are coolgiant stars.

Mass can be estimated for stars which are in Binary systems.
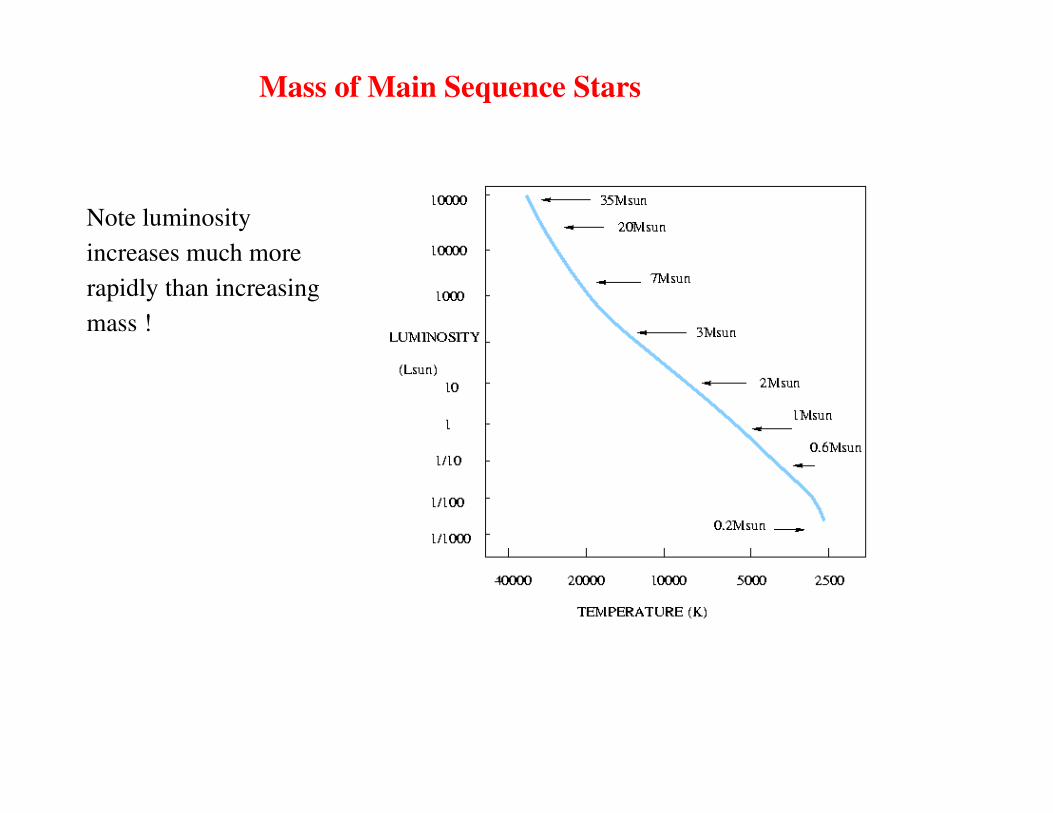
Mass of Main Sequence Stars
Note luminosityincreases much morerapidly than increasingmass !
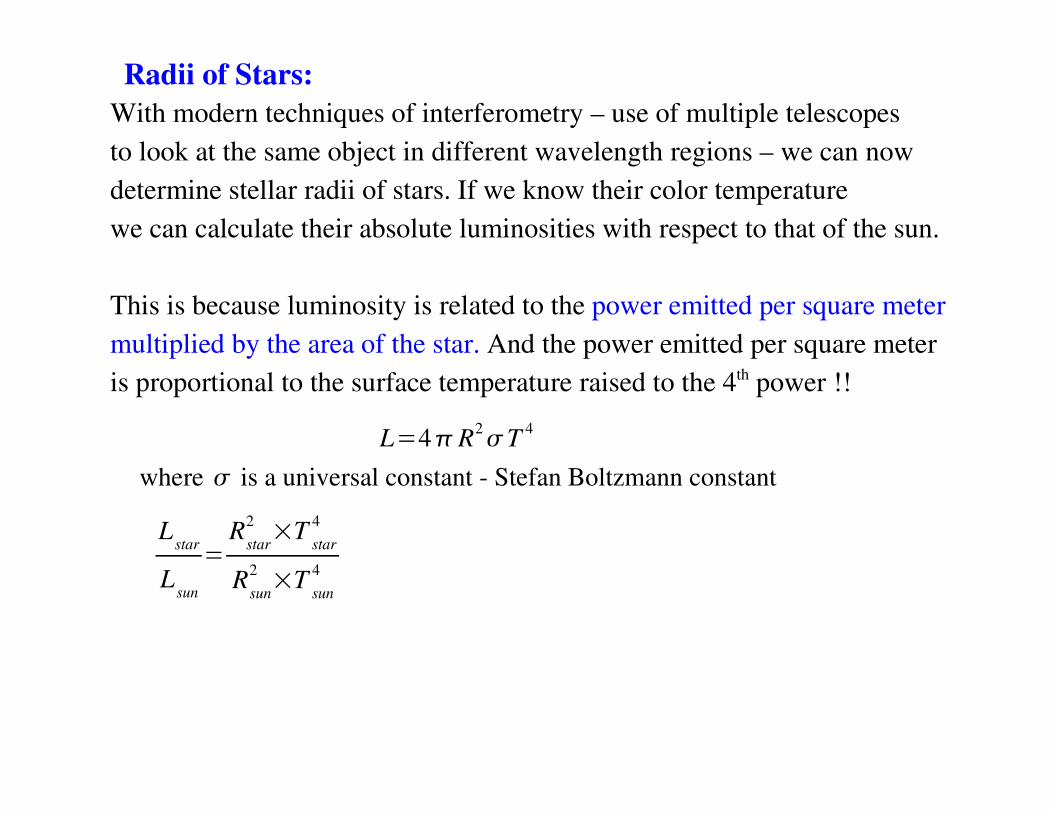
With modern techniques of interferometry – use of multiple telescopes to look at the same object in different wavelength regions – we can nowdetermine stellar radii of stars. If we know their color temperature we can calculate their absolute luminosities with respect to that of the sun.
This is because luminosity is related to the power emitted per square metermultiplied by the area of the star. And the power emitted per square meteris proportional to the surface temperature raised to the 4th power !!
L�4�R2�T 4
where � is a universal constant - Stefan Boltzmann constant
Lstar
Lsun
�Rstar
2�T star
4
Rsun2�T sun
4
Radii of Stars:
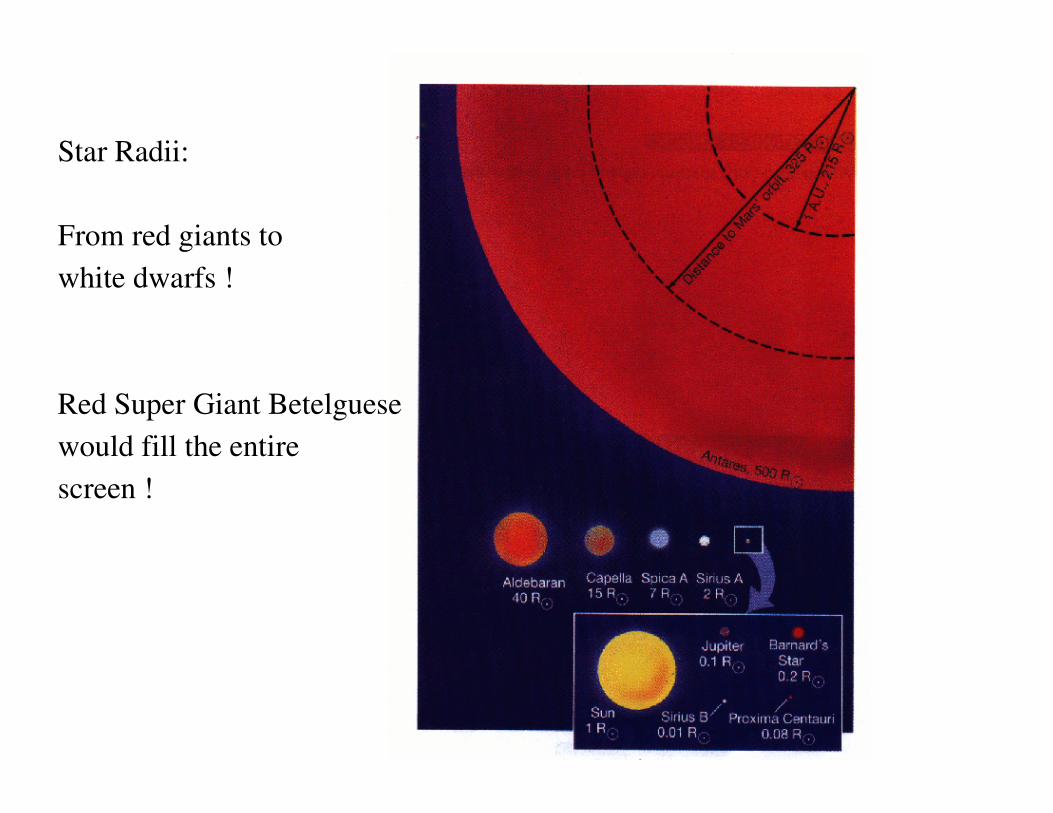
Star Radii:
From red giants towhite dwarfs !
Red Super Giant Betelguesewould fill the entirescreen !
Clusters of Stars
Star Clusters are regions in our galaxy where many stars must have formedat about the same time – in a special star forming region.
There are two types of clusters:
1. Open Clusters are found in the Galactic Disk; typical cluster will haveany number of stars from a few dozen to hundreds. Generally young starsand are not tightly bound.
2. Globular clusters (they look like a globule) have hundreds to thousands of stars which are tightly bound. They are made up of old stars and are generally found in the spherical halo surrounding the galacticcenter.
Cluster of stars were formed at the same time and out the samematerial.
Stellar evolution depends on the initial mass of the star – it is fast for massive stars and slow for smaller mass stars. Their HR diagram has valuable information about their history, in particulartheir age.
A property of the MS is that more massive stars are more luminous. More massive stars live a shorter life. So that if a globular cluster isold they will have few massive stars on the MS.
On the other hand open clusters are young and should contain stars which are massive.
I show an illustrations for both.
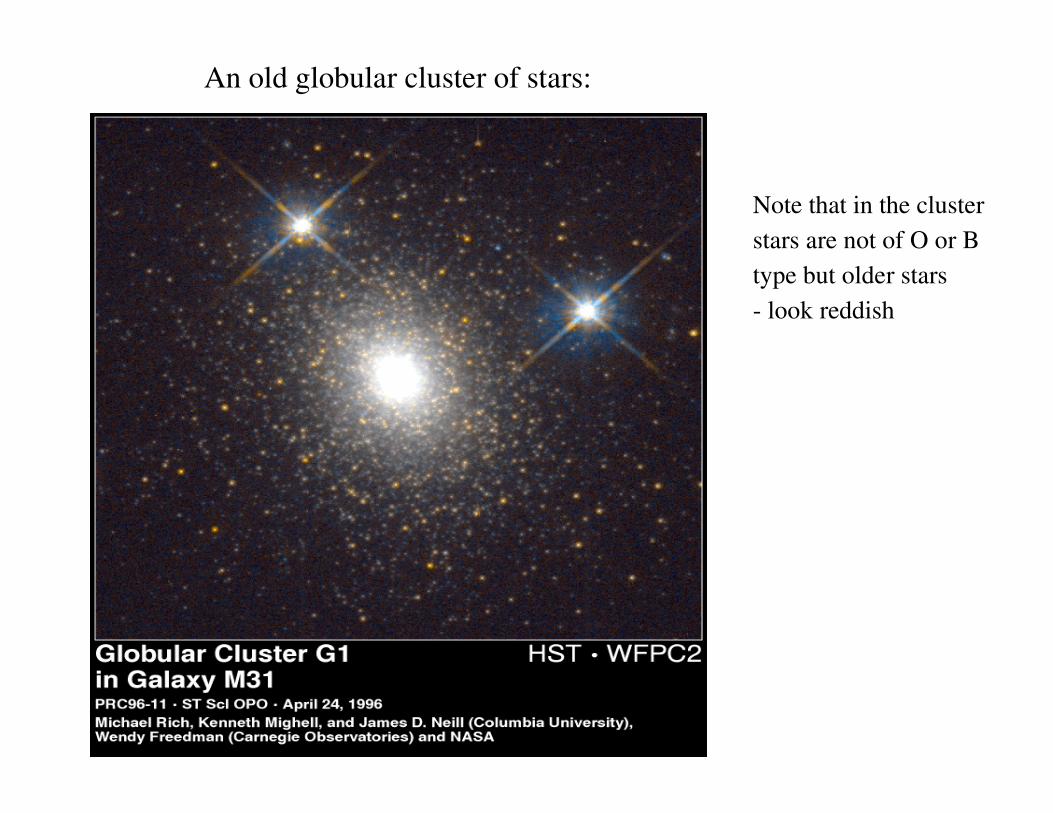
An old globular cluster of stars:
Note that in the clusterstars are not of O or Btype but older stars - look reddish
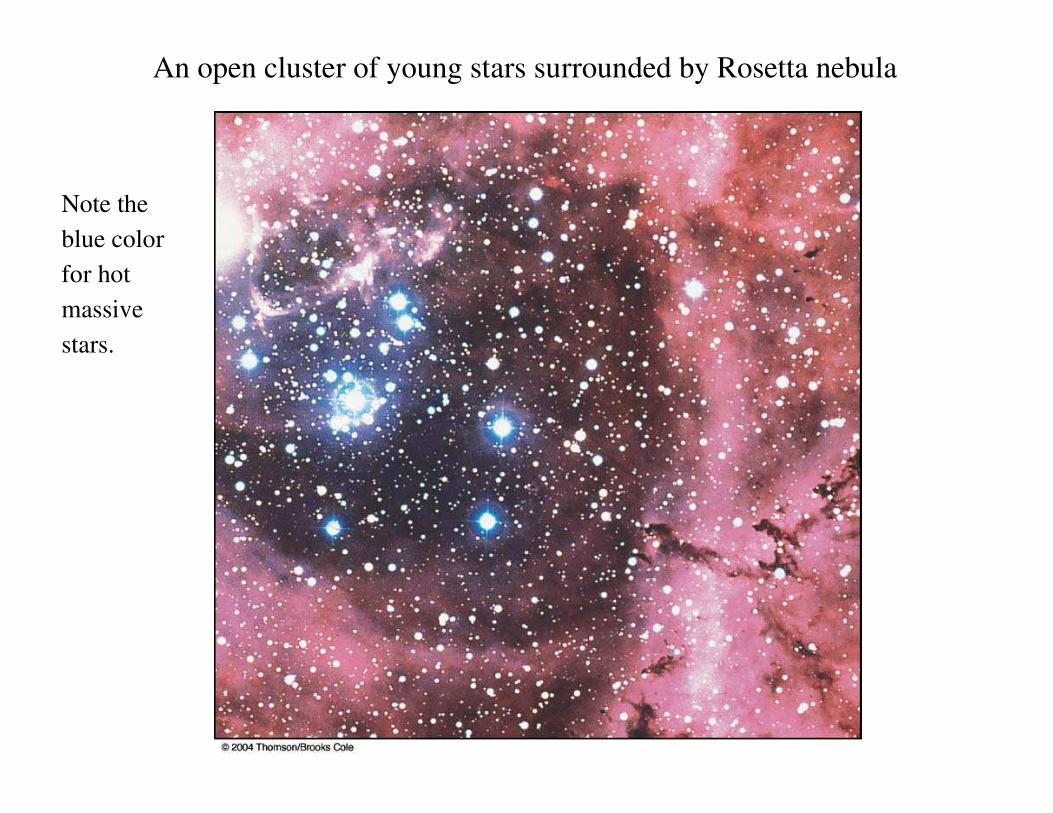
An open cluster of young stars surrounded by Rosetta nebula
Note the blue colorfor hotmassivestars.
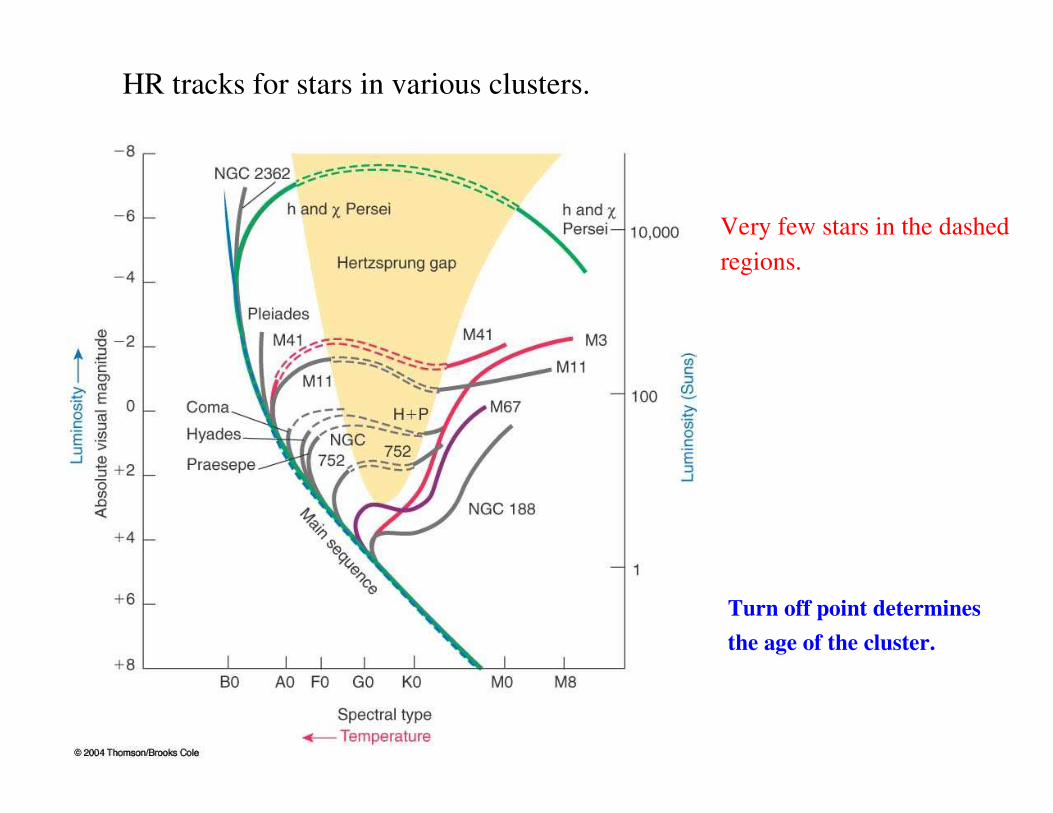
Turn off point determinesthe age of the cluster.
HR tracks for stars in various clusters.
Very few stars in the dashedregions.
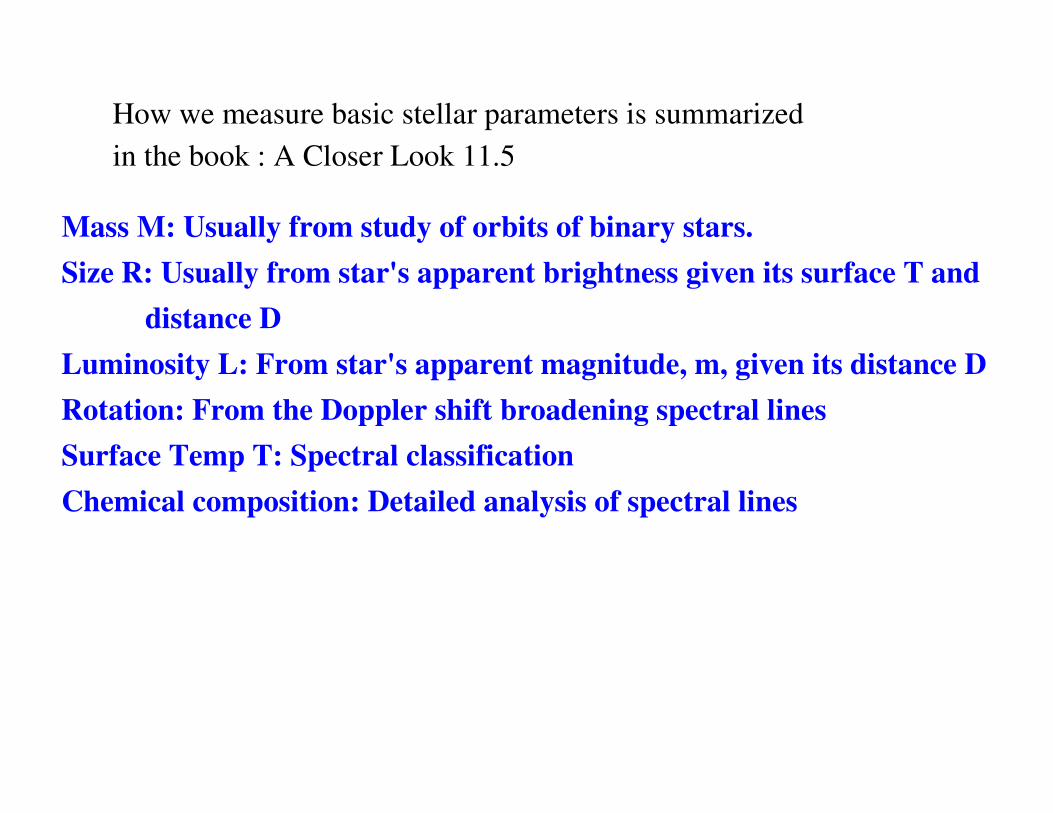
How we measure basic stellar parameters is summarized in the book : A Closer Look 11.5
Mass M: Usually from study of orbits of binary stars.Size R: Usually from star's apparent brightness given its surface T and distance DLuminosity L: From star's apparent magnitude, m, given its distance DRotation: From the Doppler shift broadening spectral linesSurface Temp T: Spectral classificationChemical composition: Detailed analysis of spectral lines
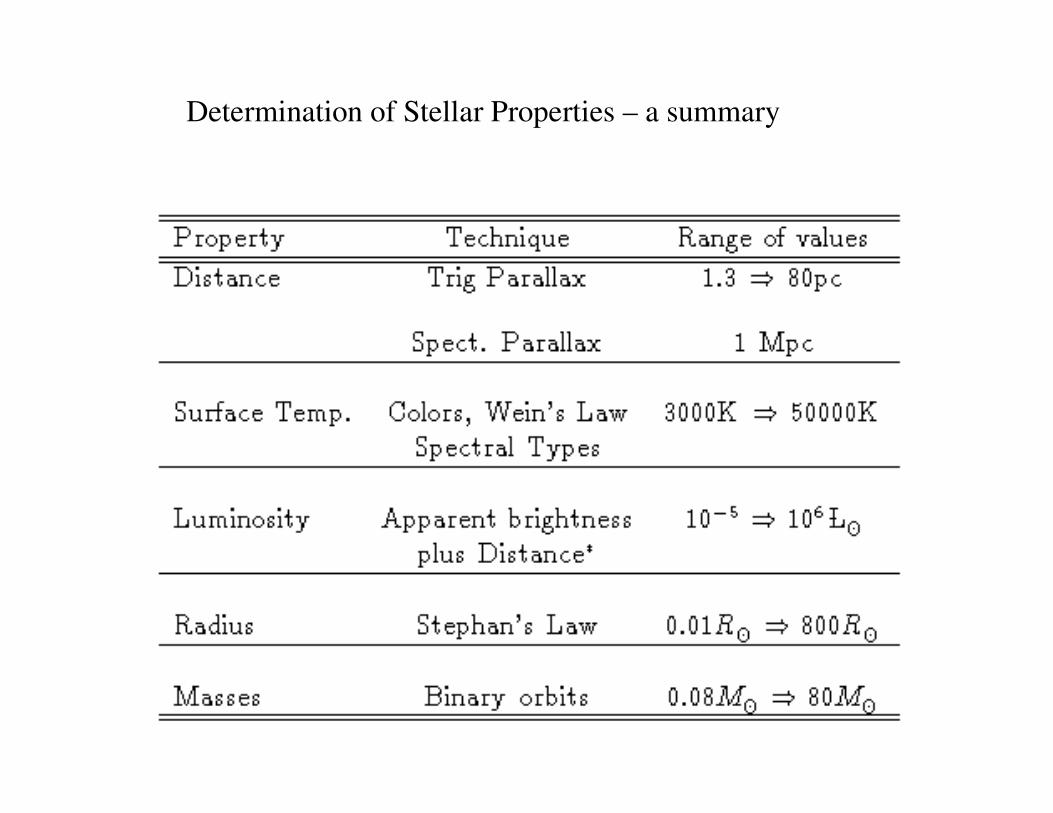
Determination of Stellar Properties – a summary
Detecting Stellar movement:
1. Proper motions: Movement of a nearby star on the celestial sphere over time against the fixed distant stars. To get their projected speed needs the knowledge of their distance. For a given angular stellar position shift speed is small for a nearby star and large for a distant star. See figure 11-16.
2. Radial velocities of the stars with respect to us. This is measured spectroscopically. It arises from Doppler effect on wavelength (equivalently frequency) due to stellar motion towards or away from us. Observed wavelength is longer than emitted wavelength if the motion is away(red shift) and is shorter if the motion is towards. (blue shift).
Note: Change in pitch of a train whistle while approaching and receding from you is the analog in sound.
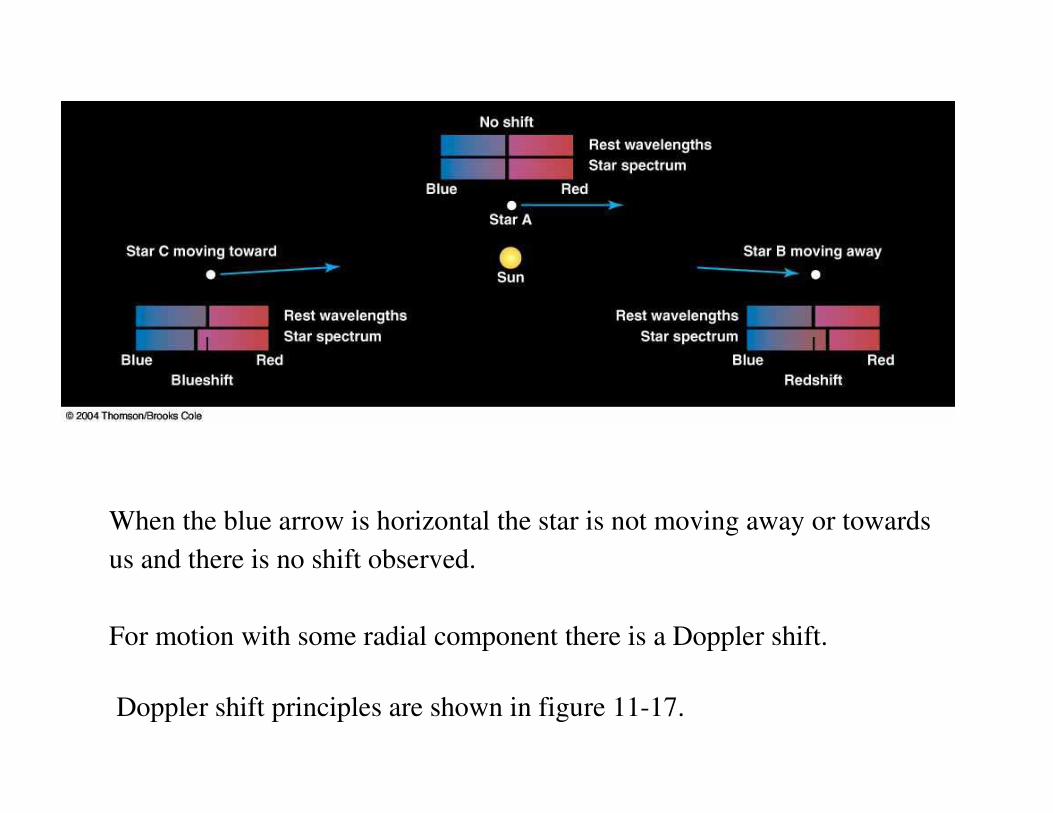
When the blue arrow is horizontal the star is not moving away or towardsus and there is no shift observed.
For motion with some radial component there is a Doppler shift.
Doppler shift principles are shown in figure 11-17.

Determination of stellar mass: Use of binary system observations.
Section 11.6
Two stars when they rotate about each other, their motion can be seen by1. Actual motion of two stars relative to each other. They have to be rather far apart to be able to see this.
2. A periodic change in brightness of stars if they eclipse (even partially) each other.
3. Spectroscopic binaries: Spectral lines move back and forth because of periodically changing Doppler effect.
If the mass of one of the stars is known the other can be estimated by usingNewtonian version of Kepler's III law or at least a lower limit can be placedon the mass of the other star. This is how Black Holes have been identified.
Final Remark:
Mass of a star is the most important characteristic of a star. Its properties and its evolution depend on its Mass. (Althoughelemental composition also plays a role in some cases)
On the main sequence, stellar luminosity and stellar surface temperature increase rapidly as stellar mass increases.
Stellar lifetime Lifetime�stellar massstellar luminosity