classification of personal exposure to radio …...1 classification of personal exposure to radio...
TRANSCRIPT

1
Classification of personal exposure to radio frequency
electromagnetic fields (RF-EMF) for epidemiological research:
evaluation of different exposure assessment methods
Patrizia Frei,a,b Evelyn Mohler,a,b Alfred Bürgi,c Jürg Fröhlich,d Georg Neubauer, e Charlotte
Braun-Fahrländer,a,b Martin Rööslia,b and the QUALIFEX-team
a Swiss Tropical and Public Health Institute, Switzerland
b University of Basel, Switzerland
c ARIAS umwelt.forschung.beratung, Bern, Switzerland
d Laboratory for Electromagnetic Fields and Microwave Electronics, ETH Zurich,
Switzerland
e EMC & Optics, Seibersdorf Labor, Austria
Corresponding Author: Martin Röösli Swiss Tropical and Public Health Institute Socinstrasse 57 CH-4002 Basel Phone: +41 (0)61 270 22 15 Fax: +41 (0)61 270 22 25 mailto: [email protected]

2
Abstract
The use of personal exposure meters (exposimeters) has been recommended for measuring
personal exposure to radio frequency electromagnetic fields (RF-EMF) from environmental
far-field sources in everyday life. However, it is unclear to what extent exposimeter readings
are affected by measurements taken when personal mobile and cordless phones are used. In
addition, the use of exposimeters in large epidemiological studies is limited due to high costs
and large effort for study participants. In the current analysis we aimed to investigate the
impact of personal phone use on exposimeter readings and to evaluate different exposure
assessment methods potentially useful in epidemiological studies. We collected personal
exposimeter measurements during one week and diary data from 166 study participants.
Moreover, we collected spot measurements in the participants’ bedrooms and data on self-
estimated exposure, assessed residential exposure to fixed site transmitters by calculating the
geo-coded distance and mean RF-EMF from a geospatial propagation model, and developed
an exposure prediction model based on the propagation model and exposure relevant
behavior. Mean personal exposure was 0.13 mW/m2, when measurements during personal
phone calls were excluded and 0.15 mW/m2, when such measurements were included. The
Spearman correlation with personal exposure (without personal phone calls) was 0.42 (95%-
CI: 0.29 to 0.55) for the spot measurements, -0.03 (95%-CI: -0.18 to 0.12) for the geo-coded
distance, 0.28 (95%-CI: 0.14 to 0.42) for the geospatial propagation model, 0.50 (95%-CI:
0.37 to 0.61) for the full exposure prediction model and 0.06 (95%-CI: -0.10 to 0.21) for self-
estimated exposure. In conclusion, personal exposure measured with exposimeters correlated
best with the full exposure prediction model and spot measurements. Self-estimated exposure
and geo-coded distance turned out to be poor surrogates for personal exposure.

3
Key words: Radio frequency electromagnetic field (RF-EMF); exposure assessment method;
mobile phone base station; Wireless LAN (W-LAN); DECT cordless phone; radio and
television broadcast

4
1. Introduction
Exposure to radio frequency electromagnetic fields (RF-EMF) in everyday life is
highly temporally and spatially variable due to various emitting sources like broadcast
transmitters or wireless local area networks (W-LAN). The use of personal exposure meters
(exposimeters) has been recommended in order to characterize personal exposure to RF-
EMFs (Neubauer et al., 2007). Several exposure assessment studies have been conducted so
far using exposimeters, (Joseph et al., 2008; Kühnlein et al., 2009; Thomas et al., 2008;
Thuróczy et al., 2008; Viel et al., 2009), which allow capture of exposure from all relevant
RF-EMF sources in the different environments where a study participant spends time
(Neubauer et al., 2007; Radon et al., 2006). They are suitable for measuring RF-EMF from
environmental far-field sources like mobile phone base stations, but are less apt to accurately
measure exposure to personal mobile or cordless phones (Inyang et al., 2008) because
measurements during personal phone calls are dependent on the distance between the emitting
device and the exposimeter. It is therefore expected that mean values obtained with
exposimeter measurements are influenced by the personal phone use of the study participants,
which is not desirable when using exposimeters for measuring environmental RF-EMF
exposure. However, the extent to which exposimeter measurements are affected by RF-EMF
sources close to the body is unknown. Other methods have been proposed for estimating RF-
EMF exposure from sources operating close to the body, such as self-reported use of cordless
and mobile phones or operator data (Vrijheid et al., 2009).
The use of personal exposimeters for measuring RF-EMF exposure may be considered
impractical for large epidemiological studies, which require large organizational effort and
resources. The handling of exposimeters is a demanding and time-consuming task for the
study participants, which would likely deter many of them from participating, thus possibly
introducing participation bias. Study participants might even manipulate the measurements by

5
placing the exposimeter at positions where high RF-EMF exposures are expected, which
would yield unreliable results. Moreover, exposimeters are not feasible for collecting
information on long-term exposure, i.e. over several years, or on past exposure. Previous
epidemiological studies have utilized other exposure assessment methods to estimate RF-
EMF exposure which include spot measurements in bedrooms (Berg-Beckhoff et al., 2009;
Hutter et al., 2006; Tomitsch et al., 2009), self-reported (Navarro et al., 2003; Santini et al.,
2003) or geo-coded distance of the residence to the closest mobile phone base station
(Blettner et al., 2009), and geospatial modeling of broadcast transmitters or mobile phone
base stations (Bürgi et al., 2010; Bürgi et al., 2008; Ha et al., 2007; Neitzke et al., 2007).
However, it is unclear how well these methods represent personal exposure to all relevant
sources of RF-EMF in everyday life.
This paper summarizes comprehensive RF-EMF exposure data collected from 166
participants in the QUALIFEX study, a prospective cohort study examining exposure to radio
frequency electromagnetic field exposure and health related quality of life. The aims of this
study were to determine the impact of personal mobile phone use on personal RF-EMF
measurements and to evaluate how reliably different exposure assessment methods could
represent personal exposure.

6
2. Methods
2.1 Personal measurements with exposimeters
A detailed description of the recruitment of the participants and measurement
protocols are summarized previously in Frei et al. (2009b). In brief, RF-EMF measurements
were collected from 166 volunteers living in the city of Basel (Switzerland) and its
surroundings between April 2007 and February 2008. RF-EMF exposure was measured using
the personal exposimeter EME Spy 120 (SATIMO, Courtaboeuf, France,
http://www.satimo.fr/). The study participants carried an exposimeter during one week and
completed a time activity diary, specifically recording place of stay and detailed use of
cordless and mobile phones. In addition, each participant completed a questionnaire regarding
exposure relevant factors and characteristics. In order to maximize the range of exposure
levels, 35 volunteers that were expected to have a high residential exposure to mobile phone
base stations (n=27) or broadcast transmitters (n=8) were recruited. The remaining 131
volunteers were not specifically selected. Ethical approval for the conduct of the study was
received from the ethical committee of Basel on March 19th, 2007 (EK: 38/07).
The exposimeter measured exposure from twelve frequency bands every 90 seconds:
radio FM (frequency modulation; 88-108 MHz), TV (television, 174-223 MHz and 470-830
MHz), Tetrapol (terrestrial trunked radio police; 380-400 MHz), uplink in three frequency
ranges (communication from mobile phone handset to base station; 880-915, 1710-1785,
1920-1980 MHz), downlink in three frequency ranges (communication from mobile phone
base station to handset; 925-960, 1805-1880, 2110-2170 MHz), DECT (digital enhanced
cordless telecommunications; 1880-1900 MHz) and W-LAN (wireless local area network;
2400-2500 MHz). The median number of recorded measurements per person was 6472. For
each individual, a weekly arithmetic mean value was calculated for each frequency band
using the robust regression on order statistics (ROS) method allowing for measurements

7
below the detection limit of 0.0067 mW/m2 (Röösli et al., 2008). Exposure to all measured
frequency bands was derived by summing up the values of all frequency bands.
Measurements that occurred during use of personal mobile or cordless phones, identified by
means of the personal diary, were omitted from the calculation of mean values. To evaluate
the impact of personal mobile and cordless phone use on mean values, the calculation of the
mean was also derived from values of all measurements. From this point forward, these mean
values are referred to as mean values without and with personal phone use.
2.2 Spot measurements in bedroom
Spot measurements were performed in the bedrooms of 134 study participants using a
NARDA SRM-3000 radiation meter. Spot measurements were not performed for the
remaining 32 participants due to technical and organizational difficulties. The NARDA
device measured the same frequency bands as the exposimeter (Table 1). The measurements
were taken as temporal averages with the root-mean-square-mode of the radiation meter. We
measured 7 points per room, with the first three points in the centre of the bedroom at 1.1 m,
1.5 m and 1.7 m above the floor. Four additional points were arranged in a rectangle, each at 1
m from the centre towards a corner of the room, 1.5 m above ground.
2.3 Geo-coded distance to the closest fixed transmitter
The geographical coordinates of the participants’ residencies were identified by the
Swiss Federal Statistical Office, and the horizontal distance of the residence to the closest
fixed site transmitter (mobile phone base station or broadcast transmitter) was calculated for
each study participant. To exclude microcells, only transmitters with an effective radiated
power of more than 15 Watt were considered. Geo-coded distance was not calculated for one
person who lived across the Swiss border.

8
2.4 Geospatial propagation model
We used a three-dimensional geospatial propagation model for the study area in which
RF-EMF from fixed site transmitters (frequency bands are shown in Table 1) was modeled
(in- and outside of buildings) (Bürgi et al., 2010; Bürgi et al., 2008). The model calculation
was based on a comprehensive database of all transmitters (position, transmission direction,
antenna types and radiation pattern, transmitter power and number of channels) and a three-
dimensional building model of the study area, considering shielding and diffraction by
buildings and topography. Using the geographical coordinates of the participants’ residencies
and the information about the floor level of the participants’ apartments, mean RF-EMF in a
horizontal radius of five meters around the coordinate at home was determined for each study
participant, with exception for two participants who lived outside of the area covered by the
model.
2.5 Full exposure prediction model
An exposure prediction model for personal RF-EMF exposure measured by the
exposimeters was developed based on the exposure questionnaire and the modeled RF-EMF
from the geospatial propagation model at the participants’ residencies. The procedure for the
model development and validation is summarized in detail in Frei et al. (2009a). Briefly, we
identified the following relevant exposure predictors using multiple regression models: the
modeled RF-EMF at the participants' home from the geospatial propagation model, modified
by the type of house wall and type of window frames. Additionally, the ownership of
communication devices (W-LAN, mobile and cordless phones) and behavioral characteristics
(amount of time spent in public transport vehicles or cars, percent full-time equivalent) were
included into the model. For the two study participants for whom the value of the geospatial
propagation model was missing the measured RF-EMF was used.

9
2.6 Self-estimated exposure
In the exposure questionnaire, participants were asked about self-estimated exposure
in comparison to the general Swiss population (separately for the sources radio FM / TV
broadcast, mobile phone base stations and handsets, cordless phones and W-LAN as well as
for all of these sources combined). The participants had to rate whether they considered
themselves to be less, equally or more exposed compared to the average Swiss population. As
nine study participants did not respond to this question, we obtained data on self-estimated
exposure from 157 study participants.
2.7 Statistical analyses
Statistical analyses were carried out using STATA version 10.1 (StataCorp, College
Station, TX, USA) and R version 2.9.1. All calculations were performed with the values for
the power flux density (mW/m2). Spearman rank correlations (rs) were estimated between the
values obtained using the different exposure assessment methods and the personal
measurements and between the mean values of the different exposure sources (derived from
the exposimeter measurements). We applied linear regression models to quantify the impact
of personal mobile and cordless phone use on mean values obtained from the exposimeter
measurements.

10
3. Results
3.1 Study participants
The characteristics of the study participants are shown in Table 2. The mean age was
42.6 years and 92 of the participants (55%) were women. The majority of the study
participants owned mobile and cordless phones (88% and 72%, respectively) and
approximately one third owned a W-LAN at home. The average length of mobile and cordless
phone use per week recorded in the personal diaries were 17 and 42 minutes, respectively.
3.2 Contribution of personal mobile and cordless phone use to individual RF-EMF
exposure
Figure 1 a) shows scatter plots of the association between mobile phone use and mean
values of all 3 uplink bands combined with (solid slopes) and without (dashed slopes)
personal phone calls and Figure 1 b) shows the corresponding data for the cordless phone use.
Mean personal exposure to uplink (with personal phone use) increased by 0.038 mW/m2
(95%-CI: 0.022 to 0.054 mW/m2; intercept: 0.034 mW/m2) per hour of mobile phone use and
exposure to DECT cordless phones by 0.023 mW/m2 (95%-CI: 0.012 to 0.033 mW/m2;
intercept: 0.026 mW/m2) per hour of cordless phone use. Exposure over all frequency bands
(total exposure; data not shown) increased by 0.026 mW/m2 (95%-CI: -0.025 to 0.077
mW/m2) per hour of mobile phone use and by 0.027 mW/m2 (95%-CI: 0.009 to 0.046
mW/m2) per hour of cordless phone use. In case of mobile phone use without personal phone
use, exposure to uplink increased by 0.023 mW/m2 (95%-CI: 0.007 to 0.038 mW/m2) per hour
of mobile phone use (Figure 1 a). The corresponding increase in the DECT band was 0.009
mW/m2 (-0.001 to 0.018 mW/m2) per hour of cordless phone use (Figure 1 b). Total exposure
calculated without personal phone use increased by 0.010 mW/m2 (95%-CI: -0.039 to 0.058

11
mW/m2) per hour of mobile phone use and by 0.013 mW/m2 (95%-CI: -0.005 to 0.031
mW/m2) per hour of cordless phone use.
Figure 2 shows the mean values and contributions of the different sources with (Figure
2 a) and without (Figure 2 b) personal phone use. The mean values over all frequency bands
were 0.15 mW/m2 with personal phone use compared to 0.13 mW/m2 without personal phone
use and this difference is statistically significant (t-test, p<0.001). The increase of 12.4%,
when including measurements during personal phone use, was mainly influenced by the use
of cordless phones (64.2%). The contribution of the uplink band to total exposure was 29.8%
with personal phone use. Without personal phone use the contribution of uplink was 29.1%.
Exposure to DECT phones contributed 27.8% to total exposure when measurements during
personal cordless phone calls were included and 22.7% when such measurements were
excluded. The Spearman correlation between the mean values with and without personal
phone use was 0.94 (95%-CI: 0.92 to 0.96) (Table 3).
3.3 Exposure assessment methods: characteristics and correlations
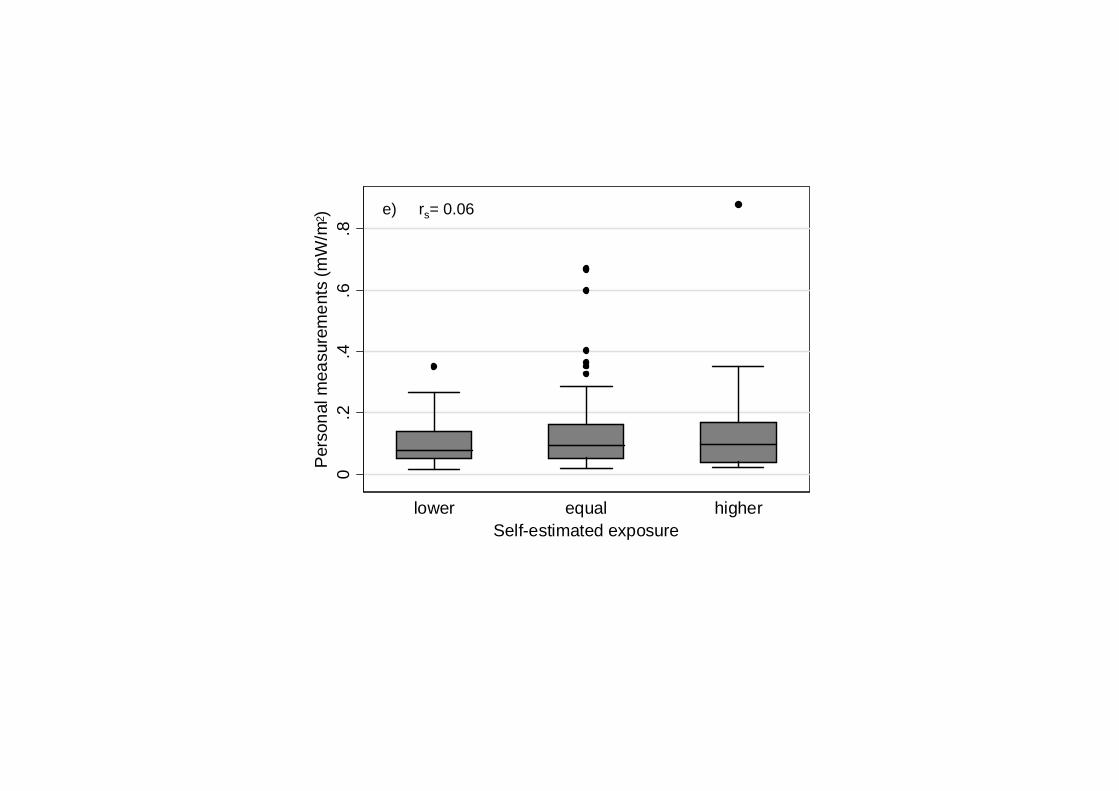
Figure 3 a) to e) show box plots of the personal measurements over all frequency
bands (without personal phone use) for three categories of the alternative exposure assessment
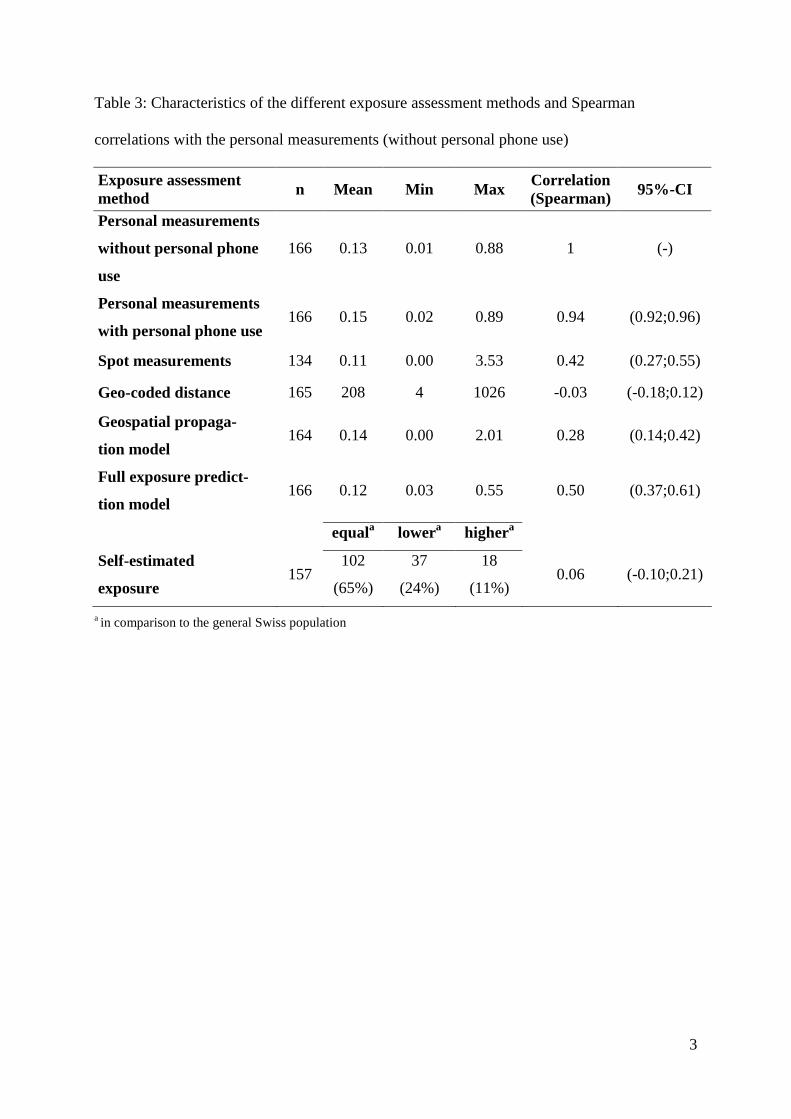
methods and the corresponding Spearman correlation coefficients. Table 3 shows the
characteristics of the different exposure assessment methods as well as the 95% confidence
intervals of the Spearman correlation coefficients. The mean values derived from the personal
measurements (with and without personal phone use), from the spot measurements, and the
geospatial propagation and the full exposure prediction model were very similar (Table 3).
The exposure range was smallest for the full exposure prediction model (between 0.03 and
0.55 mW/m2) and largest for the spot measurements in the bedrooms of the study participants
(between 0.00 and 3.53 mW/m2). The average distance of the study participants’ residences to
the closest transmitter was 208 meters. The majority of the study participants (65%)

12
considered themselves to be equally exposed to RF-EMF compared to the average Swiss
population.
The spot measurements, geospatial propagation model and full exposure prediction
model were observed to be associated with the personal measurements without personal
phone use (Figure 3 a), c) and d), respectively), and the corresponding Spearman correlation
coefficients were 0.42 (95%-CI: 0.27 to 0.55), 0.28 (95%-CI: 0.14 to 0.42), and 0.50 (95%-
CI: 0.37 to 0.61), respectively. No associations were observed between personal exposimeter
measurements and either the geo-coded distance to the closest fixed site transmitter or self-
estimated exposure (Figures 3 b) and e), respectively). The lack of association was reflected
in a low Spearman rank correlation (Table 3) for geo-coded distance (rs=-0.03 (95%-CI: -0.18
to 0.12) and for self-estimated exposure (rs=0.06 (95%-CI: -0.10 to 0.21).
Of note, some of these exposure assessment methods were not intended to directly
represent total personal RF-EMF exposure, but rather specific exposures situations, such as
residential exposure. The geo-coded distance of the residence to the closest fixed site
transmitter at home is expected to represent exposure to fixed site transmitters at home. The
corresponding correlation between the geo-coded distance and residential exposure to fixed
site transmitters measured by the exposimeter was -0.26 (95%-CI: -0.39 to -0.11). The mean
residential exposure to fixed site transmitters was calculated using the respective exposimeter
measurements at home during the measurement week, identified by the personal diary.
Similarly, the correlation between mean personal exposure to fixed site transmitters and the
calculated value obtained from the geospatial propagation model was 0.71 (95%-CI: 0.63 to
0.78). The correlation between spot measurements and personal exposure measurements in
the bedroom was 0.73 (95%-CI: 0.63 to 0.80).

13
3.4 Correlations of the different exposure sources
By using the personal exposimeter measurements, we assessed the correlations of the
different frequency bands with total exposure and with each other. Total exposure correlated
best with exposure to mobile phone handsets (rs=0.42; 95%-CI: 0.29 to 0.54), mobile phone
base stations (rs=0.38; 95%-CI: 0.24 to 0.50) and cordless phones (rs=0.37; 95%-CI: 0.23 to
0.49). These were also the sources that contributed most to total mean exposure (Frei et al.,
2009b). The Spearman correlations among the different frequency bands were low, with the
highest positive correlation between exposure to W-LAN and mobile phone handsets
(rs=0.21; 95%-CI: 0.06 to 0.35) and the most negative correlation between exposure to
cordless phones and mobile phone handsets (rs=-0.15; 95%-CI: -0.30 to 0.00). The correlation
between exposure to mobile phone handsets and mobile phone base stations was 0.07 (95%-
CI: -0.09 to 0.22).

14
4. Discussion
This study evaluated multiple exposure assessment methods for estimating personal
exposure to environmental far-field RF-EMF. Personal mobile and cordless phone use were
observed to contribute relatively little to the personal RF-EMF measurements, and geo-coded
distance to the closest fixed site transmitter and the self-estimated exposure were shown to be
inappropriate surrogates for personal RF-EMF exposure. The highest correlation with
personal measurements was found for the full exposure prediction model, which takes into
account modeled exposure at home and behavioral characteristics of a person, followed by
spot measurements in the bedroom and the geospatial propagation model.
4.1 Strengths and limitations
This study consisted of a comprehensive exposure data collection, where
approximately 6500 exposimeter measurements were collected over one entire week for 12
different frequency bands per person. In addition, we performed spot measurements,
calculated the distance of the residence to the closest fixed site transmitter, collected data on
self-estimated exposure, and developed a geospatial propagation model for the study region
and a prediction model including personal characteristics. The multiple methods employed for
exposure assessment allowed for direct comparison of the different methods, and to the
authors’ knowledge such an extensive comparison has not been conducted before. The
Spearman correlation allowed for evaluating the reliability of the exposure assessment
methods to classify exposure levels, and the ranking of exposure levels may be more essential
than the correctness of absolute values in epidemiological studies (Neubauer et al., 2007).
Exposimeter measurements require a large organizational effort, thus a small sample
size in this study is a primary limitation. In addition, personal exposimeter measurements
served as measure of comparison, and measurement accuracy for the different frequency
bands may be uncertain. A previous analysis observed that the accuracy of personal
15
exposimeter measurements depended on specific configurations of different services
generating different modulations of the signal and that cross-talks between bands may occur
(Lauer et al., submitted for publication). In addition, shielding of the body might be of
concern and depends on the body mass of a person (Knafl et al., 2008; Neubauer et al., 2008).
We tried to minimize this problem by advising the study participants to place the
exposimeters in their vicinity, but not directly on the body, when not moving.
To our knowledge, personal exposimeters include the most relevant RF-EMF sources.
However, there are additional sources in the radio frequency range which were not
considered. Our spot measurements included three additional frequency bands (paging
services (147-148 MHz), DAB channel 12 (digital audio broadcast; 223-230 MHz) and GSM-
Rail (mobile communication for the railway; 921-925 MHz)). The average contribution of
these sources was small (3.3%). We are not aware of other sources in the everyday
environment which could have made a relevant contribution to total RF-EMF at the time of
the measurement period (in the frequency range of 88-2500 MHz).
4.2 Personal exposure measurements of sources operating close to the body
Mobile and cordless phone radiation is an important exposure source also when
personal phone use is omitted from the calculation of mean values (Figure 2 b). The high
contribution of mobile phone radiation may be mainly explained by the passive exposure
from other persons using mobile phones. Also, handovers of the personal mobile phone from
one base station to another may be of influence. For cordless phones, the constant radiation of
most available cordless phone base stations and cordless phone calls from other persons are
explanations for the high contribution.
Exposure to uplink and DECT radiation as well as total exposure increased with
increasing use of mobile and cordless phones even if calculated without personal phone use.
There are several explanations for this: firstly, some phone calls may not have been noted in

16
the diary, and this might correlate with the amount of phone use. Secondly, regular mobile
and cordless phone users might spend more time at crowded places or with persons with
similar behaviors in terms of phone use and thus have a higher background exposure to
mobile and cordless phone radiation. Thirdly, with regard to exposure to mobile phones,
regular mobile phone users might spend more of their time on the way, for example in trains,
which leads to more carry-overs of the personal mobile phone. Fourthly, with regard to
exposure to cordless phone use, regular cordless phone users might be near radiating DECT
base stations more often.
The high Spearman correlation between the personal measurements with and without
personal phone use (rs=0.94) suggests that mean values derived from all personal
measurements including personal phone use do reliably discriminate between participants’
exposure levels to environmental far-field sources. This poses an advantage because not
having to collect data on phone use reduces the effort for study participants as well as for data
management. Although the absolute difference between the two mean total values was small,
it was statistically significant. Hence, in a study where one intends to characterize typical
exposure levels to environmental far-field sources in a certain population (instead of just
differentiating between highly and lowly exposed categories), the use of personal mobile and
cordless phones is not negligible. Although small on average, personal mobile and cordless
phone use can reach substantial contributions for heavy phone users.
4.3 Evaluation of the exposure assessment methods for epidemiological purposes
In addition to the basic prerequisite to reliably discriminate between participants’
exposure levels that an exposure assessment method has to fulfill, there are other aspects
which have to be considered for the use in epidemiological studies. Participation bias is of
concern. It can be introduced if an exposure assessment method requires active participation
from potential study participants, and it is expected to be specifically pronounced if a large

17
effort for study participants is involved. In this case, a substantial part of the study
participants might refuse to participate, which may be of major of concern if participation is
related to both health and exposure status (Bakke et al., 1990; de Marco et al., 1994; Röösli,
2008). Collecting exposimeter measurements in combination with diary data is likely to
introduce participation bias because of the large effort required for study participants. Spot
measurements in bedrooms also rely on compliance of study participants; however, a smaller
effort is required. The full exposure prediction model relies on compliance from study
participants because it requires questionnaire data from the participants. The effort for
completing a questionnaire, however, is highly reduced compared to collecting personal
exposimeter measurements. The use of a geospatial propagation model or of the geo-coded
distance to the closest fixed site transmitter may be more ideal, because participants do not
have to be contacted in order to assess exposure. Our results suggest, however, that the geo-
coded distance cannot reliably represent personal exposure. This is in line with previous
studies in which the geo-coded distance was compared to spot measurements in the bedroom
or personal measurements over 24 hours (Bornkessel et al., 2007; Breckenkamp et al., 2008;
Radon et al., 2006). However, we found a moderate correlation between the geo-coded
distance and residential exposure from fixed site transmitters (rs=-0.26 (95%-CI: -0.39 to -
0.11).
Another issue regarding epidemiological studies is information bias. Information bias
can be introduced if an exposure assessment method relies on subjective information of the
study participants, and if objective exposure data is collected simultaneously with data on
health because participants might be aware of the aim of the study. Self-estimated exposure is
particularly prone to information bias. That self-estimated exposure is not correlated with
actual personal exposure may imply that study participants are not aware of their own RF-
EMF exposure status and that they may be considered to be blinded to exposure. Therefore,
evaluating self-estimated exposure can offer evidence for the occurrence of information bias

18
and/or of a nocebo effect (which is the inverse of the placebo effect and means that adverse
symptoms occur due to expectations (e.g. due to concerns)) (Röösli, 2008). In general,
exposure assessment methods which are not based on subjective components are preferred
and using the geo-coded distance to the closest fixed site transmitter or a geospatial
propagation model fulfill this criterion ideally from this perspective. The full exposure
prediction model relies on subjective information of the study participant; however, our
model variables relate to statements about the ownership of wireless devices which are
unlikely to be heavily biased or predictors which are unlikely to be related to RF-EMF
exposure by lay persons (e.g. type of house wall).
The cost and feasibility of an exposure assessment method are also important criteria
which have to be taken into account. Methods which involve high costs and workforce are
personal exposimeter measurement studies or spot measurements. Typically, only a limited
number of study participants can be included in such studies. The development of a geospatial
or full exposure prediction model can be costly. Once developed, however, they are
applicable for large study populations. The exposure assessment methods which involve low
costs are the geo-coded distance or self-estimated exposure.
To date, no information is available on what biological mechanism is relevant for RF-
EMF below the standard limits. Scientific evidence has not suggested a health effect resulting
from one specific exposure source or type of modulation (Neubauer et al., 2007; Schüz and
Mann, 2000). Therefore, we consider it reasonable to take into account exposure from all
relevant exposure sources. Our results show that no single exposure source is highly
correlated with exposure over all frequency bands, and that the different exposure sources do
not correlate with each other. Not including all relevant sources in an epidemiological study
would therefore introduce a considerable random error which would lead to a substantial loss
of power and to an underestimation of the true exposure-response association (Neubauer et
al., 2007). However, it cannot be ruled out that future research might discover that effects are

19
caused by specific exposure sources or that humans are specifically susceptible to RF-EMF
during certain times of the day, e.g. during night. If this is the case, a re-evaluation of the
exposure assessment methods will have to be conducted.

20
5. Conclusions
This study provides new insight about the interpretation of different exposure
assessment methods used in previous studies. Our data suggest that a reliable discrimination
of personal exposure levels to environmental far-field RF-EMFs measured with exposimeters
is also made when measurements during personal mobile and cordless phone use are included.
The evaluation of other exposure assessment methods showed that spot measurements at
home or modeling exposure from fixed site transmitters are conceivable surrogates for
personal exposure, particularly for residential exposure. Optimally, data on residential
exposure are combined with personal characteristics, as done in our full exposure prediction
model. Using the geo-coded distance to the closest fixed site transmitter or self-estimated
exposure is inappropriate, but the latter can provide information on a possible information
bias or nocebo effect. Due to the rapid change of the technological development, the exposure
situation in the everyday environment is expected to change substantially in the future, which
means that the use of different exposure assessment methods will have to be re-evaluated.
21
ACKNOWLEDGEMENTS
We thank Matthias Egger, Niklas Joos, Axel Hettich (QUALIFEX team) for inspiring
discussions. We are thankful to René Denzler from Computer Controls AG for technical
support with the exposimeters and to Frédéric Pythoud from METAS (federal office of
metrology) for the calibration service. Many thanks go also to all study participants who
volunteered for the study.
Funding
This study is funded by the Swiss National Science Foundation (Grant 405740-
113595). It is part of the National Research Program 57 "Non-Ionising Radiation - Health and
Environment". Martin Röösli is supported by the Swiss School of Public Health + (SSPH+).
Conflict of interest
The authors declare no conflict of interest.

22
References
Bakke P, Gulsvik A, Lilleng P, Overa O, Hanoa R, Eide GE. Postal survey on airborne
occupational exposure and respiratory disorders in Norway: causes and consequences
of non-response. J Epidemiol Community Health 1990; 44:316-20.
Berg-Beckhoff G, Blettner M, Kowall B, Breckenkamp J, Schlehofer B, Schmiedel S, et al.
Mobile phone base stations and adverse health effects: phase 2 of a cross-sectional
study with measured radio frequency electromagnetic fields. Occup Environ Med
2009; 66:124-30.
Blettner M, Schlehofer B, Breckenkamp J, Kowall B, Schmiedel S, Reis U, et al. Mobile
phone base stations and adverse health effects: phase 1 of a population-based, cross-
sectional study in Germany. Occup Environ Med 2009; 66:118-23.
Bornkessel C, Schubert M, Wuschek M, Schmidt P. Determination of the general public
exposure around GSM and UMTS base stations. Radiat Prot Dosimetry 2007; 124:40-
7.
Breckenkamp J, Neitzke HP, Bornkessel C, Berg-Beckhoff G. Applicability of an Exposure
Model for the Determination of Emissions from Mobile Phone Base Stations. Radiat
Prot Dosimetry 2008; 131:474-81.
Bürgi A, Frei P, Theis G, Mohler E, Braun-Fahrländer C, Fröhlich J, et al. A model for
radiofrequency electromagnetic fields at outdoor and indoor locations for use in an
epidemiological study. Bioelectromagnetics 2010; 31:226-36.
Bürgi A, Theis G, Siegenthaler A, Röösli M. Exposure modeling of high-frequency
electromagnetic fields. J Expo Sci Environ Epidemiol 2008; 18:183-91.
de Marco R, Verlato G, Zanolin E, Bugiani M, Drane JW. Nonresponse bias in EC
Respiratory Health Survey in Italy. Eur Respir J 1994; 7:2139-45.

23
Frei P, Mohler E, Bürgi A, Fröhlich J, Neubauer G, Braun-Fahrländer C, et al. A prediction
model for personal radio frequency electromagnetic field exposure. Sci Total Environ
2009a; 408:102-8.
Frei P, Mohler E, Neubauer G, Theis G, Bürgi A, Fröhlich J, et al. Temporal and spatial
variability of personal exposure to radio frequency electromagnetic fields. Environ
Res 2009b; 109:779-85.
Ha M, Im H, Lee M, Kim HJ, Kim BC, Gimm YM, et al. Radio-frequency radiation exposure
from AM radio transmitters and childhood leukemia and brain cancer. Am J
Epidemiol 2007; 166:270-9.
Hutter HP, Moshammer H, Wallner P, Kundi M. Subjective symptoms, sleeping problems,
and cognitive performance in subjects living near mobile phone base stations. Occup
Environ Med 2006; 63:307-13.
Inyang I, Benke G, McKenzie R, Abramson M. Comparison of measuring instruments for
radiofrequency radiation from mobile telephones in epidemiological studies:
implications for exposure assessment. J Expo Sci Environ Epidemiol 2008; 18:134-41.
Joseph W, Vermeeren G, Verloock L, Heredia MM, Martens L. Characterization of personal
RF electromagnetic field exposure and actual absorption for the general public. Health
Phys 2008; 95:317-30.
Knafl U, Lehmann H, Riederer M. Electromagnetic field measurements using personal
exposimeters. Bioelectromagnetics 2008; 29:160-2.
Kühnlein A, Heumann C, Thomas S, Heinrich S, Radon K. Personal exposure to mobile
communication networks and well-being in children-A statistical analysis based on a
functional approach. Bioelectromagnetics 2009; 30:261-9.
Lauer O, Neubauer G, Röösli M, Riederer M, Mohler E, Frei P, et al. Determination of
correction factors for band-selective personal exposure meters: an example study.
submitted for publication.

24
Navarro EA, Segura J, Portolés M, de Mateo CGP. The microwave syndrome: a preliminary
study in Spain. Electromagnetic Biology and Medicine 2003; 22:161-9.
Neitzke HP, Osterhoff J, Peklo K, Voigt H. Determination of exposure due to mobile phone
base stations in an epidemiological study. Radiat Prot Dosimetry 2007; 124:35-9.
Neubauer G, Cecil S, Giczi W, Petric B, Preiner P, Fröhlich J, et al. Final Report on the
Project C2006-07, Evaluation of the correlation between RF dosimeter reading and
real human exposure. ARC-Report ARC-IT-0218, April 2008 2008.
Neubauer G, Feychting M, Hamnerius Y, Kheifets L, Kuster N, Ruiz I, et al. Feasibility of
future epidemiological studies on possible health effects of mobile phone base
stations. Bioelectromagnetics 2007; 28:224-30.
Radon K, Spegel H, Meyer N, Klein J, Brix J, Wiedenhofer A, et al. Personal dosimetry of
exposure to mobile telephone base stations? An epidemiologic feasibility study
comparing the Maschek dosimeter prototype and the Antennessa SP-090 system.
Bioelectromagnetics 2006; 27:77-81.
Röösli M. Radiofrequency electromagnetic field exposure and non-specific symptoms of ill
health: a systematic review. Environ Res 2008; 107:277-87.
Röösli M, Frei P, Mohler E, Braun-Fahrländer C, Bürgi A, Fröhlich J, et al. Statistical
analysis of personal radiofrequency electromagnetic field measurements with
nondetects. Bioelectromagnetics 2008; 29:471-8.
Santini R, Santini P, Ruz PL, Danze JM, Seigne M. Survey study of people living in the
vicinity of cellular phone base stations. Electromagnetic Biology and Medicine 2003;
22:41-9.
Schüz J, Mann S. A discussion of potential exposure metrics for use in epidemiological
studies on human exposure to radiowaves from mobile phone base stations. J Expo
Anal Environ Epidemiol 2000; 10:600-5.

25
Thomas S, Kühnlein A, Heinrich S, Praml G, Nowak D, von Kries R, et al. Personal exposure
to mobile phone frequencies and well-being in adults: a cross-sectional study based on
dosimetry. Bioelectromagnetics 2008; 29:463-70.
Thuróczy G, Molnár F, Jánossy G, Nagy N, Kubinyi G, Bakos J, et al. Personal RF
exposimetry in urban area. Annals of Telecommunications 2008; 63:87-96.
Tomitsch J, Dechant E, Frank W. Survey of electromagnetic field exposure in bedrooms of
residences in lower Austria. Bioelectromagnetics 2009; epub: 26.9.2009, :DOI:
10.1002/bem.20548.
Viel JF, Cardis E, Moissonnier M, de Seze R, Hours M. Radiofrequency exposure in the
French general population: band, time, location and activity variability. Environ Int
2009; 35:1150-4.
Vrijheid M, Armstrong BK, Bedard D, Brown J, Deltour I, Iavarone I, et al. Recall bias in the
assessment of exposure to mobile phones. J Expo Sci Environ Epidemiol 2009;
19:369-81.

26
Table captions
Table 1: Description of the different exposure assessment methods
Table 2: Characteristics of the study participants.
Table 3: Characteristics of the different exposure assessment methods and Spearman
correlations with the personal measurements (without personal phone use)

27
Figure captions
Figure 1: Scatter plots and linear fits of mobile (a) phone use and mean exposure to uplink
(UL) and cordless (b) phone use and mean exposure to DECT radiation obtained from the
personal measurements. The black points represent mean values when personal mobile phone
calls were included and the grey circles when such values were excluded. The solid and
dashed slopes represent the linear regression line for the mean values with and without
personal phone use, respectively. Note that the scale for the x and y axes are doubled in
Figure 1 b compared to Figure 1 a. Therefore, the slopes of the two figures can directly be
compared.
Figure 2: Mean exposure over one week and contributions from the different sources
including (a) and omitting (b) measurements during personal mobile and cordless phone use
from the calculation
Figure 3: Box plots of the different exposure assessment methods with the mean total
exposure (without personal phone use) in mW/m2 measured by the exposimeters. Exposure
was classified into three groups (<50th percentile, 50-90th percentile, >90th percentile)

1
Tables
Table 1: Description of the different exposure assessment methods
Exposure assessment method Unit Description Exposure sourcesa
Pers. measurements w/o personal phone use
mW/m2 EME Spy 120 measurements every 90 s during one week without personal phone use
FM, TV, Tetrapol, Uplink, Downlink, DECT, W-LAN
Pers. measurements with personal phone use
mW/m2 EME Spy 120 measurements every 90 s during one week including all measurements
FM, TV, Tetrapol, Uplink, Downlink, DECT, W-LAN
Spot measurements mW/m2 7-point-average NARDA SRM-3000 spot measurements in bedroom
FM, TV, Tetrapol, Uplink, Downlink, DECT, W-LAN
Geo-coded distance m Geo-coded distance to the closest fixed site transmitter (ERP > 15 W)2
FM, TV, Tetrapol, Downlink
Geospatial propagation model
mW/m2 Three-dimensional model (in- and outside buildings) for fixed site transmitters
FM, TV, Tetrapol, Downlink
Full exposure prediction model
mW/m2
Prediction model based on geospatial propagation model and exposure relevant behavior
FM, TV, Tetrapol, Uplink, Downlink, DECT, W-LAN
Self-estimated exposure
category Self-reported exposure in comparison to the Swiss population
FM, TV, Uplink, Downlink, DECT, W-LAN
a Frequency bands considered by the exposure methods: FM= FM radio broadcast transmitter; TV= Television broadcast transmitter; Tetrapol= Mobile communication system for closed groups, Uplink= Transmission from mobile phone handset to base station, Downlink= Transmission from mobile phone base station to handset; DECT=cordless phone, W-LAN= Wireless LAN. b ERP= effective radiated power.

2
Table 2: Characteristics of the study participants.
Sex n %
Male 74 44.6
Female 92 55.4
Age (years)
18-34 62 37.4
35-49 50 30.1
50-64 41 24.7
>64 13 7.8
Ownership of wireless devices at home
Persons owning a mobile phone handset 143 87.7
Persons owning a cordless phone 118 72.4
Persons owning W-LAN 55 33.7
Use of mobile phone
No use 65 39.2
1 minute - 1 hour 86 53.0
> 1 hour 13 7.8
Use of cordless phone
No use 61 36.8
1 minute - 1 hour 66 40.9
> 1 hour 36 22.3
3
Table 3: Characteristics of the different exposure assessment methods and Spearman
correlations with the personal measurements (without personal phone use)
Exposure assessment method n Mean Min Max
Correlation (Spearman) 95%-CI
Personal measurements
without personal phone
use
166 0.13 0.01 0.88 1 (-)
Personal measurements
with personal phone use 166 0.15 0.02 0.89 0.94 (0.92;0.96)
Spot measurements 134 0.11 0.00 3.53 0.42 (0.27;0.55)
Geo-coded distance 165 208 4 1026 -0.03 (-0.18;0.12)
Geospatial propaga-
tion model 164 0.14 0.00 2.01 0.28 (0.14;0.42)
Full exposure predict-
tion model 166 0.12 0.03 0.55 0.50 (0.37;0.61)
equala lowera highera
Self-estimated
exposure 157
102
(65%)
37
(24%)
18
(11%) 0.06 (-0.10;0.21)
a in comparison to the general Swiss population

Figure 1
0.1
.2.3
0 1 2 3Use of mobile phone (hours/week)
UL exposure with own calls UL exposure w/o own callsFitted values Fitted values
(a)
mW
/m2

0.2
.4.6
0 2 4 6Use of cordless phone (hours/week)
DECT exp. with own calls DECT exp. w/o own callsFitted values Fitted values
(b)
mW
/m2

Figure 2
0
0.02
0.04
0.06
0.08
0.1
0.12
0.14
0.16
With own phone calls Without own phone calls
mW
/m2
FM TV Tetrapol Uplink Downlink DECT W-LAN
0.15
0.13
(a) (b)

Figure 3
0.2
.4.6
.8P
erso
nal
mea
sure
me
nts
(mW
/m )
<50% 50-90% >90%Spot measurements in bedroom
a)
2
rs= 0.42

0.2
.4.6
.8P
erso
nal
mea
sure
me
nts
(mW
/m )
<10% 10-50% >50%Geo-coded distance
b)
2
rs= -0.03

0.2
.4.6
.8P
erso
nal
mea
sure
me
nts
(mW
/m )
<50% 50-90% >90%Geospatial propagation model
c)
2
rs= 0.28

0.2
.4.6
.8P
erso
nal
mea
sure
me
nts
(mW
/m )
<50% 50-90% >90%Full exposure prediction model
d)
2
rs= 0.50
0.2
.4.6
.8P
erso
nal
mea
sure
me
nts
(mW
/m )
lower equal higherSelf-estimated exposure
e)
2
rs= 0.06