classification of musical sounds by timbre using cepstral...
TRANSCRIPT

Classification of Musical Sounds by Timbre Using
Cepstral Techniques


Table of Contents
1.1 Introduction 1
2.1 Cepstral Analysis 5
2.2 From Spectrum to Cepstrum 7
2.3 Quefrency Peaks 9
2.4 Combined Signal Components and Homomorphic Filtering 12
3.1 cepstrum~ 17
3.2 A Standardized Test 18
3.3 Analysis Parameters 20
4.1 Mel Frequency 25
4.2 Mel Frequency Cepstral Coefficients 26
4.3 mfcc~ 28
5.1 Critical Bands and the Bark Scale 32
5.2 Bark Frequency Cepstrum and bfcc~ 36
6.1 Future Work 38


1.1 Introduction
In a chapter on timbre perception, Stephen Handel notes that the standard definition of timbre1
explains what timbre is not, but fails to identify exactly what it is [Han95]. This is because timbre
depends upon a network of interacting factors, including the temporal evolution of both amplitude and
frequency. Handel goes on to suggest two possible ways that timbre might be perceived: 1) in terms of
the actions required to generate the event, and 2) in terms of purely acoustic properties [Han95, p. 426].
He contends that both aspects must be involved, and that we most likely learn connections between
action, object, and sound through experience. Predictably, attempts to identify timbre with computers
have focused on the second approach, capturing information about the acoustic properties of sound in
very fine detail.
There are two general classes of signal processing techniques for identifying timbre: time
domain and spectral domain methods. In the time domain, some examples are log attack time,
temporal centroid, and zero-crossing rate. A problem with certain time domain methods is that they
rely on the temporal evolution of sounds, hence results may take longer to produce. For instance,
temporal centroid is the time location of the center of gravity of the amplitude envelope [ZRD08]
[HYG02, p. 72]. Obviously, the sound’s entire envelope must pass by in order to take meaningful
measurements. Fortunately for real-time scenarios, the attack transients of musical sounds have been
found to be of crucial importance to timbre perception. In some cases an analysis of only the first 60
milliseconds of a sound is more important for identification than the steady state [Gre75, p. 10]. One
basic measure of the nature of an attack in the time domain is log attack time, which simply measures
the time duration between a sound’s attack and its steady state, expressed as a logarithm [TKTF04]
[ZZD08]. This varies among instruments; for example, string instruments have a longer attack time
than brass or woodwinds [MK98, p. 7]. Zero-crossing rate is measured on a time domain segment of a
1 “The quality of sound by which a listener can tell that two sounds of the same loudness and pitch are dissimilar.” [ANSI73]
1

signal by taking the absolute value of the difference in sign between successive samples:
0.5∑n=0
N−1
∣sign x n−sign x n−1∣
where sign, the signum function, returns the sign of a given argument, or zero if the argument equals
zero. Zero-crossings are registered when the signum function returns different values for neighboring
samples. Zero-crossing rate is a measure of general signal noise, and can be useful to distinguish
instrument attacks [TC02].
Classically, spectral techniques making use of a short-time Fourier transform have been a more
dominant solution [ZR07, p. 3]. Spectral envelope has long been assumed to be the most important
timbral signature of a sound, though this is no longer taken for granted [MK98, p. 1]. A general
problem with spectral domain methods is high dimensionality. In real-time applications—where the
size of an analysis window is typically between 128 and 1024 samples—a brute force comparison
between the complete spectral envelope of an input signal and those in a database of previous analyses
can be computationally overwhelming. The solution to this problem is to forgo some spectral
resolution in order to reduce total points of comparison. A great number of techniques are currently in
use for MPEG7 audio descriptors [ZR07], but some popular examples that reduce data size are spectral
flux, subband analysis, spectral flatness, spectral rolloff, spectral centroid, spectral smoothing, and
cepstral analysis.
Although it is a spectral domain technique, spectral flux F is both temporally and spectrally
based, as it requires two analysis frames, and takes the total squared difference in magnitude between
their spectra [ZR07]:
F=∑k=1
N /2
∣X 2 k ∣−∣X 1 k ∣2
where |X1(k)| and |X2(k)| are successive magnitude spectrum frames. Assuming that the analyses are
2

performed at a relevant point in the evolution of a sound (e.g., immediately after an attack), this
measurement of spectral fluctuation can be used to differentiate between timbres. Subband analysis
can refer to any spectral technique that tracks spectral changes within a handful of specific frequency
ranges concurrently. Thus, spectral flux could be measured according to subbands for more precise
information. Spectral flatness estimates the noisiness of a signal, where pure white noise corresponds
to maximum flatness. It is defined as the ratio of the geometric mean to the arithmetic mean of the
magnitude spectrum of a signal [Pee04], and is also often computed relative to specific subbands. Both
spectral rolloff and spectral centroid give an idea of where spectral energy is concentrated, but in
different ways. Spectral rolloff is expressed as a cutoff frequency below which a given percentage of
magnitude spectrum energy is concentrated [TC02]. Spectral centroid is the magnitude spectrum’s
center of gravity, computed in [Tza02] as:
C=∑n=0
N−1
∣X n∣n
∑n=0
N −1
∣X n∣
where C is centroid and |X(n)| is the magnitude spectrum. Other sources weight the average according
to frequency rather than bin number [SWT04]. This is considered a reasonable estimate of timbral
brightness (i.e. high concentration of power in the higher frequency bins) [Bea82], related to the
vertical axis of John Grey’s timbre space [Gre77].
In [PAZ98], a timbre classification system is described that smooths spectra according to a bank
of eleven filters composed such that there are two filters per octave. Assuming that the instruments in
question have unique distributions of energy in relation to the bands of the filterbank, it is possible to
accurately distinguish between timbres by creating training-based templates for comparison against
incoming signals. But information other than general spectral envelope—such as a strong pitch
component in a specific instance of an instrument articulation—will also be reflected under this
3

technique. It would be ideal to have an analysis method that identifies, for instance, a timpani without
regard for its tuning.
The final spectral domain technique mentioned above, cepstral analysis, is purported to be such
a method [Roa96]. This paper will describe the technique in detail by documenting the development of
a Pd external for classifying percussion instruments. Before presenting data illustrating the
effectiveness of this implementation at different stages of its development, I will provide a basic
technical explanation of how the cepstrum is computed, along with a conceptual explanation of the
resulting data. For those who are used to looking at Fourier transform data in the frequency domain,
cepstral data can be initially confusing. Building on an understanding of the raw cepstrum, two
perceptually biased versions—the mel-frequency and bark-frequency cepstrum—will be introduced.
The Pd implementations of all three techniques will be compared in order to explore the effects of
perceptual models in timbre classification.
4

2.1 Cepstral Analysis
The term cepstrum was originally defined in a 1963 article by Bruce P Bogert, MJR Healy, and
JW Tukey, entitled “The Quefrency Alanysis of Time Series for Echoes: Cepstrum, Pseudo-
Autocovariance, Cross-Cepstrum, and Saphe Cracking.” [BHT63] Initial motivation for the technique
came out of work on echo detection in seismological data, which is still a primary cepstral application
today. As the title of the article relates, its authors devised terminology that forges conceptual links
between the frequency domain spectrum and the period domain cepstrum. Frequency values that
typically occupy the x-axis of a spectral plot become quefrency values in the cepstral domain. Signal
processing terminology such as filtering, phase, and analysis were translated to liftering, saphe, and
alanysis, respectively. For those interested in approaching the details behind this tongue-in-cheek
vocabulary, the most accessible of conceptual definitions is that found in Curtis Roads’ Computer
Music Tutorial. According to Roads, cepstral analysis “tends to separate a strong pitched component
from the rest of the spectrum.” [Roa96, p. 516] It “tends to deconvolve two convolved spectra.”
[Roa96, p. 518] These features explain why cepstral techniques are so heavily used in voice processing
and identification. [CSK77, p. 1437] If speech is fundamentally a convolution of glottal impulses with
the resonance of a speaker’s oral cavity, cepstral analysis enables us to view these components
separately. By separating filtering characteristics from the effects of a particular pitched articulation,
the cepstrum provides a general spectral signature of a person’s voice. As the filtering characteristics
of one person’s oral cavity are noticeably different from those of another, the value of this measure to
voice processing is obvious.
The cepstrum and its variants have seen increasing use in musical applications as well. Based
on its connections to speech processing, it is not surprising that cepstral techniques have been applied
to vocal pitch tracking, where (in combination with other techniques) results are robust enough to
detect multiple pitches at once. The Cepstrally-Biased Harmonic Product Spectrum method (CBHPS)
5

is a hybrid pitch tracking approach that has proven effective even under noisy conditions [CMS01, p.
405]. In the area of synthesis, results that are usually achieved through convolution (multiplication of
two signals in the frequency domain) can also be carried out by summing early cepstral coefficients and
quefrency peaks via cepstrum. Mark Rudolph describes this process:
The region near the origin [early cepstral coefficients] concentrates the information concerning the smooth spectrum X, and modifications to this region can be made to correspond to variations in the shape and size of a resonating cavity. . . . Modifications to the positions of the high quefrency peaks affect the perceived pitch of the resynthesized sound, and modifications to their relative amplitudes changes the perceived harmonics and timbre. . . . Furthermore, two sets of cepstral values may be interpolated with time-varying weights in order to achieve fusions of distinct features. [Rud89, p. 266]
The literature on cepstral synthesis techniques is mostly contained within the domain of speech
synthesis, where it offers computational efficiency [Ima83] [YMT+97] [TYM+00].
Perhaps most famously, cepstrum has been applied as a compact feature vector for quantifying
timbre. The Audio Oracle, developed by Shlomo Dubnov, Gérard Assayag, and Arshia Cont shuffles
frames of an audio file by following the structure of a Factor Oracle structure. [DAC07a]. Data drawn
from cepstral analysis is used as a feature vector for each 2048-sample window of the audio file.
Similar vectors indicate timbrally similar frames of audio that may be suitable for creating artificial
transitions. Using this information, the Factor Oracle is constructed to allow for shuffling that will
generate a sequence of windows with timbral patterns that are similar to (but distinct from) the original
file. For instance, if an original audio file had the following timbral sequence of events:
vibraphone, oboe, vibraphone, piano, vibraphone, piano
a reshuffled version resulting from a traversal of the Factor Oracle would have a timbrally similar
sequence of events. In the resulting audio file, instances of vibraphone followed by piano would be
more frequent than instances of vibraphone followed by oboe because there are simply more cases of
the former in the original sound file. Compact cepstral information makes this process possible within
6

reasonable computation times.
Basic objects for cepstrum computation in standard computer music programming
environments like Max/MSP, Pd, and SuperCollider would be useful in a variety of situations.
Although some percussion classification research does make use of cepstral analysis [HYG02]
[TKTF04], there are no widely available objects for real-time use in the environments mentioned
above. Cepstral data describing spectral envelope is very compact, and is therefore appropriate for use
in real-time applications of timbre classification.
2.2 From Spectrum to Cepstrum
This section presents a step by step transition from the frequency to quefrency domain. For
maximum clarity, this analysis will be based on a synthesized (and thus noise-free) signal with
harmonic content: a 440 Hz sawtooth wave. Fig. 2.1 shows the magnitude spectrum of this recording
before the Nyquist frequency.
As expected, we see a clear peak near 440 along the x-axis, with lesser peaks evenly spaced throughout
the spectrum at harmonics 880, 1320, 1760, 2200 Hz, etc. We also see a spectral envelope in the
7
Figure 2.1: magnitude spectrum of a 1 second recording of a 440 Hz sawtooth wave, with sampling rate 44100, where N = 44100.

gradual decrease in amplitude from one harmonic to the next. This should be a familiar picture. Of
course, not all spectral plots so clearly illustrate a spectral peak’s connection to the actual frequency
content of a signal. In this case, a sampling rate of 44100 Hz was used, and all 44100 samples of the 1
second recording were taken into account for analysis. This gives us an unusually precise fundamental
frequency of analysis [Moo90, p. 72].
The real cepstrum computation is defined as:
xRC n=ℜ IDFT [ log∣X k ∣] 1
where ℜ returns the real part of the IDFT, X k is the frequency domain Fourier transform of a
signal x n , and x RC n is the real cepstrum. Fig. 2.1 already shows us the magnitude spectrum
∣X k ∣ . The only remaining steps are to convert to a log scale and take the real portion of an
inverse Fourier transform. At the most basic conceptual level, a cepstrum is the Fourier transform of
the Fourier transform of a signal. This is why it is commonly referred to as the “spectrum of a
spectrum.” Although it is usually implemented as an IDFT of the DFT rather than a DFT of the DFT, it
is still a spectral representation of the spectrum data of a signal. Yet, the inverse Fourier transform is
typically associated with the transformation of spectral data into a reconstructed time domain signal,
and its usage here can be conceptually misleading. Because we are performing an IDFT on DFT data,
it may seem intuitive that the sequence of operations given above would result in something like our
original signal. But between the DFT and IDFT above, we have made some fundamental changes.
First, by taking the magnitude,
∣X k ∣= X k re2 X k im
2
where X k re and X k im are respectively the real and imaginary parts of our transformed signal,
we have disposed of all complex values. Without these complex values, there is no hope of accurate
8

resynthesis. Further, we have converted to the log scale. An IDFT of log∣X k ∣ will not produce
anything like our original signal. IDFT [ log∣X k ∣] is simply another Fourier transform performed
on the results of a previous Fourier transform. At this point, it is important to remember that the
difference between the Fourier transform and its inverse is merely a sign change in the exponent and
normalization on either the forward or inverse side:
DFT [x n ]=X k = 1N ∑
n=0
N −1
x n −eink 0≤k≤N −1
IDFT [ X k ]=x n=∑k=0
N−1
X k ei kn 0≤n≤N−1
where i = the imaginary unit, and =2/N . The fundamental operation is the same [Moo78, p.
46]. In fact, the original definition of cepstrum from Bogert et al. was indeed the DFT of the log of the
magnitude spectrum of a signal.
2.3 Quefrency Peaks
Now that we have reviewed the operations needed for producing a cepstral plot, we can engage
with the information it offers. As in a spectral plot, the clearly pitched components of a signal can be
easily located. However, because cepstrum moves us out of the frequency domain, the sample indexes
of a cepstral plot are connected to frequency in a different manner. Referring back to the magnitude
spectrum of Fig. 2.1, the peak corresponding to the fundamental frequency (f) of our 440 Hz sawtooth
wave occurs near sample number 440 of the plot. When treated as a signal, the evenly spaced
harmonic peaks that follow can themselves be considered a consistent frequency in the spectrum.
These peaks are graphically very similar to the waveform of an impulse train with decreasing
amplitude. It is this “impulse train” that causes a cepstral peak. Locating a peak based on f requires a
few simple operations. In the cepstral domain, sample indexes no longer refer to harmonics of the
9

fundamental frequency of analysis; rather, they are indexes of time. A 440 Hz signal (f1 = 440) is
represented in time as1f 1
= 1440
= 0.0022727 seconds , which is the time required for one cycle to
occur. Consequently, there should be a cepstral peak at the point along the quefrency axis
corresponding to 0.0022727 seconds. Where spectral data shows frequency, cepstral data shows
period. The usefulness of the term quefrency is in the place of period is debatable. At the very least it
serves as a reminder that the cepstrum does not represent the time domain, but something different
altogether. The quefrency bin for 440Hz will be a time sample index, where each sample represents
1SR
= 144100
= 0.000022676 seconds. To find the quefrency bin (q) of 1f 1
= 0.0022727 seconds,
we simply divide it by the time duration of a single sample at our sampling rate:
q =
1f 1
1SR
= SRf 1
2
In the current example, this points us to 44100440
= 100.2273, or bin 100. A closer look at this area of
the cepstrum provides some vindication:
10

The peak we expected is indeed located at bin 100, and—because this is an idealized analysis—it is
extremely well defined. If the signal’s frequency content is not known in advance, it can be determined
based on equation 2 as well:
SRq
= f 1
Notice that the number of samples, N (which is crucial for calculating actual frequency based on
spectral bin number, or vice versa) is not a part of this equation. If the sampling rate SR is fixed at
44100, cepstral bin 100 will always correspond to a frequency of roughly 440 Hz—regardless of
whether N represents 44100, 22050, or 1000 samples. The ability to see the cepstral peak, however,
will certainly be affected by N. Just as SR2
(the nyquist) is related to the highest frequency
representable by the DFT, N2
is related to the index of the highest quefrency (the longest period, or
lowest frequency) that can be represented by the cepstrum. Cepstral bins beyond this point contain
values that are symmetrical with the first half.
Using equation (2), we can move on from quefrency index 100 to find the frequency
11
Fig. 2.2: Cepstral coefficients 1-500 of a 440 Hz sawtooth wave. A prominent peak at bin 100 corresponds to the 440 Hz fundamental frequency.

corresponding to the next cepstral peak at index 200, finding that f 2 =44100200
= 220.5 . Peaks at
index 300 and 400 follow, which are due to frequencies of roughly 110 and 55 Hz respectively.
However, our original 440Hz sawtooth wave did not have energy at either of these frequencies.
Referring once again to Fig. 2.1, we can explain their presence. The “impulse train” type signal that is
the magnitude spectrum of a sawtooth wave is not sinusoidal, and therefore must contain partials of
some sort. These partials cannot be assumed to relate to the original signal in any meaningful way.
Therefore, when looking for the fundamental pitch of a harmonic signal, only the first cepstral peak is
likely to be useful.
2.4 Combined Signal Components and Homomorphic Filtering
The possibility of deconvolution is unique to cepstral analysis. Deconvolution comes from a
class of homomorphic systems proposed by Oppenheim in 1967. According to Oppenheim,
homomorphic systems “satisfy a generalization of the principle of superposition; i.e., input signals and
their corresponding responses are superimposed (combined) by an operation having the same algebraic
properties as addition.” [OS89, p. 768] For deconvolution, the specific pitch in a signal can be
distinguished from its general spectral envelope, such that the convolution f(n) * g(n) becomes a
summation. In the case of speech, f(n) is the vocal tract and g(n) the glottal impulse. The move from
multiplication-based convolution to summation based convolution can be expressed:
x n = f n∗g n
X k = F k G k
log∣X k ∣= log∣F k ∣ log∣G k ∣
Then, remembering the definition of real cepstrum given in (1), after taking the real result of the IDFT
of each element, we can represent the final step above as x RC n= f RC ng RC n . The cepstrum
12

of the entire signal is the sum of the corresponding filter and impulse cepstra. This is the advantage of
moving into the logarithmic domain—filter and impulse information can be combined or separated
through simple addition or subtraction.
A demonstration of this concept will be most clear using vocal signals. Figure 3 shows cepstra
based on recordings of a singer articulating the same voiced vowel at three different frequencies: 137
Hz, 172 Hz, and 210 Hz. For each of the corresponding cepstral plots, we expect to see peaks for
fundamental frequencies at the following quefrency bin numbers:SRf
= 44100137
= 321.9,
44100172
= 256.4, and44100
210= 210 . These are shown in Fig. 2.3.
The general contours of these cepstra are the same, the most striking difference being the location of
the quefrency peaks, which are less well defined than those of the synthetic signal above. Graphically,
we can clearly see that f RC n is summed with g RC n , and that isolating one or the other simply
requires subtraction. To isolate the spectral envelope of one of these signals, its quefrency peak should
13
Figure 2.3: Cepstra of three different pitches sung with the same voiced vowel. (a) 137 Hz (b) 172 Hz (c) 210 Hz.
be notch filtered and removed from the cepstrum. This deconvolution is far from perfect, and claims
about the ability of cepstral analysis to separate source and filter can be misleading. The human voice
is one of the strongest examples of the phenomenon, and other instruments cannot be expected to give
such clear results. Isolation is most effective when the real cepstra of impulse and filter occupy
different quefrency ranges.
As can be seen, higher frequency pitched components are nearer to the early cepstral cepstral
coefficients. These early coefficients contain the most crucial spectral envelope information because
they represent the slowest rate of spectral change. Cepstrum indicates rates of change in the log
magnitude spectrum of a signal. The cepstrum of f(n) represents the filter component , which varies
very slowly in the spectral domain. It has a relatively static spectral signature that affects the timbre of
impulses that are convolved with it (synthetically or naturally).
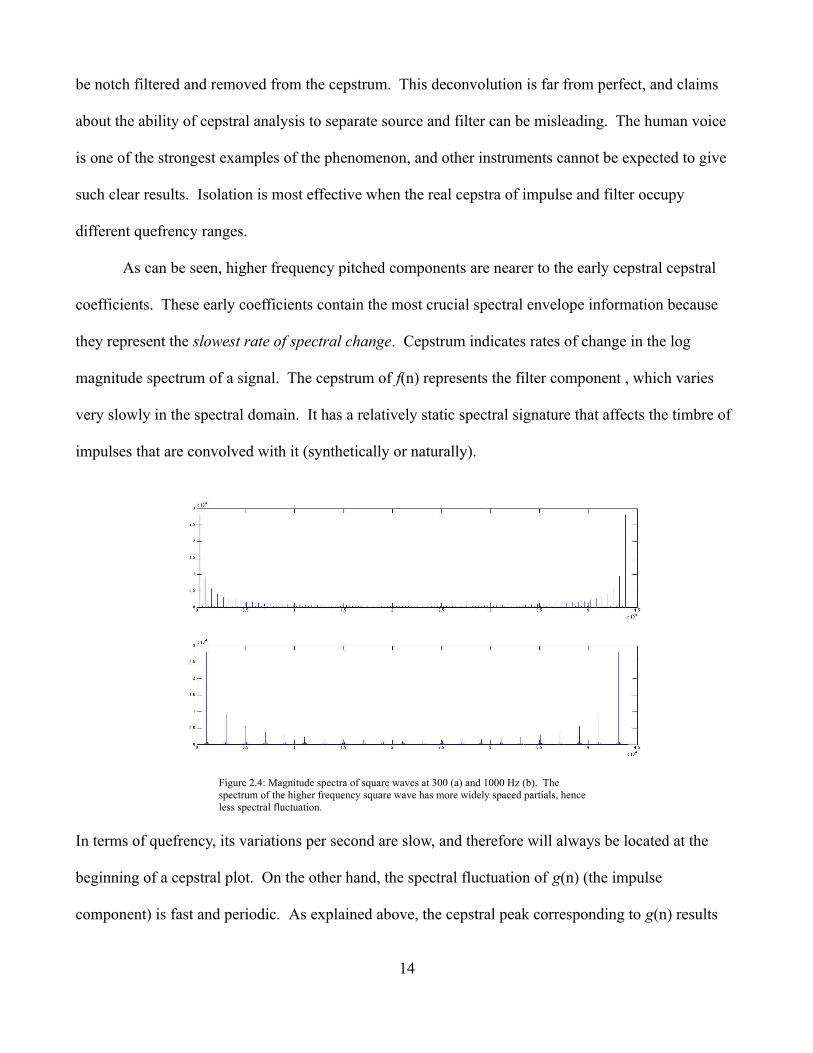
In terms of quefrency, its variations per second are slow, and therefore will always be located at the
beginning of a cepstral plot. On the other hand, the spectral fluctuation of g(n) (the impulse
component) is fast and periodic. As explained above, the cepstral peak corresponding to g(n) results
14
Figure 2.4: Magnitude spectra of square waves at 300 (a) and 1000 Hz (b). The spectrum of the higher frequency square wave has more widely spaced partials, hence less spectral fluctuation.

from evenly spaced harmonic peaks in the spectrum. These spectral peaks (and the valleys between
them) constitute periodic spectral fluctuation. Lower frequencies cause higher periodic rates of spectral
change, which is why the 137 Hz quefrency peak from Fig. 2.3 is located higher along the quefrency
axis than the 172 Hz peak. Higher frequency corresponds to lower period. Consider the spectral plots
of two square waves given in Fig. 2.4—one at 300 Hz (a) and one at 1000 Hz (b). Fluctuations in the
spectrum of the 300 Hz square wave are much more frequent (i.e. they are more closely spaced in terms
of frequency) than those of the 1000 Hz signal. By the logarithmic nature of frequency distribution, the
spacing between harmonics gradually increases with frequency. Spectrally, signals with higher
fundamental frequencies will vary less rapidly. If these spectral variations are slow enough, they will
overlap with the area of spectral envelope information in the cepstrum—roughly the first 40 or so
coefficients. This will make both f RC n and g RC n less reliable.
In Figure 2.3, however, f RC n and g RC n do not overlap. Regardless of the frequency of
the pitched component, the early cepstral coefficients in the three recordings are clearly very similar.
Figure 2.5 provides a detailed view of this information.
15
Figure 2.5: Cepstral coefficients 0-199.

Based on the first 40 coefficients alone, it is possible to verify that these three cepstra correspond to
sounds with very similar timbral characteristics. By analyzing the signals of different sung vowels and
compiling a database, it is also possible to discriminate between vowels based on cepstrum, with
complete independence from pitch. Specifically, we can quantify the timbral similarity of any two
templates in the database by calculating the Euclidean distance d:
d=∑n=0
N −1
vn−wn2
where N is the length of vectors v and w—the early cepstral coefficients from two distinct cepstra.
Based on the values of d for a given set of cepstra, an arbitrary similarity threshold can be chosen in
order to classify templates appropriately. To classify a new signal, the Euclidean distances between it
and each template can be compared to find the closest match. This brings us to the point of a real-time
musical application. Cepstral analysis provides a compact description of the spectral envelope of an
instrument that is relatively unaffected by the particularities of specific articulations, such as pitch.
With a large enough database of training examples, the events of a performance can be classified and
tracked based on timbre in order to control immediate or large scale computer processes. In the case of
inharmonic or noise-based percussion instruments, a cepstral analysis tool can be used as a functional
replacement for pitch tracking in score following applications, or for automatic performance
transcription. The next section describes an implementation of cepstral analysis in the form of a Pd
external, the parameters involved, and its effectiveness in a real-time test application.
16

3.1 cepstrum~
Functionally, the cepstrum~ object is very similar to the classification mode of bonk~. Both
require that the user give training examples of the percussion instruments that are to be identified,
which are then stored as templates. Once training is complete, any new incoming signals are compared
against the stored templates, and the nearest match is output as the index number of the appropriate
instrument as assigned during training [PAZ98]. Unlike bonk~, cepstrum~ does not have an attack
detection mode; it simply takes a cepstral snapshot when it receives a “bang”, or a training or
identification request. This means that the length of time between an onset2 and the point of analysis
must be chosen. The range of cepstral coefficients used for comparison, and number of training
examples given are the other basic parameters worthy of research. Window size is also variable, but
the effects are predictable; a larger window size will increase data resolution, and most likely improve
accuracy. This test will start with a window size and overlap designed for real-time use, with the goal
of delivering classification results near 20 ms after an attack. Attacks are reported within 6-10 ms of
latency by bonk~, and windows overlap every 64 samples, or 1.45 ms. When a training or
identification request is made, the analysis is performed on the most recent complete signal frame,
which is copied into the object’s data structure as each frame passes. The analysis is actually carried out
on the signal as it existed 1024 samples (or 23 ms) before the request. The choice of a post-attack
analysis time is therefore extremely important. If analysis is performed immediately upon an attack
report from bonk~ (i.e. 6-10 ms after the actual attack), the window in question begins more than 10 ms
before the actual attack. For this reason, a distinction must be made between the actual time of
analysis, and the millisecond parameter value given to cepstrum~ as the time of analysis. In section 3.3
below, we will search for the optimal values for all analysis parameters by making classifications over
a large variety of settings and tracking the results. First, however, we will need a standardized test and
2 All onsets are detected by bonk~.
17

scoring system.
3.2 A Standardized Test
The collection of instruments that fall under the category of percussion is notoriously vast. The
process of choosing a suitable set of instruments for this test was guided by three desires: diversity of
material—including wooden, metallic, and membrane instruments; diversity of spectrum—including
both noisy and pitched instruments; relatively short decay. General diversity is helpful both because it
provides a relatively easy starting place for evaluating the effectiveness of cepstrum~ (differentiation
should be easier among diverse instruments), and because we can get an impression of cepstrum~’s
response to a range of instruments, pointing to generally useful rather than instrument-specific settings.
Once general settings are found, future tests for very limited instrument sets can then expose
appropriate settings that may improve accuracy and latency in specific contexts. The training set
chosen here is pictured in Fig. 3.1, and consists of a low tom, wooden plank, Chinese cymbal, nipple
gong, cabaça (shaker), metal bowl, bongo, small anvil, tambourine, thundersheet, conga, and wooden
box.
18
Figure 3.1: instrument test set.

As Fig. 3.1 illustrates, many of the instruments are placed on foam rather than suspended, so the
resonances of the cymbal and gong are limited. The waveforms and magnitude spectra of the
collection are shown in Figs. 3.2 and 3.3.
A Shure SM57 cardioid microphone was used for the signal source, placed at a downward angle of 45°
with the capsule positioned 30 cm above the cabaça. Yarn mallets with a hard rubber core were used
19
Figure 3.2: Waveforms of instrument test set, ordered as listed above, and moving from left to right, top to bottom.
Figure 3.3: dB magnitude spectra of instrument test set, ordered as listed above, and moving from left to right, top to bottom.

for striking, and the point of contact with each instrument was consistent for all attacks. 20 training
attacks of varying amplitude were recorded for each instrument. The test sequence consisted of one
strike of each instrument in the order given above, at a tempo of roughly 108 bpm (~550 ms between
attacks). 10 unique runs of this test sequence were recorded, followed by 3 additional unique runs at
roughly 180 bpm (~330 ms between attacks). With a total of 13 runs through the 12 instruments, the
complete test consists of classifying 156 unique attacks.
3.3 Analysis Parameters
Locating optimum settings using this test is a multidimensional problem. It cannot be assumed
that the cepstral coefficient range used to generate a high score based on analyses taken 5 ms after an
onset report will be ideal for other settings; the parameters may be interdependent. The cepstral
coefficient range (CCR) used for comparison, and post-onset analysis time (AT) should be varied
systematically for a compilation of resulting scores. As explained above, the effects of varying window
size are more predictable than other settings, and will therefore be set at a typical real-time value of
1024 samples. The first test is based on only 5 training attacks per instrument, and the effect of
providing a larger training set will be covered later. For the purpose of plotting visually interpretable
results, we are constrained to 3 dimensions, with CCR, AT, and score being the most relevant set of
parameters.
Fig. 3.4 shows a series of plots from the initial testing process. It begins with AT set to 0 ms,
with each subsequent plot along the y axis (moving away from the reader and to the left) representing
analyses taken for AT values that increase in 1 ms increments. The entire image shows AT settings
from 0 - 45 ms. Along the x axis (moving away from the reader and to the right), the effects of
incrementing the CCR setting by 50 can be seen, showing CCR values from 0-50 through 0-500
cepstral coefficients. The z axis (vertical) shows normalized scores that fall between 0 and 1, where 1
20

represents a perfect score of 156 accurate classifications. Note that the actual range of the z axis is
about 0.7-1, as the lowest scores were near 70%.
The plot reveals a few interesting trends. First of all, increasing CCR improves results in a varied way
that depends upon the AT setting. At AT=0, widening CCR from 0-50 to 0-100 (at the first two values
along the x axis) results in a jump in accuracy, though only up to about 75%. Subsequent increases in
the CCR by 50 do not have a major effect, and the overall scores for AT=0 are nearly flat with respect
to the CCR setting. Looking along the y axis at only the lower CCR settings, scores steadily rise as AT
is increased from 0 to about 16 ms, where they begin to fluctuate slightly. A larger number of test runs
may smooth out these changes, as the overall trend seems to be improved accuracy as AT increases.
Nevertheless, there is a wide area of stable 90%+ accuracy between AT=16-45 ms for higher CCR
values. A wide AT plateau should translate to reliable ability to handle the varied spectral
characteristics of musical instruments in actual performance. This plateau begins early along the AT
axis, which is desirable in terms of reducing latency. A clear tradeoff for the AT parameter can be seen:
waiting longer to take a snapshot for analysis gives more relevant classification data and higher scores.
21
Figure 3.4: cepstrum~ test results based on 5 training examples.

Other wide areas of relatively high accuracy may exist at AT values higher than 45 ms, but they are not
sought out here because they would fall outside the ideal range of latency. Based on this initial test, an
AT value existing a few points beyond the beginning of the plateau can be proposed as an optimal
value. AT=20 ms is still relatively early, and allows for a few milliseconds of leeway.3
Looking at CCR trends in more detail, scores appear to level off around CCR=0-200 for many
AT values, but there are some erratic exceptions among the earlier AT plots. By the time AT=40, the
improving accuracy with respect to CCR is quite smooth. There seems to be no reason to use CCR
values less than 0-200, where scores are clearly lower in general. Scores do not improve or decline
significantly between CCR=0-200 and CCR=0-500, reinforcing what was described in section 2—that
early cepstral coefficients contain the most relevant data. In the case of instruments with harmonic
pitch content, the higher coefficients could contain a useful quefrency peak, but there is certainly no
reason to go beyond CCR=0-512 when using a 1024 point window. From section 2, we know that
cepstral coefficients above N2
will not provide any new information. Based on the lack of score
improvement beyond CCR=0-200, and in order to avoid unnecessary computation, CCR=0-200 can be
proposed as the optimum CCR setting.
With an informed picture of appropriate AT and CCR values, we can look at the output of
cepstrum~ at these specific settings and determine which instruments cause consistent errors. The table
below shows 13 runs through the 12 test instruments. An accurate classification of a complete run (i.e.
row 2) should show the indices of the 12 instruments in order, from 0 through 11. Errors are shown in
bold italics.
3 Again, AT=20 is a parameter setting for cepstrum~. The analysis would be performed ~30 ms after the actual onset (bonk~ reports onsets 6 to 10 ms after they actually occur, and cepstrum~ computes its analysis 20 ms after that). Even more confusingly, the signal being analyzed is one that existed 1024 samples (23 ms) earlier, since analysis is carried out on the most recently copied full frame of samples. In the end, this means that the optimum AT setting described above corresponds to a frame of audio beginning ~7 ms (30 minus 23 ms) after the actual onset. Apparently, this is the point at which more relevant spectral envelope information begins to emerge from these sounds.
22

Run 1 0 1 2 3 4 5 10 7 8 9 10 11
Run 2 0 1 2 3 4 5 6 7 8 9 10 11
Run 3 0 1 2 3 4 5 10 7 8 9 10 11
Run 4 0 1 10 3 4 5 10 7 8 9 10 11
Run 5 0 1 2 3 4 5 10 7 8 9 10 11
Run 6 0 1 10 3 4 5 6 7 8 9 10 11
Run 7 0 1 2 3 4 5 10 7 8 9 10 11
Run 8 0 1 2 3 4 5 10 7 8 9 10 11
Run 9 0 1 2 3 4 5 10 7 8 9 10 6
Run 10 0 1 2 3 4 5 10 7 8 9 10 11
Run 11 0 1 2 3 4 5 10 7 8 9 10 11
Run 12 0 1 11 3 4 5 6 7 8 9 10 11
Run 13 0 1 2 3 4 5 6 7 8 5 10 11
Classification of instrument 6 (a bongo) as instrument 10 (a conga) is the most frequent error, which is
unsurprising from an intuitive standpoint considering that they are drums with similar head material.
The other errors are less obvious. In runs 4 and 6, the chinese cymbal strike (2) was classified as a
conga (10), and run 12 shows a classification of chinese cymbal as wooden box (11). Similar errors
persist up to AT settings of 30 ms. With more distance from the onset at AT=45, this changes. Conga is
never mistaken for Chinese cymbal, however, the wooden box is classified as wooden plank (a more
understandable error). The immediacy vs. accuracy tradeoff seems to be in effect here as well. Waiting
for an instrument’s percussive onset to give way to a steady state is beneficial, but results are delayed.
Keeping the above errors and overall results from fig. 3.4 in mind, the effect of expanding the
training set can be evaluated. Fig. 3.5 shows test results organized in the same manner as fig. 3.4, but
23

based on a training set consisting of 10 rather than 5 attacks per instrument.
The trends are similar to those in fig. 3.4. Some improvement can be seen, with the highest score
reaching 99% accuracy by AT=45 ms, and the first score over 90% occurring one tick earlier on the AT
axis at AT=15 ms. Above CCR=0-200, scores rise and fall somewhat unpredictably. Scores stabilize
among higher AT and CCR values, but the proposed optimal settings of AT=20 and CCR=0-200 still
seem appropriate for situations that require immediate results.
While promising, cepstrum~’s performance is limited to ~90% accuracy for total latency times
under 30 ms in a relatively simple test. Other methods could yield higher accuracy with less latency.
Cepstral analysis is based entirely on objective measurements of sound, and does not make use of
measurements related to human pitch perception that have been formed through the systematic tracking
of subjective judgements. Drawing on a perceptually-based frequency scale, a popular form of cepstral
analysis for feature detection is the mel frequency cepstrum [Log00] [HYG02] [LEB03] [DAC07a]
[DAC07b]. Section 4 introduces the mel cepstrum and reviews the effectiveness of its application in
the standardized test used above.
24
Figure 3.5: Test results based on 10 training examples of each instrument.

4.1 Mel Frequency
In 1937, a perceptual scale for measuring pitch was proposed in [SVN37]. Based on the
experimental data of 5 subjects, the authors hoped to discover a frequency unit that could be
manipulated arithmetically yet remain observationally verifiable. In reference to melody, this unit was
named the mel. For any particular mel value, one should be able to double it, then convert both the
original and doubled values back to a frequency scale and confirm through experiment that the doubled
mel frequency is judged to be twice as high in terms of pitch. Likewise, halving or tripling a mel value
should lead to appropriately scaled perceptual results.
The experiment itself consisted of sessions in which test subjects were presented with two
different tones produced by identical oscillators at an even loudness level of 60 dB. The pitch of one
oscillator was fixed, but the other could be varied manually. Subjects were instructed to adjust the
second oscillator until it was half as high in terms of pitch as the reference tone [SVN37, p. 187]. This
process was carried out for reference tones at frequencies of 125, 200, 300, 400, 700, 1000, 2000, 5000,
8000, and 12000 Hz. The geometric mean of the test subjects’ half-pitch judgements at each of these
frequencies was taken and used to construct the curve shown in Fig. 4.1. The arbitrarily chosen point
of intersection between frequency and mels is at 1000 Hz/mels. Even mel spacing beyond this
25
Figure 4.1: Mel vs. log frequency. From [SVN37]
intersection translates to increasingly large spacing in Hz. Thus, warping the frequency axis of a
spectrum according to an evenly spaced mel scale places more weight on lower frequency values. The
general formula for calculating mels is
mel=1127.01048loge 1f
700 (3)
where f is frequency in Hz [Ber49].
4.2 Mel Frequency Cepstral Coefficents
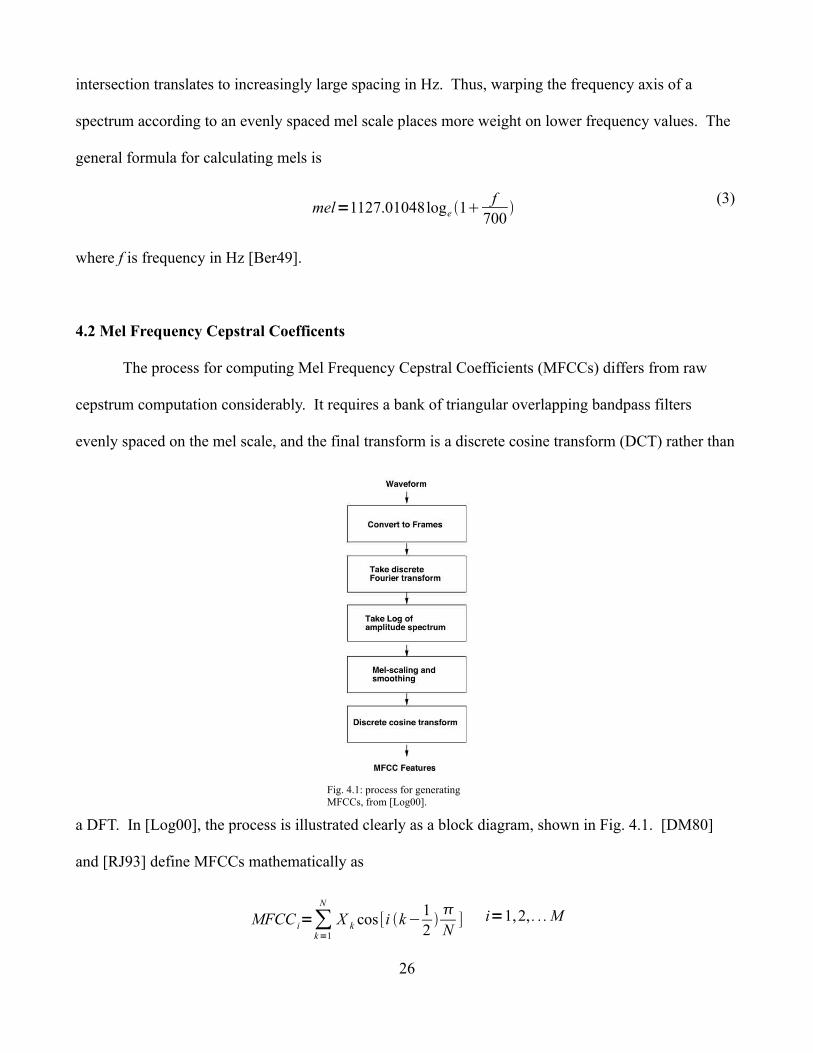
The process for computing Mel Frequency Cepstral Coefficients (MFCCs) differs from raw
cepstrum computation considerably. It requires a bank of triangular overlapping bandpass filters
evenly spaced on the mel scale, and the final transform is a discrete cosine transform (DCT) rather than
a DFT. In [Log00], the process is illustrated clearly as a block diagram, shown in Fig. 4.1. [DM80]
and [RJ93] define MFCCs mathematically as
MFCC i=∑k=1
N
X k cos [i k−12N] i=1,2, . . . M
26
Fig. 4.1: process for generating MFCCs, from [Log00].

where M is the number of desired cepstral coefficients, N is the number of filters, and X k is the log
power output of the kth filter. Note that [Log00] specifies the log amplitude spectrum. As will be
discussed below, the amplitude scale of the spectral y-axis is yet another variable to consider. After
amplitude scaling, the mel-scaling and smoothing step significantly reduces the size of spectral
envelope data. The extent of reduction depends on sampling rate, window size, and the mel spacing of
the filterbank. The lower limit of the filterbank is DC, and the upper limit should not reach the nyquist
frequency. Using equation (3), the nyquist at a sampling rate of 44100 is calculated as 3923 mels.
With an even spacing of 150 mels, this produces 27 mel values below the nyquist, which correspond to
25 overlapping filters (the first and last mel values are the lower and upper bounds of the first and last
filters respectively). Fig. 4.2 illustrates such a filterbank. Multiplying the log power spectrum against
this filterbank compresses the first 512 bins of a 1024 point window into a smoothed 25 point
estimation of the spectrum with a weighting based on the mel scale. Accordingly, Fig. 4.2 clearly
shows that higher frequency content is averaged over much larger ranges of values than lower
frequency content.
The DCT at the end of the MFCC computation is the other fundamental difference from raw cepstrum.
It is a significant enough change to warrant exclusive testing, which will be covered at the end of this
section. [Log00] proposes that the DCT approximates decorrelation obtained through Principal
27
Figure 4.2: A bank of 25 overlapping filters spaced 150 mels apart on a linear frequency scale.
Component Analysis (PCA). If MFCC yields higher scores than raw cepstrum, credit cannot be
assigned to the mel scale’s effectiveness until the DCT step has been tested with spectra that have been
smoothed according to a linear scale. The exclusive effects of the mel scale will then be clear. Logan
concludes that the use of the mel scale in music classification is “at least not harmful . . . although
further experimentation is needed to verify that this is the optimal scale for modeling music in the
general case.” [Log00, p. 8] After reviewing the performance of the mel scale and determining whether
or not it is harmful in the test studied here, section 5 will compare it against a scale based on a more
thorough body of research: the Bark scale.
4.3 mfcc~
The filterbank used in mfcc~ introduces at least one new parameter for testing: the mel spacing
between filters. As mel spacing (MS) becomes narrower, more filters will fit beneath the nyquist,
which directly affects the CCR parameter. MS=150 limits CCR to 0-24 (for 25 filters), and MS=100
expands the potential CCR to 0-38. The test below will begin with MS=100. The other new parameter
worth considering is the method for representing the power spectrum under each filter. Should the
output of a filter correspond to its total power, mean power, or—as recommended by [DM80] and
[RJ93] —log power? This implementation uses the normalized fourth root of total power as a very
rough estimation of Sones, which are calculated by raising values in the magnitude spectrum to a
power of 0.6 [RMW02]. Omitting normalization significantly reduced scores, but the choice of total or
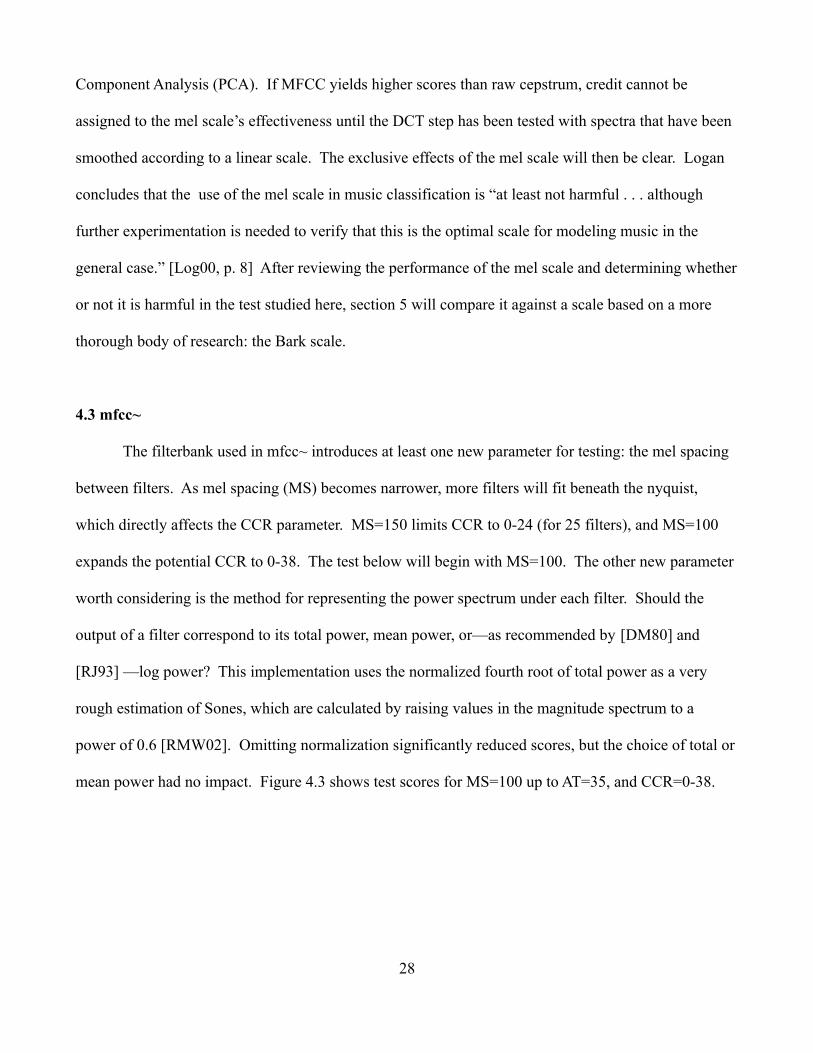
mean power had no impact. Figure 4.3 shows test scores for MS=100 up to AT=35, and CCR=0-38.
28

Compared to cepstrum~ results in figs. 3.4 and 3.5, accuracy at AT=0 ms has improved from ~75% to
~90%+. A jump above 95% accuracy occurs only a few milliseconds later at AT=3. Already, it can be
seen that the MFCC technique provides higher accuracy at lower latency, returning useful results
around 10 ms after actual onsets. A plateau of 100% accuracy is found between AT=16-18 ms at CCR
values of 0-29 and higher, only to dip down to ~95%+ for further AT settings. Following values along
the CCR axis in general reveals that increasing CCR does not reduce accuracy. Since the mel-scaling
and smoothing step reduced the number of analysis points considerably, there is no apparent reason to
use anything but the complete set of MFCCs when calculating Euclidean distance for template
comparison.
Fig. 4.4 shows scores from tests performed with MS=60. Decreasing mel-spacing increases the
number of filters to 64. The contour is similar to that in fig. 4.3, but slightly more well-behaved, with
an earlier and wider plateau of 100% accuracy between AT=15 and AT=20 ms. Mel-spacing can be
further reduced for improved stability at the cost of additional computation.
29
Figure 4.3: Test scores for mfcc~ at MS=100

Having seen the effectiveness of the MFCC technique as a whole, we can evaluate the role of the mel
scale in particular. Based on the number of filters in a filterbank with 60 mel spacing, we will use a
linearly spaced filterbank for the spectral smoothing step before computing the DCT. If results are
closer to the scores from cepstrum~, there will be more reason to believe that the characteristics of the
mel scale are responsible for the significant score improvement seen above.
Although the linear width of the first few filters in the 60 mel spaced filterbank is only about 40
Hz, a linear filterbank at that spacing is impractical for a 1024 window with 43 Hz bin spacing, as the
function of the filterbank is to reduce the number of points used for analysis. A larger spacing of 300
Hz produces 72 filters below the nyquist, which is slightly larger in size than the 60 mel spaced
filterbank. Filter widths above 300 Hz do not occur in the mel spaced filterbank until around 5 kHz, so
the loss of resolution in the low end of the spectrum is indeed the point of comparison between these
two scales. Fig. 4.5 shows score results in the standard format.
30
Figure 4.4: Test scores for mfcc~ at MS=60

Scores without mel spacing are lower, and similar to that of the raw cepstrum, indicating that the DCT
is not solely responsible for the improved scores shown in Figs. 4.3 and 4.4. The mel scale therefore
appears to be useful for its property of favoring lower frequencies. However, there are infinitely many
scales that possess this feature to varying degrees. A frequency curve based on the more extensively
researched critical bandwidths may be just as effective.
31
Figure 4.5: Test results from a 300 Hz linear spaced filterbank

5.1 Critical Bands and the Bark Scale
Critical bands refer to regions of the basilar membrane that are stimulated by unique frequency
ranges. An overview of multiple experiments establishing the boundary and center frequencies of
critical bands is given by Zwicker, Flottorp, and Stevens in [ZFS57]. It is acknowledged that the
published critical band boundaries are not fixed according to frequency, but dependent upon specific
stimuli. Relative band widths are more stable, and repeated experiments have found consistent results.
In frequency, these widths remain more or less constant at 100 Hz for center frequencies up to ~500
Hz, and are proportional to higher center frequencies by a factor of 0.2. The uppermost curve in Fig.
5.1 from [ZF90] shows this behavior, while the curves beneath it provide useful points of comparison.
Just-noticeable frequency difference is plotted against logarithmic frequency in the bottom curve, and
the dashed curve in the middle plots the difference in frequency required to advance the point of
maximum stimulation of the basilar membrane by 0.2 mm. Each of the curves can be scaled and
shifted vertically to produce very close alignment with the others. Their similarity suggests that a scale
based on documented critical band widths has physiological as well as perceptual validity. In 1960,
Zwicker’s letter to the editor in the Journal of the Acoustical Society of America introduced the Bark as
32
Figure 5.1: Critical band and related curves, from [ZF90].

a unit based on critical band boundaries, named after the inventor of the unit of loudness level:
Barkhausen. The frequency boundaries it presents are neatly rounded versions of the values found by
loudness summation experiments in [ZFS57], and are now standard reference values.
Unlike the mel scale, the Bark unit stands upon a large foundation of evidence. As Zwicker et
al. put it, the “critical band has the advantage . . . that it does not rest on assumptions or definitions, but
is empirically determined by at least four kinds of independent experiments.” [ZFS57, p. 554] The four
unique strategies for locating critical band boundaries that he refers to are threshold, masking, phase,
and loudness summation. The latter is documented in most detail. Participants in the 1957 experiment
were asked to match loudness between single tones and multiple-tone complexes of varying frequency
width f . Modulating values of f within a frequency-dependent critical bandwidth did not
affect subjects’ loudness judgements, but increasing f beyond this bandwidth resulted in
increased loudness. The points at which such loudness increases occurred were correctly predicted
according to proposed critical band boundaries. It was also determined that different spacings of
frequencies within the complex tones—which do not affect f —produced unique effects. With
even spacing of individual tones, loudness was higher than for spacings that bunch tones closer to
either boundary of f . This appears to be related to the stimulus-specific nature of critical band
boundaries. Also worthy of note is that the loudness summation method was not effective for locating
boundaries when general loudness levels were just above the threshold of hearing. Zwicker et al.
suggest that the phase based strategy is most appropriate for measurements conducted at very low
loudness levels (i.e. below 20 dB SPL).
Detecting critical band boundaries through changes in phase relies on the similarity of
sidebands in tones synthesized through low levels of amplitude and frequency modulation, and the fact
that they significantly differ only in terms of just noticeable modulation rate, and phase—one of the
33

FM sidebands will be 180° out of phase with its AM counterpart. Our hearing system is able to detect
this difference at very low modulation rates, meaning that we are sensitive to changes in sideband
phase. As modulation rates increase, however, we are unable to distinguish between the techniques
(i.e., the associated phase differences are no longer noticeable), and the just detectable degree of AM
and just detectable index of FM are the same. In [Zwi52], just detectable levels of modulation were
measured for four participants using a collection of various carrier and modulation frequencies, and
(for any given carrier frequency) critical bandwidth was taken to be twice the modulation frequency at
which AM and FM became indistinguishable [ZFS57, p. 556].
In the case of masking, studied in [Zwi54], a small band of noise is placed between two tones.
At very low noise sound pressure levels, the tones mask the noise. As the tones are more widely
spaced in frequency, the sound pressure level at which the noise ceases to be masked remains constant
until a particular tone spacing is reached, where the masking ceases at significantly lower levels
[ZFS57, p. 555]. When the noise and tones are processed within separate critical bands, masking
effects are decreased. The frequency spacing at which this occurs relates to the critical band.
Finally, the threshold method performed in [Gäs54] tracks the way in which overall sound
pressure related to the threshold of an evenly spaced tone complex varies in relation to the number of
tones in the complex [ZFS57, p. 555]. Starting with a single tone and progressing with the addition of
tones spaced 10 Hz apart (moving downward), threshold is repeatedly measured. A pattern is observed
with respect to the the number of tones present in the complex and their appropriate individual
amplitudes. For instance, with a single tone, threshold is recorded as +3 dB, while with two and four
tones in the complex, each individual tone only requires 0 dB and -3 dB respectively for the complex to
reach threshold as a whole. Thus, a consistent pattern can be seen as the amplitude of individual tones
decreases and the number of tones in the complex increases. But when a certain number of tones is
reached, the pattern does not continue as expected [ZFS57, p. 555]. This transition point in frequency
34

is taken to be a critical band boundary. [ZF90] describes another instance of this type of experiment,
where—starting with a single tone at 960 Hz—additional tones were spaced 20 Hz apart moving
upwards [Zwi90, p. 134]. The same pattern was observed.
Despite their difference in terms of verification by independent experiments, several sources
note that Barks relate very strongly to mels [Zwi57] [Zwi60][ZF90] [RMW02], the rough guide being
that multiplying Barks by 100 produces a curve similar to the mel scale. This is shown in Fig. 5.2.
From about 2 kHz onwards, the Bark curve is increasingly flat in comparison to the mel curve when
plotted against linear frequency. The highest mel values determined directly by experiment correspond
to 5, 8, and 12 kHz; higher values are projected based on equation (3). Likewise for Barks, since there
are a fixed number of critical bands that correspond to the 24 Barks, values at arbitrary subdivisions
between boundaries or beyond the 24th Bark must also be calculated with a general formula. Equation
(4), taken from [Tra90], will be used here, where f is frequency in Hz:
Bark=[26.81 f /1960 f ]−0.53 ,
f =1960Bark0.53/26.28−Bark (inverse)
(4)
Given that the mel and Bark curves are quite similar, the following section will determine whether or
not the more highly researched scale produces any improvements in the tests covered here.
35
Figure 5.2: Mel (upper) and Bark*100 curves plotted against linear frequency.

5.2 Bark Frequency Cepstrum and bfcc~
Implementation of Bark weighting in place of mels is straightforward. The collection of
frequencies used for filterbank construction will merely be generated based on equation (4) rather than
(3). A Bark spacing parameter (BS) functions identically to the MS parameter of mfcc~, the only
difference being the range of appropriate values. Since the upper boundary of the 24 th Bark is given as
15.5 kHz, values beyond this as computed with equation (4) are not necessarily backed up by critical
band research. Half-Bark spacing is used for the test below because the initial values in Hz are nearly
the same as the Hz conversion of 60 mel spacing used above. Fig. 5.3 shows results for AT=0 through
AT=35, and—moving in steps of 10 coefficients—CCR=0-6 through CCR=0-46 (the total available
coefficients produced from half-Bark spacing).
The lowest score (83%) at AT=21 ms is higher than the lowest score from the mfcc~ test (72%) when
using MS=60. As in the mfcc~ test, a plateau of 100% accuracy exists, this time beginning earlier at
AT=14 ms instead of 15 ms, and extending to 20 ms. The improvement is slight, but the fact that this
plateau exists 1 ms earlier and is 1 ms wider is certainly beneficial. Like mfcc~ performance discussed
above, AT values before 14 ms produce consistent and useful results above 92%. Fig. 5.4 shows scores
36
Figure 5.3: Test results from BS=0.5

associated with the highest CCR settings and AT=0-14 ms for mfcc~ (dashed line) and bfcc~ (solid
line).
This plot is a simplified view of the scores seen on the far right of previous plots, eliminating the CCR
axis because the full set of coefficients provide the highest accuracy. Improvements are small in this
area as well, but they are improvements nonetheless. The bfcc~ scores are higher for the first three AT
settings, lower for AT=3-5ms, and consistently higher from AT=8 ms onwards. We can conclude that
Bark units are at least as useful as mels for weighting a spectrum, and possibly more appropriate. As
the Bark scale can produce slightly more accurate results and has a larger body of research behind it,
perhaps the widespread use of mel weighting in cepstral analysis should be questioned.
37
Figure 5.4: Scores for mfcc~ (dashed) and bfcc~ (solid) for maximum CCR settings between AT=0 - 14 ms.

6.1 Future Work
The results presented here are encouraging enough to pursue some refinements. Given that
further improvements will come in single rather than double digits of milliseconds, it is important to
internalize audio buffering rather than depend on the block~ object in Pd. The hop size of 64 samples
that was used in the tests above is quite small (1.5 ms), but an independent buffering system would give
absolute sample-accuracy, so that asynchronous analysis requests could be pinpointed exactly.
Remembering that an AT setting of 0 ms corresponds to beginning a signal analysis ~13 ms before an
attack, we can see the importance of buffering as well as window size. As control over the true time of
analysis in relation to instrument attack becomes more precise, the picture of optimal parameter
settings will be increasingly clear. It will also establish a better starting point for the exploration of
multiple frame cepstral analysis techniques. Clear trends in the early AT regions of the score plots
shown above indicate that MFCCs (and BFCCs) generated at analysis times associated with AT settings
of 0 to 30 ms may have unique characteristics when considered in sequence. Such a technique could be
described as cepstral flux. When researched in detail, both the rise to 100% accuracy and the fall away
from it after about AT= 25 ms could reveal identifiable sequences of cepstral frames that depend on
instrument. Explorations of human timbre perception, such as [Gre75], take complete sound events
and their temporally evolving characteristics into account. It is doubtful that a broadly successful
measure of timbre could be developed based on only a single 23 ms sound snapshot. A multi-frame
approach to this analysis technique would certainly complicate real-time application, but it could be
used to explore the correlation between cepstral measures of timbre and perceptual models of timbre
based on direct experiment.
Another research avenue is the scaling of spectral amplitude according to frequency-dependent
perceptual loudness models. Frequency bands that are perceived as louder may have a stronger impact
on our perception of timbre, and should perhaps be emphasized accordingly in analysis. But why
38

should the skewing of analysis data according to human perceptual tendencies have any impact at all on
the evaluation of physical measurements of changes in air pressure? It is almost natural to expect that
objective measurements of sound should be ideal. Yet objects designated musical instruments are
chosen or engineered by human beings in relation to the sonic properties they possess—or rather, the
properties that we most keenly perceive. With this in mind, it certainly makes sense to warp raw sound
measurements according to the peculiarities of human perception. In this report, we have directly seen
improvements that can be gained by using two types of perceptual scales; however, we cannot
necessarily conclude that the increased accuracy should be attributed to the value of perceptual
information. From an objective and appropriately skeptical standpoint, we have merely seen that an
emphasis on lower spectral content improves results. Only through further experimentation can we
become confident that such improvements are not partially coincidental.
39

References
[ANSI73] American National Standards Institute. 1973. Psychoacoustical Terminology. S3.20. New York: American National Standards Institute.
[Ber49] Beranek, L.L. 1949. Acoustic Measurements. New York: Wiley.
[BHT63] Bogert, B., Healy, M.J.R., and Tukey, J.W. 1963. “The Quefrency Alanysis of Time Series for Echoes: Cepstrum, Pseudo-Autocovariance, Cross-cepstrum, and Saphe Cracking.” In Proceedings of the Symposium on Time Series Analysis, 1963.
[CMS01] Cuadra, P., Master, A., and Sapp, C. 2001. “Efficient Pitch Detection Techniques for Interactive Music.” In Proceedings of the International Computer Music Conference, Havana, Cuba.
[DAC07a] Dubnov, S., Assayag, G., and Cont, A. 2007. “Audio Oracle: A New Algorithm for Fast Learning of Audio Structures.” Proceedings of the International Computer Music Conference, Copenhagen, Denmark.
[DAC07b] Dubnov, S., Assayag, G., and Cont, A. 2007. “GUIDAGE: A Fast Query Guided Assemblage.” Proceedings of the International Computer Music Conference, Copenhagen, Denmark.
[DM80] Davis, S., and Mermelstein, P. 1980. “Comparison of Parametric Representations for Monosyllabic Word Recognition in Continuously Spoken Sentences.” IEEE Transactions on Acoustics, Speech, and Signal Processing Vol. ASSP-4, No. 4: 357-366.
[Gäs54] Gässler, G. 1954. “Ueber die Hörschwelle für Schallereignisse mit verschiedenbreitem Frequenzspektrum.” Acustica 4: 408-414.
[Gre75] Grey, J. 1975. “An Exploration of Musical Timbre Using Computer-based Techniques for Analysis, Synthesis and Perceptual Scaling.” Ph.D. dissertation, Stanford University.
[Gre77] Grey, J. 1977. “Multidimensional Perceptual Scaling of Musical Timbres.” Journal of the Acoustical Society of America 61(5): 1270-1277.
[Han95] Handel, S. 1995. “Timbre Perception and Auditory Object Identification.” In Hearing. New York: Academic Press, pages 425-461.
[HYG02] Herrera, P., Yeterian, A., and Gouyon, F. 2002. “Automatic Classification of Drum Sounds: A Comparison of Feature Selection Methods and Classification Techniques.” Proceedings of the International Conference on Music and Artificial Intelligence, LNAI2445: 69-80.
40

[Ima83] Imai, S. 1983. “Cepstral Analysis Synthesis on the Mel Frequency Scale.” In Proceedings of ICASSP-83, pages 93-96.
[LEB03] Logan, B., Ellis, D.P.W., and Berenzweig, A. 2003. “Toward Evaluation Techniques for Music Similarity.” In Proceedings of the 4th International Symposium on Music Information Retrieval, pages 81-85.
[Log00] Logan, B. 2000. “Mel Frequency Cepstral Coefficients for Music Modeling.” In Proceedings of the International Symposium on Music Information Retrieval.
[MK98] Martin, K.D., and Kim, Y.E. 1998. “2pMU9. Musical Instrument Identification: A Pattern-recognition Approach.” In Proceedings of the 136th Meeting of the Acoustical Society of America.
[Moo78] Moore, F.R. 1978. “An Introduction to the Mathematics of Digital Signal Processing, Part II: Sampling, Transforms, and Digital Filtering.” Computer Music Journal, 2(2): 38-60.
[Moo90] Moore, F.R. 1990 Elements of Computer Music. New Jersey: Prentice Hall.
[OS89] Oppenheim, A. and Schafer, R.W. 1989. Discrete-Time Signal Processing. New Jersey: Prentice Hall.
[PAZ98] Puckette, M., Apel, T., Zicarelli, D. 1998. “Real-time Audio Analysis Tools for Pd and MSP.” Proceedings of the International Computer Music Conference: 109-112.
[Pee04] Peeters, G. 2004. A Large Set of Audio Features for Sound Description. Paris: IRCAM.
[RJ93] Rabiner, L., and Juang, B. 1993. Fundamentals of Speech Recognition. New Jersey: Prentice Hall.
[RMW02] Rossing, T., Moore, F.R., and Wheeler, P. 2002. The Science of Sound. New York: Addison Wesley.
[Rud89] Rudolph, M. 1989. “On the Use of Cepstral Representation in Synthesis From Reduced Performance Information.” Proceedings of the International Computer Music Conference, pages 264-267.
[RW82] Risset, J. and Wessel, D. 1982. “Exploration of Timbre by Analysis and Synthesis.” In The Psychology of Music. New York: Academic Press, pages 26-58.
[SV40] Stevens, S. and Volkman, J. 1940. “The Relation of Pitch to Frequency: A Revised Scale.” American Journal of Psychology 53: 329-353.
[SVN37] Stevens, S.S, Volkman, J., and Newman, E.B. 1937. “A Scale for the Measurement of the Psychological Magnitude Pitch.” Journal of the Acoustical Society of America 8: 185-190.
41

[SWT04] Schubert, E., Wolfe, J., and Tarnopolsky, A. 2004. “Spectral Centroid and Timbre in Complex, Multiple Instrumental Textures.” In Proceedings of the International Conference on Music Perception and Cognition, North Western University, Illinois.
[TKTF04] Tindale, A., Kapur, A., Tzanetakis, G., and Fujinaga, I. 2004. “Retrieval of Percussion Gestures Using Timbre Classification Techniques.” Proceedings of the International Conference on Music Information Retrieval: 541-544.
[Tra90] Traunmüller, H. 1990. “Analytical Expressions for the Tonotopic Sensory Scale.” Journal of the Acoustical Society of America 88(1): 97-100.
[TYM+00] Tokuda, K., Yoshimura, T., Masuko, T., Kobayashi, T., and Kitamura, T. 2000. “Speech Parameter Generation Algorithms for HMM-based Speech Synthesis.” In ICASSP, pages 1315-1318.
[Tza02] Tzanetakis, G. 2002. “Manipulation, Analysis and Retrieval Systems for Audio Signals.” Ph.D. dissertation, Princeton University.
[YMT+97] Yoshimura, T., Masuko, T., Tokuda, K., Kobayashi, T., and Kitamura, T. 1997. “Speaker Interpolation in HMM-based Speech Synthesis System.” In Eurospeech, pages 2523-2526.
[ZF90] Zwicker, E. and Fastl, H. 1990. Psychoacoustics: Facts and Models. Berlin: Springer Verlag.
[ZFS57] Zwicker, E., Flottorp, G., and Stevens, S.S. 1957. “Critical Bandwidth in Loudness Summation.” Journal of the Acoustical Society of America 29: 548-557.
[ZR07] Zhang, X., and Ras, Z.W. 2007. “Analysis of Sound Features for Music Timbre Recognition.” In Proceedings of the IEEE CS International Conference on Multimedia and Ubiquitous Engineering, pages 3-8.
[ZRD08] Zhang, X., Zbigniew, W.R., and Dardzinska, A. 2008. “Discriminant Feature Analysis for Music Timbre Recognition and Automatic Indexing.” In MCD 2007, LNAI 4944, Berlin: Springer-Verlag, pages 104-115.
[Zwi52] Zwicker, E. 1952. “Die Grenzen der Hörbarkeit der Amplitudenmodulation und der Frequenzmodulation eines Tones.” Acustica 2: 125-133.
[Zwi54] Zwicker, E. 1954. “Die Verdeckung von Schmalbandgeräuschen durch Sinustöne.” Acustica 4: 415-420.
[Zwi60] Zwicker, E. 1961. “Subdivision of the Audible Range into Critical Bands (Frequenzgruppen).” Journal of the Acoustical Society of America 33(2): 248.
42