classification of emotion using subaudible …
TRANSCRIPT

CLASSIFICATION OF EMOTION USING SUBAUDIBLE FREQUENCIES IN VOCAL
DATA
by
CODY G. NARBER
B.S., Bloomsburg University, 2006
A THESIS
submitted in partial fulfillment of the requirements for the degree
MASTER OF SCIENCE
Department of Computing and Information Sciences College of Engineering
KANSAS STATE UNIVERSITY Manhattan, Kansas
2008
Approved by:
Major Professor David Gustafson, Ph.D.
brought to you by COREView metadata, citation and similar papers at core.ac.uk
provided by K-State Research Exchange

Copyright
CODY G. NARBER
2008
Abstract
Current research involving vocal emotion detection has taken a variety of different approaches,
and has found certain acoustic attributes to characterize different emotional states. While there
have been improvements in classification over the past few years, computer classification is not
nearly as accurate as human classification. This paper proposes the existence of an attribute that
has not been examined, which can be used as a measure for detecting emotion in human vocal
samples. It is shown that the new infrasonic attribute is significant when examining agitated
emotions. Therefore, it can be used to help improve vocal emotion detection.

Table of Contents
List of Figures ................................................................................................................................ vi
List of Tables ................................................................................................................................ vii
Acknowledgements...................................................................................................................... viii
CHAPTER 1 - Introduction ............................................................................................................ 1
CHAPTER 2 - Background Knowledge ......................................................................................... 3
2.1 Fundamental Frequency........................................................................................................ 3
2.2 Formants ............................................................................................................................... 3
2.3 Silence, Voiced, Unvoiced.................................................................................................... 3
2.4 Temporal Properties of Speech............................................................................................. 4
CHAPTER 3 - Literary Review...................................................................................................... 5
3.1 Elicited vs. Spontaneous ....................................................................................................... 5
3.2 Range of Emotions................................................................................................................ 7
3.3 Attributes Studied ................................................................................................................. 7
3.4 Previous Results.................................................................................................................... 7
CHAPTER 4 - Methodology .......................................................................................................... 9
4.1 Data Collection ..................................................................................................................... 9
4.2 Collection Program Design................................................................................................. 11
4.3 Data Processing................................................................................................................... 11
4.4 Data Processing/Visualization Program Design ................................................................. 13
4.5 Data Analysis...................................................................................................................... 14
CHAPTER 5 - Results .................................................................................................................. 16
CHAPTER 6 - Conclusions .......................................................................................................... 22
6.1 Conclusions......................................................................................................................... 22
6.2 Future Work........................................................................................................................ 22
References..................................................................................................................................... 23
Appendix A - Abbreviations......................................................................................................... 26
Appendix B - Scenario Passages................................................................................................... 27
A.0 Test Scenario – Neutral/Factual......................................................................................... 27
iv

A.1 Neutral/Factual................................................................................................................... 27
A.2 Happiness/Joy .................................................................................................................... 27
A.3 Angry/Frustration............................................................................................................... 28
A.4 Sadness/Disappointment .................................................................................................... 28
Appendix C - Extracted Data from Samples................................................................................. 29
Appendix D - Differences in Emotion .......................................................................................... 31
v

List of Figures
Figure 4-1 Fundamental Frequency Extraction Stages for a Single Point in Time ...................... 13
Figure 5-1 Plotting of Tremor Energy Averages for Each Speaker.............................................. 19
Figure 5-2 Plotting of Tremor Energy Variation in Each Speaker ............................................... 20
vi
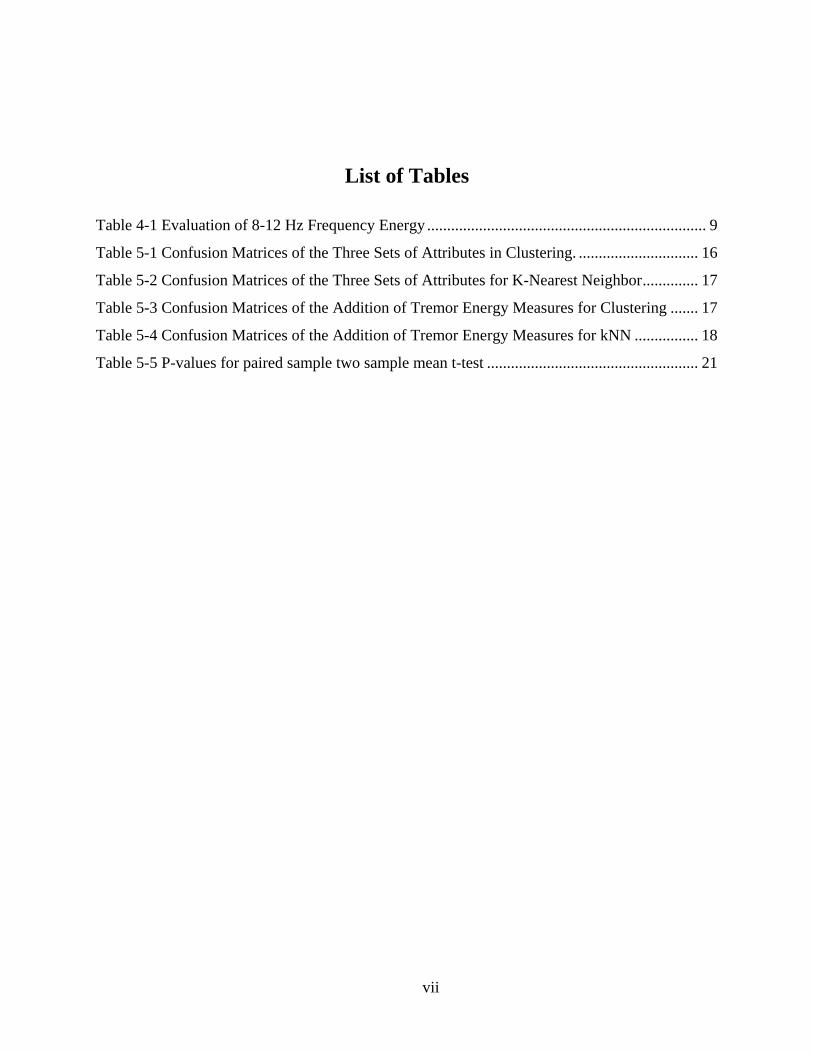
List of Tables
Table 4-1 Evaluation of 8-12 Hz Frequency Energy ...................................................................... 9
Table 5-1 Confusion Matrices of the Three Sets of Attributes in Clustering. .............................. 16
Table 5-2 Confusion Matrices of the Three Sets of Attributes for K-Nearest Neighbor.............. 17
Table 5-3 Confusion Matrices of the Addition of Tremor Energy Measures for Clustering ....... 17
Table 5-4 Confusion Matrices of the Addition of Tremor Energy Measures for kNN ................ 18
Table 5-5 P-values for paired sample two sample mean t-test ..................................................... 21
vii

Acknowledgements
I would like to acknowledge Dr. Gustafson for introducing me to this topic, and for
offering his guidance throughout my research. I would also like to thank everyone that proof read
my thesis, offered their advice, or gave their ideas. I would especially like to thank Molly who
has been my guiding light and inspiration this past year, for seeing me through my ups and
downs, and for always believing in me.
viii

CHAPTER 1 - Introduction
Emotional analysis of voice has been a problem that scientists and researchers have been
examining for years. This topic was even studied by Charles Darwin back in 1872 [1], who
looked at the facial and vocal features that are present in both humans and animals. Emotion in
voice has received much less attention over the years than its facial counterpart. This is due to
the lack of understanding and disagreement among researchers about what features should be
examined. Facial expression, on the other hand, has been established to portray emotions based
on muscles in the face contorting in specific ways [2]. By examining emotion in voice more
thoroughly, we will be able to model how the changes in our mental state affect our physical
bodies, which is of interest to psychologists, linguists, engineers, computer scientists, and many
others.
From this understanding we will be able to build better speech recognizers that can adjust
to different emotions to take into account the changes that they cause. We will be able to design
better (more human-like) decision making AI that factors in emotion, considering that emotion
plays a significant role in our decision making process [3]. We will also be able to design better
speech synthesizers that sound more human by taking into account the content of what is to be
spoken and emulate the emotion that is meant to be portrayed. We can then combine this new
knowledge with the existing understanding of facial expressions and build a hybrid emotion
detection system. The constructed system could perform classification with higher accuracy than
either would separately. All of these ideas are just the beginning since the results from voice
analysis could be used in several clinical applications as well.
This thesis examines infrasound (sound with frequency too low to be heard with the
human ear) in order to identify what, if any, attributes are being affected by muscle vibrations
that occur in that frequency. The idea of infrasonic sound is based on Lippold's physiological
tremor, which is a tremor that appears in the human voice at the 8-12 Hz range. This tremor has
been attributed to stress in several studies [4, 21-23]. However, infrasonic sound has not been
examined in the literature and will provide valuable data about whether or not this frequency
range should be examined in more depth.
1

Since infrasound has not been examined in the past, new samples needed to be gathered.
Therefore, I developed a program that elicits emotions and records a subject speaking a specific
phrase for several different emotions. The collected data was then run through another tool that I
developed that extracted several acoustic attributes including the tremor energy (all energy in the
8-12 Hz range). It was these acoustic attributes that were used for evaluation of the tremor
energy as a viable emotion classifier.
2

CHAPTER 2 - Background Knowledge
This chapter provides some background material on phonetics and acoustic features that
are discussed throughout the rest of the thesis.
2.1 Fundamental Frequency The fundamental frequency (F0) is the perceived pitch of a particular waveform, and is
sometimes known as the first harmonic frequency [5, 10]. This is one of the key attributes that
has been studied for both speech recognition and emotion classification. This feature varies
greatly from person to person, and even fluctuates during a single person's monologue. Detecting
F0 is a difficult problem due to the complexity and quality of the captured signal. Detecting F0
has been a focus of significant study for many researchers [6-8].
2.2 Formants Formants are peaks in the frequency spectrum that are created from resonance, which is
reinforced natural oscillation. Resonance exists in any sound chamber. A sound chamber is any
volume that causes reflection of the sound wave which amplifies a specific frequency (F0) and
dampens others. Thus all musical instruments are affected by resonance and have what are called
harmonic series. These are integer multiples of the pitch frequency which are also amplified by
the sound chamber. Resonance is also present in the human body. The formants of voice are like
the harmonics of instruments, except that the sound chamber in humans is defined as the vocal
tract, oral, and nasal cavities, which causes the formants not to be perfectly uniform. Several
formants exist in spoken samples and are used for vocal recognition as different vowels are made
by altering the shape and opening of the oral cavity [5, 9, 10].
2.3 Silence, Voiced, Unvoiced A spoken waveform is made up of several different sections that are used for analysis.
These are the silence, voiced, and unvoiced sections. The silence sections are the parts where the
subject is not speaking. These sections can tell us the separation for words in speech recognition,
3

but have also been used for determining the speech rate (see next subsection). A voiced sound is
a sound that is made by vibrating the vocal cords. All vowel sounds are voiced, but there are
some consonants that are voiced as well; such as 'm' in “mom”, 'n' in “nine”, and several others.
Unvoiced sounds are everything else, which include what are known as fricatives and stop
sounds. Fricatives include sounds made with the letter 'f' and 's'. They are sounds made by
creating turbulent airflow that appears as noise in the frequency spectrum. Stop sounds are those
that stop the airflow; letters that are typical stop sounds are 'd' and 't' [9].
2.4 Temporal Properties of Speech There are two temporal properties that have been examined with speech signals, and are
determined by looking at the silence vs. non-silence sections of a signal. Tempo or articulation
rate is the time that is taken between words. Pauses are another temporal property of a speech
signal that has been studied. A pause is the time between two words which is longer than normal
i.e. is a discontinuity from the tempo. These properties are sometimes modeled together as the
mean and standard deviation of the time between words [10].
4

CHAPTER 3 - Literary Review
There have been several different approaches that have been taken to examine emotion in
vocal data. Most of these differences occur during the data collection process. Some researchers
are advocates for finding spontaneous or natural emotional expression [11-13], whereas others
prefer using actors and eliciting a specific response [14-20]. Both types of data collection have
advantages and disadvantages. A direct progression of deciding which type of data to use is the
question of how to classify the vocal sample: should human listeners label the emotion or should
the explicit label that was given during capture be used. Each way has different implications
and/or contributions to research. There have also been differences on which or how many
emotions should be studied; there are advantages and disadvantages to examining only a subset
of emotions. The rest of this section is devoted to outlining the contributions of each technique;
also described are the results of past studies. In the next chapter we describe which of these
techniques we chose to use and why.
3.1 Elicited vs. Spontaneous Spontaneous emotional expression is generally collected as multimodal samples, which
include both the audio and video signals. These samples are usually collected from TV chat
shows, interviews, or from non-intrusive surveillance tapes. As most of these samples are
recordings that the researcher has gathered from outside sources, they have no specific emotional
labeling. Thus, a set of experts are tasked to label these samples, which is primarily the reason
for using both video and audio data. This gives more emotional expression cues that the experts
can use to generate a label. Several tools have been developed for these experts to label the
changes and presence of emotion over time [13]. A couple of these applications allow the expert
to label the sample as having the presence of multiple emotions or states at a single point in time.
This makes the problem much more difficult, but this approach is generally agreed to be a more
accurate labeling for how humans emote in the real world [11-13]. The ability to collect naturally
occurring data is one of the key advantages to using spontaneous data. This data can also be used
to examine the transitions from one emotion to another that occur in everyday life. The
disadvantages to using this type of data are that spontaneous reactions are neither controllable
5

nor consistent: spoken phrases will differ in content, a specific emotion wished to be studied is
not easily isolated, and the setting where each sample is gathered is typically different.
Elicited emotion is usually gathered from subjects using software or doing a task that is
aimed at gathering a specific emotion. This type of data collection has been used a lot in voice
stress analysis (VSA). These types of stress elicitation methods are used to judge the presence of
stress over time. The task that the subject is told to do becomes more and more difficult in order
to generate more and more stress in the subject [21-23]. This, as with spontaneous emotional
gathering, has the disadvantage of not being mutually exclusive as these types of tasks may
increase frustration or some other emotion. Certain people may handle stress extremely well or
may get better at the task thus becoming more comfortable with the repetition thus becoming less
stressed [21]. This can happen with any type of elicited response since people tend to handle
situations differently based on their personality and/or cultural influences. As such, elicited
emotion usually employs some type of expert labeling as well.
The final type of gathering is a form of elicited responses except that these responses are
generated from actors. This has been the most popular form of data collection due to ease of
elicitation, as well as the control that the researcher has over the emotion. The actor is usually
told what emotion they are to portray and is usually given some type of eliciting stimulus such as
an audio file to listen to, movie to watch, or passage to read that is emotionally charged [14]. For
example, if the researcher is trying to analyze sadness, the actor may be shown a death scene
from a movie, and told to say a phrase in a heartbroken tone. By doing this the researcher has
complete control over the sampling process, and knows exactly which emotion the actor is
portraying, thus the labeling of the sample is explicit. Though the labeling to the sample is
known, experts’ labels are sometimes used as a benchmark which the computer's labeling
accuracy can be compared to. Using both of these labels in conjunction can tell us about the
human thought process and how we perceive emotions rather than how the body portrays them.
Thus psychologists will tend to look at this dual labeling [17-19], while those concerned with the
physiological aspects will focus on the explicit labeling [15]. The problem with this data
collection technique comes from the fact that it is unknown whether or not actors perfectly
capture all the attributes of a vocal signal that are present in natural settings (but it is assumed by
most researchers that they do not).
6

3.2 Range of Emotions As mentioned earlier, researchers have focused on a variety of different emotions, and
operator states. Lee and Narayanan have focused on classifying negative vs positive emotion
[24]; whereas others have focused on classifying agitated versus calm states. Agitated emotions
include anger, happiness, and fear; whereas calm includes the normal or neutral state and sadness
[25]. By focusing on classifying these descriptions of emotions, researchers are hoping to
identify emotions through a bottom-up approach, and constructively build information about the
signal that can be used to identify which specific emotion is being portrayed. Some have taken a
different approach by focusing on a single emotion or state. Ang has focused on determining the
differences between annoyance and frustration from a neutral passive state that was extracted
from interactions with call centers [16]. States such as stress have gained a lot of emphasis for
their application to lie detection and/or operator workload; therefore they have been studied
separately [21-23]. The ORATOR database examines states and emotions that are not mutually
exclusive such as pleasant, happy, confident, strong, leadership, agitated, and angry. These
attributes are rated by listeners as having varying degrees of strength present in each sample [14].
Scherer describes the need for an increase in number and variety of emotions studied, though his
reasoning stems from a psychological point of view in regards to expert labeling and
discrimination, and in his research he has studied upwards of 14 different emotions [17-19].
3.3 Attributes Studied Several acoustic attributes have been examined over the years, but there are some that
have been shown to be prevalent for emotion detection. The fundamental frequency has been
used quite extensively, and it has been shown to be a significant source of information about the
signal's emotional state. Researchers have used a variety of facts about F0 including the mean
over the entire sample, the standard deviation, the range, and the first and third quartiles [11-19].
Some have used the mean of the first and second formants [24, 25], and intensity or energy
statistics as measures of emotion. Many have also used temporal changes as a measure [19,24].
3.4 Previous Results Scherer has shown that listeners have a greater-than-chance ability to label emotion only
listening to the audio sample, which shows that there are clearly audio properties that are linked
7

to specific emotions, which humans can detect consciously or unconsciously. He has developed
attribute descriptions of these emotions, for example hot anger is characterized by an increase in
F0 mean, F0 range, and high-frequency energy, as well as an increase in articulation rate. For a
more detailed description of different emotion characterizations refer to Scherer, 1996 [19].
Cowie has shown that aspects of pitch, volume, and timing are present in natural emotion as
well. [11-13].
8
CHAPTER 4 - Methodology
This chapter provides an in-depth discussion of my data collection process and my
motivation for analyzing specific attributes. I will also discuss why I used the techniques that I
did. I will also walk through my analysis of this data, both processing and classifying.
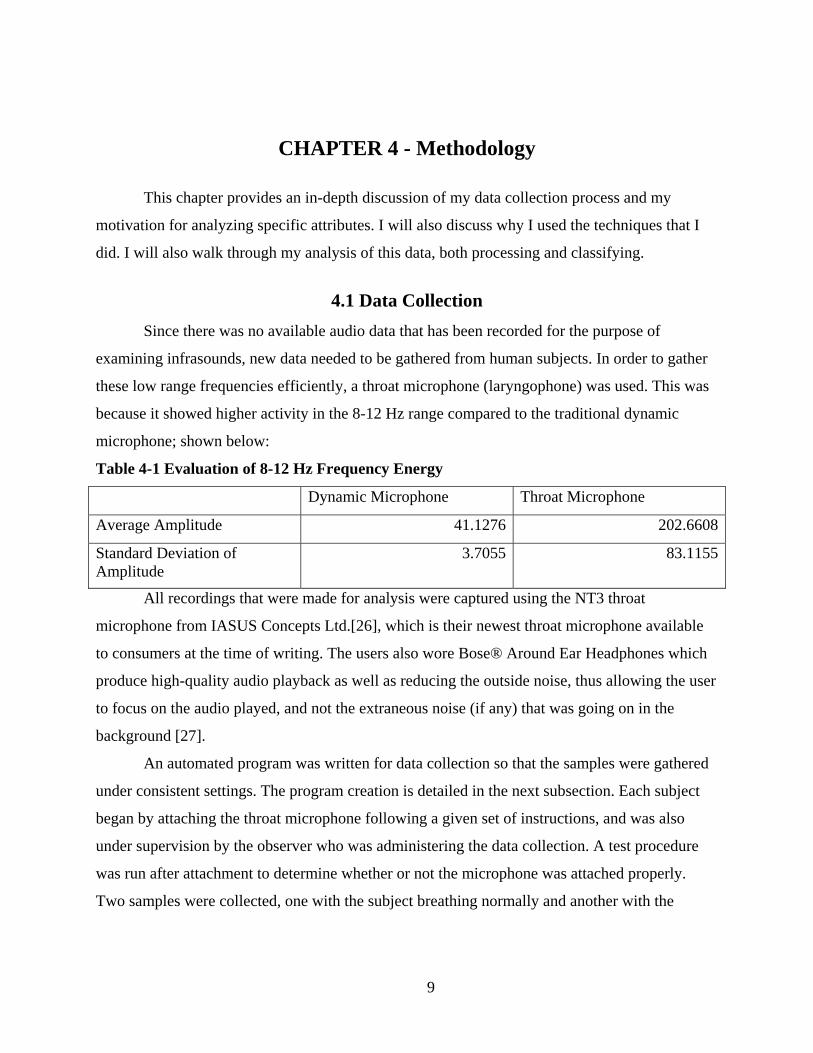
4.1 Data Collection Since there was no available audio data that has been recorded for the purpose of
examining infrasounds, new data needed to be gathered from human subjects. In order to gather
these low range frequencies efficiently, a throat microphone (laryngophone) was used. This was
because it showed higher activity in the 8-12 Hz range compared to the traditional dynamic
microphone; shown below:
Table 4-1 Evaluation of 8-12 Hz Frequency Energy
Dynamic Microphone Throat Microphone
Average Amplitude 41.1276 202.6608
Standard Deviation of Amplitude
3.7055 83.1155
All recordings that were made for analysis were captured using the NT3 throat
microphone from IASUS Concepts Ltd.[26], which is their newest throat microphone available
to consumers at the time of writing. The users also wore Bose® Around Ear Headphones which
produce high-quality audio playback as well as reducing the outside noise, thus allowing the user
to focus on the audio played, and not the extraneous noise (if any) that was going on in the
background [27].
An automated program was written for data collection so that the samples were gathered
under consistent settings. The program creation is detailed in the next subsection. Each subject
began by attaching the throat microphone following a given set of instructions, and was also
under supervision by the observer who was administering the data collection. A test procedure
was run after attachment to determine whether or not the microphone was attached properly.
Two samples were collected, one with the subject breathing normally and another with the
9

subject humming. If it was attached properly, the fundamental frequency would have been
significantly present in the second sample but not the first.
Once the subject had progressed to this point they were informed of the actual collection
process, so that they would know what to expect. This was done to remove any undue stress that
they might encounter. The subject was then presented a test scenario in order to once again
remove any lingering stress, and also get the subject accustomed to speaking while wearing the
throat microphone.
Each scenario was comprised of a passage of text that describes an emotionally charged
story, which was presented as a second person narrative in order to engage the subject. This
passage was accompanied by a playing audio file that had a speaker reading the presented
passage in the emotion that was meant to be elicited. Once the audio file had finished playing,
recording began automatically so that the speaker could say the specified phrase immediately. By
not having the subject perform any actions prior to recording, we remove any distractions to the
task at hand. Each scenario is prefaced by a title page that informs the user what emotion is to be
extracted, so that the user can get into the correct frame of mind as they hear/read the scenario.
They are also told what phrase to say so that their mind can focus on the emotion rather than the
content. The same phrase is used throughout the entire experiment, again so that the user doesn't
have to concentrate on what to say, but rather how to say it.
Once the test scenario had finished, each subject was presented with four different
scenarios each attempting to elicit a different response. The four scenarios presented were
neutral/factual, happiness/joy, anger/frustration, and sadness/disappointment in that order. The
scenario passages are given in Appendix A. The subject was given the opportunity to rerecord
their sample or to listen to the scenario again at their own digression. This was done so that the
speaker could be confident that they gave a reliable recording, according to their standards. This
helped limit the erroneous data (a recording that clearly didn't match the scenario, e.g. laughing
during the angry passage) that would be thrown out.
The subjects are only known by a unique ID number, and each of their samples are saved
with the scenario label applied, it is this label that the error will be computed from. Each of the
samples are recorded with a sampling rate of 44100 Hz, using a 16 bit encoding. Each sample
uses two channels, i.e. stored in stereo. The files that are saved are in the uncompressed PCM
Wave format. This is so no data is lost from recording to analysis.
10

4.2 Collection Program Design The collection program was written in C# and was designed as a state machine, with each
state denoting a new slide. Upon initialization a new directory is created with the name
“subject_#” where # is the current subject counter value. All recorded samples from the subject
are stored in this directory. Using Windows Forms, a GUI was developed for ease of use and
understandability. The form contained two buttons (continue and previous) and a PictureBox
showing the current state. The states were represented by stored images that showed the
instructions, queries, descriptions, and scenarios. The first image shown was the one discussing
the project and the goals of the research, so that the subject had a full understanding of what was
to be expected before recording began. As the user clicked the continue button, the program’s
state is updated through the uses of a transition method. The transition method performed
operations such as: updating the slide, showing/hiding text boxes for queries, playing the saved
audio for the scenario, or recording from the subject.
In order to play and record audio, methods from the windows multimedia libraries needed
to be used. These methods were stored in winmm.dll for use with the windows API in C++.
InteropServices was used to wrap the C++ methods in C# headers for use in the C# GUI that had
been developed. The particular method that was used was mciSendString, which sent a command
string to the Media Control Interface (MCI). Commands included: status, set, record, open, close,
play, stop, and save. These commands allowed the program to begin playing immediately after
clicking continue to begin the scenario. Once the status command reported that the audio had
finished playing, the state could be updated to begin recording automatically. As soon as the user
clicked continue during recording, the recorded audio would be saved with the appropriate
scenario name.
The state of the program was continuously updated as the user clicked continue or the
program progressed automatically. Eventually the program finished as all samples were
collected, and the state was reset. As such new subject folder was created for the next subject to
begin recording.
4.3 Data Processing Each sample was processed using the Short-Time Fourier Transform, to get the signal's
frequency components over time. The window examined was one-half a second worth of audio,
11

i.e. since the signal was recorded at 44100 Hz, the window consisted of 22050 data points in the
time domain. The window was then shifted to get the frequencies at each millisecond, thus the
window was shifted 44 samples to get the next set of frequencies.
For each set of frequencies found, the fundamental frequency needed to be extracted.
Since the fundamental frequency is known as the first harmonic it is represented by the lowest
frequency that is a relative maximum in the frequency domain. However, data is never pure and
the fundamental frequency is rarely that simple to extract. Data can be noisy and it could be
possible that the fundamental is not as prevalent in the signal as the formants are [9]. Therefore,
the frequencies were averaged over a 100 Hz window to smooth out any noisy data or outliers
that may obscure the detection process. Since the outliers may have created relative minimum
that are not the formants or fundamental some additional processing is required. Each of the
peaks in energy are then found as candidates of F0. The peak with the largest amplitude is then
examined, in order to tell if the sample contains at least one strong frequency, which implies that
the point in time is voiced [9]. If this peak is less than a thousandth of the sampling rate, then the
peak is not significant. We disregard this point in time and set all the attribute values to zero.
This is because we are only concerned with voiced sounds since those are the ones where the
vocal muscles are stressed. After this point if the data has not been disregarded, we know that
our data occurs during a voiced period of the signal. Thus we denote our fundamental frequency
as the max peak that occurs within the range of 50 – 250 Hz based on prior knowledge of F0.
This knowledge is based on the fact voiced speech of typical males will have a fundamental
within the range of 85 -155 Hz [5]. The range was expanded to allow for non-typical males
fundamental to be detected if the case ever arose. Stages of F0 extraction for a single point in
time are shown at the end of the section. Now that the peak for the fundamental has been found,
we collect the Hz, and amplitude from that peak. The amplitude used is not the averaged one, but
rather the raw data value. We also collect the sum of energy between 8-12 Hz range, which from
now on will be referred to as the tremor energy.
These three attributes are extracted every millisecond, and are averaged for all the voiced
sounds. The standard deviation is also taken. It is these 6 values: average fundamental frequency
(aF0), standard deviation of the fundamental frequency (sF0), average amplitude (aAmp),
standard deviation of the amplitude (sAmp), average tremor energy (aTE), and standard
deviation of the tremor energy (sTE); which classification is done on.
12

Figure 4-1 Fundamental Frequency Extraction Stages for a Single Point in Time
4.4 Data Processing/Visualization Program Design Another C# program was developed for reading in the recorded samples, performing
analysis of the frequency components, and displaying it all. Since the raw data needed to be
extracted, InteropServices needed to be used in conjunction with winmm.dll again. This time the
key methods used were mmioDescend, mmioAscend, and mmioRead. These methods allowed
the program to read in the chunks that make up a wave file. The key chunks include the RIFF
header, fmt, and data chunks. The RIFF header chunk contains information about the entire file:
its size, extension, etc. The fmt chunk describes how the data is stored: compression type,
number of channels, sampling rate, etc. The data chunk houses the raw data as specified by the
fmt chunk [28]. mmioDescend moves into the next sub-chunk. Thus by having an ordering of
descends and ascends, each chunk can be read into variables that the program can read from at
any time. Using the sampling rate, number of channels, and resolution information, the bytes can
be used to calculate the amplitude of the signal over time and stored into arrays.
13

Once the wave has been loaded into the program a fast fourier transform is taken of the
entire data. The time-domain data and frequency-domain data are both plotted on separate panels
in the windows form. Also shown is the information that was stored in the fmt chunk of the wave
file. GUI features were put into place to zoom-in on a specific time sequence, or frequency
range. Another feature that was coded is the visualization of the spectrogram, which is the three-
dimensional plotting of time, frequency, and energy. As the mouse moves over the plots, all
information about the point being hovered over is displayed in a status bar. This makes visual
analysis easier and more efficient. A menu item was also put into place that started a procedure
that iterated through the subject folder and ran the analysis described in the previous section. It
then wrote the found acoustic attribute values to disk in a comma-separated values (csv) file.
4.5 Data Analysis Once the data has been collected, all samples are then combined with emotion labels and
put into attribute-relation file format (ARFF) files, to be loaded into Waikato Environment for
Knowledge Analysis (WEKA). It is here that the data is put through a k-means clustering
algorithm several times, in order to compare the classification obtained with different attributes.
The clustering is found with the traditional values first (aF0, sF0, aAmp, sAmp). This is
compared to the clustering with the addition of the aTE attribute, another with sTE, and another
with both. Also compared are each set of attributes to see which of the three (F0, Amp, TE) has
the highest accuracy, and what information can be deduced. All classifications are done with four
clusters using a seed of 100. Clustering was chosen to determine the patterns that exist with the
tremor energy without any learned knowledge (training). This is done due to the limited number
of samples. Using any other type of learning would not be as useful, since the data would be cut
down in size for training. Once the clusters are found they are then compared to the actual
labeling. I did provide a k-nearest neighbor classification using the same attributes that were
used for clustering to show that the trends found from clustering were supported by instance-
based learning. However, as stated above the accuracy is much lower, but the trends remain
consistent. Another program was written in C# that computed the k-nearest neighbor
classification. The program allows the user to specify the class attribute and which attributes to
use to find the Euclidean distances. In case of ties between any two labels A and B, the average
distances from all the instances associated are computed. Whichever labeling has the smaller
14

average distance is the label that is chosen. K was chosen to be seven as this was the number of
subjects that would be used for training, and allowed the possibility for all the same class label to
be chosen.
Also examined are the differences in the tremor energy between the neutral phrase and
emotional phrases from a single speaker. A consistency measure is taken as well to take into
account the limited number of samples. This is done to see if there exists a pattern in the tremor
energy that is speaker specific.
15

CHAPTER 5 - Results
All samples were taken from traditional male college students with less than 3 years of
theater experience. Eight subjects volunteered for the study. The 6 attributes extracted from each
speaker are shown in Appendix B. These attributes were then run through WEKA using simple
k-means clustering with 4 clusters and a seed of 100. Three sets of clustering was done using aF0
and sF0, another using aAmp and sAmp, and one more using aTE and sTE. Below are the
confusion matrices of these clusterings with the cluster labeling listed horizontally and actual
labeling listed vertically. Also listed is the total number of incorrectly classified clusters.
Table 5-1 Confusion Matrices of the Three Sets of Attributes in Clustering.
*Columns are the Classified Labels, and Rows are the Actual Labels
From the above confusion matrices, we can see that the F0 clustering favors classifying
every phrase as neutral, i.e. the frequencies of the fundamental in the emotional phrases are
statistically close to the frequencies in the neutral phrases, thus are clustered together. The
amplitude clustering shows that clusters favor the sad labeling; however, the erroneous data is
spread out among clusters compared to the F0 labeling. This shows that the clustering is much
more evenly distributed and thus a better measure of emotion compared to the F0 clustering. The
tremor energy clustering is very similar to the amplitude clustering and does well on the sad and
16
happy emotions. However, there isn't a significant amount of information gain from the TE
clustering compared to the Amp clustering. It is also clear from the above confusion matrices
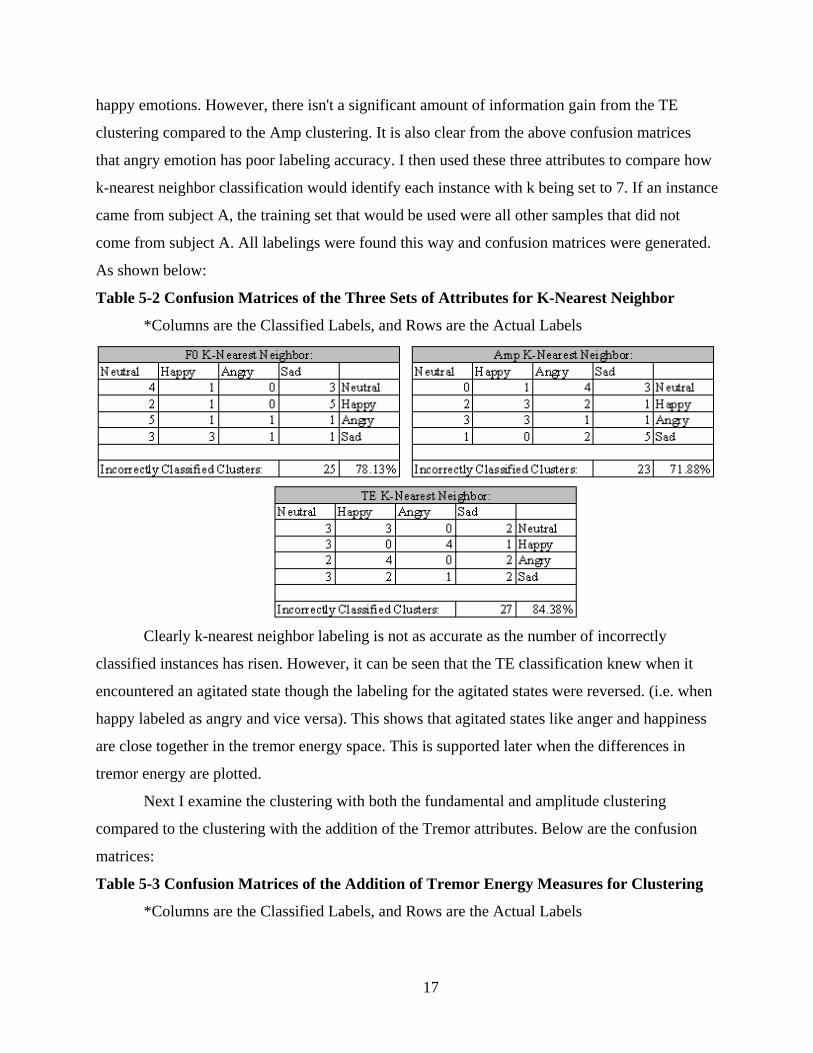
that angry emotion has poor labeling accuracy. I then used these three attributes to compare how
k-nearest neighbor classification would identify each instance with k being set to 7. If an instance
came from subject A, the training set that would be used were all other samples that did not
come from subject A. All labelings were found this way and confusion matrices were generated.
As shown below:
Table 5-2 Confusion Matrices of the Three Sets of Attributes for K-Nearest Neighbor
*Columns are the Classified Labels, and Rows are the Actual Labels
Clearly k-nearest neighbor labeling is not as accurate as the number of incorrectly
classified instances has risen. However, it can be seen that the TE classification knew when it
encountered an agitated state though the labeling for the agitated states were reversed. (i.e. when
happy labeled as angry and vice versa). This shows that agitated states like anger and happiness
are close together in the tremor energy space. This is supported later when the differences in
tremor energy are plotted.
Next I examine the clustering with both the fundamental and amplitude clustering
compared to the clustering with the addition of the Tremor attributes. Below are the confusion
matrices:
Table 5-3 Confusion Matrices of the Addition of Tremor Energy Measures for Clustering
*Columns are the Classified Labels, and Rows are the Actual Labels
17

From the above we can see that the addition of the average tremor energy improves
classification, whereas the standard deviation of the tremor energy adds no information to the
traditional clustering and even significantly degrades performance when all 6 attributes are used.
It is also clear that combining the attributes yields better classification than they would separate,
considering that F0, when was used alone, placed most samples in a single cluster. A similar
observation can be made with the k-nearest neighbor classification, and that the addition of the
average TE improves classification, whereas the standard deviation of tremor energy degrades
performance.
Table 5-4 Confusion Matrices of the Addition of Tremor Energy Measures for kNN
*Columns are the Classified Labels, and Rows are the Actual Labels
18

The above classifications show that tremor energy provides information about the
emotional state of the speaker, given no extra knowledge of the neutral state. Next we look at the
changes in tremor energy of a single speaker over emotional states. Below are two line charts
outlining the changes in tremor energy between speakers and emotion.
Figure 5-1 Plotting of Tremor Energy Averages for Each Speaker
19

Figure 5-2 Plotting of Tremor Energy Variation in Each Speaker
The differences from the neutral state are computed and shown in Appendix C. From the
above graphs we can clearly see that the tremor energy is definitely present between emotions in
single speakers. The average tremor energy increases for every speaker from the neutral state to
the happy state. The variation between energy values over time for happy also increases except
in a single case. Average energy in anger is also increased from the neutral state in all but one
case, but the variation in energy over time in anger increases for every single subject. The
changes from neutral to sadness weren’t represented well as about half of the subjects had higher
energy and the rest had lower, the same was reflected in the standard deviations. P-values were
calculated from a paired two sample means t-Test for each emotion paired with neutral. Below
the table is shown supporting the observations from the graphs. The p-value is the percentage
probability that the means support the null hypothesis of the means being equal (< 5% is
statistically significant for rejection of the null hypothesis). Comparing the Happy and Neutral
emotional states, we can see that there exists greater than 99% confidence rating that tremor
energy is very prevalent in Happy, and for anger there is a greater than 98% confidence rating.
Sadness’s rating is too low for tremor energy to be considered to have an impact.
20
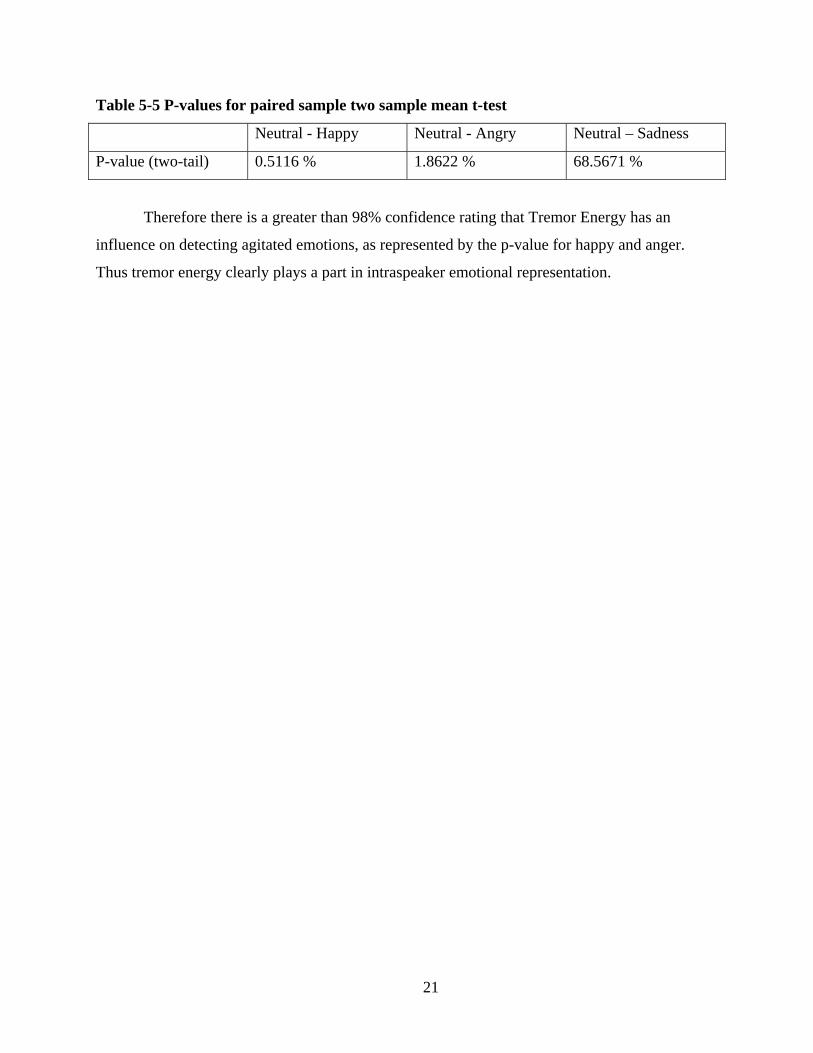
Table 5-5 P-values for paired sample two sample mean t-test
Neutral - Happy Neutral - Angry Neutral – Sadness
P-value (two-tail) 0.5116 % 1.8622 % 68.5671 %
Therefore there is a greater than 98% confidence rating that Tremor Energy has an
influence on detecting agitated emotions, as represented by the p-value for happy and anger.
Thus tremor energy clearly plays a part in intraspeaker emotional representation.
21

CHAPTER 6 - Conclusions
This chapter outlines implications that can be drawn from the above results. Also
discussed are the possibilities for future work.
6.1 Conclusions From the results, the average tremor energy is a new attribute that can be used for
emotion classification in voice. It has been shown to improve classification results when no prior
knowledge has been given and clusters have been generated. It is extremely clear that tremor
energy plays a vital role when only examining the changes in emotion from a single speaker.
This is known since the average energy level increased for each speaker when examining neutral
vs. happy and increased for angry in all but one sample.
6.2 Future Work Considering that the results compiled here were done with a small sample set, future
work should enlarge the data set, and expand it to include females, and a wider range of ages.
This is so that we can see if the tremor energy results found here extend to include a larger
denomination of human subjects. Another area of potential research would be to examine both
actor and non-actor to see if these results are dependent on the fact that the subjects may have
been under stress during data collection (though several steps were taken to alleviate this
problem). Another possibility for data collection would be to expand our original data attributes
to include temporal and formant changes, and compare those results to the classification with
tremor energy attributes added. Finally, studies can be done to include a broader range of
emotions as described by Scherer [19].
22

References
[1] C. Darwin, The Expression of the Emotions in Man and Animals, 1872.
[2] J. M. Jenkins, K. Oatley, N. L. Stein, “Constants across Culture in the Face and Emotion” in Human Emotions: A Reader, 1st ed. Hoboken: Blackwell, 1998, ch. 7, pp. 63-72.
[3] S. Werner, E. Keller, “Prosodic Aspects of Speech” in E. Keller (ed), Fundamentals of Speech Synthesis and Speech Recognition: Basic Concepts, State of the Art, and Future Challenges, Chichester: John Whiley, 1994, pp.23-40
[4] O. Lippold (1970, February) Oscillations In The Stretch Reflex Arc And The Origin Of The Rhythmical 8-12 C/S Component Of The Physiological Tremor. The Journal Of Physiology. Available: http://www.pubmedcentral.nih.gov/picrender.fcgi?artid=1348651&blobtype=pdf
[5] I. R. Titze, “The Source-filter Theory of Vowels” in Principles of Voice Production, Englewood Cliffs: Prentice-Hall, 1994, ch. 6.
[6] B. Bozkurt, B.Doval, C. D'Alessandro, T. Dutoit. “A Method For Glottal Formant Frequency Estimation”presented at the Proc. ICSLP, International Conference on Spoken Language Processing, Jeju Island (Korea). 2004. Available: http://tcts.fpms.ac.be/publications/papers/2004/icslp2004_bbdcdtd2.pdf
[7] B. Chen, P. C. Loizou “Formant Frequency Estimation in Noise” in ICASSP '04. IEEE Int. Conf. pp. I- 581-4 vol.1 Available: http://ieeexplore.ieee.org/iel5/9248/29343/01326052.pdf
[8] P. Boersma, “Accurate Short-term Analysis of the Fundamental Frequency and the Harmonics-to-noise Ratio of a Sampled Sound” Available: http://fonsg3.hum.uva.nl/paul/papers/Proceedings_1993.pdf
[9] L. Rabiner, B. Juang, “The Speech Signal: Production, Perception, and Acoustic-Phonetic Characterization” in Fundamentals of Speech Recognition, Englewood Cliffs: Prentice-Hall, 1993, ch. 2.
[10] P. Ladefoged, “Acoustic Phonetics” in A Course in Phonetics, 4th ed. Boston: Heinle & Heinle, 2001, ch 8.
[11] M. Schröder, R. Cowie, E. Douglas-Cowie, M. Westerdijk, S. Gielen, “Acoustic Correlates of Emotion Dimensions in View of Speech Synthesis” in Eurospeech 2001, Aalborg, Vol. 1, pp. 87-90. Available: http://www.dfki.de/~schroed/articles/schroeder_etal2001.pdf
23

[12] E.Douglas-Cowie, R. Cowie, M. Schröder, “The Description of Naturally Occurring Emotional Speech” in15th International Conference of Phonetic Sciences, Barcelona, Spain, pp. 2877-2880. 2003. Available: http://www.dfki.de/~schroed/articles/douglas-cowie_cowie_schroeder2003.pdf
[13] E. Douglas-Cowie, R. Cowie, I. Sneddon, C. Cox, O. Lowry, M. McRorie, J, Martin, L. Devillers, S. Abrilian, A. Batliner, N. Amir, K. Karpouzis, “The HUMAINE Database: Addressing the Collection and Annotation of Naturalistic and Induced Emotional Data” A. Paiva, R. Pradad, and R.W. Picard (Eds.): ACII 2007, LNCS 4738, pp. 488-500. 2007.
[14] H. Quast, “Automatic Recognition of Nonverbal Speech” in INC MPLab TR 2002.02.
[15] S. Yacoub, S. Simske, X. Lin, J Burns, “Recognition of Emotion in Interactive Voice Response Systems”, Hewlett-Packard Labs, Palo Alto, CA, 2003 Available: http://www.hpl.hp.com/techreports/2003/HPL-2003-136.pdf
[16] J. Ang, R. Dhillon, A. Krupski, E. Shriberg, A. Stolcke, “Prosody-Based Automatic Detection of Annoyance and Frustration in Human-Computer Dialog”in Proc of ICSLP, Denver, CO, 2002 Available: http://www.speech.sri.com/cgi-bin/run-distill?papers/icslp2002-emotion.ps.gz
[17] K.R. Scherer “Vocal communication of emotion: a review of research paradigms” in Speech Communication, v.40 n.1-2, pp.227-256, 2003. Available: http://affectco.unige.ch/system/files/2003_Scherer_SpeechComm.pdf
[18] R. Banse, K.R. Scherer, “Acoustic Profiles in Vocal Emotion Expression” in Journal of Personality and Social Psycology, v. 70(3), pp. 614-636, 1996. Available: http://www.robinhooding.com/papers/BanseAndScherer_AcousticProfiles.pdf
[19] K.R. Scherer, “Vocal Affect Expression: A Review and a Model for Future Research” in Psychological Bulletin, vol. 99, pp. 143-165. 1986. Available: http://affectco.unige.ch/system/files/1986_Scherer_PsyBull.pdf
[20] F. J. Julia, K.M. Iftekharuddin, “Detection of Emotional Expressions in Speech” in SoutheastCon, 2006. Proceedings of the IEEE. Available: http://ieeexplore.ieee.org/iel5/10844/34182/01629369.pdf?tp=&isnumber=34182&arnumber=1629369
[21] S. J. Schneider, M. Alpert, R. O'Donnell, (1989) Voice Measures of Workload in the Advanced Flight Deck. NASA. Ossining, New York.
[22] S. J. Schneider, M. Alpert, (1989, November) Voice Measures of Workload in the Advanced Flight Deck: Additional Studies. NASA. Ossining, New York.
24

[23] C. S. Hopkins, R. J. Ratley, D. S. Benincasa, J. J. Grieco, "Evaluation of Voice Stress Analysis Technology," in Proc. of HICSS'05 p. 20b Available: http://csdl2.computer.org/comp/proceedings/hicss/2005/2268/01/22680020b.pdf
[24] C. M. Lee, S. S. Narayanan, “Toward Detecting Emotions in Spoken Dialogs”, in IEEE v. 13 transaction on speech and audio processing, 2005. Available: http://ieeexplore.ieee.org/iel5/89/30367/01395974.pdf?tp=&isnumber=&arnumber=1395974
[25] V. A. Petrushin, “Emotion in Speech: Recognition and Application to Call Centers” in Proc of Conference on Artificial Neural Networks in Engineering, 1999. Available: http://citeseer.ist.psu.edu/cache/papers/cs/12648/http:zSzzSzac.comzSzserviceszSzcstarzSzPublicationszSzEmotionRecognition-ANNIE99.PDF/petrushin99emotion.pdf
[26] IASUS Concepts Ltd. Website: www.iasus-concepts.com
[27] Bose® Website: www.bose.com
[28] Resource Interchange File Format Description, Microsoft® 2008 Website: http://msdn.microsoft.com/en-us/library/ms713231(VS.85).aspx
25

Appendix A - Abbreviations
Below is a list of common abbreviations that are used throughout the paper:
F0 - Fundamental Frequency
aF0 - Average of the Fundamental Frequency over Time
sF0 - Standard Deviation of the Fundamental over Time
Amp - Amplitude or Energy of the Fundamental Frequency
aAmp - Average of the Amplitude over Time
sAmp - Standard Deviation of the Amplitude over Time
TE - Tremor Energy (Integral of Energies in [8, 12] Hz range)
aTE - Average of the Tremor Energy over Time
sTE - Standard Deviation of the Tremor Energy over Time
26
Appendix B - Scenario Passages
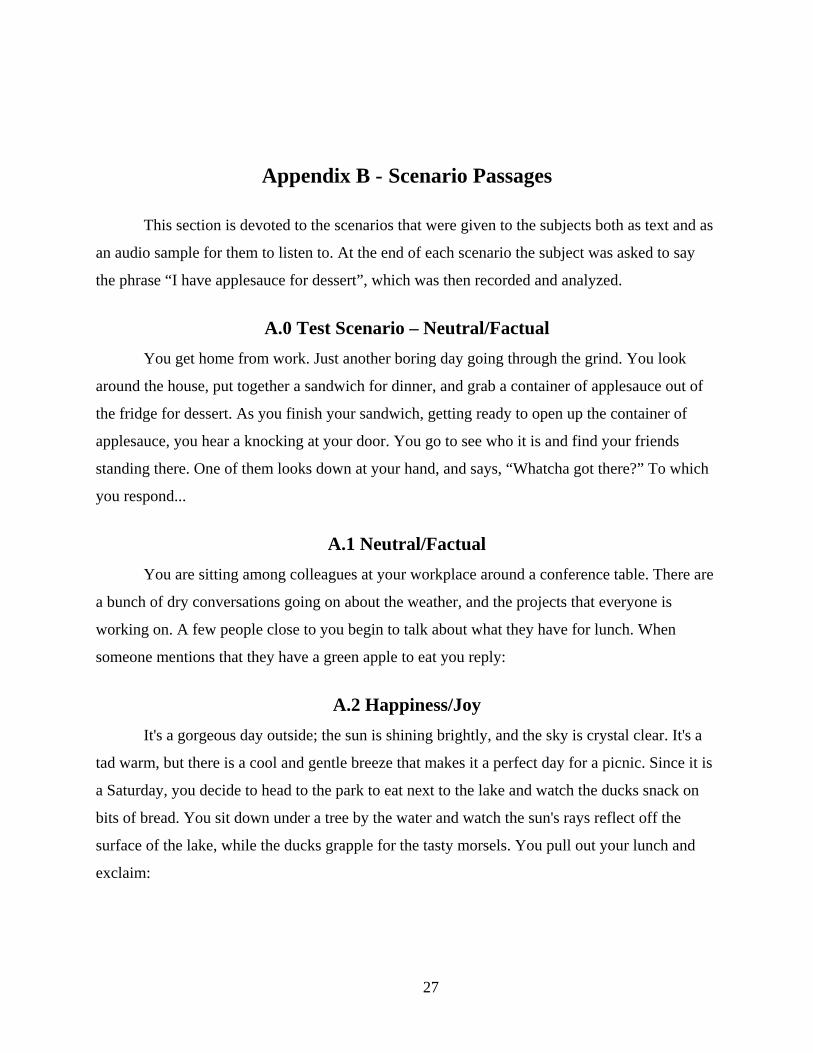
This section is devoted to the scenarios that were given to the subjects both as text and as
an audio sample for them to listen to. At the end of each scenario the subject was asked to say
the phrase “I have applesauce for dessert”, which was then recorded and analyzed.
A.0 Test Scenario – Neutral/Factual You get home from work. Just another boring day going through the grind. You look
around the house, put together a sandwich for dinner, and grab a container of applesauce out of
the fridge for dessert. As you finish your sandwich, getting ready to open up the container of
applesauce, you hear a knocking at your door. You go to see who it is and find your friends
standing there. One of them looks down at your hand, and says, “Whatcha got there?” To which
you respond...
A.1 Neutral/Factual You are sitting among colleagues at your workplace around a conference table. There are
a bunch of dry conversations going on about the weather, and the projects that everyone is
working on. A few people close to you begin to talk about what they have for lunch. When
someone mentions that they have a green apple to eat you reply:
A.2 Happiness/Joy It's a gorgeous day outside; the sun is shining brightly, and the sky is crystal clear. It's a
tad warm, but there is a cool and gentle breeze that makes it a perfect day for a picnic. Since it is
a Saturday, you decide to head to the park to eat next to the lake and watch the ducks snack on
bits of bread. You sit down under a tree by the water and watch the sun's rays reflect off the
surface of the lake, while the ducks grapple for the tasty morsels. You pull out your lunch and
exclaim:
27

A.3 Angry/Frustration This morning you reluctantly climbed out of bed only having a couple hours of sleep
because the neighbor's dog kept you up all night with his incessant barking. As you walked to the
bathroom, you caught your toe on the side of the door sending a dull throbbing pain all
throughout your foot. To make matters even worse, you got stuck in traffic on your way to work
and now your boss is making you stay late to make up for it. Sitting down in the cramped lunch
room, Jim (whom you dislike anyhow) pulls out a chair hitting your toe, now a sharp stinging
pain, he asks in his smug voice, “whatcha got there?” Enraged, you tell him:
A.4 Sadness/Disappointment At work, you receive a phone call informing you that your best friend had become
gravely ill and was rushed to the hospital. The doctor said that their time is limited, and you
should come say goodbye...On your way to the hospital, tears rolling down your cheek, you try
to figure out all the things that you need to tell the,. Once you arrive, the doctor stops you and
says, “I'm sorry, it's too late”. Pulling out your friend's favorite food, you manage to say:
28

Appendix C - Extracted Data from Samples
Below is the six attributes that were extracted from each subject.
Subject 1:aF0 sF0 aAmp sAmp aTE sTE
Neutral/Factual 113.81 25.46 134.7 57.71 260.52 98.65Happy/Joy 133.55 26.51 294.72 118.34 482.99 237.76Anger/Frustration 120.48 19.73 208.04 90.3 476.75 198.46Sad/Disappointment 126.2 27.09 214.91 99.52 349.88 120.88 Subject 2:
aF0 sF0 aAmp sAmp aTE sTENeutral/Factual 116.08 37.23 366.27 166.72 476.81 163.29Happy/Joy 120.37 42.91 229.95 100.2 650.06 271.02Anger/Frustration 113.77 40.96 270.46 149.34 710.94 342.49Sad/Disappointment 109.5 33.67 319.04 150.6 530.76 258.15 Subject 3:
aF0 sF0 aAmp sAmp aTE sTENeutral/Factual 173.39 17.56 200.85 100.72 275.12 92.14Happy/Joy 181.74 29.28 225.54 155.24 455.42 270.5Anger/Frustration 178.83 14.9 173.13 88.05 358.68 306.43Sad/Disappointment 166.79 7.38 145.71 73.07 106.04 38.1 Subject 4:
aF0 sF0 aAmp sAmp aTE sTENeutral/Factual 105.84 38.47 183.04 73.63 172.79 54.73Happy/Joy 169.14 31.96 411.98 221.4 296.23 151.93Anger/Frustration 98.12 28.63 245.96 113.56 325.43 94.82Sad/Disappointment 159.67 31.85 141.91 67.56 281.39 149.08 Subject 5:
aF0 sF0 aAmp sAmp aTE sTENeutral/Factual 162.34 51.56 341.15 125.59 362.54 160.63Happy/Joy 148.95 38.73 347.89 170.92 408.97 244.39Anger/Frustration 160.65 50.85 306.15 154.46 478.84 208.21Sad/Disappointment 141.22 39.21 134.85 75.01 241.39 67.2
29

Subject 6:aF0 sF0 aAmp sAmp aTE sTE
Neutral/Factual 104.83 30.69 175.67 70.87 178.45 49.22Happy/Joy 128.38 45.35 220.12 133.27 262.03 84.42Anger/Frustration 93.49 24.41 185.49 94.73 135.64 52.32Sad/Disappointment 90.88 32.46 147.69 76.68 123.66 29.57 Subject 7:
aF0 sF0 aAmp sAmp aTE sTENeutral/Factual 141.23 7.82 96.36 41.74 105.56 26.38Happy/Joy 151.37 41.35 153.75 130.12 129.88 44.27Anger/Frustration 125.29 11.28 214.36 84.45 121.95 32.93Sad/Disappointment 148.38 24.85 119.82 93.17 113.85 38.95 Subject 8:
aF0 sF0 aAmp sAmp aTE sTENeutral/Factual 131.86 28.18 111.97 41.46 197.97 91.9Happy/Joy 150.79 44.35 214.23 153.63 219.54 81.98Anger/Frustration 118.99 26.17 76.65 19.63 249.11 98.19Sad/Disappointment 130.96 28.91 104.3 32.34 164.81 70.05
30

Appendix D - Differences in Emotion
Below are the difference values from neutral sample to the emotion samples.
Subject 1:daF0 dsF0 daAmp dsAmp daTE dsTE
Happy/Joy 19.74 1.04 160.02 60.63 222.47 139.11Anger/Frustration 6.67 -5.73 73.34 32.58 216.22 99.8Sad/Disappointment 12.39 1.63 80.21 41.81 89.36 22.23 Subject 2:
daF0 dsF0 daAmp dsAmp daTE dsTEHappy/Joy 4.3 5.68 -136.31 -66.52 173.25 107.73Anger/Frustration -2.31 3.72 -95.81 -17.38 234.13 179.19Sad/Disappointment -6.58 -3.56 -47.23 -16.12 53.95 94.85 Subject 3:
daF0 dsF0 daAmp dsAmp daTE dsTEHappy/Joy 8.35 11.72 24.68 54.52 180.3 178.35Anger/Frustration 5.44 -2.65 -27.72 -12.67 83.56 214.29Sad/Disappointment -6.6 -10.18 -55.14 -27.65 -169.08 -54.04 Subject 4:
daF0 dsF0 daAmp dsAmp daTE dsTEHappy/Joy 63.3 -6.5 228.94 147.77 123.44 97.2Anger/Frustration -7.72 -9.84 62.92 39.93 152.64 40.09Sad/Disappointment 53.82 -6.62 -41.13 -6.07 108.6 94.35 Subject 5:
daF0 dsF0 daAmp dsAmp daTE dsTEHappy/Joy -13.39 -12.83 6.74 45.34 46.42 83.77Anger/Frustration -1.69 -0.71 -35 28.88 116.3 47.59Sad/Disappointment -21.12 -12.35 -206.29 -50.58 -121.16 -93.42 Subject 6:
daF0 dsF0 daAmp dsAmp daTE dsTEHappy/Joy 23.56 14.66 44.44 62.4 83.59 35.2Anger/Frustration -11.34 -6.29 9.81 23.86 -42.8 3.11Sad/Disappointment -13.94 1.77 -27.98 5.8 -54.78 -19.65
31

Subject 7:daF0 dsF0 daAmp dsAmp daTE dsTE
Happy/Joy 10.14 33.53 57.39 88.37 24.32 17.89Anger/Frustration -15.94 3.46 118 42.71 16.39 6.56Sad/Disappointment 7.14 17.03 23.47 51.42 8.29 12.57 Subject 8:
daF0 dsF0 daAmp dsAmp daTE dsTEHappy/Joy 18.93 16.16 102.26 112.17 21.57 -9.92Anger/Frustration -12.87 -2.01 -35.31 -21.84 51.13 6.29Sad/Disappointment -0.9 0.73 -7.66 -9.12 -33.16 -21.85
32