classification measures for a...
TRANSCRIPT
Evaluating Stochastic Cost-Benefit
Classification Measures For A Retailer’s
Assortment Mix Decision
Matthew A. Lanham, CAP ([email protected])
Doctoral Candidate
MatthewALanham.com
Ralph D. Badinelli, Ph.D. ([email protected])
Lenz Professor of Business
Department of Business Information Technology

Outline
2015 SEINFORMS Annual Meeting Copyright © 2015, MatthewALanham.com Cost-Benefit Classification Measures
Assortment Planning Demand Modeling Binary Classification Modeling Class Imbalance Model Assessment Stochastic Cost-Benefit Classification Research Design Results Future Research

The Assortment Problem
Assortment
Planning Demand Modeling
Binary
Classification Class Imbalance Model Assessment
Stochastic Cost-
Benefit Analysis Research Design
Results & Future
Research
The Assortment Decision Entails: • What products to offer where?
Typical Objective: • Determine which products to stock in a location in order to maximizes sales or profit while
satisfying various constraints (e.g. Classical Knapsack Problem)
Importance: • Considered to be the most important decisions faced by retailers because of the substantial
impact the products carried, not carried, or not available have on sales and gross margin (Kök et al., 2015; Sauré & Zeevi, 2013).
• A retailer not providing what the consumers desires will lose market share • Better assortments can create competitive advantages
Difficulty: • Thousands of Products & Stores NP-hard Problem • Understanding and modeling consumer purchase behavior adequately is the holy grail.
2015 SEINFORMS Annual Meeting Copyright © 2015, MatthewALanham.com Cost-Benefit Classification Measures
The Literature • Mostly focused on one assortment for a retailer, even though retailers will regularly have
different assortments for different stores due to the differences in customer preference. • It might be assumed that their solutions would then be implemented to each store
individually (Kök, Fisher et al. 2015).

Customized Assortment Problem = Big Data Problem
Assortment
Planning Demand Modeling
Binary
Classification Class Imbalance Model Assessment
Stochastic Cost-
Benefit Analysis Research Design
Results & Future
Research
2015 SEINFORMS Annual Meeting Copyright © 2015, MatthewALanham.com Cost-Benefit Classification Measures
Store-SKU complexity • The set of potential SKUs that a retailer may choose from can be 1,000,000+ • A traditional merchandise store (e.g. Big K) would carry approximately 16,000 unique
stock-keeping units (SKUs) with an additional 6,000 seasonal products, depending on the time of year (Cox 2011).
• A chain retailer can have several thousands of stores. A few examples, Walmart has 5,187 stores in the U.S. alone (Walmart 2015), Target 2,155 (Target 2015), and J.C. Penny 1,060 (Wikipedia 2015).
• How can we possibly model demand so that we know which SKUs to put in which stores?
100-200 Product
Categories
500k+ SKUs
Product
Attributes
10-20 Distribution
Centers
1k – 5k Stores
Demographic
Profiles

Demand Modeling
Assortment
Planning Demand Modeling
Binary
Classification Class Imbalance Model Assessment
Stochastic Cost-
Benefit Analysis Research Design
Results & Future
Research
2015 SEINFORMS Annual Meeting Copyright © 2015, MatthewALanham.com Cost-Benefit Classification Measures
Focused on Long-term Planning Horizon Products • Service parts • Office products Forecasting Techniques • ETS models, ARIMA, etc. • Goal: Estimate number of demand units for next t periods • Forecasting time-series with “lumpy” demand if very difficult Binary Classification Approaches • Logistic Regression, Decision Trees, Neural Networks, etc. • Goal: Predict purchase propensity of a product if stocked in a respective store Multi-Class Classification Approaches • Multinomial Logit Model (MNL), Nested Logit (NL), Locational-choice (LC), Exogenous Demand
(ED) • Goal: Predictive purchase propensity and estimate substitution behavior within a set of similar
products (i.e. substitutes) for a respective store • Academic literature has primarily focused on these utility-based models to estimate substitution
effects

Set up • Binary classification algorithms fit a model having a binary response (e.g. No/Yes, 0/1, etc.). • When the model is a fit, a continuous prediction for each record is generated that lies
between 0 and 1. • These predictions are then compared to a specified decision cutoff criterion, which allows
each prediction to be classified as a member of only one of two possible disjoint classes. • Our binary classification models are employed on previously stocked stock-keeping-unit
(SKU) that have sold over a particular time interval in any store. • Each SKU that has sold over a specified number of units as deemed by the retailer are
considered “sellers” (or Class 1), while those that have not sold more than a specified number of units over a certain time interval are labeled as “non-sellers” (Class 0).
Binary Classification Modeling
Assortment
Planning Demand Modeling
Binary
Classification Class Imbalance Model Assessment
Stochastic Cost-
Benefit Analysis Research Design
Results & Future
Research
2015 SEINFORMS Annual Meeting Copyright © 2015, MatthewALanham.com Cost-Benefit Classification Measures
Binary Classification
Objective: Determine the probability that SKU 𝑖 will sell in store 𝑗 • This is not being performed in the academic literature for various reasons (type of retail
business, product turn rates, etc.) but it can be effective for long-term planning horizon products
• We have found that if one is to use this approach selecting SKU propensity to sell measures based on traditional predictive model performance measures (e.g. ROC/AUC) is insufficient

• Class imbalance occurs when one class has more observations than another class. For example, training a model with 100 records where 70 had a response value of “Class 1”, while the remaining records had a response value of “Class 0”, which would yield a minority class imbalance of 30%.
• Studies have shown that not taking into account the class imbalance can have negative consequences on model estimation [24]. Essentially, the imbalance makes it difficult for the binary classification to learn, which usually leads to correctly classifying majority class records and not the minority class records [25].
• Today, there is not one technique that works optimally well for all data sets and researchers continue to work on creating a unified rebalancing framework to tackle this problem [26]. He and Garcia [27] provide a throughout review of this area. In our study, we investigate non-balancing, down-Sampling, up-Sampling, SMOTE, and ROSE.
• In this study we investigate the combination of different binary classification algorithms and class balance approaches: • Non-balancing • Down-sampling • Up-sampling • Synthetic Minority Over-sampling Technique (SMOTE) • Random OverSampling Examples (ROSE)
Class Imbalance
Assortment
Planning Demand Modeling
Binary
Classification Class Imbalance Model Assessment
Stochastic Cost-
Benefit Analysis Research Design
Results & Future
Research
2015 SEINFORMS Annual Meeting Copyright © 2015, MatthewALanham.com Cost-Benefit Classification Measures
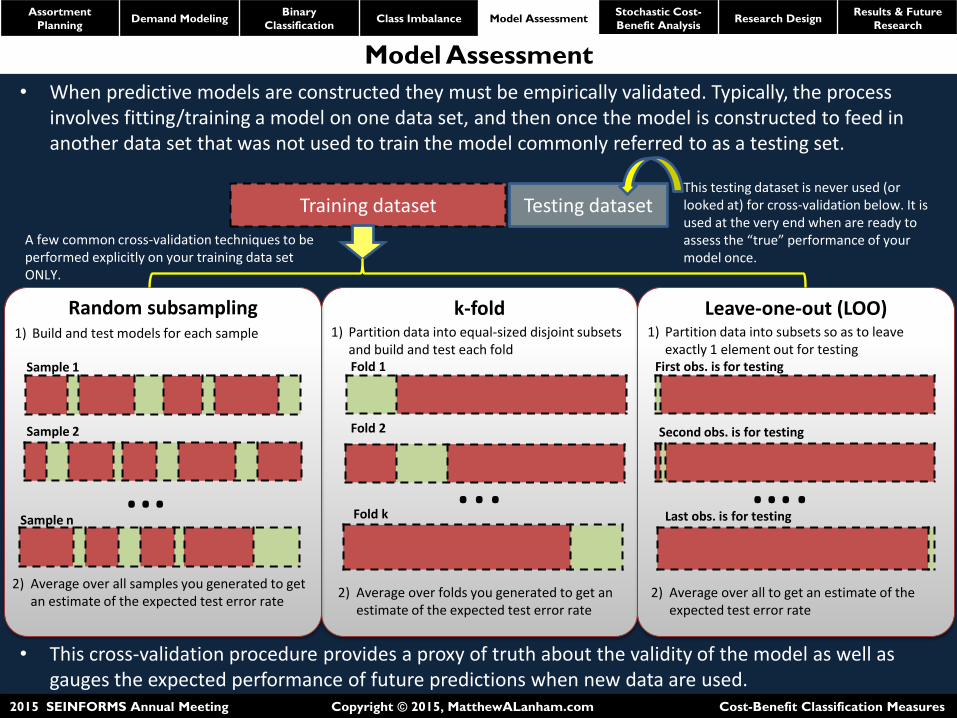
• When predictive models are constructed they must be empirically validated. Typically, the process involves fitting/training a model on one data set, and then once the model is constructed to feed in another data set that was not used to train the model commonly referred to as a testing set.
• This cross-validation procedure provides a proxy of truth about the validity of the model as well as
gauges the expected performance of future predictions when new data are used.
Model Assessment
Assortment
Planning Demand Modeling
Binary
Classification Class Imbalance Model Assessment
Stochastic Cost-
Benefit Analysis Research Design
Results & Future
Research
2015 SEINFORMS Annual Meeting Copyright © 2015, MatthewALanham.com Cost-Benefit Classification Measures
Training dataset Testing dataset
Random subsampling
…
1) Build and test models for each sample
Sample 1
Sample 2
Sample n
2) Average over all samples you generated to get an estimate of the expected test error rate
k-fold
...
1) Partition data into equal-sized disjoint subsets and build and test each fold
2) Average over folds you generated to get an estimate of the expected test error rate
Fold k
Fold 2
Fold 1
Leave-one-out (LOO) 1) Partition data into subsets so as to leave
exactly 1 element out for testing
….
First obs. is for testing
Second obs. is for testing
Last obs. is for testing
This testing dataset is never used (or looked at) for cross-validation below. It is used at the very end when are ready to assess the “true” performance of your model once.
A few common cross-validation techniques to be performed explicitly on your training data set ONLY.
2) Average over all to get an estimate of the expected test error rate

• The confusion matrix is a cross-tabulation table that provides a gauge of how well a model’s predictions were classified compared to the response. Since the response only has two possible classes in our case (i.e. sold vs. not sold), our predictions, in the form of a probability between 0,1 , are assigned to one of these potential classes.
• The assignment is based on the modeler’s specified cutoff threshold, which is most often
0.5. This means that if a prediction realizes a value of 0.67, it will be assigned to the “seller” class or “Class 1” because the prediction is larger than the threshold parameter. Likewise, a value of 0.49 would be assigned to “Class 0” or “non-seller” and so on for all probability predictions.
• A large number of true-positives (TP) and true-negatives (TN) on the diagonal of the matrix and a small number of false-positives (FP) and false-negatives (FN) provides an indication that the model used performs well at identifying SKUs that will sell or not sell in our context.
Confusion Matrix
Assortment
Planning Demand Modeling
Binary
Classification Class Imbalance Model Assessment
Stochastic Cost-
Benefit Analysis Research Design
Results & Future
Research
2015 SEINFORMS Annual Meeting Copyright © 2015, MatthewALanham.com Cost-Benefit Classification Measures

Statistics
Traditional Assessment Statistics from Confusion Matrix
Assortment
Planning Demand Modeling
Binary
Classification Class Imbalance Model Assessment
Stochastic Cost-
Benefit Analysis Research Design
Results & Future
Research
2015 SEINFORMS Annual Meeting Copyright © 2015, MatthewALanham.com Cost-Benefit Classification Measures
Statistic Alternative Name Description Formula
Overall Accuracy Probability that a SKU is classified as a seller and non-seller correctly 𝑇𝑃 + 𝑇𝑁
𝑇𝑜𝑡𝑎𝑙
Sensitivity True-Positive Rate; Recall
Probability that a retailer will predict a sell when there is actually sell 𝑇𝑃
𝑇𝑃 + 𝐹𝑁
Specificity True-Negative Rate Probability that a retailer will not predict a sell when there is not a sell 𝑇𝑁
𝐹𝑃 + 𝑇𝑁
Type I error rate False-Positive Rate; 1- Specificity
Probability that a retailer will predict a sell when there is not a sell 𝐹𝑃
𝐹𝑃 + 𝑇𝑁
Type II error rate False-Negative Rate Probability that a retailer will not predict a sell when there is actually sell 𝐹𝑁
𝑇𝑃 + 𝐹𝑁
Positive Predictive Value (PPV)
Precision Probability that the SKU did sell when it actually sold (an unconditional analog to sensitivity, which takes into account the event’s prevalence)
𝑇𝑃
𝑇𝑃 + 𝐹𝑃
Negative Predictive Value (NPV)
Probability that the SKU did not sell when it actually did not sell (an unconditional analog to specificity, which takes into account the event’s prevalence)
𝑇𝑁
𝐹𝑁 + 𝑇𝑁
Positive Likelihood Ratio (PLR)
Ratio between the probability that the retailer predicts a sell when there is a sell and the probability that a SKU will sell given it actually did not sell
𝑆𝑒𝑛𝑠𝑖𝑡𝑖𝑣𝑖𝑡𝑦
1 − 𝑆𝑝𝑒𝑐𝑖𝑓𝑖𝑐𝑖𝑡𝑦
Negative Likelihood Ratio (NLR)
Ratio between the probability that a retailer predicts a SKU will not sell given it actually sold and the probability that the retailer predicts that the SKU will not sell given that it did not sell
1 − 𝑆𝑒𝑛𝑠𝑖𝑡𝑖𝑣𝑖𝑡𝑦
𝑆𝑝𝑒𝑐𝑖𝑓𝑖𝑐𝑖𝑡𝑦
Youden’s J Index Youden [28]
J Index The proportion of correctly predicted samples for both the seller and non-seller groups (an alternative to the ROC curve)
Sensitivity + Specificity - 1
Cohen’s Kappa Kappa Historically been used to assess agreement among two raters but is appropriate to the retailer in this context as well [29]. If we let O = observed accuracy and E = expected accuracy, we can calculate Cohen’s Kappa statistic based on the confusion matrices’ marginal totals. Let, 𝑂 = 𝑇𝑃 + 𝑇𝑁 and
𝐸 =𝑇𝑃+𝐹𝑃 ∗ 𝑇𝑃+𝐹𝑁
𝑇𝑜𝑡𝑎𝑙+
𝐹𝑁+𝑇𝑁 ∗ 𝐹𝑃+𝑇𝑃
𝑇𝑜𝑡𝑎𝑙
𝑂 − 𝐸
𝑇𝑜𝑡𝑎𝑙 − 𝐸

Receiver Operating Characteristic (ROC) curve • The ROC curve is the most frequently used device to compare and assess different models. • ROC is constructed from confusion matrices with various cutoff thresholds (e.g. 0.001 to 0.999)
The ROC Curve
Assortment
Planning Demand Modeling
Binary
Classification Class Imbalance Model Assessment
Stochastic Cost-
Benefit Analysis Research Design
Results & Future
Research
2015 SEINFORMS Annual Meeting Copyright © 2015, MatthewALanham.com Cost-Benefit Classification Measures
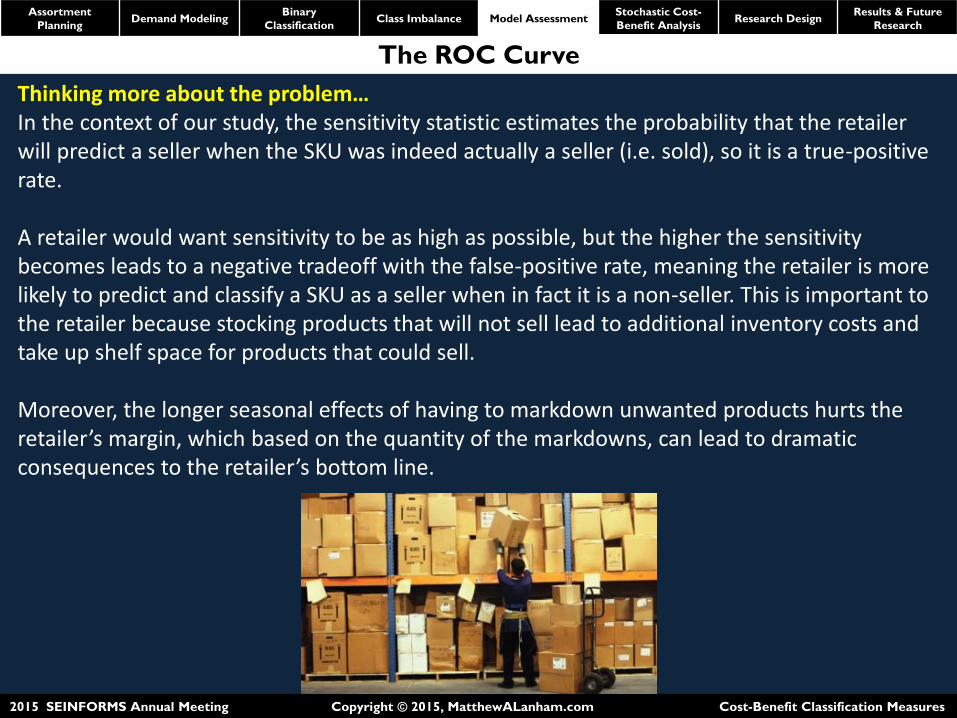
Thinking more about the problem… In the context of our study, the sensitivity statistic estimates the probability that the retailer will predict a seller when the SKU was indeed actually a seller (i.e. sold), so it is a true-positive rate. A retailer would want sensitivity to be as high as possible, but the higher the sensitivity becomes leads to a negative tradeoff with the false-positive rate, meaning the retailer is more likely to predict and classify a SKU as a seller when in fact it is a non-seller. This is important to the retailer because stocking products that will not sell lead to additional inventory costs and take up shelf space for products that could sell. Moreover, the longer seasonal effects of having to markdown unwanted products hurts the retailer’s margin, which based on the quantity of the markdowns, can lead to dramatic consequences to the retailer’s bottom line.
The ROC Curve
Assortment
Planning Demand Modeling
Binary
Classification Class Imbalance Model Assessment
Stochastic Cost-
Benefit Analysis Research Design
Results & Future
Research
2015 SEINFORMS Annual Meeting Copyright © 2015, MatthewALanham.com Cost-Benefit Classification Measures

Area Under the Curve (AUC) • To assess the overall performance of the model based on the ROC curve, the physical area under the
curve (AUC) can be calculated. A curve having no classification ability will lie perfectly on the 45 degree line, thus the AUC is 0.50. Ideally, the retailer would prefer an ROC curve that goes from point (0,0) to (0,1) to (1,1) which would indicate perfect classification for any cutoff threshold and lead to an AUC of 1 as shown in Figure 3.
Area Under The ROC Curve
Assortment
Planning Demand Modeling
Binary
Classification Class Imbalance Model Assessment
Stochastic Cost-
Benefit Analysis Research Design
Results & Future
Research
2015 SEINFORMS Annual Meeting Copyright © 2015, MatthewALanham.com Cost-Benefit Classification Measures

Motivation Provost and Fawcett [33], “Even if a model passes strict evaluation tests "in the lab," there may be external considerations that make it impractical. For example, a common flaw with detection solutions (such as fraud detection, span detection, and intrusion monitoring) is that they produce too many false alarms. A model may be extremely accurate (>99%) by laboratory standards, but evaluation in the actual business context may reveal that it still produces too many false alarms to be economically feasible.” INFORMS Certified Analytics Professional Domains • When I was trying to apply the CAP framework to my research, I felt like the connection of
the business problem to the analytics problem was disconnected. • At the end of the day, I want statistically valid model(s) that have performance measures
that can be understood by my decision-makers (e.g. Category managers) to help them make better decisions.
Stochastic Cost-Benefit Analysis
Assortment
Planning Demand Modeling
Binary
Classification Class Imbalance Model Assessment
Stochastic Cost-
Benefit Analysis Research Design
Results & Future
Research
2015 SEINFORMS Annual Meeting Copyright © 2015, MatthewALanham.com Cost-Benefit Classification Measures
Business Problem (Question) Framing
Analytics Problem Framing
Data Methodology
(Approach) Selection
Model Building
Deployment Model Life
Cycle Management

Stochastic Cost-Benefit Analysis
Assortment
Planning Demand Modeling
Binary
Classification Class Imbalance Model Assessment
Stochastic Cost-
Benefit Analysis Research Design
Results & Future
Research
2015 SEINFORMS Annual Meeting Copyright © 2015, MatthewALanham.com Cost-Benefit Classification Measures
Example Consider ten products from a similar product category. These products will have similar domain characteristics, but will have varying prices, costs, margins, and profits. We can see that historically certain products have sold over a specified time frame (i.e. “sellers”) and some have not sold (i.e. “non-sellers”). The model estimates a probability that each product will sell and based on the cutoff threshold of 0.50 each product can be assigned to a class.

Lets do some math… Below are some basic equations we could us to calculate the expected return for correctly classifying each SKU. A retailer will want to try and minimize the false-positive and false-negatives. • Some false-negatives will have a lost sales cost of not stocking the product in a location
when it would have sold. • False-positives will have their own costs as well, such as inventory, recycling, and lost
opportunity costs because the product was purchased and place in a location and it did not sell.
Stochastic Cost-Benefit Analysis
Assortment
Planning Demand Modeling
Binary
Classification Class Imbalance Model Assessment
Stochastic Cost-
Benefit Analysis Research Design
Results & Future
Research
2015 SEINFORMS Annual Meeting Copyright © 2015, MatthewALanham.com Cost-Benefit Classification Measures

In our scenario we only consider the cost of the product and do not incorporate those additional inventory and recycling costs. In the financial form of classification we show here, if the retailer correctly predicted SKU 𝑖 would sell they would know that the associated profit for that SKU is
𝑝𝑖 = 𝑟𝑒𝑣𝑖 − 𝑐𝑜𝑠𝑡𝑖 However, if SKU 𝑖 does not sell but was predicted to have sold they would earn −𝑐𝑜𝑠𝑡𝑖 for making that stocking decision.
Stochastic Cost-Benefit Analysis
Assortment
Planning Demand Modeling
Binary
Classification Class Imbalance Model Assessment
Stochastic Cost-
Benefit Analysis Research Design
Results & Future
Research
2015 SEINFORMS Annual Meeting Copyright © 2015, MatthewALanham.com Cost-Benefit Classification Measures
Here is the traditional confusion matrix based on counts of correctly classified and incorrectly classified SKUs from our example. Evaluating the classification accuracy for this model, the overall accuracy is 70% (7/10), sensitivity is 80% (4/5), and specificity is 60% (3/5).

Stochastic Cost-Benefit Analysis
Assortment
Planning Demand Modeling
Binary
Classification Class Imbalance Model Assessment
Stochastic Cost-
Benefit Analysis Research Design
Results & Future
Research
2015 SEINFORMS Annual Meeting Copyright © 2015, MatthewALanham.com Cost-Benefit Classification Measures
Now, lets look at the financial classification cost-benefit of using this model to stock SKUs classified as sellers or non-sellers. In this example, the model would yield a positive net gain. However, the misclassification of SKU A has a major overall impact to the business, possibly leading to an overall loss for this product category because the retailer is not incorporating the additional inventory, recycling, and lost opportunity costs.

To evaluate our proposed stochastic cost-benefit performance measures we tested four different binary classification algorithms (Logistic Regression, Classification tree, C5.0 decision tree, Linear Discriminant Analysis) on one product category from a national retailer. The dataset was randomly split into a 70% training dataset and a 30% out-of-sample testing dataset. Due to the dataset being imbalanced, the training dataset was rebalanced using four commonly used rebalancing techniques (up-Sampling, down-Sampling, SMOTE, and ROSE) as well as evaluated without rebalancing. We compare the different modeling approaches to identify what the optimal model chosen would have been based solely on traditional binary classification performance measures (e.g. AUC, Overall accuracy) and then compare those results to the stochastic cost-benefit evaluation procedure to see how well they correlate. For this one product category, this design allows us to answer these three research questions: R1: What are the expected business gains a retailer could expect to achieve when using various combinations of rebalancing and binary classification algorithms to identify SKU sellers from non-sellers?
R2: For each rebalance technique/binary classification algorithm combination, can the retailer expect the cost-benefit on the out of sample test set to follow more or less in line with the training data set? Classical statistics do not, as one might have over fit the training dataset.
R3: For each rebalance technique/binary classification algorithm combination, can the retailer expect the cost-benefit on the out of sample test datasets to be similar and could using the financial measures be used to identify which model is optimal compared to traditional statistical measures?
Research Design
Assortment
Planning Demand Modeling
Binary
Classification Class Imbalance Model Assessment
Stochastic Cost-
Benefit Analysis Research Design
Results & Future
Research
2015 SEINFORMS Annual Meeting Copyright © 2015, MatthewALanham.com Cost-Benefit Classification Measures

Training data statistics per rebalance set and model
Results
Assortment
Planning Demand Modeling
Binary
Classification Class Imbalance Model Assessment
Stochastic Cost-
Benefit Analysis Research Design
Results & Future
Research
2015 SEINFORMS Annual Meeting Copyright © 2015, MatthewALanham.com Cost-Benefit Classification Measures

Training and testing assessment statistics comparison
Results
Assortment
Planning Demand Modeling
Binary
Classification Class Imbalance Model Assessment
Stochastic Cost-
Benefit Analysis Research Design
Results & Future
Research
2015 SEINFORMS Annual Meeting Copyright © 2015, MatthewALanham.com Cost-Benefit Classification Measures

Our results show that the financial performance measures follow closely in line with the statistical measures.
However, without looking at the financial measures the retailer would have likely chosen the Up-C5.0 combination as their final production model to base their decision-support because it has the greatest test statistics (AUC = 0.9150/Accuracy = 85.48%). However, this model does not necessarily lead to the best expected profit or least misclassification costs. The Raw-C5.0 combination revealed respectable test statistics (AUC = 0.7561/Accuracy = 83.6%) and led to an expected profit gain of $62,153 and reduced misclassification costs of $6,409 compared to using Up-C5.0.
Testing Data Statistics
Assortment
Planning Demand Modeling
Binary
Classification Class Imbalance Model Assessment
Stochastic Cost-
Benefit Analysis Research Design
Results & Future
Research
2015 SEINFORMS Annual Meeting Copyright © 2015, MatthewALanham.com Cost-Benefit Classification Measures

Conclusions The results of the study show the value that might be achieved using stochastic cost-benefit analysis for binary classification model assessment and selection. The motivation for this research is that the assortment decision is considered one of the most important decisions that a retailer will make and thus must consider the financial considerations that their stocking decisions could make. Using naïve approaches such as binary classification to identify SKU sellers from non-sellers could be a viable baseline modeling strategy when the number of SKUs to evaluate is in the hundreds of thousands. However, we posit that retailer’s should also use more sophisticated approaches that incorporate substitution behavior. Limitations Our study is limited in that only one category of products is investigated in insolation, substitution behavior was disregarded, the evaluation of the business performance is retrospective over the same time frame as the predictions, and modeling build time is not incorporated. Ideally, all these concerns must be addressed by the retailer when generating timely and reliable decision-support. Turning this work into a Journal-quality Paper We want to extend this research by addressing these important financial aspects as well as other realistic concerns that a retailer must face so that complete assortment decision-support system can be created and tested. Factors we are testing include incorporating:
(1) constructing a valid simulation design (2) more sophisticated financial measures (3) including substitution behavior (4) evaluation over all categories that must be considered in a store assortment
Conclusions and Future Research
Assortment
Planning Demand Modeling
Binary
Classification Class Imbalance Model Assessment
Stochastic Cost-
Benefit Analysis Research Design
Results & Future
Research
2015 SEINFORMS Annual Meeting Copyright © 2015, MatthewALanham.com Cost-Benefit Classification Measures

The authors would like to thank the retailer, decision-makers, and data scientists we have collaborated with for helping us to better understand the assortment planning process. This project has allowed us an opportunity to identify missing areas in the academic literature, but more importantly improve business practice by following the management science/analytics process.
Acknowledgments
Assortment
Planning Demand Modeling
Binary
Classification Class Imbalance Model Assessment
Stochastic Cost-
Benefit Analysis Research Design
Results & Future
Research
2015 SEINFORMS Annual Meeting Copyright © 2015, MatthewALanham.com Cost-Benefit Classification Measures