class reduction and student achievement - amherst college
TRANSCRIPT

Jepsen and Rivkin
1
1
Class Reduction and Student Achievement: The Potential Tradeoff between Teacher Quality and Class Size
Christopher Jepsen and Steven Rivkin*
(Journal of Human Resources Forthcoming)
Abstract: This paper investigates the effects of California’s billion-dollar class size reduction
program on student achievement. It uses year-to-year differences in class size generated by
variation in enrollment and the state’s class size reduction program to identify both the direct
effects of smaller classes and related changes in teacher quality. Although the results show
that smaller classes raised mathematics and reading achievement, they also show that the
increase in the share of teachers with neither prior experience nor full certification dampened
*University of Kentucky, Department of Economics, 335BA Gatton B&E Building,
Lexington, KY 40506-0034, [email protected] and Amherst college, National Bureau of
Economic Research, and University of Texas at Dallas respectively. We thank the editor,
three anonymous referees, Mark Baldassare, Julian Betts, David Figlio, Gary Hart, Caroline
Minter Hoxby, Robert McMillan, Kim Rueben, Jon Sonstelie, and seminar participants at the
Public Policy Institute of California, Stanford University, NBER, the Fall 2001 APPAM
conference, and the 2003 SOLE meetings for their many helpful comments. We also thank
Anne Danenberg for invaluable data support and Pedro Cerdan, Jackie Chou, and Shelley de
Alth for excellent research assistance. Financial support for Rivkin was provided by Smith
Richardson Foundation, Spencer Foundation and Hewlett Foundation The data used in this
article can be obtained beginning [date six months after publication] through [three years
hence] from [name, address, and email].

Jepsen and Rivkin
2
2
the benefits of smaller classes, particularly in schools with high shares of economically
disadvantaged, minority students.

Jepsen and Rivkin
3
I. Introduction
In the summer of 1996, California enacted the most expensive state-level education
reform in U.S. history. The state’s class size reduction (CSR) program reduced K-3 class sizes
throughout the state by roughly ten students per class, from 30 to 20, at an annual cost that
exceeds one billion dollars. CSR required schools to decrease class size in first and second grade
prior to reducing the size of kindergarten (KG) and third grade classes. School participation in
first and second grades exceeded 90 percent statewide by 1998, but participation in KG and third
grade did not exceed 90 percent until 2000.
Given the sheer scale of the reform, CSR had major implications for the California
teacher labor market. The reform created 25,000 new teaching positions in its first two years.
Many of these positions were filled by teachers without certification or prior teaching
experience. Other positions were filled by experienced teachers who switched grades or schools
(or both). Ross (1999) describes the influx of inexperienced, non-certified teachers into
elementary schools in South Central Los Angeles following class size reduction, prompted in
part by the departure of many experienced teachers to newly created positions in more affluent
communities. Therefore, ceteris peribus estimates of class size effects provide only partial
information on the benefits of CSR because they do not capture accompanying changes in
teacher quality following its implementation.
Studying the class size and teacher quality effects of CSR is complicated by the way in
which the program was implemented. Because California did not administer statewide
examinations until the 1997-1998 school year, no baseline measure of achievement prior to CSR
is available. In addition, the statewide implementation of CSR makes it more difficult to separate

Jepsen and Rivkin
4
its effects from other changes, including expanded school accountability, the spread of charter
schools, and test score inflation.
This paper provides a comprehensive look at the effects of CSR on mathematics and
reading achievement. Whereas previous studies go to great lengths to hold teacher quality
constant, we investigate the direct effects of smaller classes and the indirect effects of the
accompanying changes in the characteristics of teachers. Our fixed effect framework uses
differences in class size and specific teacher characteristics by school, grade, and year to identify
variable effects on achievement. Because teacher experience and certification may capture only a
portion of CSR induced changes in the teacher quality, we also examine whether the quality of
instruction varies inversely with the size of entering teacher cohorts conditional on certification
status.
We find that the ten-student reduction in class size raised school average mathematics
and reading achievement by roughly 0.10 and 0.06 standard deviations of the school average test
score distribution, respectively, holding other factors constant. However, the accompanying
increases in the shares of new and not-fully certified teachers offset some of the benefits of CSR.
Most importantly, we find that having a first-year teacher as opposed to a teacher with at least
two years of experience reduced achievement by an average of 0.10 and 0.07 standard deviations
in mathematics and reading, respectively, almost identical to the benefit of the smaller classes.
We also find a significant albeit small quality differential between fully certified and non-fully
certified teachers but no significant relationship between the size of entering teacher cohorts and
the quality of instruction. Because the share of teachers with little or no experience approached
its pre-CSR level within a few years of implementation, it appears that the cost in terms of lower
instructional quality was concentrated in the initial years of the program.

Jepsen and Rivkin
5
II. Previous Class Size Research1
Recent research utilizes social experiments and innovative statistical methods to identify
the causal effect of smaller classes holding teacher quality constant. The most prominent of
these is the Tennessee STAR experiment, where students were randomly assigned to small
classes or larger classes. A comparison between achievement in large and in small classes
provides an estimate of the benefits of smaller classes but provides no information on changes in
teacher quality. Krueger (1999) and Krueger and Whitmore (2001) find that smaller class sizes in
kindergarten and first grade had a significant and lasting impact on academic achievement and
educational attainment. However, the substantial student mobility and attrition that occurred
throughout the experiment and consequent need to add students each year raises questions about
the estimates, particularly for the higher grades (Hoxby, 2000; Hanushek, 1999).
Studies by Angrist and Lavy (1999), Hoxby (2000), and Rivkin, Hanushek, and Kain
(2005) identify plausibly exogenous variation in class size in order to learn more about the
effects of class size on achievement (in Israel, Connecticut, and Texas, respectively). Except for
Hoxby (2000), the studies find that smaller classes significantly increase achievement in the
early grades (grade 5 and below), and the effects tend to be larger for lower-income students.
Because data problems attenuate the estimates in Hoxby (2000), the overall pattern of results
suggests that smaller classes raise achievement, other things held constant.2
One important feature of these studies is that they go to great lengths to hold all other
factors, particularly teacher quality, constant. However, an extensive class size reduction
program such as that undertaken by California inevitably alters the composition and quality of
the teaching force. Consequently, controlled experiments such as STAR provide only partial
information on the likely effect of broad-based class size reduction by ignoring its impact on

Jepsen and Rivkin
6
teacher quality. Depending upon the elasticity of supply of teacher quality and teacher
preferences along a number of dimensions, the existing estimates may overstate the benefits of
smaller classes, particularly for schools that have a difficult time attracting teachers.
The initial Class Size Reduction Research Consortium evaluations of CSR and
achievement compare schools that implemented CSR in the initial year with those that did not
(Bohrnstedt and Stecher, 1999; Stecher and Bohrnstedt, 2000).3 Although funding was available
for all schools, some did not participate in the first year. In order to account for differences
between schools that did and did not implement CSR in a timely manner, fourth- or fifth-grade
test scores are included in the regressions as controls. This technique assumes that all differences
across schools can be captured by a single variable (test scores in fourth or fifth grade). The
state-funded Class Size Reduction Research Consortium found little effect of CSR on student
achievement.
More recent work on CSR investigates both the benefits of smaller classes and
unintended program consequences that might adversely affect school quality. Unlu (2005) finds
positive effects of CSR using several difference-in-differences models with National Assessment
of Educational Progress (NAEP) data, though contemporaneous education policy changes in
California and the appropriateness of the control states raises concerns about this analysis. Sims
(2003) finds that the incentives of CSR to cap class size at 20 leads to increased usage of multi-
grade classrooms which adversely affects achievement.
Our analysis extends previous work on CSR in two ways. First, we look at both the direct
effects of smaller classes and the effects of any related changes in teacher characteristics.
Second, we use class size differences by school, grade, and year in a multi-level school fixed
effect framework to identify the effects of smaller classes in addition to difference-in-differences

Jepsen and Rivkin
7
models similar to those used in earlier analyses of CSR effects. Multiple difference-in-difference
specifications in combination with the school by grade and school by year fixed effects models
provide a far richer set of estimates less susceptible to contamination by confounding factors.
III. Empirical Model
In this section we describe the model used in the empirical analysis. Because we do not
have access to student level data and are unable to follow students as they age, we develop the
model at the school-grade-year level of aggregation. Nevertheless, we place the discussion in the
context of a cumulative model of learning such as that described by Todd and Wolpin (2003) in
order to highlight the potential confounding factors and the impediments to identification
introduced by the structure of the data.
Equation (1) highlights key issues that must be addressed in the absence of random
assignment in order to generate consistent estimates of the causal effects of class size and teacher
characteristics on achievement. Here average achievement A for students in grade G and school s
in year y is modeled as a function of average student, family and teacher characteristics and
average class size:
(1) GsyGsyGsyGsyGsyGsy eTCSXA ++++= λδβα
where CS is average class size, T is a vector of teacher characteristics including the shares of
teaching lacking full certification and experience, X is a vector of family background variables, α
is average student skill, where student skill evolves over time as a function of prior family and
school influences, and e is a stochastic term that captures unmeasured influences of communities

Jepsen and Rivkin
8
and schools as well as random error. If CS and T were uncorrelated with e and α, OLS would
yield unbiased estimates of δ and λ. But given the non-random sorting of students and teachers
into schools and systematic differences in the timing of class size reduction, CS and T are almost
certainly related to other achievement determinants. Note that the use of grade average
characteristics does eliminate the bias due to purposeful sorting of students into classrooms.
Our basic approach is to use the panel of schools to control for observed and unobserved
student, family, school, and community factors that could potentially bias the estimated class size
and teacher characteristic effects, leaving only exogenous variation to identify the parameter
estimates. We begin by expanding the error term e from equation (1) into a series of components
that highlight both the types of school and neighborhood factors accounted for directly by the
fixed effects and those factors that remain unaccounted for:
(2) eGsy =θs+ξG + ψy + π sG + ϕsy + ρGy +τ sGy + εGsy
where the first three terms are fixed school, grade, and year effects, the next three terms are
second-level interactions among these three components, the seventh term is the third-level
interaction, and the final term is a random error.
The school fixed effect captures time invariant differences in neighborhoods and schools.
These include school facilities, public services, community type, and working conditions that
influence teacher supply.
Because school quality may vary over time and by grade, Equation (2) also includes
interactions between school and both grade and year. The school-by-grade component captures
systematic changes across grades in a school common to all years, and the school-by-year term

Jepsen and Rivkin
9
accounts for year-to-year changes common to all grades in a school. Rather than relying on a
linear or even polynomial trend for each school, these school-by-year fixed effects remove in a
very general way all variation over time in neighborhood and local economic conditions that
likely affect mobility patterns including such things as the introduction of new school policies or
the myriad changes documented to occur in “transitional neighborhoods.” An economic shock
that reduces neighborhood employment and income would not bias the estimates; nor would a
shock to local school finances or the quality of the local school board, because each of these
would affect all grades in a school. The school-by-grade fixed effect also accounts for the
possibility that achievement trends vary systematically with changes in class size or teacher
quality as children age.
It is also important to account for statewide factors that might be correlated with overall
changes in achievement. The grade, year, and year by grade fixed effects account for statewide
trends by grade and year and other factors including test difficulty.
The seventh term, τ, is the full three way interaction between school, grade, and year.
Despite the fact that the school-by-year fixed effects capture changes in administration,
neighborhood social and economic environment, school resources, and myriad other
achievement determinants, it is almost certainly the case that most schools experience grade
specific variation in teacher quality, peer influences and perhaps other factors from year to year.
Grade specific changes in curriculum also remain unaccounted for by either the school by grade
or school by year fixed effects.
Importantly, this term cannot be included in the regressions, because doing so would
eliminate all variation in class size and the other variables; the data are aggregated to the school-
grade-year level, and there is no within grade variation. Therefore τ potentially includes

Jepsen and Rivkin
10
confounding factors that cannot be directly accounted for, and a key question is whether any
such factors contaminate the estimates of class size or teacher characteristic effects.4
The following example for a single school illustrates the variation used to identify the
parameter estimates. If we had multiple years of data for a single grade, we could use cohort
differences in achievement and class size for that grade to identify the class size effect.
Alternatively, if we had multiple grades of data for a single year, we could use grade differences
in achievement and class size in that year to identify the class size effect. In a more general case
with multiple schools, the coefficients would reflect the average of these within school
relationships across the sample.
Each of these estimators is subject to potentially serious biases. In the model that focuses
on variation across years within school and grade, unobserved time varying factors related to
class size could contaminate the estimates. In the specification that uses variation across grades
within school and year, systematic differences by cohort or by age could introduce bias.
Fortunately, the availability of multiple years and grades of data permits the simultaneous
inclusion of school-by-grade and school-by-year fixed effects. In this case the class size effect is
identified by deviations from a school’s average class size for each grade and year. Consider a
data set with class size and achievement data for grades g and g-1 and years y and y-1. The
inclusion of school by grade and school by year fixed effects is equivalent to the following
regression:
(3) )]()[()()( 11111111 −−−−−−−− −−−=−−− ysgsgyysgsgyysgsgyysgsgy CSCSCSCSAAAA δ + error
Although the school by grade and school by year fixed effects eliminate primary sources
of bias, there remains the possibility that unobserved differences by grade and year including test
difficulty and grade specific policy changes at the state level could contaminate the estimates.

Jepsen and Rivkin
11
Fortunately, the availability of data for a number of schools enables us to control for average
grade-by-year effects across all schools with grade, year, and grade by year fixed effects.
The variation in class size and teacher characteristics that remains following the inclusion
of the fixed effects and observed characteristics comes from purposeful, grade-specific changes
in school policy including implementation of CSR, variation in the size of entering cohorts at a
school, the inflow and outflow of students in a given grade and year, and teacher experience
gains over time, turnover and re-allocation among grades. Not surprisingly the variance in
second- and third-grade class size is much larger for schools that begin our sample period with
large classes and either adopt CSR during the period or not at all, thought the vast majority of
schools have small classes throughout the period (see Appendix Table 1).
Regardless of CSR status, the key identifying assumption is that the variation in class size
and teacher characteristics is not related to confounding influences. One potential source of bias
could come from school changes in response to expected teacher quality or class size. Yet given
the uncertainty about the actual teacher a child will be assigned to in the next grade and
predominance of multi-children families, such grade-year specific moves are not likely to be
widespread. Similarly, it seems plausible to assume that schools do not change class sizes or the
grade distribution of new or not fully certified teachers based on the characteristics of particular
student cohorts that are not maintained intact from one year to another. On the other hand,
adoption of CSR appears to have influenced teacher grade preferences, amplifying the
importance of accounting for teacher experience.
Of course the possibility that teacher assignments are based in part on cohort quality
cannot be ruled out, and the inability to link students across grades and years prevents us from
accounting for mobility or controlling for student heterogeneity through the use of a value-added

Jepsen and Rivkin
12
framework or student fixed effects.5 We can, however, examine the sensitivity of the estimates to
student demographic variables that are almost certainly related to academic preparation including
the proportion eligible for a subsidized lunch. Moreover, student level panel data in Texas
suggests that class size estimates are not sensitive to the inclusion of mobility controls.6
One final concern is the possible persistence of cohort differences in class size and
teacher characteristics across grades, causing the coefficients to conflate contemporaneous and
past class size and teacher characteristic effects.7 For example, cohorts with smaller second-
grade classes may have tended to have smaller first-grade and kindergarten classes, meaning that
the second-grade class size coefficient may combine the effects of class size in second grade and
class sizes in earlier grades. The magnitude of this effect depends negatively on the rate at which
the additional knowledge produced by smaller classes depreciates over time and positively on the
correlation between current and prior class size and teacher characteristics. Note that in cases
with either no knowledge persistence or no correlation between current and prior class size, class
sizes in earlier grades do not affect estimates of contemporaneous class size effects.
Although it is not possible to estimate the rate of knowledge depreciation for the specific
sample and test instrument used in this analysis because of the lack of student level information,
estimates of the correlations between current and prior year class size can be generated.
Appendix Table 2 reports the within cohort correlations over grade of residual class size and
teacher characteristics based on the variation that remains following the removal of all fixed
effects. In the case of teacher experience, the fact that most correlations for the experience
variables fall below 0.10 indicates that any confounding effects of teacher experience in the prior
year are likely to be small even if there were little or no depreciation of knowledge over time. In
the case of class size, some of the correlations approach 0.25 which although still low suggest

Jepsen and Rivkin
13
that effects of class size in prior years might introduce a small upward bias on some class size
estimates.
IV. Data Sources
The data come from the California Department of Education (CDE) and include all
public elementary schools serving second through fourth grades in California with the exception
of charter schools and alternative schools (such as special education schools). Student-level data
are not released by the CDE, but aggregate information on student background and test
performance can be combined with information on average class size and teacher characteristics
including experience, certification, and education.
We use data from seven years: 1990-1991, 1995-1996, and 1997-1998 through 2001-
2002 (for ease of discussion we subsequently refer to an academic year by the calendar year in
which it begins). This lengthy panel, which includes pre- and post-CSR years, allows us to look
at the relationship between CSR and trends in teacher characteristics, as illustrated in the next
section.
For 1997 through 2001, each California public school student in second through eleventh
grade took the Stanford Achievement Test Series, Ninth Edition, Form T (Stanford 9) multiple-
choice test, published by Harcourt, Brace & Co.8 Our measure of achievement in each grade is
the school average mathematics or reading test score, standardized to a mean of zero and a
standard deviation of one.
The information on teacher experience and certification is used to construct marginal and
joint distributions of these variables. Because evidence shows that the return to experience is
concentrated in the first few years, we calculate the shares of teachers with zero, one, and two
plus years of prior experience rather than simply using the average. We also interact certification

Jepsen and Rivkin
14
status with experience to examine whether quality differences by certification status vary with
experience.
Table 1 reports descriptive statistics by year for the regression sample period (1997 to
2001). The sample includes grades two through four for all school years from 1997 to 2001. An
observation is a combination of grade, school, and year, such as third grade in Washington
Elementary school for 1999. There are 65,511 observations.
V. California Public Elementary School Teachers: 1990-2001
The magnitude and distribution of any changes in teacher characteristics following the
CSR-driven increase in demand clearly depend on many factors. The most prominent are the
details of class size reduction, accompanying changes in salary, and the elasticity of teacher
supply for different types of schools. In terms of the first, Jepsen and Rivkin (2002) show that
CSR reduced third-grade class size from roughly 30 to 20 for all types of schools. As a result, the
number of CSR-induced openings at a given school depended only on the size of the school, not
on the characteristics of its student body.9 With respect to teacher salaries, the average earnings
of young, non-teacher female college graduates in California matched if not exceeded the rise in
starting teacher salaries during the 1990s.10
Finally, measures of supply conditions for different types of schools are not readily
available, although Ballou and Podgursky (1997) and others argue that excess supply
characterizes most teacher labor markets, especially those in middle-class communities. Schools
in such communities can meet increased demand by drawing from new teachers, those currently
out of teaching, and teachers working in less preferred districts. On the other hand, schools
serving academically and economically at risk students likely confront a lower supply of
certified teachers at market wages. Boyd et al. (2003) find that the combination of distance to

Jepsen and Rivkin
15
desirable housing and characteristics associated with a high-poverty, high-proportion black or
Hispanic student body severely inhibits the ability of administrators to attract and retain fully-
certified teachers.
Thus, the expanded number of teaching positions at all schools following the
implementation of CSR both redistributed existing teachers among schools and brought a
number of new teachers into the schools. The implications for school average instructional
quality depended upon both the effectiveness of movers and new, often uncertified, teachers in
comparison to their new colleagues and those they replaced. On the one hand, it is difficult to
speculate on the changes in quality experienced by schools serving high SES students who often
filled vacancies with experienced teachers. There is little evidence on the extent to which schools
use more desirable working conditions to procure more effective teachers as measured by value
added to student achievement, and the structure of the tenure system in California including the
granting of tenure after only a few years and difficulty firing poor performers suggests that there
is likely to be substantial quality variation within most schools. On the other hand, evidence
suggests that teachers with little or no prior experience and to a lesser extent those lacking full
certification tend to be less effective in the classroom. Consequently those schools that lost many
teachers and had to fill vacancies predominantly by hiring new teachers may have experienced a
substantial decline in the quality of instruction.
V.A. Changes in the Distribution of Teacher Experience and Certification
This section describes changes over time in teacher experience and certification by
student demographic characteristics. The figures for experience and certification are constructed
in the following way. Schools are divided into four categories according to the percentage of
students eligible for a subsidized lunch.11 Then, the average of the teacher characteristic, such as

Jepsen and Rivkin
16
the school’s percentage of new teachers, is calculated from all the schools in that subsidized
lunch category. Low-poverty schools are defined as schools with fewer than 25 percent of their
students eligible for a subsidized lunch, whereas high-poverty schools are defined as schools
with greater than 75 percent eligible for a subsidized lunch. The calculations weight each school
by the number of students in the specific racial/ethnic group (such as Asians), thereby creating
averages for students in each of the four racial/ethnic groups.12 Differences among racial/ethnic
groups within each subsidized lunch category provide information regarding the degree to which
the distributions of teacher characteristics differ by race/ethnicity conditional on income.13
Figure 1 shows trends in the percentages of new teachers – teachers in their first year of
teaching in any California public school – in grades two through four (the grades we use to
analyze the effect of CSR on student achievement later in the paper) for the lowest and highest
poverty categories.14 The basic time patterns are generally similar for all demographic groups: a
small decline in the share of new teachers prior to CSR, a large increase in the share of new
teachers following the implementation of CSR and a return to a similar share of new teachers by
the end of the time period. There are, however, race/ethnic differences among students in high
poverty schools. Specifically, the CSR-induced increase in the share of students with new
teachers is much smaller for whites than for the other demographic groups.
Figure 2 illustrates the dramatic increase over time in the share of teachers who lack full
certification.15 In contrast to the percentage of teachers with no experience, the percentage
without full certification does remain far higher than pre-CSR values in 2001. In high-poverty
schools, more than one quarter of blacks, one fifth of Hispanics, and ten percent of whites and
Asians have teachers who lack full certification more than five years following the
implementation of CSR.

Jepsen and Rivkin
17
The persistence of the increases in the share of teachers lacking full certification despite
the decline in the share with no experience indicates that teachers lacking full certification are
remaining in the schools for more than one year. Whether this reflects a longer-term decline in
teacher quality depends upon the inter-relationship among experience, certification, and quality.
An important limitation of these tables and figures as descriptors of the changes in
teacher quality experienced by California schools is the fact that experience, certification, and
other easily-quantified measures of quality appear to explain little of the actual quality variation
in terms of value added to achievement (Rivkin, Hanushek, and Kain, 2005). Of particular
relevance to the question of a CSR-induced quality change is the extent to which the need to hire
so many teachers in a short period of time led to a decline in the quality of entire cohorts that
would persist throughout their careers given the infrequency of tenure denial and shortages of
certified teachers in many schools. We attempt to provide some evidence on this issue by
investigating the relationship between entering teacher cohort size and quality in the empirical
analysis.
VI. Class Size, Teacher Characteristics, and Student Achievement
This section reports the results from the analysis of average mathematics and reading
achievement. We begin with difference-in-differences models to facilitate comparisons with
previous evaluations of CSR. Next we present a series of fixed effect estimates that differ
according to the parameterization of the teacher characteristics and the types of interactions with
demographic variables. The final set of results investigates the link between achievement and the
size of entering teacher cohorts. All specifications fully interact grade with class size but not the
teacher characteristics based on prior research and preliminary work.16 Unless otherwise

Jepsen and Rivkin
18
indicated, all regression specifications include separate coefficients by grade for the percentages
of black, Hispanic, Asian, and LEP students, as well as full sets of grade-by- year dummies
(percent subsidized lunch is only available at the school level). Robust standard errors are
clustered at the school level to account for correlations among the errors.
VI.A. Difference-in-Difference Results
Table 2 reports estimates of the effects of CSR on mathematics and reading achievement
that are identified by differences in the timing of CSR adoption. The difference in differences
specification reported in Columns 1 and 3 compares the difference in third- and fifth-grade
achievement in 1997 for schools that had implemented CSR as of 1997 (early adopters) and
those that reduced class size in 1998 or 1999 (late adopters), so the estimated benefit of CSR is
the negative of the third-grade*late-adopter interaction coefficient. This model assumes that the
difference between third- and fifth-grade achievement in late-adopting schools provides a valid
counterfactual for the early adopters.
The difference in difference in differences (DDD) specification reported in Columns 2
and 4 compares the difference in the difference in third- and fifth-grade achievement between
1997 and 1999 for early and late adopters, so the estimated benefit of CSR is the third-grade *
late-adopter * 1999 interaction coefficient. This model assumes that the 1997-1999 difference in
the difference between third- and fifth-grade achievement in early-adopting schools provides a
valid counterfactual for the late adopters.
The results are quite similar for the two models, showing that the implementation of CSR
increased achievement by roughly 0.09 standard deviations in mathematics and 0.05 standard
deviations in reading in both early- and late-adopting schools. The finding that different models
yield similar estimates provides support for the notion that CSR raised achievement, but there is

Jepsen and Rivkin
19
reason to be cautious about the interpretation since both specifications depend on the assumption
that CSR adoption did not affect fifth-grade achievement. If movement of teachers out of fifth
grade to one of the CSR grades increased the share of fifth-grade teachers without experience or
full certification, neither of the estimates would capture the effect of CSR on third-grade
achievement. Rather, they would capture the effects of CSR on the difference between third- and
fifth-grade achievement, likely overestimating the benefit of smaller classes in third grade.
VI.B. Fixed Effect Results
We now turn to results from our preferred fixed effects model that does not rely on the
strong assumptions underlying the difference in differences approaches. Table 3 reports the
estimated effects of class size and teacher characteristics on mathematics and reading
achievement for five specifications based on Equations (1) and (2) that differ according to the
included covariates and fixed effects. Columns 1 and 6 include school fixed effects; columns 2
and 7 include school-by-grade fixed effects; columns 3 and 8 contain school-by-year fixed
effects; and columns 4, 5, 9, and 10 include both school-by-grade and school-by-year fixed
effects. All specifications except for columns 5 and 10 include a full set of student demographic
variables.
The estimated effects of class size on mathematics and reading achievement are negative
and highly significant across the board, although effect magnitudes vary slightly by specification.
Consistent with prior work, the class size effect appears to be somewhat larger for mathematics
than for reading. Neither of the subjects exhibits a monotonic pattern by grade.
In our preferred full fixed effect specification (columns 4 and 9), a ten-student reduction
in class size is associated with higher scores of 0.054 to 0.095 standard deviations in
mathematics and 0.033 to 0.0056 standard deviations in reading. Despite the fact that these

Jepsen and Rivkin
20
estimates come from specifications that hold teacher characteristics constant, the magnitude of
the third-grade class size coefficient is only slightly larger in mathematics and smaller in reading
than the overall CSR effects (the combined effects of smaller classes and changes in teacher
characteristics) reported in the difference-in-difference models in Table 2. This is consistent with
the belief that CSR induced teacher movements from non-CSR to CSR grades reduced fifth-
grade achievement which inflated the DD and DDD estimates of the benefits of CSR.
Differences in test instruments, aggregation level of data, grades covered, and other
factors cloud comparisons of the magnitude of class size effects with those found in other
studies. In general, our estimates are somewhat smaller than those found for Israel, Tennessee,
and Texas even though our estimates are measured at a more aggregate level (grade) than most
previous work (classroom or student).17 The estimates in Angrist and Lavy (1999) suggest that a
ten student reduction in class size would increase achievement by at least 0.17 standard
deviations in fifth grade in Israel, while the estimates in Krueger (1999) indicate that the
approximately seven fewer students in the smaller classes raised test scores by 0.20 standard
deviations in kindergarten in Tennessee (estimates for higher grades capture cumulative effects).
Finally, the estimates reported in Rivkin, Hanushek, and Kain (2005) suggest that a ten student
reduction in class size would raise fourth-grade mathematics and reading achievement in Texas
by roughly 0.1 standard deviations. One possibility is that difficulties expanding the number of
classrooms dampened the benefits of CSR, while another is that an increase of the share of
students in multi-grade classrooms offset some of the benefits of CSR (Sims, 2003).
Table 3 also reveals significant effects of teacher experience and certification on
achievement. Based on effect magnitudes for the full fixed effect model (columns 4 and 9), the
penalty in terms of mathematics achievement for having a first-year teacher is slightly larger than

Jepsen and Rivkin
21
the benefit from a ten-student reduction in class size in third grade and over 60 percent larger
than the benefit in second and fourth grade, whereas the cost of a having a second-year teacher is
roughly one fifth as large.18 In reading, the disadvantage from having a first-year teacher slightly
exceeds the benefit from a ten-student reduction in the second grade and is roughly twice as high
in grades 3 and 4. The costs of a second-year teacher are less than half as large. Although
significant, differences by certification status are smaller: the average performance deficit for
teachers without full certification is roughly one third of that of first-year teachers in reading and
around forty percent of that of first-year teachers in mathematics.
A crucial question is whether these estimates actually capture causal effects, a question
for which there is no direct test. However, telling evidence can be brought to bear, and in this
case the evidence strongly supports the validity of the empirical approach. First, comparisons of
the last two columns for each outcome reveal that that the coefficients remain virtually
unchanged following the exclusion of a set of student demographic variables that are strongly
related to achievement (Appendix Table 3 reports the coefficients for these demographic
characteristics). Second, evidence from Texas micro-data (not reported) shows that the class size
and teacher characteristic estimates are not sensitive at all to the inclusion of controls for student
school switches and average turnover despite the significant effects of these variables on
achievement.19 This is important because student turnover provides one source of cohort
variation in class size. Of course, there may be other confounding factors, but they would have to
vary systematically by school, grade, and year and be weakly correlated with, if not orthogonal
to, both student turnover and a set of highly significant demographic variables.
VI.C. A Closer Look at Certification Effects

Jepsen and Rivkin
22
The extent to which the certification differential results from inferior pre-service training,
less experience, or a weaker academic background influences the long-run impact of hiring a
substantial number of teachers lacking full certification. Although classroom experience and
additional coursework can dissipate the adverse effects of inexperience and limited pre-service
training, a weaker academic background and skill level is not so easily remedied.
Longitudinal data on teachers would permit the decomposition of the gap into fixed
differences between certified and not fully certified teachers and differences that diminish with
experience. Unfortunately, such data are not available for this study. Instead, we use the repeated
cross-sections to investigate whether the certification differential declines with experience. A key
deficiency of this approach is that higher returns to experience for teachers lacking full
certification, higher attrition among lower quality teachers lacking full certification, the
acquisition of full certification for some teachers initially lacking full certification, and
combinations of the above would all produce a certification differential that diminishes with
experience.20 Nonetheless, the new teacher certification gap and changes in the gap with
experience do provide some evidence on the dynamics of the certification differential.
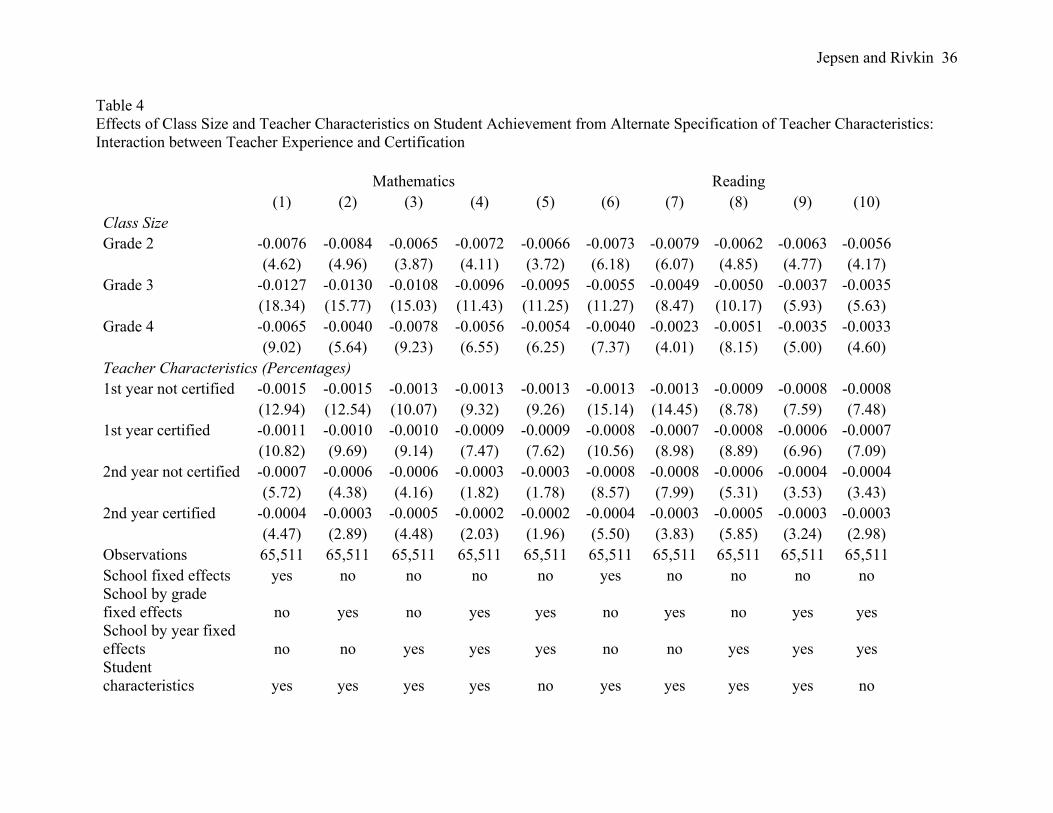
Table 4 reports the estimated effects of having a new and a second-year teacher with full
certification and a new and a second-year teacher without full certification. The estimates show
that the gap between certified and not fully certified teachers declines between the first and
second years, despite the fact that many teachers become certified between their first and second
years (authors’ calculations based on CDE data).21 The finding of a larger certification gap in the
first year is consistent with the notion that teachers lacking certification are less well prepared,
but it is also consistent with the belief that those lacking full certification initially have inferior
backgrounds and skills that are not fixed easily by experience and that differences in the rate of
Jepsen and Rivkin
23
attrition out of teaching and in the probability of becoming certified cause the gap to decline with
experience. Additional information is needed to differentiate among these various explanations.
VI.D. Differential Effects by Student Demographic Characteristics
Krueger (1999) notes that a number of studies, including the Tennessee STAR
experiment, find that class size and teacher experience effects are larger for nonwhite and low-
income students, and we investigate this possibility by interacting class size and the teacher
characteristics with the black enrollment share.22 Models with interactions between percent
Asian or percent Hispanic and class size and teacher characteristics yielded generally
insignificant interaction effects, and the results are not reported.
Table 5 presents coefficients for full fixed effect specifications that separate first- and
second-year teachers by certification level and add interaction terms between percent black and
both class size and teacher characteristics. In contrast to other work, we find little systematic
evidence of black-white differences in class size effects and only small differences in teacher
characteristic effects. All coefficients on the class size interaction terms are insignificant, while
the coefficient on the interaction between percent black and percent first-year uncertified
teachers is negative and significant (at the ten-percent level) for both mathematics and reading.
VI.E. Cohort Size and Teacher Quality
As noted earlier there is strong evidence that observed characteristics including
experience and certification explain little of the variation in teacher effectiveness. Consequently
these measures may fail to capture fully the quality decline that accompanied the implementation
of CSR. Given the evidence that salaries fell relative to the earnings of young female college
graduates, if the supply of teacher quality is not perfectly elastic one would expect the sharp
Jepsen and Rivkin
24
increase in the number of newly hired teachers to have reduced the average quality of new hires
relative to previous cohorts. A certification indicator will not capture this change as long as there
is quality variation among non-certified teachers or schools do not always prefer a fully certified
applicant to an applicant lacking full certification. Moreover, this quality gap might not be
eliminated over time given the apparently low tenure threshold.
This section uses differences in the size of entering teacher cohorts to estimate the
elasticity of the quality of instruction with respect to the number of teachers hired. In most labor
market analyses, it is quite difficult to separate changes in cohort quality from changes in labor
supply, because both lead to changes in average wages. However, in this case we can use
achievement data to estimate changes in cohort quality directly. Specifically, we test whether the
effects of teacher experience and certification on achievement varied across years, as schools
often filled their CSR-induced teaching positions with inexperienced and uncertified teachers.
Although the largest CSR-induced changes in the work force predate this analysis, we can use
any observed link between cohort size and the quality of new entrants to estimate the effects of
the earlier expansion.
Table 6 reports coefficients from full fixed effect specifications that fully interact the
proportions of certified and uncertified teachers with zero years of prior experience with year
dummies. Although experience interactions with entering cohort size (reported in the table)
rather than the year dummies would produce a more parsimonious specification, the imposition
of a linear relationship is a strong assumption that is not imposed in this model.
The results reveal little systematic relationship between cohort size and teacher quality
(as measured by effect on student achievement). If anything, both the mathematics and reading
estimates suggest that the quality of not fully certified first-year teachers is worse in 2001 (the

Jepsen and Rivkin
25
smallest teacher cohort) than in 1997 (the largest). And there is no systematic pattern whatsoever
for new teachers with full certification. In either case, we cannot reject the hypothesis of no
difference in experience effects for either fully certified or not fully certified teachers at
conventional levels, an identical result to the simple interaction with entering cohort size (not
reported).23
One potential problem with the analysis presented in Table 6 is that schools exert some
discretion in hiring regarding certification. Consequently we also estimate models that group
both certified and non-certified teachers together and ignore differences in certification. The
results from these models (not reported) also show no strong relationship between cohort size
and teacher quality, especially for first-year teachers. As in Table 6, we cannot reject the
hypotheses that the interaction terms for first-year teachers are jointly zero or that the interaction
terms for second-year teachers are jointly zero.
VI.F. Simulated Class Size and Teacher Characteristics Effects
The findings in Tables 2 through 6 indicate that some of the benefits of CSR were offset
by increases in the shares of inexperienced or not-fully-certified teachers. Because of systematic
variation by demographic group in the magnitudes of such increases, the benefits of CSR were
not distributed evenly throughout the state. In this section we simulate the short and longer term
benefits of CSR for various demographic groups by combining the estimated coefficients from
the mathematics and reading full fixed effect specifications reported in Table 3 with the actual
changes in class size, teacher experience, and teacher certification observed in California over
the time period of the study.
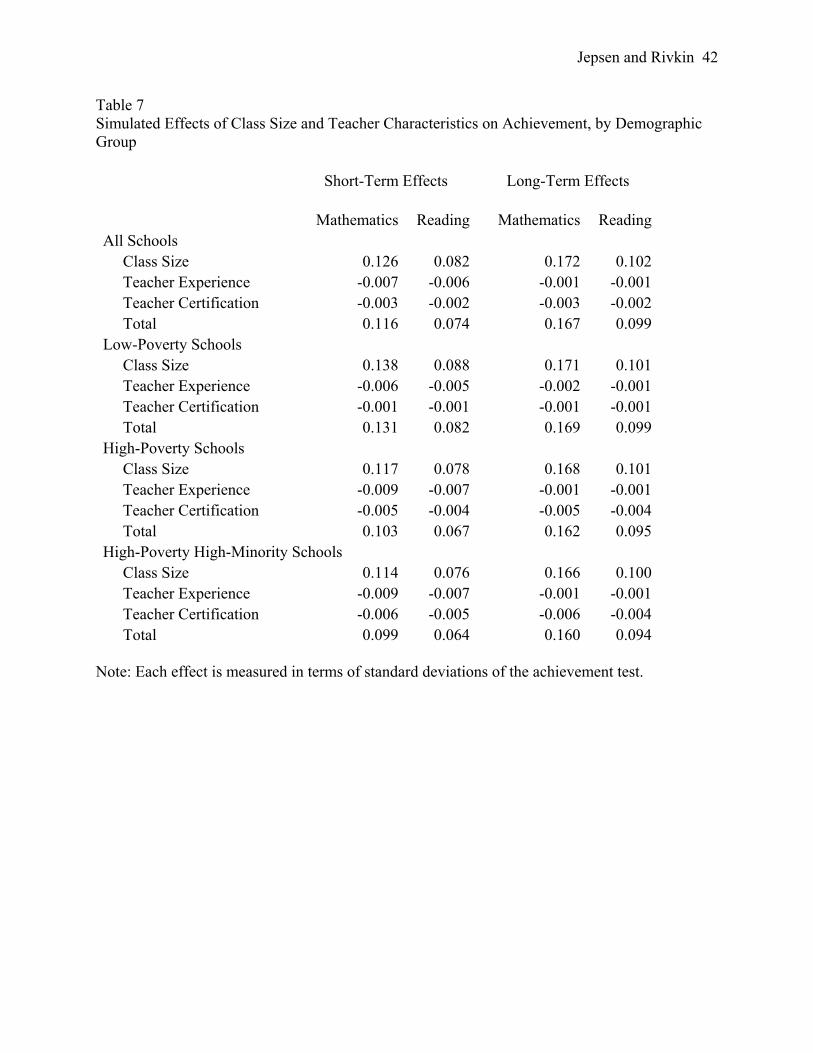
Table 7 presents the results of this simulation exercise. The first two columns report the
short-term effects of CSR on achievement based on the changes between 1995 and 1997 in class

Jepsen and Rivkin
26
size, teacher experience, and teacher certification, and the last two columns report the long-term
effects based on the changes between 1995 and 2001. The top panel shows the effects for the all
schools combined, the second panel for low-poverty schools (less than 25 percent receiving
subsidized lunch), the third panel for high-poverty schools (more than 75 percent receiving
subsidized lunch), and the fourth panel for high-poverty, high-minority-enrollment schools (more
than 75 percent receiving subsidized lunch and more than 75 percent black and/or Hispanic). The
differences in simulated achievement for each group come solely from differences in class size
and teacher characteristics as effect sizes are restricted to be constant across demographic groups
based on the findings reported in Table 5. Using the notation from Equation (1),
(3) TCSA ∆+∆=∆ λδ ˆˆˆ .
Note that CS contains class size in second, third, and fourth grade and T contains the percentage
of teachers in their first year of teaching, the percentage of teachers in their second year of
teaching, and the percentage of teachers without full certification.
Overall, the simulated CSR effect on achievement is noticeably larger in the long run
than in the short run, as many schools had not fully implemented CSR by 1997. Regardless, the
class size effect swamps the offsetting effects caused by changes in the teacher characteristics.
For the state as a whole, the average short-run benefit is 0.116 standard deviations in
mathematics and 0.074 standard deviations in reading, compared to long-run effects of 0.167
standard deviations in mathematics and 0.099 standard deviations in reading.
Not surprisingly given the observed changes in teacher characteristics and slower
program take-up in higher poverty schools, the benefits are larger in low-poverty than in high-
poverty schools. Importantly, however, such gaps shrink over time: the difference is roughly 20
percent in the short run but only around four percent in the longer run as high-poverty school

Jepsen and Rivkin
27
implementation rates rise and the share of new teachers declines from its high level immediately
following the passage of CSR. Even the 20-24 percent differential between high poverty, high
minority schools and low poverty schools in the estimated benefit of CSR for the period
immediately following statewide implementation declines to roughly five percent in only four
more years. Thus although the typical higher poverty, high minority enrollment school was
slower to adopt the program and appears to have suffered more adverse changes to the teaching
force, there is little evidence that major differences in the benefits of CSR by demographic
characteristics persisted beyond the initial implementation years.
VII. Summary and Policy Implications
In this study we investigated the direct and indirect effects of California’s Class Size
Reduction program. CSR reduced class size across the state and led to a short term increase in
the share of teachers lacking experience and a persistent increase in the share of teachers lacking
full certification, both of which were larger in higher poverty, higher minority enrollment
schools. This raised the possibility that the program benefits would be tilted toward higher
income communities, but the results suggest that any meaningful differences in the effects of
CSR by income were limited to the years immediately following implementation when there was
a spike in the share of teachers with no prior experience. There is little or no evidence of
differential class size effects by student demographic characteristics and although significant,
only a small teacher quality differential by certification status. Moreover, there is little or no
support for the hypotheses that the need to hire large numbers of teachers following the adoption
of CSR led to a lasting reduction in the quality of instruction.
Overall, the findings suggest that CSR increased achievement in the early grades for all
demographic groups, and an important question is whether the benefits justify the substantial

Jepsen and Rivkin
28
cost. Clearly this type of targeted state spending limits the flexibility of schools and districts in
allocating resources and responding to changes in operating budgets, though the cost of this
constraint in terms of lower quality depends on the degree of inefficiency in unconstrained
district choices and voter willingness to finance schools with fewer limits on the use of
resources. From a purely distributional point of view, the benefits of CSR were allocated in a
quite regressive manner in the short term but in a close to neutral manner as of six years
following the implementation of the policy.

Jepsen and Rivkin
29
References
Angrist, Joshua, and Victor Lavy. 1999. “Using Maimonides’ Rule to Estimate the Effect of Class Size on Scholastic Achievement.” Quarterly Journal of Economics 114(2): 533-76.
Ballou, Dale, and Michael Podrusky. 1997. Teacher Pay and Teacher Quality. Kalamazoo, MI: The Upjohn Institute.
Bohrnstedt, George, and Brian Stecher, eds. 1999. Class Size Reduction in California: Early Evaluation Findings, 1996-1998. Palo Alto, CA: American Institutes for Research.
Boyd, Don, Hamilton Lankford, Susanna Loeb, and James Wyckoff. 2003. “Analyzing the Determinants of the Matching of Public School Teachers to Jobs.” National Bureau of Economic Research Working Paper Number 9878.
Ehrenberg, Ronald, Dominic Brewer, Adam Gamoran, and J. Douglas Willms. 2001. “Class Size and Student Achievement.” Psychological Science in the Public Interest 2(1): 1-30.
Hanushek, Eric. 1999. “Some Findings from an Independent Investigation of the Tennessee STAR Experiment and from Other Investigations of Class Size Effects.” Educational Evaluation and Policy Analysis 21(2): 143-64.
Hanushek, Eric, John Kain, and Seven Rivkin. 2004. “Disruption versus Tiebout Improvement: The Costs and Benefits of Switching Schools.” Journal of Public Economics 88(9-10): 1721-46.
Hoxby, Caroline Minter. 2000. “The Effects of Class Size on Student Achievement: New Evidence from Population Variation.” Quarterly Journal of Economics 115(4): 1239-86.
Jepsen, Christopher, and Steven Rivkin. 2002. Class Size Reduction, Teacher Quality, and Academic Achievement in California Elementary Public Schools. San Francisco, CA: Public Policy Institute of California.
Krueger, Alan. 1999. “Experimental Estimates of Education Production Functions.” Quarterly Journal of Economics 114(2): 497-532.
Krueger, Alan, and Diane Whitmore. 2001. “The Effect of Attending a Small Class in the Early Grades on College Test-Taking and Middle School Test Results: Evidence from Project STAR.” The Economic Journal 111(1): 1-28.
Rivkin, Steven. 2006. “Cumulative Nature of Learning and Specification Bias in Education Research.” Unpublished manuscript.
Rivkin, Steven G., Eric A. Hanushek, and John F. Kain. 2005. “Teachers, Schools, and Academic Achievement.” Econometrica 73(2): 417-58.
Ross, Randy. 1999. “How Class-Size Reduction Harms Kids in Poor Neighborhoods.” Education Week, May 26.

Jepsen and Rivkin
30
Sims, David. 2003. “How Flexible is Educational Production? Combination Classes and Class Size Reduction in California.” Unpublished manuscript.
Stecher, Brian, and George Bohrnstedt, eds. 2000. Class Size Reduction in California: The 1998-1999 Evaluation Findings. Sacramento, CA: California Department of Education.
__________. 2002. What Have We Learned about Class Size Reduction in California? Sacramento, CA: California Department of Education.
Todd, Petra, and Kenneth I. Wolpin. 2003. “On the Specification and Estimation of the Production Function for Cognitive Achievement.” Economic Journal 113(485): F3-F33.
Unlu, Fatih. 2005. “California Class Size Reduction Reform: New Findings from the NAEP.” Unpublished manuscript.

Jepsen and Rivkin
31
Table 1 Descriptive Statistics
All
years 1997 1998 1999 2000 2001 Average test scores Math test 602.04 589.01 596.33 603.98 608.39 611.81 (29.70) (29.27) (28.54) (28.75) (28.40) (27.77) Reading test 606.27 597.54 602.49 607.18 610.90 612.81 (32.32) (33.46) (32.34) (31.87) (31.09) (30.47) Class size Overall 22.89 24.03 22.99 22.70 22.44 22.32 (5.30) (5.48) (5.31) (5.27) (5.15) (5.13) 2nd grade 18.74 19.07 18.79 18.74 18.57 18.54 (1.58) (2.34) (1.34) (1.19) (1.30) (1.43) 3rd grade 20.11 23.01 20.20 19.45 19.08 18.92 (3.64) (5.09) (3.74) (2.83) (2.10) (1.92) 4th grade 28.89 29.11 29.04 29.02 28.74 28.58 (3.10) (3.04) (3.00) (3.14) (3.06) (3.23) Teacher characteristics Pct 1st year uncertified 4.19 6.27 5.09 3.98 2.98 2.73 (11.20) (14.21) (12.20) (10.64) (9.22) (8.54) Pct 1st year certified 4.40 5.83 4.57 3.78 4.29 3.58 (11.81) (14.05) (11.89) (10.69) (11.62) (10.41) Pct 2nd year uncertified 3.36 2.88 4.46 3.97 2.65 2.84 (9.73) (9.37) (11.19) (10.31) (8.87) (8.58) Pct 2nd year certified 5.41 6.67 6.64 4.99 4.43 4.40 (12.75) (14.49) (14.07) (12.05) (11.40) (11.27) Pct 1st year 8.73 12.25 9.72 7.77 7.78 6.32 (16.09) (19.34) (16.75) (14.86) (14.87) (13.54) Pct 2nd year 8.85 9.61 11.12 8.99 7.39 7.23 (15.63) (16.67) (17.31) (15.55) (14.20) (13.86) Pct 3+ years 82.42 78.14 79.16 83.25 84.84 86.45 (22.21) (24.42) (23.67) (21.46) (20.66) (19.42) Pct not credentialed 12.69 12.19 13.65 13.94 11.83 11.83 (20.54) (20.43) (21.14) (21.46) (19.86) (19.66) Student demographics Percent black 8.69 9.29 9.09 8.61 8.35 8.17 (12.46) (13.27) (13.08) (12.31) (11.94) (11.64) Percent Hispanic 45.33 43.18 43.98 45.18 46.49 47.67 (30.11) (29.59) (29.85) (30.11) (30.34) (30.40) Percent Asian 10.76 10.56 10.56 10.70 10.86 11.10

Jepsen and Rivkin
32
(13.84) (13.38) (13.52) (13.76) (14.08) (14.40) Percent LEP 31.12 31.31 28.46 31.81 31.73 32.25 (25.34) (26.03) (23.99) (25.89) (25.48) (25.08) School percent free lunch 55.28 56.12 55.64 55.09 54.63 54.98 (31.02) (30.70) (30.96) (31.11) (31.22) (31.07) Observations 65,511 12,648 13,063 13,194 13,318 13,288
Note: Standard errors are in parentheses.

Jepsen and Rivkin
33
Table 2 Overall Effect of CSR on Student Achievement in Third and Fifth Grades Difference in Difference Estimators Mathematics Reading (1) (2) (3) (4) Late adopter * grade 3 -0.092 -0.090 -0.052 -0.053 (5.02) (4.84) (3.50) (3.34) Late adopter -0.053 -0.051 -0.046 -0.052 (4.07) (3.87) (4.38) (4.62) Late adopter * year 1999 0.084 0.057 * grade 3 (3.29) (2.63) Late adopter * year 1999 0.007 0.006 (0.36) (0.39) Year 1999 * grade 3 0.189 0.168 (10.81) (11.27) Year 1999 0.276 0.112 (22.03) (10.54) Grade 3 -1.401 -1.373 -1.131 -1.118 (59.55) (72.40) (59.42) (69.25) Years 97 97,99 97 97,99 Observations 6,947 14,255 6,946 14,254
Note: Absolute values of t-statistics are in parentheses.

Jepsen and Rivkin
34
Table 3 Effects of Class Size, Teacher Experience, and Teacher Certification on Student Achievement Mathematics Reading (1) (2) (3) (4) (5) (6) (7) (8) (9) (10) Class Size Grade 2 -0.0076 -0.0085 -0.0065 -0.0072 -0.0066 -0.0074 -0.0081 -0.0061 -0.0063 -0.0056 (4.66) (5.02) (3.85) (4.11) (3.72) (6.26) (6.18) (4.83) (4.76) (4.17) Grade 3 -0.0127 -0.0131 -0.0107 -0.0096 -0.0095 -0.0055 -0.0050 -0.0050 -0.0037 -0.0035 (18.36) (15.84) (15.00) (11.45) (11.26) (11.31) (8.59) (10.14) (5.93) (5.63) Grade 4 -0.0065 -0.0040 -0.0078 -0.0056 -0.0054 -0.0040 -0.0023 -0.0051 -0.0035 -0.0033 (9.02) (5.64) (9.24) (6.54) (6.24) (7.36) (4.02) (8.16) (5.00) (4.60) Teacher Characteristics (Percentages) First year -0.0012 -0.0012 -0.0011 -0.0010 -0.0010 -0.0009 -0.0009 -0.0008 -0.0007 -0.0007 (14.26) (13.37) (11.36) (9.78) (9.80) (15.14) (13.71) (10.54) (8.50) (8.48) Second year -0.0005 -0.0003 -0.0004 -0.0002 -0.0002 -0.0005 -0.0004 -0.0005 -0.0003 -0.0003 (5.74) (3.99) (4.77) (1.86) (1.83) (7.63) (6.07) (6.62) (3.73) (3.47) Not certified -0.0003 -0.0003 -0.0003 -0.0003 -0.0003 -0.0003 -0.0003 -0.0002 -0.0002 -0.0002 (2.77) (2.69) (2.80) (2.71) (2.72) (3.63) (3.89) (2.61) (2.65) (2.77) Observations 65,511 65,511 65,511 65,511 65,511 65,511 65,511 65,511 65,511 65,511 School fixed effects yes no no no no yes no no no no
School by grade fixed effects no yes no yes yes no yes no yes yes
School by year fixed effects no No yes yes yes no no yes yes yes
Student characteristics yes Yes yes yes no yes yes yes yes no
Notes: Absolute values of t-statistics are in parentheses. The dependent variable is the average test score in that subject. Student
characteristics include percent black, percent Hispanic, percent Asian, percent LEP, and (columns 1, 2, 6, and 7) school percent

Jepsen and Rivkin
35
subsidized lunch. All columns include cohort-by-year fixed effects. Regressions are weighted by average school enrollment for 1997-
2001. Each column represents a separate regression.
Jepsen and Rivkin
36
Table 4 Effects of Class Size and Teacher Characteristics on Student Achievement from Alternate Specification of Teacher Characteristics: Interaction between Teacher Experience and Certification Mathematics Reading (1) (2) (3) (4) (5) (6) (7) (8) (9) (10) Class Size Grade 2 -0.0076 -0.0084 -0.0065 -0.0072 -0.0066 -0.0073 -0.0079 -0.0062 -0.0063 -0.0056 (4.62) (4.96) (3.87) (4.11) (3.72) (6.18) (6.07) (4.85) (4.77) (4.17) Grade 3 -0.0127 -0.0130 -0.0108 -0.0096 -0.0095 -0.0055 -0.0049 -0.0050 -0.0037 -0.0035 (18.34) (15.77) (15.03) (11.43) (11.25) (11.27) (8.47) (10.17) (5.93) (5.63) Grade 4 -0.0065 -0.0040 -0.0078 -0.0056 -0.0054 -0.0040 -0.0023 -0.0051 -0.0035 -0.0033 (9.02) (5.64) (9.23) (6.55) (6.25) (7.37) (4.01) (8.15) (5.00) (4.60) Teacher Characteristics (Percentages) 1st year not certified -0.0015 -0.0015 -0.0013 -0.0013 -0.0013 -0.0013 -0.0013 -0.0009 -0.0008 -0.0008 (12.94) (12.54) (10.07) (9.32) (9.26) (15.14) (14.45) (8.78) (7.59) (7.48) 1st year certified -0.0011 -0.0010 -0.0010 -0.0009 -0.0009 -0.0008 -0.0007 -0.0008 -0.0006 -0.0007 (10.82) (9.69) (9.14) (7.47) (7.62) (10.56) (8.98) (8.89) (6.96) (7.09) 2nd year not certified -0.0007 -0.0006 -0.0006 -0.0003 -0.0003 -0.0008 -0.0008 -0.0006 -0.0004 -0.0004 (5.72) (4.38) (4.16) (1.82) (1.78) (8.57) (7.99) (5.31) (3.53) (3.43) 2nd year certified -0.0004 -0.0003 -0.0005 -0.0002 -0.0002 -0.0004 -0.0003 -0.0005 -0.0003 -0.0003 (4.47) (2.89) (4.48) (2.03) (1.96) (5.50) (3.83) (5.85) (3.24) (2.98) Observations 65,511 65,511 65,511 65,511 65,511 65,511 65,511 65,511 65,511 65,511 School fixed effects yes no no no no yes no no no no School by grade fixed effects no yes no yes yes no yes no yes yes School by year fixed effects no no yes yes yes no no yes yes yes Student characteristics yes yes yes yes no yes yes yes yes no

Jepsen and Rivkin
37
Notes: Absolute values of t-statistics are in parentheses. The dependent variable is the average test score in that subject. Student
characteristics include percent black, percent Hispanic, percent Asian, percent LEP, and (columns 1, 2, 6, and 7) school percent
subsidized lunch. All columns include cohort-by-year fixed effects. Regressions are weighted by average school enrollment for 1997-
2001. Each column represents a separate regression.

Jepsen and Rivkin
38
Table 5 Effects of Class Size and Teacher Characteristics on Student Achievement from Alternate Specification Containing Interactions between Teacher Experience and Certification, Allowing These Effects to Vary by Black Enrollment Share Mathematics Reading Class Size Grade 2 -0.0072 -0.0066 (3.56) (4.34) Grade 3 -0.0104 -0.0041 (10.75) (5.73) Grade 4 -0.0058 -0.0035 (5.56) (4.12) Grade 2 * Pct Black -0.000002 0.00003 (0.01) (0.23) Grade 3 * Pct Black 0.0001 0.0001 (1.40) (1.00) Grade 4 * Pct Black 0.00002 8.3E-09 (0.27) (0.0001) Teacher Characteristics Pct 1st year not certified -0.0011 -0.0007 (6.58) (4.92) Pct 1st year certified -0.0009 -0.0006 (5.99) (4.88) Pct 2nd year not certified -0.0002 -0.0003 (0.93) (1.84) Pct 2nd year certified -0.0002 -0.0002 (1.43) (1.55) Pct 1st year not certified * Pct Black -0.00002 -0.00002 (1.83) (2.20) Pct 1st year certified * Pct Black -0.000003 -0.00001 (0.28) (1.40) Pct 2nd year not certified * Pct Black -0.00001 -0.00001 (1.11) (1.76) Pct 2nd year certified * Pct Black -0.000004 -0.00001 (0.40) (1.59) Observations 65,511 65,511 School fixed effects no no School by grade fixed effects yes yes School by year fixed effects yes yes Student characteristics yes yes

Jepsen and Rivkin
39
Notes: Absolute values of t-statistics are in parentheses. The dependent variable is the average
test score in that subject. All regressions include percent black, percent Hispanic, percent Asian,
percent LEP, and cohort-by-year fixed effects. Regressions are weighted by average school
enrollment for 1997-2001. Each column represents a separate regression.

Jepsen and Rivkin
40
Table 6 Effects of Teacher Quality on Student Achievement, Measuring Teacher Quality by Cohort Size of New Certified and Uncertified Teachers
Mathematics Reading Number of
TeachersNot Certified -0.0012 -0.0010 (4.71) (4.53) Not Certified, 1998 -0.00004 0.0004 2,763 (0.10) (1.34) Not Certified, 1999 -0.0002 0.0004 2,232 (0.53) (1.18) Not Certified, 2000 0.0001 0.0001 1,772 (0.11) (0.38) Not Certified, 2001 -0.0003 -0.0002 1,634 (0.67) (0.41) Certified -0.0005 -0.0004 (2.25) (2.15) Certified, 1998 -0.0006 -0.0004 2,453 (1.77) (1.56) Certified, 1999 -0.0004 -0.0005 2,104 (1.10) (1.83) Certified, 2000 -0.0005 -0.0002 2,445 (1.47) (0.63) Certified, 2001 -0.0005 -0.0003 2,079 (1.42) (1.16) Observations 65,511 65,511 School by grade fixed effects yes yes School by year fixed effects yes yes Student characteristics yes yes
Notes: Absolute values of t-statistics are in parentheses. The dependent variable is the average
test score in that subject. All regressions include class size by grade, percent of second-year
teachers by certification status and year, percent black, percent Hispanic, percent Asian, percent
LEP, school percent subsidized lunch, and cohort by year fixed effects. Regressions are
weighted by average school enrollment for 1997-2001. Each column represents a separate
regression. The number of teachers refers to the number of second- through fourth-grade
teachers in that experience and certification category for that year.

Jepsen and Rivkin
41
Jepsen and Rivkin
42
Table 7 Simulated Effects of Class Size and Teacher Characteristics on Achievement, by Demographic Group Short-Term Effects Long-Term Effects Mathematics Reading Mathematics Reading All Schools Class Size 0.126 0.082 0.172 0.102 Teacher Experience -0.007 -0.006 -0.001 -0.001 Teacher Certification -0.003 -0.002 -0.003 -0.002 Total 0.116 0.074 0.167 0.099 Low-Poverty Schools Class Size 0.138 0.088 0.171 0.101 Teacher Experience -0.006 -0.005 -0.002 -0.001 Teacher Certification -0.001 -0.001 -0.001 -0.001 Total 0.131 0.082 0.169 0.099 High-Poverty Schools Class Size 0.117 0.078 0.168 0.101 Teacher Experience -0.009 -0.007 -0.001 -0.001 Teacher Certification -0.005 -0.004 -0.005 -0.004 Total 0.103 0.067 0.162 0.095 High-Poverty High-Minority Schools Class Size 0.114 0.076 0.166 0.100 Teacher Experience -0.009 -0.007 -0.001 -0.001 Teacher Certification -0.006 -0.005 -0.006 -0.004 Total 0.099 0.064 0.160 0.094
Note: Each effect is measured in terms of standard deviations of the achievement test.

Jepsen and Rivkin
43
Appendix Table 1 Variance Decomposition by Grade and CSR Status Overall Variance by Grade and CSR Status Grade 2 Grade 3 In CSR 1.47 1.29 [n=21,081] [n=18,488] Not in CSR 11.42 14.71 [n=821] [n=3,665] All Schools 2.49 12.41 [n= 21,902] [n=22,153]
Within-school Variance by Grade and CSR Status Grade 2 Grade 3 Always Participated in CSR 1.46 1.35 [n=18,536] [n=11,055] Sometimes Participated in CSR 6.93 18.27 [n=3,344] [n=10,643] Never Participated in CSR 12.71 7.09 [n=22] [n=455] All Schools 2.49 12.41 [n=21,902] [n=22,153]

Jepsen and Rivkin
44
Appendix Table 2 Within-cohort Correlation in Class Size and Teacher Characteristics Controlling for School-by-year and School-by-grade Fixed Effects Class Size Grade 1 Grade 2 Grade 3 Grade 4 Grade 1 1 Grade 2 0.2426 1 Grade 3 0.1143 0.2271 1 Grade 4 -0.0619 -0.0934 0.0087 1 Percent First-Year Teachers Grade 1 Grade 2 Grade 3 Grade 4 Grade 1 1 Grade 2 0.0260 1 Grade 3 0.0475 0.0471 1 Grade 4 0.0766 0.0924 0.1226 1 Percent Second-Year Teachers Grade 1 Grade 2 Grade 3 Grade 4 Grade 1 1 Grade 2 0.0312 1 Grade 3 0.0422 0.0614 1 Grade 4 0.0577 0.0801 0.1263 1 Percent Not Certified Grade 1 Grade 2 Grade 3 Grade 4 Grade 1 1 Grade 2 0.0318 1 Grade 3 0.0266 0.0166 1 Grade 4 0.0998 0.125 0.0585 1

Jepsen and Rivkin
45
Appendix Table 3 Student Demographic Coefficients from Table 3: Effects of Class Size, Teacher Experience, and Teacher Certification on Student Achievement Mathematics Reading (1) (2) (3) (4) (6) (7) (8) (9) Student Demographics Percent black - grade 2 -0.0074 -0.0071 -0.0066 -0.0061 -0.0075 -0.0082 -0.0041 -0.0056 (12.59) (7.46) (11.53) (6.30) (15.63) (10.48) (8.82) (7.31) Percent black - grade 3 -0.0084 -0.0090 -0.0082 -0.0087 -0.0095 -0.0102 -0.0075 -0.0069 (15.33) (11.86) (15.22) (10.73) (21.21) (17.05) (17.28) (10.67) Percent black - grade 4 -0.0093 -0.0080 -0.0093 -0.0077 -0.0111 -0.0094 -0.0088 -0.0068 (17.23) (11.78) (17.18) (9.05) (24.57) (17.14) (19.91) (10.31) Percent Hispanic - grade 2 -0.0045 -0.0037 -0.0047 -0.0037 -0.0056 -0.0050 -0.0050 -0.0043 (11.64) (7.12) (11.83) (6.43) (17.38) (11.87) (15.26) (9.58) Percent Hispanic - grade 3 -0.0046 -0.0048 -0.0052 -0.0055 -0.0072 -0.0071 -0.0075 -0.0068 (12.12) (9.45) (13.50) (10.03) (23.10) (18.11) (23.90) (15.60) Percent Hispanic - grade 4 -0.0046 -0.0044 -0.0053 -0.0055 -0.0069 -0.0063 -0.0070 -0.0065 (12.41) (9.79) (13.78) (9.92) (22.37) (16.79) (22.17) (14.62) Percent Asian - grade 2 0.0020 0.0025 0.0028 0.0036 0.0005 -0.0008 0.0023 0.0011 (3.65) (3.41) (4.91) (4.11) (1.18) (1.42) (5.10) (1.70) Percent Asian - grade 3 0.0026 0.0031 0.0035 0.0045 -0.0033 -0.0023 -0.0014 0.0004 (5.06) (4.09) (6.49) (5.69) (8.07) (3.94) (3.39) (0.54) Percent Asian - grade 4 0.0027 0.0021 0.0036 0.0029 -0.0022 -0.0019 -0.0004 -0.0004 (5.10) (3.64) (6.60) (4.01) (5.31) (4.19) (0.91) (0.72) Percent LEP - grade 2 -0.0023 -0.0025 -0.0018 -0.0023 -0.0035 -0.0038 -0.0023 -0.0034 (8.11) (6.34) (5.92) (5.56) (15.88) (11.44) (9.96) (9.97) Percent LEP - grade 3 -0.0027 -0.0022 -0.0025 -0.0021 -0.0037 -0.0037 -0.0031 -0.0031 (10.07) (6.05) (8.94) (5.22) (17.81) (11.89) (15.11) (9.74) Percent LEP - grade 4 -0.0028 -0.0031 -0.0027 -0.0027 -0.0039 -0.0047 -0.0029 -0.0032

Jepsen and Rivkin
46
(10.70) (10.47) (9.40) (7.94) (18.69) (19.37) (12.65) (10.84) Percent free lunch - grade 2 -0.0001 -0.0005 0.0003 -0.0005 (0.41) (1.35) (1.16) (1.60) Percent free lunch - grade 3 -0.0009 -0.0008 -0.0015 -0.0009 (3.16) (2.37) (6.92) (3.30) Percent free lunch - grade 4 -0.0011 -0.0008 -0.0009 -0.0007 (3.83) (2.54) (3.90) (2.73) Observations 65,511 65,511 65,511 65,511 65,511 65,511 65,511 65,511 School fixed effects yes no no no yes no no no School by grade fixed effects no yes no yes no yes no yes School by year fixed effects no no yes yes no no yes yes Student characteristics yes yes yes yes yes yes yes yes
Notes: Absolute values of t-statistics are in parentheses. Because columns (5) and (10) of Table 3 exclude student characteristics,
there are no columns (5) and (10) in this table.

Jepsen and Rivkin
47
Low Poverty Schools High Poverty Schools Figure 1. Percent New Teachers 1990-2001, by Student Demographics

Jepsen and Rivkin
48
Low Poverty Schools High Poverty Schools Figure 2. Percent Not Certified 1990-2001, by Student Demographics

Jepsen and Rivkin
49
Endnotes
1 For a detailed review of class size and student achievement, see Ehrenberg et al. (2001).
2 In the Connecticut data used by Hoxby (2000), school average scores on tests administered in
the fall are regressed on class size for the previous school years. Consequently, new entrants to a
school are assigned an erroneous measure of class size. Such measurement error attenuates the
estimates of class size effects on achievement by reducing the covariance between average
achievement and class size below its true value.
3 Later evaluations relied on HLM models or models with state-level data (Stecher and
Bohrnstedt, 2002). Neither of these approaches adequately controls for nonrandom variation in
CSR adoption.
4 Measurement of class size at the grade rather than classroom level avoids complications
introduced by the selective placement of students into classrooms. Although alternative
approaches for dealing with classroom placement would be possible, our data do not support
classroom specific analysis.
5 Hanushek, Rivkin, and Kain (2004) find that mobility reduces test scores of movers and
schoolmates.
6 These results are available from the authors upon request.
7 Rivkin (2006) describes such specification biases for a series of education production function
models.
8 California switched from the Stanford 9 to the California Achievement Test in 2002.
9 Schools were able to keep class sizes around 20 through the use of combination classes, as
illustrated in Sims (2003).

Jepsen and Rivkin
50
10 The comparisons are based on authors’ calculations using the Current Population Survey and
are available upon request.
11 The measure of poverty is actually the percent of students in the school who are eligible for
free or reduced-price lunch. For simplicity, we refer to this percentage as the percent subsidized
lunch.
12 The calculations assume that there is no systematic variation within schools by race or
ethnicity in the probability of having inexperienced or uncertified teachers.
13 Because the subsidized lunch variable is a crude measure of income and schools are divided
among only four subsidized lunch categories, race/ethnic differences conditional on income may
also reflect income differences not captured by the subsidized lunch categories.
14 Rivkin, Hanushek, and Kain (2005) find that gains to experience are concentrated in the first
few years of teaching.
15 Most teachers lacking full credentials have not completed a teacher preparation program
(including student teaching). These teachers receive emergency credentials (or occasionally a
waiver), which are annually renewable for a total period of no more than five years.
16 Krueger (1999) and Rivkin, Hanushek, and Kain (2005) are two studies that find grade
differences in class size effects.
17 As mentioned previously, effect sizes tend to be inflated with the level of aggregation, all else
equal.
18 The coefficients in Table 3 capture the effect of a 1 percent increase in the share of teachers in
their first (or second) year. Because the grade level data aggregate over classrooms, the effects of
having a first (or second) year teacher equal 100 times those coefficients.
19 These results are available from the authors upon request.

Jepsen and Rivkin
51
20 We assume here that newly certified teachers are less effective on average than already
certified teachers with similar experience and similar in effectiveness to teachers who remain
uncertified. It is possible that certification of only the most talented teachers could actually
increase the certification differential.
21 In most specifications, we can reject the hypothesis that the first-year certified and uncertified
coefficients are equal, whereas we can never reject the hypothesis that the second-year certified
and uncertified coefficients are equal.
22 Grade-level information on percent subsidized lunch is not available. Grade-by-year models
with percent subsidized lunch interaction terms would be identified solely off of differences in
class size and teacher characteristics. Therefore, we do not estimate such models.
23 The F-statistics were anywhere from 0.10 to 1.03, not even close to significance at 10 percent
for an F test with 3 hypotheses and over 4,000 degrees of freedom (i.e. F(3,4566)).