clas ohlson interim report q3 201718 180314 final · today, we can also report february sales and...
TRANSCRIPT
CLAS OHLSON NINE-MONTH REPORT 2017/18 1
nine-month report 2017/18
Third quarter – 1 November 2017 to 31 January 2018
● Sales increased by 2% to 2,746 MSEK (2,695), up 4% in local currencies
● Operating profit amounted to 349 MSEK (390) ● Profit after tax amounted to 270 MSEK (305) ● Earnings per share amounted to 4.28 SEK (4.84) ● The store portfolio was expanded by 1 store net ● Strategic partnership agreement signed with MatHem i Sverige AB ● Franchise with SYH Retail discontinued
Nine months – 1 May 2017 to 31 January 2018
● Sales increased by 2% to 6,528 MSEK (6,415), up 3% in local currencies
● Operating profit amounted to 574 MSEK (592) ● Profit after tax amounted to 444 MSEK (459) ● Earnings per share amounted to 7.02 SEK (7.28) ● Cash flow from operating activities amounted to 772 MSEK (763)
Events after the end of the reporting period ● In February, sales increased by 2% to 518 MSEK (511), up
3% in local currencies ● The store portfolio was expanded by 1 store net ● In March, we kicked-off our 100 year anniversary in all sales channels
in all markets
The 2017/18 financial year comprises the period from 1 May 2017 to 30 April 2018. This interim report has been prepared in Swedish and translated into English. In the event of any discrepancies between the Swedish and the translation, the former shall have precedence. This is such information that Clas Ohlson AB (publ) is obliged to publish pursuant to the EU Market Abuse Regulation and the Swedish Securities Market Act. This information was submitted for publication, through the agency of the contact person set out above, on 14 March 2018 at 07:00 a.m. (CET).
Contact person: Sara Kraft Westrell Director of Information and IR Tel: +46 247 649 13 or [email protected]
Nov 2017 Nov 2016 Percentage May 2017 May 2016 Percentage Feb 2017 May 2016
- Jan 2018 - Jan 2017 change - Jan 2018 - Jan 2017 change - Jan 2018 - Apr 2017
Sales, MSEK 2,746 2,695 2 6,528 6,415 2 8,102 7,990
Operating profit, MSEK 349 390 -10 574 592 -3 592 610
Profit before tax, MSEK 349 390 -10 573 592 -3 591 609
Profit after tax, MSEK 270 305 -11 444 459 -3 463 479
Gross margin, % 40.8 41.8 -1.0 p.p 40.9 41.0 -0.1 p.p 41.1 41.2
Operating margin, % 12.7 14.5 -1.8 p.p 8.8 9.2 -0.4 p.p 7.3 7.6
Return on capital employed, % – – – – – – 26.7 28.4
Return on equity, % – – – – – – 20.9 22.4
Equity/assets ratio, % 52.4 55.5 -3.1 p.p 52.4 55.5 -3.1 p.p 52.4 57.7
Earnings per share before dilution, SEK 4.28 4.84 -12 7.02 7.28 -4 7.33 7.59
3 Months 9 Months 12 Months
Cooking equipment was a strong product group when we achieved all-time-high December sales.
+4% sales in local currency
+3% sales in February in
local currency
CLAS OHLSON NINE-MONTH REPORT 2017/18 2
CEO’S COMMENTS
A quarter of continued increased sales in the important Christmas shopping period
Our sales in our third and most important quarter amounted to 2,746 MSEK, up 2 per cent year-on-year. During the period, we initiated a number of initiatives to meet the development in the market and to strengthen our customer offering in both the short and long term.
The changes in the marketplace entail many opportunities for Clas Ohlson, in both the short term and long term. Based on our strong position and our strong brand, we are working to develop the customer offering, customer meeting and our sales channels.
Stable sales growth in the quarter In the short-term perspective, we can conclude that our Christmas sales figures were our best ever, with more and better offerings to our customers than in previous years. Our important third quarter was a stable period in terms of sales with growth of 4 per cent in local currencies and a sales increase in comparable units of 1 per cent. Online sales performed well in all our markets, particularly in the UK.
We invested more in marketing and the margin during the period in order to drive sales, which has negatively impacted profits compared with previous years. Operating profit for the quarter amounted to 349 MSEK.
Today, we can also report February sales and can conclude that we had continued stable sales of 518 MSEK, up 3 per cent in local currency year-on-year.
Continued steps towards a stronger offering To strengthen our offering going forward, we launched a number of new initiatives during the period. In Norway, we launched Click & Collect in the entire Norwegian store network. In Sweden, we entered into a partnership with Telenor in a number of selected stores to broaden our offering to customers.
We also worked intensively during the quarter with the online grocery shopping service MatHem to prepare our joint offering. We can come closer to our customers by using MatHem’s digital platform to supplement an offering of home deliveries direct to the door and reach new customer groups. We expect to receive the first customer order in just a few weeks.
Just the other day, we kicked off the celebrations of our 100 year anniversary. As a customer, you will enjoy a wide range of fantastic offerings and surprises in our stores and online throughout 2018. But I will not reveal any more just yet.
Plan for future growth In the longer perspective, we are working on developing Clas Ohlson’s plan for future growth. As previously communicated, the plan will be presented at a Capital Markets Day on 3 May in Stockholm.
Lotta Lyrå President and CEO of Clas Ohlson AB
Financial information Calendar Current financial information is available at about.clasohlson.com/investors.
Press and analyst conference The nine-month report will be presented on 14 March at 8:30 a.m. by teleconference or audio broadcast. The presentation can also be followed on about.clasohlson.com/1718-q3.
8 Jun 2018 Year-end Report 2017/18
5 Sep 2018 Three-month Report 2018/19
8 Sep 2018 Annual General Meeting 2018
5 Dec 2018 Six-month Report 2018/19
13 Mar 2019 Nine-month Report 2018/19
5 Jun 2019 Year-end Report 2018/19
We reported stable sales for the Christmas shopping period and have made an extra effort to
maintain momentum. We are fully energised for our plan moving forward, and will present it to the market at our Capital Markets Day in May.
Contents Financial statements 8 Key ratios 12 Quarterly overview 13 Accounting policies 15 Key ratio definitions 16 Glossary 17
Alternative performance measures 18
Store overview 20 The share 21 Clas Ohlson in brief 22

CLAS OHLSON NINE-MONTH REPORT 2017/18 3
Operations Clas Ohlson is an international retail company with the business concept of selling a broad range of products at attractive prices that make it easy for people to solve everyday practical problems. The concept is unique and is highly attractive in established markets and has the potential for expansion into new markets and new customer segments.
Clas Ohlson sells products in the categories of Hardware, Electrical, Multimedia, Home and Leisure. Activities are conducted in Sweden, Norway, Finland, the UK and Germany via stores and online shopping.
Business environment and market1 Retail in Sweden increased by 2.8 per cent at current prices compared with the same quarter in the preceding year. During the quarter, consumer confidence in Sweden amounted to 7.5, an increase compared with the preceding quarter (2.9) and the same quarter in the preceding year (4.0).
Retail in Norway increased by 3.5 per cent at current prices compared with the same quarter in the preceding year. During the quarter, consumer confidence in Norway amounted to 10.3, a decline compared with the preceding quarter (11.6) and an increase compared with the same quarter in the preceding year (4.4).
Retail in Finland increased by 3.6 per cent at current prices compared with the same quarter in the preceding year. During the quarter, consumer confidence in Finland was 23.7, an increase compared with the preceding quarter (23.4) and an increase compared with the same quarter in the preceding year (19.4).
Retail in the UK increased by 4.3 per cent at current prices compared with the same quarter in the preceding year. During the quarter, consumer confidence in the UK was -11.3, a decline compared with the preceding quarter (-9.7) and a decline compared with the same quarter in the preceding year (-6.7).
Sales Third quarter Sales increased to 2,746 MSEK, up 2 per cent compared with 2,695 MSEK in the year-earlier period. In local currencies, sales increased by 4 per cent.
During the quarter, the store network was expanded by 1 store (5). At the end of the quarter, the total number of stores was 224, representing a net increase of 11 stores compared with the year-earlier period (8).
Nine months Sales increased to 6,528 MSEK, up 2 per cent compared with 6,415 MSEK in the year-earlier period. Sales in local currencies rose 3 per cent.
During the first nine months of the financial year, the store network was expanded by 8 stores (8).
1 Source: HUI, National Institute of Economic Research, Office for National Statistics, Opinion, Statistics Finland, Statistics Norway, Trading Economics.
Nov 2017 Nov 2016 local May 2017 May 2016 local
MSEK - Jan 2018 - Jan 2017 SEK currency - Jan 2018 - Jan 2017 SEK currency
Sweden 1,194 1,177 1 1 2,908 2,881 1 1
Norway 1,111 1,101 1 7 2,614 2,558 2 5
Finland 353 324 9 7 796 733 9 7
Outside Nordic countries*
88 93 -5 -5 209 243 -14 -12
Total 2,746 2,695 2 4 6,528 6,415 2 3
*Effected by store optimization in the UK
3 Months 9 Months
Distribution of sales
Percentage change Percentage change
Total number of stores
Distribution of numbers of stores
Sales, MSEK
Distribution of sales, %
207 208 213 216218 223 224
0
50
100
150
200
250
Q1 Q2 Q3 Q4
2016/17 2017/18
88 86
39
7 4
0
20
40
60
80
100
Sweden Norway Finland UK Germany
0
500
1000
1500
2000
2500
3000
Q1 Q2 Q3 Q4
2016/17 2017/18
44
40
133
SwedenNorwayFinlandOutside Nordic countries
CLAS OHLSON NINE-MONTH REPORT 2017/18 4
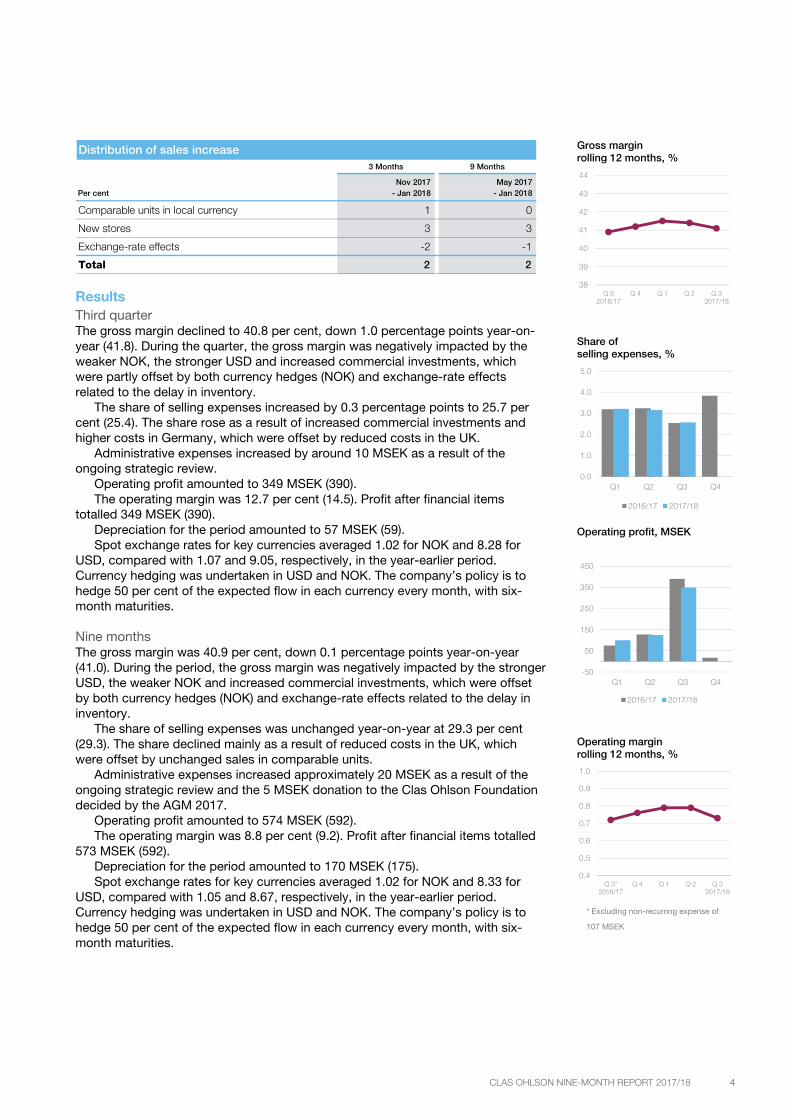
Results Third quarter The gross margin declined to 40.8 per cent, down 1.0 percentage points year-on-year (41.8). During the quarter, the gross margin was negatively impacted by the weaker NOK, the stronger USD and increased commercial investments, which were partly offset by both currency hedges (NOK) and exchange-rate effects related to the delay in inventory.
The share of selling expenses increased by 0.3 percentage points to 25.7 per cent (25.4). The share rose as a result of increased commercial investments and higher costs in Germany, which were offset by reduced costs in the UK.
Administrative expenses increased by around 10 MSEK as a result of the ongoing strategic review.
Operating profit amounted to 349 MSEK (390). The operating margin was 12.7 per cent (14.5). Profit after financial items
totalled 349 MSEK (390). Depreciation for the period amounted to 57 MSEK (59). Spot exchange rates for key currencies averaged 1.02 for NOK and 8.28 for
USD, compared with 1.07 and 9.05, respectively, in the year-earlier period. Currency hedging was undertaken in USD and NOK. The company’s policy is to hedge 50 per cent of the expected flow in each currency every month, with six-month maturities.
Nine months The gross margin was 40.9 per cent, down 0.1 percentage points year-on-year (41.0). During the period, the gross margin was negatively impacted by the stronger USD, the weaker NOK and increased commercial investments, which were offset by both currency hedges (NOK) and exchange-rate effects related to the delay in inventory.
The share of selling expenses was unchanged year-on-year at 29.3 per cent (29.3). The share declined mainly as a result of reduced costs in the UK, which were offset by unchanged sales in comparable units.
Administrative expenses increased approximately 20 MSEK as a result of the ongoing strategic review and the 5 MSEK donation to the Clas Ohlson Foundation decided by the AGM 2017.
Operating profit amounted to 574 MSEK (592). The operating margin was 8.8 per cent (9.2). Profit after financial items totalled
573 MSEK (592). Depreciation for the period amounted to 170 MSEK (175). Spot exchange rates for key currencies averaged 1.02 for NOK and 8.33 for
USD, compared with 1.05 and 8.67, respectively, in the year-earlier period. Currency hedging was undertaken in USD and NOK. The company’s policy is to hedge 50 per cent of the expected flow in each currency every month, with six-month maturities.
Distribution of sales increase3 Months 9 Months
Nov 2017 May 2017Per cent - Jan 2018 - Jan 2018
Comparable units in local currency 1 0
New stores 3 3
Exchange-rate effects -2 -1
Total 2 2
Gross margin rolling 12 months, %
Share of
selling expenses, %
Operating profit, MSEK
Operating margin rolling 12 months, %
38
39
40
41
42
43
44
Q 32016/17
Q 4 Q 1 Q 2 Q 32017/18
0.0
1.0
2.0
3.0
4.0
5.0
Q1 Q2 Q3 Q4
2016/17 2017/18
-50
50
150
250
350
450
Q1 Q2 Q3 Q4
2016/17 2017/18
0.4
0.5
0.6
0.7
0.8
0.9
1.0
Q 3*2016/17
Q 4 Q 1 Q 2 Q 32017/18
* Excluding non-recurring expense of
107 MSEK
CLAS OHLSON NINE-MONTH REPORT 2017/18 5
Investments During the nine-month period, investments totalled 422 MSEK (192). Of this amount, 224 MSEK referred to acquisitions of shares, including transaction expenses, corresponding to 10 per cent of MatHem i Sverige AB. In addition, 67 MSEK (91) comprised investments in new or refurbished stores. Other investments were primarily IT and replacement investments. During the nine-month period, investments in IT systems amounted to 89 MSEK (78).
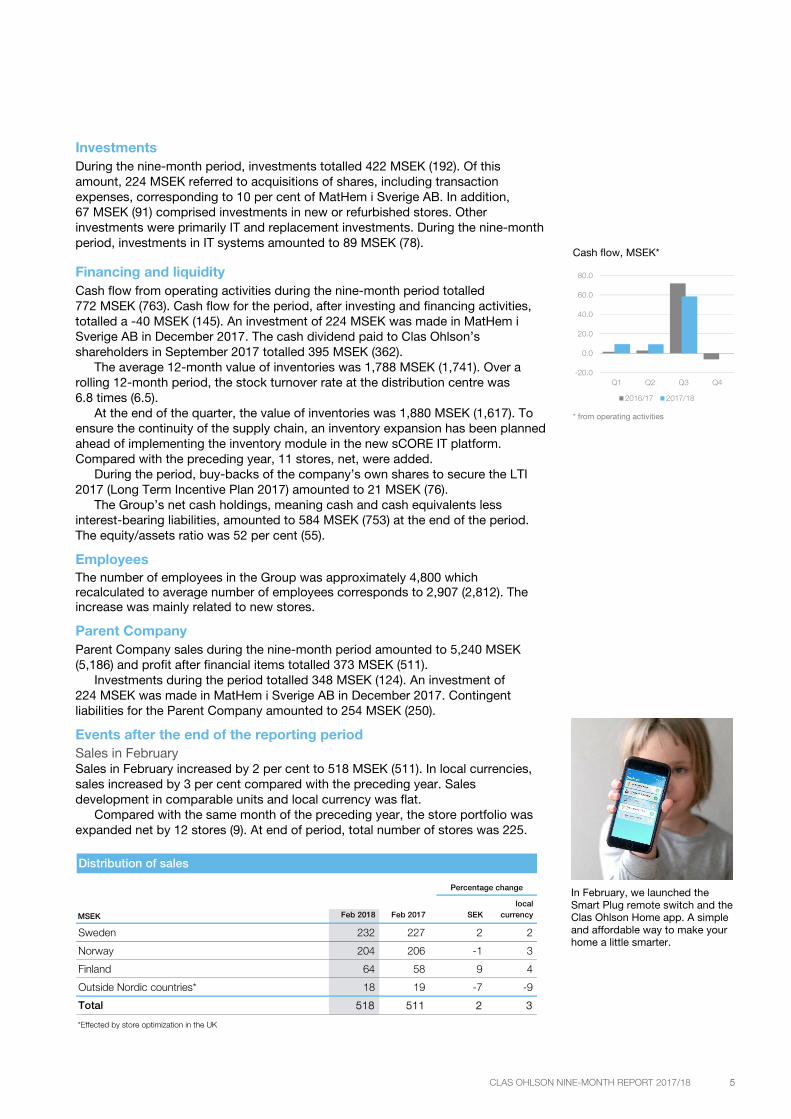
Financing and liquidity Cash flow from operating activities during the nine-month period totalled 772 MSEK (763). Cash flow for the period, after investing and financing activities, totalled a -40 MSEK (145). An investment of 224 MSEK was made in MatHem i Sverige AB in December 2017. The cash dividend paid to Clas Ohlson’s shareholders in September 2017 totalled 395 MSEK (362).
The average 12-month value of inventories was 1,788 MSEK (1,741). Over a rolling 12-month period, the stock turnover rate at the distribution centre was 6.8 times (6.5).
At the end of the quarter, the value of inventories was 1,880 MSEK (1,617). To ensure the continuity of the supply chain, an inventory expansion has been planned ahead of implementing the inventory module in the new sCORE IT platform. Compared with the preceding year, 11 stores, net, were added.
During the period, buy-backs of the company’s own shares to secure the LTI 2017 (Long Term Incentive Plan 2017) amounted to 21 MSEK (76).
The Group’s net cash holdings, meaning cash and cash equivalents less interest-bearing liabilities, amounted to 584 MSEK (753) at the end of the period. The equity/assets ratio was 52 per cent (55).
Employees The number of employees in the Group was approximately 4,800 which recalculated to average number of employees corresponds to 2,907 (2,812). The increase was mainly related to new stores.
Parent Company Parent Company sales during the nine-month period amounted to 5,240 MSEK (5,186) and profit after financial items totalled 373 MSEK (511).
Investments during the period totalled 348 MSEK (124). An investment of 224 MSEK was made in MatHem i Sverige AB in December 2017. Contingent liabilities for the Parent Company amounted to 254 MSEK (250).
Events after the end of the reporting period Sales in February Sales in February increased by 2 per cent to 518 MSEK (511). In local currencies, sales increased by 3 per cent compared with the preceding year. Sales development in comparable units and local currency was flat.
Compared with the same month of the preceding year, the store portfolio was expanded net by 12 stores (9). At end of period, total number of stores was 225.
Distribution of sales
local
MSEK Feb 2018 Feb 2017 SEK currency
Sweden 232 227 2 2
Norway 204 206 -1 3
Finland 64 58 9 4
Outside Nordic countries* 18 19 -7 -9
Total 518 511 2 3
Percentage change
*Effected by store optimization in the UK
Cash flow, MSEK*
* from operating activities
In February, we launched the Smart Plug remote switch and the Clas Ohlson Home app. A simple and affordable way to make your home a little smarter.
-20.0
0.0
20.0
40.0
60.0
80.0
Q1 Q2 Q3 Q4
2016/17 2017/18

CLAS OHLSON NINE-MONTH REPORT 2017/18 6
In the first ten months of the financial year (May-February), sales increased by 2 per cent to 7,046 MSEK (6,926). Sales in local currencies increased by 3 per cent.
Partnership initiated with MatHem A strategic partnership agreement was signed with MatHem i Sverige AB during the quarter. For Clas Ohlson, this partnership entails opportunities to reach new customers via MatHem’s digital platform and offer better service to existing customers with convenient and quick deliveries home to their door.
Clas Ohlson acquired all of the newly issued shares corresponding to 10 per cent of MatHem i Sverige AB. The investment amounted to 224 MSEK including transaction expenses.
The “100 more years” strategic review Strategy efforts were initiated in September to further develop and grow Clas Ohlson. The “100 more years” strategic review will result in a strategic plan for the company and impacted third-quarter earnings with a cost of around 10 MSEK.
To launch and implement the new strategy, we will bring together all of our employees in Insjön in August 2018. We will also celebrate Clas Ohlson’s 100 year anniversary in connection with the launch. The next three quarters are expected to be charged with about 10 MSEK per quarter for these strategy efforts, including the launch and implementation.
A Capital Markets Day for analysts, investors and the media will be arranged on 3 May 2018 in Stockholm, in conjunction with the launch of Clas Ohlson’s updated strategy for future growth. Register at about.clasohlson.com/en/investors/reports-and-presentations/201718/cmd2018/.
Update on new business system Clas Ohlson’s implementation of the new sCORE IT platform is a strategically important initiative and a programme that runs from the 2013/14 financial year until the 2018/19 financial year, and entails an investment of around 70 MSEK per year over a five-year period. Furthermore, an upgrade of the IT environment is being carried out connected to the inventory and logistics system, customer data and online shopping with an annual investment rate of 75 MSEK over a two-year period.
Update on store expansion During the 2017/18 financial year, openings are planned for 10-15 new stores, net. During the first nine months of the financial year, the store network was expanded by 8 stores. The number of forthcoming, contracted store openings amounted to 12 stores. See page 20 for a list of stores.
The fourth store in Germany, on Spitalerstraße in central Hamburg, was opened on 30 November 2017, which complements the first phase of our establishment in the German market.
As part of the optimisation of the store network in the UK, six stores were closed during the 2016/17 financial year. Another store (Croydon) will close at the end of August 2018. Total annual cost savings related to the closure of all seven stores are an estimated 70 MSEK when the restructuring has been fully realised during the 2017/18 financial year. While the store in Croydon remains open, the total cost savings are estimated at 60 MSEK on an annual basis.
The franchise partnership with SYH Retail, part of the Al Homaizi Group of companies, was ended during the quarter. The two stores in the Dubai region under the franchise were closed in the third quarter.
Changes to Clas Ohlson’s management Clas Ohlson’s Group Management was expanded with Jesper Smith, HR Director as of 1 November 2017 and Jacob Sten, Chief Growth Officer as of 1 February 2018.
In February, CFO Göran Melin announced that he will leave his position in June 2018. The recruitment of a new CFO has been initiated.
The partnership with MatHem means that customers can order much of Clas Ohlson’s range right to their door.
We opened our fourth store in Germany, on Spitalerstraße in central Hamburg, at the end of November.

CLAS OHLSON NINE-MONTH REPORT 2017/18 7
Risks and uncertainties Clas Ohlson’s operations entail risks that could negatively impact the Group to varying extents. Work is continuously carried out to update the Group’s risk situation through a documented and systematic process in which risks are identified, assessed, monitored and reported. Those risks deemed to have the greatest negative potential based on the probability of occurrence and their possible impact on operations are prioritised. This work contributes to the strategic and operational management of the company.
Operational risks primarily comprise establishments in new markets, purchasing in Asia, IT systems, competition, logistics, strikes, key employees, social responsibility, product range and shrinkage, while financial risks mainly comprise economic conditions, wage inflation, raw-material prices, transport costs and exchange-rate exposure.
For a detailed description of the Group’s risks and risk management, refer to pages 76-79 of the 2016/17 Annual Report. Apart from the risks described in the Annual Report, no other significant risks have arisen. The company’s auditors have not reviewed this report. Insjön, Sweden, 14 March 2018 Lotta Lyrå President and CEO

CLAS OHLSON NINE-MONTH REPORT 2017/18 8
Financial statements
Consolidated Income Statement
Nov 2017 Nov 2016 May 2017 May 2016 Feb 2017 May 2016
MSEK - Jan 2018 - Jan 2017 - Jan 2018 - Jan 2017 - Jan 2018 - Apr 2017
Sales 2,745.9 2,695.2 6,527.6 6,415.2 8,102.4 7,990.1
Cost of goods sold -1,625.1 -1,567.3 -3,860.7 -3,785.9 -4,773.4 -4,698.6
Gross profit 1,120.8 1,127.9 2,666.9 2,629.4 3,329.0 3,291.5
Selling expenses -706.8 -684.7 -1,911.7 -1,882.0 -2,514.9 -2,485.2
Administrative expenses -64.7 -51.3 -180.5 -150.1 -223.5 -193.1
Other operating income/expenses -0.2 -1.9 -0.6 -4.9 0.9 -3.4
Operating profit 349.2 390.0 574.2 592.4 591.7 609.9
Financial income 0.3 0.0 0.5 0.3 0.9 0.7
Financial expense -0.5 -0.5 -1.3 -1.1 -1.8 -1.6
Profit after financial items 349.0 389.5 573.4 591.5 590.8 608.9
Income tax -78.6 -84.6 -129.9 -132.3 -127.7 -130.2
Profit for the period 270.4 305.0 443.5 459.2 463.1 478.7
3 Months 9 Months 12 Months
Nov 2017 Nov 2016 May 2017 May 2016 Feb 2017 May 2016
MSEK - Jan 2018 - Jan 2017 - Jan 2018 - Jan 2017 - Jan 2018 - Apr 2017
Profit for the period 270.4 305.0 443.5 459.2 463.1 478.7
Other comprehensive income, net of tax:
Items that later can be reversed back to the Consolidated income statement:
Exhange rate differences 0.3 -20.7 -4.2 26.7 -8.0 22.9
Cash flow hedging -9.3 12.0 -15.5 14.2 -8.1 21.6
Total -9.1 -8.7 -19.7 40.9 -16.1 44.5
Items that later can not be reversed back to the Consolidated income statement:
Reevalutation of net pension obligations 0.0 0.0 0.0 0.0 0.0 0.0
Total 0.0 0.0 0.0 0.0 0.0 0.0
Total other comprehensive income, net of tax
-9.1 -8.7 -19.7 40.9 -16.1 44.5
Total comprehensive income for the period
261.3 296.3 423.8 500.1 446.9 523.2
3 Months 9 Months 12 Months
Consolidated Comprehensive Income Statement
Data per share
Nov 2017 Nov 2016 May 2017 May 2016 Feb 2017 May 2016- Jan 2018 - Jan 2017 - Jan 2018 - Jan 2017 - Jan 2018 - Apr 2017
Number of shares before dilution 63,205,200 62,960,885 63,198,167 63,066,704 63,151,986 63,052,803
Number of shares after dilution 63,302,826 63,159,563 63,343,502 63,292,871 63,293,194 63,254,614
Number of shares at end of period 63,208,135 62,994,129 63,208,135 62,994,129 63,208,135 63,083,438
Earnings per share before dilution, SEK 4.28 4.84 7.02 7.28 7.33 7.59
Earnings per share after dilution, SEK 4.27 4.83 7.00 7.26 7.32 7.57
Comprehensive income per share, SEK 4.13 4.71 6.71 7.93 7.08 8.30
3 Months 9 Months 12 Months

CLAS OHLSON NINE-MONTH REPORT 2017/18 9
Consolidated Balance Sheet
31 Jan 31 Jan 30 Apr
MSEK 2018 2017 2017
Assets
Intangible assets 401.4 321.3 340.2
Tangible assets 1,029.2 1,075.8 1,064.3
Securities held as fixed assets 224.0 0.0 0.0
Non-current receivables 18.5 18.4 18.5
Inventories 1,880.3 1,616.6 1,630.7
Other receivables 222.6 213.3 220.6
Liquid assets 584.0 753.3 625.1
Total assets 4,360.0 3,998.8 3,899.4
Equity and liabilities
Equity 2,285.3 2,218.9 2,250.7
Long-term liabilities, Non-interest-bearing 231.2 214.3 226.8
Current liabilities, Non interest-bearing 1,843.4 1,565.5 1,421.9
Total equity and liabilities 4,360.0 3,998.8 3,899.4
Consolidated Cash Flow
Nov 2017 Nov 2016 May 2017 May 2016 Feb 2017 May 2016
MSEK - Jan 2018 - Jan 2017 - Jan 2018 - Jan 2017 - Jan 2018 - Apr 2017
Operating profit 349.2 390.0 574.2 592.4 591.7 609.9
Adjustment for items not included in cash flow 57.6 60.3 174.5 169.1 217.8 212.5
Interest received 0.3 0.0 0.5 0.3 0.9 0.7
Interest paid -0.5 -0.5 -1.3 -1.1 -1.8 -1.6
Tax paid -34.8 -29.5 -90.0 -103.1 -147.7 -160.8
Cash flow from operating activities before changes in working capital
371.8 420.4 657.9 657.6 660.9 660.6
Change in working capital 213.5 298.4 113.9 105.2 47.1 38.4
Cash flow from operating activities 585.2 718.8 771.8 762.8 708.0 698.9
Investments in intangible assets -34.3 -34.4 -88.7 -78.3 -116.4 -105.9
Investments in tangible assets -39.2 -32.6 -109.7 -114.2 -153.1 -157.6
Investments in securities held as fixed assets -224.0 0.0 -224.0 0.0 -224.0 0.0
Change in current investments 0.0 0.0 0.1 0.1 0.0 0.1
Cash flow from investing activities -297.5 -66.9 -422.4 -192.4 -493.5 -263.5
Change in current liabilities, interest-bearing 0.0 -120.3 0.0 0.0 0.0 0.0
Repurchase of own shares 0.0 -0.0 -20.9 -75.7 -20.9 -75.7
Sale of own shares 0.6 2.3 26.1 12.5 33.4 19.7
Dividend to shareholders 0.0 0,0 -395.0 -362.0 -395.0 -362.0
Cash flow from financing activities 0.6 -118.0 -389.8 -425.2 -382.6 -418.0
Cash flow for the period 288.3 533.9 -40.3 145.2 -168.0 17.5
Liquid assets at the start of the period 295.8 220.2 625.1 604.3 753.3 604.3
Exchange rate difference for liquid assets -0.1 -0.8 -0.7 3.9 -1.3 3.3
Liquid assets at the end of the period 584.0 753.3 584.0 753.3 584.0 625.1
3 Months 9 Months 12 Months

CLAS OHLSON NINE-MONTH REPORT 2017/18 10
Sales by segment
Nov 2017 Nov 2016 May 2017 May 2016
MSEK - Jan 2018 - Jan 2017 - Jan 2018 - Jan 2017
Sweden 1,193.9 1,176.7 2,908.5 2,881.0
Norway 1,111.1 1,101.3 2,614.3 2,558.2
Finland 353.2 324.4 795.9 733.2
Outside Nordic countries* 87.7 92.8 208.9 242.9
Group functions 891.5 891.8 2,329.0 2,296.9
Sales to other segments -891.5 -891.8 -2,329.0 -2,296.9
Total 2,745.9 2,695.2 6,527.6 6,415.2* Effected by store optimization in the UK
3 Months 9 Months
Operating profit by segment
Nov 2017 Nov 2016 May 2017 May 2016
MSEK - Jan 2018 - Jan 2017 - Jan 2018 - Jan 2017
Sweden 49.1 45.7 119.4 112.3
Norway 46.8 44.3 110.1 103.1
Finland 11.2 10.0 25.2 22.6
Outside Nordic countries 2.7 3.6 6.3 7.9
Group functions 239.4 286.3 313.2 346.5
Total 349.2 390.0 574.2 592.4
3 Months 9 Months
Specification of change in profits*3 Months 9 Months
Nov 2017 May 2017
MSEK - Jan 2018 - Jan 2018
Profit from sales -3.0 -5.1
Decreased gross margin -28.2 -8.5
Increased administrative expenses** -13.4 -30.4
Decreased expansion costs stores*** 0.2 16.8
Decreased depreciation 1.8 4.6
Change in other operating income/expense 1.8 4.4
Change in financial income/expense 0.2 0.0
Change in profit after financial items -40.5 -18.1
*** During the first quarter 2016/17 includes start-up costs for the business operations in Germany.
*The table shows the change in profit after financial items compared with previous year.
** Includes costs for strategic review for about 10 MSEK each for quarter two and three
and donation to the Clas Ohlson Foundation for about 5 MSEK.
CLAS OHLSON NINE-MONTH REPORT 2017/18 11
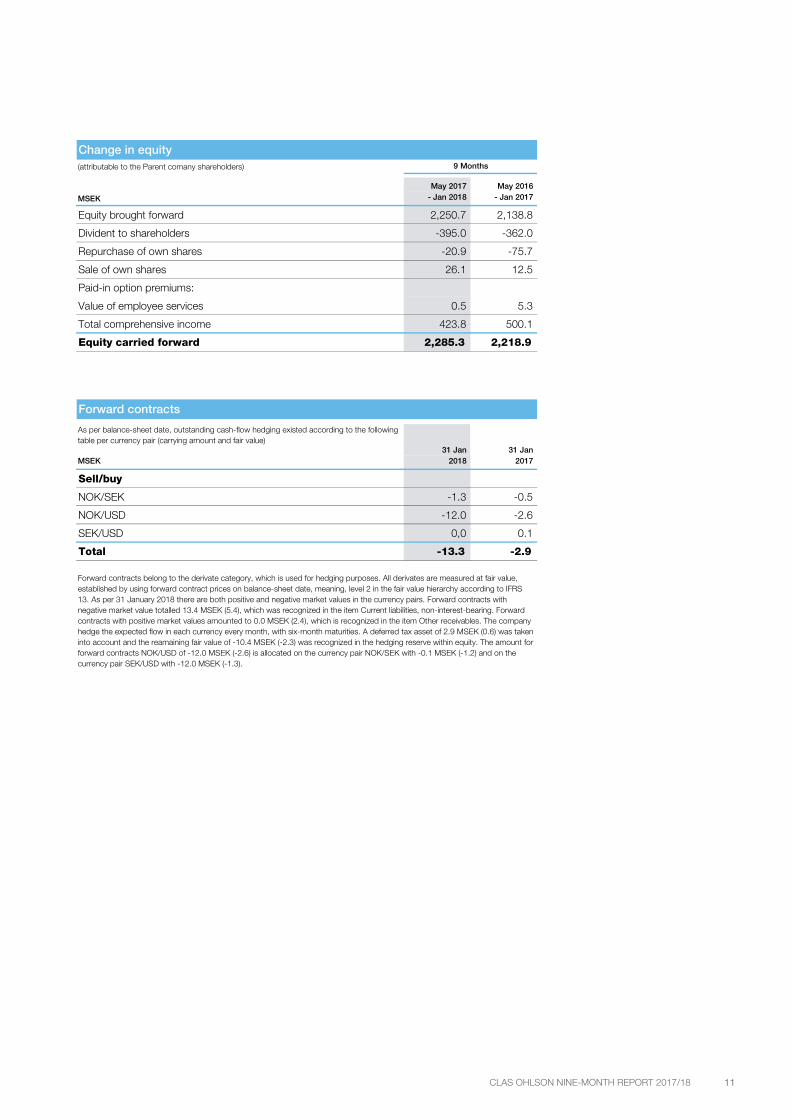
Change in equity(attributable to the Parent comany shareholders)
May 2017 May 2016
MSEK - Jan 2018 - Jan 2017
Equity brought forward 2,250.7 2,138.8
Divident to shareholders -395.0 -362.0
Repurchase of own shares -20.9 -75.7
Sale of own shares 26.1 12.5
Paid-in option premiums:
Value of employee services 0.5 5.3
Total comprehensive income 423.8 500.1
Equity carried forward 2,285.3 2,218.9
9 Months
Forward contracts
31 Jan 31 JanMSEK 2018 2017
Sell/buy
NOK/SEK -1.3 -0.5
NOK/USD -12.0 -2.6
SEK/USD 0,0 0.1
Total -13.3 -2.9
As per balance-sheet date, outstanding cash-flow hedging existed according to the following table per currency pair (carrying amount and fair value)
Forward contracts belong to the derivate category, which is used for hedging purposes. All derivates are measured at fair value, established by using forward contract prices on balance-sheet date, meaning, level 2 in the fair value hierarchy according to IFRS 13. As per 31 January 2018 there are both positive and negative market values in the currency pairs. Forward contracts with negative market value totalled 13.4 MSEK (5.4), which was recognized in the item Current liabilities, non-interest-bearing. Forward contracts with positive market values amounted to 0.0 MSEK (2.4), which is recognized in the item Other receivables. The company hedge the expected flow in each currency every month, with six-month maturities. A deferred tax asset of 2.9 MSEK (0.6) was taken into account and the reamaining fair value of -10.4 MSEK (-2.3) was recognized in the hedging reserve within equity. The amount for forward contracts NOK/USD of -12.0 MSEK (-2.6) is allocated on the currency pair NOK/SEK with -0.1 MSEK (-1.2) and on the currency pair SEK/USD with -12.0 MSEK (-1.3).

CLAS OHLSON NINE-MONTH REPORT 2017/18 12
Key ratios
Nov 2017 Nov 2016 May 2017 May 2016 Feb 2017 May 2016
- Jan 2018 - Jan 2017 - Jan 2018 - Jan 2017 - Jan 2018 - Apr 2017
Sales growth, % 1.9 8.6 1.8 5.2 2.3 5.1
Gross margin, % 40.8 41.8 40.9 41.0 41.1 41.2
Operating margin, % 12.7 14.5 8.8 9.2 7.3 7.6
Return on capital employed, % – – – – 26.7 28.4
Return on equity, % – – – – 20.9 22.4
Equity/assets ratio, % 52.4 55.5 52.4 55.5 52.4 57.7
Sales per sq.m in stores, SEK thousand – – – – 31 31
Number of stores at period end 224 213 224 213 224 216
Number of employees at period end 2,907 2,812 2,907 2,812 2,907 2,835
Data per share
Number of shares before dilution 63,205,200 62,960,885 63,198,167 63,066,704 63,151,986 63,052,803
Number of shares after dilution 63,302,826 63,159,563 63,343,502 63,292,871 63,293,194 63,254,614
Number of shares at period end 63,208,135 62,994,129 63,208,135 62,994,129 63,208,135 63,083,438
Earnings per share before dilution, SEK 4.28 4.84 7.02 7.28 7.33 7.59
Earnings per share after dilution, SEK 4.27 4.83 7.00 7.26 7.32 7.57
Comprehensive income per share, SEK 4.13 4.71 6.71 7.93 7.08 8.30
Cash flow per share*, SEK 9.26 11.42 12.21 12.09 11.21 11.08
Equity per share, SEK 36.16 35.22 36.16 35.22 36.16 35.68
3 Months 9 Months 12 Months
* From the operating activities
CLAS OHLSON NINE-MONTH REPORT 2017/18 13
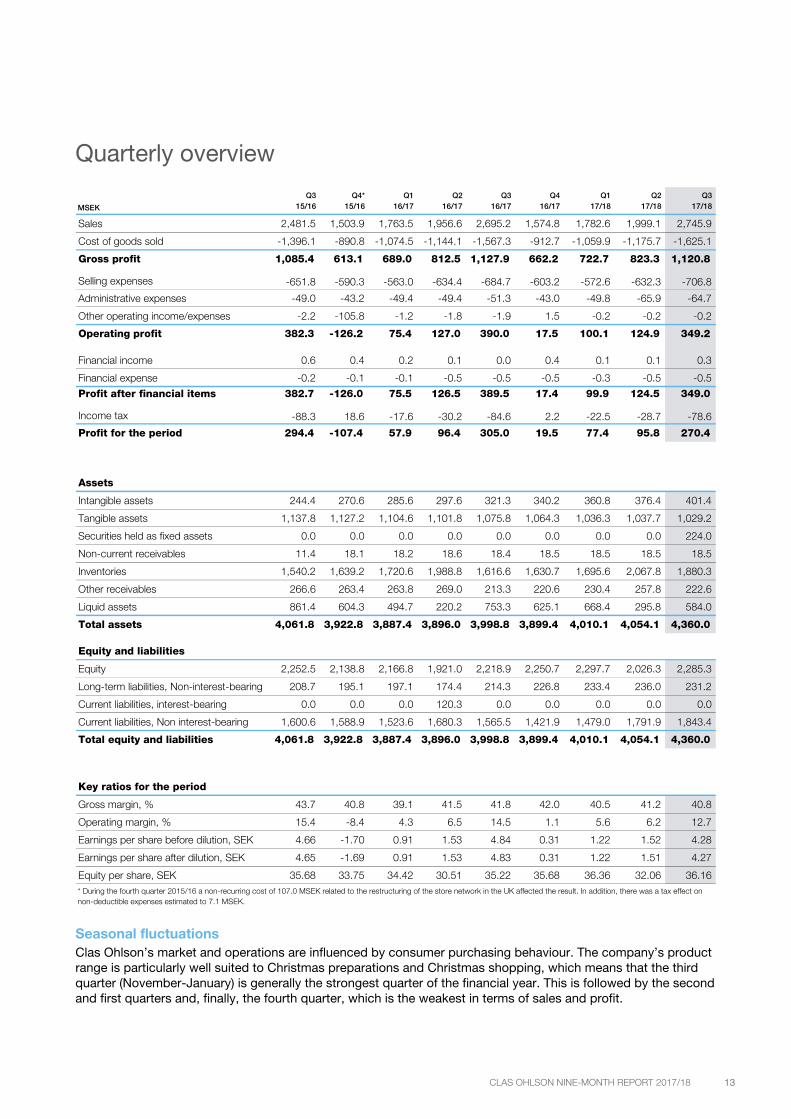
Quarterly overview
Seasonal fluctuations Clas Ohlson’s market and operations are influenced by consumer purchasing behaviour. The company’s product range is particularly well suited to Christmas preparations and Christmas shopping, which means that the third quarter (November-January) is generally the strongest quarter of the financial year. This is followed by the second and first quarters and, finally, the fourth quarter, which is the weakest in terms of sales and profit.
Q3 Q4* Q1 Q2 Q3 Q4 Q1 Q2 Q3
MSEK 15/16 15/16 16/17 16/17 16/17 16/17 17/18 17/18 17/18
Sales 2,481.5 1,503.9 1,763.5 1,956.6 2,695.2 1,574.8 1,782.6 1,999.1 2,745.9
Cost of goods sold -1,396.1 -890.8 -1,074.5 -1,144.1 -1,567.3 -912.7 -1,059.9 -1,175.7 -1,625.1
Gross profit 1,085.4 613.1 689.0 812.5 1,127.9 662.2 722.7 823.3 1,120.8
Selling expenses -651.8 -590.3 -563.0 -634.4 -684.7 -603.2 -572.6 -632.3 -706.8
Administrative expenses -49.0 -43.2 -49.4 -49.4 -51.3 -43.0 -49.8 -65.9 -64.7
Other operating income/expenses -2.2 -105.8 -1.2 -1.8 -1.9 1.5 -0.2 -0.2 -0.2
Operating profit 382.3 -126.2 75.4 127.0 390.0 17.5 100.1 124.9 349.2
Financial income 0.6 0.4 0.2 0.1 0.0 0.4 0.1 0.1 0.3
Financial expense -0.2 -0.1 -0.1 -0.5 -0.5 -0.5 -0.3 -0.5 -0.5
Profit after financial items 382.7 -126.0 75.5 126.5 389.5 17.4 99.9 124.5 349.0
Income tax -88.3 18.6 -17.6 -30.2 -84.6 2.2 -22.5 -28.7 -78.6
Profit for the period 294.4 -107.4 57.9 96.4 305.0 19.5 77.4 95.8 270.4
Assets
Intangible assets 244.4 270.6 285.6 297.6 321.3 340.2 360.8 376.4 401.4
Tangible assets 1,137.8 1,127.2 1,104.6 1,101.8 1,075.8 1,064.3 1,036.3 1,037.7 1,029.2
Securities held as fixed assets 0.0 0.0 0.0 0.0 0.0 0.0 0.0 0.0 224.0
Non-current receivables 11.4 18.1 18.2 18.6 18.4 18.5 18.5 18.5 18.5
Inventories 1,540.2 1,639.2 1,720.6 1,988.8 1,616.6 1,630.7 1,695.6 2,067.8 1,880.3
Other receivables 266.6 263.4 263.8 269.0 213.3 220.6 230.4 257.8 222.6
Liquid assets 861.4 604.3 494.7 220.2 753.3 625.1 668.4 295.8 584.0
Total assets 4,061.8 3,922.8 3,887.4 3,896.0 3,998.8 3,899.4 4,010.1 4,054.1 4,360.0
Equity and liabilities
Equity 2,252.5 2,138.8 2,166.8 1,921.0 2,218.9 2,250.7 2,297.7 2,026.3 2,285.3
Long-term liabilities, Non-interest-bearing 208.7 195.1 197.1 174.4 214.3 226.8 233.4 236.0 231.2
Current liabilities, interest-bearing 0.0 0.0 0.0 120.3 0.0 0.0 0.0 0.0 0.0
Current liabilities, Non interest-bearing 1,600.6 1,588.9 1,523.6 1,680.3 1,565.5 1,421.9 1,479.0 1,791.9 1,843.4
Total equity and liabilities 4,061.8 3,922.8 3,887.4 3,896.0 3,998.8 3,899.4 4,010.1 4,054.1 4,360.0
Key ratios for the period
Gross margin, % 43.7 40.8 39.1 41.5 41.8 42.0 40.5 41.2 40.8
Operating margin, % 15.4 -8.4 4.3 6.5 14.5 1.1 5.6 6.2 12.7
Earnings per share before dilution, SEK 4.66 -1.70 0.91 1.53 4.84 0.31 1.22 1.52 4.28
Earnings per share after dilution, SEK 4.65 -1.69 0.91 1.53 4.83 0.31 1.22 1.51 4.27
Equity per share, SEK 35.68 33.75 34.42 30.51 35.22 35.68 36.36 32.06 36.16* During the fourth quarter 2015/16 a non-recurring cost of 107.0 MSEK related to the restructuring of the store network in the UK affected the result. In addition, there was a tax effect on non-deductible expenses estimated to 7.1 MSEK.
CLAS OHLSON NINE-MONTH REPORT 2017/18 14
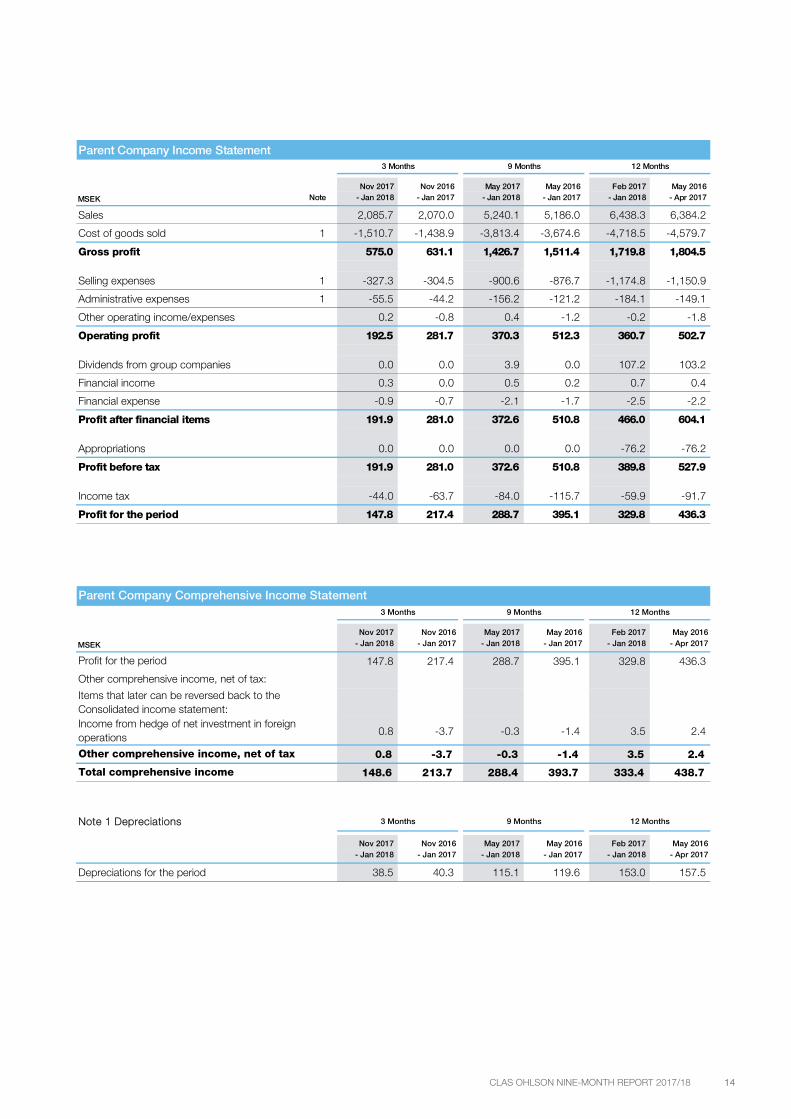
Parent Company Income Statement
Nov 2017 Nov 2016 May 2017 May 2016 Feb 2017 May 2016
MSEK Note - Jan 2018 - Jan 2017 - Jan 2018 - Jan 2017 - Jan 2018 - Apr 2017
Sales 2,085.7 2,070.0 5,240.1 5,186.0 6,438.3 6,384.2
Cost of goods sold 1 -1,510.7 -1,438.9 -3,813.4 -3,674.6 -4,718.5 -4,579.7
Gross profit 575.0 631.1 1,426.7 1,511.4 1,719.8 1,804.5
Selling expenses 1 -327.3 -304.5 -900.6 -876.7 -1,174.8 -1,150.9
Administrative expenses 1 -55.5 -44.2 -156.2 -121.2 -184.1 -149.1
Other operating income/expenses 0.2 -0.8 0.4 -1.2 -0.2 -1.8
Operating profit 192.5 281.7 370.3 512.3 360.7 502.7
Dividends from group companies 0.0 0.0 3.9 0.0 107.2 103.2
Financial income 0.3 0.0 0.5 0.2 0.7 0.4
Financial expense -0.9 -0.7 -2.1 -1.7 -2.5 -2.2
Profit after financial items 191.9 281.0 372.6 510.8 466.0 604.1
Appropriations 0.0 0.0 0.0 0.0 -76.2 -76.2
Profit before tax 191.9 281.0 372.6 510.8 389.8 527.9
Income tax -44.0 -63.7 -84.0 -115.7 -59.9 -91.7
Profit for the period 147.8 217.4 288.7 395.1 329.8 436.3
3 Months 9 Months 12 Months
Nov 2017 Nov 2016 May 2017 May 2016 Feb 2017 May 2016
MSEK - Jan 2018 - Jan 2017 - Jan 2018 - Jan 2017 - Jan 2018 - Apr 2017
147.8 217.4 288.7 395.1 329.8 436.3
0.8 -3.7 -0.3 -1.4 3.5 2.4
0.8 -3.7 -0.3 -1.4 3.5 2.4
148.6 213.7 288.4 393.7 333.4 438.7
Nov 2017 Nov 2016 May 2017 May 2016 Feb 2017 May 2016- Jan 2018 - Jan 2017 - Jan 2018 - Jan 2017 - Jan 2018 - Apr 2017
Depreciations for the period 38.5 40.3 115.1 119.6 153.0 157.5
Other comprehensive income, net of tax
3 Months 9 Months 12 Months
Profit for the period
Other comprehensive income, net of tax:
Items that later can be reversed back to the Consolidated income statement:Income from hedge of net investment in foreign operations
Parent Company Comprehensive Income Statement
Note 1 Depreciations 3 Months 9 Months 12 Months
Total comprehensive income

CLAS OHLSON NINE-MONTH REPORT 2017/18 15
Accounting policies Clas Ohlson applies the International Financial Reporting Standards (IFRS) adopted by the EU. This interim report has been prepared in accordance with the Swedish Annual Accounts Act, IAS 34 Interim Financial Reporting and RFR 1 Supplementary Accounting Rules for Groups. Disclosures in accordance with IAS 34 Interim Financial Reporting are provided in the notes and elsewhere in this interim report.
The Parent Company’s financial statements have been prepared in accordance with the Swedish Annual Accounts Act and the Swedish Financial Reporting Board’s Recommendation RFR 2. The same accounting policies are applied as for the Group, except in those cases described under the section headed “Parent Company accounting policies” in the 2016/17 Annual Report on page 103. The same accounting policies and calculation methods are applied as in the latest annual report.
New and revised IFRSs and interpretations applied from 1 May 2017 did not have any discernible effect on the consolidated financial statements.
For a more detailed description of the accounting policies applied to the Group and Parent Company in this interim report, refer to the 2016/17 Annual Report, pages 100-104.
Parent Company Balance Sheet
31 Jan 31 Jan 30 AprMSEK 2018 2017 2017
Assets
Intangible assets 401.4 321.3 340.2
Tangible assets 723.7 789.0 775.6
Financial assets 411.1 182.6 186.3
Inventories 1,225.3 1,040.4 1,062.0
Other receivables 151.3 143.0 205.2
Liquid assets 527.4 688.2 540.9
Total assets 3,440.2 3,164.5 3,110.2
Equity and liabilities
Equity 897.6 944.8 998.5
Untaxed reserves 1,048.5 972.3 1,048.5
Provisions 52.3 53.0 46.0
Long-term liabilities, Non-interest-bearing 5.0 5.0 5.0
Current liabilities, Non interest-bearing 1,436.8 1,189.4 1,012.2
Total equity and liabilities 3,440.2 3,164.5 3,110.2

CLAS OHLSON NINE-MONTH REPORT 2017/18 16
Key ratio definitions Clas Ohlson uses certain financial measures in this interim report that are not defined in accordance with IFRS. Clas Ohlson believes that these key ratios are relevant to users of the financial report as a supplement for assessing Clas Ohlson’s performance. These financial measures are not always comparable with the measures used by other companies since not all companies calculate such financial measures in the same way. Accordingly, these financial measures are not to be regarded as a replacement for measures defined according to IFRS. The measures not defined according to IFRS are presented below, unless otherwise stated.
Average inventory value Average inventory value is calculated as the total inventories for the most recent 12 months divided by 12.
Capital employed Balance-sheet total (total assets) less current liabilities and non-current liabilities, non-interest-bearing liabilities.
Cash flow from operating activities Operating profit adjusted for items not included in cash flow, interest, paid tax and change in working capital.
Cash flow from operating activities per share Cash flow from operating activities divided by the average number of shares before dilution.
Comprehensive income per share Comprehensive income divided by average number of shares before dilution.
Dividend yield Dividend per share divided by the year-end share price.
Equity/assets ratio Equity at the end of the period divided by the balance-sheet total (total assets).
Equity per share Equity divided by the number of shares outstanding at the end of the period.
Earnings per share (before and after dilution)* Profit for the period divided by the number of shares (before and after dilution).
Gross margin Gross profit divided by sales for the period.
Gross profit Gross profit is calculated as the total of sales less cost of goods sold.
Operating margin Operating profit divided by sales for the period.
Operating profit Operating profit comprises profit before financial items and tax.
Payout ratio Dividend divided by earnings per share before dilution.
P/E ratio Share price at year-end divided by earnings per share before dilution.
Return on capital employed Operating profit plus financial income expressed as a percentage of average capital employed. Average capital employed is calculated as the total capital employed for the most recent 12 months divided by 12. *Defined in accordance with IFRS.

CLAS OHLSON NINE-MONTH REPORT 2017/18 17
Return on equity Net profit for the period expressed as a percentage of average equity. Average equity is calculated as the total equity for the most recent 12 months divided by 12.
Sales growth Sales in relation to sales during the year-earlier period.
Working capital The total of current assets, minus cash and cash equivalents (inventories and current receivables), less current non-interest-bearing liabilities.
Glossary Average receipt Average amount per purchase.
Clas Office Our concept that facilitates purchases for our corporate customers.
Club Clas Our loyalty program, our loyalty club.
Code of Conduct The standards we set for ourselves, and the suppliers of our products and services, regarding working conditions, workplace health and safety and the environment.
Comparable units Units that have been in operation during the current period and the entire year-earlier period.
Conversion rate The percentage of visitors who make a purchase.
Franchise Concept whereby we “rent” our brand to an external player, who operates a store under our name.
GRI The Global Reporting Initiative, a global standard for sustainability reporting.
Nasdaq Stockholm Marketplace for trading with securities, where Clas Ohlson’s Series B share is listed.
Omni-channel A shopping experience where customers perceive a seamless interaction between physical stores, the online store and telephone sales.
Products for a more sustainable lifestyle Products with a positive, or significantly lower, environmental impact throughout their life cycle than a standard product.
Sales per square metre Store sales in relation to the effective retail space. For new stores, a conversion has been made in relation to how long the store has been open.
sCORE Systems for Clas Ohlson Retail Efficiency, our project for the introduction of a new business system.
Store traffic Number of visitors.
CLAS OHLSON NINE-MONTH REPORT 2017/18 18
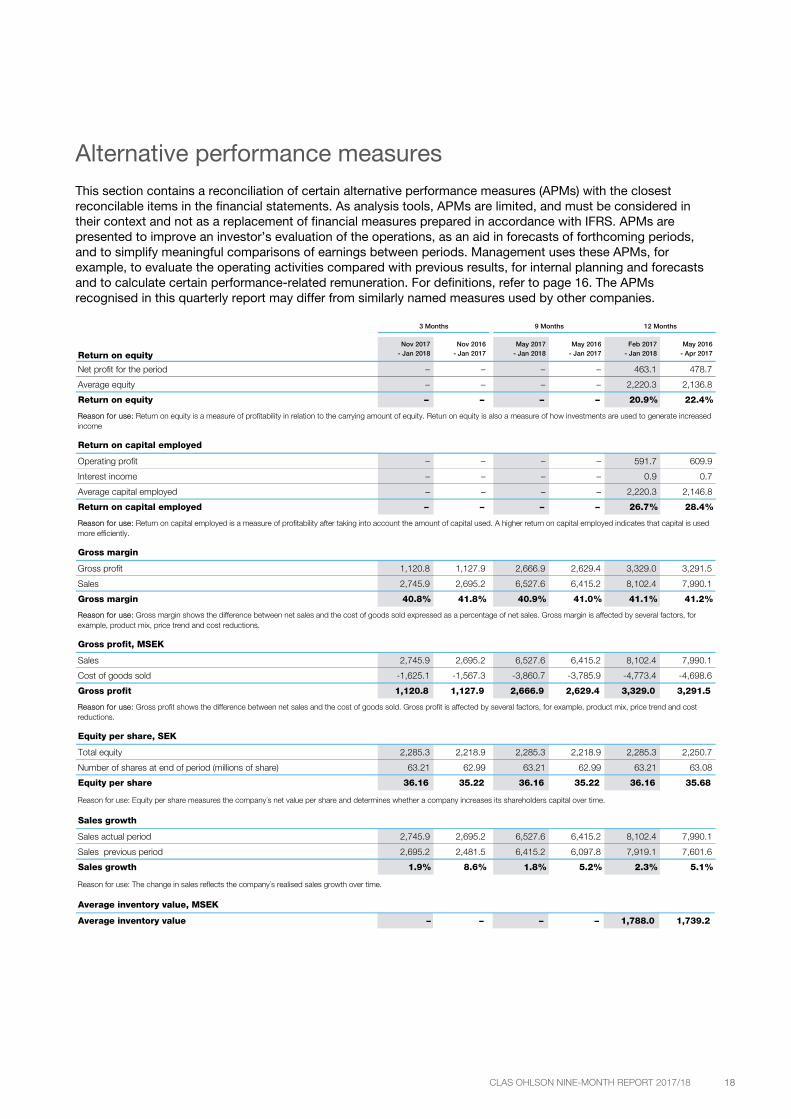
Alternative performance measures This section contains a reconciliation of certain alternative performance measures (APMs) with the closest reconcilable items in the financial statements. As analysis tools, APMs are limited, and must be considered in their context and not as a replacement of financial measures prepared in accordance with IFRS. APMs are presented to improve an investor’s evaluation of the operations, as an aid in forecasts of forthcoming periods, and to simplify meaningful comparisons of earnings between periods. Management uses these APMs, for example, to evaluate the operating activities compared with previous results, for internal planning and forecasts and to calculate certain performance-related remuneration. For definitions, refer to page 16. The APMs recognised in this quarterly report may differ from similarly named measures used by other companies.
Nov 2017 Nov 2016 May 2017 May 2016 Feb 2017 May 2016
Return on equity - Jan 2018 - Jan 2017 - Jan 2018 - Jan 2017 - Jan 2018 - Apr 2017
Net profit for the period – – – – 463.1 478.7
Average equity – – – – 2,220.3 2,136.8
Return on equity – – – – 20.9% 22.4%
3 Months 9 Months 12 Months
Reason for use: Return on equity is a measure of profitability in relation to the carrying amount of equity. Retun on equity is also a measure of how investments are used to generate increased income
Return on capital employed
Operating profit – – – – 591.7 609.9
Interest income – – – – 0.9 0.7
Average capital employed – – – – 2,220.3 2,146.8
Return on capital employed – – – – 26.7% 28.4%
Reason for use: Return on capital employed is a measure of profitability after taking into account the amount of capital used. A higher return on capital employed indicates that capital is used more efficiently.
Gross margin
Gross profit 1,120.8 1,127.9 2,666.9 2,629.4 3,329.0 3,291.5
Sales 2,745.9 2,695.2 6,527.6 6,415.2 8,102.4 7,990.1
Gross margin 40.8% 41.8% 40.9% 41.0% 41.1% 41.2%
Reason for use: Gross margin shows the difference between net sales and the cost of goods sold expressed as a percentage of net sales. Gross margin is affected by several factors, for example, product mix, price trend and cost reductions.
Gross profit, MSEK
Sales 2,745.9 2,695.2 6,527.6 6,415.2 8,102.4 7,990.1
Cost of goods sold -1,625.1 -1,567.3 -3,860.7 -3,785.9 -4,773.4 -4,698.6
Gross profit 1,120.8 1,127.9 2,666.9 2,629.4 3,329.0 3,291.5
Reason for use: Gross profit shows the difference between net sales and the cost of goods sold. Gross profit is affected by several factors, for example, product mix, price trend and cost reductions.
Equity per share, SEK
Total equity 2,285.3 2,218.9 2,285.3 2,218.9 2,285.3 2,250.7
Number of shares at end of period (millions of share) 63.21 62.99 63.21 62.99 63.21 63.08
Equity per share 36.16 35.22 36.16 35.22 36.16 35.68
Reason for use: Equity per share measures the company´s net value per share and determines whether a company increases its shareholders capital over time.
Sales growth
Sales actual period 2,745.9 2,695.2 6,527.6 6,415.2 8,102.4 7,990.1
Sales previous period 2,695.2 2,481.5 6,415.2 6,097.8 7,919.1 7,601.6
Sales growth 1.9% 8.6% 1.8% 5.2% 2.3% 5.1%
Reason for use: The change in sales reflects the company´s realised sales growth over time.
Average inventory value, MSEK
Average inventory value – – – – 1,788.0 1,739.2
CLAS OHLSON NINE-MONTH REPORT 2017/18 19
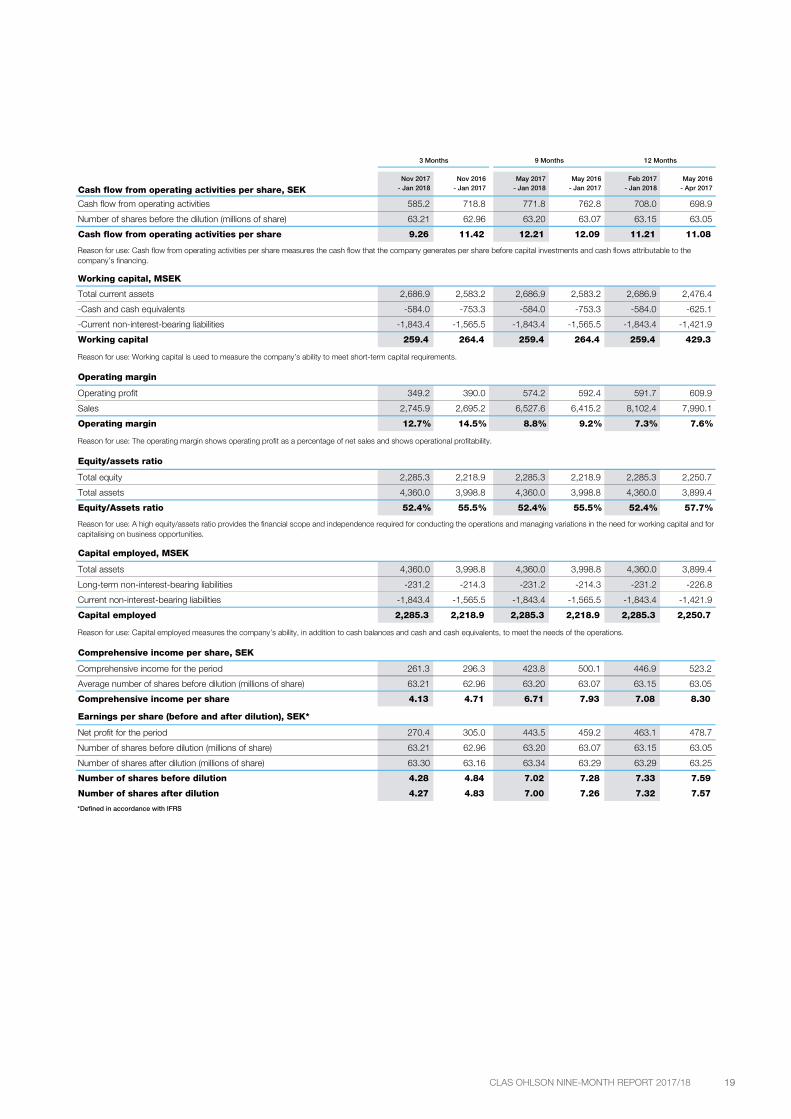
Nov 2017 Nov 2016 May 2017 May 2016 Feb 2017 May 2016
Cash flow from operating activities per share, SEK - Jan 2018 - Jan 2017 - Jan 2018 - Jan 2017 - Jan 2018 - Apr 2017
Cash flow from operating activities 585.2 718.8 771.8 762.8 708.0 698.9
Number of shares before the dilution (millions of share) 63.21 62.96 63.20 63.07 63.15 63.05
Cash flow from operating activities per share 9.26 11.42 12.21 12.09 11.21 11.08
Reason for use: Cash flow from operating activities per share measures the cash flow that the company generates per share before capital investments and cash flows attributable to the company’s financing.
3 Months 9 Months 12 Months
Working capital, MSEK
Total current assets 2,686.9 2,583.2 2,686.9 2,583.2 2,686.9 2,476.4
-Cash and cash equivalents -584.0 -753.3 -584.0 -753.3 -584.0 -625.1
-Current non-interest-bearing liabilities -1,843.4 -1,565.5 -1,843.4 -1,565.5 -1,843.4 -1,421.9
Working capital 259.4 264.4 259.4 264.4 259.4 429.3
Reason for use: Working capital is used to measure the company’s ability to meet short-term capital requirements.
Operating margin
Operating profit 349.2 390.0 574.2 592.4 591.7 609.9
Sales 2,745.9 2,695.2 6,527.6 6,415.2 8,102.4 7,990.1
Operating margin 12.7% 14.5% 8.8% 9.2% 7.3% 7.6%
Reason for use: The operating margin shows operating profit as a percentage of net sales and shows operational profitability.
Equity/assets ratio
Total equity 2,285.3 2,218.9 2,285.3 2,218.9 2,285.3 2,250.7
Total assets 4,360.0 3,998.8 4,360.0 3,998.8 4,360.0 3,899.4
Equity/Assets ratio 52.4% 55.5% 52.4% 55.5% 52.4% 57.7%
Reason for use: A high equity/assets ratio provides the financial scope and independence required for conducting the operations and managing variations in the need for working capital and for capitalising on business opportunities.
Capital employed, MSEK
Total assets 4,360.0 3,998.8 4,360.0 3,998.8 4,360.0 3,899.4
Long-term non-interest-bearing liabilities -231.2 -214.3 -231.2 -214.3 -231.2 -226.8
Current non-interest-bearing liabilities -1,843.4 -1,565.5 -1,843.4 -1,565.5 -1,843.4 -1,421.9
Capital employed 2,285.3 2,218.9 2,285.3 2,218.9 2,285.3 2,250.7
Reason for use: Capital employed measures the company’s ability, in addition to cash balances and cash and cash equivalents, to meet the needs of the operations.
Comprehensive income per share, SEK
Comprehensive income for the period 261.3 296.3 423.8 500.1 446.9 523.2
Average number of shares before dilution (millions of share) 63.21 62.96 63.20 63.07 63.15 63.05
Comprehensive income per share 4.13 4.71 6.71 7.93 7.08 8.30
Earnings per share (before and after dilution), SEK*
Net profit for the period 270.4 305.0 443.5 459.2 463.1 478.7
Number of shares before dilution (millions of share) 63.21 62.96 63.20 63.07 63.15 63.05
Number of shares after dilution (millions of share) 63.30 63.16 63.34 63.29 63.29 63.25
Number of shares before dilution 4.28 4.84 7.02 7.28 7.33 7.59
Number of shares after dilution 4.27 4.83 7.00 7.26 7.32 7.57
*Defined in accordance with IFRS

CLAS OHLSON NINE-MONTH REPORT 2017/18 20
Store overview New stores, third quarter ● Stjørdal, Norway, opened in November 2017 ● Stathelle, Norway, opened in November 2017 ● Bergen, Norway, opened in November 2017 ● Hamburg, Germany, opened in November 2017
Closed stores, third quarter ● City Centre Mirdif, Dubai (Franchise), December 2017 ● Mercato, Dubai (Franchise), December 2017 ● Trondheim Lade, Norway, December 2017
New stores after the end of the period ● Bodø, Norway, opened in February 2018 ● Husnes, Norway, opened in March 2018
Future store openings ● Bærum, Norway, scheduled to open in March 2018 ● Tampere, Finland, scheduled to open in April 2018 ● Gothenburg, Sweden, scheduled to open in April 2018 ● Märsta, Sweden, scheduled to open in April 2018 ● Sortland, Norway, scheduled to open in May 2018 ● Tyresö, Sweden, scheduled to open in May 2018 ● Ljungby, Sweden, scheduled to open in June 2018 ● Stockholm, Sweden, scheduled to open in September 2018 ● Helsinki, Finland, scheduled to open in September 2018 ● Mölndal, Sweden, scheduled to open in September 2018 ● Kungälv, Sweden, scheduled to open in March 2019 ● Helsinki, Finland, scheduled to open in autumn of 2019
For more information, refer to the detailed list on the website about.clasohlson.com
In February, a new Clas Ohlson Compact Store was opened in Bodø in Norway.
Click & Collect was launched in all Norwegian stores in February. The store in Bergen Åsane was the first to make customer deliveries.
Sales Q3 2017/18
Stores at end of Q3 2017/18
SWEDEN
GERMANY
4
NORWAY
1,111 MSEK 86
7
1,194 MSEK 88
353 MSEK39
FINLAND CHINA
About 40% of our purchases are made directly via in-house purchasers.
UK
88 MSEK
OUTSIDE NORDIC COUNTRIES

CLAS OHLSON NINE-MONTH REPORT 2017/18 21
The share Clas Ohlson Series B shares have been listed on Nasdaq Stockholm since 1999 and are included in the Consumer Services sector index. The price paid on 31 January 2018 was 109 SEK per share.
Number of shares The number of registered shares totalled 65,600,000, unchanged from the preceding year. At 31 January 2018, the company held 2,391,865 shares (2,605,871) corresponding to 4 per cent (4) of the total number of registered shares. At the end of the period, the number of shares outstanding, net after buy-back, was 63,208,135 (62,994,129).
Dividend policy Clas Ohlson’s dividend policy is that the dividend is to comprise at least 50 per cent of earnings per share after tax, taking into account the company’s financial position.
The largest shareholders 31 January 2018
Owner Number of A-shares Number of B-shares Equity, % Votes, %
Helena Tidstrand 1,368,060 6,179,828 12 17
Björn Haid 1,007,960 4,732,834 9 13
Johan Tidstrand 1,368,060 900,000 3 12
Peter Haid 1,007,960 3,785,243 7 12
Claus-Toni Haid 1,007,960 3,465,916 7 12
Nordea 0 3,334,398 5 3
If Skadeförsäkring AB 0 3,114,337 5 3
Afa Försäkring 0 1,949,959 3 2
Odin Sverige 0 1,762,392 3 1
Swedbank 0 1,176,154 2 1
Other shareholders 0 29,438,939 44 24
Total 5,760,000 59,840,000 100 100
Share data
Listing Nasdaq StockholmMid Cap
Ticker Clas B
Industry Consumer Services
ISIN code SE0000584948
Earnings per share, SEK
Dividend per share, SEK
-2,00
-1,00
0,00
1,00
2,00
3,00
4,00
5,00
Q1 Q2 Q3 Q4
2016/17 2017/18
0
1
2
3
4
5
6
7
2013 2014 2015 2016 2017
CLAS OHLSON NINE-MONTH REPORT 2017/18 22
www.clasohlson.com Clas Ohlson AB | SE-793 85 Insjön, Sweden | Telephone +46 (0)247-444 00 | Corp. Reg. No. 556035-8672
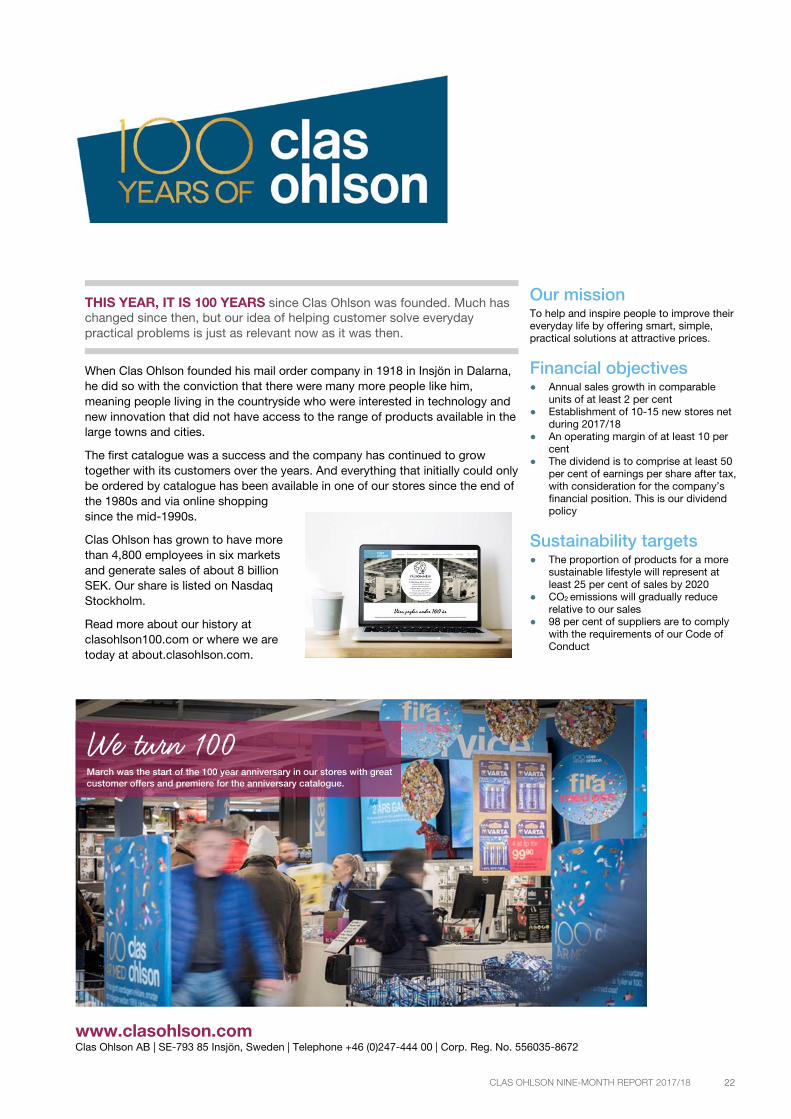
Our mission To help and inspire people to improve their everyday life by offering smart, simple, practical solutions at attractive prices.
Financial objectives ● Annual sales growth in comparable
units of at least 2 per cent ● Establishment of 10-15 new stores net
during 2017/18 ● An operating margin of at least 10 per
cent ● The dividend is to comprise at least 50
per cent of earnings per share after tax, with consideration for the company’s financial position. This is our dividend policy
Sustainability targets ● The proportion of products for a more
sustainable lifestyle will represent at least 25 per cent of sales by 2020
● CO2 emissions will gradually reduce relative to our sales
● 98 per cent of suppliers are to comply with the requirements of our Code of Conduct
THIS YEAR, IT IS 100 YEARS since Clas Ohlson was founded. Much has changed since then, but our idea of helping customer solve everyday practical problems is just as relevant now as it was then.
When Clas Ohlson founded his mail order company in 1918 in Insjön in Dalarna, he did so with the conviction that there were many more people like him, meaning people living in the countryside who were interested in technology and new innovation that did not have access to the range of products available in the large towns and cities.
The first catalogue was a success and the company has continued to grow together with its customers over the years. And everything that initially could only be ordered by catalogue has been available in one of our stores since the end of the 1980s and via online shopping since the mid-1990s.
Clas Ohlson has grown to have more than 4,800 employees in six markets and generate sales of about 8 billion SEK. Our share is listed on Nasdaq Stockholm.
Read more about our history at clasohlson100.com or where we are today at about.clasohlson.com.
We turn 100 March was the start of the 100 year anniversary in our stores with great customer offers and premiere for the anniversary catalogue.