city sanitation plan belgaum - municipaladmn.gov.in · city sanitation plan belgaum administrative...
TRANSCRIPT

CITY SANITATION PLAN BELGAUM
ADMINISTRATIVE STAFF COLLEGE OF INDIA, HYDERABAD 2 | P a g e
TABLE OF CONTENTS
TABLE OF CONTENTS ........................................................................................................................... 2
LIST OF TABLES .................................................................................................................................... 5
LIST OF FIGURES ................................................................................................................................... 7
LIST OF MAPS ........................................................................................................................................ 8
LIST OF INFORMATION BOXES ............................................................................................................ 8
EXECUTIVE SUMMARY ....................................................................................................................... 12
ACKNOWLEDGEMENTS ...................................................................................................................... 14
CSTF MEMBERS ................................................................................................................................... 15
FOREWORD (by CSTF Chairperson) .................................................................................................. 16
ASCI TEAM MEMBERS ........................................................................................................................ 17
Chapter 1 ............................................................................................................................................. 18
INTRODUCTION ........................................................................................................................................................ 18
1.1 BACKGROUND ........................................................................................................................................ 18
1.2 OBJECTIVES OF CITY-WIDE SANITATION PLAN ..................................................................... 18
1.3 CONTEXT .................................................................................................................................................. 19
1.4 CITY SANITATION PLANNING IN BELGAUM ............................................................................. 21
1.5 PROCESS, DETAILED STEPS AND LIMITATIONS ..................................................................... 24
1.6 VERIFICATION OF MOUD CHECKLIST .......................................................................................... 33
1.7 CHAPTER PLAN ...................................................................................................................................... 38
Chapter 2 ............................................................................................................................................. 40
STATE URBAN SANITATION POLICIES & PROGRAMMES – A REVIEW ............................................. 40
2.1 NATIONAL URBAN SANITATION POLICY (NUSP) ................................................................... 40
2.2 MUNICIPAL SOLID WASTE RULES, 2000 .................................................................................... 43
2.3 KARNATAKA URBAN DRINKING WATER AND SANITATION POLICY, 2002 ............... 44
2.4 KARNATAKA URBAN INFRASTRUCTURE DEVELOPMENT AND FINANCE
CORPORATION (KUIDFC) ................................................................................................................................. 45
2.5 INTEGRATED LOW COST SANITATION (ILCS) ......................................................................... 47
2.6 ASHA KIRAN MAHITI (AKM) ............................................................................................................ 47
2.7 JNNURM ..................................................................................................................................................... 47
2.8 URBAN INFRASTRUCTURE DEVELOPMENT SCHEME FOR SMALL & MEDIUM
TOWNS (UIDSSMT) ............................................................................................................................................. 48
2.9 RAJIV AWAS YOJANA ........................................................................................................................... 48
2.10 URBAN STATISTICS FOR HR AND ASSESSMENTS (USHA)” ................................................ 50

CITY SANITATION PLAN BELGAUM
ADMINISTRATIVE STAFF COLLEGE OF INDIA, HYDERABAD 3 | P a g e
2.11 INTEREST SUBSIDY SCHEME FOR HOUSING THE URBAN POOR (ISHUP) ................... 50
2.12 13TH CENTRAL FINANCE COMMISSION (CFC) ........................................................................ 51
2.13 NATIONAL MISSION ON SUSTAINABLE HABITAT .................................................................. 52
Chapter 3 ............................................................................................................................................. 53
PROFILE OF BELGAUM CITY ................................................................................................................................ 53
3.1 INTRODUCTION ..................................................................................................................................... 53
3.2 LOCATION AND REGIONAL LINKAGES ........................................................................................ 53
3.3 CLIMATE ................................................................................................................................................... 53
3.4 TOPOGRAPHY ......................................................................................................................................... 54
3.5 BRIEF HISTORY ...................................................................................................................................... 54
3.6 DEMOGRAPHY ........................................................................................................................................ 54
3.7 SLUMS AND SQUATTER SETTLEMENTS ..................................................................................... 59
3.8 EXISTING LANDUSE ............................................................................................................................. 64
3.9 MUNICIPAL GOVERNANCE ............................................................................................................... 65
Chapter 4 ............................................................................................................................................. 70
ENVIRONMENTAL SANITATION – AN ASSESSMENT ................................................................................ 70
4.1 SANITATION SITUATION ANALYSIS ................................................................................................. 70
4.1.1 Household Sanitation ........................................................................................................................... 70
4.1.2 Slum Sanitation ...................................................................................................................................... 72
4.1.3 Open Defecation Areas ........................................................................................................................ 78
4.1.4 Community Toilets ................................................................................................................................ 79
4.1.5 Public Toilets ........................................................................................................................................... 81
4.1.6 School Sanitation ................................................................................................................................... 85
4.1.7 Septage Management ........................................................................................................................... 88
4.1.8 Standardized Service Level Indicators ......................................................................................... 89
4.1.9 Waste Water Projections .................................................................................................................... 90
4.2 STORM WATER DRAINAGE SYSTEM .................................................................................................. 91
4.2.1 Existing Drainage Network ............................................................................................................... 91
4.2.2 Coverage .................................................................................................................................................... 92
4.2.3 Outfalls ....................................................................................................................................................... 92
4.2.4 Existing Drainage Conditions ........................................................................................................... 92
4.2.5 Local Flooding Areas ............................................................................................................................ 92
4.2.6 Standardized Service Level Indicators ......................................................................................... 93
4.3 SOLID WASTE MANAGEMENT ............................................................................................................. 94
4.3.1 Primary collection and coverage .................................................................................................... 94
CITY SANITATION PLAN BELGAUM
ADMINISTRATIVE STAFF COLLEGE OF INDIA, HYDERABAD 4 | P a g e
4.3.2 Street sweeping ...................................................................................................................................... 95
4.3.3 Waste generation, Segregation, quantity and characteristics ............................................. 96
4.3.4 Secondary Collection ............................................................................................................................ 96
4.3.5 Transportation ....................................................................................................................................... 96
4.3.6 Treatment & Disposal .......................................................................................................................... 97
4.3.7 Service level benchmarking indicators ........................................................................................ 98
4.3.8 Future demand and gap ...................................................................................................................... 99
4.4 WATER SUPPLY ........................................................................................................................................ 100
4.4.1 Source of water .................................................................................................................................... 100
4.4.2 Service coverage .................................................................................................................................. 101
4.4.3 Coverage and Supply .......................................................................................................................... 102
4.4.4 Standardized Service Level indicators ....................................................................................... 103
4.4.5 Future Demand and Gap ................................................................................................................... 103
4.4.6 New And Upcoming Project ............................................................................................................ 104
Chapter 5 ........................................................................................................................................... 107
INSTITUTIONAL CAPACITY AND FINANCE ................................................................................................. 107
5.1 MUNICIPAL FINANCE ............................................................................................................................. 107
Chapter 6 ........................................................................................................................................... 111
SANITATION SITUATION AND RANKING ..................................................................................................... 111
6.1 NATIONAL SANITATION RANKING PARAMETERS ................................................................... 111
Chapter 7 ........................................................................................................................................... 115
CITY-WIDE SANITATION ..................................................................................................................................... 115
7.1. INTRODUCTION ........................................................................................................................................ 115
7.2. VISION AND CITY- WIDE SANITATION PLANNING ................................................................... 115
7.2.1 Vision Statement .................................................................................................................................. 115
7.2.2 Principles Of Csp .................................................................................................................................. 116
7.2.3 Assumptions, Norms And Units Costs ......................................................................................... 118
7.2.4 Various Occurrence Of Issues Versus Consequences In Belgaum ................................... 119
7.3. SUBSECTOR STRATEGIES ..................................................................................................................... 121
7.3.1 Open Defecation Free Status By Ensuring Access To All (Including Poor And Slum
Dwellers As Well As Visiting Population). ............................................................................................... 121
7.3.2 Excreta Disposal And Waste Water Management .................................................................. 134
7.3.3 Improvement Of Integrated Solid Waste Management ....................................................... 145
7.3.4 Improvement Of Storm Water Management In Belgaum ................................................... 150
7.4. ENABLING AND SUSTAINING STRATEGIES .................................................................................. 151
CITY SANITATION PLAN BELGAUM
ADMINISTRATIVE STAFF COLLEGE OF INDIA, HYDERABAD 5 | P a g e
7.4.1 Awareness Raising, Hygiene Promotion And Community Participation. .................... 151
7.4.2 Finacial Requirements And Financing Mechanisms ............................................................. 162
7.4.3 Institutional Arrangement And Responsibility ....................................................................... 167
7.5. MONITORING AND EVALUATION ..................................................................................................... 172
7.5.1 Monitoring And Review .................................................................................................................... 172
7.5.2 Launching Reward Scheme: ............................................................................................................ 173
7.5.3 Incentives And Disincentives By Mc/Nps ................................................................................. 174
GLOSSARY .......................................................................................................................................... 175
ANNEXURE ......................................................................................................................................... 178
ANNEXURE1: TECHNOLOGY OPTION IN URBAN SANITATION ......................................................... 178
ANNEXURE 2: GOOD PRACTICES ..................................................................................................................... 183
ANNEXURE 3: REVIEWED POLICIES, LEGAL AND ADMINISTRATIVE FRAMEWORK AND
PROGRAMMES ......................................................................................................................................................... 186
ANNEXURE 4: BUILDING APPLICATION RECEIPT ................................................................................... 190
ANNEXURE 5: CSTF CONSTITUTION IN BELGAUM ................................................................................. 191
ANNEXURE 6: FIRST CSTF WORKSHOP PROCEEDINGS, BELGAUM ................................................. 192
ANNEXURE 8: SECONDARY DATA FORMATS – PROFILING OF THE ULBS .................................... 195
ANNEXURE 9: PRIMARY DATA SURVEY FORMATS ................................................................................. 209
LIST OF TABLES
Table 1:Broad framework of CSP ............................................................................................................................ 26
Table 2: Research techniques with the tasks identified ................................................................................ 27
Table 3: Surveys and sample numbers ................................................................................................................. 28
Table 4: Chronological details of activities concerning Belgaum CSP ..................................................... 30
Table 5: CSP Content self-assessment ................................................................................................................... 33
Table 6: Guide for self-assessment of CSP CONTENT ..................................................................................... 36
Table 7: CSP Process Self-Assessment .................................................................................................................. 37
Table 8: Guide for self-assessment of CSP PROCESS....................................................................................... 38
Table 9: City Colour Codes: Categories ................................................................................................................. 42
Table 10: Cities and City Color Codes .................................................................................................................... 42
Table 11: Schedule details of MSW rules, 2000 ................................................................................................ 43
Table 12: Future population projections using various methods ............................................................. 55
Table 13: Future population projections ............................................................................................................. 55
Table 14: Wardwise population distribution and growth potential ........................................................ 56

CITY SANITATION PLAN BELGAUM
ADMINISTRATIVE STAFF COLLEGE OF INDIA, HYDERABAD 6 | P a g e
Table 15: Ward density and growth potential .................................................................................................. 57
Table 16f: Details of slum areas, CCB .................................................................................................................... 59
Table 17: Existing land use analysis of Belgaum – 2001 ............................................................................... 65
Table 18 Sanitation arrangement of Belgaum City Corporation ................................................................ 71
Table 19: Details of sanitation in slum areas, CCB .......................................................................................... 73
Table 20: Details of OD areas, CCB ......................................................................................................................... 78
Table 21 Details Of Community Toilets In Residential / Slum Areas ...................................................... 79
Table 22 Details of Public toilets and their usage pattern ............................................................................ 81
Table 23 ward wise Numbers And Percentage Of Floating Population .................................................. 84
Table 24: Type of govt. schools w.r.t categories ............................................................................................... 85
Table 25 Sludge/Septage Equipment And Mangement ................................................................................. 88
Table 26: Sewerage And Sanitation – Service Level Benchmarks, Belgaum City Corporation ..... 89
Table 27: Projections Of Waste Water .................................................................................................................. 90
Table 28 Details of the coverage of storm water drains,CCB ...................................................................... 92
Table 29 HHs in water logging areas, CCB .......................................................................................................... 92
Table 30: Storm Water Drainage System – Service Level Benchmarks, CCB ....................................... 93
Table 31: Road Category And Their Lengths ..................................................................................................... 95
Table 32 Details Of Vehicles Used For To Door To Door Waste Collection ........................................... 97
Table 33 : Solid Waste Management – Service Level Benchmarks,CCB .................................................. 98
Table 34: Projections For Solid Waste Generation In Future ...................................................................... 99
Table 35 Expenditure details of the well .......................................................................................................... 100
Table 36 Ward Wise Connection Details ........................................................................................................... 101
Table 37: Details of the coverage of the Water Supply System (2009) ................................................. 102
Table 38: Water Supply Services, CCB ................................................................................................................ 103
Table 39: Projections For Water Demand ......................................................................................................... 103
Table 40 Cost Details Of The Project ................................................................................................................... 104
Table 41 Ulb Wise Investment For Works (Amount In Rs. Crores) : ..................................................... 104
Table 42 Technical details of 24 / 7 Demo zones of Belgaum .................................................................. 105
Table 43 Raw water pumping details ................................................................................................................. 106
Table 44 Estimate For Revenue Receipts .......................................................................................................... 107
Table 45 Estimate For Revenue Payments ....................................................................................................... 108
Table 46 Estimates for Capital Receipts & Payments ................................................................................... 108
Table 47: Sanitation Ranking for Belgaum City Corporation .................................................................... 112
Table 48: Goals for City-wide Sanitation Planning, Belgaum .................................................................... 115
Table 49: Components of City Wide Sanitation Strategies ......................................................................... 117
Table 50: Norms for Household Sanitation ...................................................................................................... 118
CITY SANITATION PLAN BELGAUM
ADMINISTRATIVE STAFF COLLEGE OF INDIA, HYDERABAD 7 | P a g e
Table 51: Indicative figures in Household Sanitation Arrangements over CSP Implementation
Period ............................................................................................................................................................................... 122
Table 52: Estimation of Proposed Pay and Use complex (Each unit) .................................................... 124
Table 53 Grouping of un-served wards w.r.t. public conveniences, CCB ............................................ 126
Table 54: Addressing access to various categories of uses ....................................................................... 130
Table 55: Management Strategies ....................................................................................................................... 131
Table 56: Intended benefits for the six technology systems. ................................................................... 135
Table 57: Waste water treatment options for Non UGD areas ................................................................. 135
Table 58: sustaining Starters for UGD ............................................................................................................... 136
Table 59: Degree of Treatment Needed for Land Application .................................................................. 139
Table 60: Cost of Construction of the Wastewater Treatment system ................................................. 141
Table 61:Cost of Operation and Maintenance ................................................................................................. 142
Table 62: Land Requirement .................................................................................................................................. 142
Table 63: ISWM Action Plan ................................................................................................................................... 146
Table 64 IEC Plan 1 ..................................................................................................................................................... 152
Table 65: IEC Plan 2 and Advocacy Plan for Environmental Sanitation .............................................. 154
Table 66: Methods and implementation of awareness activities ............................................................ 156
Table 67: Phase wise distribution of works .................................................................................................... 158
Table 68 Fund Convergence for CSP .................................................................................................................... 163
Table 69 Financial Requirements and Mechanisms...................................................................................... 165
Table 70: Comparison of Standards (issued by CPCB) with effluent values ....................................... 173
Table 71:Recommended sizes of septic tanks ................................................................................................. 179
Table 72: Reviewed Policies, Legal and Administrative Framework and Programmes ................ 186
Table 73: Functions of ULB...................................................................................................................................... 187
LIST OF FIGURES
Figure 1: CSP Implementation Roadmap ............................................................................................................. 23
Figure 2: Process for CSP Data Assimilation ...................................................................................................... 28
Figure 3 Regional Linkages ....................................................................................................................................... 53
Figure 4 Trends in population growth ................................................................................................................. 54
Figure 5: Organizational Structure, Belgaum City Corporation ................................................................. 67
Figure 6: Percentage distribution of HHs w.r.t. type of toilets ................................................................... 71
Figure 7: Percentage distribution of HHs w.r.t. type of toilets ................................................................... 72
Figure 8: Functionality of toilets in govt. schools ............................................................................................. 86
CITY SANITATION PLAN BELGAUM
ADMINISTRATIVE STAFF COLLEGE OF INDIA, HYDERABAD 8 | P a g e
Figure 9 % availability of toilets for girls & boys ............................................................................................. 86
Figure 10 water facility availability in schools .................................................................................................. 87
Figure 11 waste water disposal in schools ......................................................................................................... 87
Figure 12 Percentage distribution of HHs w.r.t waste disposal ................................................................. 94
Figure 13 Satisfaction with waste collection system ...................................................................................... 95
Figure 14 Collection & generation of solid waste ............................................................................................ 96
Figure 15 Estimate for Revenue Receipts & Revenue Payments ............................................................. 109
Figure 16 Estimate of Capital Receipts & Payments ..................................................................................... 110
Figure 17: Components of CSP strategies .......................................................................................................... 120
Figure 18: Proposed institutional set-up for sanitation .............................................................................. 171
Figure 19: Receipt for building application for ULBs ................................................................................... 190
Figure 20 CSTF constitution notification letter .............................................................................................. 191
LIST OF MAPS
Map 1: Ward Densities and growth potential .................................................................................................... 58
Map 2 Notified & Non-notified slum location map, CCB ................................................................................ 64
Map 3: Identified Open Defecation Wards in CCB ............................................................................................ 78
Map 4: Location of community and public toilets ............................................................................................ 83
Map 5 proposed Locations for Public Toilets .................................................................................................. 126
LIST OF INFORMATION BOXES
Information Box 1: National Urban Sanitation Policy (Nusp) ..................................................................... 19
Information Box 2: Definitions Of Household Sanitation Arrangements According To Census
2001 .................................................................................................................................................................................... 71
Information Box 3: Guidelines Of Total Sanitation Campaign(Tsc) For School Sanitation............ 86
Information Box 4: Septic Tank Maintenance Norms .................................................................................... 89
Information Box 5: Sewerage And Sanitation – The Key Observations .................................................. 90
Information Box 6: Storm Water Drainage – The Key Observations ....................................................... 93
Information Box 7: Initiatives By The Government For Swm .................................................................... 98
Information Box 11: Solid Waste Management – The Key Observations ............................................... 99
Information Box 9: Water Supply System – The Key Observations ....................................................... 103
Information Box 10: Assumptions For City Sanitation Plan ...................................................................... 118
Information Box 11: Location Needs For Community/Public Toilets ................................................... 125

CITY SANITATION PLAN BELGAUM
ADMINISTRATIVE STAFF COLLEGE OF INDIA, HYDERABAD 9 | P a g e
Information Box 12: Finance Options Models For Community Latrines .............................................. 127
Information Box 13: Proposed Scheme For Mechanical Aid For Cleaning Of Sewers And Septic
Tanks (Smacss) ............................................................................................................................................................. 166
Information Box 16: Tools To Measure 100% Sanitation Milestone Achievements ....................... 172
Information Box 15: The Condominial Sewerage System In Brazil ........................................................ 184
CITY SANITATION PLAN BELGAUM
ADMINISTRATIVE STAFF COLLEGE OF INDIA, HYDERABAD 10 | P a g e
ABBREVIATIONS
ASCI Administrative Staff College of India
BOD Biological Oxygen Demand
BOT Buy-Own-Operate
BPL Below Poverty Line
BSUP Basic Services to the Urban Poor
CAA Constitution Amendment Act
CD&MA Commissioner and Director of Municipal Administration
COD Chemical Oxygen Demand
CPHEEO Central Public Health and Environmental Engineering Organization
CSP City Sanitation Plan
CT Community Toilets
CTF City sanitation Task Force
DMA Directorate of Municipal Administration
DMHO District Medical Health Officer
DPR Detailed Project Report
ELSR Elevated Service Reservoir
FGD Focus Group Discussions
FY Financial Year
GIS Geographic Information System
GoK Government of Karnataka
GoI Government of India
HHs Households
HSC House Service Connections
IEC Information, Education, Communication
ILCS Integrated Low Cost Sanitation
JnNURM Jawaharlal Nehru National Urban Renewal Mission
MAUD Municipal Administration and Urban Development
MSL Mean Sea Level
MSW Municipal Solid Waste
CCB City Corporation Belgaum
NRW Non Revenue Water
NUSP National Urban Sanitation Policy
ODF Open Defecation
O&M Operations and Maintenance
PHED Public Health and Engineering Department
PSP Public Stand Posts
RVM Rajiv Vidya Mission
RWA Residents Welfare Association
SI Sanitary Inspector
SLB Service Level Benchmarking
SJSRY Swarna Jayanti Shehri Rojgar Yojana
SSA Sarva Shiksha Abhiyan
SSHE School Sanitation and Hygiene Education
STP Sewage Treatment Plant
CITY SANITATION PLAN BELGAUM
ADMINISTRATIVE STAFF COLLEGE OF INDIA, HYDERABAD 11 | P a g e
SWM Solid Waste Management
ULB Urban Local Body
UGD Under Ground Drainage
WC Water Closet
Units of Measure
lpcd litres per capita per day
m metre
MLD Million Litres per Day
MT Metric Tons
sq.m square metre
TPD Tonnes per Day
CITY SANITATION PLAN BELGAUM
ADMINISTRATIVE STAFF COLLEGE OF INDIA, HYDERABAD 12 | P a g e
EXECUTIVE SUMMARY
This document presents City Sanitation Plan (CSP) of Belgaum City Corporation. Belgaum is one
of the 8 cities whose CSPs have been prepared by ASCI in partnership with Directorate of
Municipal Administration (DMA), Government of Karnataka and City Managers’ Association,
Karnataka (CMAK)
The CSP process in Belgaum endeavors to identify the various areas that are affected by various
issues with different sectors of sanitation, (viz. sewerage, solid waste management, storm water
drainage and water supply) and also to provide guidance towards the solutions of the said
issues.
This has been made possible through an extensive participatory approach including field visits,
repeated discussions with various stakeholders, sample surveys, etc. Acquiring and assimilation
of varied secondary information also formed an important part of the process.
The plan preparation process was carried out using methodology requiring wide range of data
in various areas and population groups, to develop robust analysis and produce outputs. The
data collection included both primary and secondary sources and detail analysis of them.
The analysis in turn has paved the way for the preparation of the proposal for various strategies
to alleviate the sanitary conditions of the place, so that Belgaum may well overcome the various
plaguing issues and thereby a healthy sanitized environment prevails for the citizens.
The report has two major sections –
A. The Situational Analysis
B. The Sanitation Strategies.
The former section deals with depicting the city and its present status with regards to
sanitation. The aim is to highlight the existing conditions regarding access and coverage of
sanitary facilities, identify the gaps and striking issues, and understand the behavioral aspects of
various sections of the society. This section is covered from Chapter 1 to Chapter 5.
The latter section thereafter provides strategies and solutions to bridge the identified gaps,
mitigate the existing issues, and provide ways and means to aid the sustenance of the existing
and proposed strategies and projects. There have been presented in Chapter 6.
A. The Situational Analysis
Chapter 1 gives an introduction to the CSP process, its background, and the objectives behind it.
This is followed by the step-by-step methodology of the CSP process, as well as the status of the
CSP for the particular city. The process of collection of baseline information – both primary and
secondary, has been explained at length. The chapter also presents a review of the policies &
programmes that are prevalent and followed in the state to improve the sanitation conditions in
the urban areas. It gives detailed insight into the NUSP and the sanitation ranking of cities, the
MSW 2000 rules, the ILCS projects, and other such projects which have been taken up for the
improvement of access and coverage of sanitary facilities.

CITY SANITATION PLAN BELGAUM
ADMINISTRATIVE STAFF COLLEGE OF INDIA, HYDERABAD 13 | P a g e
Chapter 2 deals with the City Profile where the various aspects of the city are discussed in
order to get a fair idea about the city itself. Aspects such as location, regional linkages,
demography, economic, landuse and housing profiles, the urban governance, the slums and
squatter settlements are discussed in brief.
Chapter 3 forms the central focus of Section A – i.e. The Situational Analysis. The aim of the
chapter is to present a clear picture of the existing systems of sanitation in the city. It contains
four sectors – Sewerage and sanitation, Storm water system, Solid waste Management and the
Water supply system of the city. Within each sector, the gaps and issues in access and coverage
are identified, the problem areas are clearly demarcated, the performance of each of the sectors
is evaluated through Service Level Benchmarking (SLB) indicators, and projections are also
made for the future years.
Chapter 4 aims to evaluate the institutional capacity and the financial structure, to find out if
the ULB along with the associated organizations is able to cater to the sanitation needs of the
society, with regards to both adequate qualified personnel and adequate financial sources.
Chapter 5 presents the evaluation of the sanitation condition of Belgaum City Corporation on
the basis of the indicators and the scoring methodology used by MoUD for the sanitation
ranking of cities.
B. The Sanitation Strategies
The strategies are presented in Chapter 6. It provides the vision for the CSP and its goals, and
the basic guiding principles on which the strategies are based. Thereafter, strategies have been
provided to improve coverage and access to sanitation facilities, to implement effectively the
various proposals, and options and mechanisms for effectively financing the strategies and
proposals along with proper phasing
CITY SANITATION PLAN BELGAUM
ADMINISTRATIVE STAFF COLLEGE OF INDIA, HYDERABAD 14 | P a g e
ACKNOWLEDGEMENTS
“Water is Life and Sanitation is Dignity.”
The above quote well impresses upon one the fact that sanitation is the most important aspect
for a healthy and dignified living.
Often sanitation is considered to be synonymous to solid waste management, especially in the
ULBs. To set right this flawed concept, sanitation ideally can be defined as safe management of
human excreta, including its safe confinement treatment, disposal and associated hygiene-
related practices. With increasing urbanization sanitation is becoming a severe problem in all
cities in our country.
Hence there arises a need for integrated solutions to take account of the various elements of
environmental sanitation, fecal management and disposal, solid waste management; generation
of industrial and other specialized / hazardous wastes; drainage; as also the management of
drinking water supply. This is the main aim and purpose behind the preparation of City
Sanitation Plans.
We take an opportunity to express our sincere gratitude to all the people who have helped and
supported us throughout the process which made the completion of the report possible.
Extensive and rigorous discussions with the APMDP and the ULB officials gave a well formed
shape to the effort. Hence, their help and co-operation is very much solicited for the success of
the CSP.
The City Sanitation Plan for the city of Belgaum looks forward to develop effective strategies for
safe disposal of solid and liquid waste generating throughout the city by suggesting
environment friendly low cost technical options for the same.
Prof. Srinivasa Chary Vedala
Dean & Director
Centre for Energy, Environment,Urban Governance & Infrastructure Development
(CEEUG&ID),
Administrative Staff College of India (ASCI)
CITY SANITATION PLAN BELGAUM
ADMINISTRATIVE STAFF COLLEGE OF INDIA, HYDERABAD 15 | P a g e
CSTF MEMBERS
The City Sanitation Task Force (CSTF) plays a very important part in the formulation and
implementation of the CSP in a city. The importance of CSTF and their functions were clearly
portrayed to the authorities at DMA, CMAK and the officials from various ULBs at the State Level
Launch Workshop on 25th November, 2010. Based on the discussions from the workshop, the
ULBs formed the CSTF for their respective cities. The list of CSTF members went through quite a
number of revisions. The final list of CSTF members for Belgaum is as follows.

CITY SANITATION PLAN BELGAUM
ADMINISTRATIVE STAFF COLLEGE OF INDIA, HYDERABAD 16 | P a g e
FOREWORD (by CSTF Chairperson)

CITY SANITATION PLAN BELGAUM
ADMINISTRATIVE STAFF COLLEGE OF INDIA, HYDERABAD 17 | P a g e
ASCI TEAM MEMBERS
The team which has put forth dedicated efforts towards the completion of this CSP report,
consists of the following people.
Prof. Srinivasa Chary Vedala, Dean and Director, Centre for Energy, Environment, Urban
Governance & Infrastructure Development
Mrs. Vasavi Narla, Assistant Professor
Mr. Anil Kumar Palakodeti, Senior Research Associate
Ms. Lakshmy Poorna, Senior Research Associate
Ms. Uzra Sultana, Senior Research Associate
Ms Sneha Kesiraju, Senior Research Associate

CITY SANITATION PLAN BELGAUM
ADMINISTRATIVE STAFF COLLEGE OF INDIA, HYDERABAD 18 | P a g e
Chapter 1
Introduction
1.1 BACKGROUND
The National Urban sanitation Policy launched during 2008 envisages “All Indian cities and
towns become totally sanitized, healthy and liveable and ensure and sustain good public health
and environmental outcomes for all their citizens with a special focus on hygienic and
affordable sanitation facilities for the urban poor and women.”
The overall goal of National policy is to transform Urban India into community-driven, totally
sanitized, healthy and liveable cities and towns. Specific goals include:
A. Awareness Generation and Behaviour Change,
B. Open Defecation Free Cities,
C. Integrated City-Wide Sanitation,
D. Sanitary and Safe Disposal, and
E. Proper Operation & Maintenance of all Sanitary Installations.
Against this background, and in recognition of its importance to national and state development,
the Integrated City-Wide Sanitation Plan for Belgaum City is prepared to provide city-wide
systematic approach and framework to achieve the goals contemplated under NUSP.
1.2 OBJECTIVES OF CITY-WIDE SANITATION PLAN
The City Sanitation Plan (CSP) is aimed at developing and maintaining a clean, safe and pleasant
physical environment in Belgaum city to promote social, economic and physical well-being of all
sections of the population. It encompasses plan of action for achieving 100% sanitation in the
city of Belgaum through demand generation and awareness campaign, sustainable technology
selection, construction and maintenance of sanitary infrastructure, provision of services, O&M
issues, institutional roles and responsibilities, public education, community and individual
action, regulation and legislation.
The principal components of city-wide approach include:
(a) Collection and sanitary disposal of wastes, including solid wastes, liquid wastes, excreta,
industrial wastes, clinical and other hazardous wastes;
(b) Storm water drainage;
(c) Cleansing of thoroughfares, markets and other public spaces;
(d) Environmental sanitation education;
(e) Inspection and enforcement of sanitary regulations;
(f) Monitoring the observance of environmental standards.
CITY SANITATION PLAN BELGAUM
ADMINISTRATIVE STAFF COLLEGE OF INDIA, HYDERABAD 19 | P a g e
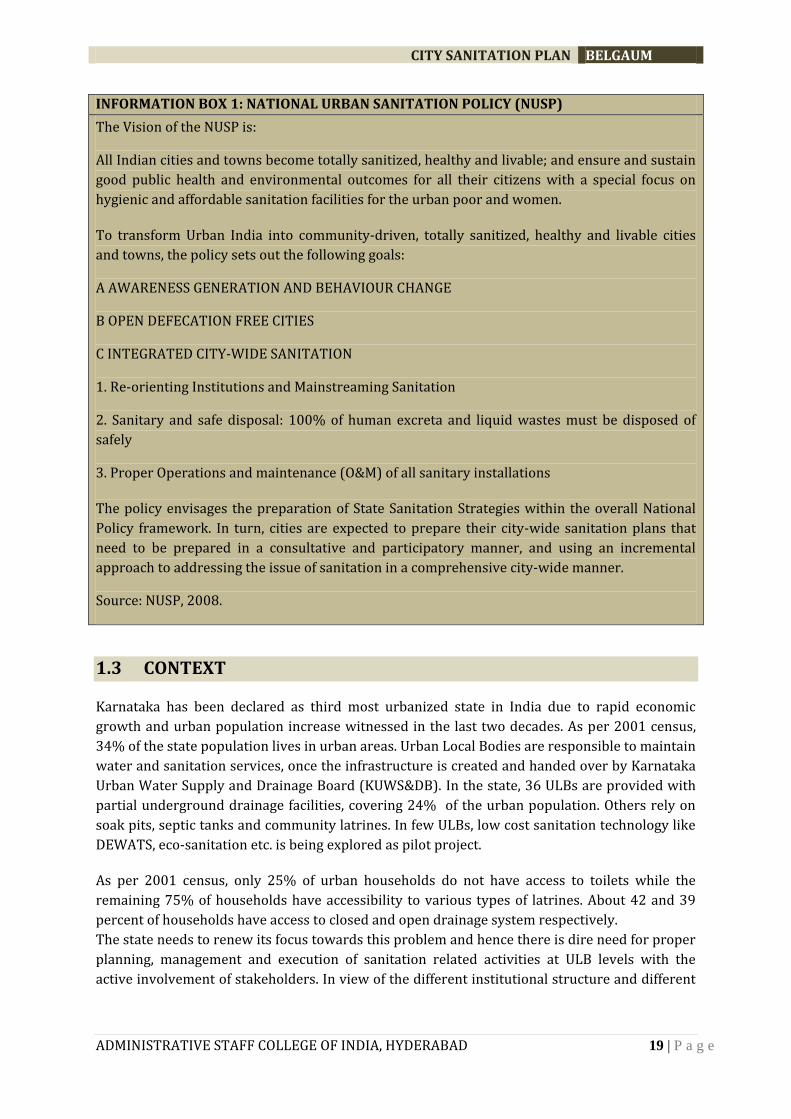
INFORMATION BOX 1: NATIONAL URBAN SANITATION POLICY (NUSP)
The Vision of the NUSP is:
All Indian cities and towns become totally sanitized, healthy and livable; and ensure and sustain
good public health and environmental outcomes for all their citizens with a special focus on
hygienic and affordable sanitation facilities for the urban poor and women.
To transform Urban India into community-driven, totally sanitized, healthy and livable cities
and towns, the policy sets out the following goals:
A AWARENESS GENERATION AND BEHAVIOUR CHANGE
B OPEN DEFECATION FREE CITIES
C INTEGRATED CITY-WIDE SANITATION
1. Re-orienting Institutions and Mainstreaming Sanitation
2. Sanitary and safe disposal: 100% of human excreta and liquid wastes must be disposed of
safely
3. Proper Operations and maintenance (O&M) of all sanitary installations
The policy envisages the preparation of State Sanitation Strategies within the overall National
Policy framework. In turn, cities are expected to prepare their city-wide sanitation plans that
need to be prepared in a consultative and participatory manner, and using an incremental
approach to addressing the issue of sanitation in a comprehensive city-wide manner.
Source: NUSP, 2008.
1.3 CONTEXT
Karnataka has been declared as third most urbanized state in India due to rapid economic
growth and urban population increase witnessed in the last two decades. As per 2001 census,
34% of the state population lives in urban areas. Urban Local Bodies are responsible to maintain
water and sanitation services, once the infrastructure is created and handed over by Karnataka
Urban Water Supply and Drainage Board (KUWS&DB). In the state, 36 ULBs are provided with
partial underground drainage facilities, covering 24% of the urban population. Others rely on
soak pits, septic tanks and community latrines. In few ULBs, low cost sanitation technology like
DEWATS, eco-sanitation etc. is being explored as pilot project.
As per 2001 census, only 25% of urban households do not have access to toilets while the
remaining 75% of households have accessibility to various types of latrines. About 42 and 39
percent of households have access to closed and open drainage system respectively.
The state needs to renew its focus towards this problem and hence there is dire need for proper
planning, management and execution of sanitation related activities at ULB levels with the
active involvement of stakeholders. In view of the different institutional structure and different

CITY SANITATION PLAN BELGAUM
ADMINISTRATIVE STAFF COLLEGE OF INDIA, HYDERABAD 20 | P a g e
sets of issues involved in the delivery of the services in urban areas, the need for a separate
policy statement for sanitation sector is felt.
In spite of various programmes implemented by the State Government and the Urban Local
Bodies (ULBs) the problem of urban sanitation has not been resolved yet. Therefore, the State
Government, as a decisive step to resolve the problems pertaining to Urban Sanitation, has
initiated the Karnataka State Urban Sanitation Policy (KSUSP) and City Sanitation Plans in
consonance with the NUSP. CSPs are envisaged to be prepared in a consultative manner for
enhancing ownership among stakeholders in the city. The cities selected for the aforesaid
purpose are as follows:
Bellary
BELGAUM
Gulbarga
Hubli-Dharwad
Mangalore
Mysore
Shimoga
Tumkur
Most of these towns also embarked on implementing Under Ground Drainage (UGD) system
with huge capital investments while accessing projects under different schemes. At this juncture
GoK felt the need to review sanitation situation, problems and opportunities to improve
sanitation in these cities/ towns particularly and in the state. This will mandate and guide State
and all ULBs to plan for delivering sanitary outcomes.

CITY SANITATION PLAN BELGAUM
ADMINISTRATIVE STAFF COLLEGE OF INDIA, HYDERABAD 21 | P a g e
1.4 CITY SANITATION PLANNING IN BELGAUM
CSP tries to detail out how the city plan is to deliver the sanitary outcomes defined in NUSP and
state strategy, in coordination with other line departments to ensure a well collaborated
approach engaging all stakeholders including governmental and nongovernmental service
providers. The scope of CSPs broadly encompass following major tasks:
A. COLLECTION OF SECONDARY DATA
Secondary data collection and review of available data from various sources as per demands of
CSP (the officials of City Corporations, Water Boards, or any other parastatal agencies).
B. PREPARATORY WORK (PROFILING OF ULB AND PREPARING CITY REPORT)
As a preparatory work, a preliminary profiling of ULBs will be undertaken using SLB indicators
and City Ratings to highlight the open defecation free (ODF) status, sanitation situation, health
indicators and current projects. This will also guide further investigation through field visits
and primary data collection.
C. STAKEHOLDER ANALYSIS AND CITY SANITATION TASK FORCE (CSTF)
CONSTITUTION
As per the requirement of CSP, major role is to be played by the members of institutions,
organizations, individuals, NGOs, academics, journals, local councilors, industry owners,
consultants, representatives of private sector, etc. Constitution of CSTF was facilitated by
drawing members from these groups in consensus with ULBs who will be constantly
supporting the CSP preparation by analyzing the strengths and competencies required to
overcome the current situation and for better sanitation facilities.
D. PRIMARY DATA COLLECTION AND SAMPLING
Data collection to a limited extent through rapid field surveys, case studies, consultations,
transacts walks, FGDs, etc. to validate and supplement the secondary data(obtained in step 4.1)
The data will be collected as per formats/templates and questionnaires after brief orientation
to the stakeholders. Random stratified sampling in typical cases (slums, schools, wards
commercial places, public latrines, surface drains, solid waste arrangements, industries, health
and educational Institutions etc.) evenly distributed all over the town to cover all
representative types of situations.
E. REVIEW/STUDY OF THE CURRENT PRACTICES
This includes a review of sector strategies in water, sanitation and solid waste management at
state and city level. DPRs prepared on these sectors will be studied in detail and analysed. Also
regional and state urban strategies to know the dynamics of urbanisation pattern will be
looked in to.
F. CONDITION ASSESSMENT
Choices of toilet in the city and their effectiveness along with pictures on super structure,
below ground, design models and materials used for different uses like residential, industries,
public spaces and new areas. Field tests facilitation (soil percolation, waste water effluents,
water bodies’ contamination) in critical points in drains, ground water after a reconnaissance
survey which would also assist in gauging the situation where the information is not adequate.
CITY SANITATION PLAN BELGAUM
ADMINISTRATIVE STAFF COLLEGE OF INDIA, HYDERABAD 22 | P a g e
G. WARD PROFILING AS PER CITY SANITATION RANKING PARAMETERS
City as a number of spatial units will look at indicators pertaining to the practice of open
defecation, access to sanitation (individual, community and public), collection, treatment and
disposal of solid and liquid wastes, proper upkeep and maintenance of the sanitation
infrastructure, clear institutional roles and responsibilities and improvements in health and
environment as per the “City Sanitation Rating”.
H. COMMUNICATION GAP AND NEEDS ASSESSMENT
IEC needs assessment will be carried out and broad communication strategy will be developed
in consultation with the ULB officials and other stakeholders.
I. DEVELOPING A SITUATION ANALYSIS REPORT
The situation analysis, prepared by taking into consideration the ground realities, local
conditions, and assessment of the present sanitation situation. It will include inputs from all
the above activities with the details of existing household sanitation arrangements, public
sanitary conveniences, wastewater disposal, solid waste management and water supply. The
report will also include an analysis of the ULB legal framework and byelaws, financial analysis
of the ULB, data on key public and environmental health, user charges, willingness to pay, etc.
J. FORMULATION OF VISION
This involves understanding the major aspirations with respect to urban development in the
State through consultations and building an overarching vision that may be appropriate to the
articulations. This involves following;
Secondary information, data analysis and report review
Brainstorming with key stakeholders and focus groups
Understanding visions of concerned sectors and other constituents e.g., cities and
development agencies and concerned authorities.
K. DEVELOPMENT OF STRATEGY
This involves understanding the major issues of the sector, major priorities laid down and an
assessment of how the current arrangements are working with respect to urban development
in the city. Also, the key strengths, major weaknesses, potential opportunities as well as likely
threats would also be analysed to move towards the identification of the action
areas/intervention areas that form the strategy development. This involves:
Completion of information analysis, even with quick estimates, and review of
current policies and priorities
Consultations with key stakeholders/ focus groups concerning
Detailed discussion with departments/ agencies/ cities/ authorities
L. PREPARATION OF DRAFT CSP
Finalization of CSP along with recommendations based on the situation and solutions for
making city open defecation free and totally sanitized, public toilet and community toilets
models and operational models; proto - type design recommendation for all typical situations,
waste disposal mechanisms, starters for sewerage layouts and estimation of requirement in
terms of capacities, quantity and finances.

CITY SANITATION PLAN BELGAUM
ADMINISTRATIVE STAFF COLLEGE OF INDIA, HYDERABAD 23 | P a g e
M. PREPARATION OF IMPLEMENTATION ROAD MAP
This involves identifying and documenting interventions for the improvement of sanitation.
The cost estimates of such interventions (only ball park figures); the institutional responsibility
as well as broad timelines for implementation will be indicated in the CSP.
Figure 1: CSP Implementation Roadmap
CITY SANITATION PLAN BELGAUM
ADMINISTRATIVE STAFF COLLEGE OF INDIA, HYDERABAD 24 | P a g e
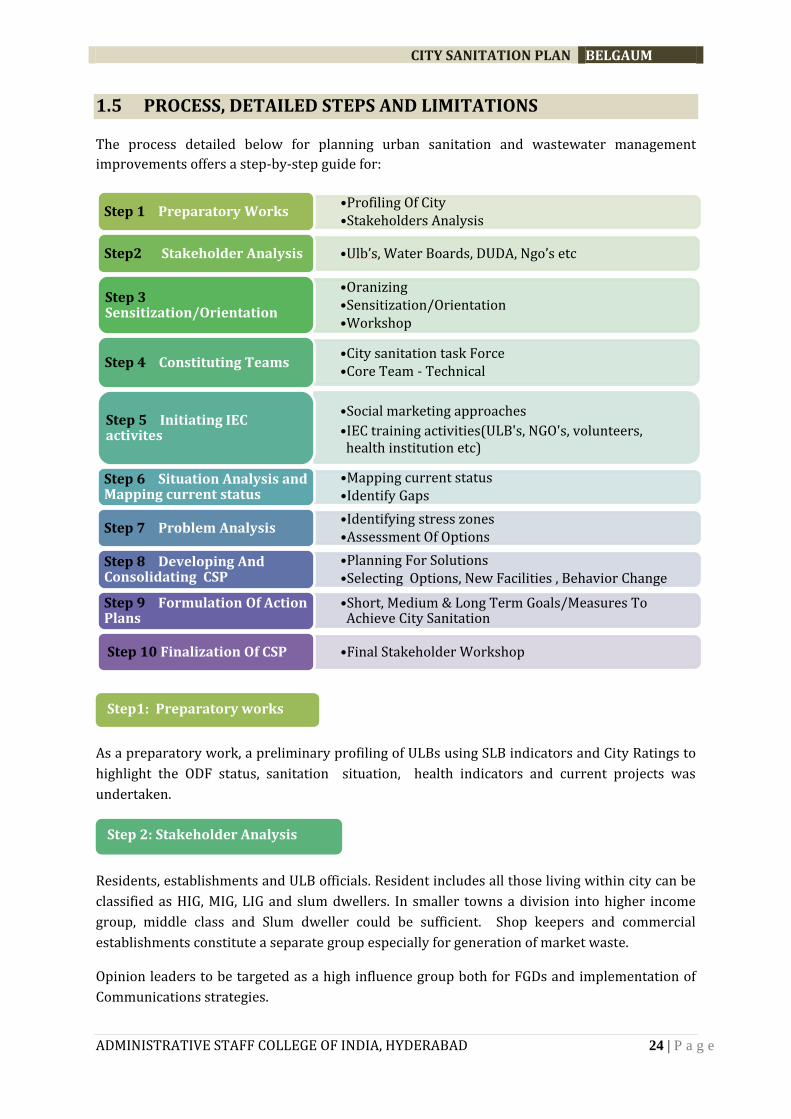
1.5 PROCESS, DETAILED STEPS AND LIMITATIONS
The process detailed below for planning urban sanitation and wastewater management
improvements offers a step-by-step guide for:
As a preparatory work, a preliminary profiling of ULBs using SLB indicators and City Ratings to
highlight the ODF status, sanitation situation, health indicators and current projects was
undertaken.
Residents, establishments and ULB officials. Resident includes all those living within city can be
classified as HIG, MIG, LIG and slum dwellers. In smaller towns a division into higher income
group, middle class and Slum dweller could be sufficient. Shop keepers and commercial
establishments constitute a separate group especially for generation of market waste.
Opinion leaders to be targeted as a high influence group both for FGDs and implementation of
Communications strategies.
•Profiling Of City •Stakeholders Analysis
Step 1 Preparatory Works
•Ulb’s, Water Boards, DUDA, Ngo’s etc Step2 Stakeholder Analysis
•Oranizing •Sensitization/Orientation •Workshop
Step 3 Sensitization/Orientation
•City sanitation task Force •Core Team - Technical
Step 4 Constituting Teams
•Social marketing approaches
•IEC training activities(ULB's, NGO's, volunteers, health institution etc)
Step 5 Initiating IEC activites
•Mapping current status •Identify Gaps
Step 6 Situation Analysis and Mapping current status
•Identifying stress zones •Assessment Of Options
Step 7 Problem Analysis
•Planning For Solutions •Selecting Options, New Facilities , Behavior Change
Step 8 Developing And Consolidating CSP
•Short, Medium & Long Term Goals/Measures To Achieve City Sanitation
Step 9 Formulation Of Action Plans
•Final Stakeholder Workshop Step 10 Finalization Of CSP
Step1: Preparatory works
Step 2: Stakeholder Analysis
CITY SANITATION PLAN BELGAUM
ADMINISTRATIVE STAFF COLLEGE OF INDIA, HYDERABAD 25 | P a g e
Key officials-Commissioners, sanitation inspectors, medical/health officers,
Councilors, Community elders,
City media: newspapers reporters,
RWA office bearers,
NGOs,
Safaikaramcharies union office bearers,
Heads of Commercial establishments and shopkeepers, including public places such as bus
stands
Slum residents
Residents from neighborhoods
School teachers, employees
School children
2. Parameters: three key parameters
Environmental Sanitation SWM: market waste, domestic waste, waste segregation at
source and at collection point, waste disposal measures
ODF: public toilets, individual latrines, toilet maintenance, disposal of human waste,
UGS: awareness, user charges,
Issues on these parameters as explored in primary data will create a basis for topics to
be raised in FDGs
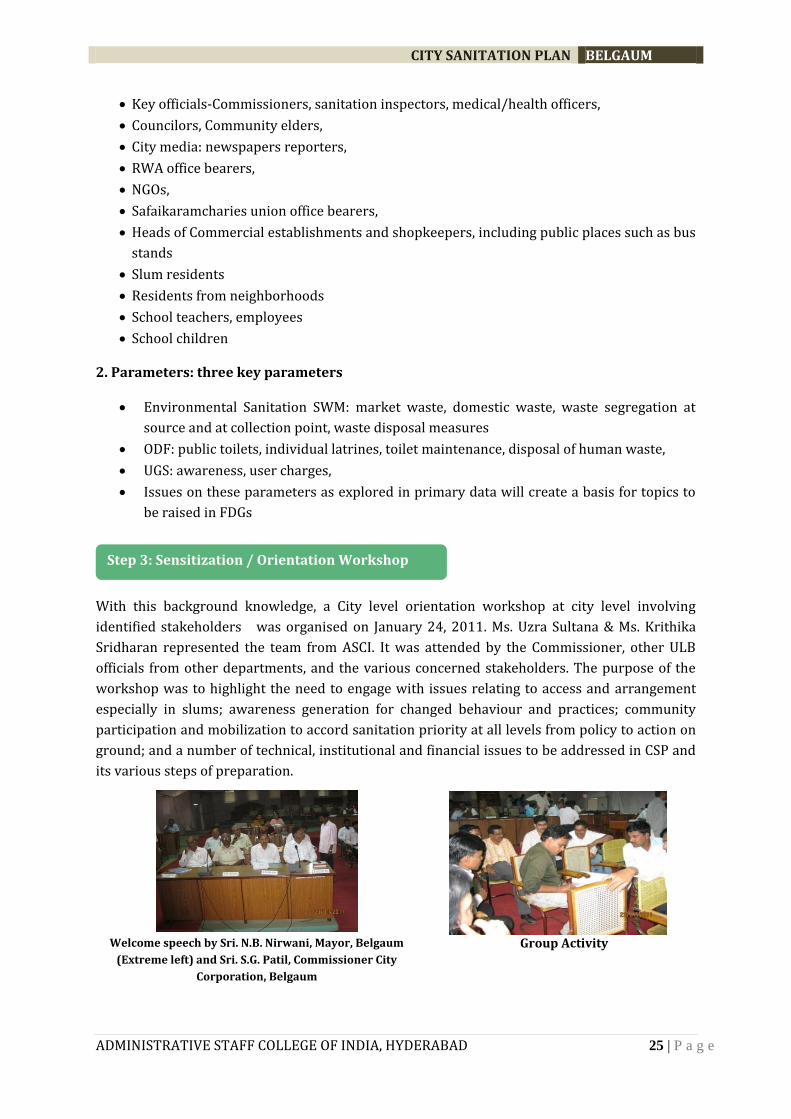
With this background knowledge, a City level orientation workshop at city level involving
identified stakeholders was organised on January 24, 2011. Ms. Uzra Sultana & Ms. Krithika
Sridharan represented the team from ASCI. It was attended by the Commissioner, other ULB
officials from other departments, and the various concerned stakeholders. The purpose of the
workshop was to highlight the need to engage with issues relating to access and arrangement
especially in slums; awareness generation for changed behaviour and practices; community
participation and mobilization to accord sanitation priority at all levels from policy to action on
ground; and a number of technical, institutional and financial issues to be addressed in CSP and
its various steps of preparation.
Welcome speech by Sri. N.B. Nirwani, Mayor, Belgaum
(Extreme left) and Sri. S.G. Patil, Commissioner City
Corporation, Belgaum
Group Activity
Step 3: Sensitization / Orientation Workshop
CITY SANITATION PLAN BELGAUM
ADMINISTRATIVE STAFF COLLEGE OF INDIA, HYDERABAD 26 | P a g e
a. City sanitation Task Force (CTF)
The first step in making the cities 100% sanitized is to elevate the consciousness about
sanitation in the mind of municipal agencies, government agencies and most importantly,
amongst the people of the city. For this purpose, CSTF has to be constituted in the ULB and it has
to organize a multi-stakeholder, multi-party meeting in the preparatory stage, and take a formal
resolution to make the city 100% sanitized. CSTF has been constituted in Belgaum City
Corporation.
The roles and responsibilities of CSTF include:
• Launching the City 100% Sanitation Campaign
• Generating awareness
• Approving materials and progress reports
• Approving the City Sanitation Plan
• Providing overall guidance
• Fixing of responsibilities on a permanent basis.
The objective of well driven IEC has to be demand-driven with social marketing approaches to
increase demand for toilets and ensure hygiene behaviours, promote no subsidies for household
toilets in future and encourage diversity in technology and design. For this purpose ULBs may
utilise suitable player for inter-personal IEC and training from the existing system like; ward
development committees, health institutions, schools, National Service Scheme (NSC)
Volunteers, the private sector (retailers, contractors, suppliers, plumbers, masons),
neighbourhood committees and NGOs, Angan Wadi workers.
The Situation Analysis, prepared by taking into consideration the ground realities, local
conditions, and assessment of the present sanitation situation has been undertaken and broad
framework is indicated below:
Table 1:Broad framework of CSP
Sectors Spatial units Finances Institutional
Service levels and
benchmarks for:
Solid Waste Management
Water Supply Storm Water
Household Sanitation Slums Public Sanitary
Conveniences School Sanitation Institutional
Sanitation Map
Cost Recovery–Policy–Tariffs–Collections–
Budget Transfers.
PPPs. Study of current
Institutional Arrangement – Policies, Plans, implementation, management.
Staffing, Organization &
Step 4: Constituting: City Sanitation Task Force
Core Team – Technical
Step 5: Initiating IEC activities
Step 6: Situation Analysis and Mapping Current Status
CITY SANITATION PLAN BELGAUM
ADMINISTRATIVE STAFF COLLEGE OF INDIA, HYDERABAD 27 | P a g e
Drainage Health Situation –
Statistics and Anecdotal
Comment
Environmental Situation
– Local and Downstream
and Groundwater.
spatially Any town specific
areas.
programmes (SJSRY, ILCS, etc
Competence
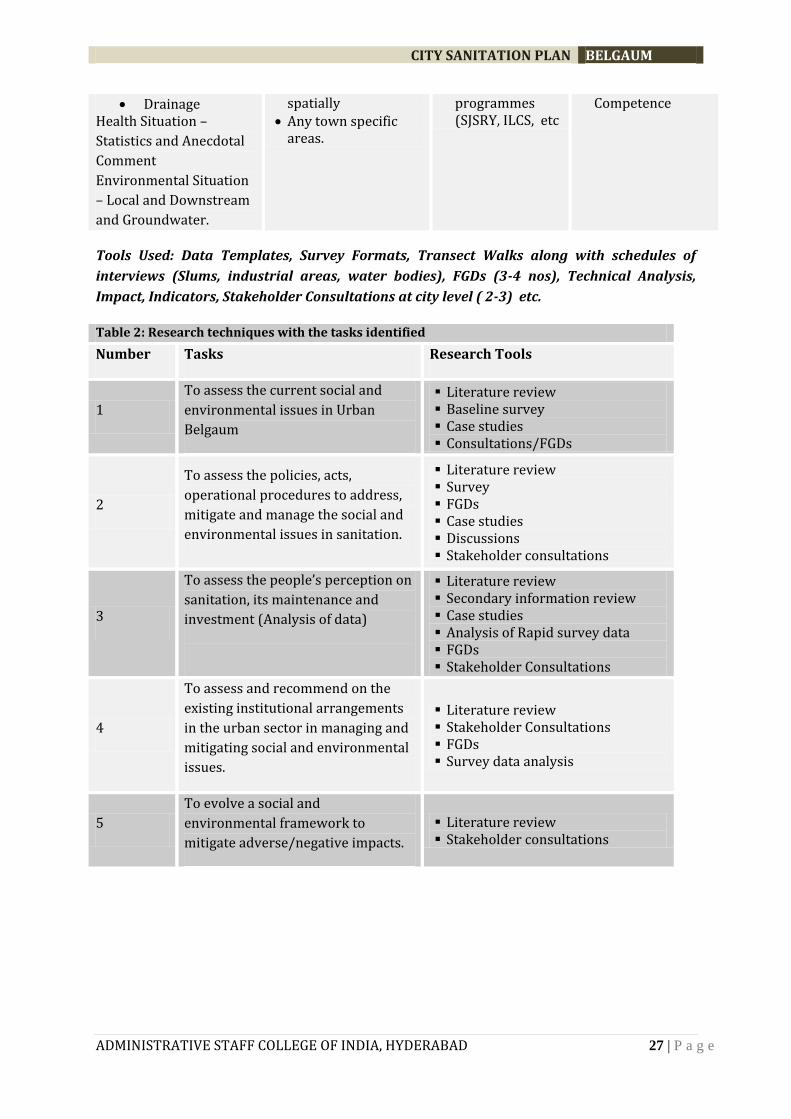
Tools Used: Data Templates, Survey Formats, Transect Walks along with schedules of
interviews (Slums, industrial areas, water bodies), FGDs (3-4 nos), Technical Analysis,
Impact, Indicators, Stakeholder Consultations at city level ( 2-3) etc.
Table 2: Research techniques with the tasks identified
Number Tasks Research Tools
1
To assess the current social and
environmental issues in Urban
Belgaum
Literature review Baseline survey Case studies Consultations/FGDs
2
To assess the policies, acts,
operational procedures to address,
mitigate and manage the social and
environmental issues in sanitation.
Literature review Survey FGDs Case studies Discussions Stakeholder consultations
3
To assess the people’s perception on
sanitation, its maintenance and
investment (Analysis of data)
Literature review Secondary information review Case studies Analysis of Rapid survey data FGDs Stakeholder Consultations
4
To assess and recommend on the
existing institutional arrangements
in the urban sector in managing and
mitigating social and environmental
issues.
Literature review Stakeholder Consultations FGDs Survey data analysis
5
To evolve a social and
environmental framework to
mitigate adverse/negative impacts.
Literature review Stakeholder consultations

CITY SANITATION PLAN BELGAUM
ADMINISTRATIVE STAFF COLLEGE OF INDIA, HYDERABAD 28 | P a g e
Process followed for data assimilation:
Figure 2: Process for CSP Data Assimilation
Sample survey results for the basic services
Purpose: The objective of conducting the sample field survey was to assess the services at the
customer level / field level and validate the information given by the officials.
Methodology: A total of 2935 samples were taken across the different parts of the city to
validate the information. Out of the total samples, 2813 samples were household surveys. The
detail of survey samples is as follows.
Areas covered: The survey took spatially from all parts of the city, but the main focus was given
to the following areas.
Table 3: Surveys and sample numbers
Sl.
No.
Type of surveys Sample nos.
1 HH surveys 2813(Non-slums: 98,
Slums:2715,
2 Community toilets 47
3 Public toilets 5
4 Commercial places 30
5 Schools 40
CITY SANITATION PLAN BELGAUM
ADMINISTRATIVE STAFF COLLEGE OF INDIA, HYDERABAD 29 | P a g e
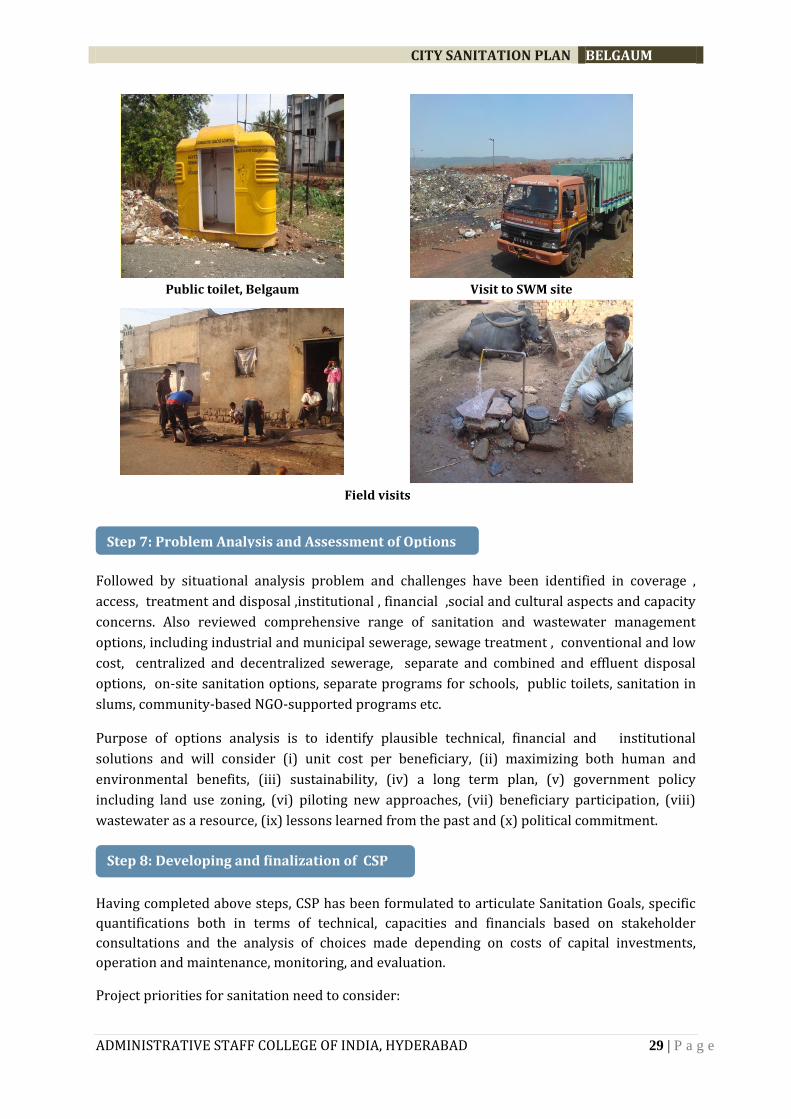
Public toilet, Belgaum
Visit to SWM site
Field visits
Followed by situational analysis problem and challenges have been identified in coverage ,
access, treatment and disposal ,institutional , financial ,social and cultural aspects and capacity
concerns. Also reviewed comprehensive range of sanitation and wastewater management
options, including industrial and municipal sewerage, sewage treatment , conventional and low
cost, centralized and decentralized sewerage, separate and combined and effluent disposal
options, on-site sanitation options, separate programs for schools, public toilets, sanitation in
slums, community-based NGO-supported programs etc.
Purpose of options analysis is to identify plausible technical, financial and institutional
solutions and will consider (i) unit cost per beneficiary, (ii) maximizing both human and
environmental benefits, (iii) sustainability, (iv) a long term plan, (v) government policy
including land use zoning, (vi) piloting new approaches, (vii) beneficiary participation, (viii)
wastewater as a resource, (ix) lessons learned from the past and (x) political commitment.
Having completed above steps, CSP has been formulated to articulate Sanitation Goals, specific
quantifications both in terms of technical, capacities and financials based on stakeholder
consultations and the analysis of choices made depending on costs of capital investments,
operation and maintenance, monitoring, and evaluation.
Project priorities for sanitation need to consider:
Step 7: Problem Analysis and Assessment of Options
Step 8: Developing and finalization of CSP

CITY SANITATION PLAN BELGAUM
ADMINISTRATIVE STAFF COLLEGE OF INDIA, HYDERABAD 30 | P a g e
i. Serving the Unserved Urban Poor
ii. Serving the Unserved Schools
iii. Serving the Unserved Public Areas
iv. Institutional capacity building for sustainability and environmental monitoring
v. Grant elements for demonstration pilot projects for eco-sanitation (private
vi. developers)
vii. Rehabilitation of existing facilities.
viii. Improvement of existing sanitation (septic tank sludge and effluent treatment).
ix. Extension of existing sewerage and sewage treatment (as a last priority).
ACTIVITY UPDATE ON BELGAUM CSP
Table 4: Chronological details of activities concerning Belgaum CSP
Progress made Activity
1. State launch workshop
held at Bangalore on 25th
November 2010
The launch was aimed to sensitize
elected representatives and
administrative functionaries on
National Urban Sanitation Policy
and City Sanitation Plan. Honorable
Minister for Urban Development,
Government of Karnataka had
participated in the workshop and
delivered key note address. Launch workshop, Bangalore
2. State level technical
workshop
held at office of
Directorate of Municipal
Administration,
Government of
Karnataka on 7th
January 2011
The objective of the state level
technical workshop was focused on
sharing the understanding on the
CSP and its importance to the ULBs.
It was primarily focused on the
present status of solid waste
management practices, sewerage
system, water supply, toilet facilities
in the city. It was also focused on the
methodology for the preparation on
CSP.
Participants at technical
orientation workshop at DMA,
GoK
3. CSTF orientation
workshop
held at Conference Hall
of City Corporation,
Belgaum on January 24,
2011
The workshop was intended to
introduce the CSTF members the
need for the constitution of CSTF
and their role in the preparation of
City Sanitation Plan. This was
followed by the group activity
among the CSTF members to seek
their views on the problems and
solutions in regard to the sanitation
in the city.
Participants at the 2nd round
CSTF meeting

CITY SANITATION PLAN BELGAUM
ADMINISTRATIVE STAFF COLLEGE OF INDIA, HYDERABAD 31 | P a g e
4. Preparation of Inception
Report
Submitted to DMA, GoK
in March 2011
An Inception Report was prepared
with the progress made until the
submission of the same. In included
the mention of the activities since
the State launch workshop till the
first workshop with the CSTF
members of the cities under
preparation of CSP. Also, illustrated
the way forward approach for the
CSP.
Coverpage of the Inception
Report
5. 2nd round of CSTF
meeting held at the
Conference Hall of City
Corporation, Belgaum
The 2nd round meeting was intended
to share the progress made along
with the clarification and
understating of the data to be
validated. It covered the
methodology adopted for the
primary survey, focused group
discussions, situation analysis, etc.,
and the workable suggestions from
CSTF members were taken into
consideration while following the
methodology and drafting CSP.
Participants at the 2nd round
CSTF meeting
6. Collection and review of
secondary data/reports
/documents
A review of reports or supporting
documents available with City
Corporation was done for
understanding of the existing status
and proposed infrastructure of the
city.
7. Preparation of GIS layers
with the available base
maps
The GIS base maps were collected
from the Karnataka Municipal
Reforms Cell, Directorate of
Municipal Administration,
Government of Karnataka. The maps
were used to locate the problematic
areas like open defecation, flood
prone areas, community toilets, etc.
8. Primary survey The primary survey was done to
understand the current situation of
sanitation and verify the secondary
information collected. The primary
survey has given an understanding
of areas of open defecation, flood
prone areas, water deficient areas,
UGD missing lines, etc. in preparing
the CSP.
9. Focused group
discussions
Conducting FGDs have provided to
identify problems at the source. 6

CITY SANITATION PLAN BELGAUM
ADMINISTRATIVE STAFF COLLEGE OF INDIA, HYDERABAD 32 | P a g e
FGDs have been conducted in slum
areas, market, residential areas and
slaughter house. The FGDs have
given an understanding to prepare
the situation assessment of the city’s
infrastructure for CSP.
10. Draft City Sanitation Plan Comprises basic city profile,
demographic details, SWM, water
supply, waste water treatment,
sewerage network in the city,
situation assessment, demand
supply gap assessment, municipal
responsibilities, financial
assessment, etc. The integration of
the available information along with
the outcome of primary survey and
FGDs has been used to prepare the
draft CSP.

CITY SANITATION PLAN BELGAUM
ADMINISTRATIVE STAFF COLLEGE OF INDIA, HYDERABAD 33 | P a g e
1.6 VERIFICATION OF MOUD CHECKLIST
The MoUD has prepared a common checklist for the preparation of CSPs by various
organizations for cities in various parts of India. This Checklist will help cities assess the quality
of the draft version of the CSP. The indicators in the Checklist are drawn to measure whether
the key dimensions of sanitation are addressed in the contents; and ensure that the process
followed in the preparation of the CSP was consultative and has full ownership of the city
stakeholders. This is a self-assessment and needs to be done in-house by the ULB. The results
should indicate the gaps in contents and process that need to be remedied – and thereby ensure
that CSP is ready for submission, and presentation as one of the model CSPs prepared for
implementation under the NUSP.
An attempt has been made by the ASCI team to prepare the CSP under the guidelines of the
MoUD checklist. The Checklist is in two parts: CONTENT and PROCESS. In the city self-
assessment, please fill in YES or NO in the relevant column, and provide remarks in the column.
A. Content Self-Assessment
Table 5: CSP Content self-assessment
No. Item Yes/No Remarks/Status
I
Baseline Data Collection & Situational Analysis in
terms of identification of short term or mid – term
or long term measures
1)
Has the city carried out a baseline data collection
(secondary and primary) and Situation Analysis of
different aspects of sanitation viz:
(Score
overall “Yes”
if at least
nine
indicators
below score
“Yes”, else
“No”)
i. Access to household level sanitation arrangements
in general residential and slum areas Yes
ii. Community and Public Toilets – location and
status Yes
iii.Safe collection and conveyance of human excreta
(on-site and sewerage) – infrastructure and
management (including status of de-sludging
services)
Yes
iv. Treatment and safe disposal of human excreta Yes
v. Solid waste collection, transport and safe disposal Yes
vi. Drainage and flooding Yes

CITY SANITATION PLAN BELGAUM
ADMINISTRATIVE STAFF COLLEGE OF INDIA, HYDERABAD 34 | P a g e
vii. Drinking water quantity, quality and coverage Yes
viii. Institutional arrangements and finances for
capital creation and O&M
management of environmental services
(water, sanitation, solid waste, drainage)
No
Information on
institutional
arrangements not
available for
sanitation, water and
drainage.
Information on
finances and O&M not
available for any
sector.
ix. Current population and socio-economic
categories; and projections by different categories Partial
Projections of
different categories
not done
x. Arrangements and practices of commercial, public
and other institutions in respect of sanitation and
solid wastes
Yes
xi. Maps and physical features of settlements
(wards, slums, etc.) and key city infrastructure
(water, sewerage, drainage, roads, treatment plants,
water and sewage pumping stations, etc.)
Yes
xii. Data on health-related indicators of sanitation
and water supply No
xiii. Other important and locally relevant details
(specify) Yes
2) Has the draft CSP identified specific data gaps and
developed a plan for detailed data collection? Yes
II Institutional Roles and Issues
3)
Has the city identified an institutional home/s for
sanitation planning, implementation, monitoring
and regulation?
Yes
4) Has the draft CSP proposed specific actions to
resolve institutional gaps and overlaps for:
(Score
overall “Yes”
if at least
five
indicators
below score
“Yes”, else
“No”)
a. Planning and financing Yes
b. Creation of physical infrastructure Yes

CITY SANITATION PLAN BELGAUM
ADMINISTRATIVE STAFF COLLEGE OF INDIA, HYDERABAD 35 | P a g e
c. O&M Management Yes
d. Training and Capacity Building Yes
e. Monitoring of Outcomes Yes
f. Communications Yes
g. Regulation Yes
III City-wide Sanitation Campaign
5) Does the draft CSP contain a plan for the launch of a
100% Sanitation Campaign in the city? Yes
IV Technology Options and City-wide design
6)
Has draft CSP detailed and evaluated different
technology options (on or off-site as well for
collection, transport and safe disposal – i.e. full-
cycle) for sanitation?
Yes
7)
Do the proposed sanitation interventions
(rehabilitation, retrofitting or new investments)
consider the whole city? (not just a part thereof)
Yes
V Urban Poor and Unreached
8)
Has the draft CSP identified the locations or
settlements of the urban poor and other unreached
population segments with have no or limited access
to sanitation?
Yes
9)
Does the draft CSP identify actions for assisting
unreached/poor households with individual,
community or public sanitation facilities (in that
order); and efficient disposal from these facilities?
Yes
10)
Has the draft CSP identified or
proposed sources of financing the CSP
(schemes, grants, loans, etc.) for extending access to
sanitation and related behavior change
communication activities?
No
VI Financing and O&M management
11)
Does the draft CSP consider an appropriate time-
frame and spatial and demographic dimensions to
remain relevant (at least for the 12th Five Year Plan
period, even if investment numbers are indicative
or work-in-process)?
Yes
12) Were the different sanitation options
(hardware plus software) evaluated on the basis of Partial Cost benefit analysis
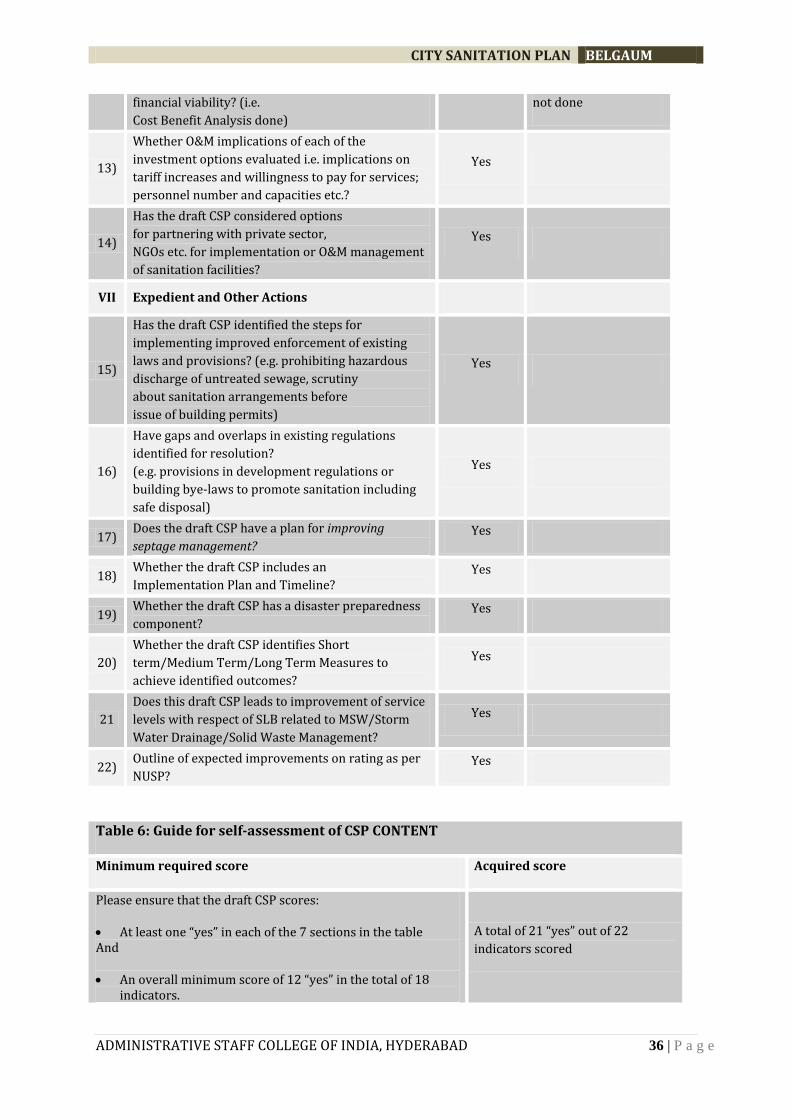
CITY SANITATION PLAN BELGAUM
ADMINISTRATIVE STAFF COLLEGE OF INDIA, HYDERABAD 36 | P a g e
financial viability? (i.e.
Cost Benefit Analysis done)
not done
13)
Whether O&M implications of each of the
investment options evaluated i.e. implications on
tariff increases and willingness to pay for services;
personnel number and capacities etc.?
Yes
14)
Has the draft CSP considered options
for partnering with private sector,
NGOs etc. for implementation or O&M management
of sanitation facilities?
Yes
VII Expedient and Other Actions
15)
Has the draft CSP identified the steps for
implementing improved enforcement of existing
laws and provisions? (e.g. prohibiting hazardous
discharge of untreated sewage, scrutiny
about sanitation arrangements before
issue of building permits)
Yes
16)
Have gaps and overlaps in existing regulations
identified for resolution?
(e.g. provisions in development regulations or
building bye-laws to promote sanitation including
safe disposal)
Yes
17) Does the draft CSP have a plan for improving
septage management? Yes
18) Whether the draft CSP includes an
Implementation Plan and Timeline? Yes
19) Whether the draft CSP has a disaster preparedness
component? Yes
20)
Whether the draft CSP identifies Short
term/Medium Term/Long Term Measures to
achieve identified outcomes?
Yes
21
Does this draft CSP leads to improvement of service
levels with respect of SLB related to MSW/Storm
Water Drainage/Solid Waste Management?
Yes
22) Outline of expected improvements on rating as per
NUSP? Yes
Table 6: Guide for self-assessment of CSP CONTENT
Minimum required score Acquired score
Please ensure that the draft CSP scores:
At least one “yes” in each of the 7 sections in the table And
An overall minimum score of 12 “yes” in the total of 18 indicators.
A total of 21 “yes” out of 22
indicators scored
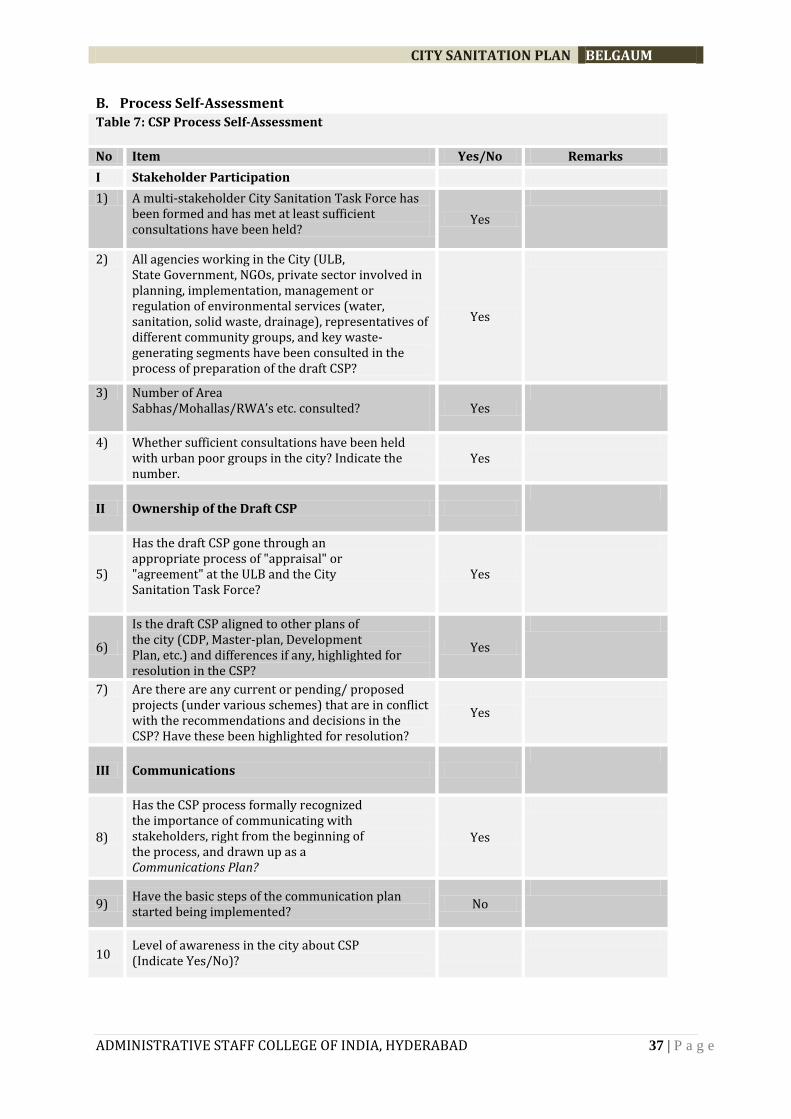
CITY SANITATION PLAN BELGAUM
ADMINISTRATIVE STAFF COLLEGE OF INDIA, HYDERABAD 37 | P a g e
B. Process Self-Assessment
Table 7: CSP Process Self-Assessment
No Item Yes/No Remarks
I Stakeholder Participation
1) A multi-stakeholder City Sanitation Task Force has been formed and has met at least sufficient consultations have been held?
Yes
2) All agencies working in the City (ULB, State Government, NGOs, private sector involved in planning, implementation, management or regulation of environmental services (water, sanitation, solid waste, drainage), representatives of different community groups, and key waste-generating segments have been consulted in the process of preparation of the draft CSP?
Yes
3) Number of Area Sabhas/Mohallas/RWA’s etc. consulted? Yes
4) Whether sufficient consultations have been held with urban poor groups in the city? Indicate the number.
Yes
II Ownership of the Draft CSP
5)
Has the draft CSP gone through an appropriate process of "appraisal" or "agreement" at the ULB and the City Sanitation Task Force?
Yes
6)
Is the draft CSP aligned to other plans of the city (CDP, Master-plan, Development Plan, etc.) and differences if any, highlighted for resolution in the CSP?
Yes
7) Are there are any current or pending/ proposed projects (under various schemes) that are in conflict with the recommendations and decisions in the CSP? Have these been highlighted for resolution?
Yes
III Communications
8)
Has the CSP process formally recognized the importance of communicating with stakeholders, right from the beginning of the process, and drawn up as a Communications Plan?
Yes
9) Have the basic steps of the communication plan started being implemented?
No
10 Level of awareness in the city about CSP (Indicate Yes/No)?

CITY SANITATION PLAN BELGAUM
ADMINISTRATIVE STAFF COLLEGE OF INDIA, HYDERABAD 38 | P a g e
IV Links with Related Exercises
11) If the city is participating in the Service Level Benchmarking (SLB) exercise, have the relevant indicators been measured and uniformity ensured between that and the CSP?
Yes
Table 8: Guide for self-assessment of CSP PROCESS
Minimum Required Score Acquired score
Please ensure that the draft CSP scores:
At least two “yes” in sections i and ii, and At least one “yes” in sections iii and iv in the table.
A total of 7 “yes” in sections i and ii
A total of 2 “yes” in sections iii and
iv
1.7 CHAPTER PLAN
This section intends to present a brief overview of the CSP report, giving an idea of the content
and the purpose of the various chapters. The report has two major sections –
A. The Situational Analysis
B. The Sanitation Strategies.
The former section deals with depicting the city and its present status with regards to
sanitation. The aim is to highlight the existing conditions regarding access and coverage of
sanitary facilities, identify the gaps and striking issues, and understand the behavioral aspects of
various sections of the society. This section is covered from Chapter 1 to Chapter 5.
The latter section thereafter provides strategies and solutions to bridge the identified gaps,
mitigate the existing issues, and provide ways and means to aid the sustenance of the existing
and proposed strategies and projects. There have been presented in Chapter 6.
C. The Situational Analysis
Chapter 1 gives an introduction to the CSP process, its background, and the objectives behind it.
This is followed by the step-by-step methodology of the CSP process, as well as the status of the
CSP for the particular city. The process of collection of baseline information – both primary and
secondary, has been explained at length. The CSP process at Belgaum has then been evaluated
on the basis of the CSP checklist as prepared by MoUD, GoI.
Chapter 2 presents a review of the policies & programmes that are prevalent and followed in
the state to improve the sanitation conditions in the urban areas. It gives detailed insight into
the NUSP and the sanitation ranking of cities, the MSW 2000 rules, the ILCS projects, and other
such projects which have been taken up for the improvement of access and coverage of sanitary
facilities.
CITY SANITATION PLAN BELGAUM
ADMINISTRATIVE STAFF COLLEGE OF INDIA, HYDERABAD 39 | P a g e
Chapter 3 deals with the City Profile where the various aspects of the city are discussed in
order to get a fair idea about the city itself. Aspects such as location, regional linkages,
demography, economic, landuse and housing profiles, the urban governance, the slums and
squatter settlements are discussed in brief.
Chapter 4 forms the central focus of Section A – i.e. The Situational Analysis. The aim of the
chapter is to present a clear picture of the existing systems of sanitation in the city. It contains
four sectors – Sewerage and sanitation, Storm water system, Solid waste Management and the
Water supply system of the city. Within each sector, the gaps and issues in access and coverage
are identified, the problem areas are clearly demarcated, the performance of each of the sectors
is evaluated through Service Level Benchmarking (SLB) indicators, and projections are also
made for the future years.
Chapter 5 aims to evaluate the institutional capacity and the financial structure, to find out if
the ULB along with the associated organizations is able to cater to the sanitation needs of the
society, with regards to both adequate qualified personnel and adequate financial sources.
D. The Situational Analysis
The strategies are presented in Chapter 6. It provides the vision for the CSP and its goals, and
the basic guiding principles on which the strategies are based. Thereafter, strategies have been
provided to improve coverage and access to sanitation facilities, to implement effectively the
various proposals, and options and mechanisms for effectively financing the strategies and
proposals along with proper phasing

CITY SANITATION PLAN BELGAUM
ADMINISTRATIVE STAFF COLLEGE OF INDIA, HYDERABAD 40 | P a g e
Chapter 2
State Urban Sanitation Policies & Programmes – A review
2.1 NATIONAL URBAN SANITATION POLICY (NUSP)
2.1.1. NUSP – THE BACKGROUND
“All Indian cities and towns become totally sanitized, healthy and liveable and ensure and
sustain good public health and environmental outcomes for all their citizens with a special
focus on hygienic and affordable sanitation facilities for the urban poor and women.”
Keeping this vision in view, the National Urban Sanitation Policy (NUSP) has been formulated by
the Government of India in 2008 with a vision to provide appropriate sanitation facilities in all
cities and towns, through policy, institutional, technical and financial interventions. Some of the
areas to address under NUSP include open defecation free towns, providing access to toilets for
poor people, waste water and solid waste treatment and disposal and achieving public health
outcomes and environmental standards.
2.1.2. COMPONENTS OF NATIONAL URBAN SANITATION POLICY
Govt. of India shall support the following components:
Awareness Generation
Institutional Roles
Reaching the Un-Served and Poor Households
Knowledge Development
Capacity Building
Financing
National Monitoring & Evaluation
Coordination at the National Level
2.1.3. NATIONAL AWARD SCHEME FOR SANITATION FOR INDIAN CITIES
Goal
In order to rapidly promote sanitation in urban areas of the country (as provided for in the
National Urban Sanitation Policy and Goals 2008), and to recognize excellent performance in
this area, the Government of India intends to institute an annual award scheme for cities. The
award is based on the premise that improved public health and environmental standards are
the two outcomes that cities must seek to ensure for urban citizens. In doing so, governments in
states and urban areas will need to plan and implement holistic city-wide sanitation plans,
thereby put in place processes that help reach outputs pertaining to safe collection, disposal and
disposal (including conveyance, treatment, and/ or re-use without adverse impacts on the
environment in and around the cities). It may be noted that the awards will not recognize mere
inputs, hardware or expenditure incurred in urban sanitation but assess how these lead to
CITY SANITATION PLAN BELGAUM
ADMINISTRATIVE STAFF COLLEGE OF INDIA, HYDERABAD 41 | P a g e
achievements of intermediate milestones toward the final result of 100 % safe disposal of
wastes from the city on a sustainable basis. Cities will need to raise the awareness of city
stakeholders (households, establishments, industries, municipal functionaries, media, etc.) since
improved sanitation can ensure improved public health and environmental outcomes only if
considerable changes in behaviour and practice take place across the spectrum of society.
Concept of Totally Sanitized Cities
A totally Sanitized City will be one that has achieved the outputs or milestones specified in the
National Urban Sanitation policy, the salient features of which are as follows:
Cities must be open defecation free
Must eliminate the practice of manual scavenging and provide adequate personnel
protection equipment that addresses the safety of sanitation workers.
Municipal wastewater and storm water drainage must be safely managed
Recycle and reuse of treated wastewater for non potable applications should be
implemented wherever possible.
Solid Waste collected and disposed off fully and safely
Services to the Poor and Systems for Sustaining Results
Improved Public Health Outcomes and Environmental Standards
Rating and Categorization of Cities
The rating of cities in regard to their performance in sanitation improvements will be based on
set of objective indicators of outputs, processes and outcomes.
Three Categories of Indicators
The rating exercise will involve three categories of indicators:
1. Output Indicators: pertain to the city having achieved certain results or outputs in
different dimensions of sanitation ranging from behvioural aspects and provision, to safe
collection, treatment and disposal without harm to the city’s environment. There are nine
mainoutput-indicators accounting for 50 points of the total of 100 points.
2. Process Related: indicators pertain to systems and procedures that exist and are practiced
by the city agencies to ensure sustained sanitation. There are seven main process-indicators
accounting for 30 points of the total of 100 points.
3. Outcome Related: indicators include the quality of drinking water and that of water in
water-bodies of city, as also the extent of reduction in sanitation-related and water-borne
diseases in the city over a time period. There are three main outcome-indicators accounting for
20 points of a total of 100 points1.
Ideally, data for the above outputs, processes and outcomes are regularly collected by city
authorities but at present, very few cities will have, at best, partial data available. This rating
exercise will help in highlighting the need for regular data-collection and monitoring of
indicators.
On the basis of the said rating scheme, cities will be placed in different categories as presented
in Table 6. National rating survey data will utilize these categories for publication of results.

CITY SANITATION PLAN BELGAUM
ADMINISTRATIVE STAFF COLLEGE OF INDIA, HYDERABAD 42 | P a g e
Table 9: City Colour Codes: Categories
No. Category Description
1 Red
Less than 33 Marks
Cities on the brink of public health and
environmental “emergency”; needing immediate
remedial action
2 Black
34 – 66 Marks
Needing considerable
Improvements
3 Blue
67 to 90 Marks Recovering but still diseased
4 Green
91 to 100 Marks Healthy and Clean city
On the basis of plans prepared and implemented, cities will be able to measure the results of
their actions, and be able to clearly chart out their improvements over time compared to their
baseline situation.
On achievement of remarkable results, i.e. coming into the Green category (Healthy and Clean
City), cities will typically become eligible for the national award. Other cities showing
remarkable incremental performance or selective achievements may also be given special or
honorary awards. Cities in different size-classes may also be considered for category-wise
awards.
Based on results of the Rating survey and selection of awardees, cities will be invited to
participate in a National Urban Sanitation Award ceremony.
A rating has been done by MoUD, GoI, for 436 Class I cities in India. None of the cities fall in the
green category. The distribution of the 436 cities in the said categories has been presented in
the table as follows.
Table 10: Cities and City Color Codes
No. Category No. of cities
1 Red
Less than 33 Marks 204 cities
2 Black
34 – 66 Marks 228 cities
3 Blue
67 to 90 Marks 4 cities
4 Green
91 to 100 Marks 0 cities

CITY SANITATION PLAN BELGAUM
ADMINISTRATIVE STAFF COLLEGE OF INDIA, HYDERABAD 43 | P a g e
2.2 MUNICIPAL SOLID WASTE RULES, 2000
The Municipal Solid Wastes (Management and Handling) Rules, 1999 were published under the
notification of the Government of India in the Ministry of Environment and Forests. In exercise
of the powers conferred by section 3, 6 and 25 of the Environment (Protection) Act, 1986 (29 of
1986), the Central Government hereby made the rules to regulate the management and
handling of the municipal solid wastes, 2000.
Municipal Solid Waste (Management & Handling) Rules, 2000 (MSW Rules) are applicable to
every municipal authority responsible for collection, segregation, storage, transportation,
processing and disposal of municipal solids. The Rules contains four Schedules namely;
Table 11: Schedule details of MSW rules, 2000
Schedule-I Relates to implementation Schedule
Schedule-II Specifications relating to collection, segregation, storage, transportation, processing and disposal of municipal solid waste (MSW).
Schedule-III Specifications for land filling indicating; site selection, facilities at the site, specifications for and filling, Pollution prevention, water quality monitoring, ambient air quality monitoring, Plantation at landfill site, closure of landfill site and post care.
Schedule-IV Indicate waste processing options including; standards for composting, treated l lactates and incinerations.
The MSW Rules (2000) very categorically state the roles and responsibilities of ULBs, the State
Govt., the Union Territory Administrations and the Pollution Control Boards. The roles of the
ULBs as stated are as follows:
1. Every municipal authority shall, within the territorial area of the municipality, be
responsible for the implementation of the provisions of these rules, and for any
infrastructure development for collection, storage, segregation, transportation,
processing and disposal of municipal solid wastes.
2. The municipal authority or an operator of a facility shall make an application in Form-I,
for grant of authorization for setting up waste processing and disposal facility including
landfills from the State Board or the Committee in order to comply with the
implementation programme laid down in Schedule I.
3. The municipal authority shall comply with these rules as per the implementation
schedule laid down in Schedule I.
4. The municipal authority shall furnish its annual report
a. to the Secretary-in-charge of the Department of Urban Development of the
concerned State or as the case may be of the Union territory, in case of a
metropolitan city; or

CITY SANITATION PLAN BELGAUM
ADMINISTRATIVE STAFF COLLEGE OF INDIA, HYDERABAD 44 | P a g e
b. to the District Magistrate or the Deputy Commissioner concerned in case of all other
towns and cities, with a copy to the State Board or the Committee on or before the
30th day of June every year.
2.3 KARNATAKA URBAN DRINKING WATER AND SANITATION
POLICY, 2002
Good quality reliable drinking water supply and sanitation are essential basic needs of every
citizen. Increasing urbanization has resulted in greater pressure on the existing urban water
supply and sanitation systems leading to increasing demand on the one hand to augment the
source and improve distribution and on the other to increase the coverage of underground
drainage (UGD). At the same time, as stated in the State Water Policy brought out by the
Department of the Water Resources, there is an urgent need to conserve the limited water
resources of the State to ensure sufficient availability of water for various needs as well as for
the future. The Government of Karnataka in partnership with urban local bodies in the State, the
Karnataka Urban Water Supply & Drainage Board (KUWS&DB) and the Bangalore Water Supply
and Sewerage Board (BWSSB) will continue and strengthen its efforts to provide all residents of
urban areas of the State, piped water supply and sanitation services at or near their dwellings.
The efforts of the Government of Karnataka and its partner agencies will be to:
1. Ensure universal coverage of water and sanitation services that people want and are
willing to pay for and
2. To do so in a manner that preserves the sustainability of the precious water resources of
the State, project and enhances the commercial and economical sustainability of the
operations at the same time
3. Ensure a minimum level of service to all citizens.
The Government of Karnataka will continue to be responsible for:
Ensuring provision of the bulk of the resources required for capacity creation
Regulation, monitoring and evaluation of the efficiency of operations, including
prescribing reporting requirements, procurement procedures, etc.,
Setting minimal service standard
Encouraging the use of public private partnerships as well as private sector
participation to achieve the sector goals
Promotion of the economic and commercial viability of water supply systems and the
exploitation of economies of scale and scope by appropriate aggregation options
Institution of necessary incentives for urban local bodies and other service providers to
implement sector reforms
Ensuring co-ordination and collaboration among the various agencies both at the policy
and operational level through the establishment of appropriate committees and
agencies.
CITY SANITATION PLAN BELGAUM
ADMINISTRATIVE STAFF COLLEGE OF INDIA, HYDERABAD 45 | P a g e
2.4 KARNATAKA URBAN INFRASTRUCTURE DEVELOPMENT AND
FINANCE CORPORATION (KUIDFC)
State Government has appointed Karnataka Urban Infrastructure Development & Finance
Corporation (KUIDFC) as the State Level Nodal Agency (SLNA) under JnNURM to assist Urban
Local Bodies (ULBs), place proposals to SLSC for approval, manages grants, release funds to
ULBs, maintain revolving fund and monitor the physical & financial progress and reforms
implementation as committed in the Memorandum of Agreement.
Funds under the scheme would be released by the Central Government to the Nodal Agency
which in turn would release to the Implementing Agency in the form of loan, soft loan-cum-
grant or grant.
As per the guidelines, at least 25% (for UIG) & 10% ( for BSUP) of the funds released are to be
recovered and ploughed into a Revolving Fund by the nodal agency for financing of further
infrastructure projects and the fund may be upgraded to a state level infrastructure fund.
66 Projects with an investment of Rs. 4602.40 crore have been approved so far. Of this, Central
Government share is Rs. 2002.83 crore and State Government share is Rs. 709.53 crore, against
which the GoI has already released Rs. 1035.50 crore and GoK has contributed its share of Rs.
475.25 crore. Against the total releases of Rs. 1508.75 crore, an amount of Rs. 2503.59 crore has
already been spent (including ULB/IA share). 21 projects have been completed. 50.50% of
approved investment is for Water, Sewerage & Drainage Sector, 0.70% for Solid Waste
Management, 29.70% for Roads and Road related Infrastructure, 0.80% for Heritage & Tourism
and 18.30 % for provision of Basic Services to Urban Poor. For the urban poor, 28,118 dwelling
units will be built in 110 slums which would benefit about 1, 40, 590 people. Till date,
construction of 9548 dwelling units has been completed. 19 DPRs for an estimated investment
of Rs. 1670.07 crore are pending approval of the GoI requiring an ACA of Rs. 962.05 crore.
Further 22 DPRs are under various stages of preparation with an estimated cost of Rs. 4265.57
crore.
PROJECTS
Externally aided projects
Completed
ADB assisted Karnataka Urban Infrastructure Development Project (KUIDP)
Ongoing
ADB assisted Karnataka Urban Development and Coastal Environmental Management
Project (KUDCEMP)
World Bank assisted Karnataka Urban Water Supply Improvement Project (KUWASIP)
ADB assisted North Karnataka Urban Sector Investment Programme (NKUSIP)
World Bank assisted Karnataka Municipal Reforms Project (KMRP)
Other Projects
Centrally sponsored Mega City Scheme
Greater Bangalore Water and Sanitation Project (GBWASP)

CITY SANITATION PLAN BELGAUM
ADMINISTRATIVE STAFF COLLEGE OF INDIA, HYDERABAD 46 | P a g e
2.1.4. KARNATAKA URBAN DEVELOPMENT AND COASTAL ENVIRONMENTAL
MANAGEMENT PROJECT (KUDCEMP)
The Project will support the Government's priority investment in the urban sector, based on an
urban sector development strategy that focuses on improving the welfare of the urban poor and
the devolution of municipal management responsibility from states to urban local bodies. This
integrated urban development project will help meet basic human needs by developing urban
services for water supply and sanitation, solid waste and wastewater management, and slum
and environmental improvements. The Project will also support street improvements and
traffic management, and strengthen other municipal services required to improve the quality of
life in urban areas. The Project will provide assistance in capacity building and community
participation at the state and local levels and in Project implementation.
COMPONENTS OF KUDCEMP
Part A: Capacity Building, Community Participation and Poverty Alleviation
Training and technical assistance to urban local body staff
Community awareness and participation programme
Slum improvement and sites and services for low income groups
Part B: Water Supply Rehabilitation and Expansion
Rehabilitation of existing water supply systems
Providing new water supply schemes to increase the capacity and supply levels
Leak detection and rectification
Promotion of cost recovery
Part C: Urban Environmental Improvement
Waste water management
Underground drainage
Sanitation
Storm water drainage
Solid waste management
Land fill
Vehicles
Awareness
Community involvement
Traffic Management
Roads
Junction improvement
Rehabilitation of existing markets and other municipal facilities
Part D: Street and Bridge Improvement of existing roads
Construction of new roads
Associated road side drainage works
Part E: Coastal Environmental Management
Preparation of coastal resource management and conservation plans
CITY SANITATION PLAN BELGAUM
ADMINISTRATIVE STAFF COLLEGE OF INDIA, HYDERABAD 47 | P a g e
Industrial pollution control and environmental monitoring programme
Urban water front rehabilitation plan for Belgaum
Coastal erosion prevention through mangrove afforestation
Part F: Implementation Assistance
Support for systematic implementation of the project by appointing consultants for
design, construction, supervision and project management and procuring necessary
equipment and vehicles
KUDCEMP TOWNS
Ankola
Bhatkal
Dandeli
Karwar
Kundapura
Mangalore
Puttur
Sirsi
Udupi
Ullal
2.5 INTEGRATED LOW COST SANITATION (ILCS)
The programme envisages construction of new sanitary latrines in households not having
latrines by adopting the low-cost leach pit system, with an objective to eliminate dry latrines
and manual scavenging. The scheme is being implemented with 63% HUDCO loan, 32%
Government of India (GoI) subsidy and 5% of contribution of beneficiary. Initially during the
year 1992 the Integrated Low Cost Sanitation Scheme was taken up in 34 municipalities,
subsequently extended the programme covering all the Urban Local Bodies (ULB) in a phased
programme. The scheme was implemented in all 113 ULB with HUDCO financial assistance.
2.6 ASHA KIRAN MAHITI (AKM)
Asha Kiran Mahiti is a web-based application of the Karnataka Municipal Reforms Cell,
Directorate of Municipal Administration, Govt of Karnataka. It has taken a major step in the
direction of mapping 3,400 notified and non-notified slums all over Karnataka and has the
socio-economic database of six lakh slum households across Karnataka. Based on this, it needs
to generate the social indicators, evolve plans and set targets for improvement in each of them
and measure the audit outcomes periodically.
2.7 JNNURM
The aim of JnNURM is to encourage reforms and fast track planned development of identified
cities. Focuses on efficiency in urban infrastructure and service delivery mechanisms,
community participation, and accountability of ULBs/ Parastatal agencies towards citizens.

CITY SANITATION PLAN BELGAUM
ADMINISTRATIVE STAFF COLLEGE OF INDIA, HYDERABAD 48 | P a g e
Objectives of JnNURM:
a. Focused attention to integrated development of infrastructure services in cities covered
under the Mission;
b. Establishment of linkages between asset-creation and asset-management through a slew
of reforms for long-term project sustainability;
c. Ensuring adequate funds to meet the deficiencies in urban infrastructural services;
d. Planned development of identified cities including peri-urban areas, outgrowths and
urban corridors leading to dispersed urbanization;
e. Scale-up delivery of civic amenities and provision of utilities with emphasis on universal
access to the urban poor;
f. Special focus on urban renewal programme for the old city areas to reduce congestion;
and
g. Provision of basic services to the urban poor including security of tenure at affordable
prices, improved housing, water supply and sanitation, and ensuring delivery of other
existing universal services of the government for education, health and social security.
2.8 URBAN INFRASTRUCTURE DEVELOPMENT SCHEME FOR SMALL
& MEDIUM TOWNS (UIDSSMT)
UIDSSMT aims at improvement in urban infrastructure in towns and cities in a planned manner.
It shall subsume the existing schemes of Integrated Development of Small and Medium Towns
(IDSMT) and Accelerated Urban Water Supply Programme (AUWSP).
Objectives of UIDSSMT scheme are:
1. Improve infrastructural facilities and help create durable public assets and quality
oriented services in cities & towns
2. Enhance public-private-partnership in infrastructural development and
3. Promote planned integrated development of towns and cities.
2.9 RAJIV AWAS YOJANA
Scheme Objectives
The Government has initiated a new scheme called Rajiv Awas Yojana (RAY) for the slum
dwellers and the urban poor. This scheme aims at providing Central support to States that are
willing to assign property rights to slum dwellers. The Government’s effort would be to create a
Slum-free India through the implementation of RAY.
The Ministry of Housing and Urban Poverty Alleviation (MoHUPA) has prepared Guidelines for
Slum Free City Planning to assist the preparatory activities under RAY and this has been
circulated to all States/UTs. RAY calls for a multi-pronged approach focusing on the following
aspects:
• Bringing existing slums within the formal system and enabling them to avail the same
level of basic amenities as the rest of the town/city.
• Redressing the failures of the formal system that lead to the creation of slums; and
CITY SANITATION PLAN BELGAUM
ADMINISTRATIVE STAFF COLLEGE OF INDIA, HYDERABAD 49 | P a g e
• Tackling the shortages of urban land and housing that keep shelter out of reach of the
urban poor and force them to resort to extra-legal solutions in a bid to retain their
sources of livelihood and employment.
Under the Slum Free City Planning guidelines, there is a requirement for the Urban Local Bodies
(ULBs) to build an inventory of existing spatial data available with various agencies. Often ULBs,
other than metropolitan cities, do not have centralized spatial data. Under RAY, it is planned to
have ‘Technical Cell’, which will have responsibilities to coordinate and collect data from state
governments, NRSC/ISRO, Survey of India, National Informatics Centre (NIC) etc. If the city base
map is not available, a base map of the city would be generated using standard guidelines set
forth under the project.
As given in the Slum Free City Planning (SFCP) guidelines, the preparation of Slum-free City Plan
will broadly involve survey of all slums – notified and non-notified; mapping of slums using the
state-of-art technology; integration of geo-spatial and socio-economic data; and identification of
development model proposed for each slum. To achieve these things, a systematic approach is
essential which will be useful for various other developmental planning initiatives for the urban
poor. The present technical manual details the steps to be followed for slum mapping using
satellite data, GPS, Total Station Survey in preparing GIS database, MIS development of non-
spatial data collected and integration of GIS with MIS to enable generating Plan of Action (PoA)
for slum free cities.
Rajiv Awas Yojana envisages that each State would prepare a State Slum-free Plan of Action
(POA). The preparation of legislation for assignment of property rights to slum dwellers would
be the first step for State POA. The POA would need to be in two parts,
Part-1 regarding the upgradation of existing slums and Part-2 regarding the action to prevent
new slums. In Part-1 the State would need to survey and map all exiting slums in selected cities
proposed by the State for coverage under RAY. In Part-2 the Plan would need to assess the rate
of growth of the city with a 20 year perspective, and based on the numbers specify the actions
proposed to be taken to obtain commensurate lands or virtual lands and promote the
construction of affordable EWS houses so as to stay abreast of the demand. This part would
need also to make necessary legislative and administrative changes to enable urban land
expansion, and in town planning regulations to legislate reservations for EWS/LIG housing in all
new developments.
Rajiv Awas Yojana (RAY) for the slum dwellers and the urban poor envisages a ‘Slum-free India’
through encouraging States/Union Territories to tackle the problem of slums in a definitive
manner. It calls for a multi-pronged approach focusing on:
• Bringing existing slums within the formal system and enabling them to avail of the
same level of basic amenities as the rest of the town;
• Redressing the failures of the formal system that lie behind the creation of slums; and
• Tackling the shortages of urban land and housing that keep shelter out of reach of the
urban poor and force them to resort to extra-legal solutions in a bid to retain their
sources of livelihood and employment.
CITY SANITATION PLAN BELGAUM
ADMINISTRATIVE STAFF COLLEGE OF INDIA, HYDERABAD 50 | P a g e
Slum-free City Cell in Urban Local Body headed by the Municipal Commissioner/Executive
Officer will be primarily responsible for the preparation of Slum-free City Plans based on
guidelines provided by the concerned State Government and support extended by the Nodal
Agency for Rajiv Awas Yojana at the State level.
2.10 URBAN STATISTICS FOR HR AND ASSESSMENTS (USHA)”
Scheme Objectives
The Central Sector Scheme of “Urban Statistics for HR and Assessments (USHA)” aims at the
development and maintenance of national a database, MIS and knowledge repository relating to
urban poverty, slums, housing, construction and other urbanization-related statistics. Its key
objective is to support the Ministry of Housing & Urban Poverty Alleviation and other Ministries
with an information base and knowledge inputs for the purpose of planning, policy-making,
project design, formulation, implementation, monitoring and evaluation, particularly in the
context of programmes relating to urban poverty, slums and housing. It seeks to specially
support the effective implementation of Jawaharlal Nehru National Urban Renewal Mission –
Basic Services to the Urban Poor (BSUP) and Integrated Housing & Slum Development
Programme (IHSDP). The four pillars of “USHA” are: database including MIS & sample surveys;
action research; impact assessment; and capacity building/training.
USHA will coordinate applied research and capacity building activities pertaining to urban
poverty, slums, housing, construction and other urbanization-related statistics in collaboration
with reputed research and training institutions at national, regional and state levels and experts.
Scheme Components
The following components are envisaged under the “Urban Statistics for HR and Assessments
(USHA)” Scheme for which funding support will be provided:
Data Centre and MIS on Urban Poverty, Slums, Housing, Building Construction and
related Urbanisation Statistics.
Knowledge Centre/National Resource Centre for Urban Poverty and Slums
Sample Surveys in areas of Urban Poverty, Slums, Housing & Building Construction
Socio-Economic Research Studies in areas of Urban Poverty, Slums, Housing &
Building Construction
Capacity Building & Training in areas of Urban Poverty, Slums, Housing & Building
Construction Statistics
Publicity & Awareness
2.11 INTEREST SUBSIDY SCHEME FOR HOUSING THE URBAN POOR
(ISHUP)
The Ministry of Housing and Urban Poverty Alleviation (MH&UPA), Government of India has
designed an Interest Subsidy Scheme as an additional instrument for addressing the housing

CITY SANITATION PLAN BELGAUM
ADMINISTRATIVE STAFF COLLEGE OF INDIA, HYDERABAD 51 | P a g e
needs of the EWS/LIG segments in urban areas. The Scheme envisages the provision of interest
subsidy to EWS and LIG segments to enable them to buy or construct houses.
BROAD FEATURES OF THE SCHEME
2.1 Purpose - The Scheme will provide home loan with Central Government subsidy to
EWS/LIG persons for acquisition of house as also for construction of house to such beneficiary,
who does not own a house in his/her name or in the name of his/her spouse or any dependent
child. Such beneficiaries who own land in any urban area but do not have any pucca house in
their name or in the name of their spouse or any dependent child will also be covered under the
Scheme.
2.2 Eligibility - The economic parameter of EWS is defined as households having an average
monthly income upto Rs.3,300 and the economic parameter of LIG is defined as households
having an average monthly income between Rs.3,301 upto Rs.7,300. This will be subject to
revision by the Steering Committee of the Scheme from time to time.
2.3 Loan amount admissible - The scheme will provide a subsidized loan for 15 – 20 years for
a maximum amount of Rs.1,00,000 for an EWS individual A maximum loan amount of
Rs.1,60,000 for a LIG individual for a house at least of 40 sq.mts will be admissible. However,
subsidy will be given for loan amount upto Rs. 1 lakh only. Additional loans, if needed would be
at unsubsidized rates.
In identifying beneficiaries, the ULB or the local agency identified by the State should as far as
possible identify clusters in which land has been allotted and housing can be supported through
this scheme within such clusters. The Preference under the Scheme (subject to beneficiaries
being from EWS/LIG segments) should be given to the following in accordance with their
proportion in the total population of City / urban agglomerate during the 2001 Census.
i. Scheduled Caste;
ii. Scheduled Tribe;
iii. Minorities;
iv. Persons with disabilities; and
v. Women beneficiaries.
2.12 13TH CENTRAL FINANCE COMMISSION (CFC)
Importantly, the report of 13th CFC released in February 2010 recommended general
performance grants and special area performance grants to be linked to performance of ULBs.
Moreover, allocations to ULBs would now be linked to divisible pool replacing the previous ad-
hoc allocation. It has recommended grants of Rs. 23,111 crores to ULBs during 2010-15, a four-
fold growth over the 12th CFC allocation. The 13th CFC recommends state governments and ULBs
to focus on improved property tax revenues, urban service standards, strengthened local body
framework, improved municipal accounting, introduce system of independent ombudsmen, and
put in place a system of electronic transfer of grants to ULBs among other things.

CITY SANITATION PLAN BELGAUM
ADMINISTRATIVE STAFF COLLEGE OF INDIA, HYDERABAD 52 | P a g e
2.13 NATIONAL MISSION ON SUSTAINABLE HABITAT
One of the eight Missions as part of the Prime Minister action plan for climate change, is on the
National Mission on Sustainable Habitat was assigned to this Ministry. MOUD formulated the
Mission document through several round of consultations and discussions. The document was
finally approved by the Prime Minister’s Council on Climate Change in June 2010. The objective
of the Mission is to promote sustainability of habitats through improvements in energy
efficiency in buildings, urban planning, improved management of solid and liquid waste
including recycling and power generation, modal shift towards public transport and
conservation. It also seeks to improve ability of habitats to adapt to climate change by
improving resilience of infrastructure, community based disaster management and measures
for improving advance warning systems for extreme weather events.
Under this cities are eligible for implementing demonstration projects in SWM, storm water
management, and Waste water treatment. MoUD is also identifying capacity needs and
earmarked lot of funds for this purpose.

CITY SANITATION PLAN BELGAUM
ADMINISTRATIVE STAFF COLLEGE OF INDIA, HYDERABAD 53 | P a g e
Chapter 3
Profile of Belgaum City
3.1 INTRODUCTION
Belgaum is a city and a municipal corporation in Belgaum district in the state
of Karnataka, India. It is the fourth largest city of the state of Karnataka, the first three
being Bangalore, Mysore, Hubli-Dharwar. Belgaum has now become one of the important place
and now marching with a tag of fast growing, redeveloping district with a population of
Belgaum 4,65,282(Census 2001). Belgaum is exactly at the center between Mumbai and
Bangalore.
3.2 LOCATION AND REGIONAL LINKAGES
Belgaum is also headquarters for Belgaum division. The division comprises the districts
of Bagalkot, Belgaum, Bijapur,Dharwad - Hubli, Gadag, Haveri, and Uttara Kannada. Government
of Karnataka proposed to make Belgaum as second capital of the State of Karnataka with the
recently upcoming second state administrative building Suvarna Vidhan Soudha. The city is
well-connected by road via National Highway 4, now part of the Golden Quadrilateral. It is on
the main Indian railways grid, and is part of Hubli Division.
Figure 3 Regional Linkages
3.3 CLIMATE
Belgaum is well known for its pleasant climate throughout the year. It is at its coldest in winter
(November - February temperatures dropping to 9 degrees Celsius), and experiences
continuous monsoon during July to September. The annual average rainfall is over 200 cm" ,
2000 mm.
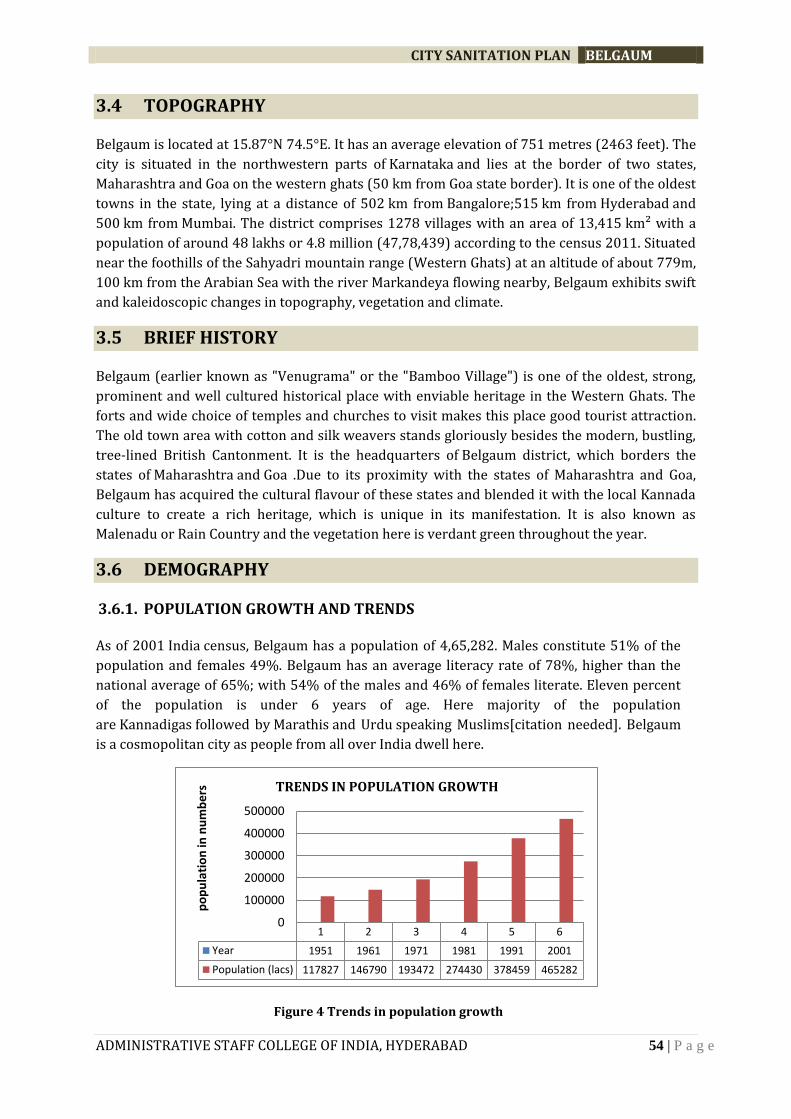
CITY SANITATION PLAN BELGAUM
ADMINISTRATIVE STAFF COLLEGE OF INDIA, HYDERABAD 54 | P a g e
3.4 TOPOGRAPHY
Belgaum is located at 15.87°N 74.5°E. It has an average elevation of 751 metres (2463 feet). The
city is situated in the northwestern parts of Karnataka and lies at the border of two states,
Maharashtra and Goa on the western ghats (50 km from Goa state border). It is one of the oldest
towns in the state, lying at a distance of 502 km from Bangalore;515 km from Hyderabad and
500 km from Mumbai. The district comprises 1278 villages with an area of 13,415 km² with a
population of around 48 lakhs or 4.8 million (47,78,439) according to the census 2011. Situated
near the foothills of the Sahyadri mountain range (Western Ghats) at an altitude of about 779m,
100 km from the Arabian Sea with the river Markandeya flowing nearby, Belgaum exhibits swift
and kaleidoscopic changes in topography, vegetation and climate.
3.5 BRIEF HISTORY
Belgaum (earlier known as "Venugrama" or the "Bamboo Village") is one of the oldest, strong,
prominent and well cultured historical place with enviable heritage in the Western Ghats. The
forts and wide choice of temples and churches to visit makes this place good tourist attraction.
The old town area with cotton and silk weavers stands gloriously besides the modern, bustling,
tree-lined British Cantonment. It is the headquarters of Belgaum district, which borders the
states of Maharashtra and Goa .Due to its proximity with the states of Maharashtra and Goa,
Belgaum has acquired the cultural flavour of these states and blended it with the local Kannada
culture to create a rich heritage, which is unique in its manifestation. It is also known as
Malenadu or Rain Country and the vegetation here is verdant green throughout the year.
3.6 DEMOGRAPHY
3.6.1. POPULATION GROWTH AND TRENDS
As of 2001 India census, Belgaum has a population of 4,65,282. Males constitute 51% of the
population and females 49%. Belgaum has an average literacy rate of 78%, higher than the
national average of 65%; with 54% of the males and 46% of females literate. Eleven percent
of the population is under 6 years of age. Here majority of the population
are Kannadigas followed by Marathis and Urdu speaking Muslims[citation needed]. Belgaum
is a cosmopolitan city as people from all over India dwell here.
Figure 4 Trends in population growth
1 2 3 4 5 6
Year 1951 1961 1971 1981 1991 2001
Population (lacs) 117827 146790 193472 274430 378459 465282
0
100000
200000
300000
400000
500000
po
pu
lati
on
in n
um
be
rs TRENDS IN POPULATION GROWTH
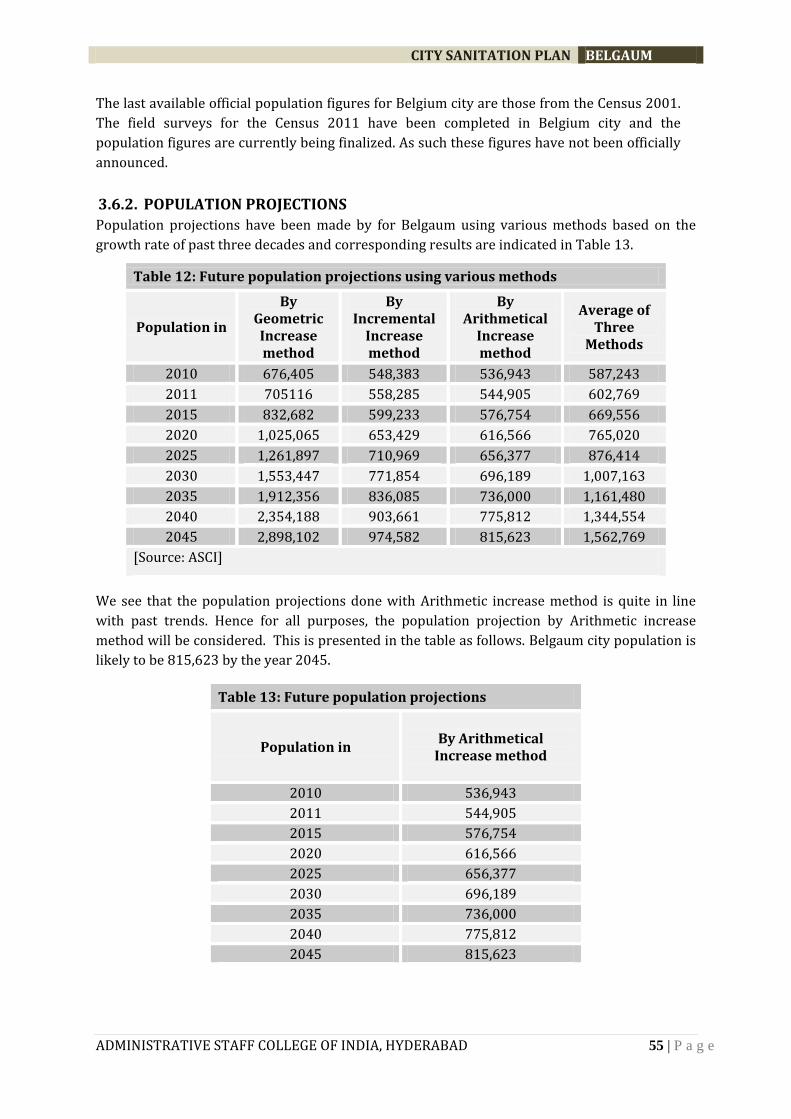
CITY SANITATION PLAN BELGAUM
ADMINISTRATIVE STAFF COLLEGE OF INDIA, HYDERABAD 55 | P a g e
The last available official population figures for Belgium city are those from the Census 2001.
The field surveys for the Census 2011 have been completed in Belgium city and the
population figures are currently being finalized. As such these figures have not been officially
announced.
3.6.2. POPULATION PROJECTIONS
Population projections have been made by for Belgaum using various methods based on the
growth rate of past three decades and corresponding results are indicated in Table 13.
Table 12: Future population projections using various methods
Population in
By Geometric Increase method
By Incremental
Increase method
By Arithmetical
Increase method
Average of Three
Methods
2010 676,405 548,383 536,943 587,243
2011 705116 558,285 544,905 602,769
2015 832,682 599,233 576,754 669,556
2020 1,025,065 653,429 616,566 765,020
2025 1,261,897 710,969 656,377 876,414
2030 1,553,447 771,854 696,189 1,007,163
2035 1,912,356 836,085 736,000 1,161,480
2040 2,354,188 903,661 775,812 1,344,554
2045 2,898,102 974,582 815,623 1,562,769
[Source: ASCI]
We see that the population projections done with Arithmetic increase method is quite in line
with past trends. Hence for all purposes, the population projection by Arithmetic increase
method will be considered. This is presented in the table as follows. Belgaum city population is
likely to be 815,623 by the year 2045.
Table 13: Future population projections
Population in By Arithmetical
Increase method
2010 536,943
2011 544,905
2015 576,754
2020 616,566
2025 656,377
2030 696,189
2035 736,000
2040 775,812
2045 815,623
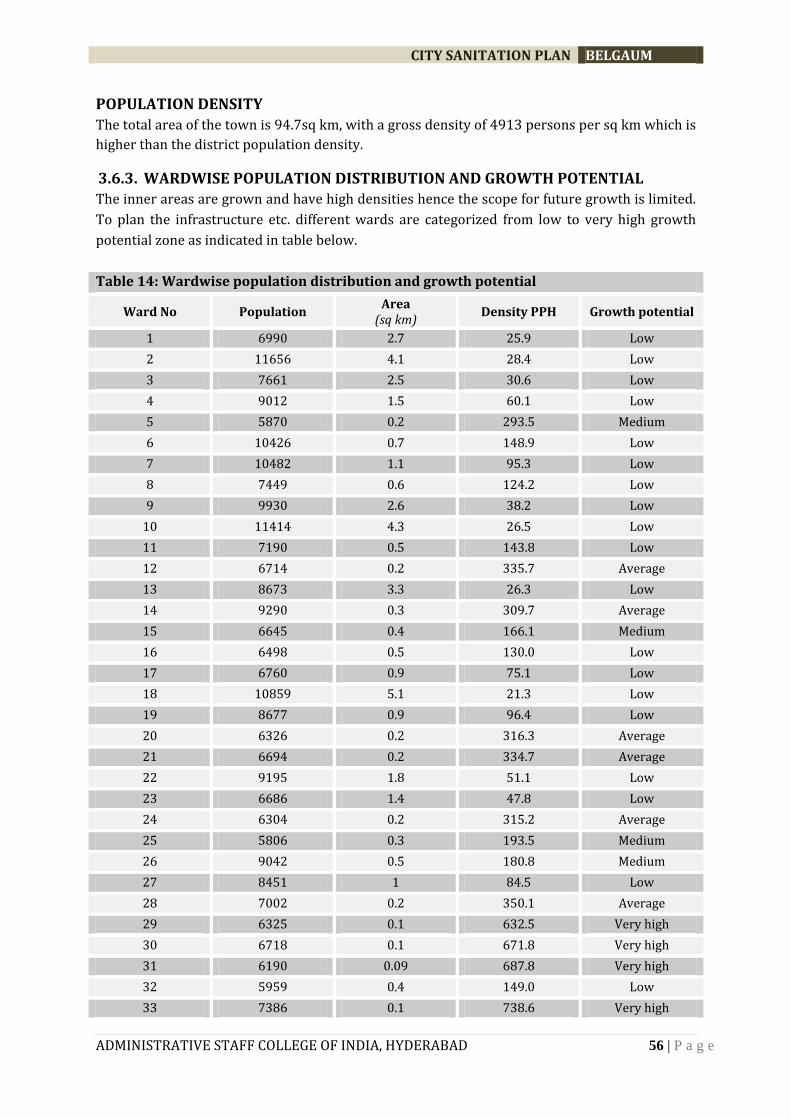
CITY SANITATION PLAN BELGAUM
ADMINISTRATIVE STAFF COLLEGE OF INDIA, HYDERABAD 56 | P a g e
POPULATION DENSITY
The total area of the town is 94.7sq km, with a gross density of 4913 persons per sq km which is
higher than the district population density.
3.6.3. WARDWISE POPULATION DISTRIBUTION AND GROWTH POTENTIAL
The inner areas are grown and have high densities hence the scope for future growth is limited.
To plan the infrastructure etc. different wards are categorized from low to very high growth
potential zone as indicated in table below.
Table 14: Wardwise population distribution and growth potential
Ward No Population Area
(sq km) Density PPH Growth potential
1 6990 2.7 25.9 Low
2 11656 4.1 28.4 Low
3 7661 2.5 30.6 Low
4 9012 1.5 60.1 Low
5 5870 0.2 293.5 Medium
6 10426 0.7 148.9 Low
7 10482 1.1 95.3 Low
8 7449 0.6 124.2 Low
9 9930 2.6 38.2 Low
10 11414 4.3 26.5 Low
11 7190 0.5 143.8 Low
12 6714 0.2 335.7 Average
13 8673 3.3 26.3 Low
14 9290 0.3 309.7 Average
15 6645 0.4 166.1 Medium
16 6498 0.5 130.0 Low
17 6760 0.9 75.1 Low
18 10859 5.1 21.3 Low
19 8677 0.9 96.4 Low
20 6326 0.2 316.3 Average
21 6694 0.2 334.7 Average
22 9195 1.8 51.1 Low
23 6686 1.4 47.8 Low
24 6304 0.2 315.2 Average
25 5806 0.3 193.5 Medium
26 9042 0.5 180.8 Medium
27 8451 1 84.5 Low
28 7002 0.2 350.1 Average
29 6325 0.1 632.5 Very high
30 6718 0.1 671.8 Very high
31 6190 0.09 687.8 Very high
32 5959 0.4 149.0 Low
33 7386 0.1 738.6 Very high
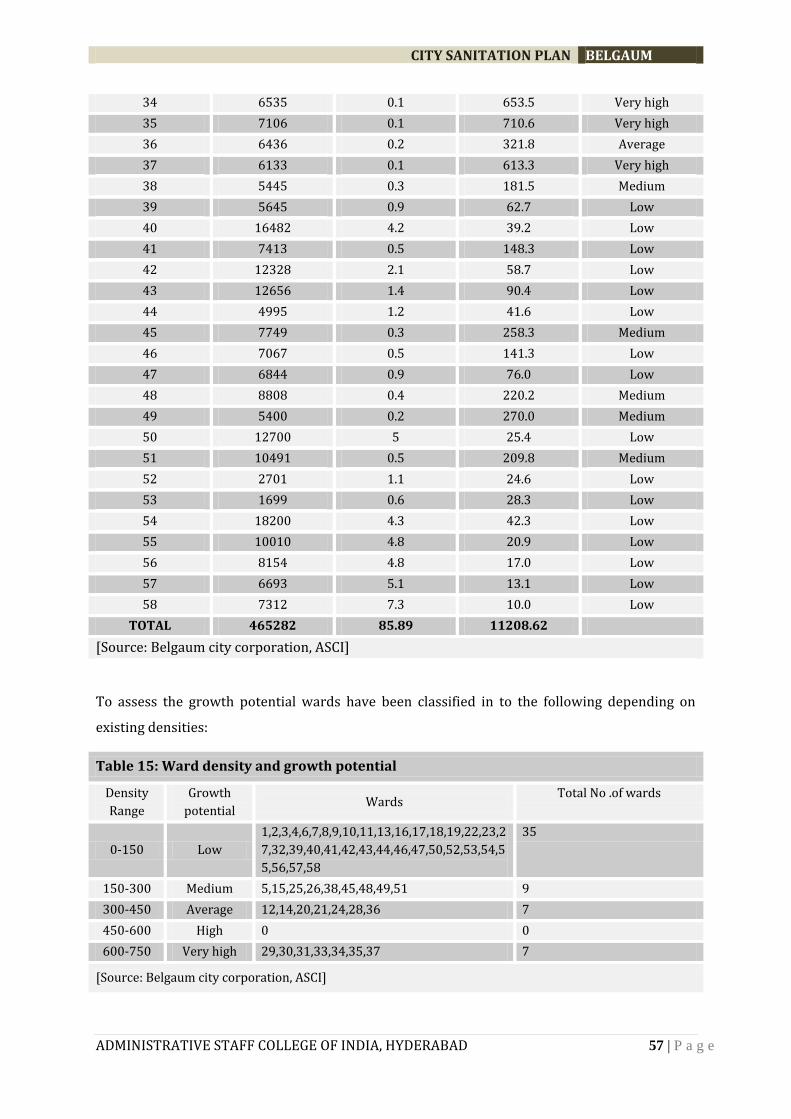
CITY SANITATION PLAN BELGAUM
ADMINISTRATIVE STAFF COLLEGE OF INDIA, HYDERABAD 57 | P a g e
34 6535 0.1 653.5 Very high
35 7106 0.1 710.6 Very high
36 6436 0.2 321.8 Average
37 6133 0.1 613.3 Very high
38 5445 0.3 181.5 Medium
39 5645 0.9 62.7 Low
40 16482 4.2 39.2 Low
41 7413 0.5 148.3 Low
42 12328 2.1 58.7 Low
43 12656 1.4 90.4 Low
44 4995 1.2 41.6 Low
45 7749 0.3 258.3 Medium
46 7067 0.5 141.3 Low
47 6844 0.9 76.0 Low
48 8808 0.4 220.2 Medium
49 5400 0.2 270.0 Medium
50 12700 5 25.4 Low
51 10491 0.5 209.8 Medium
52 2701 1.1 24.6 Low
53 1699 0.6 28.3 Low
54 18200 4.3 42.3 Low
55 10010 4.8 20.9 Low
56 8154 4.8 17.0 Low
57 6693 5.1 13.1 Low
58 7312 7.3 10.0 Low
TOTAL 465282 85.89 11208.62
[Source: Belgaum city corporation, ASCI]
To assess the growth potential wards have been classified in to the following depending on
existing densities:
Table 15: Ward density and growth potential
Density
Range
Growth
potential Wards
Total No .of wards
0-150 Low
1,2,3,4,6,7,8,9,10,11,13,16,17,18,19,22,23,2
7,32,39,40,41,42,43,44,46,47,50,52,53,54,5
5,56,57,58
35
150-300 Medium 5,15,25,26,38,45,48,49,51 9
300-450 Average 12,14,20,21,24,28,36 7
450-600 High 0 0
600-750 Very high 29,30,31,33,34,35,37 7
[Source: Belgaum city corporation, ASCI]
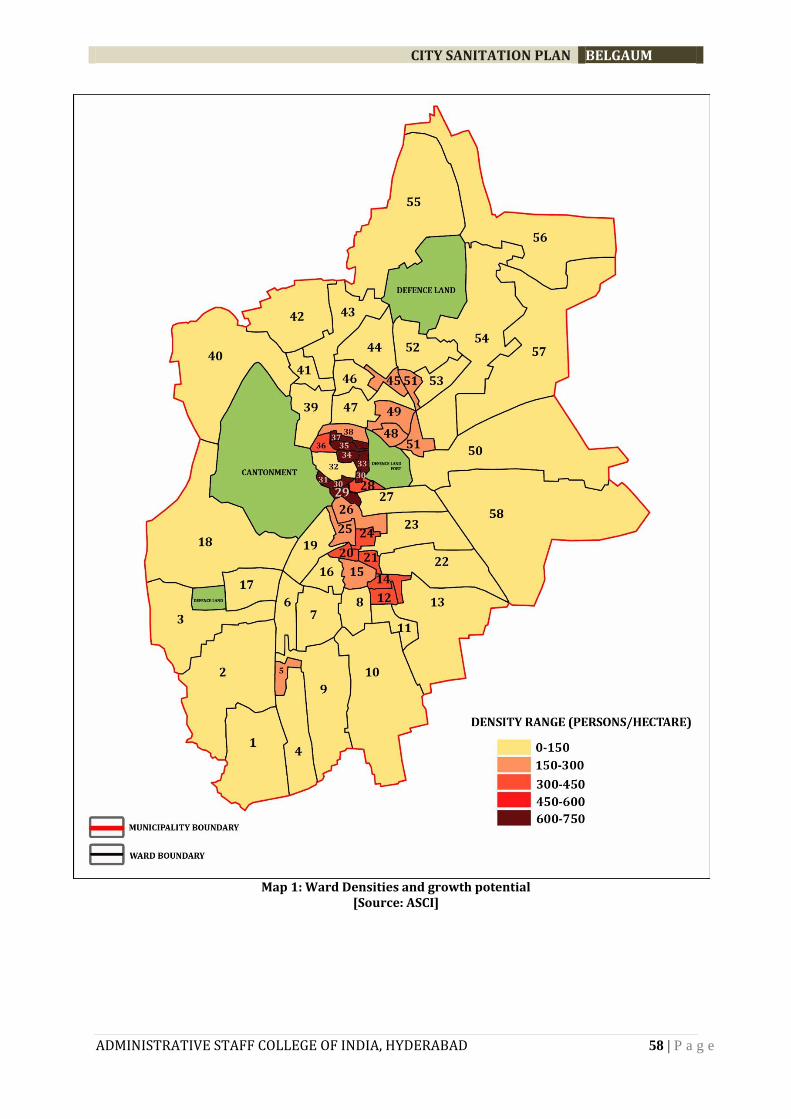
CITY SANITATION PLAN BELGAUM
ADMINISTRATIVE STAFF COLLEGE OF INDIA, HYDERABAD 58 | P a g e
Map 1: Ward Densities and growth potential [Source: ASCI]

CITY SANITATION PLAN BELGAUM
ADMINISTRATIVE STAFF COLLEGE OF INDIA, HYDERABAD 59 | P a g e
3.7 SLUMS AND SQUATTER SETTLEMENTS
Slums – Existing Scenario
In Belgaum City Corporation there are 51 slums. Asha Kiran Mahiti (a web-based project on slums of Karnataka prepared by
Municipal Reforms Cell, Karnataka) has identified 21 slum areas – 32 notified and 19 non-notified. The total population living in
the slums is 57214 (year 2010) and accounting to 11% per cent of the city population as per the projected 2010 population. The
total number of slum households is 12082 accounting to nearly 9 per cent of the total households in the city.
Table 16f: Details of slum areas, CCB
Sl. No.
Ward No.
Slum Name Slum Type
Land ownership
Slum
Area Slum Popn
Slum Density
(persons/sq.km)
Slum
HHs
BPL
Popn
BPL
HHs
1 58
Alarwad (Ashrya
colony)
Non-
Notified Local Body 0.06 576 9600 131 568 130
2 6
Ambedkar Nagar,
Anagol. Notified Private 0.009 1404 156000 325 715 161
3 1
Ambedkar Nagar,
Majagaon
Non-
Notified Private 0.014 507 36214 118 477 111
4 41 Beldar Chawani Notified Private 0.005 332 66400 70 293 61
5 6
Bhajantri Galli,
Belgaum Notified
State
Government 0.002 430 215000 106 392 98
6 1
Brahmadev
Nagar, Majagaon
Non-
Notified Private 0.051 1117 21902 249 618 130
7 38
Chavat Galli
Dorwada, Notified Private 0.006 880 146667 190 752 166
8 13
Devang Nagar,
Vadagaon
Non-
Notified Private 0.5 1236 2472 274 1091 240
9 14
Dhor Galli,
Vadagaon Notified Private 0.012 354 29500 74 323 67
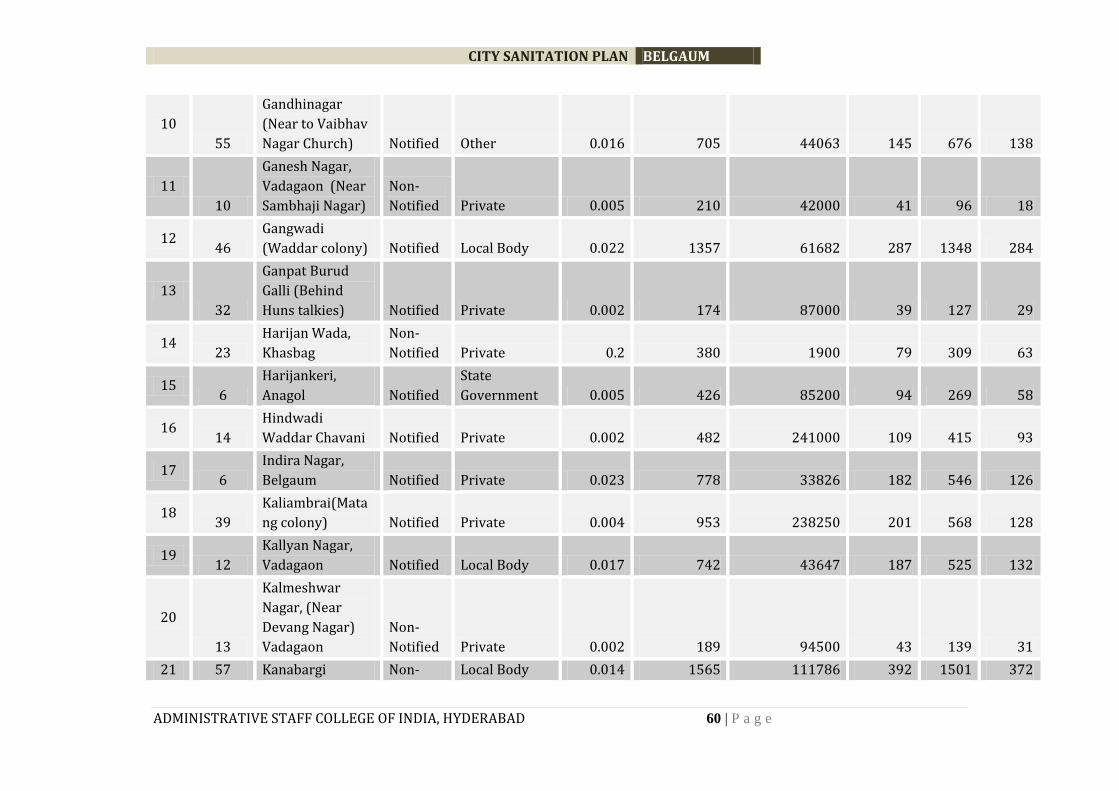
CITY SANITATION PLAN BELGAUM
ADMINISTRATIVE STAFF COLLEGE OF INDIA, HYDERABAD 60 | P a g e
10
55
Gandhinagar
(Near to Vaibhav
Nagar Church) Notified Other 0.016 705 44063 145 676 138
11
10
Ganesh Nagar,
Vadagaon (Near
Sambhaji Nagar)
Non-
Notified Private 0.005 210 42000 41 96 18
12 46
Gangwadi
(Waddar colony) Notified Local Body 0.022 1357 61682 287 1348 284
13
32
Ganpat Burud
Galli (Behind
Huns talkies) Notified Private 0.002 174 87000 39 127 29
14 23
Harijan Wada,
Khasbag
Non-
Notified Private 0.2 380 1900 79 309 63
15 6
Harijankeri,
Anagol Notified
State
Government 0.005 426 85200 94 269 58
16 14
Hindwadi
Waddar Chavani Notified Private 0.002 482 241000 109 415 93
17 6
Indira Nagar,
Belgaum Notified Private 0.023 778 33826 182 546 126
18 39
Kaliambrai(Mata
ng colony) Notified Private 0.004 953 238250 201 568 128
19 12
Kallyan Nagar,
Vadagaon Notified Local Body 0.017 742 43647 187 525 132
20
13
Kalmeshwar
Nagar, (Near
Devang Nagar)
Vadagaon
Non-
Notified Private 0.002 189 94500 43 139 31
21 57 Kanabargi Non- Local Body 0.014 1565 111786 392 1501 372
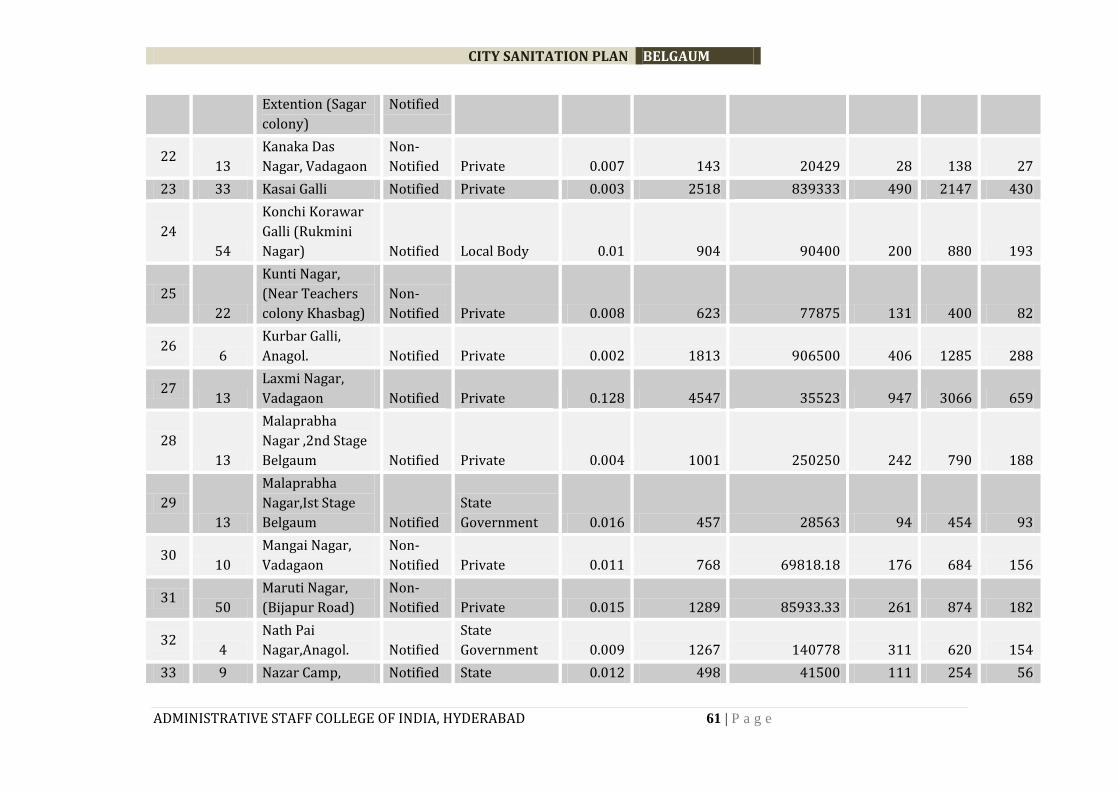
CITY SANITATION PLAN BELGAUM
ADMINISTRATIVE STAFF COLLEGE OF INDIA, HYDERABAD 61 | P a g e
Extention (Sagar
colony)
Notified
22 13
Kanaka Das
Nagar, Vadagaon
Non-
Notified Private 0.007 143 20429 28 138 27
23 33 Kasai Galli Notified Private 0.003 2518 839333 490 2147 430
24
54
Konchi Korawar
Galli (Rukmini
Nagar) Notified Local Body 0.01 904 90400 200 880 193
25
22
Kunti Nagar,
(Near Teachers
colony Khasbag)
Non-
Notified Private 0.008 623 77875 131 400 82
26 6
Kurbar Galli,
Anagol. Notified Private 0.002 1813 906500 406 1285 288
27 13
Laxmi Nagar,
Vadagaon Notified Private 0.128 4547 35523 947 3066 659
28
13
Malaprabha
Nagar ,2nd Stage
Belgaum Notified Private 0.004 1001 250250 242 790 188
29
13
Malaprabha
Nagar,Ist Stage
Belgaum Notified
State
Government 0.016 457 28563 94 454 93
30 10
Mangai Nagar,
Vadagaon
Non-
Notified Private 0.011 768 69818.18 176 684 156
31 50
Maruti Nagar,
(Bijapur Road)
Non-
Notified Private 0.015 1289 85933.33 261 874 182
32 4
Nath Pai
Nagar,Anagol. Notified
State
Government 0.009 1267 140778 311 620 154
33 9 Nazar Camp, Notified State 0.012 498 41500 111 254 56
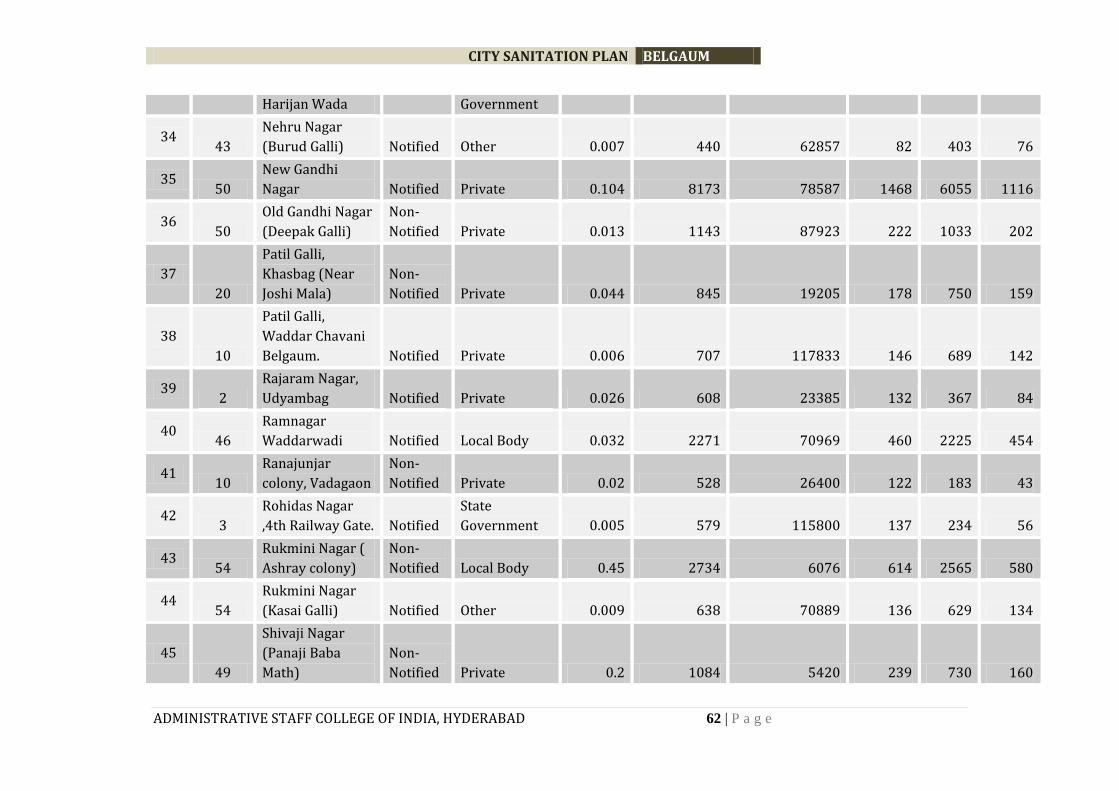
CITY SANITATION PLAN BELGAUM
ADMINISTRATIVE STAFF COLLEGE OF INDIA, HYDERABAD 62 | P a g e
Harijan Wada Government
34 43
Nehru Nagar
(Burud Galli) Notified Other 0.007 440 62857 82 403 76
35 50
New Gandhi
Nagar Notified Private 0.104 8173 78587 1468 6055 1116
36 50
Old Gandhi Nagar
(Deepak Galli)
Non-
Notified Private 0.013 1143 87923 222 1033 202
37
20
Patil Galli,
Khasbag (Near
Joshi Mala)
Non-
Notified Private 0.044 845 19205 178 750 159
38
10
Patil Galli,
Waddar Chavani
Belgaum. Notified Private 0.006 707 117833 146 689 142
39 2
Rajaram Nagar,
Udyambag Notified Private 0.026 608 23385 132 367 84
40 46
Ramnagar
Waddarwadi Notified Local Body 0.032 2271 70969 460 2225 454
41 10
Ranajunjar
colony, Vadagaon
Non-
Notified Private 0.02 528 26400 122 183 43
42 3
Rohidas Nagar
,4th Railway Gate. Notified
State
Government 0.005 579 115800 137 234 56
43 54
Rukmini Nagar (
Ashray colony)
Non-
Notified Local Body 0.45 2734 6076 614 2565 580
44 54
Rukmini Nagar
(Kasai Galli) Notified Other 0.009 638 70889 136 629 134
45
49
Shivaji Nagar
(Panaji Baba
Math)
Non-
Notified Private 0.2 1084 5420 239 730 160
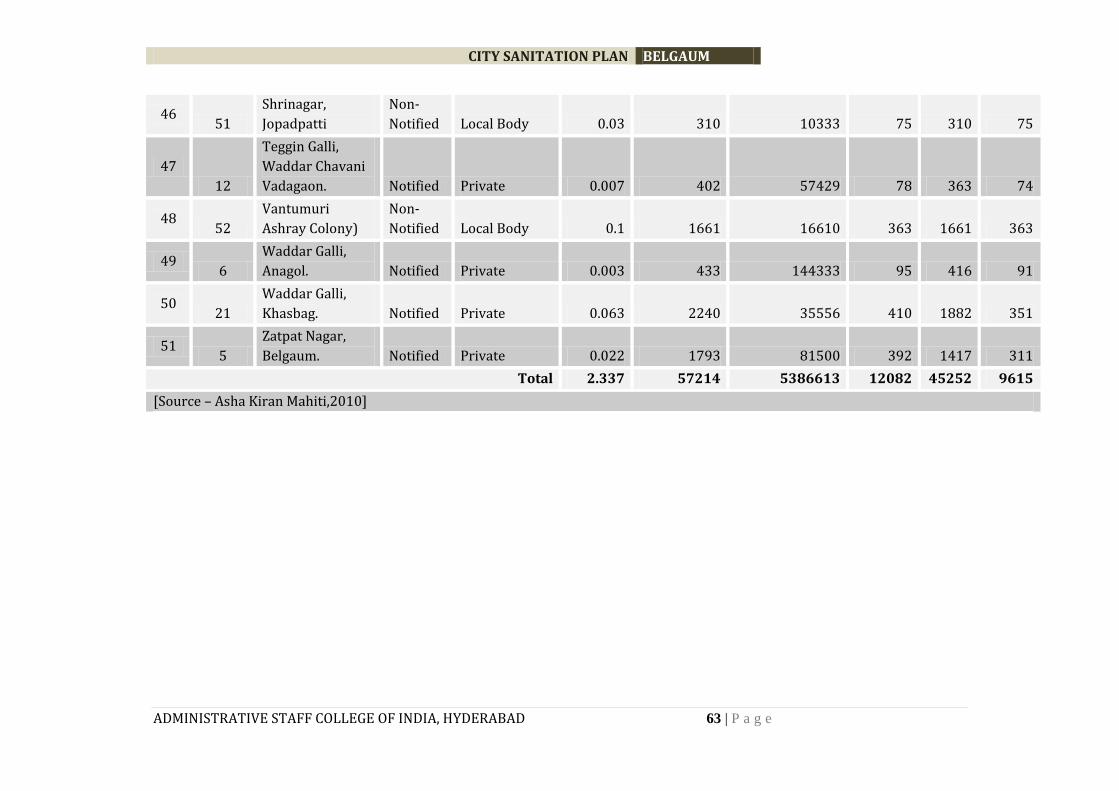
CITY SANITATION PLAN BELGAUM
ADMINISTRATIVE STAFF COLLEGE OF INDIA, HYDERABAD 63 | P a g e
46 51
Shrinagar,
Jopadpatti
Non-
Notified Local Body 0.03 310 10333 75 310 75
47
12
Teggin Galli,
Waddar Chavani
Vadagaon. Notified Private 0.007 402 57429 78 363 74
48 52
Vantumuri
Ashray Colony)
Non-
Notified Local Body 0.1 1661 16610 363 1661 363
49 6
Waddar Galli,
Anagol. Notified Private 0.003 433 144333 95 416 91
50 21
Waddar Galli,
Khasbag. Notified Private 0.063 2240 35556 410 1882 351
51 5
Zatpat Nagar,
Belgaum. Notified Private 0.022 1793 81500 392 1417 311
Total 2.337 57214 5386613 12082 45252 9615
[Source – Asha Kiran Mahiti,2010]

CITY SANITATION PLAN BELGAUM
ADMINISTRATIVE STAFF COLLEGE OF INDIA, HYDERABAD 64 | P a g e
The location of the 51 notified and non-notified slum areas is shown in the map of CCB as follows.
Map 2 Notified & Non-notified slum location map, CCB
3.8 EXISTING LANDUSE
The extent of the Local Planning Area (LPA) is 9470 hectares. Due to non-acquitting of lands and
non-development of areas that the reserved parks, open spaces, playgrounds, some parts of the
city are lacking in these facilities. The total area under parks & open spaces is about 3.37% of
the developed area. The details of the existing land use are indicated in the following table:
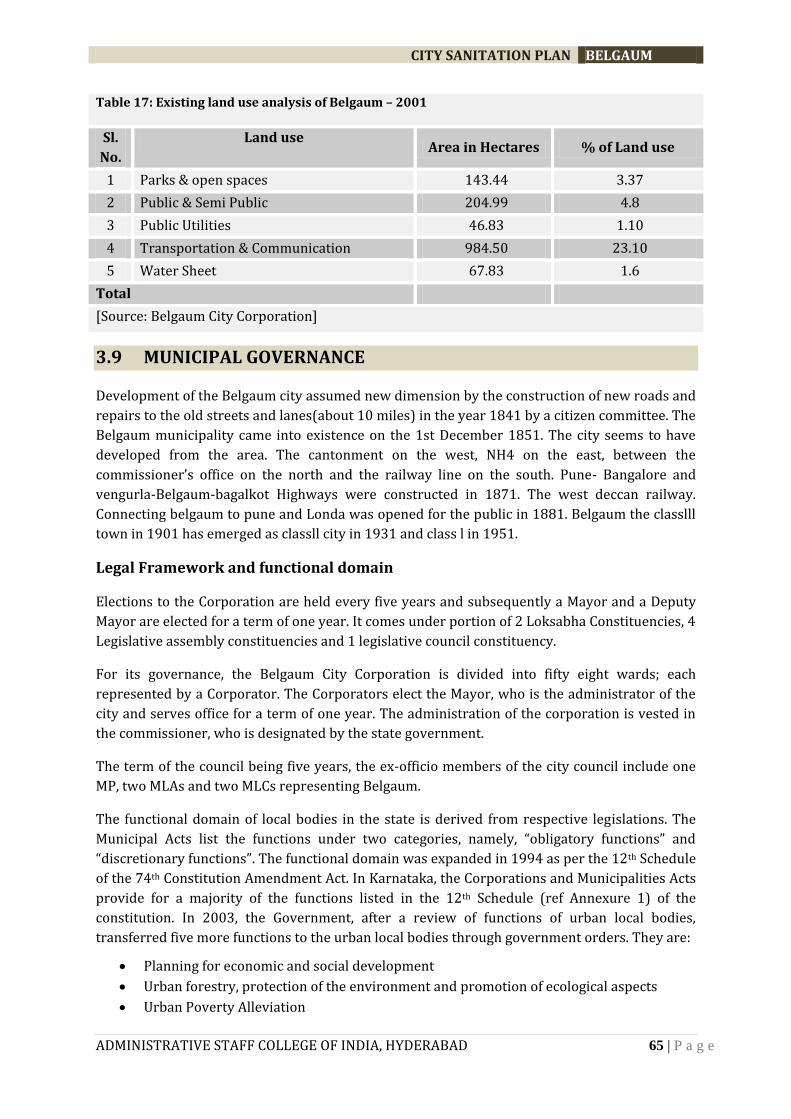
CITY SANITATION PLAN BELGAUM
ADMINISTRATIVE STAFF COLLEGE OF INDIA, HYDERABAD 65 | P a g e
Table 17: Existing land use analysis of Belgaum – 2001
Sl.
No.
Land use Area in Hectares % of Land use
1 Parks & open spaces 143.44 3.37
2 Public & Semi Public 204.99 4.8
3 Public Utilities 46.83 1.10
4 Transportation & Communication 984.50 23.10
5 Water Sheet 67.83 1.6
Total
[Source: Belgaum City Corporation]
3.9 MUNICIPAL GOVERNANCE
Development of the Belgaum city assumed new dimension by the construction of new roads and
repairs to the old streets and lanes(about 10 miles) in the year 1841 by a citizen committee. The
Belgaum municipality came into existence on the 1st December 1851. The city seems to have
developed from the area. The cantonment on the west, NH4 on the east, between the
commissioner’s office on the north and the railway line on the south. Pune- Bangalore and
vengurla-Belgaum-bagalkot Highways were constructed in 1871. The west deccan railway.
Connecting belgaum to pune and Londa was opened for the public in 1881. Belgaum the classlll
town in 1901 has emerged as classll city in 1931 and class l in 1951.
Legal Framework and functional domain
Elections to the Corporation are held every five years and subsequently a Mayor and a Deputy
Mayor are elected for a term of one year. It comes under portion of 2 Loksabha Constituencies, 4
Legislative assembly constituencies and 1 legislative council constituency.
For its governance, the Belgaum City Corporation is divided into fifty eight wards; each
represented by a Corporator. The Corporators elect the Mayor, who is the administrator of the
city and serves office for a term of one year. The administration of the corporation is vested in
the commissioner, who is designated by the state government.
The term of the council being five years, the ex-officio members of the city council include one
MP, two MLAs and two MLCs representing Belgaum.
The functional domain of local bodies in the state is derived from respective legislations. The
Municipal Acts list the functions under two categories, namely, “obligatory functions” and
“discretionary functions”. The functional domain was expanded in 1994 as per the 12th Schedule
of the 74th Constitution Amendment Act. In Karnataka, the Corporations and Municipalities Acts
provide for a majority of the functions listed in the 12th Schedule (ref Annexure 1) of the
constitution. In 2003, the Government, after a review of functions of urban local bodies,
transferred five more functions to the urban local bodies through government orders. They are:
Planning for economic and social development
Urban forestry, protection of the environment and promotion of ecological aspects
Urban Poverty Alleviation
CITY SANITATION PLAN BELGAUM
ADMINISTRATIVE STAFF COLLEGE OF INDIA, HYDERABAD 66 | P a g e
Safeguarding the interest of weaker sections including the handicapped and mentally
retarded
Promotion of Cultural and Aesthetic aspects
There is a multiplicity of laws governing the urban areas in the state. These laws may be
classified as follows:
Urban Development Policy and Karnataka is governed by
Planning Legislation:
1. The Karnataka Town and Country Planning Act, 1961
2. Bangalore Development Authority Act, 1976
3. Bangalore Metropolitan Region Development Authority Act, 1985
4. Karnataka Urban Development Authorities Act, 1987
Municipal Legislation:
1. The Karnataka Municipalities Act, 1964
2. The Karnataka Municipal Corporation Act ,1976
Development Legislation:
1. The Karnataka Industrial Area Development Act , 1966
2. The Karnataka Housing Board Act ,1962
3. The Karnataka Urban Water Supply and Drainage Board Act , 1973
4. The Karnataka Slum Area (Improvement) and Clearance Act , 1970
5. Land Acquisition Act, 1894.
Regulatory Legislation:
1. The Karnataka Land Reforms Act ,1964
2. The Karnataka Land Revenue Act, 1964
3. Karnataka Registration Act
Apart from the Acts, there are rules and by-laws regulating various activities in urban areas
Institutional Framework
The Belgaum City Corporation is democratically elected by the civic community as per the 74th
CAA. At the head is the Mayor with the Council and the Standing Committee. Next to the Mayor
is the Commissioner, who with the help of the Joint Commissioner heads the various
departments The Organogram of Belgaum City Corporation (Figure 5) gives the details.
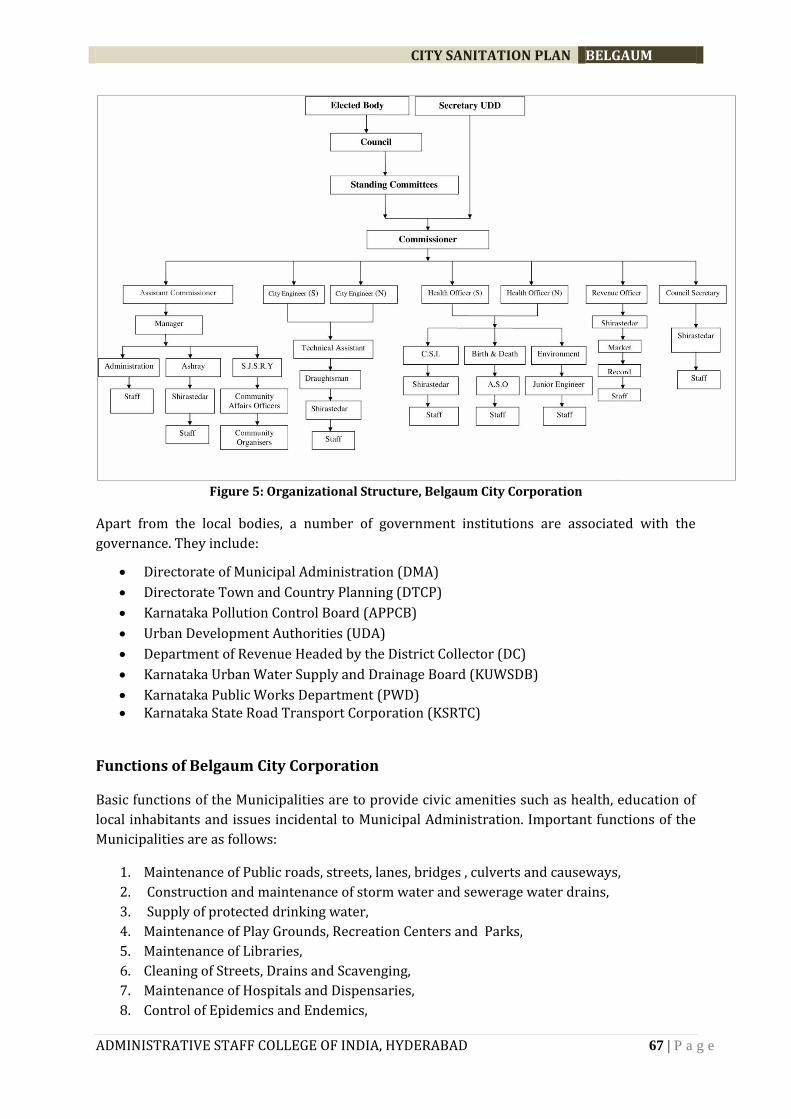
CITY SANITATION PLAN BELGAUM
ADMINISTRATIVE STAFF COLLEGE OF INDIA, HYDERABAD 67 | P a g e
Figure 5: Organizational Structure, Belgaum City Corporation
Apart from the local bodies, a number of government institutions are associated with the
governance. They include:
Directorate of Municipal Administration (DMA)
Directorate Town and Country Planning (DTCP)
Karnataka Pollution Control Board (APPCB)
Urban Development Authorities (UDA)
Department of Revenue Headed by the District Collector (DC)
Karnataka Urban Water Supply and Drainage Board (KUWSDB)
Karnataka Public Works Department (PWD) Karnataka State Road Transport Corporation (KSRTC)
Functions of Belgaum City Corporation
Basic functions of the Municipalities are to provide civic amenities such as health, education of
local inhabitants and issues incidental to Municipal Administration. Important functions of the
Municipalities are as follows:
1. Maintenance of Public roads, streets, lanes, bridges , culverts and causeways,
2. Construction and maintenance of storm water and sewerage water drains,
3. Supply of protected drinking water,
4. Maintenance of Play Grounds, Recreation Centers and Parks,
5. Maintenance of Libraries,
6. Cleaning of Streets, Drains and Scavenging,
7. Maintenance of Hospitals and Dispensaries,
8. Control of Epidemics and Endemics,

CITY SANITATION PLAN BELGAUM
ADMINISTRATIVE STAFF COLLEGE OF INDIA, HYDERABAD 68 | P a g e
9. Registration of Births and Deaths,
10. Maintenance of Elementary Schools,
11. Housing,
12. Maintenance and Improvement in Slum Areas,
13. Maintenance of Street Lighting,
14. Maintenance of slaughter houses and markets.
Some of the major departments and their functions are presented as follows.
Revenue Section, Accounts Section and Audit Section
The main functions of the revenue section are
Assessment and levy of various taxes such as property tax, Vacant land tax,
Collection and monitoring of the taxes
The main functions of the Accounts Section are
Preparation of the budgets,
Processing of the bills and payment vouchers,
Monitoring of the revenue generation,
Maintenance of the books of account,
Maintenance of the payroll,
general provident fund,
Management of treasury
The main functions of the Audit Section is Conducting a pre-audit of all the receipts and
payments. Based on the verification and approval of the audit section, payments will be released
Town Planning Section
Formulation of building rules, master plan rules and zonal regulation
Implementation of master plans
Road widening programmes
Public spaces, Roads and Junctions improvement
Issuance of permission for buildings and layouts
Regularization and demolition of unauthorized constructions
Removal of encroachments
Health Section
The main functions of the public health / sanitation are
Cleaning of the streets and supervision of sanitation
Lifting of garbage and dumping of the same in dumping yard
Spraying disinfecting materials under anti malaria schemes

CITY SANITATION PLAN BELGAUM
ADMINISTRATIVE STAFF COLLEGE OF INDIA, HYDERABAD 69 | P a g e
Maintenance of vehicles, diesel bunks, vehicle sheds, and work shops
Registration of births and deaths
Regulation of dangerous and offensive trades
Maintenance and management of slaughter houses and certification of animals for
slaughter
Prevention of epidemics
Prevention of food adulteration
Management of dispensaries of Indian Medicine System and allopathic system.
Sanitation is one of the key functions of the ULB and the Health Section of ULB is responsible for
all sanitation work in the limits of the ULB. Maintenance and upkeep of urban infrastructure
such as roads, sewerage drains, preventive measures for control of diseases and epidemics,
solid waste management, etc., are some of the key processes which help in maintaining the
sanitary conditions of the ULBs. The key processes of Sanitation-Solid Waste Management
function involve allocation of employees for sweeping and garbage removal, cleaning of drains,
allocation of the vehicles for garbage transportation and disposal of garbage at the dumping
ground, maintenance of the vehicles, maintenance of the public toilets, and carrying out anti-
malarial operations, etc.
Executive Engineering Section
The main functions of the executive engineering section are:
Preparation of plans and estimates for civil works
Construction and maintenance of roads
Construction of buildings
Execution of civil works
Construction and maintenance of drains
CITY SANITATION PLAN BELGAUM
ADMINISTRATIVE STAFF COLLEGE OF INDIA, HYDERABAD 70 | P a g e
Chapter 4
Environmental Sanitation – an Assessment
4.1 SANITATION SITUATION ANALYSIS
INTRODUCTION
Sustainable urban sanitation presents one of the most significant service delivery challenges
related to poverty alleviation and sustainable development of the towns. Environmental
sanitation holds a primordial position in assessing and documenting nature of a town/town in
its status regarding sanitation. This chapter essentially deals with issues pertaining to the core
objective of the town sanitation plan and also covers sanitary installations at different levels of
households, at public places, in institutions and schools. Concentration on open defecation
levels in slums along with complementary sectors like solid waste management, storm water
drains and water supply, an essential component of sanitation is dealt at vast. This also
demarcates service level benchmarking and factors leading to health hazards.
4.1.1 HOUSEHOLD SANITATION
In view of reliable information management pertaining to sanitation, the study heavily
depended on the information provided by CCB as per the data formats given to them. As per the
SLB indicator the, 48% hhs are covered by Sewerage net wotk of 393 KM (raod length is 615
km). This is about 60% of length of roads in Belgaum. Secondary information filled in indicates
that Ward 11,12,13,14, 16 and 22 are totally connected to UGD. Which means 6399 residential
properties are connected to UGD but same data also is showing much less number (5459) of
HHS are connected to UGD. This is implying serious inconsistency in management of data.
Hence this should become priority action point to maintain proper regular updated MIS to
make informed decisions in a transparent manner for maintaining safe sanitation.
In non - slum areas, 92778 HHS are living and 12082 HHs are living in slums. Average non slum
house hold size is 4.67. About 10% Belgaum Households are living in slums which is quite low in
comparison to many other Indian cities. This figures itself indicate that that about 90% HHS are
having safe sanitation arrangements with an assumption that non slums will have access to
toilets. Even the primary survey reiterated that all non-slum households have access to toilets.
With this logic the study made an attempt to estimate various types of sanitation practices. Data
indicates also that there are not any pit latrines in non-slum areas. Here households either have
UGD connection or Septic tank for their toilets. No dry latrines reported in Belgaum.
Primary survey results indicate that majority of households in slum areas (59%) do not have
access to toilets resorting to practice of open defecation and about 100% of non-slum areas
have access to individual household type of toilets. Primary survey results indicate that a small
percentage of HHs (1.8% in slums) use shared type of toilets, and around 5.5% HHs in slums
depend on community toilets.

CITY SANITATION PLAN BELGAUM
ADMINISTRATIVE STAFF COLLEGE OF INDIA, HYDERABAD 71 | P a g e
Figure 6: Percentage distribution of HHs w.r.t. type of toilets
[Source: ASCI primary surveys, 2011]
The night soil is collected from toilets by suction tanks and disposed into the STPs. In the
present situation, it is the individual household responsibility to construct toilet along with
septic tank as per the specifications given in building bylaws. Building bye-laws are seriously
lacking clarity on guidelines to construct toilets and maintenance of sanitary installations.
INFORMATION BOX 2: DEFINITIONS OF HOUSEHOLD SANITATION ARRANGEMENTS
ACCORDING TO CENSUS 2001
Water closet latrine (WC): The sanitary water flush latrines are those latrines that have water
closets fitted with flushing cistern. Such latrines that may be connected to a septic tank or an
underground sewerage system will also be recorded as water closet latrines. The fecal matter
from these types of latrines is removed without the need for scavenging or manual handling of
excreta.
Pit latrine: The latrines attached to the pit that is dug into the ground for the reception of night
soil are reckoned as pit latrines.
Other latrine: This category includes service latrines (i.e. those that are cleaned manually);
latrines serviced by animals such as pigs, etc. and all latrines other than the pit and the water
closet types of latrine
Table 18 Sanitation arrangement of Belgaum City Corporation
Slums Non slums Total in % Remarks
Total HHS 12082 105573 117655 100.00
Septic Tank 5,372.00 49,099.00 54471 46% Remaining connected to septic tanks.
PIT 620.00 620 1% Including 38 common Pits.
OD 2393 2393 2%
32.9%
0.0% 5.5% 1.8%
59.7%
100.0%
0.0% 0.0% 0.0% 0.0% 0.0%
20.0%
40.0%
60.0%
80.0%
100.0%
120.0%
Household Public toilet Communitytoilet
Shared Toilet Opendefecation
Slum HHs % Non-Slum HHs %
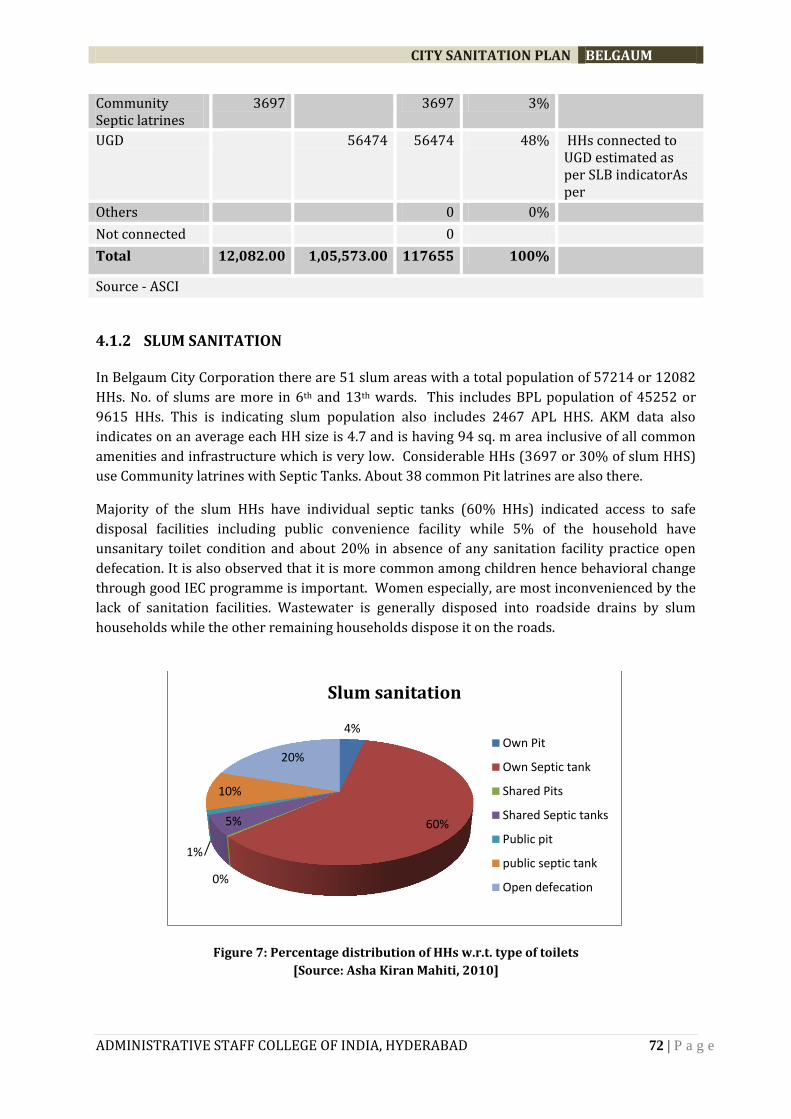
CITY SANITATION PLAN BELGAUM
ADMINISTRATIVE STAFF COLLEGE OF INDIA, HYDERABAD 72 | P a g e
Community Septic latrines
3697 3697 3%
UGD 56474 56474 48% HHs connected to UGD estimated as per SLB indicatorAs per
Others 0 0%
Not connected 0
Total 12,082.00 1,05,573.00 117655 100%
Source - ASCI
4.1.2 SLUM SANITATION
In Belgaum City Corporation there are 51 slum areas with a total population of 57214 or 12082
HHs. No. of slums are more in 6th and 13th wards. This includes BPL population of 45252 or
9615 HHs. This is indicating slum population also includes 2467 APL HHS. AKM data also
indicates on an average each HH size is 4.7 and is having 94 sq. m area inclusive of all common
amenities and infrastructure which is very low. Considerable HHs (3697 or 30% of slum HHS)
use Community latrines with Septic Tanks. About 38 common Pit latrines are also there.
Majority of the slum HHs have individual septic tanks (60% HHs) indicated access to safe
disposal facilities including public convenience facility while 5% of the household have
unsanitary toilet condition and about 20% in absence of any sanitation facility practice open
defecation. It is also observed that it is more common among children hence behavioral change
through good IEC programme is important. Women especially, are most inconvenienced by the
lack of sanitation facilities. Wastewater is generally disposed into roadside drains by slum
households while the other remaining households dispose it on the roads.
Figure 7: Percentage distribution of HHs w.r.t. type of toilets
[Source: Asha Kiran Mahiti, 2010]
4%
60%
0%
5%
1%
10%
20%
Slum sanitation
Own Pit
Own Septic tank
Shared Pits
Shared Septic tanks
Public pit
public septic tank
Open defecation
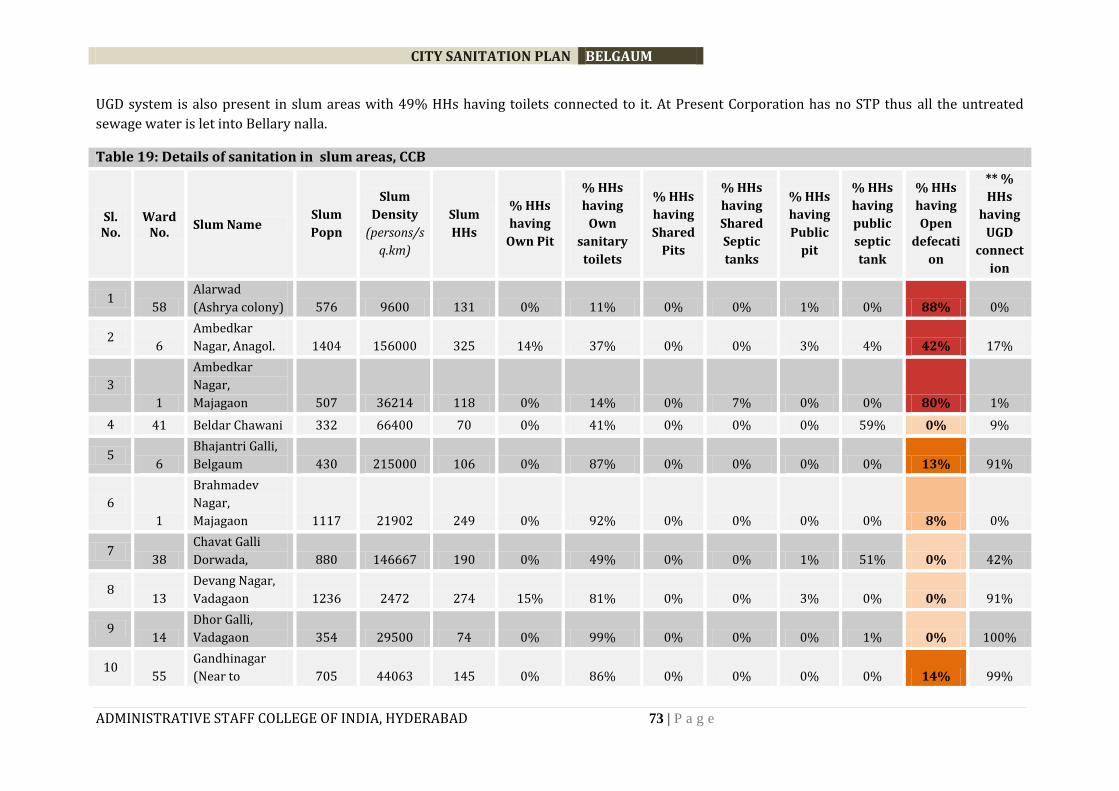
CITY SANITATION PLAN BELGAUM
ADMINISTRATIVE STAFF COLLEGE OF INDIA, HYDERABAD 73 | P a g e
UGD system is also present in slum areas with 49% HHs having toilets connected to it. At Present Corporation has no STP thus all the untreated
sewage water is let into Bellary nalla.
Table 19: Details of sanitation in slum areas, CCB
Sl. No.
Ward No.
Slum Name Slum
Popn
Slum
Density
(persons/s
q.km)
Slum
HHs
% HHs
having
Own Pit
% HHs
having
Own
sanitary
toilets
% HHs
having
Shared
Pits
% HHs
having
Shared
Septic
tanks
% HHs
having
Public
pit
% HHs
having
public
septic
tank
% HHs
having
Open
defecati
on
** %
HHs
having
UGD
connect
ion
1 58
Alarwad
(Ashrya colony) 576 9600 131 0% 11% 0% 0% 1% 0% 88% 0%
2 6
Ambedkar
Nagar, Anagol. 1404 156000 325 14% 37% 0% 0% 3% 4% 42% 17%
3
1
Ambedkar
Nagar,
Majagaon 507 36214 118 0% 14% 0% 7% 0% 0% 80% 1%
4 41 Beldar Chawani 332 66400 70 0% 41% 0% 0% 0% 59% 0% 9%
5 6
Bhajantri Galli,
Belgaum 430 215000 106 0% 87% 0% 0% 0% 0% 13% 91%
6
1
Brahmadev
Nagar,
Majagaon 1117 21902 249 0% 92% 0% 0% 0% 0% 8% 0%
7 38
Chavat Galli
Dorwada, 880 146667 190 0% 49% 0% 0% 1% 51% 0% 42%
8 13
Devang Nagar,
Vadagaon 1236 2472 274 15% 81% 0% 0% 3% 0% 0% 91%
9 14
Dhor Galli,
Vadagaon 354 29500 74 0% 99% 0% 0% 0% 1% 0% 100%
10 55
Gandhinagar
(Near to 705 44063 145 0% 86% 0% 0% 0% 0% 14% 99%
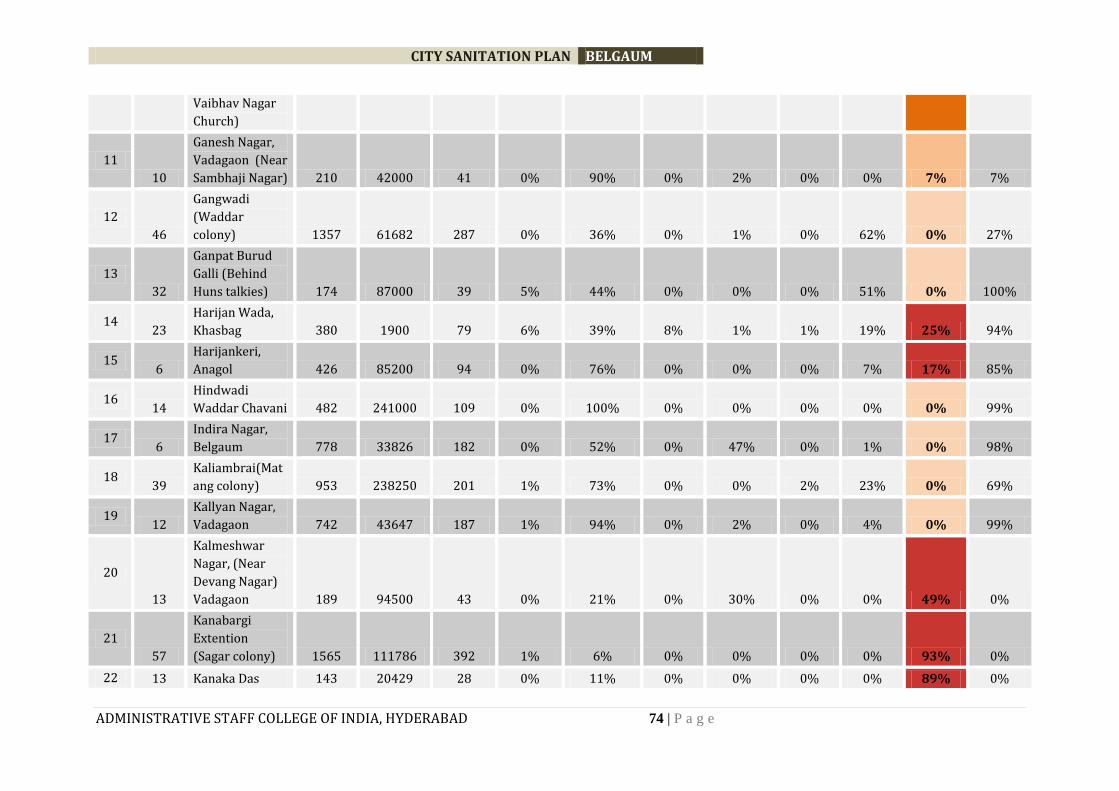
CITY SANITATION PLAN BELGAUM
ADMINISTRATIVE STAFF COLLEGE OF INDIA, HYDERABAD 74 | P a g e
Vaibhav Nagar
Church)
11
10
Ganesh Nagar,
Vadagaon (Near
Sambhaji Nagar) 210 42000 41 0% 90% 0% 2% 0% 0% 7% 7%
12
46
Gangwadi
(Waddar
colony) 1357 61682 287 0% 36% 0% 1% 0% 62% 0% 27%
13
32
Ganpat Burud
Galli (Behind
Huns talkies) 174 87000 39 5% 44% 0% 0% 0% 51% 0% 100%
14 23
Harijan Wada,
Khasbag 380 1900 79 6% 39% 8% 1% 1% 19% 25% 94%
15 6
Harijankeri,
Anagol 426 85200 94 0% 76% 0% 0% 0% 7% 17% 85%
16 14
Hindwadi
Waddar Chavani 482 241000 109 0% 100% 0% 0% 0% 0% 0% 99%
17 6
Indira Nagar,
Belgaum 778 33826 182 0% 52% 0% 47% 0% 1% 0% 98%
18 39
Kaliambrai(Mat
ang colony) 953 238250 201 1% 73% 0% 0% 2% 23% 0% 69%
19 12
Kallyan Nagar,
Vadagaon 742 43647 187 1% 94% 0% 2% 0% 4% 0% 99%
20
13
Kalmeshwar
Nagar, (Near
Devang Nagar)
Vadagaon 189 94500 43 0% 21% 0% 30% 0% 0% 49% 0%
21
57
Kanabargi
Extention
(Sagar colony) 1565 111786 392 1% 6% 0% 0% 0% 0% 93% 0%
22 13 Kanaka Das 143 20429 28 0% 11% 0% 0% 0% 0% 89% 0%
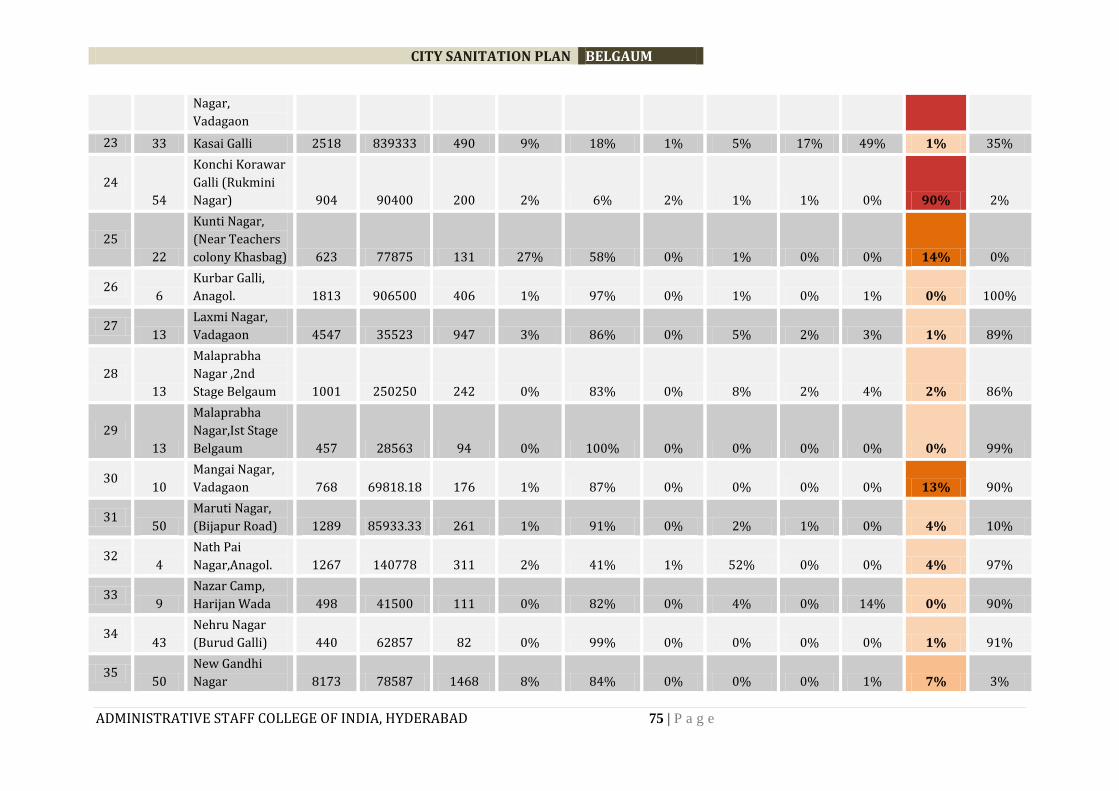
CITY SANITATION PLAN BELGAUM
ADMINISTRATIVE STAFF COLLEGE OF INDIA, HYDERABAD 75 | P a g e
Nagar,
Vadagaon
23 33 Kasai Galli 2518 839333 490 9% 18% 1% 5% 17% 49% 1% 35%
24
54
Konchi Korawar
Galli (Rukmini
Nagar) 904 90400 200 2% 6% 2% 1% 1% 0% 90% 2%
25
22
Kunti Nagar,
(Near Teachers
colony Khasbag) 623 77875 131 27% 58% 0% 1% 0% 0% 14% 0%
26 6
Kurbar Galli,
Anagol. 1813 906500 406 1% 97% 0% 1% 0% 1% 0% 100%
27 13
Laxmi Nagar,
Vadagaon 4547 35523 947 3% 86% 0% 5% 2% 3% 1% 89%
28
13
Malaprabha
Nagar ,2nd
Stage Belgaum 1001 250250 242 0% 83% 0% 8% 2% 4% 2% 86%
29
13
Malaprabha
Nagar,Ist Stage
Belgaum 457 28563 94 0% 100% 0% 0% 0% 0% 0% 99%
30 10
Mangai Nagar,
Vadagaon 768 69818.18 176 1% 87% 0% 0% 0% 0% 13% 90%
31 50
Maruti Nagar,
(Bijapur Road) 1289 85933.33 261 1% 91% 0% 2% 1% 0% 4% 10%
32 4
Nath Pai
Nagar,Anagol. 1267 140778 311 2% 41% 1% 52% 0% 0% 4% 97%
33 9
Nazar Camp,
Harijan Wada 498 41500 111 0% 82% 0% 4% 0% 14% 0% 90%
34 43
Nehru Nagar
(Burud Galli) 440 62857 82 0% 99% 0% 0% 0% 0% 1% 91%
35 50
New Gandhi
Nagar 8173 78587 1468 8% 84% 0% 0% 0% 1% 7% 3%

CITY SANITATION PLAN BELGAUM
ADMINISTRATIVE STAFF COLLEGE OF INDIA, HYDERABAD 76 | P a g e
36
50
Old Gandhi
Nagar (Deepak
Galli) 1143 87923 222 2% 57% 0% 0% 0% 0% 40% 12%
37
20
Patil Galli,
Khasbag (Near
Joshi Mala) 845 19205 178 0% 83% 0% 3% 0% 8% 6% 93%
38
10
Patil Galli,
Waddar Chavani
Belgaum. 707 117833 146 0% 33% 0% 12% 0% 55% 0% 1%
39 2
Rajaram Nagar,
Udyambag 608 23385 132 2% 47% 0% 0% 0% 0% 52% 54%
40 46
Ramnagar
Waddarwadi 2271 70969 460 2% 20% 0% 10% 0% 68% 0% 28%
41
10
Ranajunjar
colony,
Vadagaon 528 26400 122 2% 97% 0% 1% 0% 0% 1% 95%
42
3
Rohidas Nagar
,4th Railway
Gate. 579 115800 137 0% 69% 0% 0% 0% 0% 31% 33%
43 54
Rukmini Nagar (
Ashray colony) 2734 6076 614 0% 19% 0% 1% 0% 0% 80% 3%
44 54
Rukmini Nagar
(Kasai Galli) 638 70889 136 19% 76% 0% 0% 1% 4% 1% 86%
45
49
Shivaji Nagar
(Panaji Baba
Math) 1084 5420 239 3% 89% 0% 1% 0% 6% 0% 98%
46 51
Shrinagar,
Jopadpatti 310 10333 75 0% 0% 0% 0% 0% 0% 100% 5%
47
12
Teggin Galli,
Waddar Chavani
Vadagaon. 402 57429 78 1% 88% 0% 1% 0% 0% 9% 99%

CITY SANITATION PLAN BELGAUM
ADMINISTRATIVE STAFF COLLEGE OF INDIA, HYDERABAD 77 | P a g e
48 52
Vantumuri
Ashray Colony) 1661 16610 363 1% 0% 0% 0% 0% 0% 99% 2%
49 6
Waddar Galli,
Anagol. 433 144333 95 0% 49% 1% 45% 0% 3% 1% 99%
50 21
Waddar Galli,
Khasbag. 2240 35556 410 11% 73% 3% 5% 0% 4% 4% 99%
51 5
Zatpat Nagar,
Belgaum. 1793 81500 392 1% 68% 0% 27% 0% 0% 4% 94%
Total 57214 5386613 12082 4% 60% 0% 5% 1% 10% 20% 49%
Note OD colour code legend 0-5% 5-10% 10-15% >15%
[Source: Asha Kiran Mahiti, 2010] ** % HHs having UGD connection shows the total percentage of slum households connected to UGD
Poor conditions of toilet facilities resorting to Open Defecation
[Source: ASCI]

CITY SANITATION PLAN BELGAUM
ADMINISTRATIVE STAFF COLLEGE OF INDIA, HYDERABAD 78 | P a g e
4.1.3 OPEN DEFECATION AREAS
Incidences of open defecation are quite high with a percentage of 20% of slum HHs. The slums
are characterized by lack of access to basic sanitation facilities. Ill-maintained public
convenience blocks and inadequate individual unit’s results in unsafe practices like open
defecation.
The details of OD areas are presented in the table as follows.
Table 20: Details of OD areas, CCB
Sl. No. Ranging Ward. No. No.of wards No.of Slums
1 No OD 41,38,13(2*),14(2*),46(2*),32,6(2*),39,12,9,10,49 12 16
2 0-5% 33,13(2*),50,4,43,10,546,21,5 10 11
3 5-10% 1,10,50,20,12 5 5
4 10-15% 6,55,22,10 4 4
5 >15% 58,6(2*),1,23,13(3*),57,54(2*),50,2,51,52, 12 15
*(_)the ward is repeated because of the number of slums in that ward that practice OD
[Source: Asha Kiran Mahiti, 2010 & ASCI primary survey, 2011]
Map 3: Identified Open Defecation Wards in CCB
[Source: ASCI]

CITY SANITATION PLAN BELGAUM
ADMINISTRATIVE STAFF COLLEGE OF INDIA, HYDERABAD 79 | P a g e
4.1.4 COMMUNITY TOILETS
There are 43 community toilets in various wards of Belgaum City Corporation, of which 2 are
maintained by C.C.B worker, 18 by C.C.B contract, 3 are cleaning & contractor and the remaining
by private contractors. Of the 43 toilet complexes, 4 are not working and the remaining are
working but found to be in average conditions. Improper maintenance of the community toilets
is also a major factor that is resorting to Open defecation.
There are in total 335 toilet seats which are being used by 3697 HHs(3%) of the total
households.
The following details are given in the table below.
Table 21 Details Of Community Toilets In Residential / Slum Areas
S.no Ward No
Name of Slum/Area
Location of Community Toilet
Toilet Seats
Number of Househ olds Using
Whether pay and use (Y/N)
Type of Management
Working /Not working
1 1 Majagaon Bedar Galli, Majagaon
2 2 - - Not working
2 2 Majagaon Udyambhag main Road, Beside Bemco
1 3 Yes Contractor -
3 3 Majagaon - - - - - -
4 4 Angol Bable Galli, Angol 4 4 125 Cleaning & Contractor
-
5 Maruti Galli, Angol
4 4 150 Cleaning & Contractor
-
6 Nath pai Nagar, Angol
4 4 135 Cleaning & Contractor
-
7 6 Zeri Galli, Ambebkar Nagar
Zeri Galli 8 110 No Contractor Working
8 9 Patil galli vadhar chavani
vadhar chavani Sambhaji Nagar
3 + 3 146 No CCB pvt Contracter
Working
9 14 Dharwad Road, adagaon, Dhamne Road
--- --- --- CCB Contract
---
10 15 15 chambar wada nath pai nahgar
20 300
11 15 15 sarvoday colony 6 60
12 19 M.F. raod beside ice
8 50 CCB Contract
Working
13 M.F. rd 8 100 CCB Working

CITY SANITATION PLAN BELGAUM
ADMINISTRATIVE STAFF COLLEGE OF INDIA, HYDERABAD 80 | P a g e
Contract
14 Shukrawar peth
1 50 CCB Contract
Working
15 gavali galli 4 100 CCB Contract
Working
16 kalamandir 5 CCB Contract
Working
17 20 PK Quarters near PK Borgala
8+8 100 No CCB Contract
18 PK Quarters near Somaj Mandir
CCB Contract
19 PK Quarters, Yellur Bus stop, Anandwadi,
CCB Contract
20 21 harijan wada gade marg
Harijan wada 4 80 No CCB
21 22 waddar galli khasbag
Maruti galli khasbag
10 205 No CCB
22 23 sambhaji galli BP
sambhaji galli BP 8 20 No CCB
23 24 Harijanwada khasbag
Harijan wada 12 45 No CCB
24 26 No Tambit galli 5+5 275 No C.C.B. Worker
Working
25 27 No Tangdi galli 8+8 305 --- do do
26 28 No Rama Metri Adda 5+5 250 --- do do
27 29 No Patil galli B.P 4+4 150 --- do do
28 30 - Arallikatti D. Galli 6 - Contractor Working
29 - Kalegar Galli 14 - Contractor Working
30 31 - Konwal galli 11 - Contractor Working
31 32 Ganapat Galli
--- 13 39 Yes Contractor Working
32 Burdagalli --- --- --- --- --- ---
33 33 Kasai Galli - 10 425 - Contractor Working
34 33 - Kasai Galli 3 - Yes Contractor Working
35 34 --- Kakar Galli 16 75 --- Contractor Working
36 35 Khnajar galli 10 100 N CCB Working
37 Khanjar galli 11 50 Y nil Working
38 38 Dhor galli Chawat galli 18 190 CCB Working
39 39 kaliambrai kaliambria 18 240 N Workng
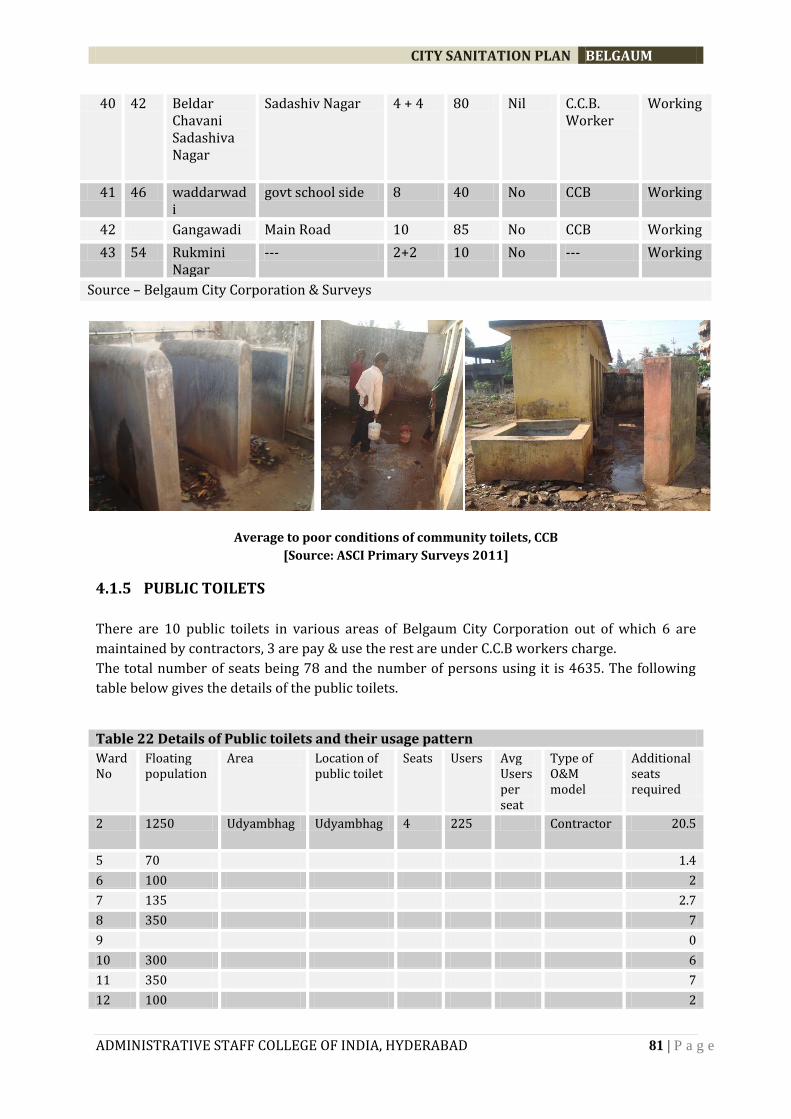
CITY SANITATION PLAN BELGAUM
ADMINISTRATIVE STAFF COLLEGE OF INDIA, HYDERABAD 81 | P a g e
40 42 Beldar Chavani Sadashiva Nagar
Sadashiv Nagar 4 + 4 80 Nil C.C.B. Worker
Working
41 46 waddarwadi
govt school side 8 40 No CCB Working
42 Gangawadi Main Road 10 85 No CCB Working
43 54 Rukmini Nagar
--- 2+2 10 No --- Working
Source – Belgaum City Corporation & Surveys
Average to poor conditions of community toilets, CCB
[Source: ASCI Primary Surveys 2011]
4.1.5 PUBLIC TOILETS
There are 10 public toilets in various areas of Belgaum City Corporation out of which 6 are
maintained by contractors, 3 are pay & use the rest are under C.C.B workers charge.
The total number of seats being 78 and the number of persons using it is 4635. The following
table below gives the details of the public toilets.
Table 22 Details of Public toilets and their usage pattern
Ward No
Floating population
Area Location of public toilet
Seats Users Avg Users per seat
Type of O&M model
Additional seats required
2 1250 Udyambhag Udyambhag 4 225 Contractor 20.5
5 70 1.4
6 100 2
7 135 2.7
8 350 7
9 0
10 300 6
11 350 7
12 100 2
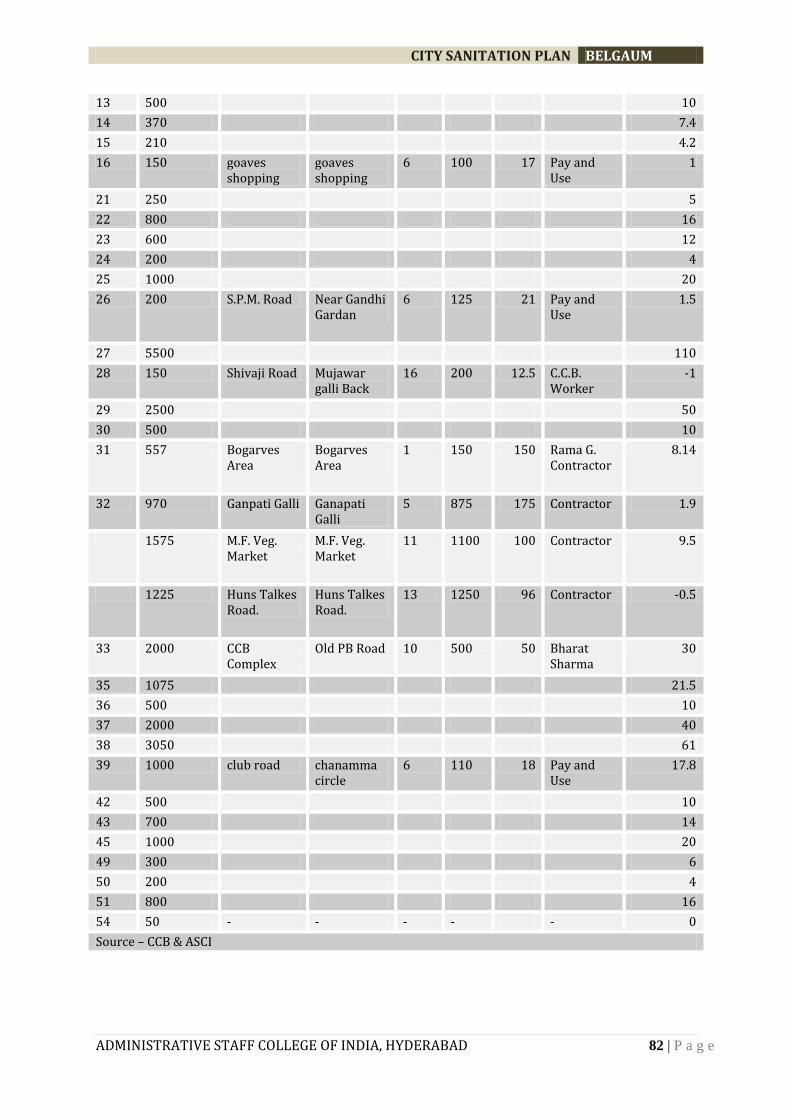
CITY SANITATION PLAN BELGAUM
ADMINISTRATIVE STAFF COLLEGE OF INDIA, HYDERABAD 82 | P a g e
13 500 10
14 370 7.4
15 210 4.2
16 150 goaves shopping
goaves shopping
6 100 17 Pay and Use
1
21 250 5
22 800 16
23 600 12
24 200 4
25 1000 20
26 200 S.P.M. Road Near Gandhi Gardan
6 125 21 Pay and Use
1.5
27 5500 110
28 150 Shivaji Road Mujawar galli Back
16 200 12.5 C.C.B. Worker
-1
29 2500 50
30 500 10
31 557 Bogarves Area
Bogarves Area
1 150 150 Rama G. Contractor
8.14
32 970 Ganpati Galli Ganapati Galli
5 875 175 Contractor 1.9
1575 M.F. Veg. Market
M.F. Veg. Market
11 1100 100 Contractor 9.5
1225 Huns Talkes Road.
Huns Talkes Road.
13 1250 96 Contractor -0.5
33 2000 CCB Complex
Old PB Road 10 500 50 Bharat Sharma
30
35 1075 21.5
36 500 10
37 2000 40
38 3050 61
39 1000 club road chanamma circle
6 110 18 Pay and Use
17.8
42 500 10
43 700 14
45 1000 20
49 300 6
50 200 4
51 800 16
54 50 - - - - - 0
Source – CCB & ASCI

CITY SANITATION PLAN BELGAUM
ADMINISTRATIVE STAFF COLLEGE OF INDIA, HYDERABAD 83 | P a g e
Average to poor conditions of Public toilets, CCB
[Source: ASCI Primary Surveys 2011]
Map 4: Location of community and public toilets
[Source: ASCI]

CITY SANITATION PLAN BELGAUM
ADMINISTRATIVE STAFF COLLEGE OF INDIA, HYDERABAD 84 | P a g e
Belgaum is visited by approx. 33087 floating population per day. The population is served by
only 78 seats in various public toilet complexes scattered all over the city area. The numbers of
seats are inadequate. Hence, some such complexes have to be constructed in these areas to meet
the needs of the visitors in such wards.
The following table gives the ward wise details of the floating population.
Table 23 ward wise Numbers And Percentage Of Floating Population
Ward No No. of People visiting town every day by ward
Areas and localities of visiting
2 1250 Udyambhag
5 70 Sambhaji Chowk main Road & Clinics
6 100 Near Govt. Marathi School, Ragunath Peth
7 135 3rd cross, Bhagynagar, gogate College Road, Vadagaon.
8 350 BigBazar, Bhagi Market
Deshmukh Road, RPD. Circle
9 300 Yallur Road DHO Road & other
10 350 Sombaji Nagar Nozar Comp & Other
11 100 Vishnu galli, Patil galli
12 500 Bazar galli
13 370 bharta nagar
14 210 Laxmi Nagar, Malprabha Nagar
15 150 june belgaon
20 250
21 800 Marketing in khasbag
22 600 Marketing in khasbag
23 200 Marketing in khasbag
24 1000 Marketing in khasbag
25 200 Marketing in khasbag
26 5500 Kapileshwar Temple
27 150 mahadwar Road
28 2500 Shani Temple
29 500 Fort Road, Trunk Road, P.B. Road
30 557 Raviwar Peth, Kalmath Road
31 970 Kelakarbag
32 1575 KhadeBazar, Kadolkar Galli.
33 1225 Khadebazar, Kasai Galli
34 2000 KhadeBazar, Tenginkar Galli
Bendibazar, Dansal Galli
35 1075 Khanjar galli, kacheri rd
36 500 dispensaries
37 2000 Kaktives road veg market
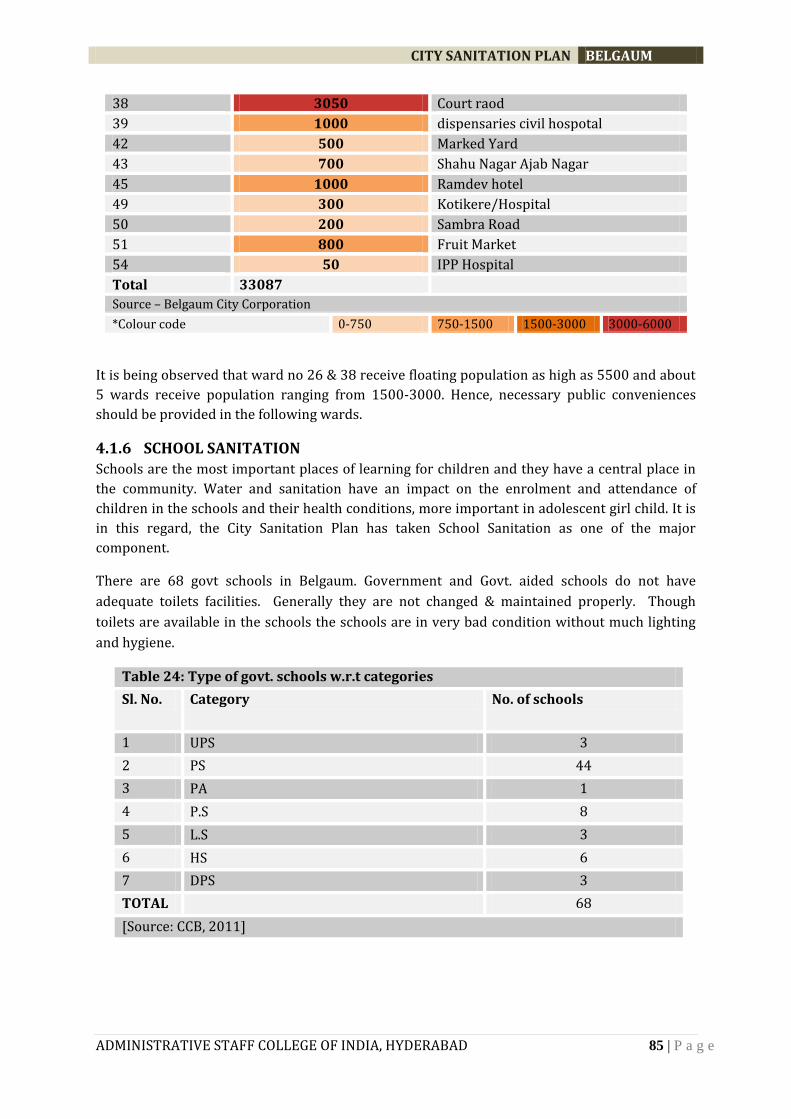
CITY SANITATION PLAN BELGAUM
ADMINISTRATIVE STAFF COLLEGE OF INDIA, HYDERABAD 85 | P a g e
38 3050 Court raod
39 1000 dispensaries civil hospotal
42 500 Marked Yard
43 700 Shahu Nagar Ajab Nagar
45 1000 Ramdev hotel
49 300 Kotikere/Hospital
50 200 Sambra Road
51 800 Fruit Market
54 50 IPP Hospital
Total 33087
Source – Belgaum City Corporation
*Colour code 0-750 750-1500 1500-3000 3000-6000
It is being observed that ward no 26 & 38 receive floating population as high as 5500 and about
5 wards receive population ranging from 1500-3000. Hence, necessary public conveniences
should be provided in the following wards.
4.1.6 SCHOOL SANITATION
Schools are the most important places of learning for children and they have a central place in
the community. Water and sanitation have an impact on the enrolment and attendance of
children in the schools and their health conditions, more important in adolescent girl child. It is
in this regard, the City Sanitation Plan has taken School Sanitation as one of the major
component.
There are 68 govt schools in Belgaum. Government and Govt. aided schools do not have
adequate toilets facilities. Generally they are not changed & maintained properly. Though
toilets are available in the schools the schools are in very bad condition without much lighting
and hygiene.
Table 24: Type of govt. schools w.r.t categories
Sl. No. Category No. of schools
1 UPS 3
2 PS 44
3 PA 1
4 P.S 8
5 L.S 3
6 HS 6
7 DPS 3
TOTAL 68
[Source: CCB, 2011]

CITY SANITATION PLAN BELGAUM
ADMINISTRATIVE STAFF COLLEGE OF INDIA, HYDERABAD 86 | P a g e
TOILET FACILITIES FOR STUDENTS IN SCHOOLS
It has been observed that about 12% of the schools have no toilet facilities. This may be
attributed to lack of adequate maintenance. Such non-functioning toilets need to be looked into
and upgraded, so as to provide adequate toilet facilities to students at the minimal cost of
repairing and maintenance as compared to the cost of construction of new toilets.
It has been observed that about 7% of toilets are unavailable for boys and 9 % of toilets
unavailable for girls resorting to open defecation.
Toilet Facilities for Girls & Boys in School
As per the norms, one urinal space may be provided for every 20-40 boys/girls and one toilet
seat may be provided for every 80-120 boys/girls. At the very outset, the number of toilets
available is scarce and the number of toilets functioning is far less by half. The number of toilets
available for the girl students is barely sufficient. This also reflects on the standards of the
school sanitation along with the importance given for sanitation related activities. The practice
of open defecation in schools is reinforced by traditional behavior patterns and lack of
awareness about the health threats posed by it coupled with non-availability of toilets in the
school premises. The school authorities have not been sensitive to the issues causing health
hazards due to open defecation. The sole reason spelt out quite often is the operation and
maintenance cost of the toilets. All the teachers were of the opinion that providing
infrastructure remains to be the last priority as compared to construction of more school rooms,
etc.
INFORMATION BOX 3: GUIDELINES OF TOTAL SANITATION CAMPAIGN(TSC) FOR SCHOOL
SANITATION
Total Sanitation Campaign (TSC) guidelines at present stipulate that toilets in all types of Govt.
schools i.e. Primary, Upper Primary, Secondary and Higher Secondary and Anganwadis should
be constructed. The Dept. of Drinking Water Supply is supporting the construction of toilets and
urinals in schools under TSC.
The guidelines say that separate toilets for girls and boys should be provided in co-educational
schools which are to be treated as two separate units and each unit is entitled to Central
assistance. The unit cost of each school toilet units is Rs. 20,000 of which 70% i.e. Rs. 14,000 is
Figure 8: Functionality of toilets in govt. schools
[Source:CCB] Figure 9 % availability of toilets for girls & boys
[Source:CCB]
88%
12%
School Sanitation
Having toilets
Not havingtoilets
7% 9%
84%
School Sanitation
% Toiletsunavailable forboys
% Toiletsunavailable forgirls
% Toiletsavailable forboth

CITY SANITATION PLAN BELGAUM
ADMINISTRATIVE STAFF COLLEGE OF INDIA, HYDERABAD 87 | P a g e
given as Central share, the rest being the State share. Each unit consists of one toilet and three or
four urinals. It is evident that the number of toilet units to be built should be linked to the
number of students to be catered to by each unit. Hence, the following clarification is issued:
“One Urinal space may be provided for every 20 to 40 boys or girls separately and one toilet seat
may be provided for every 80 to 120 boys or girls separately. One school toilet unit should
consist of one lavatory and three to four urinals. Construction should be in multiples of units
depending on the strength of the school, on whether students are allowed to go to urinals during
classes, on whether schools have staggered breaks, space available in the school premises,
expected growth in the enrolment and other regional conditions. States are given the flexibility
to define their norms within this range depending on existing State norms and the other factors
mentioned above. School-wise requirement of toilet units should be worked out based on these
factors.”
CONDITION ASSESSMENT OF SCHOOL TOILETS
Sanitation de-linked with water supply loses its very purpose. Children’s ability to learn may be
affected by inadequate water, sanitation and hygiene conditions in several ways. They include
helminthes infections, long-term exposure to chemical contaminants in water (e.g. lead and
arsenic), diarrheal diseases and malaria infections, all of which force many school children to be
absent from school. About 24% of toilets in schools do not have water supply facilities.
Figure 10 water facility availability in schools
[Source – CCB]
Figure 11 waste water disposal in schools
[Source – CCB]
WASTE WATER DISPOSAL IN SCHOOL TOILETS
Majority of the toilets (83%) in the govt. schools of CCB are connected to UGD. 17% toilets are
connected to the septic tanks and the remaining 8% of schools have no sanitation facility.
School Saniation, [survey ASCI]
76%
24%
Water Facility Availability
water facilityavailable
water facilityunavailable
83%
17%
Waste Water Disposal
connected toUGD
connected toseptic tank

CITY SANITATION PLAN BELGAUM
ADMINISTRATIVE STAFF COLLEGE OF INDIA, HYDERABAD 88 | P a g e
4.1.7 SEPTAGE MANAGEMENT
At present, Belgaum city is partly covered by underground sewerage system. The system is still
under construction. Corporation is having one sucker machine for cleaning the septic tanks. At
Present Corporation has no sewage treatment plant thus all the sewage water –untreated, is let
into Bellary nalla. The government has sanctioned 186 crores for entire remodeling of the UGD
system and construction of the sewage treatment plant for the entire city.
Table 25 Sludge/Septage Equipment And Mangement
No. Indicator Municipality Owned
A Equipment Available ---
1 No of Sludge Suction trucks/equipment One
2 Annual No of tanks cleaned - last year's estimate 194
B Cleaned using mechanical equipment
3 Estimated Volume (ML) cleaned last year 582000 litres
4 Method of Conveyance and Disposal: Untreated UGD main line
5 Amount Disposed Untreated (ML) - last year's estimate 582000 litres
6 Location of disposal - untreated UGD main line
7 Method of Conveyance and Disposal: Treated No treatment
8 Amount Disposed Treated (ML) - last year's estimate Nill
9 Location of disposal - Treated Nill
10 Cost per tank cleaning Rs. 1000/- /3000 litres of tank capait
Source - CCB
From the field survey, it was observed that most of the houses get their septic tanks cleaned
after large intervals of about 1 – 7 years. This is a point of concern, because when cleared after
such intervals, the septic tanks may not function to the full extent in treating the septage.
The individual houses or the communities approach private agencies which clear the septage
through Cess Pool Vehicles. The houses pay a onetime charge of Rs. 1000 – Rs. 3000. No
information about the average volume of faecal sludge generated and disposed annually was
available. The private agencies dispose of the collected sludge in low lying areas outside the
municipal boundary.
Untreated waste water is let into Bellary nalla as there is no treatment facility
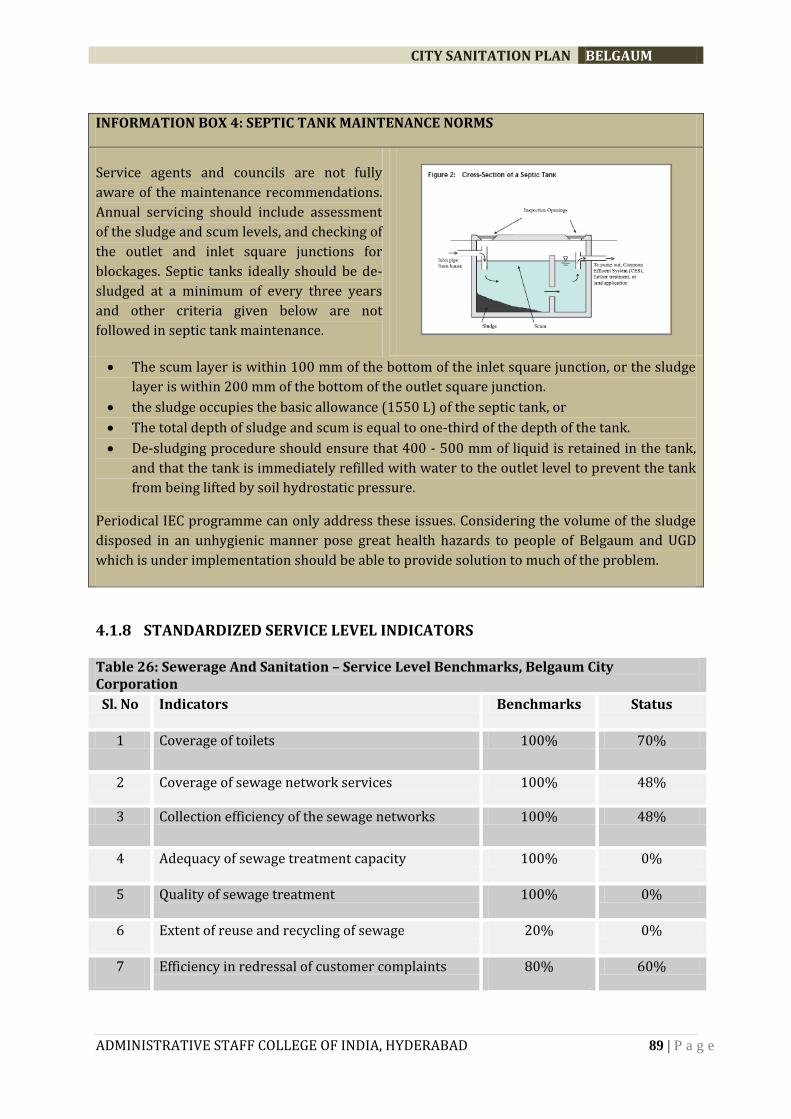
CITY SANITATION PLAN BELGAUM
ADMINISTRATIVE STAFF COLLEGE OF INDIA, HYDERABAD 89 | P a g e
INFORMATION BOX 4: SEPTIC TANK MAINTENANCE NORMS
Service agents and councils are not fully
aware of the maintenance recommendations.
Annual servicing should include assessment
of the sludge and scum levels, and checking of
the outlet and inlet square junctions for
blockages. Septic tanks ideally should be de-
sludged at a minimum of every three years
and other criteria given below are not
followed in septic tank maintenance.
The scum layer is within 100 mm of the bottom of the inlet square junction, or the sludge
layer is within 200 mm of the bottom of the outlet square junction.
the sludge occupies the basic allowance (1550 L) of the septic tank, or
The total depth of sludge and scum is equal to one-third of the depth of the tank.
De-sludging procedure should ensure that 400 - 500 mm of liquid is retained in the tank,
and that the tank is immediately refilled with water to the outlet level to prevent the tank
from being lifted by soil hydrostatic pressure.
Periodical IEC programme can only address these issues. Considering the volume of the sludge
disposed in an unhygienic manner pose great health hazards to people of Belgaum and UGD
which is under implementation should be able to provide solution to much of the problem.
4.1.8 STANDARDIZED SERVICE LEVEL INDICATORS
Table 26: Sewerage And Sanitation – Service Level Benchmarks, Belgaum City Corporation
Sl. No Indicators Benchmarks Status
1 Coverage of toilets 100% 70%
2 Coverage of sewage network services 100% 48%
3 Collection efficiency of the sewage networks 100% 48%
4 Adequacy of sewage treatment capacity 100% 0%
5 Quality of sewage treatment 100% 0%
6 Extent of reuse and recycling of sewage 20% 0%
7 Efficiency in redressal of customer complaints 80% 60%

CITY SANITATION PLAN BELGAUM
ADMINISTRATIVE STAFF COLLEGE OF INDIA, HYDERABAD 90 | P a g e
8 Extent of cost recovery in sewage management 100% 0%
9 Efficiency in collection of sewage charges 90% 0%
[Source –SLB notifications of Karnataka ULB’s 2011]
4.1.9 WASTE WATER PROJECTIONS
Assessment for the amount of sewerage that may be produced by the future population growth
has been made on the basis of the projected population, and the present per capita water
supply. By 2045, 71.77 MLD of waste water will be produced by the city’s population.
Table 27: Projections Of Waste Water
Year Avg per capita Population (Arithmetic Increase method)
Waste Water in MLD
2010 110 536,943 47.25
2015 110 576,754 50.75
2020 110 616,566 54.26
2025 110 656,377 57.76
2030 110 696,189 61.26
2035 110 736,000 64.77
2040 110 775,812 68.27
2045 110 815,623 71.77
[Source – ASCI]
INFORMATION BOX 5: SEWERAGE AND SANITATION – THE KEY OBSERVATIONS
20% of slum HHs defecate in open – immediate mitigation necessary.
There is a need for improving the information database about sanitation on the part of the
Municipality.
12% of schools do not have toilet facilities necessary up gradation is required.
There is a need for construction of more number of community toilets in the slums within
the Municipality area.
At Present Belgaum Corporation has no sewage treatment plant thus all the sewage water –
untreated, is let into Bellary nalla.
Clearing of the sludge from the septic tanks is done majorly by human agencies.
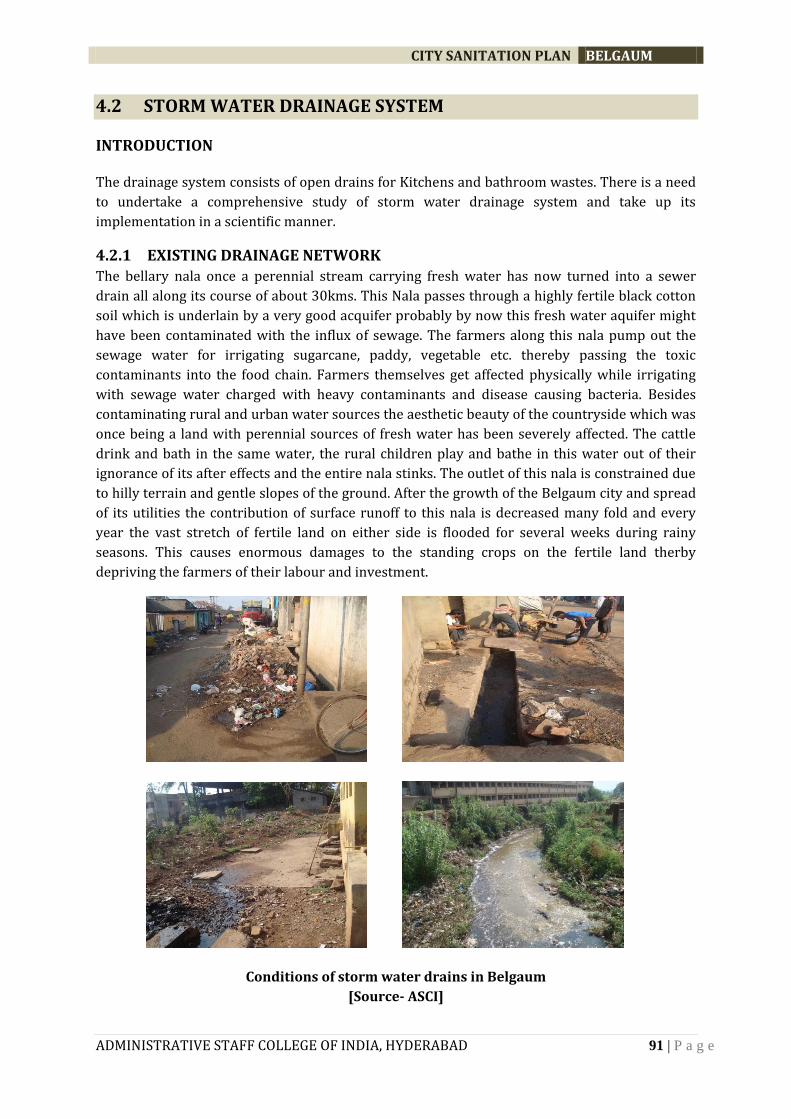
CITY SANITATION PLAN BELGAUM
ADMINISTRATIVE STAFF COLLEGE OF INDIA, HYDERABAD 91 | P a g e
4.2 STORM WATER DRAINAGE SYSTEM
INTRODUCTION
The drainage system consists of open drains for Kitchens and bathroom wastes. There is a need
to undertake a comprehensive study of storm water drainage system and take up its
implementation in a scientific manner.
4.2.1 EXISTING DRAINAGE NETWORK
The bellary nala once a perennial stream carrying fresh water has now turned into a sewer
drain all along its course of about 30kms. This Nala passes through a highly fertile black cotton
soil which is underlain by a very good acquifer probably by now this fresh water aquifer might
have been contaminated with the influx of sewage. The farmers along this nala pump out the
sewage water for irrigating sugarcane, paddy, vegetable etc. thereby passing the toxic
contaminants into the food chain. Farmers themselves get affected physically while irrigating
with sewage water charged with heavy contaminants and disease causing bacteria. Besides
contaminating rural and urban water sources the aesthetic beauty of the countryside which was
once being a land with perennial sources of fresh water has been severely affected. The cattle
drink and bath in the same water, the rural children play and bathe in this water out of their
ignorance of its after effects and the entire nala stinks. The outlet of this nala is constrained due
to hilly terrain and gentle slopes of the ground. After the growth of the Belgaum city and spread
of its utilities the contribution of surface runoff to this nala is decreased many fold and every
year the vast stretch of fertile land on either side is flooded for several weeks during rainy
seasons. This causes enormous damages to the standing crops on the fertile land therby
depriving the farmers of their labour and investment.
Conditions of storm water drains in Belgaum
[Source- ASCI]

CITY SANITATION PLAN BELGAUM
ADMINISTRATIVE STAFF COLLEGE OF INDIA, HYDERABAD 92 | P a g e
4.2.2 COVERAGE
The total length of primary and secondary drains in Belgaum city is 349 kms along the roadside
which works out to 45.45 per cent of the total road length (615km) of the city which is far less
than the norm of 150 per cent coverage of the present road length. This indicates the necessity
of extension of road side drains in unserved and under-served areas.
Table 28 Details of the coverage of storm water drains,CCB
Length Kms
Length of pucca drains(Km) 56
Length of kutcha Drains (Km) 293
Total length of drains(Km) 349
Total Length of Road Network (Km) 615
4.2.3 OUTFALLS
There is no sewage treatment plant and recycling facilities within the area. The entire sewage is
directed to Bellary nala which is linked through gutters and sewer lines. The most damaging
waste in the Belgaum City is in the form of sewage.
4.2.4 EXISTING DRAINAGE CONDITIONS
Majority of the drains in the city area are lined due to regular yearly maintenance silt deposition
is less in the most of the existing natural drains. Some of the secondary drains and tertiary
drains are choked-up due to improper maintenance. Road sides drains consist of box shaped
drenches on one or both sides of the road and are covered by slabs. Most of the drains are found
to carry both sewage and sullage flow, thereby increasing the flow quantity in drains. This is due
to the absence of branch and trunk sewers.
4.2.5 LOCAL FLOODING AREAS
The primary survey analyses
show that 18 % HHs in slums and
19% HHs in non-slums reside in
areas with water logging
problems. Such areas experience
flooding during the monsoons.
And about 11% of slums HHs
especially during rains.
Table 29 HHs in water logging areas, CCB
Whether the area is prone to flooding
during rains
Slum HHs
Non-Slum HHs
During rains 11% 0%
Once in a while 4% 0%
Total HHs in areas with flooding
18% 0%
No flooding 67% 100%
Total 100% 100%
[Source: ASCI Primary Surveys, 2011]

CITY SANITATION PLAN BELGAUM
ADMINISTRATIVE STAFF COLLEGE OF INDIA, HYDERABAD 93 | P a g e
INFORMATION BOX 6: STORM WATER DRAINAGE – THE KEY OBSERVATIONS
No comprehensive plan for improvement of storm water drains.
Water logging and flood prone areas are observed.
Inadequate capacity of drains due to silting and weeding of drains.
The farmers along this nala pump out the sewage water for irrigating sugarcane, paddy,
vegetable etc. thereby passing the toxic contaminants into the food chain.
Partial/ haphazard lining of drains.
The entire sewage is directed to Bellary nala which is linked through gutters and sewer
lines.
Flow of sewage and disposal of solid wastes into drains.
Silting, weeding and blockage of drains due to dumping of construction spoils and other
wastes.
Lack of adequate maintenance of drain channel and associated structures.
Cleaning of drains manually without any safety equipment.
4.2.6 STANDARDIZED SERVICE LEVEL INDICATORS
As per the standard service level indicators following benchmarks have been assessed:
Table 30: Storm Water Drainage System – Service Level Benchmarks, CCB
Sl. No Indicators Benchmarks Status
1 Coverage of storm water drainage system 100% 53%
2 Incidences of water logging/flooding 0 3
[Source –SLB notifications of Karnataka ULB’s 2011]

CITY SANITATION PLAN BELGAUM
ADMINISTRATIVE STAFF COLLEGE OF INDIA, HYDERABAD 94 | P a g e
4.3 SOLID WASTE MANAGEMENT
As per the definition provided by the Municipal Solid Waste (Management and Handling) Rules,
2000 of Government of India, municipal solid waste (MSW) includes commercial and residential
wastes generated in municipal or notified areas in either solid or semi-solid form excluding
industrial hazardous wastes but including treated bio-medical wastes. The present section
elucidates the status of municipal solid waste management in the city of Belgaum.
The various aspects of solid waste management as per MSW rules 2000 in Belgaum City are
taken care of by the Environmental Engineer and his department. The daily waste generated in
Belgaum is about 158TPD with a daily collection 149.6 TPD.
4.3.1 Primary collection and coverage
The total number of households with D2D collection in CCB area is 57376 (49%). Manually
driven tricycles are used for door-to-door collection. All the household wastes, bulk generator
wastes and street sweeping wastes is disposed of in community bins. Municipal solid waste is
not mixed with hospital and industrial waste.
Primary surveys show that D2D collection system is more prevalent in non-slum areas of the
city. Only about 5% of slum HHs having D2D collection. The slum dwellers majorly (approx.
68%) practice disposal of waste in the roadside bins and it has been observed that about 50% of
Non-slum HHs majorly dispose it in roadside bins. There are about 3% slum HHs who dispose of
their waste in open drains.
Figure 12 Percentage distribution of HHs w.r.t waste disposal
[Source: ASCI primary surveys, 2011]
The ULB carries and clears the waste either through D2D collection, or from roadside bins and
designated dumping spots. But this clearing is not quite efficient as waste still remains after
clearance. This creates unclean and unhealthy environs.
68%
25%
3% 5%
50%
0% 0%
50%
0%
10%
20%
30%
40%
50%
60%
70%
80%
Disposed inroadside Bin
Disposed atdesignated
open dumpingspot
Disposed indrain
Door-to-doorcollection
Slum HHs
Non slum HHs
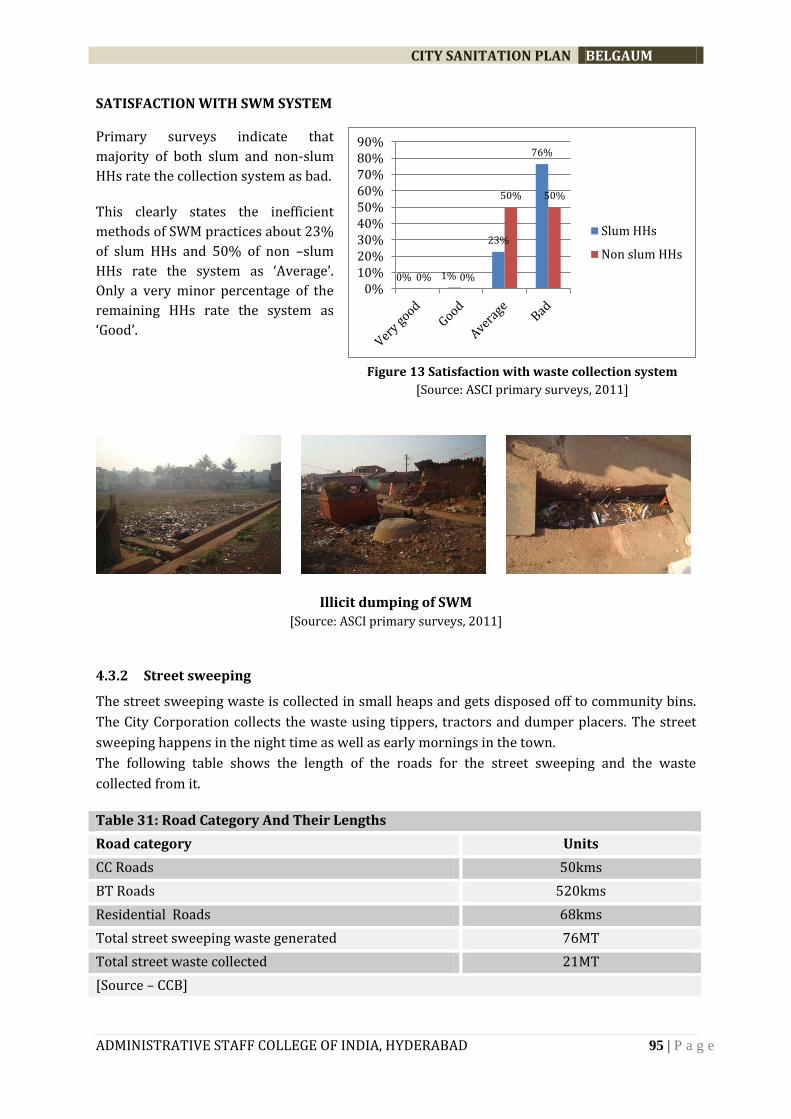
CITY SANITATION PLAN BELGAUM
ADMINISTRATIVE STAFF COLLEGE OF INDIA, HYDERABAD 95 | P a g e
SATISFACTION WITH SWM SYSTEM
Primary surveys indicate that
majority of both slum and non-slum
HHs rate the collection system as bad.
This clearly states the inefficient
methods of SWM practices about 23%
of slum HHs and 50% of non –slum
HHs rate the system as ‘Average’.
Only a very minor percentage of the
remaining HHs rate the system as
‘Good’.
Figure 13 Satisfaction with waste collection system
[Source: ASCI primary surveys, 2011]
Illicit dumping of SWM
[Source: ASCI primary surveys, 2011]
4.3.2 Street sweeping
The street sweeping waste is collected in small heaps and gets disposed off to community bins.
The City Corporation collects the waste using tippers, tractors and dumper placers. The street
sweeping happens in the night time as well as early mornings in the town.
The following table shows the length of the roads for the street sweeping and the waste
collected from it.
Table 31: Road Category And Their Lengths
Road category Units
CC Roads 50kms
BT Roads 520kms
Residential Roads 68kms
Total street sweeping waste generated 76MT
Total street waste collected 21MT
[Source – CCB]
0% 1%
23%
76%
0% 0%
50% 50%
0%10%20%30%40%50%60%70%80%90%
Slum HHs
Non slum HHs

CITY SANITATION PLAN BELGAUM
ADMINISTRATIVE STAFF COLLEGE OF INDIA, HYDERABAD 96 | P a g e
Street sweeping and open drains cleaning and other cleaning related activities are being
managed by corporation pourakarmikas as well as private sanitation contractors.
4.3.3 Waste generation, Segregation, quantity and characteristics
About 158 tons of waste is generated per day in Belgaum City. Belgaum city corportation
collects about 149.6 tons (95 %), of the total waste, through its solid waste collection system.
The per capita waste generation in the town is about 339.5 gm per day that is higher than the
normative estimate of 210 gm per capita per day by CPHEEO for the similar size of city.
Segregation of waste is not being practiced in CCB. The following graph gives the details of
category wise waste generated and collected.
Figure 14 Collection & generation of solid waste
[Source: CCB]
The solid waste that is collected is segregated into wet, dry/ recyclable waste. Physical
composition survey indicates components such as Paper, Plastics, Glass, Metals, Dust & Ash
Clothes, Rags & Rubber and hazardous are yet to be analyzed.
4.3.4 Secondary Collection
The waste from primary collection is transferred to secondary collection metal containers. The
primary collection is done with the help of 40 SHG’s and 20 RWA. 50% area is covered under
collection of waste from DTD and corporation has given 11 auto tippers, 30 tricycles and 128
push carts for various SHG’s & RWA’s. At present Belgaum City Corporation 292 pourakarmikas
for sanitation work. As the number of PK’s in the city corporation are not sufficient to manage
the sanitation of 58 wards. This subject was discussed in the council meeting and it has been
decided to give the work of maintenance of sanitation work of 43 wards to private sanitation
contractors following due procedure.
4.3.5 Transportation
The entire garbage is transported to the landfill site with the help of 8 twin dumper placer, 12
tippers, 8 tractors.
0
500
1000
1500
2000
2500
Residential &commercial
waste
Streetsweeping
Market waste
Category Of Waste Generation & Collection
Quantity of wastegenerated (MT/Month)
Quatity of wastecollected(MT/Month)

CITY SANITATION PLAN BELGAUM
ADMINISTRATIVE STAFF COLLEGE OF INDIA, HYDERABAD 97 | P a g e
Table 32 Details Of Vehicles Used For To Door To Door Waste Collection
Ward No. Vehicle Type
No. of Vehicle
Capacity of each vehicle
No. of
Trips
Total waste collected
1,2,3,4 Auto Tipper 3 0.5 tone 3 4.5
Push Cart 3 90 kg 5 1.5
5,6,7,8 Auto Tipper 2 0.5 tone 4 4
Push Car 6 90 5 2.7
9,10, 11,12
Auto Tipper 1 0.5 tone 2 1
Push Cart 20 90 3 5
13,15 Auto Tipper 2 0.5 tone 6 3
14 & 20 Auto Tipper 1 0.5 tone 1 1
Push Cart 3 0.5 tone 3 3
21,22,23,24,25 Push cart 15 90 KG 3 4
30,31,33 Auto Tipper 6 540 kg 6 6.5
Push Cart - - - -
32 & 34 Pursh Cart 15 30 kg 2 1.0
35,37,38 Pursh Cart 3 90 10 3
49,50 ,51,54
Auto Tipper 1 0.6 5 3
whed Borrows
12 90 kg 4 3.6
52 & 53 Auto Tipper 1 0.5 Tone 5 2.5
Push Car 4 90 kg / Push Car
4 1.5
56,57,58 Auto Tipper nill --- --- ---
Push Car nill --- --- ---
Source - CCB
4.3.6 Treatment & Disposal
The entire waste transported to MSW land fill site which is situated at Turmuri village, 14kms
away from the city. M/S Ramky Enviro Engineers PVT limted has been entrusted for final
processing, treatment, inertisation and disposal of Municipal Solid waste on BOT waste for a
period of 25 years. They have already established the plant for treating the waste scientifically
and converting the waste into manure. The manure generated is marketed through Nagarjuna
fertilizers on behalf of Ramky Enviro Engineers limited.
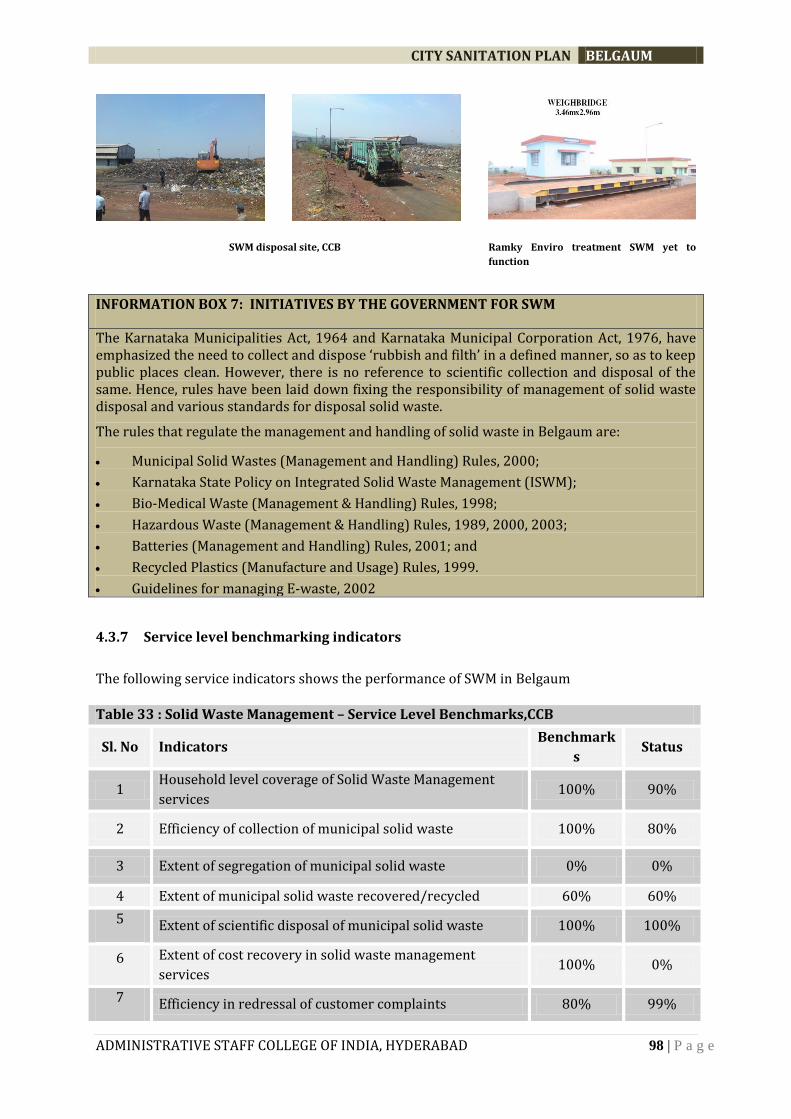
CITY SANITATION PLAN BELGAUM
ADMINISTRATIVE STAFF COLLEGE OF INDIA, HYDERABAD 98 | P a g e
SWM disposal site, CCB Ramky Enviro treatment SWM yet to
function
INFORMATION BOX 7: INITIATIVES BY THE GOVERNMENT FOR SWM
The Karnataka Municipalities Act, 1964 and Karnataka Municipal Corporation Act, 1976, have emphasized the need to collect and dispose ‘rubbish and filth’ in a defined manner, so as to keep public places clean. However, there is no reference to scientific collection and disposal of the same. Hence, rules have been laid down fixing the responsibility of management of solid waste disposal and various standards for disposal solid waste.
The rules that regulate the management and handling of solid waste in Belgaum are:
Municipal Solid Wastes (Management and Handling) Rules, 2000;
Karnataka State Policy on Integrated Solid Waste Management (ISWM);
Bio-Medical Waste (Management & Handling) Rules, 1998;
Hazardous Waste (Management & Handling) Rules, 1989, 2000, 2003;
Batteries (Management and Handling) Rules, 2001; and
Recycled Plastics (Manufacture and Usage) Rules, 1999.
Guidelines for managing E-waste, 2002
4.3.7 Service level benchmarking indicators
The following service indicators shows the performance of SWM in Belgaum
Table 33 : Solid Waste Management – Service Level Benchmarks,CCB
Sl. No Indicators Benchmark
s Status
1 Household level coverage of Solid Waste Management
services 100% 90%
2 Efficiency of collection of municipal solid waste 100% 80%
3 Extent of segregation of municipal solid waste 0% 0%
4 Extent of municipal solid waste recovered/recycled 60% 60%
5 Extent of scientific disposal of municipal solid waste 100% 100%
6 Extent of cost recovery in solid waste management
services 100% 0%
7 Efficiency in redressal of customer complaints 80% 99%

CITY SANITATION PLAN BELGAUM
ADMINISTRATIVE STAFF COLLEGE OF INDIA, HYDERABAD 99 | P a g e
8 Efficiency in collection of user charges 90% 70%
[Source –SLB notifications of Karnataka ULB’s 2011]
4.3.8 Future demand and gap
The following table shows the projections for SWM considering the average per capita as 0.33kg.
Table 34: Projections For Solid Waste Generation In Future
YEAR Avg per capita (kg)
Population (Arithmetic Increase method)
Projection of solid waste generated (TPD)
2010 0.33 536,943 177.19
2015 0.33 576,754 190.33
2020 0.33 616,566 203.47
2025 0.33 656,377 216.60
2030 0.33 696,189 229.74
2035 0.33 736,000 242.88
2040 0.33 775,812 256.02
2045 0.33 815,623 269.16
[Source –ASCI]
INFORMATION BOX 8: SOLID WASTE MANAGEMENT – THE KEY OBSERVATIONS
It was observed that DTD collection of SWM is very inefficient and only 49% of households
have coverage.
Staff requires proper training on solid waste handling and collection the solid waste.
Crude dumping of solid waste on the roadsides, open drains and vacant lands was
observed which creates unhygienic surroundings.
Segregation of waste is not practiced in Belgaum city.

CITY SANITATION PLAN BELGAUM
ADMINISTRATIVE STAFF COLLEGE OF INDIA, HYDERABAD 100 | P a g e
4.4 WATER SUPPLY
INTRODUCTION
Before the commencement of Rakaskop Water Supply Scheme in 1964, Belgaum city was
dependent on open wells. The wells have an average diameter of 30'–35’ with an average water
column of 60'–70’, even during summer. These wells were abandoned after the introduction of
tap water. However, in 1995, the reservoir that supplied water to the city dried up due to
variations in the monsoon. Until 1995, the Rakaskop reservoir was the only source of potable
water for Belgaum city. Wells and open wells were misused as garbage dumping sites, or for
religious rituals like Ganesh immersion. Because of their misuse, many of the wells were
covered with concrete slabs and people had forgotten about their existence. In 1995, with the
delayed monsoons, the reservoir dried up, creating a water crisis in Belgaum city. At this
juncture, the Belgaum City Corporation (BCC), after studying the viability of revival of the open
wells, initiated the process of utilisation of groundwater from open wells to augment surface
water supply. In the process, it also protected the water-table and environment.
The survey, it was realised that Belgaum has an aquifer beneath the laterite stones, and that
most of the old wells are situated there.
Subsequently, 15 high-yield open wells were identified within the corporation limits. Identified
wells were cleaned up, de-silted and de-watered with the involvement of local people, NGOs,
social workers and citizen clubs.
Mini filters with an average design capacity of
50,000 l/hr along with an alum dozer,
chlorinator, and pumps, were fixed to the wells.
The quality of water was tested and supplied to
citizens through the existing distribution
network. Each open well has an average yield of
4 lakh liters of water per day.
The cost of the project worked out to Rs. 5, 00,000 per well. The operating cost of each plant
with 50,000 LPH filtration capacity and 8 hours pumping was around Rs. 307 per day. The
details are given in the table:
4.4.1 Source of water
The purified water supply of the Belgaum city is done by Karnataka urban water and sewerage
board (KUWSSB) from 2 different sources i.e Markendaya river-Ra kaskoppa and ghataprabha
river-Hidkal dam and every day 15MGD of water is supplied to the city. Recently 24/7 water
supply system is implemented in 10 wards of Belgaum City. The billing is done on monthly basis
and the people are paying the bills regularly.
In view of the success of 24hr continuous water supply in these 10 wards people have
expressed their willingness for the similar facility in their wards. Hence a proposal was
submitted for implementation of 24hrs supply of water in the entire city. The same is accepted
by the Govt. of Karnataka and this facility will be extended to the entire city.
Table 35 Expenditure details of the well
Expenditure Area Cost per Day
Electricity 152
Chemicals 55
Labour 100
Total 307
Source - CCB

CITY SANITATION PLAN BELGAUM
ADMINISTRATIVE STAFF COLLEGE OF INDIA, HYDERABAD 101 | P a g e
4.4.2 Service coverage
The service coverage of water supply is covering 39801 HHs (about approx. 34%). There are
about 30 % metered connections in Belgaum. Following are the ward wise details of various
categories of connections.
Table 36 Ward Wise Connection Details
Ward No HHs Connected To Piped Water
No. Of Hours Per Day Other Commercial Properties Connected To Piped Water System
1 329 3 hours / day
2 2474 3 hours / day 19
3 3 hours / day
4 3 hours / day
5 3 hours / day
6 3 hours / day
7 896 3 hours / day 25
8 849 3 hours / day 1
9 827 3 hours / day 2
10 621 3 hours / day
11 844 3 hours / day 12
12 856 3 hours / day 1
13 703 3 hours / day 3
14 637 3 hours / day 3
15 854 3 hours / day 22
16 900 3 hours / day 2
17 944 3 hours / day 15
18 417 3 hours / day 3
19 572 3 hours / day 11
20 511 3 hours / day 4
21 610 3 hours / day 3
22 627 3 hours / day 14
23 585 3 hours / day 3
24 512 3 hours / day
25 1054 3 hours / day 10
26 446 3 hours / day 2
27 421 3 hours / day 4
28 505 3 hours / day 18
29 478 3 hours / day
30 469 3 hours / day 21
31 638 3 hours / day 19
32 532 3 hours / day 27
33 561 3 hours / day 36
34 633 3 hours / day 12
35 484 3 hours / day 5

CITY SANITATION PLAN BELGAUM
ADMINISTRATIVE STAFF COLLEGE OF INDIA, HYDERABAD 102 | P a g e
36 519 3 hours / day 23
37 388 3 hours / day 2
38 459 3 hours / day 12
39 614 3 hours / day 2
40 654 3 hours / day 6
41 501 3 hours / day 7
42 380 3 hours / day 14
43 2172 3 hours / day 17
44 429 3 hours / day 10
45 447 3 hours / day
46 1111 3 hours / day
47 1324 3 hours / day 3
48 107 3 hours / day 10
49 881 3 hours / day 19
50 803 3 hours / day 3
51 496 3 hours / day 2
52 1658 3 hours / day 5
53 2305 3 hours / day 6
54 1719 3 hours / day 7
55 74 3 hours / day 0
56 207 3 hours / day 3
57 165 3 hours / day 0
58 599 3 hours / day 0
Total 39801 0 448
Source - CCB
There are about 448 other commercial properties connected to piped water system.
4.4.3 Coverage and Supply
The following table shows the coverage of water supply system and number of connections.
Table 37: Details of the coverage of the Water Supply System (2009)
Sl. No. Particulars Units
1. Population 465282
2. Current Per Capita water consumption (in LPCD) 110
3. Per capita supply as per CPHEEO Norm (in LPCD) 135
4 Population covered under piped Water Supply 34%
5. Quantity of drinking water supply per day 15 MGD
6. Source of water
1st stage started Rakkaskoppa
2nd stage started Hidkal dam
7. No. Overhead tanks 5
8. No. of Bore wells 16
Source - CCB

CITY SANITATION PLAN BELGAUM
ADMINISTRATIVE STAFF COLLEGE OF INDIA, HYDERABAD 103 | P a g e
4.4.4 Standardized Service Level indicators
Table 38: Water Supply Services, CCB
Sl. No. Indicators Benchmarks Present Status
1 Coverage of water supply connections
100% 62%
2 Per capita water supply 135 lpcd 110 lpcd
3 Extent of metering of connections 100% 30%
4 Extent of non-revenue water (NRW)
15% 25%
5 Continuity of water supply 24 hrs 0 hrs
6 Quality of water supply 100% 100%
7 Efficiency of redressal of customer complaints
80% 80%
8 Cost recovery in water supply services
100% 43.6%
9 Efficiency in collection of water supply related charges
90% 85%
[Source –SLB notifications of Karnataka ULB’s 2011]
4.4.5 Future Demand and Gap
Assessment of the future water supply requirements has been made on the basis of the
projected population and the present per capita water supply. By 2045, the city would require
about 120 MLD of water supply.
Table 39: Projections For Water Demand
YEAR Avg per capita (lpcd)
Population (Arithmetic Increase method)
Water Supply requirements (MLD)
2010 110 536,943 59.06
2015 110 576,754 63.44
2020 110 616,566 67.82
2025 110 656,377 72.20
2030 110 696,189 76.58
2035 110 736,000 80.96
2040 110 775,812 85.34
2045 110 815,623 89.72
[Source – ASCI]
INFORMATION BOX 9: WATER SUPPLY SYSTEM – THE KEY OBSERVATIONS
Unaccounted for Water (UFW): In the old system, nearly 25 per cent of water loss due to
leakages & unauthorized connections was indicated by CCB officials. The distribution losses
are accounting more than designed losses.
Disparity in water supply rates and pressure is observed in certain areas due to lack of
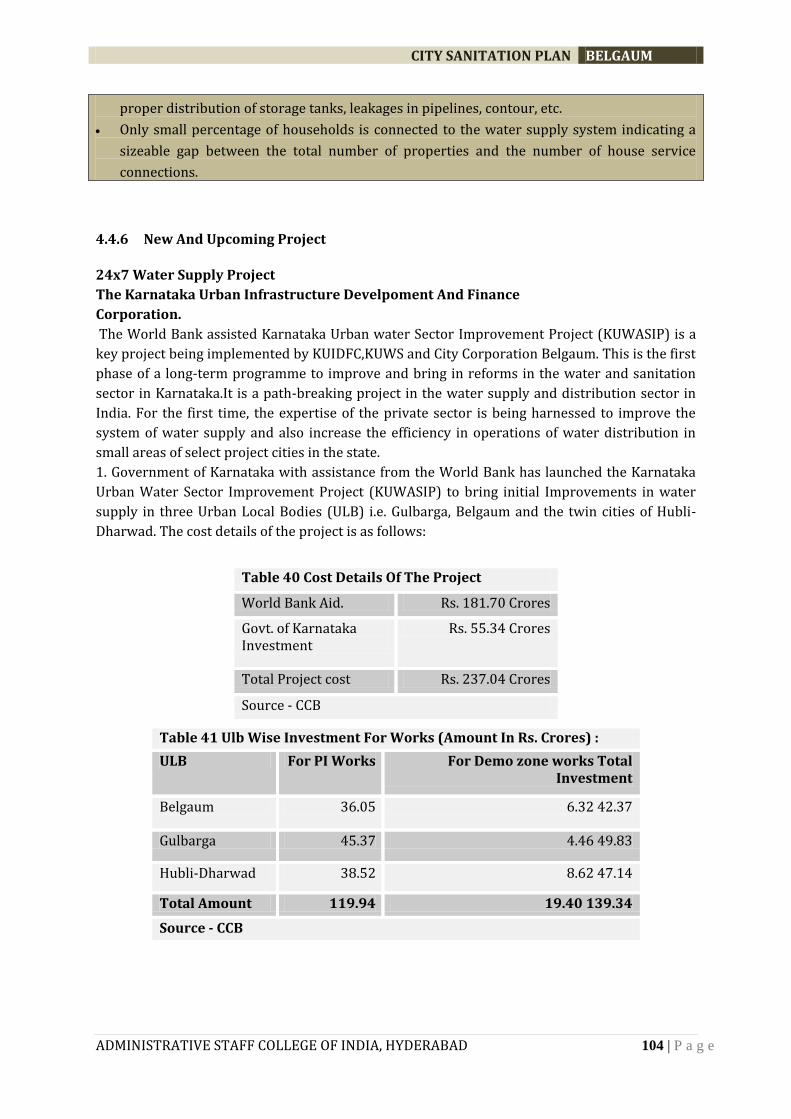
CITY SANITATION PLAN BELGAUM
ADMINISTRATIVE STAFF COLLEGE OF INDIA, HYDERABAD 104 | P a g e
proper distribution of storage tanks, leakages in pipelines, contour, etc.
Only small percentage of households is connected to the water supply system indicating a
sizeable gap between the total number of properties and the number of house service
connections.
4.4.6 New And Upcoming Project
24x7 Water Supply Project
The Karnataka Urban Infrastructure Develpoment And Finance
Corporation.
The World Bank assisted Karnataka Urban water Sector Improvement Project (KUWASIP) is a
key project being implemented by KUIDFC,KUWS and City Corporation Belgaum. This is the first
phase of a long-term programme to improve and bring in reforms in the water and sanitation
sector in Karnataka.It is a path-breaking project in the water supply and distribution sector in
India. For the first time, the expertise of the private sector is being harnessed to improve the
system of water supply and also increase the efficiency in operations of water distribution in
small areas of select project cities in the state.
1. Government of Karnataka with assistance from the World Bank has launched the Karnataka
Urban Water Sector Improvement Project (KUWASIP) to bring initial Improvements in water
supply in three Urban Local Bodies (ULB) i.e. Gulbarga, Belgaum and the twin cities of Hubli-
Dharwad. The cost details of the project is as follows:
Table 40 Cost Details Of The Project
World Bank Aid. Rs. 181.70 Crores
Govt. of Karnataka Investment
Rs. 55.34 Crores
Total Project cost Rs. 237.04 Crores
Source - CCB
Table 41 Ulb Wise Investment For Works (Amount In Rs. Crores) :
ULB For PI Works For Demo zone works Total Investment
Belgaum 36.05 6.32 42.37
Gulbarga 45.37 4.46 49.83
Hubli-Dharwad 38.52 8.62 47.14
Total Amount 119.94 19.40 139.34
Source - CCB
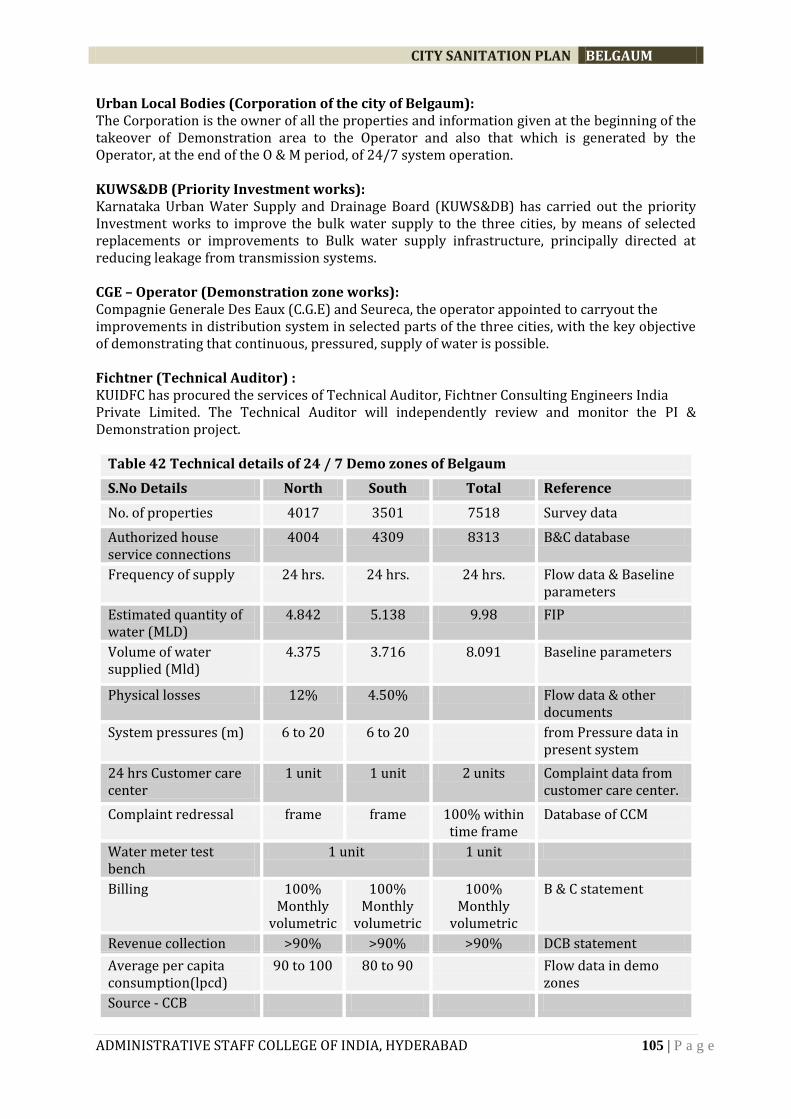
CITY SANITATION PLAN BELGAUM
ADMINISTRATIVE STAFF COLLEGE OF INDIA, HYDERABAD 105 | P a g e
Urban Local Bodies (Corporation of the city of Belgaum): The Corporation is the owner of all the properties and information given at the beginning of the takeover of Demonstration area to the Operator and also that which is generated by the Operator, at the end of the O & M period, of 24/7 system operation. KUWS&DB (Priority Investment works): Karnataka Urban Water Supply and Drainage Board (KUWS&DB) has carried out the priority Investment works to improve the bulk water supply to the three cities, by means of selected replacements or improvements to Bulk water supply infrastructure, principally directed at reducing leakage from transmission systems. CGE – Operator (Demonstration zone works): Compagnie Generale Des Eaux (C.G.E) and Seureca, the operator appointed to carryout the improvements in distribution system in selected parts of the three cities, with the key objective of demonstrating that continuous, pressured, supply of water is possible. Fichtner (Technical Auditor) : KUIDFC has procured the services of Technical Auditor, Fichtner Consulting Engineers India Private Limited. The Technical Auditor will independently review and monitor the PI & Demonstration project.
Table 42 Technical details of 24 / 7 Demo zones of Belgaum
S.No Details North South Total Reference
No. of properties 4017 3501 7518 Survey data
Authorized house service connections
4004 4309 8313 B&C database
Frequency of supply 24 hrs. 24 hrs. 24 hrs. Flow data & Baseline parameters
Estimated quantity of water (MLD)
4.842 5.138 9.98 FIP
Volume of water supplied (Mld)
4.375 3.716 8.091 Baseline parameters
Physical losses 12% 4.50% Flow data & other documents
System pressures (m) 6 to 20 6 to 20 from Pressure data in present system
24 hrs Customer care center
1 unit 1 unit 2 units Complaint data from customer care center.
Complaint redressal frame frame 100% within time frame
Database of CCM
Water meter test bench
1 unit 1 unit
Billing 100% Monthly
volumetric
100% Monthly
volumetric
100% Monthly
volumetric
B & C statement
Revenue collection >90% >90% >90% DCB statement
Average per capita consumption(lpcd)
90 to 100 80 to 90 Flow data in demo zones
Source - CCB

CITY SANITATION PLAN BELGAUM
ADMINISTRATIVE STAFF COLLEGE OF INDIA, HYDERABAD 106 | P a g e
Table 43 Raw water pumping details
Number of Raw water source ( Rakaskoppa & Hidkal ) 2
Total quantity of Bulk water pumped from source – Rakaskoppa 12 MGD
Total quantity of Bulk water pumped from source – Hidkal 12 MGD
Quantity of raw water directed to beneficiaries 6MGD
Quantity of raw water reaching water treatment plant 18 MGD
Source - CCB
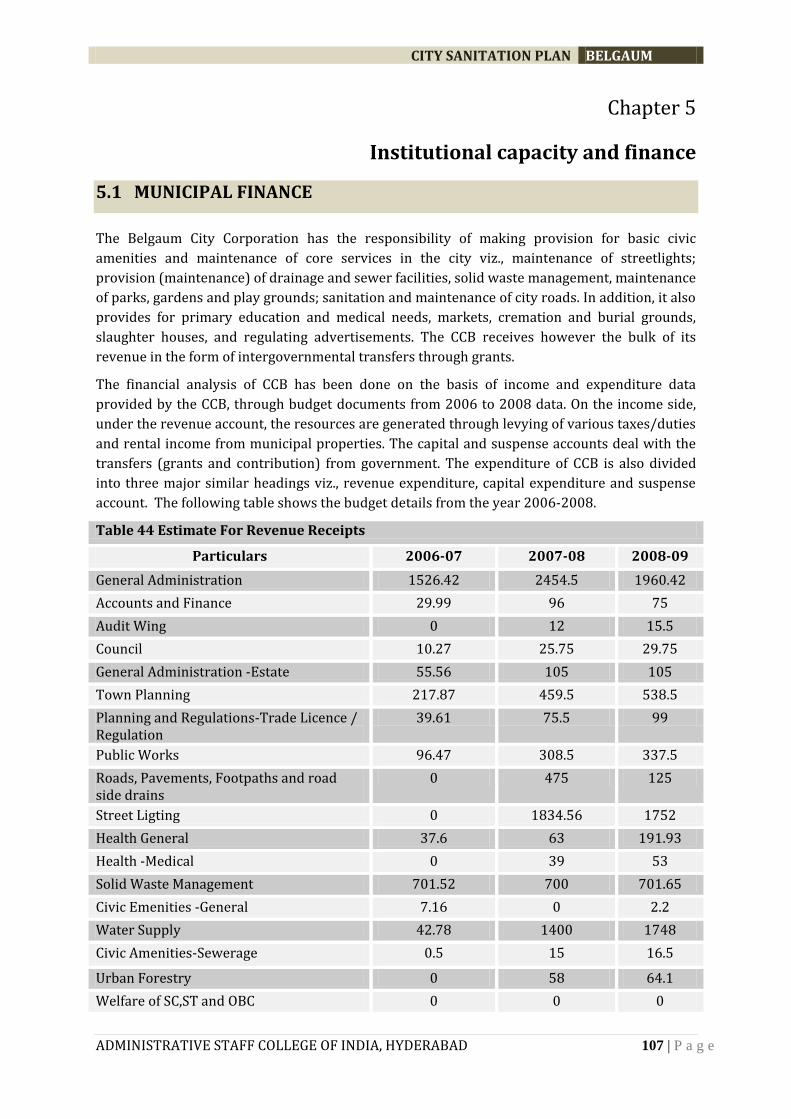
CITY SANITATION PLAN BELGAUM
ADMINISTRATIVE STAFF COLLEGE OF INDIA, HYDERABAD 107 | P a g e
Chapter 5
Institutional capacity and finance
5.1 MUNICIPAL FINANCE
The Belgaum City Corporation has the responsibility of making provision for basic civic
amenities and maintenance of core services in the city viz., maintenance of streetlights;
provision (maintenance) of drainage and sewer facilities, solid waste management, maintenance
of parks, gardens and play grounds; sanitation and maintenance of city roads. In addition, it also
provides for primary education and medical needs, markets, cremation and burial grounds,
slaughter houses, and regulating advertisements. The CCB receives however the bulk of its
revenue in the form of intergovernmental transfers through grants.
The financial analysis of CCB has been done on the basis of income and expenditure data
provided by the CCB, through budget documents from 2006 to 2008 data. On the income side,
under the revenue account, the resources are generated through levying of various taxes/duties
and rental income from municipal properties. The capital and suspense accounts deal with the
transfers (grants and contribution) from government. The expenditure of CCB is also divided
into three major similar headings viz., revenue expenditure, capital expenditure and suspense
account. The following table shows the budget details from the year 2006-2008.
Table 44 Estimate For Revenue Receipts
Particulars 2006-07 2007-08 2008-09
General Administration 1526.42 2454.5 1960.42
Accounts and Finance 29.99 96 75
Audit Wing 0 12 15.5
Council 10.27 25.75 29.75
General Administration -Estate 55.56 105 105
Town Planning 217.87 459.5 538.5
Planning and Regulations-Trade Licence / Regulation
39.61 75.5 99
Public Works 96.47 308.5 337.5
Roads, Pavements, Footpaths and road side drains
0 475 125
Street Ligting 0 1834.56 1752
Health General 37.6 63 191.93
Health -Medical 0 39 53
Solid Waste Management 701.52 700 701.65
Civic Emenities -General 7.16 0 2.2
Water Supply 42.78 1400 1748
Civic Amenities-Sewerage 0.5 15 16.5
Urban Forestry 0 58 64.1
Welfare of SC,ST and OBC 0 0 0

CITY SANITATION PLAN BELGAUM
ADMINISTRATIVE STAFF COLLEGE OF INDIA, HYDERABAD 108 | P a g e
Slum improvement 1.91 2 2
Revenue-General 734.82 993.5 1147.08
Estimate of Revenue Receipts 3502.48 9116.81 8964.13
Source - CCB
The following table shows the estimate for Revenue Payments.
Table 45 Estimate For Revenue Payments
Particulars 2006-07 2007-08 2008-09
General Administration 657.82 765.3 863.9
Legal Cell. 3.36 11.05 6.85
I T Cell 3.4 35.95 39.05
Accounts and Finance 16.39 30.25 39.95
Audit Wing 7.03 13.65 20.65
Town Planning. 11.18 20.9 32.7
Public Works General. 141.92 398.2 351.7
Roads, Pavements, Footpaths & road side drains 388 1440 745
Street Lighting. 136.17 1902.96 1953.3
Health -General. 60.24 175 238.5
Health -Medical. 62.82 61.1 85.5
Burial and Cremation 14.36 65.5 16.25
Solid Waste Management 957.56 1164.1 1306.35
Civic Amenities 0 2 2
Water Supply. 116.45 1420 1405
Sewerage. 53.54 150 101
Urban Forestry. 69.77 111.75 139.7
Urban Poverty Alleviation. 90.66 95 102.8
Slum improvement 0 0 0.25
Education. 0 8.25 15.5
Revenue. 83.72 524.5 560.25
Estimate of Revenue Payments 2894.26 8433.66 8115.55
Source - CCB
The following table shows the estimate for Capital receipts & payments.
Table 46 Estimates for Capital Receipts & Payments
Particulars 2006-07 2007-08 2008-09
General Administration 454.6 1200 1000
Public WorksRoads,pavements &footpaths 0 0 100
Public Works-footovers,bridges and subways 0 0 0
Public Works-Street Lighting 0 75 10

CITY SANITATION PLAN BELGAUM
ADMINISTRATIVE STAFF COLLEGE OF INDIA, HYDERABAD 109 | P a g e
Public Works-Storm water drains, Open drains, Culverts and causeways
0 0 0
Public Health 0 0 0
Solid Waste Management 0 0 0
Civic amenities -Sewerage 0 10 10
Urban Forestry Parks,Garden
Welfare of SC,ST and OBCs 0 0 0
Education 0 0 0
Total Estimate of Capital Receipts 454.6 1285 1120
ESTIMATES FOR CAPITAL PAYMENTS
General Administration 228.18 655 460
I T Cell 7.11 7 35
Roads, Pavements,Footpaths and road side drains 192.47 1075 320
Public Works -Bridges,Flyover 0.48 0 0
Street Lighting 82.05 171 251
Health Medical 0 0 0
Solid waste management 2.28 30 85
Civic Amenities 2.58 0 2
Water Supply 37.17 5 5
Sewerage 66.25 88 105
Urban forestry 3.04 85 135
Welfare activities of SC,ST and OBC 0 82 68.53
Total Estimate of Capital Payments 621.61 2198 1466.53
Source - CCB
Figure 15 Estimate for Revenue Receipts & Revenue Payments
0
1000
2000
3000
4000
5000
6000
7000
8000
9000
10000
2006-07 200708 2008-09
Estimate of Revenue Receipts & Revenue Payments
Estimate of RevenueReceipts
Estimate of RevenuePayments

CITY SANITATION PLAN BELGAUM
ADMINISTRATIVE STAFF COLLEGE OF INDIA, HYDERABAD 110 | P a g e
Figure 16 Estimate of Capital Receipts & Payments
The following graph shows that the Revenue & Capital have decreased in 2008-09.
0
500
1000
1500
2000
2500
2006-07 200708 2008-09
Estimate of Capital Receipts & Payments
Estimate of CapitalReceipts
Estimate of CapitalPayments

CITY SANITATION PLAN BELGAUM
Chapter 6
Sanitation Situation and Ranking
6.1 NATIONAL SANITATION RANKING PARAMETERS
The Ministry of Urban Development (MoUD) has identified a set of output, process and outcome
indicators to assess the existing sanitation conditions in the town. The list of indicators pertain
to the practice of open defecation, access to sanitation (individual, community and public),
collection, treatment and disposal of solid and liquid wastes, proper upkeep and maintenance of
the sanitation infrastructure, clear institutional roles and responsibilities and improvements in
health and environment (cf. Annex 1). A total of 19 indicators have been detailed, of which nine
are output-related ( six are direct indicators identified under service level bench marking by
GoUD, GOI) , seven are process-related and three are outcome-related. Sanitation parameters
such as access to community toilets, safe management of human excreta and solid waste
collection and treatment.
Output Indicators: 50/100 ( 9 main output indicators and out of which 6 are SLB indicators)
Behavioural aspects and provision to safe collection, treatment and disposal without harming
city’s environment.
Process Related: 30/100 ( 7 main process-indicators )
Indicators pertain to systems and procedures - exist and practiced by city agencies to ensure
sustained sanitation.
Outcome Related: 20/100 (3 main outcome-indicators)
Indicators include: quality of drinking water & water in water-bodies, reduction in sanitation-
related and water-borne diseases over a time period.
Diseases by faeco-orally transmitted enteric pathogens - 10% of total burden of disease in India.
Intestinal group of diseases claim about 5 million lives and about 50 million people suffer every
year.
Findings of a survey commissioned by the Ministry of Urban Development (MoUD) that rate
Indian cities on safe sanitation practices of 423 Class-I cities (with a population of more than
100,000 ). Four color codes have been assigned to the cities based on the points they obtained
in the rating; red means the cities need 'immediate remedial action', black means 'need
considerable improvement', blue means ‘recovering,’ green means ‘healthy and clean.’
community-driven Nirmal Shahars, or totally sanitized, healthy, and livable cities and towns.
As per national Rankings, Belgaum has been ranked at 91 out of 423 Class I cities, scoring 40.51
marks out of 100 and in Black category. This means performance of Belgaum in regard to safe
sanitation has a good scope for improvement on various indicators. A complete profiling of
Belgaum against 19 parameters has been done indicating present status and identifying few
targets which can be achieved immediately, in a short term and in long term. The goal of
Belgaum is to strive for 100 percent access to sanitation facilities in next two years and 100
percent safe disposal of all town generated waste in long term.

CITY SANITATION PLAN BELGAUM
ADMINISTRATIVE STAFF COLLEGE OF INDIA, HYDERABAD 112 | P a g e
Table 47: Sanitation Ranking for Belgaum City Corporation
Sl. No. Indicators Total
Marks Marks
awarded Remarks
1. OUTPUT RELATED INDICATORS
1.a. No Open Defecation
1.a.i.
Access and use of toilets by urban poor and other u-served households by individual and community sanitation facilities
4 0
Field assessment also validated on OD status and agrees with Ranking markings. Short Term Goal - two year (Ref management options on Access.) 1 st year – eliminate OD
1.a.ii. Access and use of toilets by floating and institutional population
4 2 Medium - long Term 60% of public toilets are not properly maintained.
1.a.iii. No open defecation visible
4 0.83 Short to long term MIS, punitive measures and incentives through IEC.
1.a.iv. Manual Scavenging eliminated in the city
4 4
Overestimated - No protection to sanitary workers. Sustaining efforts throughout CSP process and even after that
1.b.
Proportion of total human excreta generation that is safely collected
6 4 Short to Medium – UGD is under construction. Proposal for DEWATS systems in parts of the city.
1.c.
Proportion of total black waste water generation that is treated safely and disposed off
6 0 Damages in UGD system – black water mixes with storm water and drains off into the river.
1.d.
Proportion of total grey wastewater generation that treated and safely disposed of
3 0
Medium – to long term Nil now 30-40% - 2012 40-100% 2010 onwards Next year – 1 mark
1.e. Proportion of treated wastewater that is re-cycled and re-used
3 0
Medium – to long term Nil now. 1- 10% 2012 10- 20% 2012 -2014 20% and more 2014 onwards.
1.f.
Proportion of total storm-water and drainage that is efficiently and safely managed
3 2
Short – to long 40 – 60% : 2012 60- 80 2012 : 2014 100% 2014 onwards
1.g. Proportion of total solid waste generation that is regularly collected
4 1
Short to medium 25%-60% D2D collection improvement by 2012 60 – 100% 2012 onwards Sustenance of system – 2012 onwards
1.h. Proportion of total solid 4 2 Long Term
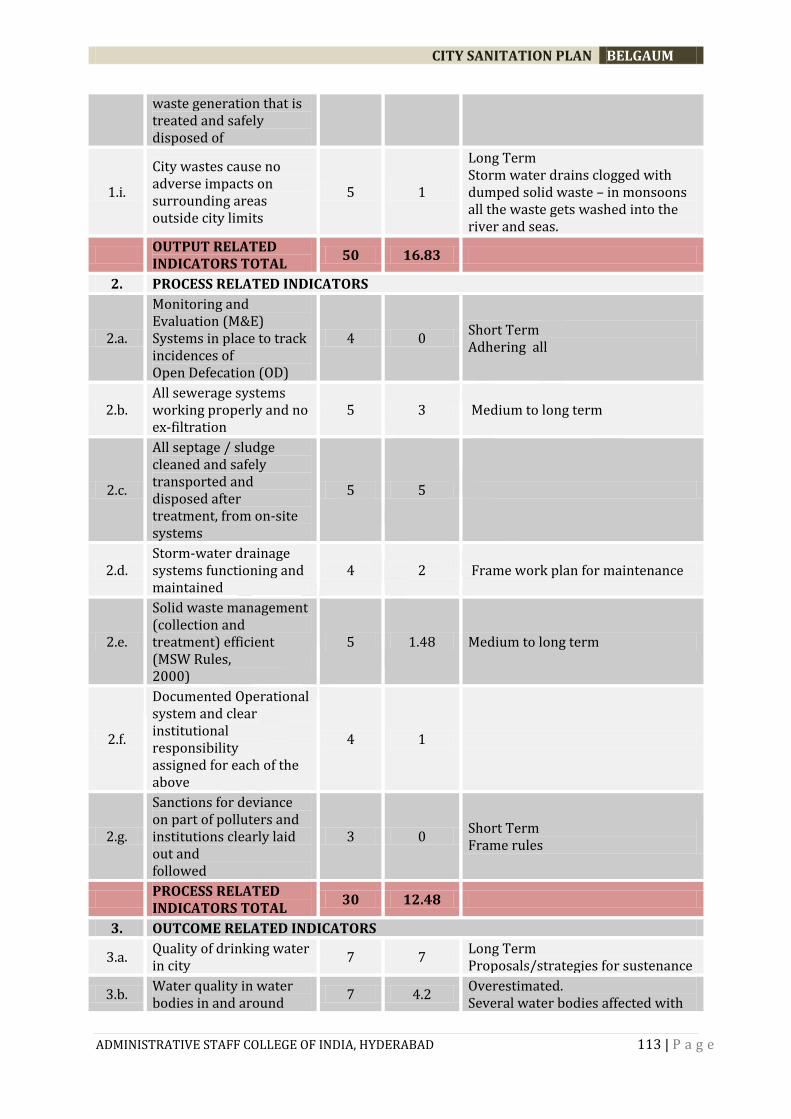
CITY SANITATION PLAN BELGAUM
ADMINISTRATIVE STAFF COLLEGE OF INDIA, HYDERABAD 113 | P a g e
waste generation that is treated and safely disposed of
1.i.
City wastes cause no adverse impacts on surrounding areas outside city limits
5 1
Long Term Storm water drains clogged with dumped solid waste – in monsoons all the waste gets washed into the river and seas.
OUTPUT RELATED INDICATORS TOTAL
50 16.83
2. PROCESS RELATED INDICATORS
2.a.
Monitoring and Evaluation (M&E) Systems in place to track incidences of Open Defecation (OD)
4 0 Short Term Adhering all
2.b. All sewerage systems working properly and no ex-filtration
5 3 Medium to long term
2.c.
All septage / sludge cleaned and safely transported and disposed after treatment, from on-site systems
5 5
2.d. Storm-water drainage systems functioning and maintained
4 2 Frame work plan for maintenance
2.e.
Solid waste management (collection and treatment) efficient (MSW Rules, 2000)
5 1.48 Medium to long term
2.f.
Documented Operational system and clear institutional responsibility assigned for each of the above
4 1
2.g.
Sanctions for deviance on part of polluters and institutions clearly laid out and followed
3 0 Short Term Frame rules
PROCESS RELATED INDICATORS TOTAL
30 12.48
3. OUTCOME RELATED INDICATORS
3.a. Quality of drinking water in city
7 7 Long Term Proposals/strategies for sustenance
3.b. Water quality in water bodies in and around
7 4.2 Overestimated. Several water bodies affected with
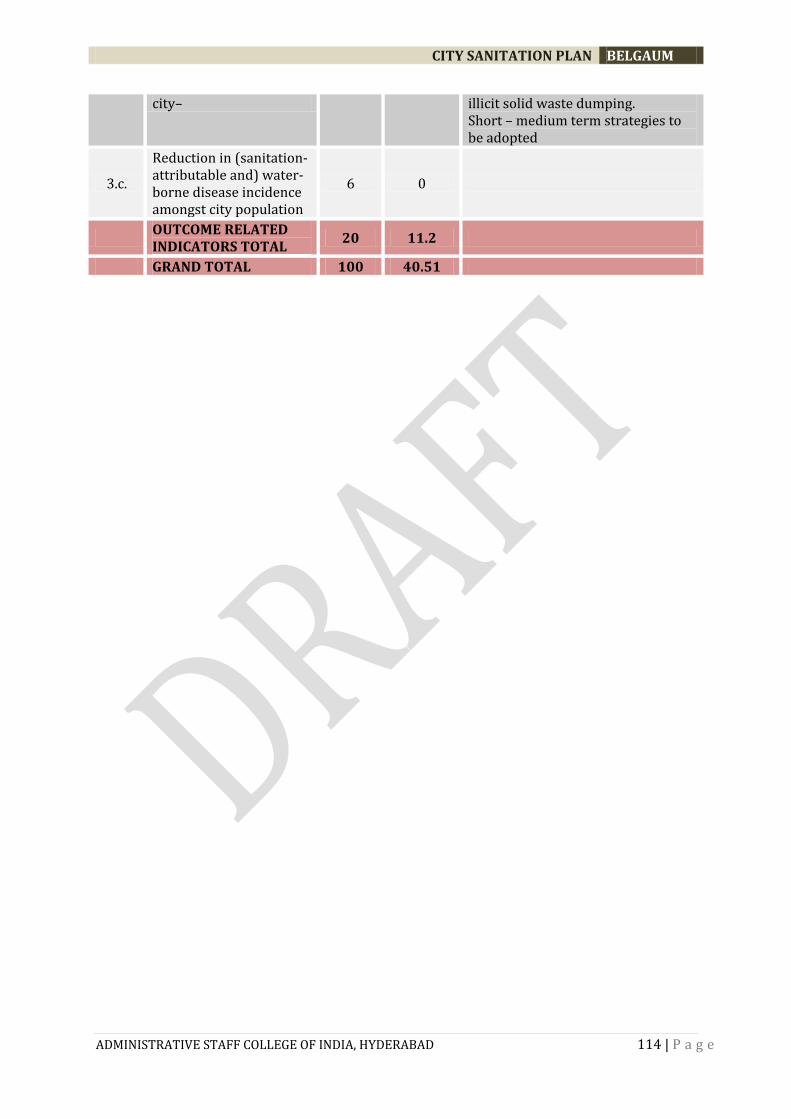
CITY SANITATION PLAN BELGAUM
ADMINISTRATIVE STAFF COLLEGE OF INDIA, HYDERABAD 114 | P a g e
city– illicit solid waste dumping. Short – medium term strategies to be adopted
3.c.
Reduction in (sanitation-attributable and) water-borne disease incidence amongst city population
6 0
OUTCOME RELATED INDICATORS TOTAL
20 11.2
GRAND TOTAL 100 40.51
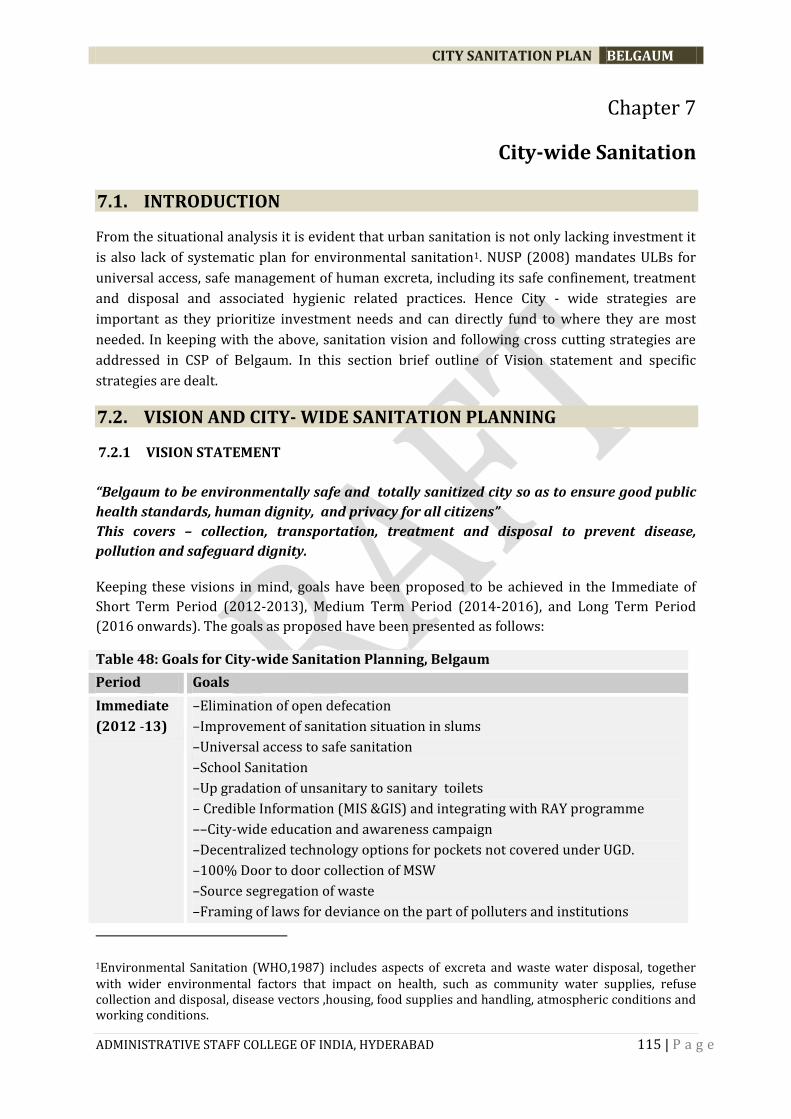
CITY SANITATION PLAN BELGAUM
ADMINISTRATIVE STAFF COLLEGE OF INDIA, HYDERABAD 115 | P a g e
Chapter 7
City-wide Sanitation
7.1. INTRODUCTION
From the situational analysis it is evident that urban sanitation is not only lacking investment it
is also lack of systematic plan for environmental sanitation1. NUSP (2008) mandates ULBs for
universal access, safe management of human excreta, including its safe confinement, treatment
and disposal and associated hygienic related practices. Hence City - wide strategies are
important as they prioritize investment needs and can directly fund to where they are most
needed. In keeping with the above, sanitation vision and following cross cutting strategies are
addressed in CSP of Belgaum. In this section brief outline of Vision statement and specific
strategies are dealt.
7.2. VISION AND CITY- WIDE SANITATION PLANNING
7.2.1 VISION STATEMENT
“Belgaum to be environmentally safe and totally sanitized city so as to ensure good public
health standards, human dignity, and privacy for all citizens”
This covers – collection, transportation, treatment and disposal to prevent disease,
pollution and safeguard dignity.
Keeping these visions in mind, goals have been proposed to be achieved in the Immediate of
Short Term Period (2012-2013), Medium Term Period (2014-2016), and Long Term Period
(2016 onwards). The goals as proposed have been presented as follows:
Table 48: Goals for City-wide Sanitation Planning, Belgaum
Period Goals
Immediate
(2012 -13)
–Elimination of open defecation
–Improvement of sanitation situation in slums
–Universal access to safe sanitation
–School Sanitation
–Up gradation of unsanitary to sanitary toilets
– Credible Information (MIS &GIS) and integrating with RAY programme
––City-wide education and awareness campaign
–Decentralized technology options for pockets not covered under UGD.
–100% Door to door collection of MSW
–Source segregation of waste
–Framing of laws for deviance on the part of polluters and institutions
1Environmental Sanitation (WHO,1987) includes aspects of excreta and waste water disposal, together with wider environmental factors that impact on health, such as community water supplies, refuse collection and disposal, disease vectors ,housing, food supplies and handling, atmospheric conditions and working conditions.

CITY SANITATION PLAN BELGAUM
ADMINISTRATIVE STAFF COLLEGE OF INDIA, HYDERABAD 116 | P a g e
–System for maintenance of water bodies
–Reduction in no. of cases of water borne diseases, especially malaria
Medium
term
(2014-
2016)
– Sanitary and safe disposal of human excreta and liquid waste (continuing
process)
– Regulation of septic tanks and septage management
– Litter free areas
– Sustenance of SWM system
–Systems in place for good O & M (individual, community level toilets and
disposal systems) through behavior change and good management practices.
– Institutional arrangements and capacity building
–Safe transportation and disposal of MSW
Long term
(2016
onwards )
– Water recycle and reuse
–Controlling adverse effects of city wastes on surrounding areas
– Monitoring and evaluation
– Environmental and financial sustainability.
7.2.2 PRINCIPLES OF CSP
CSP not only emphasis on the physical infrastructure but also focus on behaviour change
outcomes, proper usage, institutional reorientation, regular upkeep and maintenance,
increased accountability and service delivery by ULBs and their partners. Accordingly the
strategies have been developed on the basis of following principles:
1. Right to sanitation and mobilization of community for demand creation: Access to
sanitation facilities shall be universalized (100%) without any barrier of cost/ fee, land
tenure etc. , but also bearing the associated responsibility as well. Household sanitation is
first and foremost the responsibility of a household. Hence, sanitation will be promoted
based on demand i.e. communities and households will be encouraged to priorities by
contributing to a significant portion of the costs involved in providing and running a
sanitation system. Improve sanitation by institutionalizing rewards for good performance
and sanctions against harmful actions and IEC programs to improve sanitation. ULB /
Utility may provide free consultations, designs and drawings and quality control for onsite
sanitation.
2. Focus on sound finances and maintenance: Sanitation system should be sustainable. The
users should pay against use to maintain sustainability. Similarly, polluters should pay for
the cost of cleaning up the impact of their pollution on the environment. Choice and
maintenance of facilities have to be well thought of in advance to make service affordable
and sustainable. Need to ensure last mile connectivity to water supply system and sewerage
system in network coverage area. Door to collection should be 100%.
3. Integrated institutional engagement: Sanitation cannot be maintained without proper
water supply, solid waste management and development is not possible in isolation.
Coordination is necessary between different departments, all tiers of Government and other
stakeholders with clear roles and responsibilities. Need to ensure last mile connectivity to
water supply system and sewerage system in network coverage area. Door to collection
should be 100%.
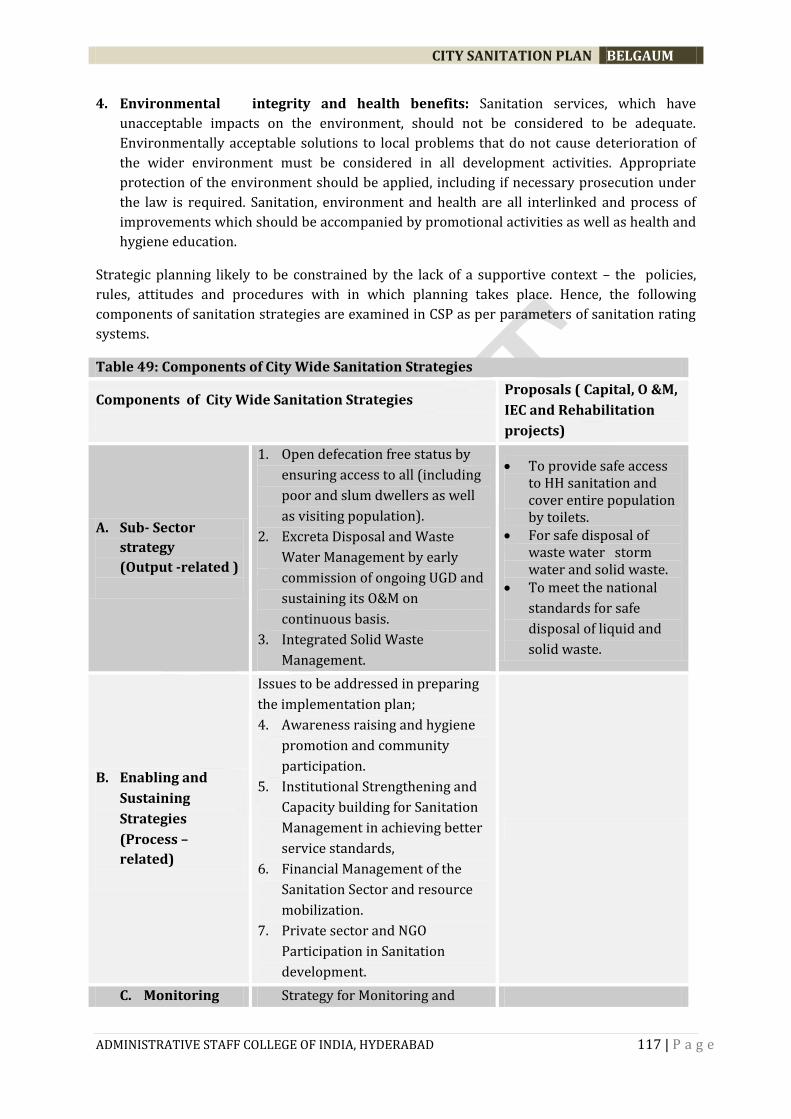
CITY SANITATION PLAN BELGAUM
ADMINISTRATIVE STAFF COLLEGE OF INDIA, HYDERABAD 117 | P a g e
4. Environmental integrity and health benefits: Sanitation services, which have
unacceptable impacts on the environment, should not be considered to be adequate.
Environmentally acceptable solutions to local problems that do not cause deterioration of
the wider environment must be considered in all development activities. Appropriate
protection of the environment should be applied, including if necessary prosecution under
the law is required. Sanitation, environment and health are all interlinked and process of
improvements which should be accompanied by promotional activities as well as health and
hygiene education.
Strategic planning likely to be constrained by the lack of a supportive context – the policies,
rules, attitudes and procedures with in which planning takes place. Hence, the following
components of sanitation strategies are examined in CSP as per parameters of sanitation rating
systems.
Table 49: Components of City Wide Sanitation Strategies
Components of City Wide Sanitation Strategies
Proposals ( Capital, O &M,
IEC and Rehabilitation
projects)
A. Sub- Sector
strategy
(Output -related )
1. Open defecation free status by
ensuring access to all (including
poor and slum dwellers as well
as visiting population).
2. Excreta Disposal and Waste
Water Management by early
commission of ongoing UGD and
sustaining its O&M on
continuous basis.
3. Integrated Solid Waste
Management.
To provide safe access to HH sanitation and cover entire population by toilets.
For safe disposal of waste water storm water and solid waste.
To meet the national
standards for safe
disposal of liquid and
solid waste.
B. Enabling and
Sustaining
Strategies
(Process –
related)
Issues to be addressed in preparing
the implementation plan;
4. Awareness raising and hygiene
promotion and community
participation.
5. Institutional Strengthening and
Capacity building for Sanitation
Management in achieving better
service standards,
6. Financial Management of the
Sanitation Sector and resource
mobilization.
7. Private sector and NGO
Participation in Sanitation
development.
C. Monitoring Strategy for Monitoring and

CITY SANITATION PLAN BELGAUM
ADMINISTRATIVE STAFF COLLEGE OF INDIA, HYDERABAD 118 | P a g e
and
Evaluation
evaluation
Implementation plan to propose
monitoring systems.
7.2.3 ASSUMPTIONS, NORMS AND UNITS COSTS
Formulation of CSP is based on few assumptions and certain available norms as detailed below;
INFORMATION BOX 10: ASSUMPTIONS FOR CITY SANITATION PLAN
• Generally all Households will be connected to UGD by the year 2030.
• Zero OD status to be achieved by 2012
• No. of HHs using community toilets would reduce over time as they would be provided
with individual household type toilets
• Floating population: 7,000 in 2011 and it is expected to grow to 45000 in 2036 (From
discussions with Officials).
In order to maintain desired sanitation levels and achieve improved health and environmental
indicators certain standard of service have to be maintained. The basis for the maintenance of
service levels is Standardized Service Level Benchmarks. They are assessed in Belgaum as per
MoUD framework and certain other norms and standards followed as indicated in the table
below for estimation of deficiency in sanitation. This would enable to estimate infrastructure
gaps and investment requirements for future.
Table 50: Norms for Household Sanitation
Unit
A Household sanitation infrastructure
1 Latrine connected to septic tank 1 per household
2 Grit and grease trap 1 per household
B Public and Community Sanitary Conveniences
Public Toilet
1 Users per Latrine Seat 60 users/ seat
Community Toilet
2 Users per Latrine Seat One seat toilet can cater for 20 HHs
C Septage Clearance, Treatment and Disposal
1 No of septic tanks cleared per vehicle per day 3 tanks per day per vehicle
2 Frequency of septage clearance from septic tank Once in 2 years
3 Septage volume removed per tank 2 cum
4 No of operational days per annum 300 days
Sludge Drying Beds
5 Area per drying bed(average) 225 m
6 Dimensions of drying bed 15m x 15 m
8 Thickness of liquid sludge layer in drying bed 0.20 m
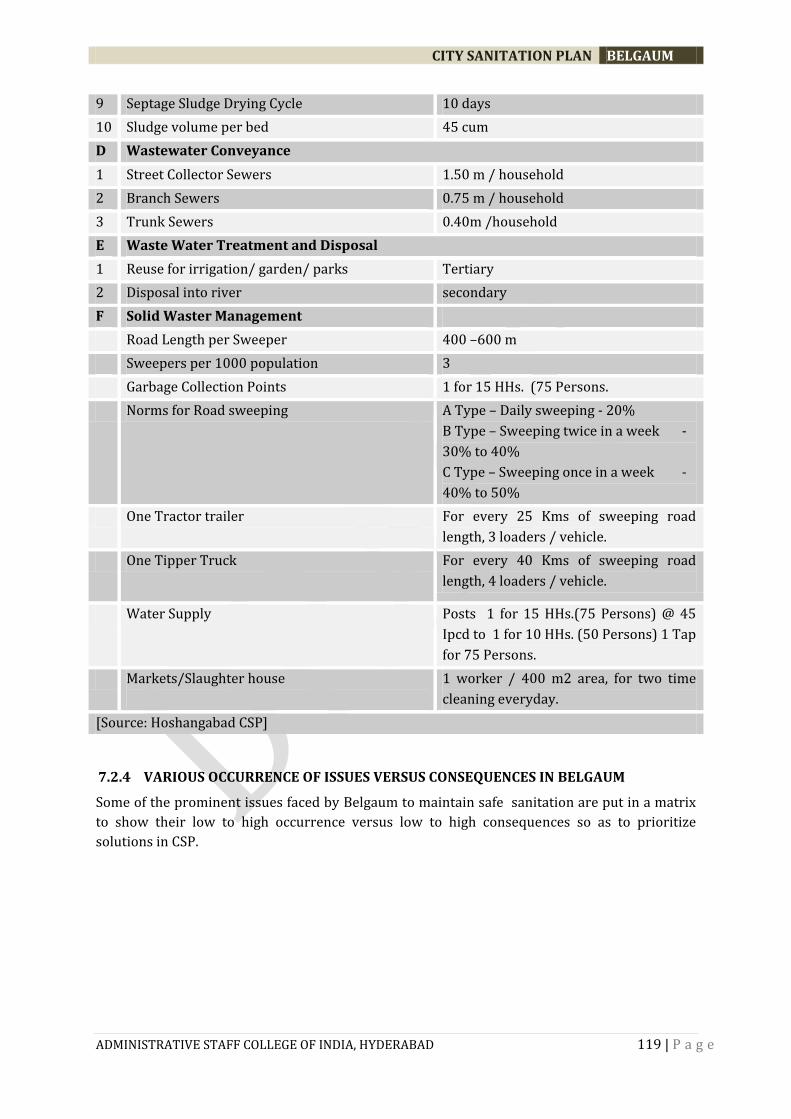
CITY SANITATION PLAN BELGAUM
ADMINISTRATIVE STAFF COLLEGE OF INDIA, HYDERABAD 119 | P a g e
9 Septage Sludge Drying Cycle 10 days
10 Sludge volume per bed 45 cum
D Wastewater Conveyance
1 Street Collector Sewers 1.50 m / household
2 Branch Sewers 0.75 m / household
3 Trunk Sewers 0.40m /household
E Waste Water Treatment and Disposal
1 Reuse for irrigation/ garden/ parks Tertiary
2 Disposal into river secondary
F Solid Waster Management
Road Length per Sweeper 400 –600 m
Sweepers per 1000 population 3
Garbage Collection Points 1 for 15 HHs. (75 Persons.
Norms for Road sweeping A Type – Daily sweeping - 20%
B Type – Sweeping twice in a week -
30% to 40%
C Type – Sweeping once in a week -
40% to 50%
One Tractor trailer For every 25 Kms of sweeping road
length, 3 loaders / vehicle.
One Tipper Truck For every 40 Kms of sweeping road
length, 4 loaders / vehicle.
Water Supply Posts 1 for 15 HHs.(75 Persons) @ 45
Ipcd to 1 for 10 HHs. (50 Persons) 1 Tap
for 75 Persons.
Markets/Slaughter house
1 worker / 400 m2 area, for two time
cleaning everyday.
[Source: Hoshangabad CSP]
7.2.4 VARIOUS OCCURRENCE OF ISSUES VERSUS CONSEQUENCES IN BELGAUM
Some of the prominent issues faced by Belgaum to maintain safe sanitation are put in a matrix
to show their low to high occurrence versus low to high consequences so as to prioritize
solutions in CSP.
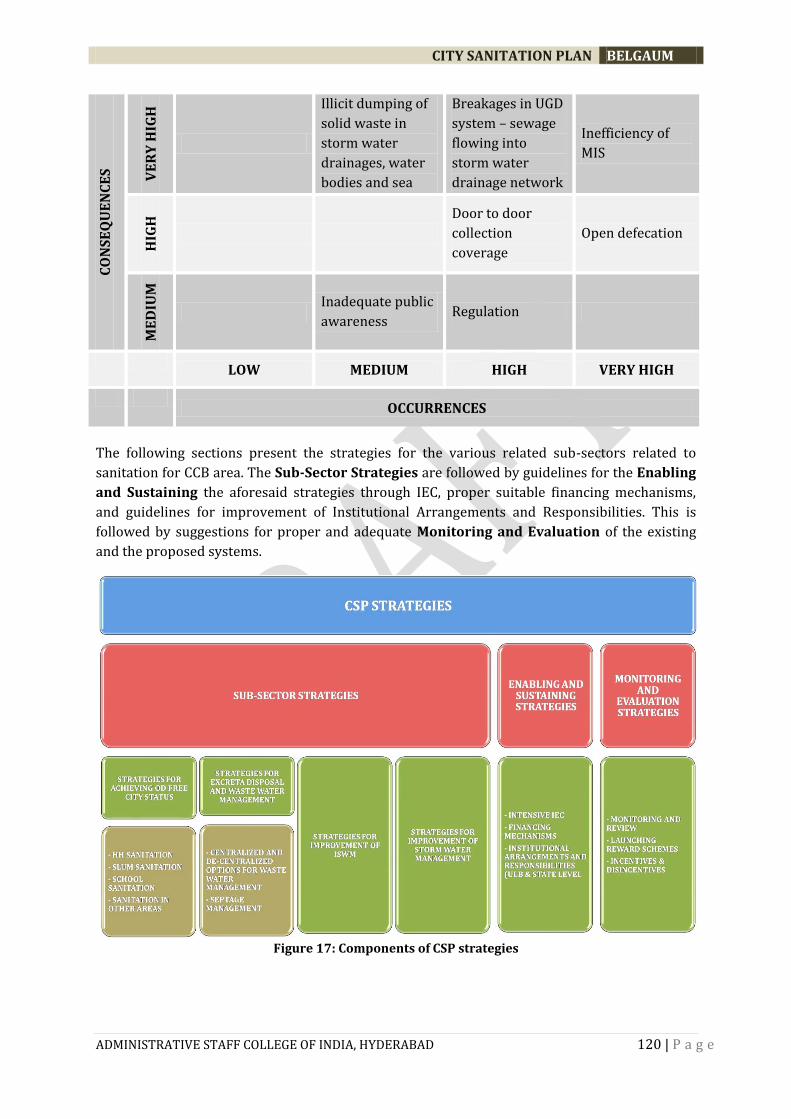
CITY SANITATION PLAN BELGAUM
ADMINISTRATIVE STAFF COLLEGE OF INDIA, HYDERABAD 120 | P a g e
CO
NS
EQ
UE
NC
ES
VE
RY
HIG
H
Illicit dumping of
solid waste in
storm water
drainages, water
bodies and sea
Breakages in UGD
system – sewage
flowing into
storm water
drainage network
Inefficiency of
MIS H
IGH
Door to door
collection
coverage
Open defecation
ME
DIU
M
Inadequate public
awareness Regulation
LOW MEDIUM HIGH VERY HIGH
OCCURRENCES
The following sections present the strategies for the various related sub-sectors related to
sanitation for CCB area. The Sub-Sector Strategies are followed by guidelines for the Enabling
and Sustaining the aforesaid strategies through IEC, proper suitable financing mechanisms,
and guidelines for improvement of Institutional Arrangements and Responsibilities. This is
followed by suggestions for proper and adequate Monitoring and Evaluation of the existing
and the proposed systems.
Figure 17: Components of CSP strategies

CITY SANITATION PLAN BELGAUM
ADMINISTRATIVE STAFF COLLEGE OF INDIA, HYDERABAD 121 | P a g e
7.3. SUBSECTOR STRATEGIES
This CSP aims guiding through next steps in achieving the goal of city wide sanitation for
Belgaum. Broad strategies identified will try to lay down road map for achieving total sanitation
and hence detailed out. Also in this section along with strategies, infrastructure gaps estimated
as per practiced norms mentioned in previous section. Also both management and technical
options and financial requirement to bridge the gap have been assessed.
7.3.1 OPEN DEFECATION FREE STATUS BY ENSURING ACCESS TO ALL (INCLUDING POOR
AND SLUM DWELLERS AS WELL AS VISITING POPULATION).
Open defecation, though in very minor percentages, is prevalent in Belgaum. This mainly
pertains to the behaviour of children and few old people and the migrant labour class
population in the city. This has to be addressed in immediate term with concerted efforts to
make OD free as it is easily doable.
To achieve OD free status socially inclusiveness approaches that can be promoted are:
Promoting access to households with safe sanitation facilities (including proper disposal
arrangements);
Demand driven approach for access and promoting community-planned and managed
toilets wherever necessary, for groups of households who have issues of space, tenure
or economic constraints in gaining access to individual facilities;
• Triggering social action by intensive IEC to prevent OD
• Promotion of no cost/ low costs technologies of right kind for super structure.
• Adequate availability and 100% upkeep and management of Public Sanitation facilities
in all busy areas and floating population affected areas
• Promoting partnerships to construct community and public toilets - Public Conveyance
blocks
• Increased access of the poor to water for hygiene
• Norms for sanitation provisions in buildings (including non-residential) and spaces
where public congregate, through bye-laws
• Municipal fund creation for neighbourhood project

CITY SANITATION PLAN BELGAUM
ADMINISTRATIVE STAFF COLLEGE OF INDIA, HYDERABAD 122 | P a g e
A. HOUSEHOLD SANITATION ARRANGEMENTS
As of now, UGD system is available in almost 50% area. . This can be extended further. Still about 50% HHs will be served with onsite arrangements
(Septic tanks and DEWATS ).
Important milestones for Belgaum:
1. No more open defecation by Year: 2012 - 13 (achieve OD free status by intensive IEC). 2. At least 75 % households connected to UGD by 2012 -13. 3. Increase the utilisation rates of municipal sewerage services by 2016
Table 51: Indicative figures in Household Sanitation Arrangements over CSP Implementation Period
Sanitation Arrangement
Baseline Survey
Pre-CSP Year CSP Implementation Period
2010 2011 2012 2013 2014 2015 2016 Remarks
WC Connected to Conventional Sewer. 70469 72332 85077 95278 105970 117172 128909
Extend UGD and ensure last mile connectivity in served areas. In % 48 48 55 60 65 70 75
WCs connected to Septic Tanks
63128 64798 57234 55579 44018 33478 25782
Slowly reduce dependency on Septic Tanks
In % 43 43 37 35 27 20 15
Community Toilet User Households 4404 4521 4641 3176 4891 5022 5156
No. of HHs would reduce over time being provided with individual household toilets in % 3 3 3 2 3 3 3
Open defecation 7341 7535 3094 0 0 0 0 Zero OD status to be
achieved by 2013 in % 5 5 2 0 0 0 0

CITY SANITATION PLAN BELGAUM
ADMINISTRATIVE STAFF COLLEGE OF INDIA, HYDERABAD 123 | P a g e
DEWATs and other types no of HHs
1468 1507 4641 4764 8152 8369 8594
There are now few PIT type Latrines.DEWATS should be proposed in areas which is not served by UGD about 6 DEWATS units with a capacity of 150 HHs in each unit should be proposed.
In %
1 1 3 3 5 5 5
Total Households 146810 150692 154686 158797 163030 167389 171879
From 2011 as per population projections
Source - ASCI

CITY SANITATION PLAN BELGAUM
ADMINISTRATIVE STAFF COLLEGE OF INDIA, HYDERABAD 124 | P a g e
B. SLUM SANITATION IMPROVEMENT
Creating demand responsive participatory approach to provision of community blocks
wherever individual toilets are not possible will be important aspect in creating access. This can
be done by giving incentives for private contractors, NGOs, community organizers to work
together to jointly deliver community toilet blocks. Partnerships can be led either by contractor
or NGO with each other. There need be high technical standards, high quality service levels and
provisions for children.
Considering Belgaum situation, series of options need to be worked in slums as follows:
Sewerage for individual household latrines (IHHL)
Delinking tenure ship for slum residents to build toilets.
Management arrangements to be worked. Eg. CBO members operate and manage toilet
block on their own, or CBO employs the staff like caretaker to operate and manage the
toilet block or CBO contracts a caretaker (individual or family) to manage and operate
the toilet block on its behalf.
There are adequate community toilets for the poor in Belgaum city at present. The proper O&M
is very necessary for the sustenance of such toilets. Hence, the City Corporation will act as
facilitator and sign an MOA with local residents who are going to use it for O &M which is going
to be the responsibility of Community.
C. PUBLIC SANITATION FACILITIES
There are various optionsto be explored for financing communal and public toilet services.
Public toilets serving relatively large numbers of people may be sufficiently profitable to attract
private investment; in contrast, communal facilities serving small groups of households (as
generally preferred by users) will generally require at least partial government support. One
option is for capital costs to be financed by a combination of sunk subsidy and concessionary
loan: so for example, 50% of the cost is borne by sunk subsidy from the national and/or
municipal government, while the remaining 50% is covered by a concessionary loan to the
municipality. Debt service and capital replacement costs (CapManEx) may then be covered by
householder tariffs, by some other source of revenue (e.g. a national or municipal-level
surcharge on water bills), or by a combination of the two.
Estimation of public toilet facilities Table 52: Estimation of Proposed Pay and Use complex (Each unit)
S. No Component Estimated Cost in Rs
1 No. of Seats 12 Nos
2 No. of users for maximum extent -Morning &
Evening. 3 hours + 3 hours
3 One seat can accommodate 60 persons per day
4 Total capacity 12 nos X 60 persons /day
7 Revenue per month (720 persons * 1 per person =
720 x 30 days ) Rs. 21,600/-
8 Revenue by Ad per month ( one wall) 500
9 Total revenue 22100

CITY SANITATION PLAN BELGAUM
ADMINISTRATIVE STAFF COLLEGE OF INDIA, HYDERABAD 125 | P a g e
10 Cleaning articles Rs 50 x 12 toilets 600
11 Sweepers 2 nos 4000
12 Civic maintenance and other contingencies 1000
13 Caretaker 4000
14 UGD user charges 360
15 Total Expenditure 9960
16 Estimated Private Operator Income
12140
In this regard estimation is done for number of toilets and urinals needed under various
categories to make the city fully sanitized. The planning for public toilets has taken
consideration the following user groups: floating population, population during weekly markets,
population that comes into cities for special occasions like fairs, religious activities etc,
population at public place like bus stands, railway stations etc. Such facilities can be managed
through community groups, NGOs, CBOs and private operators on a self-sustaining basis.
The existing no. of seats are 306 catering to 3697 at the rate of 12 people per seat. Utilisation of
these toilets can be greatly enhanced to make optimal use of them. i.e at the rate of 25-40
persons per seat. In public and community toilets in Belgaum are more than adequate to serve
the needs of the floating population at present. But spatially, there are several wards where
there is an influx of floating population, but there are either inadequate or no public
conveniences in those areas. The following table shows the un-served wards and the floating
population influx per day.
INFORMATION BOX 11: LOCATION NEEDS FOR COMMUNITY/PUBLIC TOILETS
Land availability for communal/public toilet construction of course varies from one
location to another. Problems may arise because people living adjacent to an available plot
may not want a sanitation facility constructed next to their property.
A suitable plot of land should be Close to the area of demand: users should not have to walk
more than 200 m at very most, and will typically prefer a much shorter distance (probably
about 30 m), In a location with safe after-dark access: this is critical for women’s security,
In a location that is acceptable to people living nearby, Reachable by small truck, to allow
septic tank emptying, Within reach of a sustainable water supply.
Determination of ideal locations for proposed public toilets
There are about 78 seats available in public toilets catering to 4635 that is at the rate of 59
people per seat which is higher than the norm of 40-50 people per seat. But in ward 31,32 and
33 the load on the public toilets is huge and more number of sets are required.

CITY SANITATION PLAN BELGAUM
ADMINISTRATIVE STAFF COLLEGE OF INDIA, HYDERABAD 126 | P a g e
Table 53 Grouping of un-served wards w.r.t. public conveniences, CCB
Group Ward. Nos. Floating population influx/day
No. of seats required
Group 1 5,6,7, 8 650 2 public toilet complexes with 7 seats each
Group 2 10,11,12,13,14,15,16 1880 5 public toilet complex with 7 seats
Group 3 21,22,23,24,25 2850 7 public toilet complex with 8 seats
Group 4
26,27,28,29,30,31,32,33 42,43,45
11000
Additional 157 seats . Another ten Public toilet complexes of 16 seats each. 44 seats. 5 Toilet complexes of 9 seats each.
Source - ASCI
Such wards can be spatially grouped to be served by common public conveniences. The
proposed grouping is as follows.The proposed locations of the public toilets are shown in the
map as follows.
Map 5 proposed Locations for Public Toilets
[Source –ASCI]

CITY SANITATION PLAN BELGAUM
ADMINISTRATIVE STAFF COLLEGE OF INDIA, HYDERABAD 127 | P a g e
INFORMATION BOX 12: FINANCE OPTIONS MODELS FOR COMMUNITY LATRINES
1. Municipal fund for neighbourhood projects (Indonesia) Blitar, a small town in East
Java, is special for its community development fund. It has twenty neighbourhoods, of which
three are poor. The budget of the town was Rp. 6.14 billion (US$ 646,000) in 2004, double
the amount of 2002. Under its community block grant programme the city disburses 2% of
its income directly to the neighbourhoods for small projects, including an obligatory 13% for
low cost housing. The neighbourhoods themselves contribute 13-22% of the project funds in
kind or cash. The purpose of the fund is to increase public participation and self-
management and allow local officials and communities to exercise their autonomy. Village
Community Empowerment Institutions (LPMSKs) take care of mobilization. Women
participate in the mandated community assemblies in which these projects are planned.
Since 2003 project selection criteria include the number of poor beneficiaries. Most local
grants go to improvement of infrastructure. From 2005 on, use of funds for hardware is
restricted to 60%. Learning from mistakes is an accepted part of the approach.
3. Slum Sanitation pogramme of Mumbai: A key feature was the involvement of slum
communities in project implementation right from the planning stage. The mobilization
process facilitated collaborations between NGOs, contractors and CBOs. In each slum a
CBO was formed and registered as a trust or a society (under the Bombay Public trust
Act. To express its “demand” each family in the target slum area was asked to pay
contribution Rs.100 per adult (maximum of Rs 500 per family) as a membership fee. The
amount was deposited in a joint bank account. After construction of the toilet block the
CBO typically certifies it’s satisfactory completion and signs a MOU with the municipal
Corporation. The responsibility of maintaining the toilet block is then handed over to the
CBO. MOU specifies that CBO will operate and maintain the toilet block.
4. After the reforms in TSC programme, priority was given for setting up sanitary
complexes in a place acceptable for both men and women. The prescribed unit cost is up
to Rs 2 lakh, shared by GOI, State Government and the community in the ratio of
60:20:20. However, the community contribution can be made by the local governance
from its budget (GOI, CSRS 2002). This approach directly provides subsidy to
communities rather than individuals. Though many households are inclined positively to
have IHL, the scarcity of space, the traditional taboos have become a constraint for
construction of IHL. To overcome such constraints, the integrated Community Latrines
Complex (ICLC) becomes a substitute. The maintenance cost of the community sanitary
complexes has to be met by the Panchayats/voluntary organisations/charitable
trusts/Self Help Groups and not the committee set up by local government.
D. SCHOOL SANITATION PROVISION
In Belgaum like any other city, school latrines and water points become dirty and run down as
detailed in the situational analysis report. As a result, they are not used and create a health
hazard. School water supply, sanitation and hygiene education are very important for the
following main reasons:
Promotes health and hygiene behaviour at an early stage of childhood.
Improves the health of children and results in a lower dropout rate, especially among
girl children.
CITY SANITATION PLAN BELGAUM
ADMINISTRATIVE STAFF COLLEGE OF INDIA, HYDERABAD 128 | P a g e
Huge network of schools offers a ready-made infrastructure to influence the students,
teachers, parents and hence the community.
Children are the change agents; hence, it ensures generational change in the adoption of
the health and hygiene behaviour.
location of the schools in low lying areas also create a serious threat
A good cleaning and maintenance system requires funds, spare parts, people and equipment,
and a clear division of roles and responsibilities among the actors involved. A number of
organizational options for maintenance suggested: through a cleaning committee, by classes
on a rotation basis, with or without a rewarding mechanism, or by individual students.
The children should be encouraged to help to maintain their own school environment and
facilities. The following models are recommended for school sanitation.
a. Health Clubs School health and hygiene clubs are usually involved in helping children for maintenance tasks.
School health clubs (or similar groups with other names) can be very useful for:
stimulating safe hygiene behaviour among children;
monitoring SSHE programme;
reaching out into the community;
Prepare an annual action plan for the School health club;
Organise school activities in planning, teaching, monitoring, and maintenance;
Conduct community activities with the help of headmaster and teachers;
Different actors should be engaged and all work together to promote and implement gender-
responsive sanitation, health and hygiene solutions. This includes:
1. Schools – (parents, PTAs, school councils, teachers,
2. students)
3. NGOs and CBOs
4. Women’s groups
5. Youth organizations
6. Governments – including Ministries of Education, Health, Water
7. Health providers
8. Researchers
b. School committee Often school committees are found very effective and can be established in schools to plan and
implement school sanitation programmes. These Committees may usually consist of students,
teachers, and parents with following roles :
Take a lead in co-ordinating and preparing action plan of SSHE programme.
Involve other actors in mobilizing local resources and support special activities like fund
raising, construction, maintenance and repair;
Organise various activities periodically to collect funds for various programmes;
Budget, allocate and supervise funds.
Include Special programme for Schools as indicated below:
Quiz completion for std. 8th and 9th
1. Four groups each of three students should be made
2. Naming the groups

CITY SANITATION PLAN BELGAUM
ADMINISTRATIVE STAFF COLLEGE OF INDIA, HYDERABAD 129 | P a g e
3. There should be at forty questions in the quiz
1. Winning group and runners group will get the prizes
I. Winning group prize Rs. /-
II. Runners up Rs. /-
Elocution Competition for std. 7th
1. Each student should be allowed three minutes only
2. Topic should be related only to water and sanitation themes ex. My village is
clean/purification of water
1. Prize first Rs. /-
2. Second Rs. /-
3. Third Rs. /-
Esssay competition for std. 6th
1. Each student should be allowed three minutes only
2. Topic should be related only to water and sanitation themes ex. My School/ ward/Para
clean/ hygiene practices
1. Prize first Rs. /-
2. Second Rs. /-
3. Third Rs. /-
On the spot painting competition for std. 5th
Materials needed can be estimated and be given by school as indicated below:
Wax colour caryon box 50* = /-
Pencils 50* = /-
Eraser 50* = /-
Paper (15 inch by 11 inch) 50* = /-
Prize Rs. /-
First Prize Rs. /-
Second Prize Rs. /-
Third Prize Rs. /-
E. PROVISION OF SANITATION IN OTHER AREAS FOR ACHIEVING CITYWIDE
SANITATION
National Building Code (NBC 2005) of India is basis for all Building Regulations and adopted by
respective states in the country, which clearly specifies that any building meant for human
occupancy or use should have adequate sanitation and disposal facilities irrespective of
availability of sewerage.
Detailed norms are available in the code depending on occupancy saying in no case less than
one water closet should be provided. Wherever disposal facilities are not available they shall be
provided as part of the building design for ensuring highest standards of sanitation condition.
Part 9 on Plumbing services Section 1 of Water Supply Drainage and Sanitation clearly details
the requirements under safe sanitation provision. But authorities are failed in implementation
of NBC and Building regulation to check building plan approvals. CSTF should intervene in this
and two members should be identified from CSTF to ratify building plans for adequate
sanitation provision. Clear rules need to be amended on responsibility of toilet provision in the
premises of any human occupation or use. Various uses generally found in any given city and
options for sanitation provision to achieve citywide sanitation are indicated below:
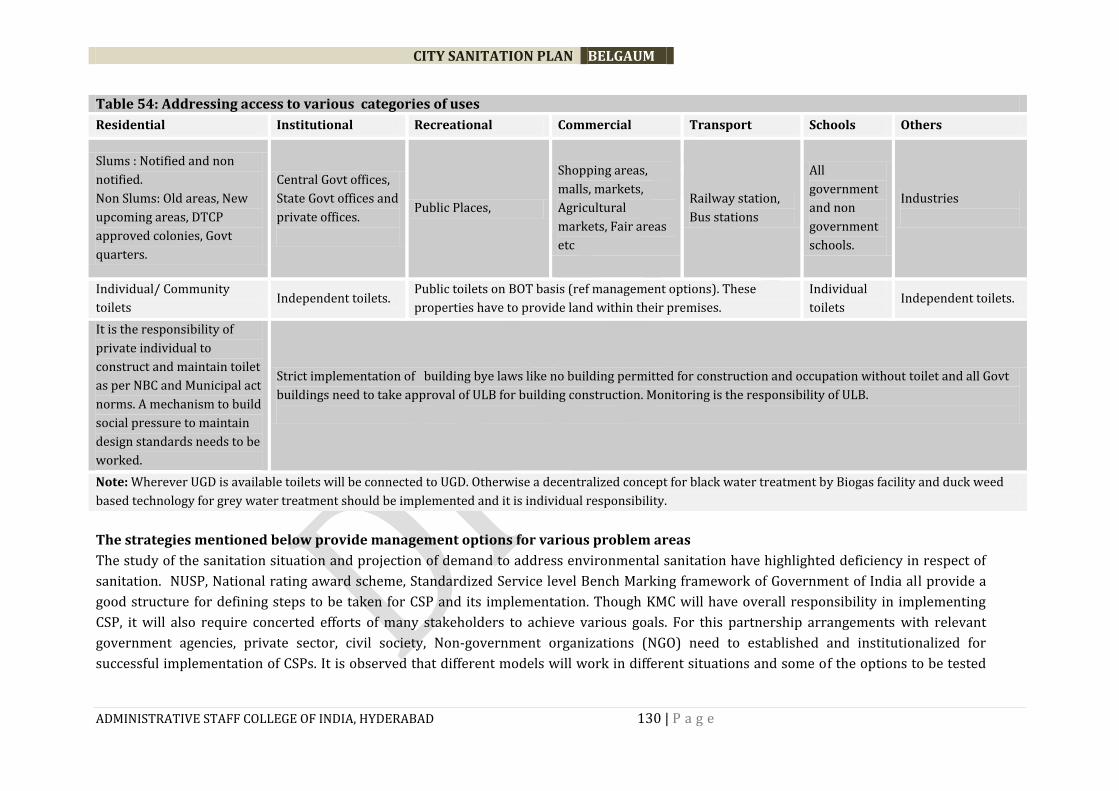
CITY SANITATION PLAN BELGAUM
ADMINISTRATIVE STAFF COLLEGE OF INDIA, HYDERABAD 130 | P a g e
Table 54: Addressing access to various categories of uses
Residential Institutional Recreational Commercial Transport Schools Others
Slums : Notified and non
notified.
Non Slums: Old areas, New
upcoming areas, DTCP
approved colonies, Govt
quarters.
Central Govt offices,
State Govt offices and
private offices.
Public Places,
Shopping areas,
malls, markets,
Agricultural
markets, Fair areas
etc
Railway station,
Bus stations
All
government
and non
government
schools.
Industries
Individual/ Community
toilets Independent toilets.
Public toilets on BOT basis (ref management options). These
properties have to provide land within their premises.
Individual
toilets Independent toilets.
It is the responsibility of
private individual to
construct and maintain toilet
as per NBC and Municipal act
norms. A mechanism to build
social pressure to maintain
design standards needs to be
worked.
Strict implementation of building bye laws like no building permitted for construction and occupation without toilet and all Govt
buildings need to take approval of ULB for building construction. Monitoring is the responsibility of ULB.
Note: Wherever UGD is available toilets will be connected to UGD. Otherwise a decentralized concept for black water treatment by Biogas facility and duck weed
based technology for grey water treatment should be implemented and it is individual responsibility.
The strategies mentioned below provide management options for various problem areas
The study of the sanitation situation and projection of demand to address environmental sanitation have highlighted deficiency in respect of
sanitation. NUSP, National rating award scheme, Standardized Service level Bench Marking framework of Government of India all provide a
good structure for defining steps to be taken for CSP and its implementation. Though KMC will have overall responsibility in implementing
CSP, it will also require concerted efforts of many stakeholders to achieve various goals. For this partnership arrangements with relevant
government agencies, private sector, civil society, Non-government organizations (NGO) need to established and institutionalized for
successful implementation of CSPs. It is observed that different models will work in different situations and some of the options to be tested

CITY SANITATION PLAN BELGAUM
ADMINISTRATIVE STAFF COLLEGE OF INDIA, HYDERABAD 131 | P a g e
and implemented by KMC are as follows:
Table 55: Management Strategies
Option A Option B Option C Option D
1. Improving Access
HHs Individual toilets with
subsidy.
Up gradation with technical
support for alternatives.
Up gradation with financial
support for alternatives.
Guidance notes to APL on
different types of toilets with
technical support.
Schools Designing, field testing and
propagating child – friendly,
gender friendly and disabled
friendly toilets by ULB as
part of IEC.
Mobilizing business houses,
companies etc. to donate or
adopt toilets with ad rights.
Promoting PPPs for O&M Education dept. bears capital
and O &M by outsourcing.
Public/Institutional
toilets
Create public-private
partnerships between
service providers and
government agencies.
Mobilizing business houses,
companies etc. to donate or
adopt toilets with ad rights.
Generators of huge visitors
(railways, KSRTC, Court,
shopping complex, market
areas, theaters and Govt
offices) to give land for pay
and use toilets on BOT mode.
Consolidate IEC money of all
govt. programs for O&M and
use Toilet walls.
2. Black soil and Waste water Treatment
Septage Management Update and amend
regulations on tariffs for
septage management.
Considering subsidizing of
emptying fees to poor.
Frequency of septic tank
emptying regulated by
authorities to every three
years.
Public awareness campaign for
enhanced frequency of septic
tank emptying and develop
annual septage symposium.

CITY SANITATION PLAN BELGAUM
ADMINISTRATIVE STAFF COLLEGE OF INDIA, HYDERABAD 132 | P a g e
Sludge Treatment and
disposal
Improving on public utility’s
collection and
transportation Capacity.
Regulations for and licensing
of private entrepreneur
involvement in sludge
collection and
transportation.
ULB manage contractors for
scheduled desludging.
Clear policies and guidelines
for developers.
Promotion of no cost/ low
costs technologies like soak
pits to septic tanks (Areas
where UGD is not covered)
UGD Scheme Ref Starters
ISWM Promotion of RWAs, local
committees in 100% door to
door collection.
Making segregated wastes
available at disposal /
treatment facilities.
- 20% (2011 -2012)
- 60% (2012 -14)
- 100% (2014 onwards)
Recycling waste
- 50% (2010 -2012)
- 60% (2012 -14)
- 80% (2014 onwards)
Scientific treatment and
disposal by developing pilot
initiatives and testing by 2014
and scaling up afterwards.
3. M& E and awareness
Regulation A strong regulatory
framework to be put in place
by amending the Municipal
Act, Building regulations
with rules on following:
Guidelines on
penalties/fines to be
imposed on
littering,
obstruction of
natural and artificial
drainage, faecal and
septic effluent
discharge in to
drains.
Public awareness
campaign
Triggering social
mechanisms to prevent OD,
behaviour change, disuse of
toilets. Raise public
awareness through
multimedia campaigns,
targeting children in
Expose NGOs and media to
importance of sanitation to
gain their support.
Build political support with
exposure visits, technical
trainings, reports, and
workshops.
Manuals on guidelines,
regulations, O& M of toilets
and extensive dissemination.

CITY SANITATION PLAN BELGAUM
ADMINISTRATIVE STAFF COLLEGE OF INDIA, HYDERABAD 133 | P a g e
particular.
Monitoring and
evaluation
1. Gather information and
develop databases and
regular updation.
- SWM, Drainage, sanitation,
track O&D
2. Adoption of “Protocol” on
monthly collection of data
from each ward/slum and
publish in public forum.
Framing rules and
specifications and effective
monitoring especially to
make sewerage systems
work without any ex
filtration in the future.
Continuing O&M
practices(cleaning toilets,
emptying pits/septic tanks,
maintaining waste water
disposal systems)
Technical evaluation and
finalization: Appraising models
for toilets, solid/liquid waste
management, school
sanitation, vulnerable and
special needs populations,
menstrual hygiene.
Sustaining usage O&M
and governance
Impact monitoring: periodic
and regular monitoring of
socio economic, health,
ground water and soil
impact indicators.
Institutional processes:
Community monitoring of
construction, usage etc,
social pressure on usage and
O&M etc.
Establishing linkages for funds
defining allocations/sharing
costs, determining community
Contributions.
Documented operational
systems and institutional
responsibility assigned for
each sector by preparing
written manual.

CITY SANITATION PLAN BELGAUM
ADMINISTRATIVE STAFF COLLEGE OF INDIA, HYDERABAD 134 | P a g e
7.3.2 EXCRETA DISPOSAL AND WASTE WATER MANAGEMENT
Sewerage system need not be the only sanitation system for liquid waste. Onsite sanitation
systems to treat grey and black water or a combination depending on the user choice shall be
adopted for less dense settlements and other uncovered areas. Need to ensure 100% treatment
of both black and grey water. For onsite sanitation, periodic cleaning shall be ensured. ULB may
provide the equipment at a fee and also final disposal, depending on the type of onsite
treatment involved. The proposals for Belgaum consider safe containment, treatment and
disposal of human excreta and community liquid waste. This will be achieved by:
Ensuring that all human wastes are collected, treated and disposed off safely;
Promoting proper disposal and treatment of sludge from on-site installations (septic
tanks, pit latrines, etc.);
Promoting proper functioning of network-based sewerage systems and ensuring
connections of households to them;
Encourage recycle and reuse of treated waste water for non-potable applications,
wherever possible.
A. TECHNICAL OPTIONS FOR FECAL TREATMENT AND WASTE WATER TREATMENT
100 % of human excreta and liquid wastes from all sanitation facilities must be disposed-off
safely. Rudimentary latrines (discharging into drains and nalas) widely spread in Belgaum, are
the first step to manage excreta. The next step in the sanitation ladder is any form of improved
latrines that ensure more hygienic separation of excreta and the final step is a flush latrine
connected to a septic tank or a sewer network. Each successive step of the ladder represents a
higher unit cost but is assumed to give a correspondingly lower level of health risk (Morella
2008). Different types of sanitation systems (indicated in the table) below and decentralized
wastewater treatment plants can be suggested i.e. septic tanks, biogas toilets and Decentralized
Wastewater Treatment System (DEWATS).
The six technologies represent different levels of sanitation services. Whereas the septic tank
aims only at providing better hygienic conditions, the ecosan and biogas systems provide
additional benefits (reuse of nutrients, biogas). The decentralized systems aim at reusing the
treated wastewater for irrigation.

CITY SANITATION PLAN BELGAUM
ADMINISTRATIVE STAFF COLLEGE OF INDIA, HYDERABAD 135 | P a g e
Table 56: Intended benefits for the six technology systems.
Basic Sanitation Waste Water Treatment
Intended
benefit
Septic
tank
Biogas Ecosan SIBF** MSF*** DEWAT
S****
Type Individu
al
Individual /
Communal
Individual /
Communal
Commun
al
Commun
al
Commun
al
Better Hygienic
Conditions
Yes Yes Yes Yes Yes Yes
Reuse of
Nutrients and
Biogas
NA Yes Yes NA* NA* NA*
Reuse of
treated waste
water for
irrigation
NA NA NA Yes Yes Yes
**Solid Immobilised Biofilter (SIBF)
***Multiple Stage Filtration (MSF)
****Decentralized Wastewater Treatment System (DEWATS)
Following options are suggested for Non UGD areas;
Table 57: Waste water treatment options for Non UGD areas
Sl. No. Area Preference 1
(Offsite)
Preference 2
(onsite)
Option 3
(onsite)
1 New upcoming areas
(high income)
UGD DEWATS Septic tanks
2 New upcoming areas (
Low income)
UGD DEWATS Two pits
3 Slums of narrow lanes UGD Communal septic
tanks
Biogas tanks
All systems provide water for irrigation with which users get in contact so regular monitoring is
required to keep the hygienic risks low. Hence education on appropriate hygiene practices as
well as the use of the systems as a way to improve aspects, such as smell and breeding insects,
should be provided on ongoing basis.
The biogas and Ecosan system pose medium risk to the person who is emptying the systems,
whereas the SIBF and the DEWATS feature only low risk as users do not get in direct contact
with the system. The risk here is dependent on the reuse of water for irrigation practices, type
of crops and how well the prior treatment has worked. One factor of success of the
decentralized systems is the well-organized operation and maintenance, which is either
conducted by a private company or a community committee. Those decentralized systems also
require less energy (and have therefore lower costs) than conventional treatment systems.
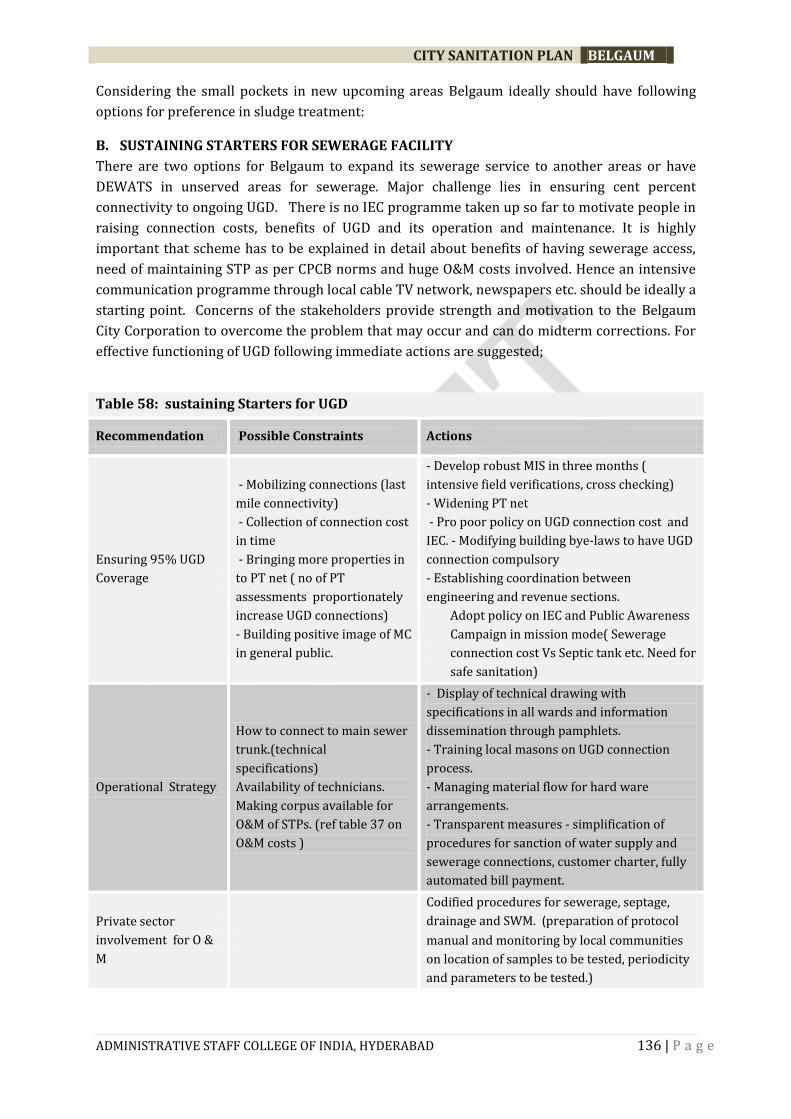
CITY SANITATION PLAN BELGAUM
ADMINISTRATIVE STAFF COLLEGE OF INDIA, HYDERABAD 136 | P a g e
Considering the small pockets in new upcoming areas Belgaum ideally should have following
options for preference in sludge treatment:
B. SUSTAINING STARTERS FOR SEWERAGE FACILITY
There are two options for Belgaum to expand its sewerage service to another areas or have
DEWATS in unserved areas for sewerage. Major challenge lies in ensuring cent percent
connectivity to ongoing UGD. There is no IEC programme taken up so far to motivate people in
raising connection costs, benefits of UGD and its operation and maintenance. It is highly
important that scheme has to be explained in detail about benefits of having sewerage access,
need of maintaining STP as per CPCB norms and huge O&M costs involved. Hence an intensive
communication programme through local cable TV network, newspapers etc. should be ideally a
starting point. Concerns of the stakeholders provide strength and motivation to the Belgaum
City Corporation to overcome the problem that may occur and can do midterm corrections. For
effective functioning of UGD following immediate actions are suggested;
Table 58: sustaining Starters for UGD
Recommendation Possible Constraints Actions
Ensuring 95% UGD
Coverage
- Mobilizing connections (last
mile connectivity)
- Collection of connection cost
in time
- Bringing more properties in
to PT net ( no of PT
assessments proportionately
increase UGD connections)
- Building positive image of MC
in general public.
- Develop robust MIS in three months (
intensive field verifications, cross checking)
- Widening PT net
- Pro poor policy on UGD connection cost and
IEC. - Modifying building bye-laws to have UGD
connection compulsory
- Establishing coordination between
engineering and revenue sections.
Adopt policy on IEC and Public Awareness
Campaign in mission mode( Sewerage
connection cost Vs Septic tank etc. Need for
safe sanitation)
Operational Strategy
How to connect to main sewer
trunk.(technical
specifications)
Availability of technicians.
Making corpus available for
O&M of STPs. (ref table 37 on
O&M costs )
- Display of technical drawing with
specifications in all wards and information
dissemination through pamphlets.
- Training local masons on UGD connection
process.
- Managing material flow for hard ware
arrangements.
- Transparent measures - simplification of
procedures for sanction of water supply and
sewerage connections, customer charter, fully
automated bill payment.
Private sector
involvement for O &
M
Codified procedures for sewerage, septage,
drainage and SWM. (preparation of protocol
manual and monitoring by local communities
on location of samples to be tested, periodicity
and parameters to be tested.)

CITY SANITATION PLAN BELGAUM
ADMINISTRATIVE STAFF COLLEGE OF INDIA, HYDERABAD 137 | P a g e
C. OPERATION AND MAINTENANCE
A sewerage system as it is known collects wastewater from residences, industries, hospitals and
commercial institutions for conveyance to STPs for treatment and safe disposal. Any obstruction
or overloading of the collection system can have dramatic consequences on public health and
the environment.
It is the responsibility of the City Corporation, to ensure that the performance of the sewerage
system is not compromised in any manner by adopting proper practices of operation and
maintenance of the system. Effective O&M of an underground sewerage scheme is critical and
the direct responsibility rests with the Belgaum City Corporation. For ease of operation and
maintenance, the sewerage system has to be cost effective.
The primary aim of sewage treatment plant‘s (STP) operation and maintenance (O&M), is the
running and maintenance the plant, efficiently and economically, so that the effluent from the
plant meets the prescribed standards in terms of BOD,SS and fecal coliforms laid down by the
local body or the pollution control board while discharging the effluent on land or into water
body.
The basic requirements of successful O&M of STP are:
1. A thorough knowledge of plant and machinery and equipment provided in the STP
and their functions,
2. A thorough knowledge of the processes,
3. Proper and adequate tools,
4. Adequate stock of spare parts and chemical,
5. Assignment of specific responsibilities to operating staff,
6. Schedule of daily preventive maintenance,
7.Systematic and period inspection,
8.Training of all operating staff in operating procedures and maintenance practices,
9.Maintaining records of key activities and operating logs of equipment, and
10. Good housekeeping.
Finance and
administration
Consumers get interest free loans to connect and pay back as part of the tariff;
Introduction of weighed tariffs reflecting the principle ‘the polluter pays’.
Use of local indicators, e.g. type of housing, to determine the category of
payment.
Different loan terms for different groups, e.g. installments.
Timely payments are rewarded, e.g. by a % reduction for the next year.
CITY SANITATION PLAN BELGAUM
ADMINISTRATIVE STAFF COLLEGE OF INDIA, HYDERABAD 138 | P a g e
D. REQUIREMENTS OF MAINTENANCE OF SEWER
As huge investment are generally made for the implementation of the sewerage system, it is
appropriate to operate and maintain the system effectively in order to derive maximum benefit
of the investment. Maintenance of sewer system depends not only on proper design and
construction but also on the availability of competent staff for their operation.
The requirements of the maintenance of the sewerage system are:
1. Protect the sewerage system against damaging materials, which may be discharged
by the public, commercial and industrial institution.
2. Prevent the sewerage system from clogging due to deposition of solids as a result of
inadequate flow
3. Prevent the accumulation of foul gases in the sewerage system due to the anaerobic
decomposition of the deposited solids
4. Save the workers involved in the sewer cleaning from death due to obnoxious gases.
The preventive maintenance methods to achieve the above requirement are:
Ensure self-cleaning velocity in all section of the sewerage system at least once in a day for
prevention of clogging in the sewerage system. The sewer section where it is not possible to
obtain the self-cleansing velocities due to flatness of the gradient especially in the head reaches
of the sewer network, flushing is necessary.
The O&M of the created infrastructure includes manning and maintenance of the STPs, power
charges for the pumping stations, manning for the maintenance of the network, maintenance
and repairs of the sewer cleaning machinery and equipment, administrative expenditure
involved in billing and collection of sewerage cess etc. Also the sewer lines between two
successive manholes should be periodically inspected using intrusive equipments &
arrangement for silting and blockages. The revenue from the sewerage sector is mainly from the
charges being collected while giving new sewerage connection and drainage cess collected along
with house tax.
E. REUSE OF RECYCLED WATER
Decentralized wastewater systems collect, treat, and reuse or dispose of wastewater at or near
its point of generation. It includes systems that treat wastewater from individual homes or
buildings as well as cluster systems that treat wastewater from groups of two or more houses.
Unlike centralized urban wastewater treatment systems, decentralized systems treat
wastewater close to the source, typically using small pipes for collecting small volumes of
domestic wastewater. They are most cost-effective option especially in peri urban and hilly
terrain existing in Belgaum. Following guidelines need to be followed for application of sewage
water.

CITY SANITATION PLAN BELGAUM
ADMINISTRATIVE STAFF COLLEGE OF INDIA, HYDERABAD 139 | P a g e
Table 59: Degree of Treatment Needed for Land Application
Treatment Device Type Land Application System
Primary
Septic tank
Grey water Tank
Waterless composting toilet
Combustion toilet
Soil absorption systems
Burial (for compost)
Secondary
AWTS
Grey water treatment
Septic tank and re circulating sand
filter
Subsurface Irrigation
Tertiary (disinfection)
AWTS
Grey water treatment
Septic tank and re circulating sand
filter
Subsurface irrigation
Surface Irrigation (non –
aerosal)
Grey water tertiary
(Excluding Kitchen
wastes)
Grey water treatment
Subsurface irrigation
Surface Irrigation (non –
aerosol)
Toilet flushing
F. DEWATS : SEWAGE TREATMENT (300 PERSON EQUIVALENT OR 60-65 HHS
EQUIVALENT)
The sewage treatment unit consists of anaerobic up flow reactor as a primary treatment and
Root Zone Treatment (RTZ) System as secondary treatment system. A maturation pond is also
in place for tertiary treatment. The treated wastewater is finally supplied to the houses for
inferior domestic uses like toilet flushing and garden irrigation.
Description of Wastewater treatment units
The wastewater treatment system consists of Up-flow Anaerobic Reactor as primary treatment
unit. This system was designed & implemented for 300 person equivalent. The cross section of
this reactor is trapezoidal section in the bottom and rectangular in the top. The waste water
from final receiving chamber is allowed to enter in this reactor at the bottom through a pipe and
water rises up at a very low velocity. The treated waste water is collected through gutter along
longitudinal walls and enters the secondary treatment system.
Primary Treatment Unit
Type of Primary treatment: Up flow anaerobic reactor.
Design capacity: 300 Persons.
Type of Structure: Reinforced Cement Concrete
Size of unit: 10m x 3m x 4m
Design Load Characteristics
Hydraulic load : 1600 lts/m2/day
Organic load: 0.512 Kg/m2/day

CITY SANITATION PLAN BELGAUM
ADMINISTRATIVE STAFF COLLEGE OF INDIA, HYDERABAD 140 | P a g e
Actual Load Characteristics
Hydraulic load: 160 lts/m2/day (As per Standards)
Hydraulic load: 177 lts/m2/day (As per Actual measurement before commissioning of
recycling system)
Hydraulic load: 81 lts/m2/day (As per Actual measurement after commissioning of
recycling system)
Organic Load (Maximum): 0.037 Kg/m2/day (As per Actual measurement before
commissioning of recycling system)
Organic Load (Maximum): 0.011 Kg/m2/day (As per Actual measurement after
commissioning of recycling system)
1. Volume: 114 m3
2. Cross sectional area: 12m2
3. Longitudinal Sectional area at the centre: 40m2
Secondary Treatment Unit
The wastewater treatment systems consists of Horizontal root zone system as secondary
treatment which receives partly treated wastewater from primary treatment unit.
Horizontal Root Zone Treatment Unit
The secondary treatment units are implemented in Phase level hence the first level is designed
for 50 persons. In the root zone treatment, wastewater passes through filter bed by uniform
horizontal flow. Root zone treatment are sealed filter beds consisting of sand, gravel and soil
system, occasionally with a cohesive element, planted with vegetation which can grow in
wetlands. The wastewater passes through the filter bed where biodegradation of the
wastewater takes place.
Root Zone Treatment system
Type of treatment system: Horizontal Root Zone treatment.
Type of Structure: Reinforced Concrete floor with Brick walls.
Size of Unit: 10m X 5m X 1.2m
Design Load Characteristics
1. Hydraulic load: 160 lts/m2/day
2. Organic load: 0.024 Kg/m2/day
Actual Load Characteristics
Hydraulic load: 106 lts /m2/day (As per Actual measurement before commissioning of
recycling system)
Hydraulic load: 49 lts /m2/day (As per Actual measurement after commissioning of
recycling system)
Organic load: 0.0030 kg /m2/day (As per Actual measurement before commissioning of
recycling system)

CITY SANITATION PLAN BELGAUM
ADMINISTRATIVE STAFF COLLEGE OF INDIA, HYDERABAD 141 | P a g e
Organic load: 0.0021 kg /m2/day (As per Actual measurement after commissioning of
recycling system)
Type of plant species: Arundo donax
Plan area of filter bed: 50sq.m
Tertiary Treatment Unit
Maturation Pond : In this treatment unit, Maturation pond act as tertiary treatment, effluent
from Root zone treatment unit enters in the Maturation pond. The important function of
maturation pond is the removal of excreted pathogens to achieve an effluent quality which is
suitable for its downstream reuse.
Design of Maturation Pond
Type of Structure: Reinforced Concrete floor with Brick walls
Size of Unit: 5.75m X 5mX 1m
Cross sectional area: 5m2
Longitude Sectional area: 5.75m2
Plan area: 28.75 m2
Capacity of unit: 28.75 m3
Hydraulic Retention time: 4.5 days (as per actual daily sewage inflow)
Hence total cost required for the construction of wastewater treatment system is Rs 4000.00
per person.
Table 60: Cost of Construction of the Wastewater Treatment system
Sl
No
Description Total Cost in Rs For Person
Equivalent
Cost/
Person
1. Primary treatment unit (Upflow
Anaerobic Reactor)
2,75,000.00 300 916.00
2. Secondary treatment unit (Root
Zone Treatment)
1,00,000.00 50 2000.00
3. Tertiary treatment unit
(Maturation Pond)
25,000.00 50 500.00
TOTAL COST Rs 4,00,000.00 3416.00

CITY SANITATION PLAN BELGAUM
ADMINISTRATIVE STAFF COLLEGE OF INDIA, HYDERABAD 142 | P a g e
Table 61:Cost of Operation and Maintenance
Sl No Description of work Amount (Rs)
1 Monitoring
Wastewater Analysis cost
26,500.00
2. Maintenance
Operation and maintenance (Since commissioning till date)
30,000.00
3. Onsite Laboratory
4 Cost of Equipment and chemicals 12,000.00
5 Total (two years) 68, 500.00
6 O&M cost year Rs 35000
Table 62: Land Requirement
Sl No Description Total Area
(Sq. m)
Person
Equivalent
Area / Person
(Sq.m)
1. Primary treatment unit ((Up-flow
Anaerobic Reactor)
34 300
0.11
2. Secondary treatment unit (Root
Zone treatment)
62 50 1.24
3. Tertiary treatment unit
(Maturation Pond)
33 50 0.7
TOTAL 129 300 2.4
Area requirement per person for the treatment of wastewater is nearly 2.4m2/person
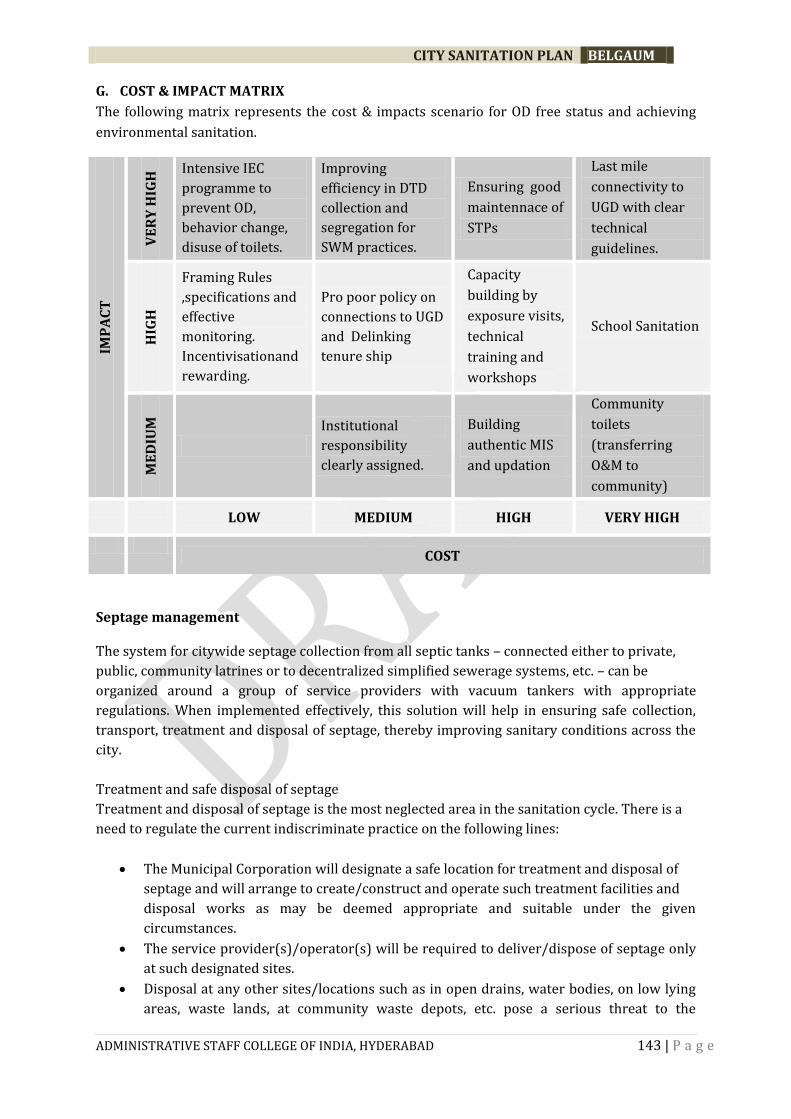
CITY SANITATION PLAN BELGAUM
ADMINISTRATIVE STAFF COLLEGE OF INDIA, HYDERABAD 143 | P a g e
G. COST & IMPACT MATRIX
The following matrix represents the cost & impacts scenario for OD free status and achieving
environmental sanitation.
IMP
AC
T
VE
RY
HIG
H Intensive IEC
programme to
prevent OD,
behavior change,
disuse of toilets.
Improving
efficiency in DTD
collection and
segregation for
SWM practices.
Ensuring good
maintennace of
STPs
Last mile
connectivity to
UGD with clear
technical
guidelines.
HIG
H
Framing Rules
,specifications and
effective
monitoring.
Incentivisationand
rewarding.
Pro poor policy on
connections to UGD
and Delinking
tenure ship
Capacity
building by
exposure visits,
technical
training and
workshops
School Sanitation
ME
DIU
M
Institutional
responsibility
clearly assigned.
Building
authentic MIS
and updation
Community
toilets
(transferring
O&M to
community)
LOW MEDIUM HIGH VERY HIGH
COST
Septage management
The system for citywide septage collection from all septic tanks – connected either to private,
public, community latrines or to decentralized simplified sewerage systems, etc. – can be
organized around a group of service providers with vacuum tankers with appropriate
regulations. When implemented effectively, this solution will help in ensuring safe collection,
transport, treatment and disposal of septage, thereby improving sanitary conditions across the
city.
Treatment and safe disposal of septage
Treatment and disposal of septage is the most neglected area in the sanitation cycle. There is a
need to regulate the current indiscriminate practice on the following lines:
The Municipal Corporation will designate a safe location for treatment and disposal of
septage and will arrange to create/construct and operate such treatment facilities and
disposal works as may be deemed appropriate and suitable under the given
circumstances.
The service provider(s)/operator(s) will be required to deliver/dispose of septage only
at such designated sites.
Disposal at any other sites/locations such as in open drains, water bodies, on low lying
areas, waste lands, at community waste depots, etc. pose a serious threat to the

CITY SANITATION PLAN BELGAUM
ADMINISTRATIVE STAFF COLLEGE OF INDIA, HYDERABAD 144 | P a g e
environment and public health and will be considered unlawful and the operator will be
liable to punishment under the provisions of the municipal bylaws.

CITY SANITATION PLAN BELGAUM
ADMINISTRATIVE STAFF COLLEGE OF INDIA, HYDERABAD 145 | P a g e
7.3.3 IMPROVEMENT OF INTEGRATED SOLID WASTE MANAGEMENT
A summary of the current position of the solid waste management has been dealt in previous
chapters. Field surveys and discussions with stakeholders also identified key issues and
problems in Belgaum. To assess the magnitude of the problem to be tackled in future
estimations of waste generation has been done based on population projections done for
Belgaum taking considering CPHEEO norms (average per capita waste generation is 350 gms).
Since growth is expected to be moderate, the future generation trends will be governed by
population changes and will be mainly from domestic sources.There need to be considerable
focus required to address solid waste management complying to MSW 2000 rules. The Health
Department of Belgaum is headed by a Health Officer and is responsible for all activities of
collection, street sweeping, transportation, and disposal of solid waste. The Engineering
Department is responsible for procurement and maintenance of equipment and vehicles. For
operational purposes, the entire area is divided into 5 zones. Each zone comprises of electoral
wards and is headed by a Health Inspector.

CITY SANITATION PLAN BELGAUM
ADMINISTRATIVE STAFF COLLEGE OF INDIA, HYDERABAD 146 | P a g e
A systematic action plan for maintaining solid waste management while achieving each recommendation as outlined below:
Table 63: ISWM Action Plan
Recommendation Strategy to be adopted Actions Possible Constraints
1 Achieving benchmark
cleanliness (following
SLB indicators and
parameter in Sanitation
rankings in phases )
Establish work norms (per
worker) for roads (both
congested and wide), open
spaces.
Regularize sanitary worker
attendance by biometric system.
Encourage successes of visible
clean areas.
Involve Corporators and a few
other who will support such
efforts in their Wards.
Promote clean wards/slums/Colony etc. by
well-planned door to door collection.
Increased involvement of NGOs/Private
operators etc.
Good working conditions and recognition
mechanisms for workforce.
Increasing efficiency
and productivity of
existing staff.
Possible protest from
employees.
2 Source segregation of
waste into specified
types
Maximum recycling and
maximum local composting of
bio-degradable waste.
Provide separate collection
mechanism for Bulk Waste
Producers, Construction waste /
Debris, Garden/ Green Waste.
Overall training and capacity
building of MSW personnel in
order to achieve segregation of
solid waste at source.
Good communication and
awareness programme.
Promote source segregation by keeping
“wet” & “dry” wastes separately, doorstep
collection of “wet” waste for bulk waste
producers with extra rates, to compost all
bio – degradable and recycle dry wastes.
Associate with trade & industry associations
for better marketing to segregate recyclable
material
Give priority to the source segregation of
recyclable waste by shops and
establishments and later concentrate on
segregation at the 3household level.
Targeting behaviour
change of households.
Increased public health
and hygiene levels

CITY SANITATION PLAN BELGAUM
ADMINISTRATIVE STAFF COLLEGE OF INDIA, HYDERABAD 147 | P a g e
3 Minimizing ,primary
collection, transport
and handling costs per
ton
Encourage PPP and out sourcing. Reduce expenditure on collection per
household by imposing user charges @
Rs.one per day), encourage source
segregation and reduce waste reduction to
at least 15%.Planning and optimizing vehicle
routing with robust MIS and waste
generation data base.
Introduction of GPS and monitoring of MSW
vehicles in a centralized locality.
4 Management
Information Systems
Regular reporting and data
updating.
Appropriate division of roles
and responsibilities.
Developing information base on :
Daily/weekly/monthly reports at
town/ward/zone level.
Spatial and seasonal waste generation
quantities and nature (Ward-wise waste),
collection points linking to GIS, asset
inventory, category wise waste generation,
number of workers in each ward for
collection, transportation and disposal.
Recording weigh-bridge on-site
Number of staff and expected clearance
frequencies.
Funds and leadership
5 Levy user charges Polluter pays principle and a
policy on SWM user charges.
Simple procedures and strict
enforcement of regulations.
Share MSW information with the
Public.
Display boards with details of MSW in
specific area including Contractor’s phone
number on the dustbins to be cleared by
them and specify how residents can
handover waste to municipal body.
Charges for business or trade, eating-houses
or hostels, health-care facilities, shops,
offices, street-food, fairs and exhibitions and
Lack of political will.

CITY SANITATION PLAN BELGAUM
ADMINISTRATIVE STAFF COLLEGE OF INDIA, HYDERABAD 148 | P a g e
ceremonies.
Avoid NIMBY by sanitizing all wastes near
point of collection until composting
commence.
6 Advanced locality
Management (ALM)
Strong citizen’s group to work
closely with ULB to develop
strategy and improve ISWM as well
as other civic amenities in their
local area.
Organize citizen meeting in neighbourhood and
explain concept of ALM through public
meetings.
Select ALM committee from all representative
building, lanes etc.
7 Promoting Public
Private Participation
(PPP)
Performance improvement criteria
based contracting system.
Enhancing the strength of ULBs and ability
of engaged contractors to perform.
Take up pilot in newly developed areas,
under-served areas and particularly in the
areas where local bodies have not been
providing service through their own labour
force.
PPP can be considered in:
- D2D collection of household waste,
commercial waste, hospital waste, hotel
waste, construction waste and market
waste.
- Setting-up, operation and maintenance
of waste disposal facility, operation and
maintenance of waste treatment or
processing plants.
- Supplying refuse collection vehicles on
lease, repairs and maintenance of
vehicles at a private garage,
transportation of waste on contractual
Lack of credible
information
Inadequate internal
capacities to monitor
private operator
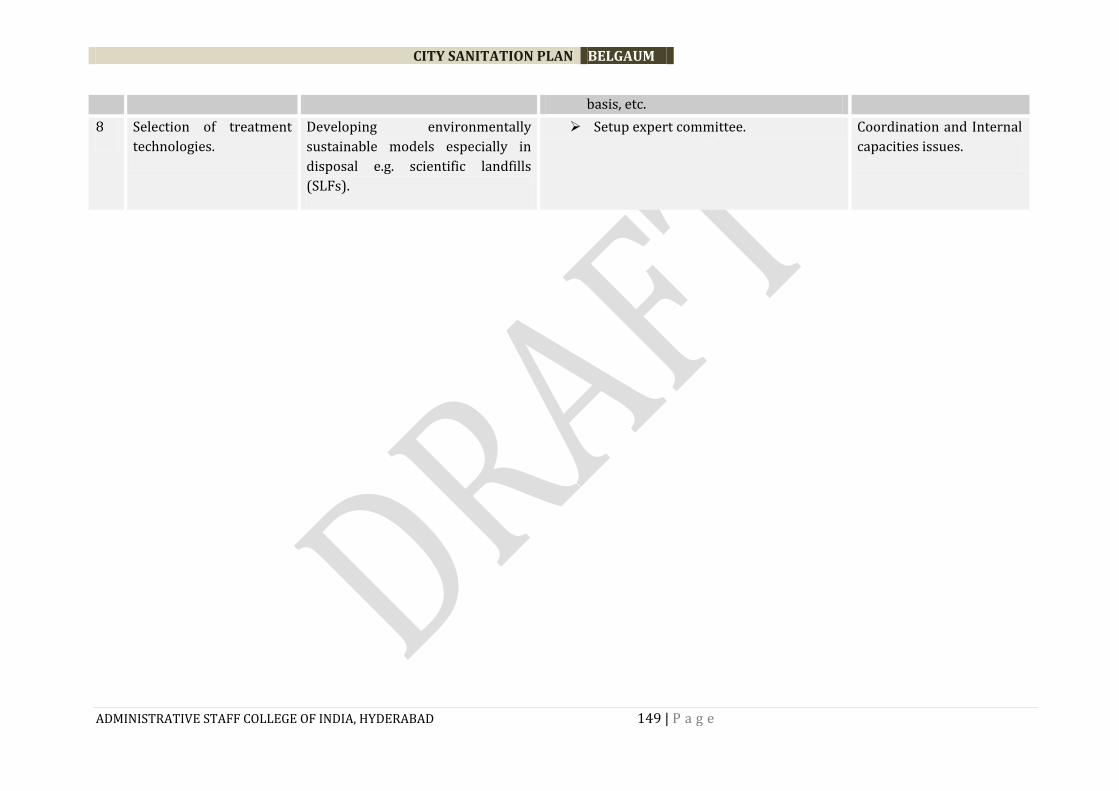
CITY SANITATION PLAN BELGAUM
ADMINISTRATIVE STAFF COLLEGE OF INDIA, HYDERABAD 149 | P a g e
basis, etc.
8 Selection of treatment
technologies.
Developing environmentally
sustainable models especially in
disposal e.g. scientific landfills
(SLFs).
Setup expert committee. Coordination and Internal
capacities issues.

CITY SANITATION PLAN BELGAUM
ADMINISTRATIVE STAFF COLLEGE OF INDIA, HYDERABAD 150 | P a g e
7.3.4 IMPROVEMENT OF STORM WATER MANAGEMENT IN BELGAUM
The existing situation of the storm water drainage network has already been discussed at length
in Section 4.2. There are a couple of areas wherein there are instances of water logging during
the rainy seasons. These areas get quite seriously affected during such times. Following are
some strategies that may be adopted to improve these areas by a large extent.
Suggested strategies for storm water management
Identifying the water logged areas and their frequency of water logging. As a short term
plan rehabilitation of drains in those areas can be taken on priority.
Considering the existing problems of water logging in rainy seasons, the use of the
debris generating from civil works like road constructions and construction sites can be
utilized as infilling in the low lying areas where water accumulates during rainy seasons,
however, proper treatment of compaction and execution is essential on such sites. These
works can be taken up as short term measures.
There should be immediate provision made in order to stop mixing of solid waste into
open drains so as to prevent choking of drains
Augmenting the existing drainage network by converting existing Kachha drains into
pucca drains by providing proper cross sections along the running length of the roads.
Construction of new drainage channels (covered) along the roads where there is no
provision of drainage system should be taken up based on detail surveys
Disposing the collected water safely into identified areas. The existing lakes can be
considered for discharging the surface water and storm water. Development of
collection and conveyance system for storm water is suggested as a midterm which will
discharge the water into existing lakes or water bodies and will help recharging and
rejuvenating the existing lakes which at present are drying due to climatic changes.
Considering options for Rain water harvesting suitable to city context. It can be
recommended in the building regulations and bye-laws for newly developing areas,
residential colonies and institutional campuses to develop rain water harvesting system.

CITY SANITATION PLAN BELGAUM
ADMINISTRATIVE STAFF COLLEGE OF INDIA, HYDERABAD 151 | P a g e
7.4. ENABLING AND SUSTAINING STRATEGIES
7.4.1 AWARENESS RAISING, HYGIENE PROMOTION AND COMMUNITY PARTICIPATION.
The first step in making cities 100% sanitized is to elevate the consciousness about sanitation
in the mind of municipal agencies, government agencies and most importantly, amongst the
people of the city. The policy also aims to transform cities into totally sanitized, healthy and
livable cities and towns. This can be achieved only by:
Generating awareness amongst households and institutions about sanitation and its
linkages with public and environmental health;
Promoting mechanisms to bring about and sustain behavioral changes aimed at
adoption of healthy sanitation practices;
There needs to be considerable engagement with households and communities on changing
mindsets, and understanding incentives to change behavior and practices. A communication
strategy has been drafted to create support for and facilitate effective implementation of city-
wide, demand-based sanitation programs; and for generating awareness amongst urban
households on sanitation and its linkages with health, economic productivity and the
environment along with facilitating behavior change towards adoption of safe sanitation
practices among households.
One reason for the low support to sanitation is that opinion leaders, policy makers and
managers do not see the links between sanitation, public health and economics. The first step in
making cities 100% sanitized is to elevate the consciousness about sanitation in the mind of
municipal agencies, government agencies and most importantly, amongst the people of the city.
ULBs are in the frontline of implementation and have a key role in ensuring sanitation and
should focus on demand responsive approach. To meet this challenge a systematic
“Communication Need Assessment (CNA)” for different Target Groups has been taken up as part
of CSP and objective of well driven IEC is for sanitation to be demand-driven with social
marketing approaches to increase demand for toilets and ensure hygiene behaviors, promote no
subsidies for household toilets in future and encourage diversity in technology and design.
ULBs are in the frontline of implementation and have a key role in ensuring sanitation and
should focus on demand responsive approach. State government should ensure support to ULBs
in providing enabling environment in all respects and provide communication and awareness
strategy. The following table details out IEC and advocacy plan in achieving desired goals of
environmental sanitation:
Enabling environment is understood at two levels. Firstly, at the macro level it refers to mobilization of political and administrative will and creation of an environment to support program implementation. Secondly, at the grassroots level, it is the inclination generated towards behavior change in ending open defecation and achieving total sanitation. Key features of the campaigning should include:
A community-led approach with focus on collective achievement of total sanitation; Focus on Information, Education and Communication (IEC) to mobilise and motivate communities towards safe sanitation; Minimum capital incentives to be disbursed post construction and usage;
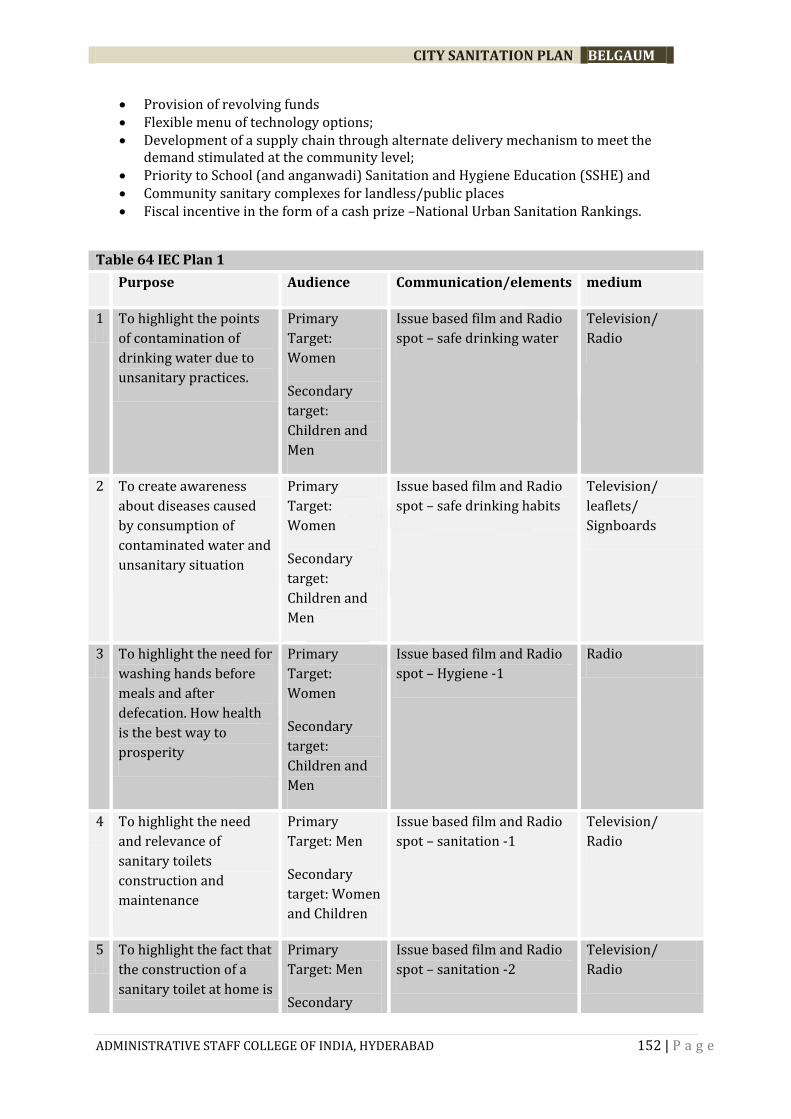
CITY SANITATION PLAN BELGAUM
ADMINISTRATIVE STAFF COLLEGE OF INDIA, HYDERABAD 152 | P a g e
Provision of revolving funds Flexible menu of technology options; Development of a supply chain through alternate delivery mechanism to meet the
demand stimulated at the community level; Priority to School (and anganwadi) Sanitation and Hygiene Education (SSHE) and Community sanitary complexes for landless/public places Fiscal incentive in the form of a cash prize –National Urban Sanitation Rankings.
Table 64 IEC Plan 1
Purpose Audience Communication/elements medium
1 To highlight the points
of contamination of
drinking water due to
unsanitary practices.
Primary
Target:
Women
Secondary
target:
Children and
Men
Issue based film and Radio
spot – safe drinking water
Television/
Radio
2 To create awareness
about diseases caused
by consumption of
contaminated water and
unsanitary situation
Primary
Target:
Women
Secondary
target:
Children and
Men
Issue based film and Radio
spot – safe drinking habits
Television/
leaflets/
Signboards
3 To highlight the need for
washing hands before
meals and after
defecation. How health
is the best way to
prosperity
Primary
Target:
Women
Secondary
target:
Children and
Men
Issue based film and Radio
spot – Hygiene -1
Radio
4 To highlight the need
and relevance of
sanitary toilets
construction and
maintenance
Primary
Target: Men
Secondary
target: Women
and Children
Issue based film and Radio
spot – sanitation -1
Television/
Radio
5 To highlight the fact that
the construction of a
sanitary toilet at home is
Primary
Target: Men
Secondary
Issue based film and Radio
spot – sanitation -2
Television/
Radio
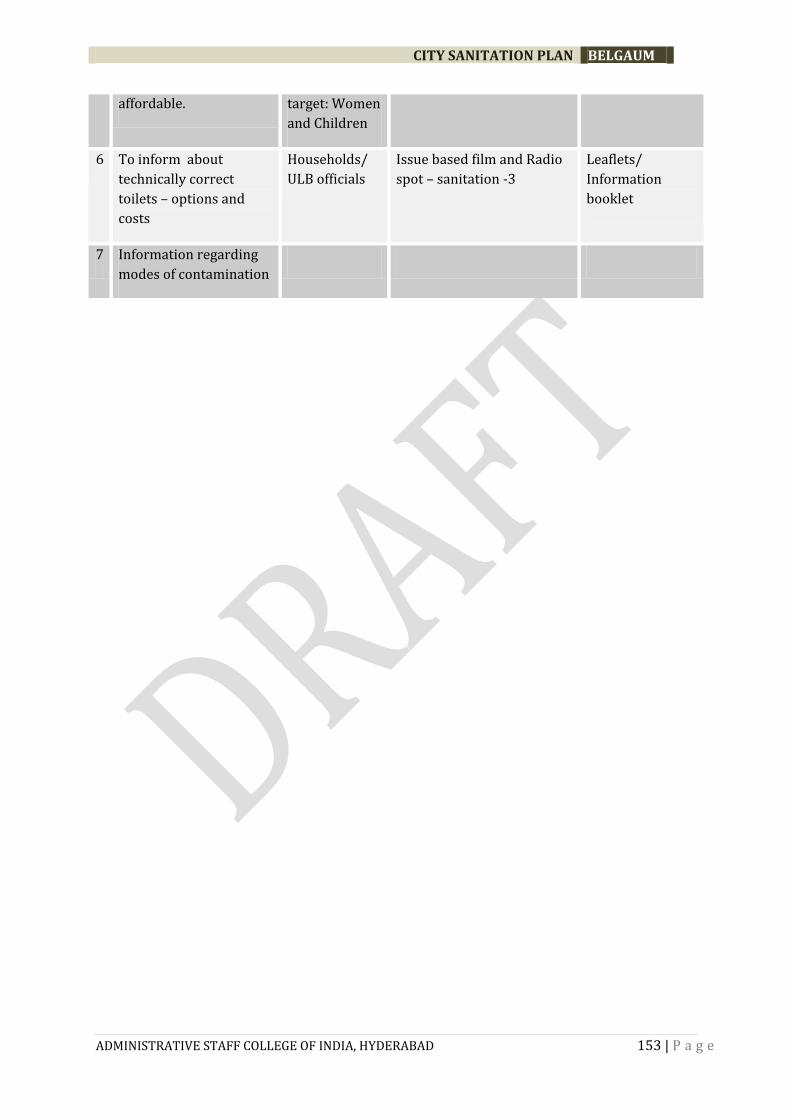
CITY SANITATION PLAN BELGAUM
ADMINISTRATIVE STAFF COLLEGE OF INDIA, HYDERABAD 153 | P a g e
affordable. target: Women
and Children
6 To inform about
technically correct
toilets – options and
costs
Households/
ULB officials
Issue based film and Radio
spot – sanitation -3
Leaflets/
Information
booklet
7 Information regarding
modes of contamination
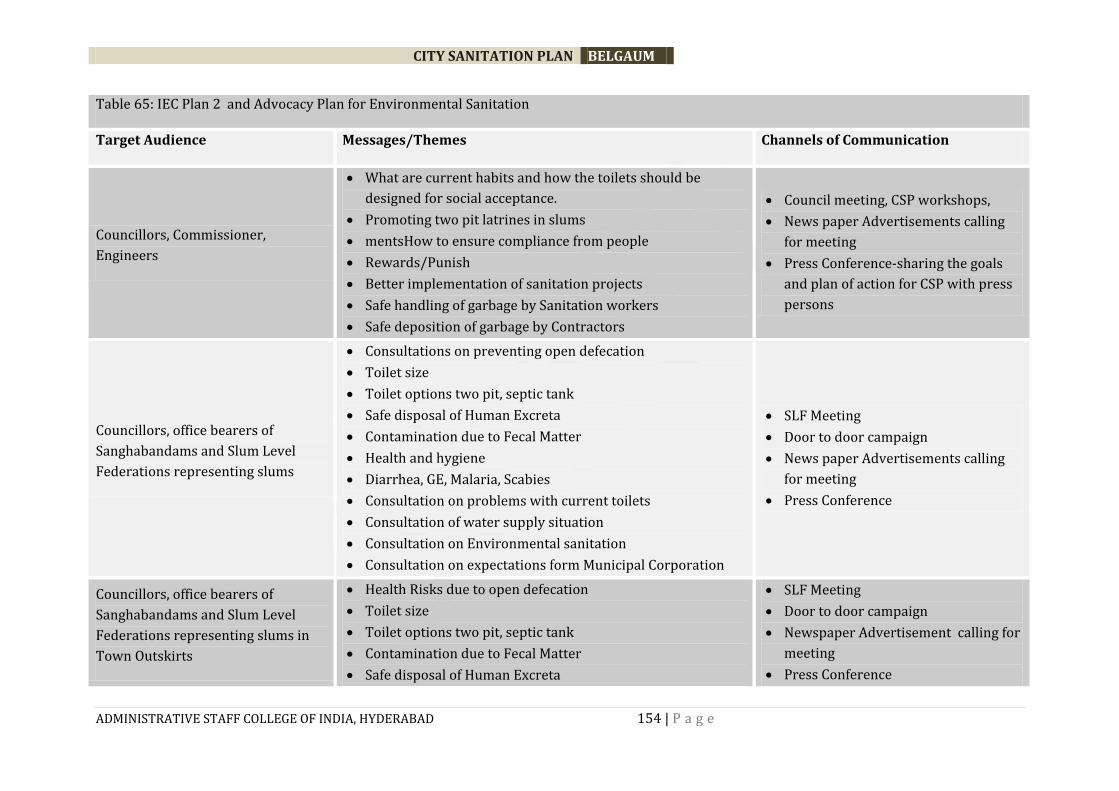
CITY SANITATION PLAN BELGAUM
ADMINISTRATIVE STAFF COLLEGE OF INDIA, HYDERABAD 154 | P a g e
Table 65: IEC Plan 2 and Advocacy Plan for Environmental Sanitation
Target Audience Messages/Themes Channels of Communication
Councillors, Commissioner,
Engineers
What are current habits and how the toilets should be
designed for social acceptance.
Promoting two pit latrines in slums
mentsHow to ensure compliance from people
Rewards/Punish
Better implementation of sanitation projects
Safe handling of garbage by Sanitation workers
Safe deposition of garbage by Contractors
Council meeting, CSP workshops,
News paper Advertisements calling
for meeting
Press Conference-sharing the goals
and plan of action for CSP with press
persons
Councillors, office bearers of
Sanghabandams and Slum Level
Federations representing slums
Consultations on preventing open defecation
Toilet size
Toilet options two pit, septic tank
Safe disposal of Human Excreta
Contamination due to Fecal Matter
Health and hygiene
Diarrhea, GE, Malaria, Scabies
Consultation on problems with current toilets
Consultation of water supply situation
Consultation on Environmental sanitation
Consultation on expectations form Municipal Corporation
SLF Meeting
Door to door campaign
News paper Advertisements calling
for meeting
Press Conference
Councillors, office bearers of
Sanghabandams and Slum Level
Federations representing slums in
Town Outskirts
Health Risks due to open defecation
Toilet size
Toilet options two pit, septic tank
Contamination due to Fecal Matter
Safe disposal of Human Excreta
SLF Meeting
Door to door campaign
Newspaper Advertisement calling for
meeting
Press Conference

CITY SANITATION PLAN BELGAUM
ADMINISTRATIVE STAFF COLLEGE OF INDIA, HYDERABAD 155 | P a g e
Health and hygiene
Diarrhea, GE, Malaria, Scabies
Consultation on problems with current toilets
Consultation of water scarcity
Consultation on Environmental sanitation
Consultation on expectations form Municipal Corporation
Office bearers of Residents Welfare
Association middleclass localities
Consultation on problems with current toilets
Consultation on septic tank cleaning
Consultation on Environmental sanitation
Consultation of water supply situation
Consultation of willingness to pay for tricycles etc
Consultation on expectations form Municipal Corporation
Meetings, Door to door campaigning
Newspaper Advertisement calling for
meeting
Press Conference
Water and sanitation officials
Display numbers of responsible officials like Sanitation
Inspectors prominently in their Zones
Restart Call Center Facility, establish grievance redressal
mechanism.
Appreciation of what people desire
Print pamphlets given with
newspapers, news paper
advertisements, painting on
Elevated/underground reservoirs
Print the phone numbers of
responsible officials on the tractors
Water and Sanitation Workers Importance of safe handling of waste
Contractors Do not dump Garbage on roads leading to dump yard
Do not burn garbage
Segregate waste at the dump yard.
Print the phone numbers of
responsible officials on the tractors
Shopkeepers Do not dump garbage in by lanes
If you need to dispose hazardous waste call the Municipal
Corporation and ask for a tractor.
Town Wide Keep house and neighbourhood Clean Road Side Billboards

CITY SANITATION PLAN BELGAUM
ADMINISTRATIVE STAFF COLLEGE OF INDIA, HYDERABAD 156 | P a g e
Boil/Filter the Water before drinking
Wash your hands before and after eating/drinking
Don’t allow mosquitoes to breed in your neighbourhood
Immunize Children
Don’t share clothes of persons infected with skin diseases
News Paper Ads
Town Cable
Sanitation, despite being a basic human need and a critical need for improved quality of life, has not got the necessary attention in the past. Also, the
different aspects of sanitation starting from collection of human feces to the safe disposal (the whole process cycle) have seen different stakeholders.
Table 66: Methods and implementation of awareness activities
Stakeholder Group Message Intent Example of Messages that could be used
Households (urban poor / slum
dwellers) that lack toilets / access to
sanitation
Motivate citizens to take
action and adopt safe,
hygienic sanitation practices
Clean households leads to healthy, strong and successful families
Choose dignity for your wives and daughters! Having toilets at home
adds to the comfort, security and privacy of the women.
Improved sanitation facilities, (e.g. use individual or community
toilets) will reduce health expenditure of your family.
Service providers – includes
• Officials of ULBs
• Officials from different arms
of the city administration,
primarily from ULBs, PHED,
OWSSB, etc.
Reinforce that:
Sanitation also includes
management of human
excreta and liquid wastes in
addition to solid waste
management.
Leverage investments in sanitation and public health and give the
residents and their future generations a chance to a healthy and happy
future.
Service providers – includes
• Officials from different arms
of the city administration,
Proper waste management is
not solely the responsibility of
the state. Citizens have an
Proper management of household waste + proper confinement,
disposal and treatment of human excreta = Clean Cities. Winning the
Nirmal Shaher Puraskar isn’t so difficult. Little effort will result in big
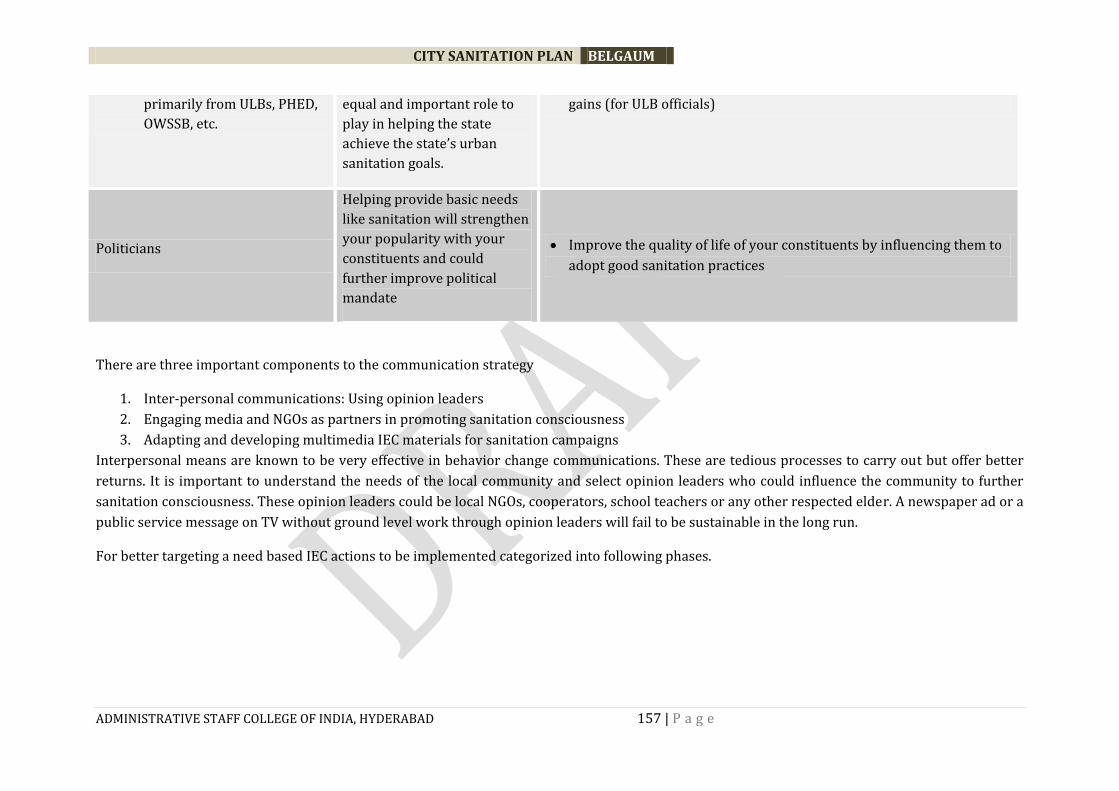
CITY SANITATION PLAN BELGAUM
ADMINISTRATIVE STAFF COLLEGE OF INDIA, HYDERABAD 157 | P a g e
primarily from ULBs, PHED,
OWSSB, etc.
equal and important role to
play in helping the state
achieve the state’s urban
sanitation goals.
gains (for ULB officials)
Politicians
Helping provide basic needs
like sanitation will strengthen
your popularity with your
constituents and could
further improve political
mandate
Improve the quality of life of your constituents by influencing them to
adopt good sanitation practices
There are three important components to the communication strategy
1. Inter-personal communications: Using opinion leaders
2. Engaging media and NGOs as partners in promoting sanitation consciousness
3. Adapting and developing multimedia IEC materials for sanitation campaigns
Interpersonal means are known to be very effective in behavior change communications. These are tedious processes to carry out but offer better
returns. It is important to understand the needs of the local community and select opinion leaders who could influence the community to further
sanitation consciousness. These opinion leaders could be local NGOs, cooperators, school teachers or any other respected elder. A newspaper ad or a
public service message on TV without ground level work through opinion leaders will fail to be sustainable in the long run.
For better targeting a need based IEC actions to be implemented categorized into following phases.
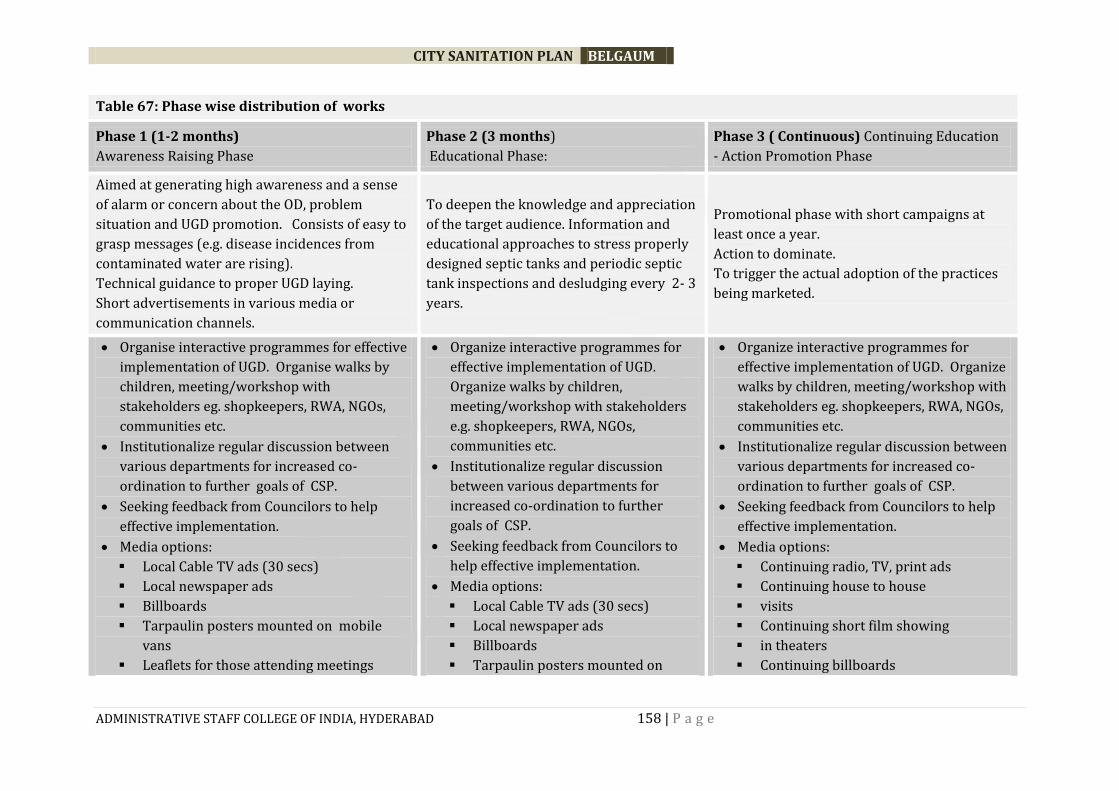
CITY SANITATION PLAN BELGAUM
ADMINISTRATIVE STAFF COLLEGE OF INDIA, HYDERABAD 158 | P a g e
Table 67: Phase wise distribution of works
Phase 1 (1-2 months)
Awareness Raising Phase
Phase 2 (3 months)
Educational Phase:
Phase 3 ( Continuous) Continuing Education
- Action Promotion Phase
Aimed at generating high awareness and a sense
of alarm or concern about the OD, problem
situation and UGD promotion. Consists of easy to
grasp messages (e.g. disease incidences from
contaminated water are rising).
Technical guidance to proper UGD laying.
Short advertisements in various media or
communication channels.
To deepen the knowledge and appreciation
of the target audience. Information and
educational approaches to stress properly
designed septic tanks and periodic septic
tank inspections and desludging every 2- 3
years.
Promotional phase with short campaigns at
least once a year.
Action to dominate.
To trigger the actual adoption of the practices
being marketed.
Organise interactive programmes for effective
implementation of UGD. Organise walks by
children, meeting/workshop with
stakeholders eg. shopkeepers, RWA, NGOs,
communities etc.
Institutionalize regular discussion between
various departments for increased co-
ordination to further goals of CSP.
Seeking feedback from Councilors to help
effective implementation.
Media options:
Local Cable TV ads (30 secs)
Local newspaper ads
Billboards
Tarpaulin posters mounted on mobile
vans
Leaflets for those attending meetings
Organize interactive programmes for
effective implementation of UGD.
Organize walks by children,
meeting/workshop with stakeholders
e.g. shopkeepers, RWA, NGOs,
communities etc.
Institutionalize regular discussion
between various departments for
increased co-ordination to further
goals of CSP.
Seeking feedback from Councilors to
help effective implementation.
Media options:
Local Cable TV ads (30 secs)
Local newspaper ads
Billboards
Tarpaulin posters mounted on
Organize interactive programmes for
effective implementation of UGD. Organize
walks by children, meeting/workshop with
stakeholders eg. shopkeepers, RWA, NGOs,
communities etc.
Institutionalize regular discussion between
various departments for increased co-
ordination to further goals of CSP.
Seeking feedback from Councilors to help
effective implementation.
Media options:
Continuing radio, TV, print ads
Continuing house to house
visits
Continuing short film showing
in theaters
Continuing billboards

CITY SANITATION PLAN BELGAUM
ADMINISTRATIVE STAFF COLLEGE OF INDIA, HYDERABAD 159 | P a g e
News releases in print, radio
and TV
Discussions on radio
mobile vans
Leaflets for those attending
meetings
News releases in print, radio
and TV
Discussions on radio
Continuing but less frequent
assemblies, SLF meetings
Continuing news releases on all
platforms
Continuing feature articles
Media: TV, Radio, Door to door, billboards,
leaflets. Mass announcements Budget: 3 – 3.5 lakhs / year
Measurable Parameters of Communication Plan:
Increase awareness
Willingness to psy the costs as contribution and self financing for creation of facilities
Reduce mortality rates due to waterborne disease and unsanitary /unhygienic living habita
Maintenance in the hands of villages/ village committee user group
Reduce tendency for not using facilities by community and laxity in maintenance
Cleanliness in the Wards
Proportion of families adopting household sanitary toilets
Improvement in hygienic behavior, adoption and use of sanitation facilities by children at school and anganwadi level.
Proportion of families practicing hand washing before feeding cooking and after defecation
Reduction in incidences in diarrhea and other water borne diseases.
Proportion of wards contributing towards maintenance charges of common facilities through village committee.
Grouping wards in size of population. Area and social development index for effective training, supervision, media tools, and monitoring.
Eg:
1. Low density : wall paintings, signboards, slogans, Group meetings, Puppet show,
2. Moderate density: wall paintings, signboards, slogans, Group meetings, Puppet show
3. High density : Wall paintings, signboards, slogans, Group meetings/ Roadshows, Mela, School programes
4. Very high density : Wall paintings, signboards, slogans, Group meetings/ Roadshows/ Mela, School programes
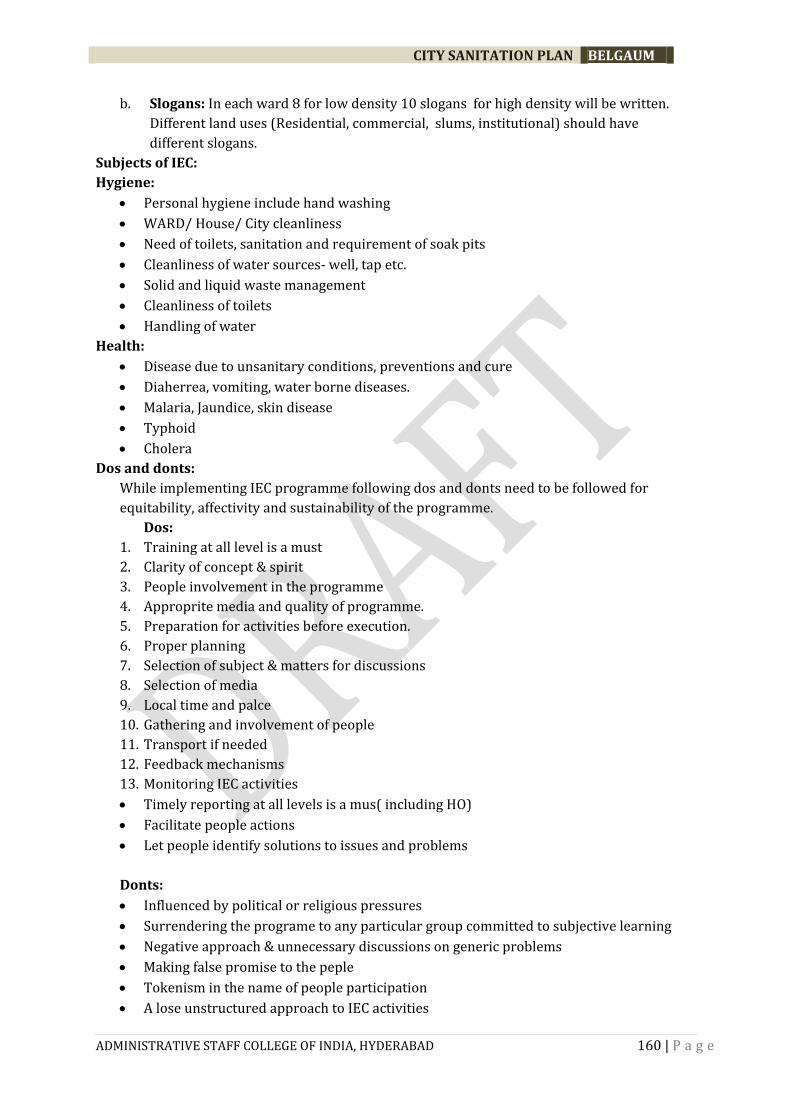
CITY SANITATION PLAN BELGAUM
ADMINISTRATIVE STAFF COLLEGE OF INDIA, HYDERABAD 160 | P a g e
b. Slogans: In each ward 8 for low density 10 slogans for high density will be written.
Different land uses (Residential, commercial, slums, institutional) should have
different slogans.
Subjects of IEC:
Hygiene:
Personal hygiene include hand washing
WARD/ House/ City cleanliness
Need of toilets, sanitation and requirement of soak pits
Cleanliness of water sources- well, tap etc.
Solid and liquid waste management
Cleanliness of toilets
Handling of water
Health:
Disease due to unsanitary conditions, preventions and cure
Diaherrea, vomiting, water borne diseases.
Malaria, Jaundice, skin disease
Typhoid
Cholera
Dos and donts:
While implementing IEC programme following dos and donts need to be followed for
equitability, affectivity and sustainability of the programme.
Dos:
1. Training at all level is a must
2. Clarity of concept & spirit
3. People involvement in the programme
4. Approprite media and quality of programme.
5. Preparation for activities before execution.
6. Proper planning
7. Selection of subject & matters for discussions
8. Selection of media
9. Local time and palce
10. Gathering and involvement of people
11. Transport if needed
12. Feedback mechanisms
13. Monitoring IEC activities
Timely reporting at all levels is a mus( including HO)
Facilitate people actions
Let people identify solutions to issues and problems
Donts:
Influenced by political or religious pressures
Surrendering the programe to any particular group committed to subjective learning
Negative approach & unnecessary discussions on generic problems
Making false promise to the peple
Tokenism in the name of people participation
A lose unstructured approach to IEC activities
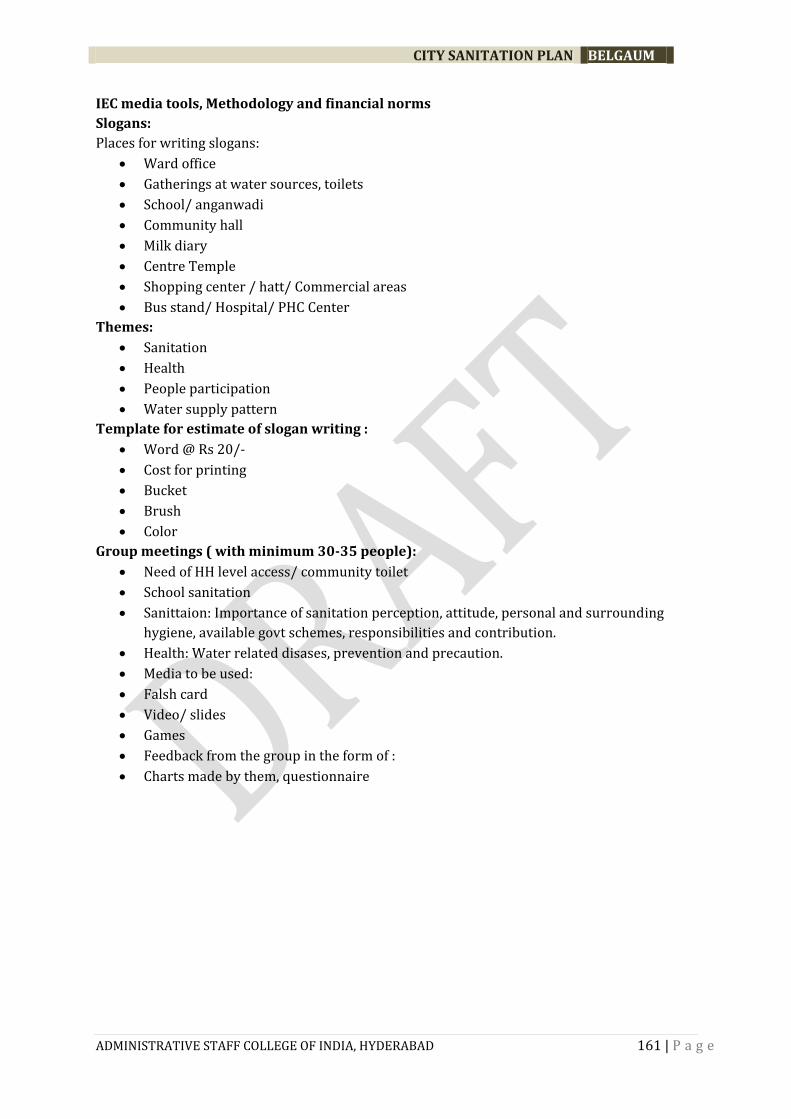
CITY SANITATION PLAN BELGAUM
ADMINISTRATIVE STAFF COLLEGE OF INDIA, HYDERABAD 161 | P a g e
IEC media tools, Methodology and financial norms
Slogans:
Places for writing slogans:
Ward office
Gatherings at water sources, toilets
School/ anganwadi
Community hall
Milk diary
Centre Temple
Shopping center / hatt/ Commercial areas
Bus stand/ Hospital/ PHC Center
Themes:
Sanitation
Health
People participation
Water supply pattern
Template for estimate of slogan writing :
Word @ Rs 20/-
Cost for printing
Bucket
Brush
Color
Group meetings ( with minimum 30-35 people):
Need of HH level access/ community toilet
School sanitation
Sanittaion: Importance of sanitation perception, attitude, personal and surrounding
hygiene, available govt schemes, responsibilities and contribution.
Health: Water related disases, prevention and precaution.
Media to be used:
Falsh card
Video/ slides
Games
Feedback from the group in the form of :
Charts made by them, questionnaire

CITY SANITATION PLAN BELGAUM
ADMINISTRATIVE STAFF COLLEGE OF INDIA, HYDERABAD 162 | P a g e
7.4.2 FINACIAL REQUIREMENTS AND FINANCING MECHANISMS
Funds from central government schemes provide majority of funding for these schemes. These funds may be inadequate to achieve the goals of providing 'improved' sanitation envisioned as per the City sanitation Vision. To fill the gap in financing of sanitation infrastructure, One way is to find funds in government plan and Budget allocations, the other is to look for public and private financing, including public and private international funds. These are complementary and non-competing sources. Research in economics has shown over past several decades that in many situations, especially in infrastructure and 'facilitating' investments, public investments can crowd-in and increase private investments. Sanitation has both public good and private good aspects to it. It should be funded by both public and private finances. A model where public funds provide the back-end and private funds provide the front-end can fill the gap in sanitation financing. Government-Business-Consumer, model can be used. This may include plan and budgetary funds, state funds, municipal and local government funds, and private funds to build sewers and sewage treatment infrastructure of high quality. This may be done on a build-operate-transfer (BOT) basis, or on a lease-hire-to-businesses basis - like telecom, electricity or transport infrastructure in some places. Linking into existing schemes Business operators could raise their own finances to deliver services, and government and democratic institutions can play a regulatory role to ensure these 'natural' monopolies provide good service at reasonable price to consumers. These businesses may also help households find long-term financing for access to toilets and sustainable sewage treatment systems that have long durability andhigh quality. For different aspects of sanitation fund convergence is very important. Links between the plans and ongoing schemes and programmes will only happen if local stakeholders take control of programmes and schemes, review their effectiveness and improve them where necessary. Many government-funded schemes for infrastructure development in low-income areas focus more on the disbursement of funds than the quality of work, but their effectiveness and sustenance should be ensured by:
Supervising and monitoring them closely Including them in the overall strategy for sanitation in the town, and improving their
Links to other services and programmes Ensuring that resources are deployed where they are most needed Consulting beneficiaries and responding to what they actually want Ensuring that they include any necessary ‘software’ components such as hygiene education (this is especially important for latrine-building schemes).
For this purpose, it may be necessary to bring in an NGO or other agency to work alongside the main implementing agency. BCC has to have some stakeholder meetings led by its commissioner and can identify the quantum of the money available under various possible schemes for furthering sanitation Goals and can be utilized in a very systematic manner as indicated below.

CITY SANITATION PLAN BELGAUM
ADMINISTRATIVE STAFF COLLEGE OF INDIA, HYDERABAD 163 | P a g e
Table 68 Fund Convergence for CSP
Components Capaci
ty
buildin
g
undue
NUSP
RA
Y
13t
h
FC
Privat
e
Secto
r/
NGO
etc
BRG
F
MLA
/
MP
Fun
d
SSA
/
ICD
S
National
Sustaina
ble
Habitat
National
Livelihoo
ds
Mission
JNURM/UIDS
MT
BPL Toilet
(HH level)
APL Toilet
(HH Level)
School
Toilet
Anganwadi
toilet
Community
Complex
Public
Toilets
Technical
support
Liquid
Waste –
treatment
and disposal
Solid waste
– treatment
and disposal
IEC
Capacity
building
MSW D2D
collection
MSW
Transportati
on
Water
bodies O
&M

CITY SANITATION PLAN BELGAUM
ADMINISTRATIVE STAFF COLLEGE OF INDIA, HYDERABAD 164 | P a g e
Storm
drains
For the effective implementation of the city sanitation plan, it is anticipated that funds will be sourced from following channels:
The Central Grants (via ministry of Urban Development and Ministry of HUPA, GOI. Individual and institutional contributions. State’s own budget. Connection cost of UGD to be collected and deposited for O&M of STPs and should be
managed by CSTF. Promote public-private partnership for key activities identified in the city sanitation
plan. PPP in public and community toilets, CSR funds and mobilize private people in maintaining school toilets.
Funding projects wherever possible from existing schemes such as JNNURM and UIDSSMT.
Funding from Bilateral and multilateral agencies can also be explored. Providing assistance for the preparation of Detailed Project Report (DPR) as per city
sanitation plan as soon as requests for funding are received; SJSRY/ NULM Affordable housing in partnership Interest subsidy scheme for the urban poor - BPL USHA- Urban statistics and HR assessment ILCS Other Health and education programs for IEC Schemes for Minority population MoUD have created a Community Participation Fund (CPF) under which a community
can conceive a project on municipal solid waste and submit it through the local municipality to the Union Government. Funds to the tune of Rs. 9.5 lakh can be granted with community contributing 5%, in case of slums and 10% in case of others. However, fifty-one per cent of voters living in the locality there will have to sign a document indicating their interest and support to the project. Urban Local Bodies could forward such proposals to GOI.

CITY SANITATION PLAN BELGAUM
ADMINISTRATIVE STAFF COLLEGE OF INDIA, HYDERABAD 165 | P a g e
The financial requirements have been estimated in terms of the need of sanitation situation in
Belgaum.
Table 69 Financial Requirements and Mechanisms
S. No.
Existing situation
Proposed action / budget head
Number of units (seats) for CSP implementation period (2012-2016)
cost per unit
Total cost
1 No of places of open defecation
Construction of Sulabh toilets
2 Construction of Individual toilets
*3 Construction of Urinals for schools
Amount in Crores
4 No proper disposal of effluent from toilets
*(a) connection to sewer line or drain
5 disposal of effluent from septic tanks
*(b)connection to sewer line
6 Recycling and reuse of wastewater
At least 30% wastewater is recycled and reused(61.13MLD)
Solid waste Management in (Quantity) Total quantity Quantity that needs to be
considered
1 DTD collection 100%
2 Composting At least 20% waste should be composted
3 Generation of fuel or electricity by waste recycling
at least 5% waste is processed and is used as a fuel
4 Recycling and reuse of dry waste
Recycling and reuse of all related waste through rag pickers or through
agencies or NGO
Environment & Awareness
1 Water resources that are polluted Study of water pollution levels and suggestive measure to arrest pollution
25 lakh per
Zone(approx.)

CITY SANITATION PLAN BELGAUM
ADMINISTRATIVE STAFF COLLEGE OF INDIA, HYDERABAD 166 | P a g e
2 NGOs working with peoples participatory approach
Encouragement to such NGOs and assistance if required.
12 lack per
Zone(approx.)
3 NGOs or agencies working towards citizen education
Additional financial assistance if required to few
3 lakh per
Zone
(approx.)
Note : Subject to changes with regard to the approval of CSTF & ULB members
Note :- Cumulative figure will be considered after the discussion with CSTF members and
the final figures will be ascertained in the final draft CSP
INFORMATION BOX 13: PROPOSED SCHEME FOR MECHANICAL AID FOR CLEANING OF
SEWERS AND SEPTIC TANKS (SMACSS)
a. The National Advisory Council (NAC) has observed that the shameful practice of manual
scavenging persists in India, despite being outlawed. The NAC has identified the need for a
special focus to liberate our society from the norms on social exclusion and discrimination
along with an action plan with full ownership of participation of the persons involved in manual
scavenging. The Government of India has enacted the Employment of Manual Scavengers and
Construction of Dry Latrines (Prohibition) Act, 1993. It serves as a primary instrument in the
liberation of a broken people enslaved to a life of indignity enforced through ideologies of
descent based work and caste. The Act defines a manual scavenger as “a person engaged in or
employed in manual carriage of human excreta”.
b. However, the existing definition of manual scavenging as per the Act, 1993 does not cover
manual cleaning of septic tanks and sewers cleaning. It is essential that such cleaning
operations be included in the definition of manual scavenging since there they involve similar
issues of dignity as well as health related risks. Therefore, the definition of manual scavenging
may be modified as “a person engaged or employed, whether by an individual or an urban local
body or any other public or private agency, for manual cleaning, carrying or disposing
untreated human excreta, including a latrine, a tank, in a drain or a sewer line”.
There are established technologies that convert human excreta in to manure in a scientific manner.
Such decomposed material and its carriage may not be covered in the definition of scavenging.
c. Accordingly, the MoUD intends to formulate a scheme for facilitating the state government and
ULBs in ensuring cleaning of sewers and septic tanks/any latrines mechanically. The scheme
will facilitate funding for the procurement of suction machines for cleaning of septic tanks and
suction-cum-jetting machines for cleaning of sewers in all cities/towns in the Country. The
scheme is envisaged on ‘All Town’ basis. All 5161 cities and towns as per 2001 census will
qualify for assistance under the proposed scheme.
d. FINANCING PATTERN
i. Funds would be provided to the SLNA through State Governments / UTs in the form of
100% grant for capital investment for the procurement of the equipment and machinery. No
funds would be provided for operation and maintenance of sewerage and onsite sanitation
systems including maintenance of these machines which shall be borne by the ULBs/State
Govts.

CITY SANITATION PLAN BELGAUM
ADMINISTRATIVE STAFF COLLEGE OF INDIA, HYDERABAD 167 | P a g e
ii. The operation and maintenance of sewerage and onsite sanitation system (septic tanks,
dry latrines etc) including running and maintenance of machinery shall be the responsibility
of the ULB/Water Supply and Sanitation (WSS) Agencies/Boards. If necessary, these
activities may be outsourced by the ULBs/ WSS Agencies/Boards to private service
providers/ entrepreneurs over a specified period as per the agreement to be executed
between ULBs & private entrepreneurs. The O&M cost including desilting, cleaning of sewers
& manholes, de-sludging of septic tanks and maintenance of vehicles would be borne by the
ULBs.
iii. The requirement of funds for the purchase of suction machines and suction-cumjetting
machines for cleaning of sewers and septic tanks for all 5161 towns have been assessed as
Rs. 4949 Crores.
iv. Funding will be available for the procurement of new machines only.
CRITERIA FOR PRIORITIZATION OF TOWNS
Priority would be given to towns with the following characteristics.
1. State capitals irrespective of the population
2. Pilgrim centre/heritage towns
3. Culturally important towns
4. ULBs in which the practice of manual scavenging is pre-dominant
5. ULBs where there are no machines for sewer and septic tank cleaning operations.
MONITORING MECHANISM
Independent Evaluation and Monitoring Agencies should be appointed by the State Govt. at State
level/city level in line with the monitoring mechanism envisaged under JNNURM. The Independent
Evaluation and Monitoring Agencies will monitor the status Of the procurement of the machines,
cleaning operations of the sewer and septic tanks and the status of the action taken on the
eradication of manual scavenging by the ULBs and report to the to the Municipal
Administration/State Govts which will forward the same to SLNAs. The SLNA will forward the status
of the implementation of the scheme to the Ministry of Urban Development.
The concerned ULB/Head of Water Supply and Sanitation Agencies, who are responsible for O&M of
sewerage and onsite sanitation facilities shall furnish an action plan each year to the Ministry of
Urban Development through Directorate of Municipal Administration and SLNA regarding action
taken/action to be taken for elimination of manual scavenging and the number of employees
engaged in manual cleaning and mechanical cleaning of sewers and septic tanks in the next 2 years
from the date of purchase of machines.
7.4.3 INSTITUTIONAL ARRANGEMENT AND RESPONSIBILITY
The ULBs are responsible for managing the cycle of sanitation and public health within their
cities, in coordination with various departments. Already there are number of provisions to
practice and implement in achieving sanitation goals and some additional recommendations are
as follows:
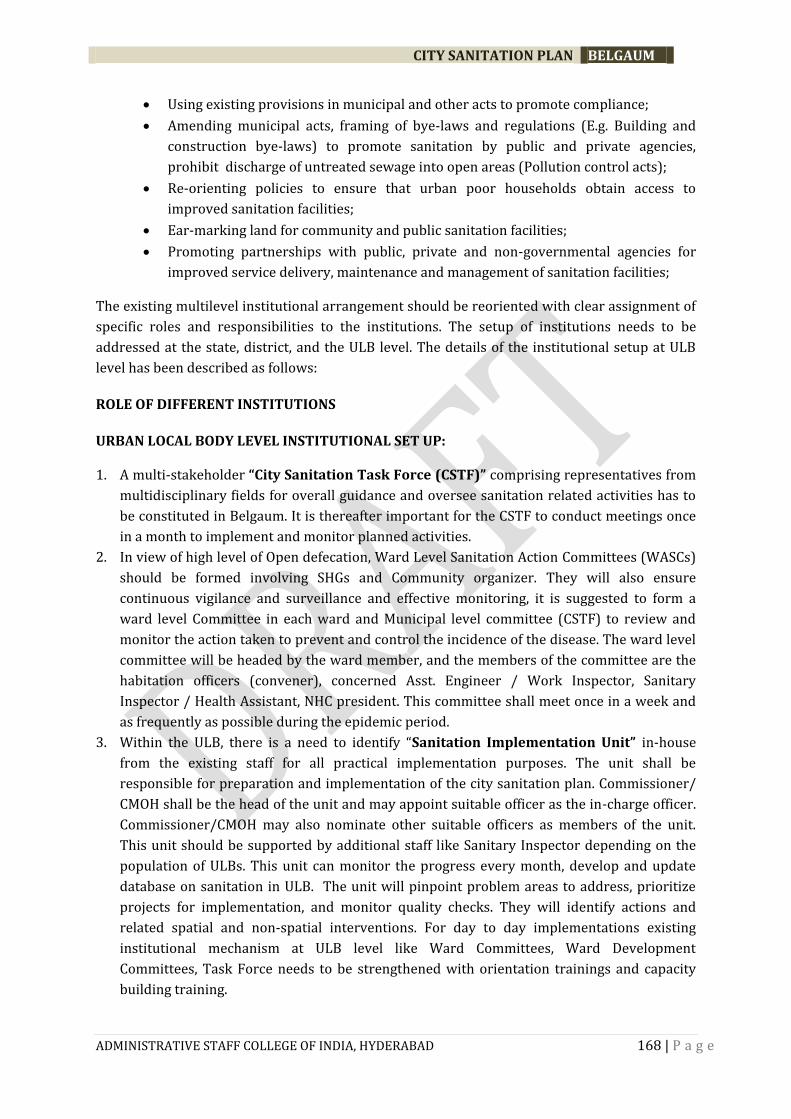
CITY SANITATION PLAN BELGAUM
ADMINISTRATIVE STAFF COLLEGE OF INDIA, HYDERABAD 168 | P a g e
Using existing provisions in municipal and other acts to promote compliance;
Amending municipal acts, framing of bye-laws and regulations (E.g. Building and
construction bye-laws) to promote sanitation by public and private agencies,
prohibit discharge of untreated sewage into open areas (Pollution control acts);
Re-orienting policies to ensure that urban poor households obtain access to
improved sanitation facilities;
Ear-marking land for community and public sanitation facilities;
Promoting partnerships with public, private and non-governmental agencies for
improved service delivery, maintenance and management of sanitation facilities;
The existing multilevel institutional arrangement should be reoriented with clear assignment of
specific roles and responsibilities to the institutions. The setup of institutions needs to be
addressed at the state, district, and the ULB level. The details of the institutional setup at ULB
level has been described as follows:
ROLE OF DIFFERENT INSTITUTIONS
URBAN LOCAL BODY LEVEL INSTITUTIONAL SET UP:
1. A multi-stakeholder “City Sanitation Task Force (CSTF)” comprising representatives from
multidisciplinary fields for overall guidance and oversee sanitation related activities has to
be constituted in Belgaum. It is thereafter important for the CSTF to conduct meetings once
in a month to implement and monitor planned activities.
2. In view of high level of Open defecation, Ward Level Sanitation Action Committees (WASCs)
should be formed involving SHGs and Community organizer. They will also ensure
continuous vigilance and surveillance and effective monitoring, it is suggested to form a
ward level Committee in each ward and Municipal level committee (CSTF) to review and
monitor the action taken to prevent and control the incidence of the disease. The ward level
committee will be headed by the ward member, and the members of the committee are the
habitation officers (convener), concerned Asst. Engineer / Work Inspector, Sanitary
Inspector / Health Assistant, NHC president. This committee shall meet once in a week and
as frequently as possible during the epidemic period.
3. Within the ULB, there is a need to identify “Sanitation Implementation Unit” in-house
from the existing staff for all practical implementation purposes. The unit shall be
responsible for preparation and implementation of the city sanitation plan. Commissioner/
CMOH shall be the head of the unit and may appoint suitable officer as the in-charge officer.
Commissioner/CMOH may also nominate other suitable officers as members of the unit.
This unit should be supported by additional staff like Sanitary Inspector depending on the
population of ULBs. This unit can monitor the progress every month, develop and update
database on sanitation in ULB. The unit will pinpoint problem areas to address, prioritize
projects for implementation, and monitor quality checks. They will identify actions and
related spatial and non-spatial interventions. For day to day implementations existing
institutional mechanism at ULB level like Ward Committees, Ward Development
Committees, Task Force needs to be strengthened with orientation trainings and capacity
building training.

CITY SANITATION PLAN BELGAUM
ADMINISTRATIVE STAFF COLLEGE OF INDIA, HYDERABAD 169 | P a g e
4. The Municipal level committee shall be headed by the Chairperson with the members being
the Municipal Commissioner (Convener), CMHO, ME, CDS President, Local NGO, DM&HO or
his deputee. This committee shall meet once in every fifteen days and as frequently and as
possible during the epidemic period
The functions of the unit will be:
To conduct a baseline survey on city sanitation and update regularly (once in two
years)
To prioritize projects for implementation, monitor quality checks identified under
CSP and identify actions and related spatial and non-spatial interventions.
To develop city wide communication strategy and conduct city wide total sanitation
campaign.
To ensure intra departmental coordination of ULB for sanitation promotion
To develop network with several government departments and other agencies for
promoting healthy & environmentally sound sanitation.
To manage all the process like procurement, contracting etc. for sanitation projects
and be responsible for implementation, monitoring and evaluation of the
programme. Develop local sanitation and hygiene regulations in consultation with
stakeholders; establish standards and norms; inform citizens of their rights and
duties under existing sanitation legislation/regulations; and set up mechanisms for
monitoring and enforcing their implementation.
Clarify Roles and improve agency coordination
Streamlining policies so as to develop and adopt local septage ordinance, Institute
regular desludging mechanism, PPP promotion and regulation, ULB introduce User
charges, Update and amend regulation in building bye laws.
Mobilize Govt support Capital but local groups to manage O &M.
Build political support through exposure visits workshops.
Engaging civil societies to end OD.
For day to day implementations existing institutional mechanism at ULB level like Ward
Committees, Ward Development Committees, Task Force needs to be strengthened with
orientation trainings and capacity building training.
Poverty wing of ULB should be responsible to design, implement, and monitor the sanitation
promotion programmes, converging the source of funds and preparing the budget. ULB should
also plan and budget for the operation and maintenance of sanitation systems. It is also
responsible for assisting households to provide their own sanitation and to build their own
toilet facilities. Specific responsibilities include –
To design integrated planning and communication strategy for City sanitation
promotion.
To provide access to sanitation to all urban population
To make communities aware of the importance of sanitation in terms of health.
To launch together with the communities, health and hygiene promotion
programmes.
CITY SANITATION PLAN BELGAUM
ADMINISTRATIVE STAFF COLLEGE OF INDIA, HYDERABAD 170 | P a g e
To monitor the health of communities.
Establish and improve septage management requirements and guidelines
Providing technical support, guidance and training .
To assist households to operate and maintain sanitation facilities
To assist Ward Education Committee for the improvement of school
infrastructure, including sanitation and for implementing School health promotion
programmes to create safe and healthy school.
To coordinate all the internal departments like PWD, Sanitation, Health and
Education, and also involving the Community Based Organizations, Welfare
Associations, youth clubs, market committees etc. for Total Sanitation Approach
and Campaign in the ULB, and make the city open defecation free.
To develop and design ward wise, & slum wise incentive schemes for reaching the
ultimate goal of Nirmal Sahar
STATE URBAN SANITATION CELL (SUSC)
DMA needs to be strengthened for the purpose of functioning as a Sanitation Nodal Agency with
a dedicated Sanitation Cell. The Cell will have a complete office set up with the following
constitution, terms of reference. (To elaborate on Roles and responsibilities, on investment
flows, Policy and standards setting, Asset Creation, Financing of Capital Investments, Planning
and implementation, Operation and maintenance, Environmental Regulation, Monitoring and
Evaluation, Land Use / Building regulations, Ongoing programs, Implementation, Execution,
Legal Regulatory Responsibility, Capacity Building and IEC).
Constitution of State Urban Sanitation Cell (SUSC):
Creation of a strategic urban sanitation cell at DMA, GoK, to be headed by a “Director”
equivalent officer with a fixed tenure of five of mission period for better coordination
and integrated development.
SUSC is expected to provide overall direction and strategic support to ULBs and
coordinate with state level organizations in achieving the strategy objectives in a time-
bound manner.
SUSC will support cities in preparing CSPs by giving overall direction, frame work etc
with in the first year of mission period.
It will have three strategic wings (Ref: fig no 23) with specific and designated expertise
to offer and support in achieving the mission objectives. Each wing will have two expert
staff in required field with the support from “Sanitation Fund”.
SUSC will be central coordinating body and need to coordinate with State, Districts and
ULBs. IEC wing should work closely with State Health Department, Education
Department and design awareness programmes for convergence. Engineering wing and
MIS wings should coordinate regularly with Town and Country Planning Department to
ensure all convergence and effective planning.
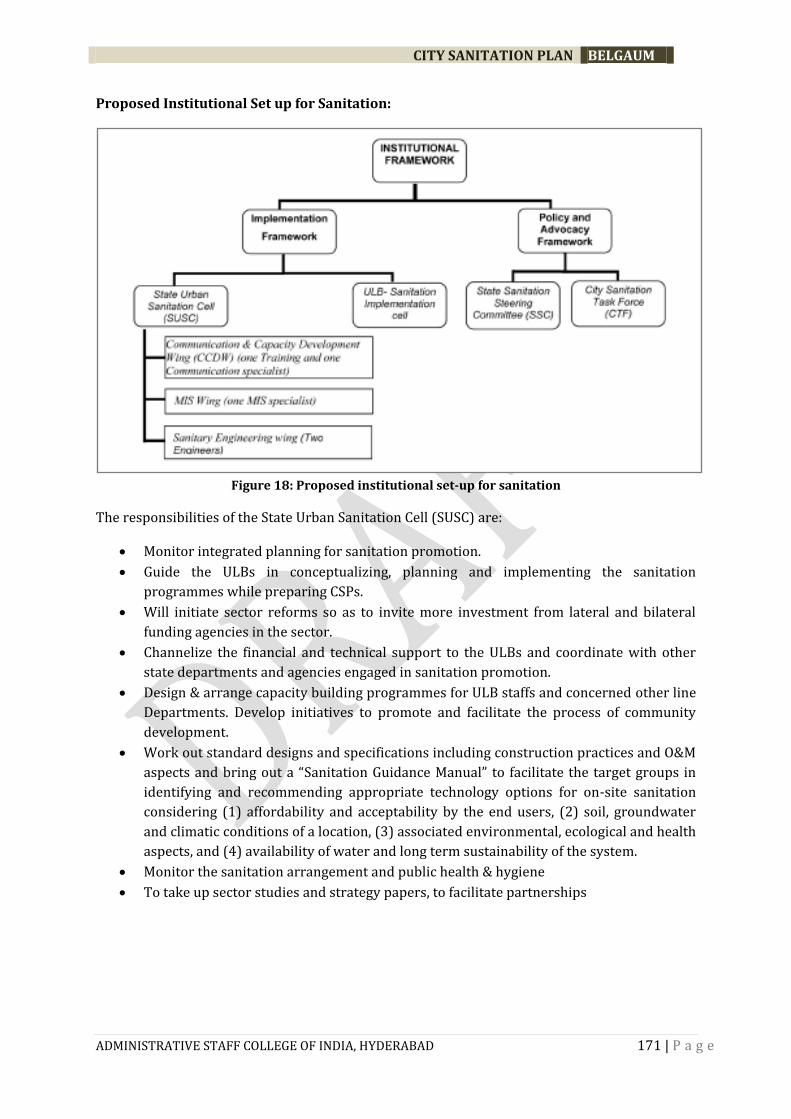
CITY SANITATION PLAN BELGAUM
ADMINISTRATIVE STAFF COLLEGE OF INDIA, HYDERABAD 171 | P a g e
Proposed Institutional Set up for Sanitation:
Figure 18: Proposed institutional set-up for sanitation
The responsibilities of the State Urban Sanitation Cell (SUSC) are:
Monitor integrated planning for sanitation promotion.
Guide the ULBs in conceptualizing, planning and implementing the sanitation
programmes while preparing CSPs.
Will initiate sector reforms so as to invite more investment from lateral and bilateral
funding agencies in the sector.
Channelize the financial and technical support to the ULBs and coordinate with other
state departments and agencies engaged in sanitation promotion.
Design & arrange capacity building programmes for ULB staffs and concerned other line
Departments. Develop initiatives to promote and facilitate the process of community
development.
Work out standard designs and specifications including construction practices and O&M
aspects and bring out a “Sanitation Guidance Manual” to facilitate the target groups in
identifying and recommending appropriate technology options for on-site sanitation
considering (1) affordability and acceptability by the end users, (2) soil, groundwater
and climatic conditions of a location, (3) associated environmental, ecological and health
aspects, and (4) availability of water and long term sustainability of the system.
Monitor the sanitation arrangement and public health & hygiene
To take up sector studies and strategy papers, to facilitate partnerships

CITY SANITATION PLAN BELGAUM
ADMINISTRATIVE STAFF COLLEGE OF INDIA, HYDERABAD 172 | P a g e
7.5. MONITORING AND EVALUATION
7.5.1 MONITORING AND REVIEW
Monitoring is imperative to verify whether objectives of sanitation plan have been achieved.
Elements of this plan will be monitored and reported and will rely on the provision of a range of
quantitative and qualitative information. Monitoring and evaluation of sanitation progamme is
of higher relevance and importance as Urban development Ministry, Government of India ranks
cities on sanitation and gives Nirmal Shahar Puraskar based on the cities performance. The City
Sanitation Task Force should be made be responsible for monitoring and reviewing the
implementation of the CSP.
At ULB level, City Sanitation Task Force will monitor the programme in support of Standing
Committees (Health, Sanitation, Public Works, and Water supply) based on Implementation
Agency data, citizens’ groups feedback, and primary Field Visits. Periodic verification of following
Impact and Monitoring indicators at ULB level are suggested.
INFORMATION BOX 14: TOOLS TO MEASURE 100% SANITATION MILESTONE
ACHIEVEMENTS
To measure 100% Sanitation Milestone achievements, a number of tools apart from 19
indicators of City Sanitation Ranking can be considered:
a. Impact Indicators
Reduction in incidence of diseases, e.g. - percentage children less than 36 months of
age with diarrhea in last two weeks
Quantity of water used per capita per day
% of child caregivers, food prepares with appropriate hand-washing behavior.
Use of safe methods for disposal of infant excreta
Knowledge of danger of unsafe excreta disposal and hand washing practice
Demand for new toilets within towns and from neighboring communities
% of toilets upgraded with own funds by households after monsoon/filling up of pit
b. Monitoring indicators
% of households with access to sanitary latrines: public and personal separately
% constructed water supply facilities maintained by the communities served
% households using safe drinking water regularly (public and personal separately)
Use of toilets by household members (esp. men, aged, disabled, children under 5)
Range of available affordable options for toilets.
In case of sewage effluent, following standards need to be met and a mechanism to monitor
internally by CSTF by way of protocol adoption.

CITY SANITATION PLAN BELGAUM
ADMINISTRATIVE STAFF COLLEGE OF INDIA, HYDERABAD 173 | P a g e
Table 70: Comparison of Standards (issued by CPCB) with effluent values
Standard for
discharge
into inland
surface
water.
Standard for
reuse of
effluent for
irrigation
SIBF
(effluent)
MSF
effluent
DEWATS
Effluent
BOD (mg/l) 30 100 6 197 17
COD (mg/l) 250 NA 20 688 50
The review period of the proposed action plan for CSP is five years from the formal adoption
date. Progress monitoring and reporting will be conducted by the council monthly, by the
taskforce quarterly and by the state Government bi-annually. As a result of the review, some
revisions to the targets may be required in order to:
a) Update or remove those targets that have proven to be unclear, unable to be adequately
measured, unworkable, or out of date in their allocation of responsibility for action.
b) Reflect changes in the wider wastewater management/sanitation service provision
landscape.
c) Better reflect progress against the targets and, where necessary, set new targets.
d) Better reflect the current state of knowledge of wastewater management/sanitation
facilities.
e) GIS is also very powerful tool to make robust sanitation related information and
updating with regular pictures for centralized monitoring. RAY programme can be
utilize fir this purpose.
7.5.2 LAUNCHING REWARD SCHEME:
Periodic rating of wards in respect of Sanitation, and recognition of best performers by
instituting Awards.
Open Defecation Free
a. Totally free from open defecation;
b. Sanitary collection of 100 percent human excreta and wastes
c. Proper removal and treatment of all wastewater
Wastewater and Drainage safely managed
a. All grey water collected and disposed off safely;
b. All storm water is properly managed
Solid Waste collected and disposed off fully and safely
a. 100 percent of solid waste is collected regularly;
b. Solid wastes are disposed off safely (including treatment and re-use)

CITY SANITATION PLAN BELGAUM
ADMINISTRATIVE STAFF COLLEGE OF INDIA, HYDERABAD 174 | P a g e
7.5.3 INCENTIVES AND DISINCENTIVES BY MC/NPS
The incentives within the City Sanitation Plans could provide infrastructure funding to those
communities that successfully meet reward scheme or by way of incentives that may include:
The provision of collective ‘in kind’ rewards to motivators that successfully support
wards and neighbourhoods meeting reward scheme.
Publicly recognizing those wards and neighbourhoods that achieve ‘excreta free’, ‘litter
free’ or ‘foul water free’ status.
Placing a signboard to this effect at the entrance to the neighbourhood / ward.
The disincentives the ULBs may consider within the CSP include:
Exercising all provisions within the Municipal Act/ Water Act to levy fines, bills for costs
incurred and instigate court proceedings for encroachments, releases of industrial waste
or effluent, illegal slaughter houses, markets, burial grounds, and the provision of
essential water/sewerage/drainage connections.
The provision of ‘fine’ for all individuals that dispose excreta, litter or foul water in an
unhygienic manner in public spaces (Polluter pay principle).
Sanctions against harmful actions and/or failure to act - for instance, a ban, supported
by fines on the use of untreated sewage to irrigate crops/water bodies.

CITY SANITATION PLAN BELGAUM
ADMINISTRATIVE STAFF COLLEGE OF INDIA, HYDERABAD 175 | P a g e
GLOSSARY
1. Activated sludge: An aerobic treatment process in which oxygen and micro-organism
concentrations in wastewater are artificially elevated to facilitate rapid digestion of
biodegradable organic matter.
2. Aerated pond or lagoon: A natural or artificial wastewater treatment pond in which
mechanical or diffused air aeration is used to supplement the natural reoxygenation
processes.
3. Aerobic treatment: Treatment of wastewater with the help of micro-organisms that
rely on oxygen.
4. Anaerobic digestion: Decomposition of organic material by anaerobic bacteria in the
absence of air.
5. Anaerobic lagoon: A system for treatment of high-strength wastewater and sludge that
involves retention under anaerobic conditions.
6. Biochemical oxygen demand: A measure of the organic pollutant strength of
wastewater.
7. Biosolids: See Sewage sludge.
8. Blackwater: Wastewater discharge from toilets.
9. Bucket latrine: A traditional but unhygienic form of sanitation in which feces is
deposited into a bucket which is collected regularly (usually at night) and taken away
(usually by ‘sweepers’).
10. Composting latrine: A latrine designed to receive both feces and waste vegetable
matter with the aim of reducing moisture content and achieving a carbon-to-nitrogen
ratio that promotes rapid that promotes rapid decomposition.
11. Dry latrines: All forms of latrines that do not require water for flushing.
12. Desludging: Removal of sludge or settled solid matter from treatment tanks such as
septic/Imhoff tank, interceptor tank or sedimentation tanks.
13. Disposal: Discharge, deposition or dumping of any liquid or solid waste onto land or
water so that it may enter the environment.
14. Domestic sewage: All forms of wastewater derived from residential properties, as well
as blackwater and greywater from commercial and institutions buildings.
15. Dry sanitation: Disposal of human excreta without the use of water for flushing or anal
cleansing.
16. Ecological sanitation (ecosan): A form of dry sanitation that involves separation of
feces and urine in order to facilitate recycling of nutrients in local agricultural systems.
17. Effluent: Any form of wastewater or liquid waste that flows from an operation or
activity.
18. Excreta: Feces and urine.
19. Fecal sludge: The undigested sludge that is collected from pit latrines and leach pits.
20. Greywater (also known as sullage): Wastewater produced by washing and bathing
activities.
21. Lagoon: See technology data sheet on ‘Wastewater and Fecal Sludge Treatment: Waste
Stabilization Ponds’ (page 104).
22. Leachfield: A trench filled with sand, soil, gravel and brickbats for disposal of septic
tank overflow into the surrounding soil.
CITY SANITATION PLAN BELGAUM
ADMINISTRATIVE STAFF COLLEGE OF INDIA, HYDERABAD 176 | P a g e
23. Leach pit (sometimes known as a cesspit): An underground tank that is used where
there is no sewer and household wastewaters are drained into them to permit leaching
of the liquid into the surrounding soil.
24. Night soil: Human excreta, with or without anal cleansing material, which are deposited
into a bucket or other receptacle for manual removal.
25. On-plot sanitation: A sanitation system that is wholly contained within the plot
occupied by a private dwelling and its immediate surroundings. Commonly, on-plot
sanitation is equivalent to ‘household latrine’, but may also include facilities shared by
several households living together on the same plot.
26. On-plot facilities: The components of a sanitation system located within a
householder’s plot.
27. Off-site sanitation: A system of sanitation that involves collection and transportation of
waste (wastewater either by sewerage or septage/fecal sludge by vacuum truck) to a
location away from the immediate locality.
28. Pathogens: Micro-organisms such as bacteria, viruses and protozoa that cause disease.
29. Percolation rate: The rate at which liquids move through soil.
30. Pit latrine: A form of on-plot sanitation with a pit for accumulation and decomposition
of excreta from which liquid infiltrates into the surrounding soil.
31. Pour flush toilet: A type of latrine where a water seal trap is used to prevent smells and
to reduce insects.
32. Sanitation: Interventions (usually construction of facilities such as latrines) that
improve the management of excreta and promote sanitary (healthy) conditions.
33. Septage: Mixture of wastewater and sludge removed from a septic tank during cleaning
operations.
34. Septic tank: A form of on-plot sanitation for the anaerobic treatment of
sewage/blackwater.
35. Sewage: A mixture of wastewater from all urban activates from residential, commercial
properties. It may also contain a component of industrial wastewater.
36. Sewer: A conduit, usually a pipe, which is used to collect and convey wastewater away
from its point of production to its point of disposal.
37. Sewage sludge (sometimes referred to as biosoilds): A semisolid residue generated
during the treatment of domestic sewage including both solids removed by
sedimentation and biological sludge produced by biological treatment.
38. Sewerage: A network of interconnected sewers in an area, district or town.
39. Soak pit/Soakaway: A pit, typically after a septic tank from where wastewater slowly
seeps into the ground through perforated sides and bottom.
40. Sullage (also known as greywater): Wastewater from bathing, laundry, preparation of
food, cooking, and other personal and domestic activates.
41. Superstructure: Screen or building enclosing a latrine to provide privacy and
protection for users.
42. Suction truck: A vehicle used for mechanized sludge removal from septic tanks and
lined latrine pits.
43. Ventilated improved pit latrine (VIP): A dry latrine system, with a dark interior and a
screened vent pipe to reduce odor and fly problems.
44. Vent pipe: A pipe that facilitates the escape of gases and odors from a latrine or septic
tank.

CITY SANITATION PLAN BELGAUM
ADMINISTRATIVE STAFF COLLEGE OF INDIA, HYDERABAD 177 | P a g e
45. Wastewater: Liquid waste from households or commercial or industrial operations,
along with any surface water/storm water.
46. Wastewater treatment: A combination of physical, chemical and biological processes
to remove suspended solids, dissolved pollutants, and pathogens and render the water
harmless to the environment.
47. Water closet: A pan, incorporating a water seal, in which excreta are deposited before
being flushed away using water.
48. Water seal: Water held in a U-shaped pipe or hemispherical bowl connecting a pan to a
pipe, channel or pit to prevent the escape of gases and insects from the sewer or pit.

CITY SANITATION PLAN BELGAUM
ADMINISTRATIVE STAFF COLLEGE OF INDIA, HYDERABAD 178 | P a g e
ANNEXURE
Annexure1: Technology Option in Urban Sanitation
All sanitation technologies are either ‘’Wet’’ or ’’ Dry’’.
Wet technologies require water as the name indicates flush out the feces and they drain in to a
leach pit, septic tank or sewer- common practice.
Dry technology: Does not require water as the name indicates. This is our age old pit latrine,
ventilated improved pits etc. This is our usually adopted in hilly area where the water table is
pretty deep.
To feel clean water is a must, so wet latrines are preferred by common man.
‘ON SITE’ AND ‘OFF SITE’ SYSTEMS
On site: Retaining waste in a pit or tank.
Off site: Removing waste to a distant place for treatment and disposal or disposal alone. Even in
‘On site’ system periodical removal of sludge/septage is necessary
The conventional offsite disposal system involves collection of the sewage through pipes and
conveying to a sewage treatment plant, treatment and disposal. This is an expensive option,
requires extensive land etc. So the communities were forced to think of alternative low cost
onsite disposal methods of which the most widely used options are ‘Septic tank’ and Twin pit
pour flush latrines.
SEPTIC TANK
A septic tank is a combined sedimentation and digestion tank where sewage is held for one or
two days. During the period, the suspended solids settle down to the bottom. This is
accompanied by anaerobic digestion of settled solids (sludge) and liquid resulting in reduction
in the volume of sludge, reduction in bio degradable organic matter and release of gases like
Carbon dioxide, methane etc. The effluent although clarified to a large extent still contains
appreciable amount of dissolved and suspended organic solids and pathogens. So the effluent is
to be disposed in a very careful way. Because of this unsatisfactory condition of the effluent and
also difficulty in providing proper effluent disposal system, septic tanks are limited to individual
houses, institutions whose contributory population does not exceed so as to reduce the volume
of effluent and thereby reduce the difficulty in treatment. The septic tanks are normally
rectangular in shape and can either be a single tank or double tank. In case of double tank, the
solid concentration is considerably lower and the first compartment is usually twice the size of
the second. The liquid depth is 1-2 m and the length to breadth 2 to 1. Recommend sizes of
septic tanks up to 2 users and for 300 users are given below.

CITY SANITATION PLAN BELGAUM
ADMINISTRATIVE STAFF COLLEGE OF INDIA, HYDERABAD 179 | P a g e
Table 71:Recommended sizes of septic tanks
No: users Length in m Breadth in m Liquid depth in m cleaning
interval of 2-3years
5 1.5 0.75 1.00-1.05
10 2 0.90 1.00-1.40
15 2 0.90 1.30-2.00
20 2.3 1.10 1.30-1.80
50 5.00 2.00 1.00-1.24
100 7.50 2.65 1.00-1.24
150 10.00 3.00 1.00-1.24
200 12.00 3.30 1.00-1.24
300 15.00 4.00 1.00-1.24
Notes: a) The capacities are recommended on the assumption that discharges from water
closet alone are connected to septic tank.
b) A provision of 300 mm should be provided as freeboard.1.00 m + 0.30 m, 1.05 m +
0.30 m etc
c) For population over 100 mm the tank may be divided into independent parallel
chambers for easy maintenance and cleaning.
The Functions
1. Septic tank receives black water and excreta from the toilets.
2. Heavier solids settle to the bottom of the septic tank where they are decomposed by
anaerobic bacteria
3. The digested sludge is store at bottom
4. The lighter solids such as hair, soap and grease float to the surface forming scum.
5. The gases like carbon dioxide, methane and hydrogen sulphide are produced during
anaerobic decomposition and released to the atmosphere through vent.
6. To start with septic tank is filled with water for a depth of about 100 mm and seated
with
Cow dung or sludge from other septic tank
7. Septic tanks are to be cleaned once in 2 to 3 years to remove the accumulated digested
sludge.
Disposal of effluent from the septic tank: Land disposal methods such as soak pits and
dispersion trenches: The land disposal methods largely upon porosity and percolation
characteristics of the soil as the land disposal methods are designed percolation or seepage into
the soil. This also depends on the depth of water table. Soak pits or dispersion trenches shall be
constructed in soils where the percolation rate is between 12 to 25 minutes per cm [Time taken
for percolation of 1 cm depth of water between 12 to 25 minutes] and the depth of water table
is 2.00 m or more from ground level. [The depth we get water when the ground is dug] . If the
water table is high, the dispersion trenches shall be partially or fully above ground level or in a
mound. Dispersion trenches should be 20.00m away from any source of drinking water and also
it should be at least 7.00m away from any house. For soils which have percolation rate more
than 25cm other methods shall be adopted for disposal of effluents.
CITY SANITATION PLAN BELGAUM
ADMINISTRATIVE STAFF COLLEGE OF INDIA, HYDERABAD 180 | P a g e
SOAK PITS
The soak pits may be of any regular shape and filled with rubble or brick bats. Soak pits need be
prepared only when the water table is sufficiently below or when a porous layer underlies an in
previous layer at top. Minimum dimension of the soak pit shall be 1.00m and the depth below
the invert level or inlet pipe surrounding land to avoid flooding.
SOAK PIT OR SEEPAGE PIT
All seepage pits shall have a diameter of 1.00m.
All seepage pits shall be designed as any of the following two types
1. Hollow and lined with acceptable material.
2. Filled with coarse stone or similar material that range from fines, sand, clay or
organic material.
Pits filled with coarse stone are prepared over hollow lined pits
Lining of brick, stone, block or similar materials shall have a minimum thickness of 100
mm and shall be laid with overlapping, tight-butted joints
Below the inlet level, mortar shall be used in the horizontal joints only. Above the inlet,
all joints shall be filled fully with mortar.
For hollow- lined pits, the inlet pipe should extend horizontally at least 300 mm into
the pit with a tee to divert flow downward and prevent washing and eroding the side
wall
A minimum annular space of 150 mm between the lining and excavation wall shall be
filled with crushed rock or gravel varying in diameter from 20 mm to 65 mm and free
from fines, sand, clay, or organic material. The maximum fines in the gravel shall be 2
percent by weight passing through a Standard 10mesh (2.0 millimeter) sieve. Clean
coarse gravel or rock at least 150 mm deep shall be placed in the bottom of each pit.
A structurally sound and otherwise suitable top shall be provided that will prevent
entrance of surface water, dirt or other foreign material, and be capable of supporting
the overburden of earth and any reasonable load to which it is subjected
Access to each hollow –lined pit shall be provided by means of a manhole, not less than
450 mm in minimum horizontal dimension, or by means of an easily removable cover.
The top of the pit shall be covered with a minimum of 150 mm of backfill.
In pits filled with coarse stone, the perforated distribution pipe shall run across each pit.
A layer of crushed rock or gravel shall be used for leveling the distribution pipe.
DISPERSION TRENCHES
Narrow and shallow trenches about 0.5m to 1.00m deep and 0.3m to 1.00m wide excavated to a
slight slope. Open jointed stone ware or concrete pipes 80 to 100 mm diameter are laid in the
trenches over a bed of 15 to 25 cm of washed gravel or crushed stone. The top of pipes shall be
covered by coarse gravel and crushed stone to a minimum depth of 15 cm. The balance portion
may be filled with earth and finished in the form of a mound above the ground to avoid flooding
of trenches during rain.
Width of trench:300 to 600 mm wide
Depth :500to 600 mm

CITY SANITATION PLAN BELGAUM
ADMINISTRATIVE STAFF COLLEGE OF INDIA, HYDERABAD 181 | P a g e
Dispersion pipe: 100 mm diameter open jointed S.W. pipes/ 75mm to 90mm OD
perforated PVC pipes
Maximum length of each trench: 30 m
Spacing of the trench : 1.8 m
Slope of the pipe :1 in 400
Media: 20 to 65 mm size broken stones for a thickness of 150 mm below the pipe.
Separation distance of trees and rooted plants;
Trees and other large rooted plants shall not be allowed to grow near to dispersion
trenches
It is desirable to cover the area over onsite soil absorption systems with lawn grass or
other shallow –rooted plants
Soil absorption systems should not be located under vegetable gardens.
The separation distance of trenches must be at least equal to 3 times the deepest
effective depth of trench with a minimum separation of 370 mm between trenches
POUR FLUSH WATER SEAL LATRINES
Pour flush latrines as the nature indicates, the excreta is hand flushed by pouring about 1.6 to 2
lit of water. The pour flush latrines are with a single leach pit and squatting pan over it. When
the pit in use gets filled up another pit is dug and the squatting platform and the slab is placed
on it.
The first pit is covered with earth and allowed to decay. After one or two years, the digested
excreta is used as a manure. The disadvantage of this system is that desludging has to be done
almost immediately after the pit has been filled up which involved handling of fresh and
undigested excreta. So this is appropriate only if it is desludged mechanically. To tide over this
situation a twin pit design was introduced. When one pit is full, the excreta is diverted into the
second pit. The filled up pit can be conveniently implied after 1⅟₂ to 2 years when most of the
pathogens die off. The sludge can be used as manure.
LEACH PIT
Leach pits serve a dual function of
a) Storage and digestion of excreted solids and
b) Infilteration of waste liquids.
Leach pits are designed based on the following parameters.
1) Solid accumulation rate.
2) Long term infilteration rate.
3) Hydraulic loading.
4) Minimum period required for effective pathogen destruction
5) Optimal pit emptying frequency.
The pits are lined with honey come brick work, open jointed or with perforated burnt clay or
concrete rings. The pits are circular and used alternatively and designed for 3 years filling
period. When one pit is filled it is stopped, the excreta being diverted to second pit. The contents

CITY SANITATION PLAN BELGAUM
ADMINISTRATIVE STAFF COLLEGE OF INDIA, HYDERABAD 182 | P a g e
become lich organic humus, innocuous and free from pathogens as well as smell. When
convenient, it is emptied and contents used as organic manure.
The size of leach pits depends on a number of factors mentioned above. The effective volume
under dry conditions should be at least 0.135 m³ percapita of the house hold for a period of 3
years. In the case of wet pit where water table is high the volume shall be 0.210 m³ per capita of
the house hold for a period of 3 years. Leach pit configuration can be varied to suit site
conditions while the least cost design in a twin circular pits.
Design of pits under different conditions
a) In water logged area: The pit top should be raised by 300 mm above likely level of water
above ground level at the time of water logging. Earth should then be filled will
compacted all round the pits up to 1.00 m distance from the pit up to its top. The raising
of the pit will necessitate raising of the latrine floor also.
b) In high sub soil water level: Where the sub soil water level rises to less than 300 mm
above the likely sub soil water level and earth should be filled all round the pits and
latrine floor raised.
c) In rock strata: In rocky strata with soil layer in between, the leach pits should be
designed as for ordinary leach pit construction with low subsoil water level.
d) Where space is a constraint: Where circular pits of standard sizes cannot be constructed
due to space constraints, deeper pit with smell diameter (not less than 750 mm) or
combined oval square or rectangular pits divided into two equal compartments by a
partition wall may be provided. In case combined pits the partition wall should not have
holes. The partition wall should go 250 mm deeper than the pit lining and plastered on
both sides with cement mortar.
AQUA PRIVY
This is a simplified form of septic tank. This consists of a masonry tank filled with water, a
squatting pan or a platform placed above the tank and ventilation pipe. A long chute or pipe
from the squatting is submerged in the tank water. The excreta falls through this chute or pipe
into the tank and undergoes anaerobic digestion as in a septic tank. The accumulated sludge
(digested) from the tank is to be removed periodically. To compensate for evaporation and
leakage losses and to maintain the water seal. I.e. submergence of chute in the water, water is
added every time after its use.

CITY SANITATION PLAN BELGAUM
ADMINISTRATIVE STAFF COLLEGE OF INDIA, HYDERABAD 183 | P a g e
Annexure 2: Good practices
1. Tiruchirapally (Trichy to most people), the famous temple town of the South, is the fourth-
largest city in Tamil Nadu, and is located on the banks of the Cauvery with a population of just
over a million — of which 25 per cent live in slums. Trichy has 211 “approved” slums and as
many as 75 “unapproved” slums which are located on railway land, Government of India land,
and land belonging to the Waqf Board and other private owners. Until the end of the 1990s the
slums of Trichy, with their sanitation and toilet facilities in an appalling state, were no different
from the rest of the country. But things began to change about 10 years ago, and Trichy has not
looked back since. The city was ranked 6th in India in the sanitation ranking of Indian cities by
the ministry of urban development in 2009-10.
It all started with a major initiative launched by the NGO Gramalaya in 2000, mobilising women
in the slums in self-help groups (SHGs) and launching an awareness campaign on sanitation
through training. They were able to get the support of Water-Aid, a UK-based NGO, to fund the
building/renovation of 25 community toilets and child-friendly toilets in the slums, which
would be managed by the women of the community on a pay-and-use basis. Sanitation health
education teams were set up by the SHGs to propagate the message of sanitation, monitor the
behaviour of residents, and supervise the maintenance of the toilets.
A community toilet complex typically has 10-12 seats for women and 10-12 for men. Child-
friendly toilets are separately provided in an adjacent area, for children up to the age of eight.
Each toilet has a tap which supplies 24×7 water. Some have graduated to “sanitary complexes”
with room for bathing and washing. Each facility receives its water supply from the Trichy City
Corporation (TCC), and a bore well is also provided by the corporation. Each has a provision of
underground storage of water and an overhead tank to which water is pumped. TCC has
ensured that water is made available also in summer months through tankers. The corporation
waives the electricity charge for the pumping of water for the first few years of operating the
toilets. Afterwards, the tariff for community toilets is levied at the lower domestic rate and not
commercial rate.
The cost of a typical community toilet was around Rs 3 lakh in the initial years that Water-Aid
built such complexes. Today, the cost is around Rs 12 lakh. The success of the women in
managing and maintaining the community toilets encouraged the TCC to build more of them, so
that all the 211 approved slums now have community toilets. Out of a total of 347 such toilets
(some slums have more than one), 284 are connected to the sewerage system and 63 function
through a septic tank. About 100 toilets are being managed on a pay and use basis by SHGs with
Gramalaya, and another 40 by other NGOs. For the rest, the TCC and/or ward councillors take
the responsibility for managing the toilets.
The Kamala Nehru Nagar slum where the toilet was inside the slum area. In West Devathanam,
another complex where the toilet is located between the slum and a public road and caters to
the needs of the slum as well as the floating population surrounding the slum. At the community
toilets run by SHGs, sanitary health education team members take turns to sit at a table placed
outside the toilet complex with tokens to sell as people come to use the toilet. They engage
cleaners who clean the complex two to three times a day. I found that the toilets were cleaner
than what we may typically find in cinema halls in Delhi.

CITY SANITATION PLAN BELGAUM
ADMINISTRATIVE STAFF COLLEGE OF INDIA, HYDERABAD 184 | P a g e
It is clear from the systems they have put in place to manage and maintain these toilets that
these women understand the economics of it all. The collection from user charges is used to pay
their electricity bills, the cleaner, the guard who keeps the watch, and expenses of minor repairs.
The typical user charge varies from 50 paise to Re 1 per use, while children, the elderly and the
physically challenged have free access. The accounts are meticulously-kept and are audited by
the TCC.
All teams make a small subscription to come together under Women’s Action for Village
Empowerment (WAVE) which is a registered society. Monthly meetings of WAVE allow them to
discuss their problems and learn from each other in finding solutions. A member of the TCC is
also invited to these meetings. They are now extending their sphere to cover solid waste
management and better delivery of other public services.
After initial resistance to their cause, men wanted to have a part of the action when the women
seemed to be succeeding in making their slums clean. The women obliged by creating AWASH
(Association for Water, Sanitation and Hygiene) so that men could also contribute to improving
the water and sanitation scenario of their joint habitat. Men also find a role through WATSAN
(water and sanitation) committees in monitoring the progress of the overall sanitation status of
the slums in the city. The municipal commissioner, T. T. Balsamy, was very appreciative of the
role played by the NGOs and the communities in bringing about the much overdue
transformation. As Geetha Jegan, executive director of Gramalaya put it: “Together, the city
corporation, the NGOs and the communities from the slums of Trichy have transformed the
sanitation scenario in Trichy.”
Trichy has shown the way. Other cities in India must follow to completely get rid of open
defecation and work for better sanitary conditions.
INFORMATION BOX 15: THE CONDOMINIAL SEWERAGE SYSTEM IN BRAZIL
The "condominial" system is the brainchild of Jose Carlos de Melo, a socially committed
engineer from Recife. The name condominial was given for two reasons. First, a block of houses
was treated like a horizontal apartment building (or condominial in Portuguese) (see figure).
Second, "Condominial" was a popular Brazilian soap opera and associated with the best in
urban life. As is evident in the figure, the result is a radically different layout, with a shorter grid
of smaller and shallower "feeder" sewers running through the backyards and with the effects of
shallower connections to the mains rippling through the system. These innovations cut
construction costs to between 20 and 30 per cent of those of a conventional system. The more
fundamental and radical innovation, however, is the active involvement of the population in
choosing their level of service, and in operating and maintaining the "feeder" infrastructure. The
key elements are that families can choose to continue with their current sanitation system, to
connect to a conventional waterborne system or to connect to a condominial system. If a family
chooses to connect to a condominial system, it has to pay a connection charge, which can be
financed by the water company, and a monthly tariff. If on the other hand, the family wants a
conventional connection, it has to pay an initial cost and a monthly tariff (both of which are
about three times higher) reflecting the different capital and operating costs. Families are free
to continue with their current system, which usually means a holding tank discharging into an
open street drain.

CITY SANITATION PLAN BELGAUM
ADMINISTRATIVE STAFF COLLEGE OF INDIA, HYDERABAD 185 | P a g e
In most cases, however, those families
who, initially, chose not to connect
eventually end up connecting. Either they
succumb to heavy pressure from their
neighbours or they find the build-up of
wastewater in and around their houses
intolerable once the (connected)
neighbours fill in the rest of the open
drain. Individual households are
responsible for maintaining the feeder sewers, with the formal agency maintaining only the
trunk mains. This increases the communities' sense of responsibility for the system. Also, the
misuse of any portion of the feeder system, for example by putting solid waste down the toilet,
soon shows up in a blockage in the neighbour's portion of the sewer. The rapid, direct and
informed feedback to the misuser virtually eliminates the need to educate the users of the
system in the "acceptable and unacceptable" and results in fewer blockages than in
conventional systems. Finally, because of the greatly reduced responsibility of the wastewater
utility, its operating costs are sharply reduced. The condominial system is now providing
service to hundreds of thousands of urban people in northeast Brazil and is being replicated on
a large scale throughout the country. The danger, however, is that the clever engineering is seen
as "the system". Where the community and organisational aspects have been missing, the
technology has worked poorly (as in Joinville, Santa Catarina) or not at all (as in the Baixada
Fluminense in Rio de Janeiro). Source: Briscoe, 1993; de Melo, 1985.
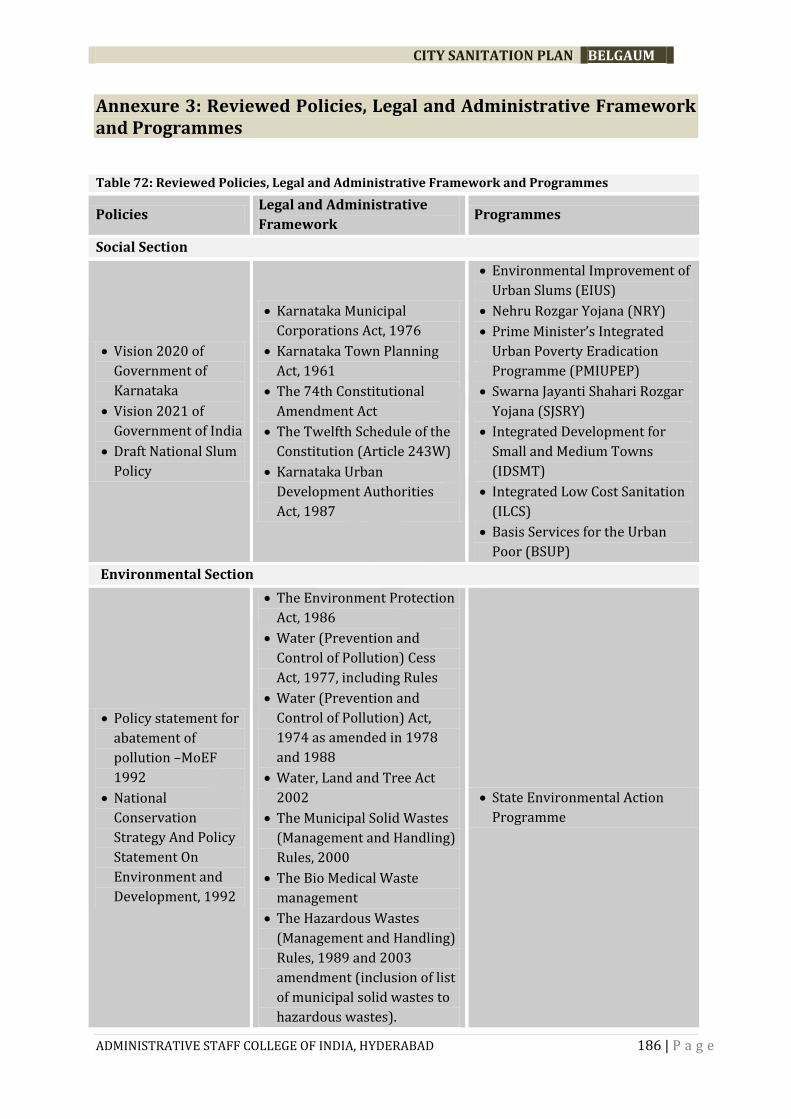
CITY SANITATION PLAN BELGAUM
ADMINISTRATIVE STAFF COLLEGE OF INDIA, HYDERABAD 186 | P a g e
Annexure 3: Reviewed Policies, Legal and Administrative Framework and Programmes
Table 72: Reviewed Policies, Legal and Administrative Framework and Programmes
Policies Legal and Administrative
Framework Programmes
Social Section
Vision 2020 of
Government of
Karnataka
Vision 2021 of
Government of India
Draft National Slum
Policy
Karnataka Municipal
Corporations Act, 1976
Karnataka Town Planning
Act, 1961
The 74th Constitutional
Amendment Act
The Twelfth Schedule of the
Constitution (Article 243W)
Karnataka Urban
Development Authorities
Act, 1987
Environmental Improvement of
Urban Slums (EIUS)
Nehru Rozgar Yojana (NRY)
Prime Minister’s Integrated
Urban Poverty Eradication
Programme (PMIUPEP)
Swarna Jayanti Shahari Rozgar
Yojana (SJSRY)
Integrated Development for
Small and Medium Towns
(IDSMT)
Integrated Low Cost Sanitation
(ILCS)
Basis Services for the Urban
Poor (BSUP)
Environmental Section
Policy statement for
abatement of
pollution –MoEF
1992
National
Conservation
Strategy And Policy
Statement On
Environment and
Development, 1992
The Environment Protection
Act, 1986
Water (Prevention and
Control of Pollution) Cess
Act, 1977, including Rules
Water (Prevention and
Control of Pollution) Act,
1974 as amended in 1978
and 1988
Water, Land and Tree Act
2002
The Municipal Solid Wastes
(Management and Handling)
Rules, 2000
The Bio Medical Waste
management
The Hazardous Wastes
(Management and Handling)
Rules, 1989 and 2003
amendment (inclusion of list
of municipal solid wastes to
hazardous wastes).
State Environmental Action
Programme
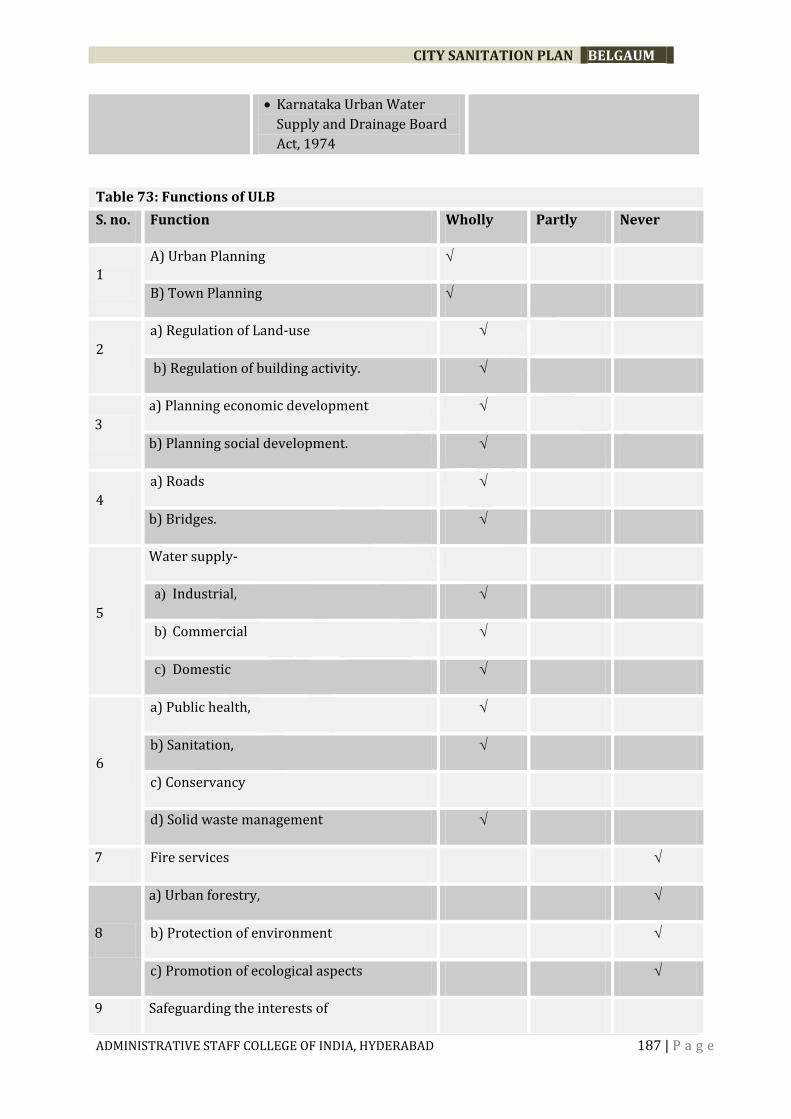
CITY SANITATION PLAN BELGAUM
ADMINISTRATIVE STAFF COLLEGE OF INDIA, HYDERABAD 187 | P a g e
Karnataka Urban Water
Supply and Drainage Board
Act, 1974
Table 73: Functions of ULB
S. no. Function Wholly Partly Never
1
A) Urban Planning
B) Town Planning
2
a) Regulation of Land-use
b) Regulation of building activity.
3
a) Planning economic development
b) Planning social development.
4
a) Roads
b) Bridges.
5
Water supply-
a) Industrial,
b) Commercial
c) Domestic
6
a) Public health,
b) Sanitation,
c) Conservancy
d) Solid waste management
7 Fire services
8
a) Urban forestry,
b) Protection of environment
c) Promotion of ecological aspects
9 Safeguarding the interests of
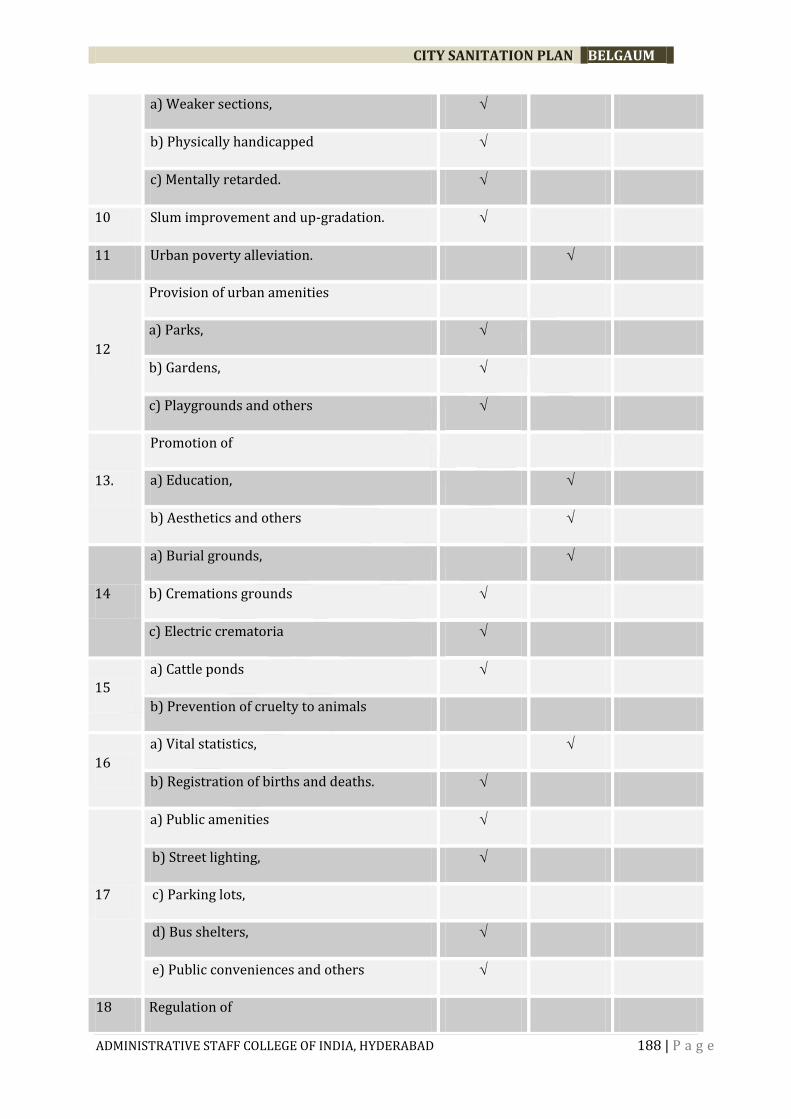
CITY SANITATION PLAN BELGAUM
ADMINISTRATIVE STAFF COLLEGE OF INDIA, HYDERABAD 188 | P a g e
a) Weaker sections,
b) Physically handicapped
c) Mentally retarded.
10 Slum improvement and up-gradation.
11 Urban poverty alleviation.
12
Provision of urban amenities
a) Parks,
b) Gardens,
c) Playgrounds and others
13.
Promotion of
a) Education,
b) Aesthetics and others
14
a) Burial grounds,
b) Cremations grounds
c) Electric crematoria
15
a) Cattle ponds
b) Prevention of cruelty to animals
16
a) Vital statistics,
b) Registration of births and deaths.
17
a) Public amenities
b) Street lighting,
c) Parking lots,
d) Bus shelters,
e) Public conveniences and others
18 Regulation of

CITY SANITATION PLAN BELGAUM
ADMINISTRATIVE STAFF COLLEGE OF INDIA, HYDERABAD 189 | P a g e
a) Slaughterhouses
b) Tanneries
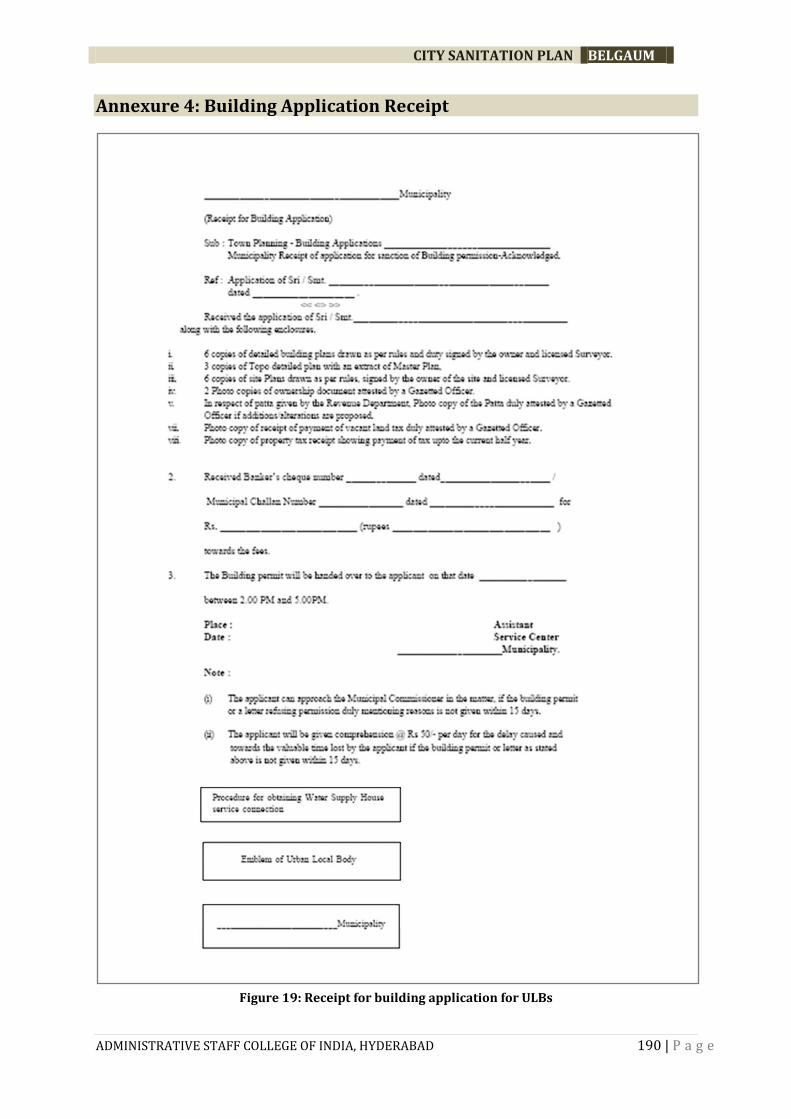
CITY SANITATION PLAN BELGAUM
ADMINISTRATIVE STAFF COLLEGE OF INDIA, HYDERABAD 190 | P a g e
Annexure 4: Building Application Receipt
Figure 19: Receipt for building application for ULBs
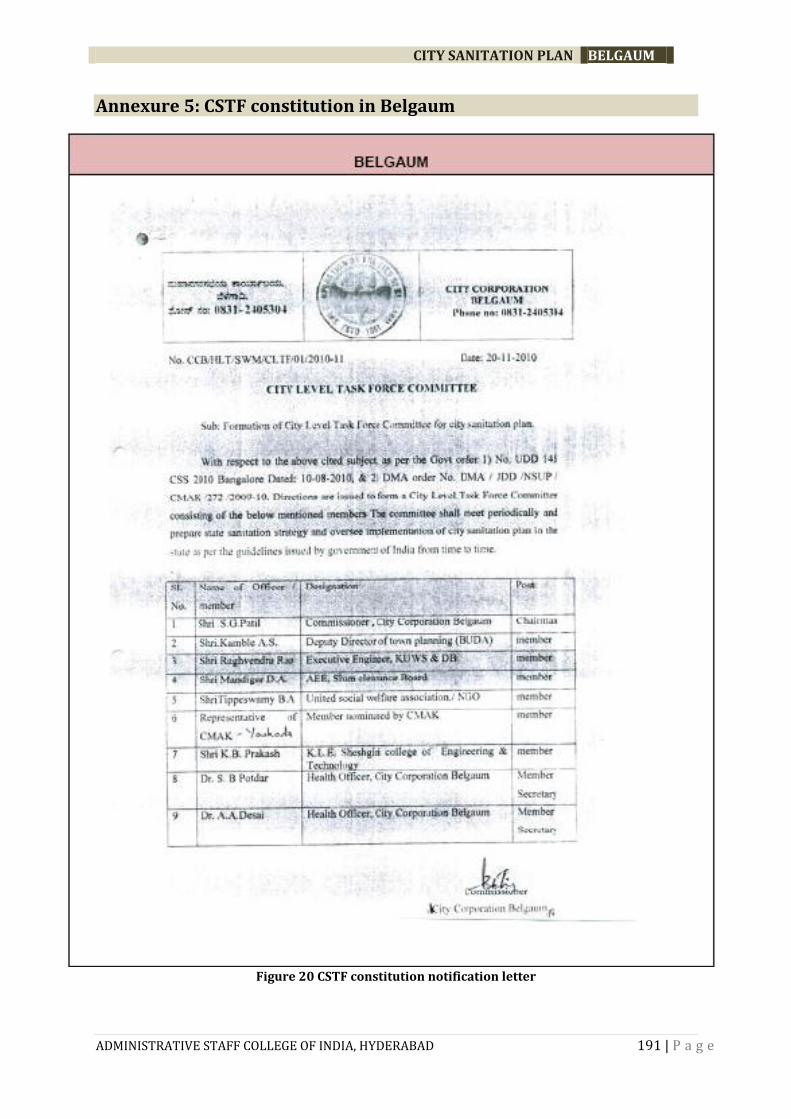
CITY SANITATION PLAN BELGAUM
ADMINISTRATIVE STAFF COLLEGE OF INDIA, HYDERABAD 191 | P a g e
Annexure 5: CSTF constitution in Belgaum
Figure 20 CSTF constitution notification letter
CITY SANITATION PLAN BELGAUM
ADMINISTRATIVE STAFF COLLEGE OF INDIA, HYDERABAD 192 | P a g e
Annexure 6: First CSTF Workshop Proceedings, Belgaum
Venue: Council Hall, City Corporation Office, Belgaum
Date and Time: 24th January 2011 | 3:00 PM
The workshop started with a welcome speech by Sri. N.B. Nirwani, Mayor, Belgaum, Sri. S. G.
Patil, Commissioner City Corporation, Belgaum, and Sri. Dhanraj Gavali, Deputy Mayor, Belagum.
The agenda listed the need for the constitution of CSTF members and their role in the
preparation of City Sanitation Plan followed by the group activity among the CSTF members to
seek their views on the problems and solutions in regard to the sanitation in their respective
city, as given below. There were around 80 participants for the workshop which includes Mayor,
Deputy Mayor, Commissioner, DMA, Health Officers, Corporators, Community Affairs Officers,
Counsellors, PWD Chairman, Regional Officer-KSPCB, NGOs, Environmental Engineers, NGO
Bhageertah, Health Inspector, ASCI’s team and CMAK. The discussions on the various issues
were noted and relevant inference was drawn. The session concluded with the closing remarks
by Sri. S.G. Patil, Commissioner City Corporation, Belgaum and ASCI team thanked the CSTF
members for their interactive collaboration during the workshop.
GROUP ACTIVITY
GROUP I: Open defecation free city
Issues
1. Slum creations in urban areas
2. Poverty and lack of knowledge
3. Lack of space for construction and community toilets in slum areas
4. Lack of water facility in slums
5. Lack of UGD networking
Solutions
1. Individual toilet construction through government and subsidy programs
2. Financial help for poor for construction of toilets
3. Provide spaces through ULB for construction of toilets
4. Utilize local self help groups for maintenance of toilets
5. Provide UGD facility and water facility in slum and low income group areas
6. Create awareness among public
7. Make city 100% toilet facility, UGD connections and slum free city
8. To arrange public meetings in backward areas
9. Free usage of toilet facilities in poor areas with water facilities for 24x7 and
maintenance charges of Rs. 15-20 per family per month can be taken
10. Awareness to the public specially slum areas and poor people who are mostly prone to
open defecation.
GROUP II: Waste water treatment
1. Every household should have UGD connection.
2. Bad condition pipes need to be repaired immediately with out any delay.
3. The waste water should be collected in one common nala and then sent to the treatment
plant. Waste water should be scientifically treatment.
CITY SANITATION PLAN BELGAUM
ADMINISTRATIVE STAFF COLLEGE OF INDIA, HYDERABAD 193 | P a g e
4. Strong pipes should be used for carrying the waste water.
5. As most of the waste water from households are not connected to the UGD, the waste
water escapes and deposits in the nearby areas causing problems.
6. Either single house toilet or community toilets needs to be built in the areas having no
toilet facilities.
GROUP III: Sanitary facilities for the poor
1. Construction of community toilets and individual toilets with sufficient water facility i.e.,
two pit latrine facilities in remote areas.
2. Government housing scheme especially for poor should be associated with individual
toilets with individual waste water connection.
3. Toilets should be connected with the UGD system.
4. Proper education to the poor public required for proper waste management and
community health.
5. Low cost toilet model should be brought to the notice with subsidised cost and method
of construction should be brought to their notice and trained.
GROUP IV: Door to door waste collection, treatment and disposal
1. Every house hold should give their domestic waste to person and not throw in gutter
and roads
2. Awareness programme to be created with ward meetings, cinemas, shows, etc.
3. 2 times door to door collection of solid waste and 2 times picking by primary collection
of containers
4. Supply of bags, buckets at concession rates to be given to public by the corporators.
5. Providing more number of containers depending on the area of wards.
6. Ban on plastic bags and bottles
7. Construction of platform to keep containers
8. Door to door collection charges to be followed
9. Violation of door to door policy to be fined
10. Boards or sign boards to use dustbins and containers
11. Disinfectant spray to be regularised
12. Separate collection of dead animals and building materials
13. NGOs should take interest in management of solid waste.
GROUP V: Regarding IEC for solid waste management
1. Information visualize through theatres with slide films
2. Through pamphlets, posters, banners and giving advertisement in newspapers
3. To conduct the awareness programmes
4. To conduct road side activities like dramas, poetries, etc.
5. Awareness through mobile SMS, emails, telephonic messages, etc.
6. Personnel visits by the Commissioner, health committee chairman, health officers and
corporators, sanitary inspectors, etc., to the slum areas
7. To conduct slide shows in the city so that students will educate their parents
8. Sanitation literacy though NGOs
9. Residential welfare associations can be formed in different parts of the city so that they
can look after the awareness regarding educational activities.
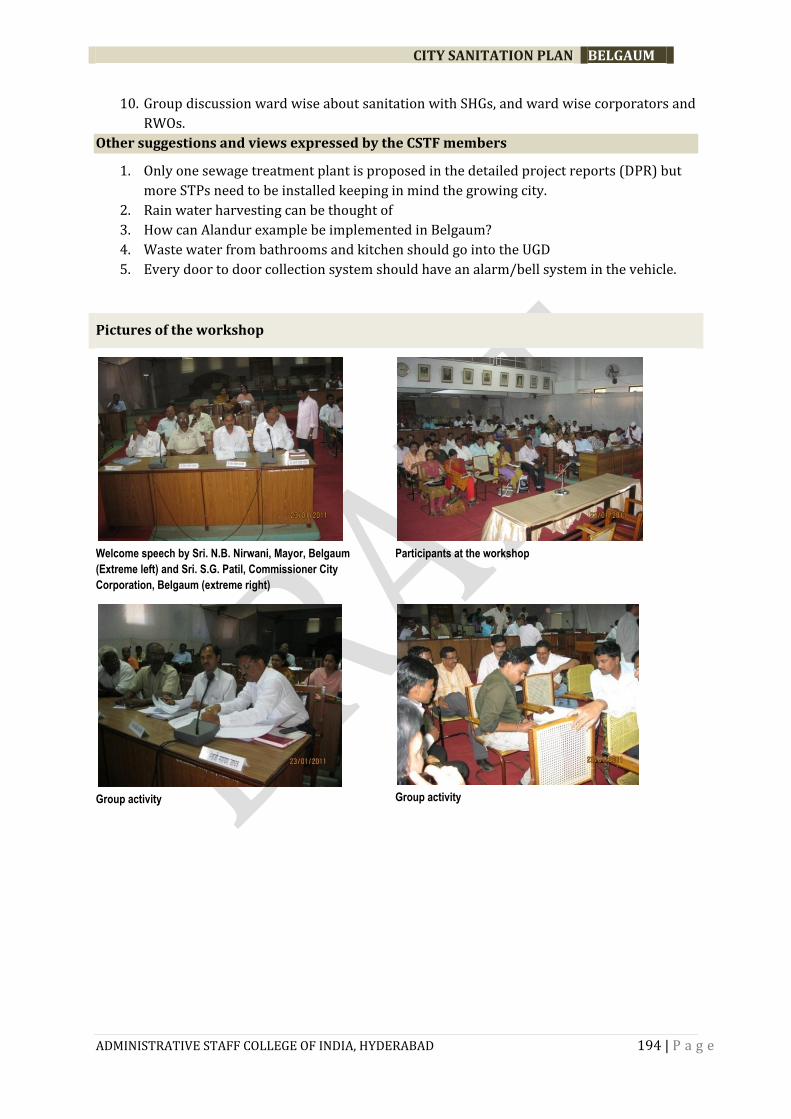
CITY SANITATION PLAN BELGAUM
ADMINISTRATIVE STAFF COLLEGE OF INDIA, HYDERABAD 194 | P a g e
10. Group discussion ward wise about sanitation with SHGs, and ward wise corporators and
RWOs.
Other suggestions and views expressed by the CSTF members
1. Only one sewage treatment plant is proposed in the detailed project reports (DPR) but
more STPs need to be installed keeping in mind the growing city.
2. Rain water harvesting can be thought of
3. How can Alandur example be implemented in Belgaum?
4. Waste water from bathrooms and kitchen should go into the UGD
5. Every door to door collection system should have an alarm/bell system in the vehicle.
Pictures of the workshop
Welcome speech by Sri. N.B. Nirwani, Mayor, Belgaum
(Extreme left) and Sri. S.G. Patil, Commissioner City
Corporation, Belgaum (extreme right)
Participants at the workshop
Group activity
Group activity

CITY SANITATION PLAN BELGAUM
ADMINISTRATIVE STAFF COLLEGE OF INDIA, HYDERABAD 195 | P a g e
Annexure 8: Secondary Data Formats – Profiling of the ULBs
TABLE 1: DETAILS OF ULB
Name of the ULB
Address
Area
Population
No. of Wards
Please attach organizational structure of the ULB
TABLE 2: SUMMARY OF GROWTH TRENDS
Sl.
No
Year Total
Population
Total
households
Area of the
city
Total BPL
population
Total
population
in slums
Total
Households
in Slums
Area of slums
(nos.) (nos.) (sq.km) (nos.) (nos.) (nos.) (sq.km)
1 1961
2 1971
3 1981
4 1991
5 2001
6 2011
Note: The figures for 2011 will be estimated figures, while the 1961- 2001 figures should be taken from the Census
Note: Remarks column could indicate any explanation for figures not keeping in line with trends (e.g. jurisdictional changes),migration ,floating
population rates.
Source

CITY SANITATION PLAN BELGAUM
ADMINISTRATIVE STAFF COLLEGE OF INDIA, HYDERABAD 196 | P a g e
TABLE 3: WARDWISE DEMOGRAPHIC DETAILS
Ward No. Area
(sq.km)
Population
(nos.)
Households
(nos.)
1
2
3
4
5
TABLE 4: WARDWISE DETAILS OF TYPES OF PROPERTIES
Sl. No. Ward No.
Residential properties
Commercial properties
Institutional properties
Govt. Schools
Govt. Hospitals
Other Govt. health institutions
Slaughter houses
Industries
(nos.) (nos.) (nos.) (nos.) (nos.) (nos.) (nos.) (nos.)
1
2
3
4
5
TABLE 5: WARDWISE SLUM DETAILS
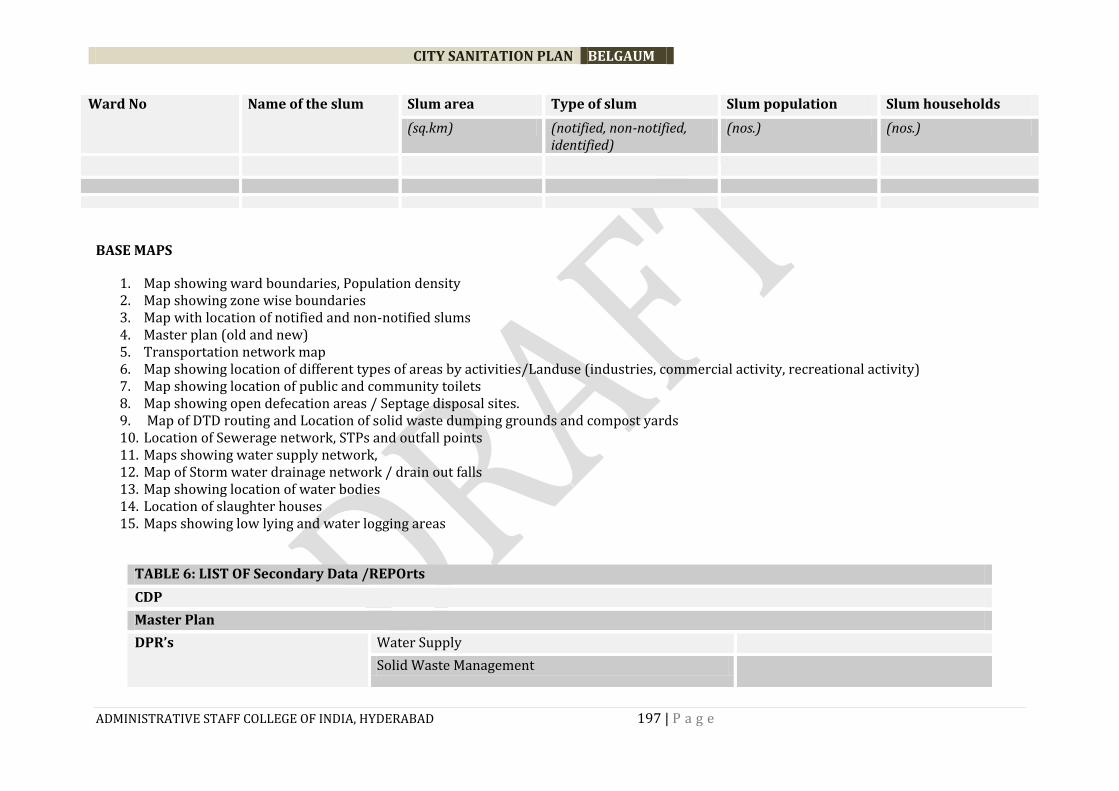
CITY SANITATION PLAN BELGAUM
ADMINISTRATIVE STAFF COLLEGE OF INDIA, HYDERABAD 197 | P a g e
Ward No Name of the slum Slum area Type of slum Slum population Slum households
(sq.km) (notified, non-notified, identified)
(nos.) (nos.)
BASE MAPS
1. Map showing ward boundaries, Population density 2. Map showing zone wise boundaries 3. Map with location of notified and non-notified slums 4. Master plan (old and new) 5. Transportation network map 6. Map showing location of different types of areas by activities/Landuse (industries, commercial activity, recreational activity) 7. Map showing location of public and community toilets 8. Map showing open defecation areas / Septage disposal sites. 9. Map of DTD routing and Location of solid waste dumping grounds and compost yards 10. Location of Sewerage network, STPs and outfall points 11. Maps showing water supply network, 12. Map of Storm water drainage network / drain out falls 13. Map showing location of water bodies 14. Location of slaughter houses 15. Maps showing low lying and water logging areas
TABLE 6: LIST OF Secondary Data /REPOrts
CDP
Master Plan
DPR’s Water Supply
Solid Waste Management
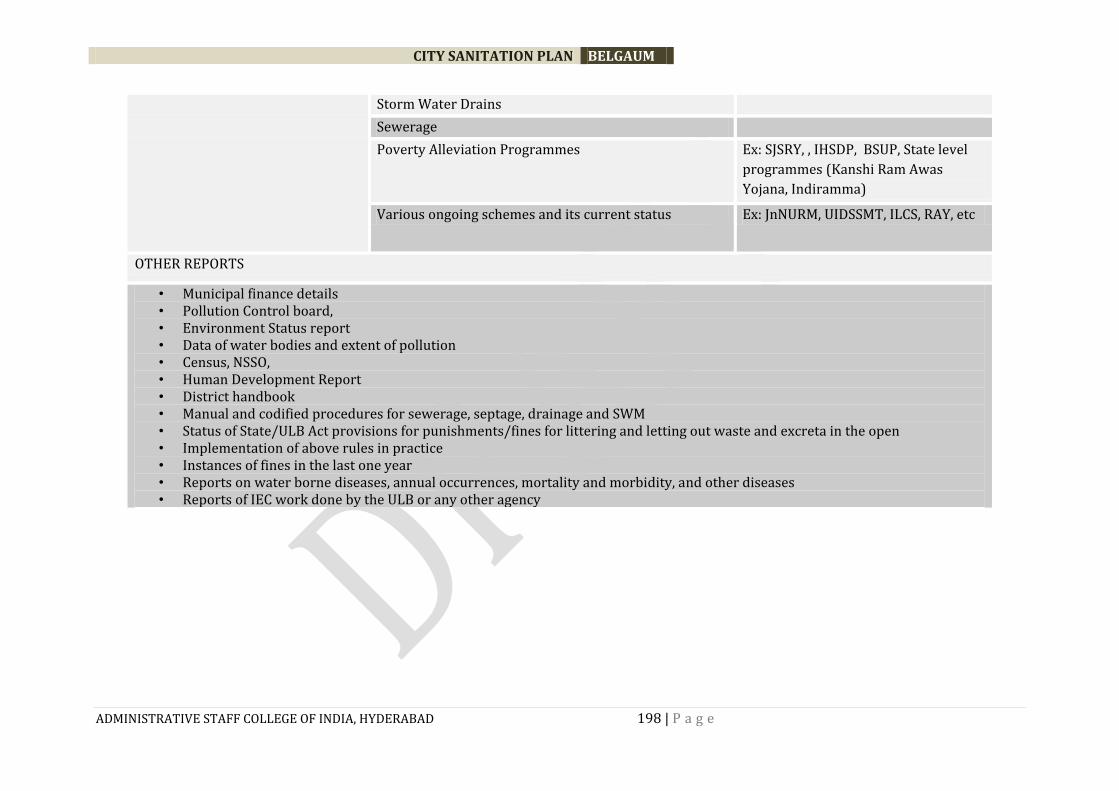
CITY SANITATION PLAN BELGAUM
ADMINISTRATIVE STAFF COLLEGE OF INDIA, HYDERABAD 198 | P a g e
Storm Water Drains
Sewerage
Poverty Alleviation Programmes Ex: SJSRY, , IHSDP, BSUP, State level
programmes (Kanshi Ram Awas
Yojana, Indiramma)
Various ongoing schemes and its current status Ex: JnNURM, UIDSSMT, ILCS, RAY, etc
OTHER REPORTS
• Municipal finance details • Pollution Control board, • Environment Status report • Data of water bodies and extent of pollution • Census, NSSO, • Human Development Report • District handbook • Manual and codified procedures for sewerage, septage, drainage and SWM • Status of State/ULB Act provisions for punishments/fines for littering and letting out waste and excreta in the open • Implementation of above rules in practice • Instances of fines in the last one year • Reports on water borne diseases, annual occurrences, mortality and morbidity, and other diseases • Reports of IEC work done by the ULB or any other agency
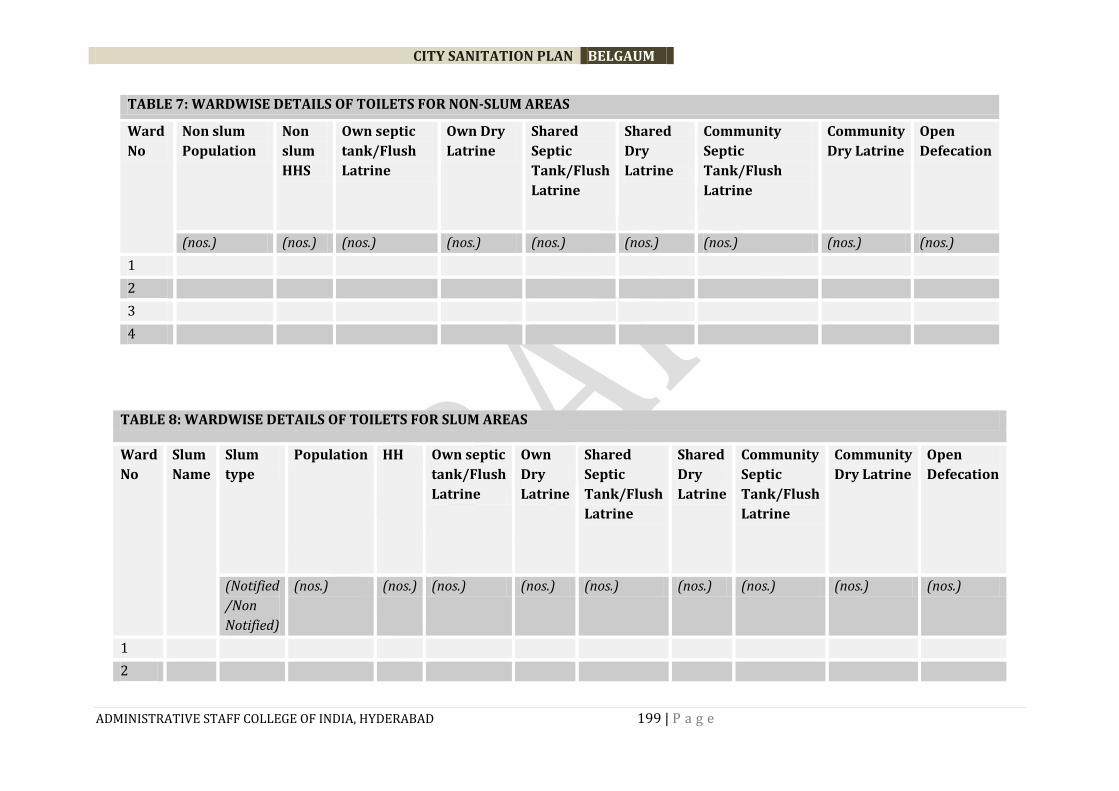
CITY SANITATION PLAN BELGAUM
ADMINISTRATIVE STAFF COLLEGE OF INDIA, HYDERABAD 199 | P a g e
TABLE 7: WARDWISE DETAILS OF TOILETS FOR NON-SLUM AREAS
Ward
No
Non slum
Population
Non
slum
HHS
Own septic
tank/Flush
Latrine
Own Dry
Latrine
Shared
Septic
Tank/Flush
Latrine
Shared
Dry
Latrine
Community
Septic
Tank/Flush
Latrine
Community
Dry Latrine
Open
Defecation
(nos.) (nos.) (nos.) (nos.) (nos.) (nos.) (nos.) (nos.) (nos.)
1
2
3
4
TABLE 8: WARDWISE DETAILS OF TOILETS FOR SLUM AREAS
Ward
No
Slum
Name
Slum
type
Population HH Own septic
tank/Flush
Latrine
Own
Dry
Latrine
Shared
Septic
Tank/Flush
Latrine
Shared
Dry
Latrine
Community
Septic
Tank/Flush
Latrine
Community
Dry Latrine
Open
Defecation
(Notified
/Non
Notified)
(nos.) (nos.) (nos.) (nos.) (nos.) (nos.) (nos.) (nos.) (nos.)
1
2
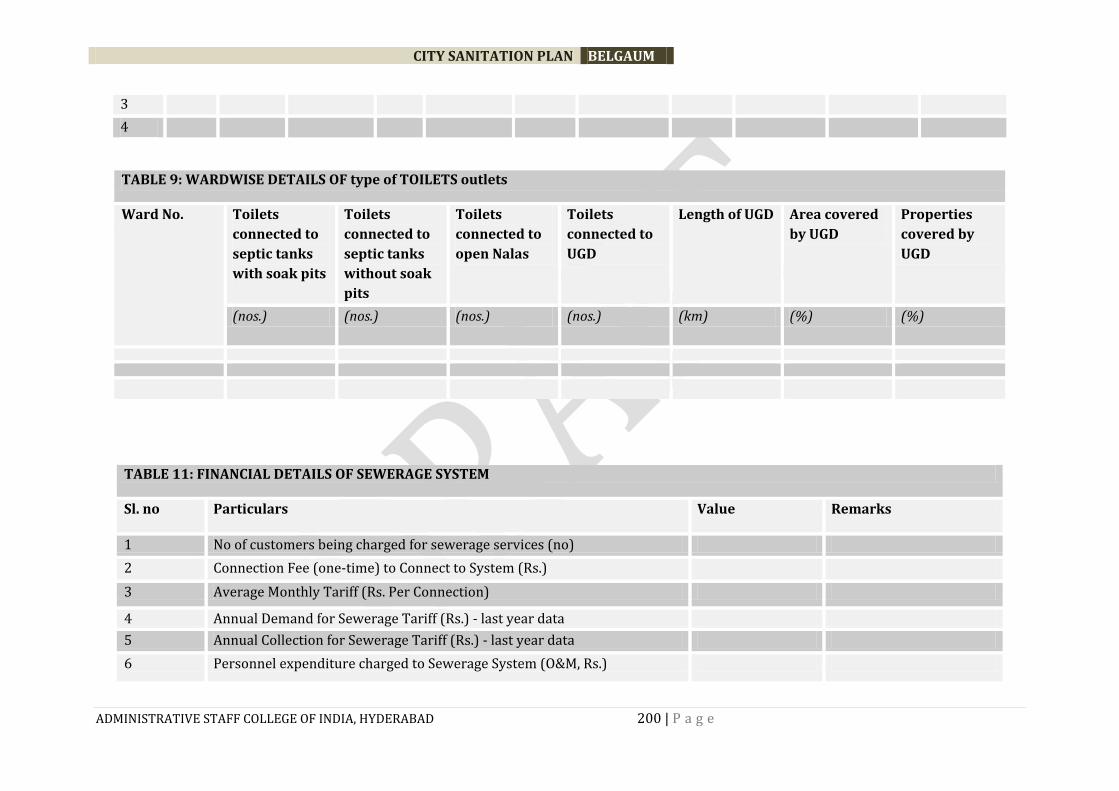
CITY SANITATION PLAN BELGAUM
ADMINISTRATIVE STAFF COLLEGE OF INDIA, HYDERABAD 200 | P a g e
3
4
TABLE 9: WARDWISE DETAILS OF type of TOILETS outlets
Ward No. Toilets
connected to
septic tanks
with soak pits
Toilets
connected to
septic tanks
without soak
pits
Toilets
connected to
open Nalas
Toilets
connected to
UGD
Length of UGD Area covered
by UGD
Properties
covered by
UGD
(nos.) (nos.) (nos.) (nos.) (km) (%) (%)
TABLE 11: FINANCIAL DETAILS OF SEWERAGE SYSTEM
Sl. no Particulars Value Remarks
1 No of customers being charged for sewerage services (no)
2 Connection Fee (one-time) to Connect to System (Rs.)
3 Average Monthly Tariff (Rs. Per Connection)
4 Annual Demand for Sewerage Tariff (Rs.) - last year data
5 Annual Collection for Sewerage Tariff (Rs.) - last year data
6 Personnel expenditure charged to Sewerage System (O&M, Rs.)
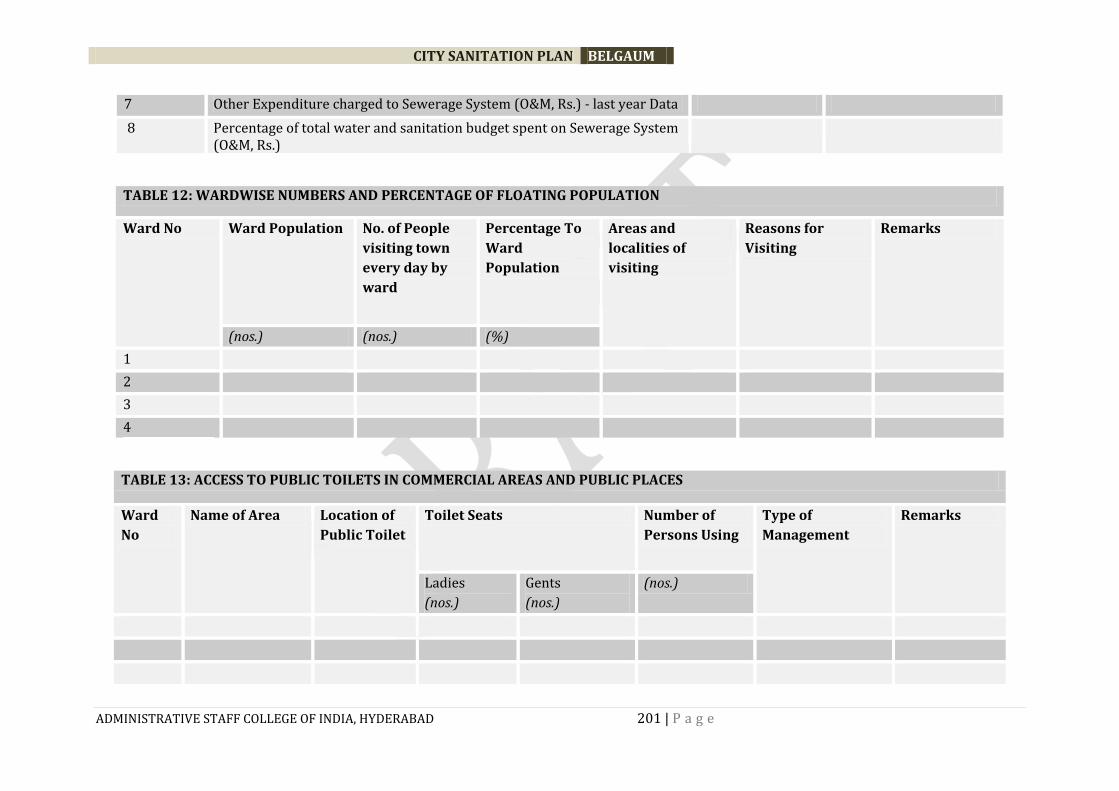
CITY SANITATION PLAN BELGAUM
ADMINISTRATIVE STAFF COLLEGE OF INDIA, HYDERABAD 201 | P a g e
7 Other Expenditure charged to Sewerage System (O&M, Rs.) - last year Data
8 Percentage of total water and sanitation budget spent on Sewerage System (O&M, Rs.)
TABLE 12: WARDWISE NUMBERS AND PERCENTAGE OF FLOATING POPULATION
Ward No Ward Population No. of People
visiting town
every day by
ward
Percentage To
Ward
Population
Areas and
localities of
visiting
Reasons for
Visiting
Remarks
(nos.) (nos.) (%)
1
2
3
4
TABLE 13: ACCESS TO PUBLIC TOILETS IN COMMERCIAL AREAS AND PUBLIC PLACES
Ward
No
Name of Area Location of
Public Toilet
Toilet Seats Number of
Persons Using
Type of
Management
Remarks
Ladies
(nos.)
Gents
(nos.)
(nos.)
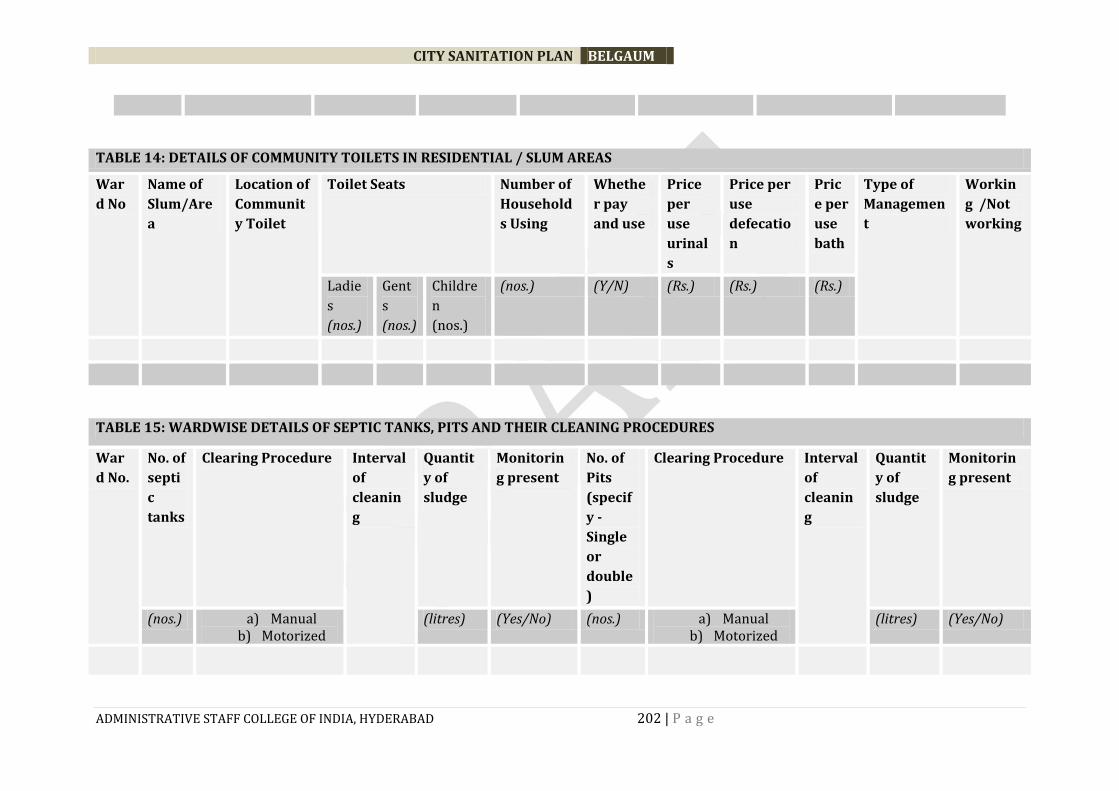
CITY SANITATION PLAN BELGAUM
ADMINISTRATIVE STAFF COLLEGE OF INDIA, HYDERABAD 202 | P a g e
TABLE 14: DETAILS OF COMMUNITY TOILETS IN RESIDENTIAL / SLUM AREAS
War
d No
Name of
Slum/Are
a
Location of
Communit
y Toilet
Toilet Seats Number of
Household
s Using
Whethe
r pay
and use
Price
per
use
urinal
s
Price per
use
defecatio
n
Pric
e per
use
bath
Type of
Managemen
t
Workin
g /Not
working
Ladie
s
(nos.)
Gent
s
(nos.)
Childre
n
(nos.)
(nos.) (Y/N) (Rs.) (Rs.) (Rs.)
TABLE 15: WARDWISE DETAILS OF SEPTIC TANKS, PITS AND THEIR CLEANING PROCEDURES
War
d No.
No. of
septi
c
tanks
Clearing Procedure Interval
of
cleanin
g
Quantit
y of
sludge
Monitorin
g present
No. of
Pits
(specif
y -
Single
or
double
)
Clearing Procedure Interval
of
cleanin
g
Quantit
y of
sludge
Monitorin
g present
(nos.) a) Manual b) Motorized
(litres) (Yes/No) (nos.) a) Manual b) Motorized
(litres) (Yes/No)

CITY SANITATION PLAN BELGAUM
ADMINISTRATIVE STAFF COLLEGE OF INDIA, HYDERABAD 203 | P a g e
TABLE 16: SLUDGE/SEPTAGE EQUIPMENT AND MANAGEMENT
No. Indicator Municipality Owned Private
Agencies
Remarks
A Equipment Available
1 No of Sludge Suction trucks/equipment
2 Annual No of tanks cleaned - last year's estimate
B Cleaned using mechanical equipment
3 Estimated Volume (ML) cleaned last year
4 Method of Conveyance and Disposal: Untreated
5 Amount Disposed Untreated (ML) - last year's estimate
6 Location of disposal - untreated
7 Method of Conveyance and Disposal: Treated
8 Amount Disposed Treated (ML) - last year's estimate
9 Location of disposal - treated
10 Cost per tank cleaning
C Manual Cleaning of Tanks and Pits
11 Estimate Annual No of Tanks cleaned - last year's average
12 Cost per tank cleaning
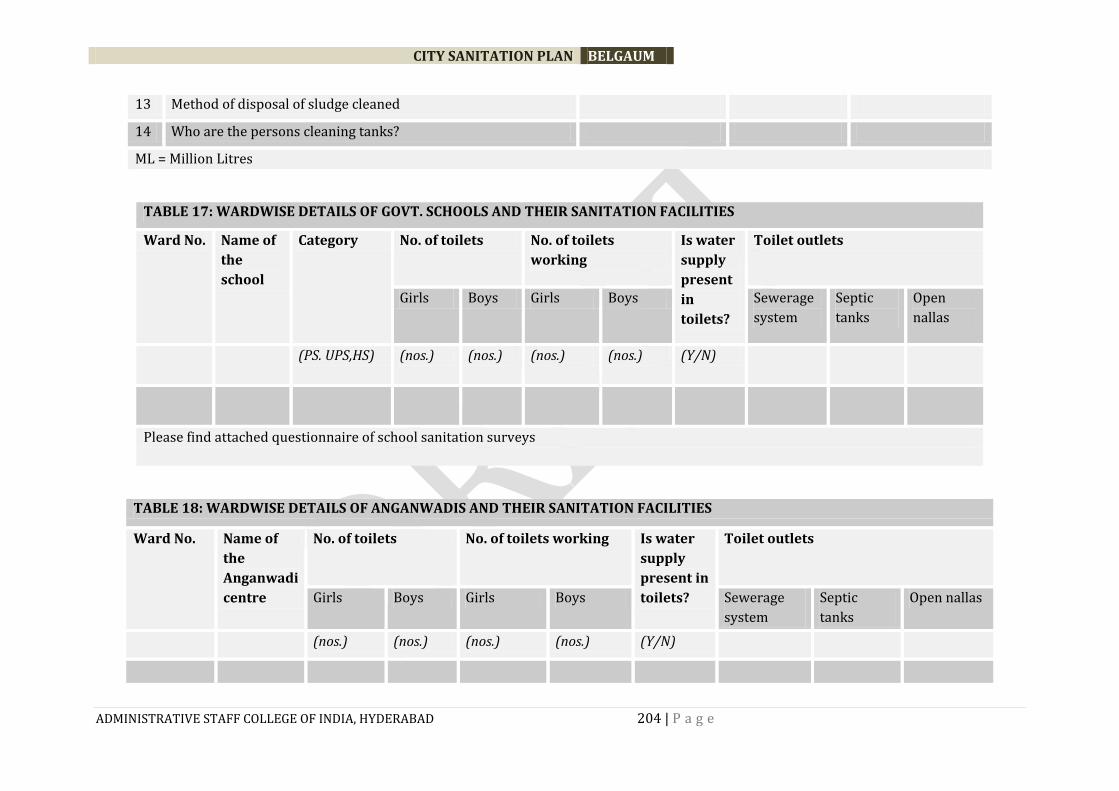
CITY SANITATION PLAN BELGAUM
ADMINISTRATIVE STAFF COLLEGE OF INDIA, HYDERABAD 204 | P a g e
13 Method of disposal of sludge cleaned
14 Who are the persons cleaning tanks?
ML = Million Litres
TABLE 17: WARDWISE DETAILS OF GOVT. SCHOOLS AND THEIR SANITATION FACILITIES
Ward No. Name of
the
school
Category No. of toilets No. of toilets
working
Is water
supply
present
in
toilets?
Toilet outlets
Girls Boys Girls Boys Sewerage
system
Septic
tanks
Open
nallas
(PS. UPS,HS) (nos.) (nos.) (nos.) (nos.) (Y/N)
Please find attached questionnaire of school sanitation surveys
TABLE 18: WARDWISE DETAILS OF ANGANWADIS AND THEIR SANITATION FACILITIES
Ward No. Name of
the
Anganwadi
centre
No. of toilets No. of toilets working Is water
supply
present in
toilets?
Toilet outlets
Girls Boys Girls Boys Sewerage
system
Septic
tanks
Open nallas
(nos.) (nos.) (nos.) (nos.) (Y/N)
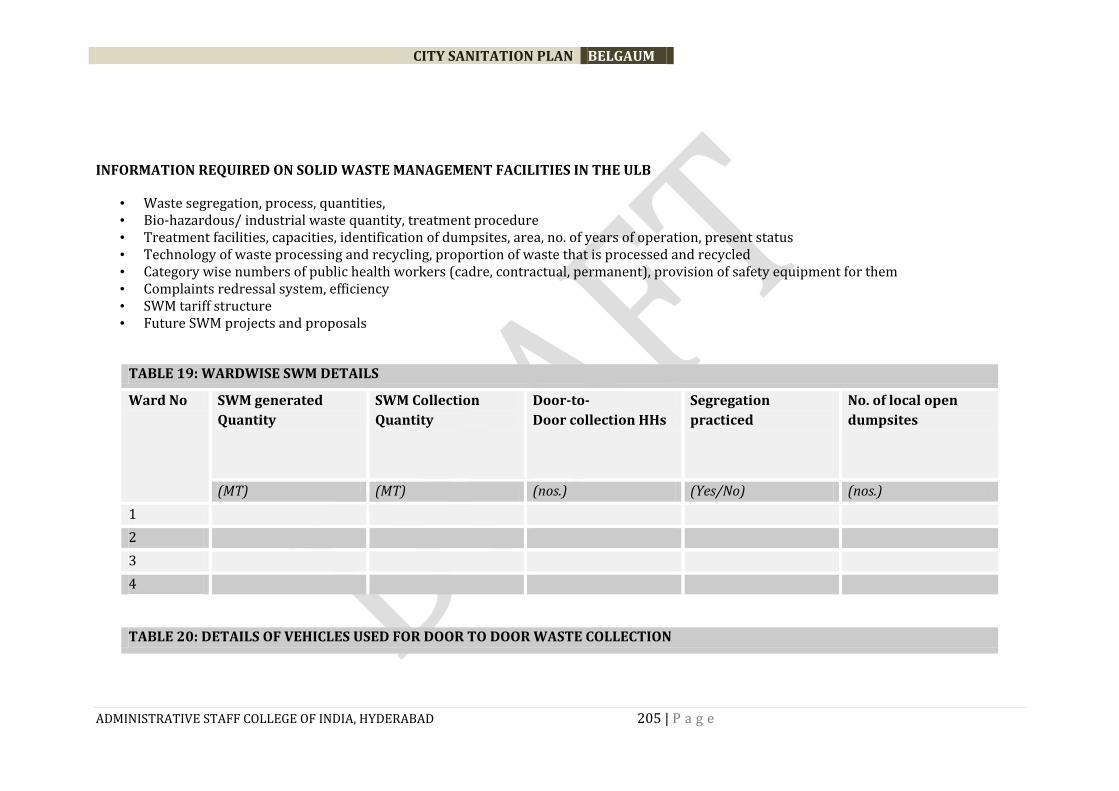
CITY SANITATION PLAN BELGAUM
ADMINISTRATIVE STAFF COLLEGE OF INDIA, HYDERABAD 205 | P a g e
INFORMATION REQUIRED ON SOLID WASTE MANAGEMENT FACILITIES IN THE ULB
• Waste segregation, process, quantities, • Bio-hazardous/ industrial waste quantity, treatment procedure • Treatment facilities, capacities, identification of dumpsites, area, no. of years of operation, present status • Technology of waste processing and recycling, proportion of waste that is processed and recycled • Category wise numbers of public health workers (cadre, contractual, permanent), provision of safety equipment for them • Complaints redressal system, efficiency • SWM tariff structure • Future SWM projects and proposals
TABLE 19: WARDWISE SWM DETAILS
Ward No SWM generated
Quantity
SWM Collection
Quantity
Door-to-
Door collection HHs
Segregation
practiced
No. of local open
dumpsites
(MT) (MT) (nos.) (Yes/No) (nos.)
1
2
3
4
TABLE 20: DETAILS OF VEHICLES USED FOR DOOR TO DOOR WASTE COLLECTION

CITY SANITATION PLAN BELGAUM
ADMINISTRATIVE STAFF COLLEGE OF INDIA, HYDERABAD 206 | P a g e
Vehicle Type No .of vehicles Capacity of each vehicle
(Tons)
No. of trips Total waste collected
(Tons)
TABLE 21: DETAILS OF VEHICLES USED FOR SECONDARY WASTE TRANSPORTATION
Vehicle Type No. of vehicles Capacity of each vehicle
(Tons)
No. of trips Total waste collected
(Tons)
TABLE 21: DETAILS OF WASTE ACCORDING TO DIFFERENT CATEGORIES
Category of waste Quantity of waste
generated
(MT/Month)
Quantity of
waste collected
(MT/Month)
Category of waste Quantity of waste
generated
(MT/Month)
Quantity of waste
collected
(MT/Month)
Residential Slaughter Houses
Commercial Industries
Street sweeping Construction waste
Market waste Any other (please
specify)

CITY SANITATION PLAN BELGAUM
ADMINISTRATIVE STAFF COLLEGE OF INDIA, HYDERABAD 207 | P a g e
INFORMATION REQUIRED ON WATER SUPPLY SYSTEM IN THE ULB
• Source, treatment facilities, • Capacity, present production • Length of distribution network, coverage • Water quality • Complaints redressal system, efficiency • Water tariff structure • Future water supply projects and proposals
TABLE 22: WARDWISE DETAILS OF WATER SUPPLY SYSTEM
Ward
No.
HHS connected
to Piped Water
(nos.)
No. of
hours per
day
HHS
connected to
stand posts
(nos.)
No. of
hours per
day
HHS connected
to Tube
wells/own
sources and
others
(nos.)
Bulk
connections
(nos.)
Other
properties
connected to
piped water
system
(nos.)
1
2
3
4
5
INFORMATION REQUIRED ON STORM WATER DRAINAGE SYSTEM IN THE ULB
• Outfall points,
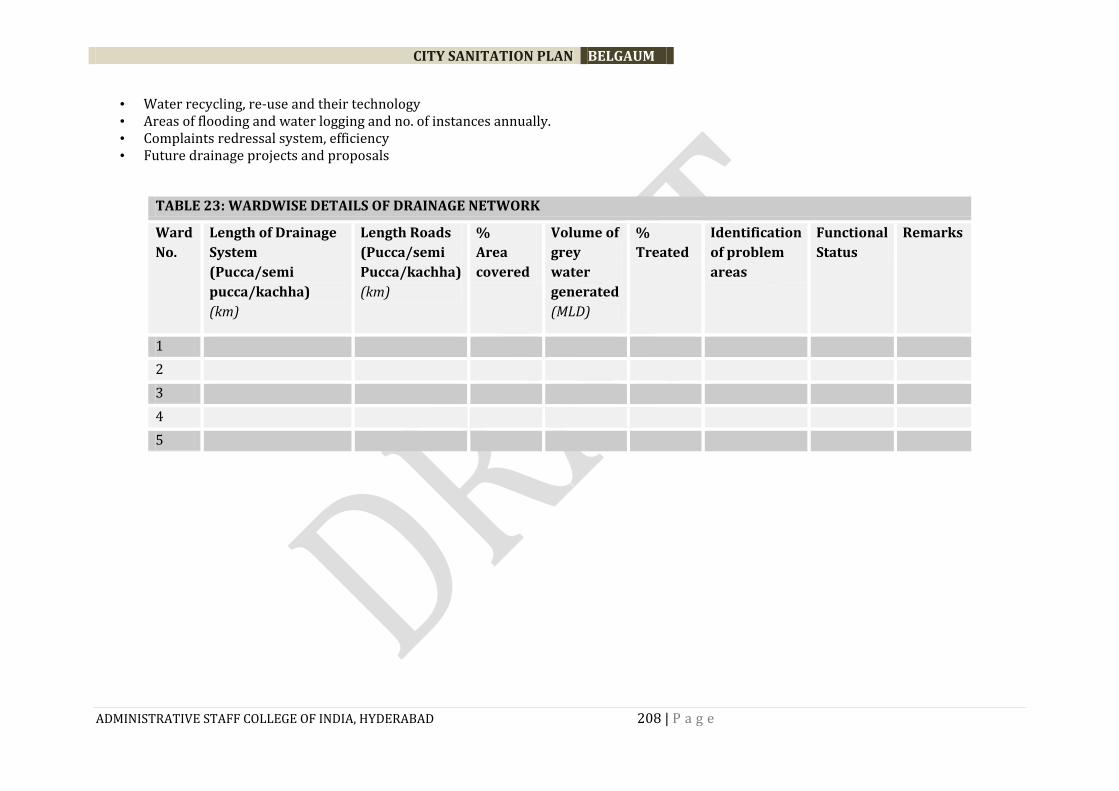
CITY SANITATION PLAN BELGAUM
ADMINISTRATIVE STAFF COLLEGE OF INDIA, HYDERABAD 208 | P a g e
• Water recycling, re-use and their technology • Areas of flooding and water logging and no. of instances annually. • Complaints redressal system, efficiency • Future drainage projects and proposals
TABLE 23: WARDWISE DETAILS OF DRAINAGE NETWORK
Ward
No.
Length of Drainage
System
(Pucca/semi
pucca/kachha)
(km)
Length Roads
(Pucca/semi
Pucca/kachha)
(km)
%
Area
covered
Volume of
grey
water
generated
(MLD)
%
Treated
Identification
of problem
areas
Functional
Status
Remarks
1
2
3
4
5
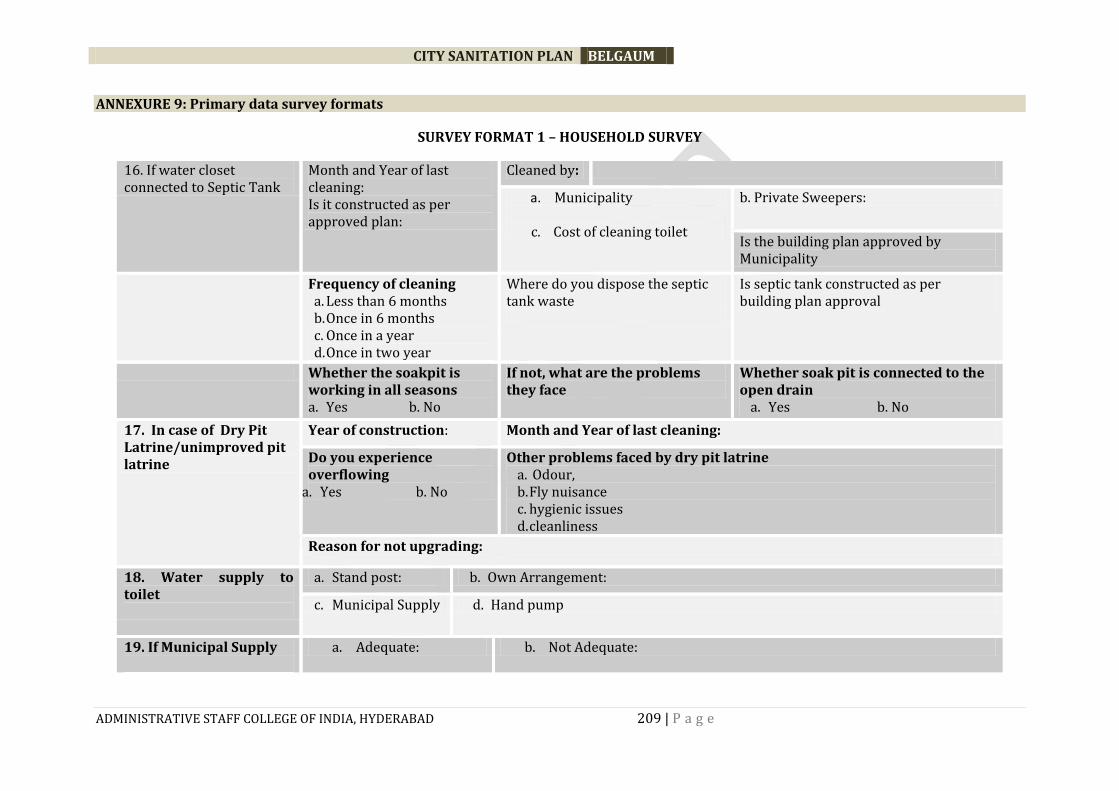
CITY SANITATION PLAN BELGAUM
ADMINISTRATIVE STAFF COLLEGE OF INDIA, HYDERABAD 209 | P a g e
ANNEXURE 9: Primary data survey formats
SURVEY FORMAT 1 – HOUSEHOLD SURVEY
16. If water closet connected to Septic Tank
Month and Year of last cleaning: Is it constructed as per approved plan:
Cleaned by:
a. Municipality
c. Cost of cleaning toilet
b. Private Sweepers:
Is the building plan approved by Municipality
Frequency of cleaning a. Less than 6 months b. Once in 6 months c. Once in a year d. Once in two year
Where do you dispose the septic tank waste
Is septic tank constructed as per building plan approval
Whether the soakpit is working in all seasons a. Yes b. No
If not, what are the problems they face
Whether soak pit is connected to the open drain
a. Yes b. No
17. In case of Dry Pit Latrine/unimproved pit latrine
Year of construction: Month and Year of last cleaning:
Do you experience overflowing
a. Yes b. No
Other problems faced by dry pit latrine a. Odour, b. Fly nuisance c. hygienic issues d. cleanliness
Reason for not upgrading:
18. Water supply to toilet
a. Stand post: b. Own Arrangement:
c. Municipal Supply d. Hand pump
19. If Municipal Supply
a. Adequate: b. Not Adequate:

CITY SANITATION PLAN BELGAUM
ADMINISTRATIVE STAFF COLLEGE OF INDIA, HYDERABAD 210 | P a g e
20. If, Community/Public, Who in family uses it?
a. All members b. Only Adult Men
c. Only Adult Women d. All Adults
21. No. of people using the community toilet
a. 10-20 b. 20-30
c. 30-40
d. 40-50
e. 50 and above
22. No. of seats
a. Less than 10 b. 10-15 c. 15-20 d. 20-30 e. 30 & above
23. Condition of the toilets
a. Good b. Average c. unusable d. Not in use
24. Payment Arrangements for community toilets
a. Pay and use (Every use) b. Monthly family pass
c. Free of cost
25. Charges a. 50 paise b. Rs 1-2 c. Rs. 2-3 d. Rs 3 and above e. monthly pass 1. less than 20 2. 20-30 3. 30-40
26.Are you satisfied with present arrangement
a. Yes b. No
27. If No state reasons* (tick all possible options)
a. poor maintenance b. corruption c. lack of facilities d. Other, Specify
28.Why you have not constructed toilet (Applicable if Q 14-15 are answered)
a. Affordability to construct toilet b .Affordability of connecting to sewer network
c. Uncertainty over land and tenure d. Space Constraints
e. Low priority given to sanitation (awareness) f. Lack of water
g. Lack of know how h. Any other
29.What facility would a. Household latrine (types): b. Pour flush twin
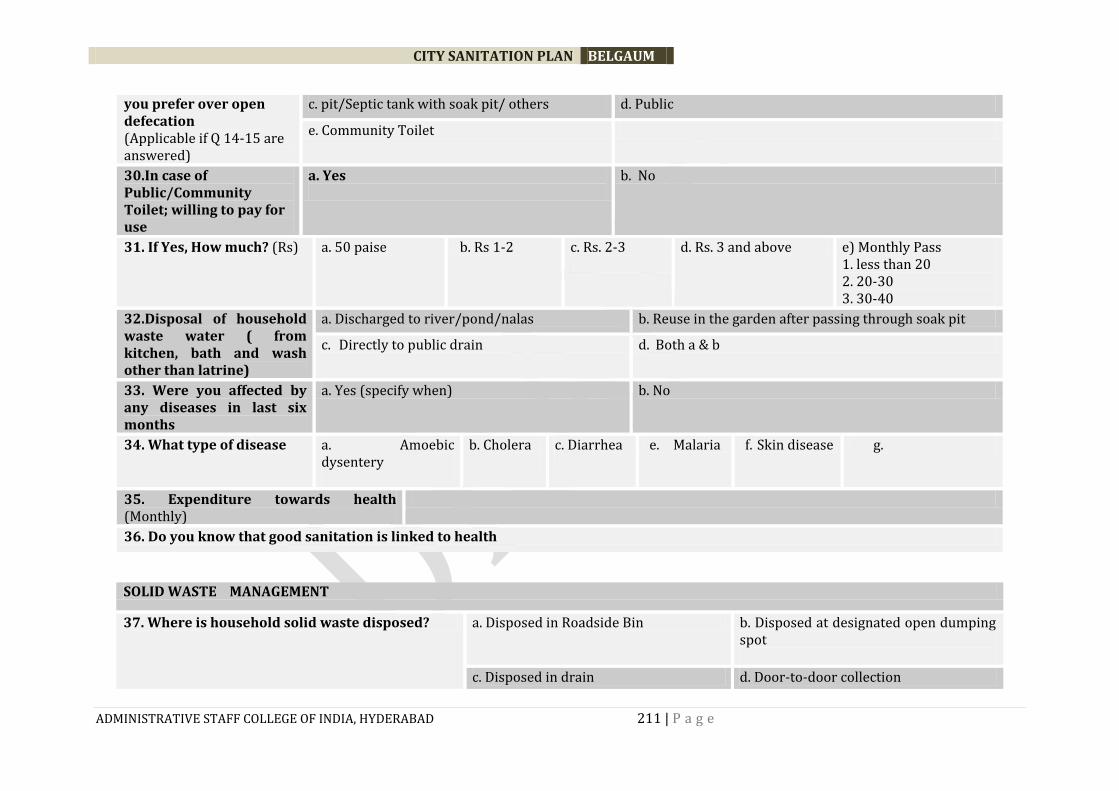
CITY SANITATION PLAN BELGAUM
ADMINISTRATIVE STAFF COLLEGE OF INDIA, HYDERABAD 211 | P a g e
you prefer over open defecation (Applicable if Q 14-15 are answered)
c. pit/Septic tank with soak pit/ others d. Public
e. Community Toilet
30.In case of Public/Community Toilet; willing to pay for use
a. Yes
b. No
31. If Yes, How much? (Rs) a. 50 paise b. Rs 1-2 c. Rs. 2-3
d. Rs. 3 and above e) Monthly Pass 1. less than 20 2. 20-30 3. 30-40
32.Disposal of household waste water ( from kitchen, bath and wash other than latrine)
a. Discharged to river/pond/nalas b. Reuse in the garden after passing through soak pit
c. Directly to public drain d. Both a & b
33. Were you affected by any diseases in last six months
a. Yes (specify when) b. No
34. What type of disease a. Amoebic dysentery
b. Cholera
c. Diarrhea
e. Malaria f. Skin disease g.
35. Expenditure towards health (Monthly)
36. Do you know that good sanitation is linked to health
SOLID WASTE MANAGEMENT
37. Where is household solid waste disposed? a. Disposed in Roadside Bin b. Disposed at designated open dumping spot
c. Disposed in drain d. Door-to-door collection

CITY SANITATION PLAN BELGAUM
ADMINISTRATIVE STAFF COLLEGE OF INDIA, HYDERABAD 212 | P a g e
38. Distance to Disposal Spot (Feet)
a. Less than 50 b. 50 to 100
c. 100 to 200 d. 200 to 500
e. More than 500
39. Does municipality carry the waste dumped in your locality?
a. Yes
b. No
40. Do you have door to door collection?
a. Yes
b. No
41. Frequency of collection? a. Daily twice
b. Daily once
c. Once in 2 days
d. Once in three days
e. Three days & Above
42. Is the waste segregated at the source?
a. Yes
b. No
43. Do you pay for the waste collected from the municipality?
a. Yes
b. No
44.How much do you pay
(Rs per month)
a. 0-10 b. 10-20 c. 20-25 d. 25-30 e. 30-35 e. 35 and above
45.Are you satisfied with the service a. Very good b. Good c. Average d. Bad
46. Frequency of road sweeping a. Daily once b. Once in two days
c. Twice weekly
d. Once in a week e. Irregular
47.Frequency of cleaning drains a. Daily once b. Once in two days
c. once in 3 days
d. once in a week e. Irregular
Housing
48. Structure a) Pucca b) semi-Pucca c) Kutcha
Flooding
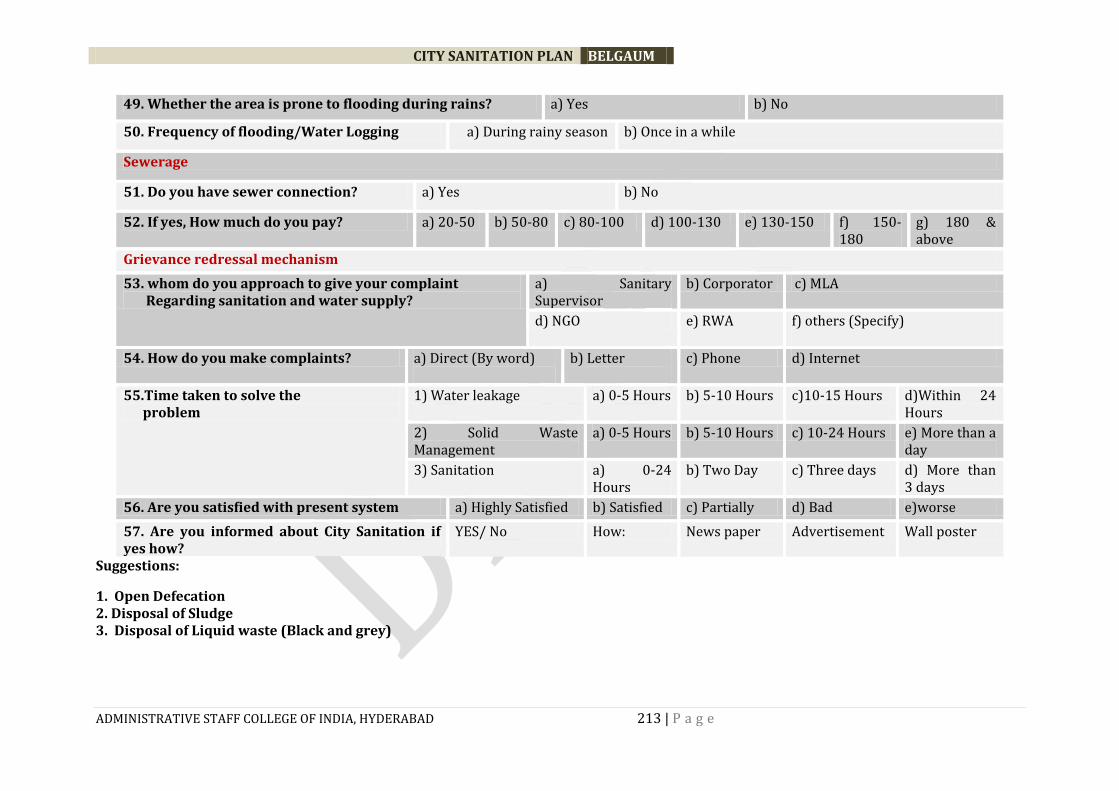
CITY SANITATION PLAN BELGAUM
ADMINISTRATIVE STAFF COLLEGE OF INDIA, HYDERABAD 213 | P a g e
49. Whether the area is prone to flooding during rains? a) Yes b) No
50. Frequency of flooding/Water Logging a) During rainy season b) Once in a while
Sewerage
51. Do you have sewer connection? a) Yes b) No
52. If yes, How much do you pay? a) 20-50 b) 50-80 c) 80-100 d) 100-130 e) 130-150 f) 150-180
g) 180 & above
Grievance redressal mechanism
53. whom do you approach to give your complaint Regarding sanitation and water supply?
a) Sanitary Supervisor
b) Corporator c) MLA
d) NGO e) RWA f) others (Specify)
54. How do you make complaints? a) Direct (By word)
b) Letter
c) Phone d) Internet
55.Time taken to solve the problem
1) Water leakage a) 0-5 Hours b) 5-10 Hours c)10-15 Hours d)Within 24 Hours
2) Solid Waste Management
a) 0-5 Hours b) 5-10 Hours c) 10-24 Hours e) More than a day
3) Sanitation a) 0-24 Hours
b) Two Day c) Three days d) More than 3 days
56. Are you satisfied with present system a) Highly Satisfied b) Satisfied c) Partially d) Bad e)worse
57. Are you informed about City Sanitation if yes how?
YES/ No How: News paper Advertisement Wall poster
Suggestions:
1. Open Defecation 2. Disposal of Sludge 3. Disposal of Liquid waste (Black and grey)
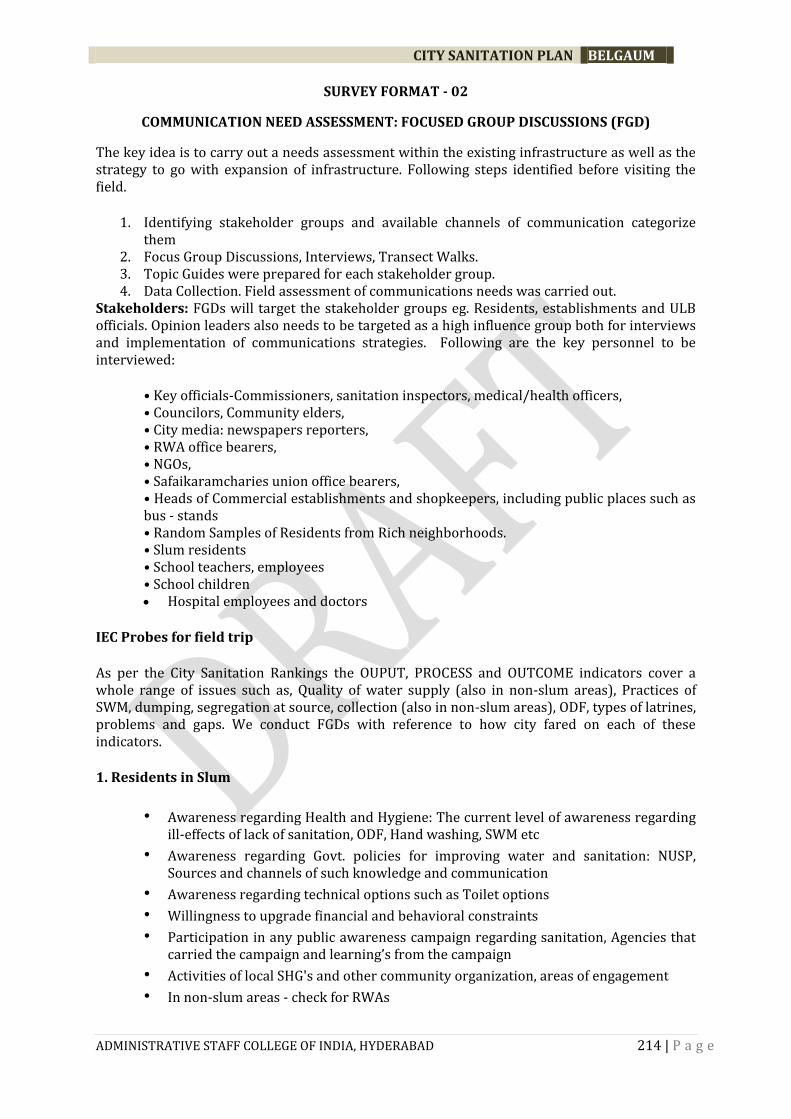
CITY SANITATION PLAN BELGAUM
ADMINISTRATIVE STAFF COLLEGE OF INDIA, HYDERABAD 214 | P a g e
SURVEY FORMAT - 02
COMMUNICATION NEED ASSESSMENT: FOCUSED GROUP DISCUSSIONS (FGD)
The key idea is to carry out a needs assessment within the existing infrastructure as well as the strategy to go with expansion of infrastructure. Following steps identified before visiting the field.
1. Identifying stakeholder groups and available channels of communication categorize them
2. Focus Group Discussions, Interviews, Transect Walks. 3. Topic Guides were prepared for each stakeholder group. 4. Data Collection. Field assessment of communications needs was carried out.
Stakeholders: FGDs will target the stakeholder groups eg. Residents, establishments and ULB officials. Opinion leaders also needs to be targeted as a high influence group both for interviews and implementation of communications strategies. Following are the key personnel to be interviewed:
• Key officials-Commissioners, sanitation inspectors, medical/health officers, • Councilors, Community elders, • City media: newspapers reporters, • RWA office bearers, • NGOs, • Safaikaramcharies union office bearers, • Heads of Commercial establishments and shopkeepers, including public places such as bus - stands • Random Samples of Residents from Rich neighborhoods. • Slum residents • School teachers, employees • School children Hospital employees and doctors
IEC Probes for field trip
As per the City Sanitation Rankings the OUPUT, PROCESS and OUTCOME indicators cover a whole range of issues such as, Quality of water supply (also in non-slum areas), Practices of SWM, dumping, segregation at source, collection (also in non-slum areas), ODF, types of latrines, problems and gaps. We conduct FGDs with reference to how city fared on each of these indicators.
1. Residents in Slum
• Awareness regarding Health and Hygiene: The current level of awareness regarding ill-effects of lack of sanitation, ODF, Hand washing, SWM etc
• Awareness regarding Govt. policies for improving water and sanitation: NUSP, Sources and channels of such knowledge and communication
• Awareness regarding technical options such as Toilet options
• Willingness to upgrade financial and behavioral constraints
• Participation in any public awareness campaign regarding sanitation, Agencies that carried the campaign and learning’s from the campaign
• Activities of local SHG's and other community organization, areas of engagement
• In non-slum areas - check for RWAs

CITY SANITATION PLAN BELGAUM
ADMINISTRATIVE STAFF COLLEGE OF INDIA, HYDERABAD 215 | P a g e
• Media consumption patterns reading newspapers, Cable TV etc (also in non-slum areas)
• Information regarding demography of the slum (To be gathered from surveys)
• Complaint resolution system: complaints and mechanisms of resolution, how do they deal with water and sanitation crisis, Approaching local corporator, Complain to Municipality, Agitate
2. Municipal officials (including Safaikaramcharies)
• Role envisaged for communication for implementing NUSP.
• Channels of communication are at ULB’s disposal, Extent to which these channels are being exploited.
• Technological options, geographic and infrastructural issues involved in implementing Water and Sanitation schemes.
• M&E, feedback, support, rewards: Maintenance of citizen grievance records, discernible patterns in complaints, efficiency of complaint redressal.
• Details of any specific communication campaign being take up, Content, Channels used, budget allocated, awareness regarding multiplying message through media.
• Kinds of training and tools are given to Safaikaramcharies for safe disposal of waste etc and their satisfaction at what has been provided.
3. Commercial establishment and Public places
• Observation regarding sanitation is these places
• Practices involved in disposal of commercial waste such as segregation, shopkeeper participation
• O&M, regular upkeep of public places
4. School Sanitation
Status of school sanitation Health Problems issues-drop out rates/ enrollment rates, girl children, status of SSA , O&M problems, Health problems.
5. Hospitals
Examine Disposal of hazardous waste, specifically if effluents are being left into open drains
Disease burden of the town, data from District Medical/Health Officer, information on campaigns to mitigate, budget allocated
Disease burden, Diarrhea, GET, Cholera, Malaria, Skin problems Communication efforts with reference to diarrhea, malaria etc.
6. Media Persons
Main Sanitation issues in the city Sanitation news stories Municipality PR. Who answers media enquiries? Municipal Advertisements in dailies.

CITY SANITATION PLAN BELGAUM
ADMINISTRATIVE STAFF COLLEGE OF INDIA, HYDERABAD 216 | P a g e
Checklists
1. Messages: Behavior change communication for residents, sustaining behavior and attitude change, attitudes of officials. Creating awareness about health and hygiene, environmental sanitation, helping officials be good listeners, improving management within existing constraints through better communication. Developing content for manuals for best communication practices, posters etc.
2. Channels of communication: these include grievance redressal mechanism of the MC, MC’s interaction with people- feedback seeking mechanisms, postures, hoardings, exhibitions, school activities, cable TV, FM Radio, Handbills, Newspapers, Street Plays, Meetings/seminars, workshops, presentations and interpersonal means.
Interpersonal means include interactive group education and door to door motivational programmes. Here the role of NGO’s is important.
3. Parameters: OUTPUT, PROCESS, OUTCOME as per NUSP
• Environmental Sanitation
SWM: market waste, domestic waste, waste segregation at source and at collection point, waste disposal measures
Treatment of solid waste and dump Deviance on part of polluters and institutions such as hospitals Proportion of solid waste, grey water, black water generated that is treated and
disposed safely ODF: public toilets, individual latrines, toilet maintenance, disposal of human waste, M&E to Track OD Check if Sewage systems are working properly Disposal of septage UGS: awareness, usercharges, problems Water, Quality of water in the city, in the water bodies in and around city, Reduction in water borne diseases amongst city-population
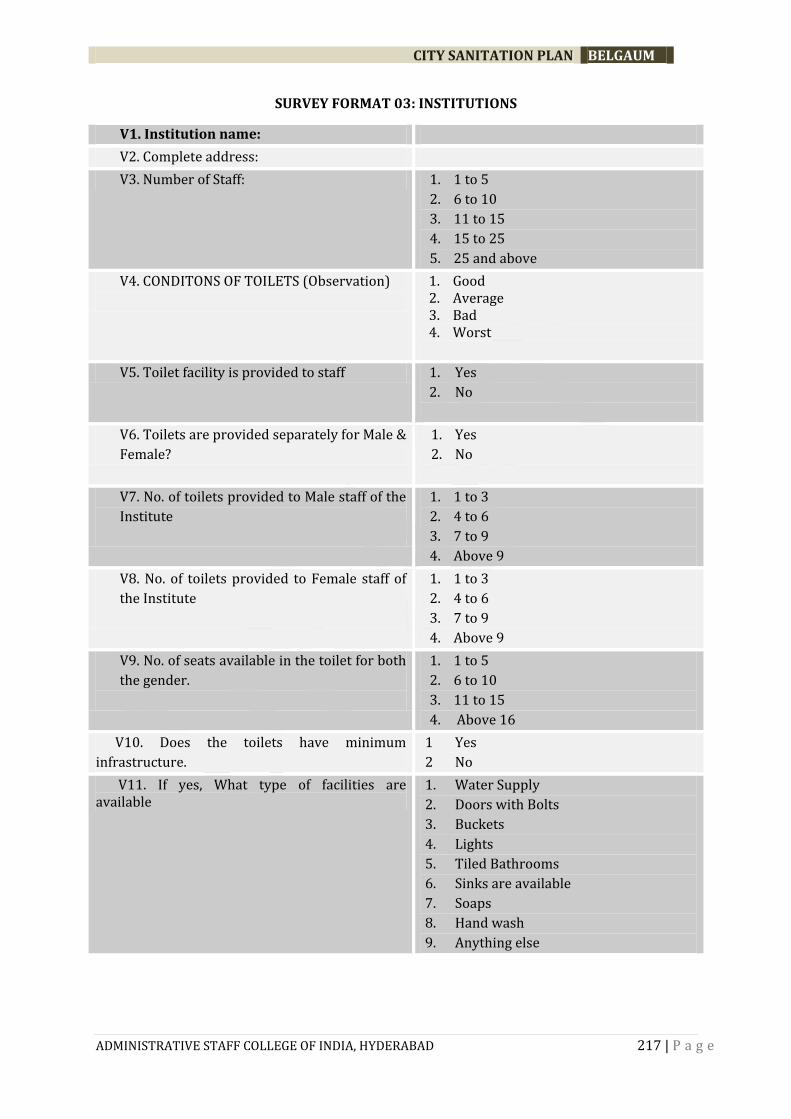
CITY SANITATION PLAN BELGAUM
ADMINISTRATIVE STAFF COLLEGE OF INDIA, HYDERABAD 217 | P a g e
SURVEY FORMAT 03: INSTITUTIONS
V1. Institution name:
V2. Complete address:
V3. Number of Staff: 1. 1 to 5
2. 6 to 10
3. 11 to 15
4. 15 to 25
5. 25 and above
V4. CONDITONS OF TOILETS (Observation)
1. Good 2. Average 3. Bad 4. Worst
V5. Toilet facility is provided to staff 1. Yes
2. No
V6. Toilets are provided separately for Male &
Female?
1. Yes
2. No
V7. No. of toilets provided to Male staff of the
Institute
1. 1 to 3
2. 4 to 6
3. 7 to 9
4. Above 9
V8. No. of toilets provided to Female staff of
the Institute
1. 1 to 3
2. 4 to 6
3. 7 to 9
4. Above 9
V9. No. of seats available in the toilet for both
the gender.
1. 1 to 5
2. 6 to 10
3. 11 to 15
4. Above 16
V10. Does the toilets have minimum
infrastructure.
1 Yes
2 No
V11. If yes, What type of facilities are available
1. Water Supply
2. Doors with Bolts
3. Buckets
4. Lights
5. Tiled Bathrooms
6. Sinks are available
7. Soaps
8. Hand wash
9. Anything else
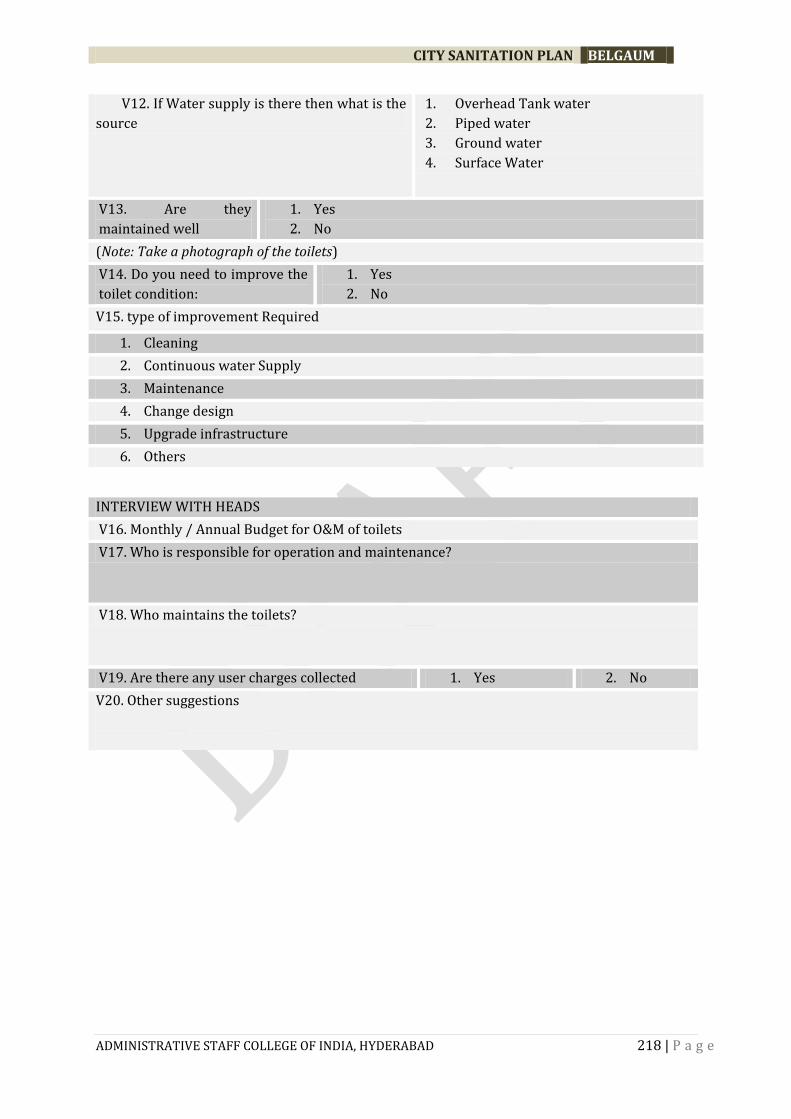
CITY SANITATION PLAN BELGAUM
ADMINISTRATIVE STAFF COLLEGE OF INDIA, HYDERABAD 218 | P a g e
V12. If Water supply is there then what is the
source
1. Overhead Tank water
2. Piped water
3. Ground water
4. Surface Water
V13. Are they
maintained well
1. Yes
2. No
(Note: Take a photograph of the toilets)
V14. Do you need to improve the
toilet condition:
1. Yes
2. No
V15. type of improvement Required
1. Cleaning
2. Continuous water Supply
3. Maintenance
4. Change design
5. Upgrade infrastructure
6. Others
INTERVIEW WITH HEADS
V16. Monthly / Annual Budget for O&M of toilets
V17. Who is responsible for operation and maintenance?
V18. Who maintains the toilets?
V19. Are there any user charges collected 1. Yes 2. No
V20. Other suggestions

CITY SANITATION PLAN BELGAUM
ADMINISTRATIVE STAFF COLLEGE OF INDIA, HYDERABAD 219 | P a g e
SURVEY FORMAT 04 COMMUNITY TOILETS
1. Town/city
2. Location
3. Maintained by/ service provider
4. Number of toilets a. Urinals b. Bath c. Washbasins
5. Male : 6. Female: 7. Children:
8. Pay per Use (In Rs) a. Defecation: b. Urinal: c. Bathing:
9. Number of people visiting per day
10. Condition a. Very good b. good c. average d. bad e. worse
11. Cleaning (Times per day):
12. Type of latrine
13. Feacal Sludge Management
a) Sewer
b) Manually Lifted
c) Onsite treatment
d) Other
14. Effluent Discharge(where does it go)
15. O & M Arrangement

CITY SANITATION PLAN BELGAUM
ADMINISTRATIVE STAFF COLLEGE OF INDIA, HYDERABAD 220 | P a g e
SURVEY FORMAT 05 PUBLIC TOILETS
1. Town/city
2. Location
3. Maintained by/ service provider
4. Number of toilets Urinals Bath Washbasins
5. Male : 6. Female: 7. Children:
8. Pay per Use (In Rs) d. Defecation: e. Urinal: f. Bathing:
9. Number of people visiting per day
10. Condition f. Very good g. g
o
o
d
h. Average i. Bad j. Worse
11. Cleaning (Times per day):
12. Type of latrine Pit / WC
13. Fecal Sludge Management
e) Sewer
f) Onsite treatment
g) Other
14. Onsite treatment Waste water
a. Sewer drain
b. Septic tank
c. Septic tank
d. Other
15. O & M
Arrangement
PPP NGO

CITY SANITATION PLAN BELGAUM
ADMINISTRATIVE STAFF COLLEGE OF INDIA, HYDERABAD 221 | P a g e
SURVEY FORMAT 06 HOSPITALS
1. Name of the Hospital
2. Location
3. Capacity (Beds)
4. Services Provided
5. Quantity of Solid waste produced by hospital (Kg)
6. Quantity of liquid waste produced by hospital (Liters)
7. Is colour coding done for the waste produced
Yes No
8. What is the arrangement for disposal of Bio Medical Waste
Municipality Private Own Arrangement
9. If it is private, how much do you pay?
10. Is there a system of segregating biodegradable and non biodegradable wastes
Yes No
11. Is the system of disposing Bio-medical waste Is in accordance with
Bio-Medical Waste (Management & Handling) rules, 1998 and amendments
Yes
No
12. Frequency of collection and disposal BMW (Hours)
13. How is the liquid BMW is disposed, Such as Blood, Mucus, Secretion and urine
14. Is there a mechanism for management of sludge from hospital cesspools?
Yes No
15. If yes, Please explain
16. Is there any decentralized waste water treatment
Yes No
If yes, give details
a. Capacity of plant
b. What type of treatment
c. Discharge after treatment (COD
level after treatment)

CITY SANITATION PLAN BELGAUM
ADMINISTRATIVE STAFF COLLEGE OF INDIA, HYDERABAD 222 | P a g e
SURVEY FORMAT 07 SCHOOLS
2
Strength No. of Students
(a) No. of Students Girls Boys
(b) No. of Teachers Female Male
(c) No. of other Staff
Female Male
3(a Students
No. of Urinals No. of WCs
Total requirement
Presently existed Balance to be constructed
Total requirement
Presently existing
Balance to be constructed o.k Under repairs
F M F M F M F M F M F M F M
3(b) Teachers
No. of Urinals No. of WCs
Total required
Presently existed Balance to be constructed
Total requirement
Presently existing
Balance to be constructed o.k Under repairs
F M F M F M F M F M F M F M
3(b) Other staff
No. of Urinals No. of WCs
Total required
Presently existed Balance to be constructed
Total requirement
Presently existing
Balance to be constructed o.k Under repairs
F M F M F M F M F M F M F M
4 Does the school have a waste water disposal (Other than WC water) Yes
No
5 Toilets Connected to: Septic Tank □ Sewerage □ Open drains □ Not connected □
6 Is the toilet properly ventilated? Yes No 7 Is the toilet tiled? Yes No
8 Does the toilet has electricity connection? Yes No
8(a) If yes, is it working? Yes No
9 Does the school have water connection? Yes No
10 Are there other sources of Water Supply? Borewell □ Tankers □ Others (specify) :
a. Basic Information
Name of the Respondent: Male/Female
Student □ Teacher □ Principal □ Others □
Name of the School
I.
II.
III.
Ownership of School Building:
Own □ Rent □
Address and location
Landmark
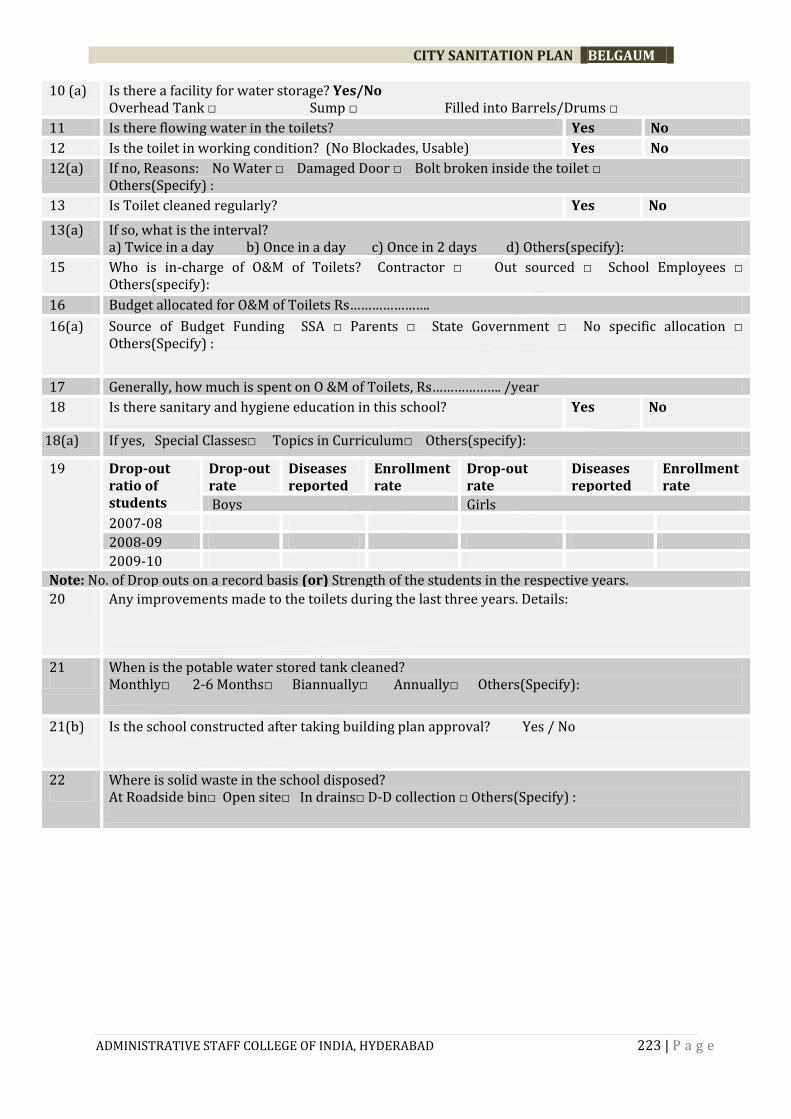
CITY SANITATION PLAN BELGAUM
ADMINISTRATIVE STAFF COLLEGE OF INDIA, HYDERABAD 223 | P a g e
10 (a) Is there a facility for water storage? Yes/No Overhead Tank □ Sump □ Filled into Barrels/Drums □
11 Is there flowing water in the toilets? Yes No
12 Is the toilet in working condition? (No Blockades, Usable) Yes No
12(a) If no, Reasons: No Water □ Damaged Door □ Bolt broken inside the toilet □ Others(Specify) :
13 Is Toilet cleaned regularly? Yes No
13(a) If so, what is the interval? a) Twice in a day b) Once in a day c) Once in 2 days d) Others(specify):
15 Who is in-charge of O&M of Toilets? Contractor □ Out sourced □ School Employees □ Others(specify):
16 Budget allocated for O&M of Toilets Rs………………….
16(a) Source of Budget Funding SSA □ Parents □ State Government □ No specific allocation □ Others(Specify) :
17 Generally, how much is spent on O &M of Toilets, Rs………………. /year
18 Is there sanitary and hygiene education in this school? Yes No
18(a) If yes, Special Classes□ Topics in Curriculum□ Others(specify):
19 Drop-out ratio of students
Drop-out rate
Diseases reported
Enrollment rate
Drop-out rate
Diseases reported
Enrollment rate
Boys Girls
2007-08
2008-09
2009-10
Note: No. of Drop outs on a record basis (or) Strength of the students in the respective years.
20 Any improvements made to the toilets during the last three years. Details:
21 When is the potable water stored tank cleaned? Monthly□ 2-6 Months□ Biannually□ Annually□ Others(Specify):
21(b) Is the school constructed after taking building plan approval? Yes / No
22 Where is solid waste in the school disposed? At Roadside bin□ Open site□ In drains□ D-D collection □ Others(Specify) :

CITY SANITATION PLAN BELGAUM
ADMINISTRATIVE STAFF COLLEGE OF INDIA, HYDERABAD 224 | P a g e
b. Perception Survey:
Principal:
1 Do you use toilets? Yes No
a If no, Where do you go by? a) Your home is nearby□ b) to neighbor’s home □ c) don’t drink water □ d) open defecate □ d) others (specify):
2 Are students allowed to leave in the mid of the classes to use the urinals?
Yes No
3 Are students of different classes having breaks at the same time/intervals?
Yes No
4 Do you feel any students having dropped out or frequently fallen sick & away from school days due to poor sanitation?
Yes No
5 Other Concerns/issues in maintenance of toilets?
Teachers:
1 Do You use the toilets? Yes No
a If no, Where do you go by? a) Your home is nearby□ b) to neighbor’s home □ c) don’t drink water □ d) open defecate □ d) others (specify):
2 Do you feel any students having dropped out or frequently fallen sick & away from school days due to poor sanitation?
Yes No
3 Have you seen any teacher transferred to another school due to poor sanitation?
Yes No
4 Other Concerns/issues in maintenance of toilets?
Students:
1 Do You use the toilets? Yes No
a If no, Where do you go by? a) Your home is nearby□ b) to neighbor’s home □ c) don’t drink water d) open defecate e) others (specify):
2 Do they wash their hands after they go to toilets? Yes No
3 Are you allowed to leave in the mid of the classes to use the urinals? Yes No
4 Are different classes having breaks at the same time/intervals? Yes No
5 Have you seen any of your friends having dropped out or frequently fallen sick & away from school days due to poor sanitation?
Yes No
6 Other Concerns/issues in maintenance of toilets?
Girl Students:
1 Is there arrangement for dustbin in the toilets? Yes No
2 Do you attend school during menstrual period? Yes No
3 Any special menstrual hygiene classes? Yes No
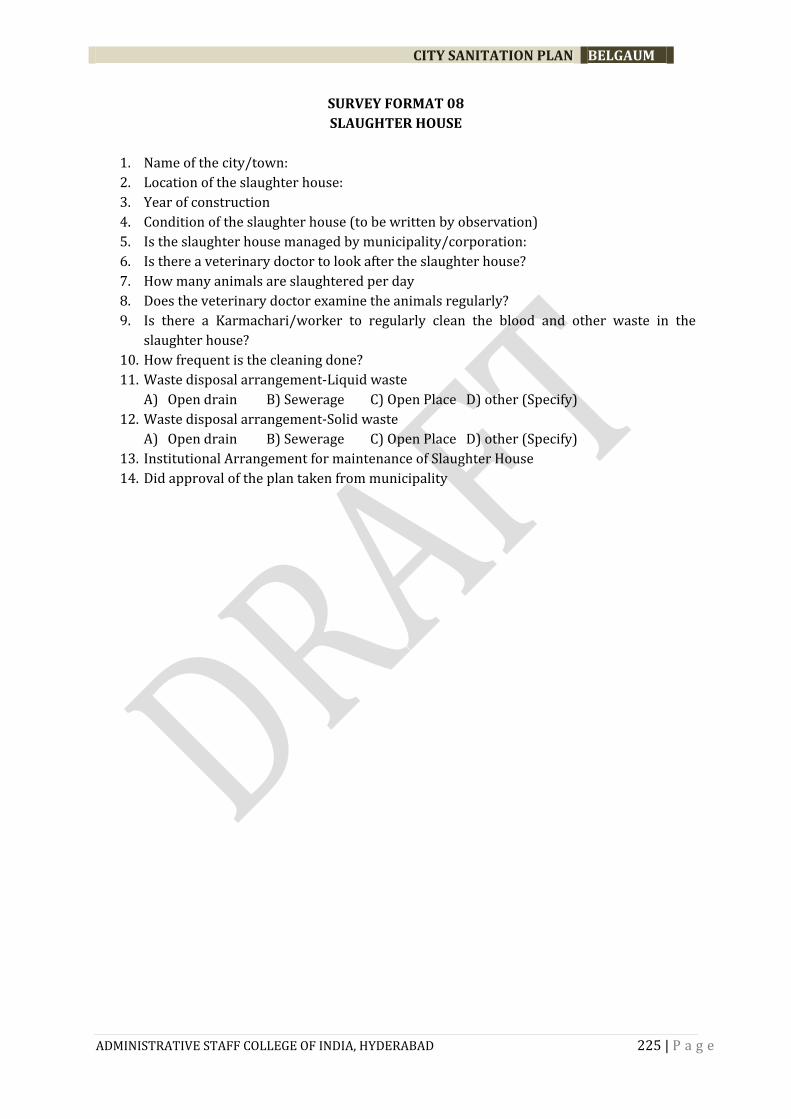
CITY SANITATION PLAN BELGAUM
ADMINISTRATIVE STAFF COLLEGE OF INDIA, HYDERABAD 225 | P a g e
SURVEY FORMAT 08
SLAUGHTER HOUSE
1. Name of the city/town:
2. Location of the slaughter house:
3. Year of construction
4. Condition of the slaughter house (to be written by observation)
5. Is the slaughter house managed by municipality/corporation:
6. Is there a veterinary doctor to look after the slaughter house?
7. How many animals are slaughtered per day
8. Does the veterinary doctor examine the animals regularly?
9. Is there a Karmachari/worker to regularly clean the blood and other waste in the
slaughter house?
10. How frequent is the cleaning done?
11. Waste disposal arrangement-Liquid waste
A) Open drain B) Sewerage C) Open Place D) other (Specify)
12. Waste disposal arrangement-Solid waste
A) Open drain B) Sewerage C) Open Place D) other (Specify)
13. Institutional Arrangement for maintenance of Slaughter House
14. Did approval of the plan taken from municipality

CITY SANITATION PLAN BELGAUM
ADMINISTRATIVE STAFF COLLEGE OF INDIA, HYDERABAD 226 | P a g e
SURVEY FORMAT 09
COMMERCIAL PLACES
1. Name of the Commercial place
2. Name of Respondent
3. Gender a. Male b. Female
4. Duration of work
5. Number of workers in the shop
Male : Female:
a. 1-2 b. 1- 5 c. 5-10
d. 10-20 e. 20-30 f. 30 & above
6. Toilets Availability in the Shop/complex a. Yes b. No
7. Number of seats a. 1 to 5 b. 6 to 10 c. Above10
d. Only Urinals
8. Are the workers allowed to use a. Yes b. No
9. Awareness about a Public toilet in the premises a. Yes b. No
10. In case of necessity, usage pattern a. Complex toilets b. Public toilets
c. open defecation d. wait for an opportunity
11. Willingness to have pay and use toilets
(in case of no provision)
a. Yes b. No
12. Specific amount they can afford (Rs.) a. Up to 1 b.1 to 2 c. 2-3 d. Monthly pass
1. less than
20
2. 20-30 3. 30-40
13. Where do you throw your waste a. On the road b. Nearby bin
c. Nalas d. Other
14. How much do you pay for Garbage collection?
Per Month
a. 100-300 b. 301-700 c. 701-1500
d. 1501-3000 e. 3000 Above
15. Is the garbage collected regularly? a. Yes b. No
16. How regularly the garbage is being collected a. Daily twice b. once daily c. once in two days
d. once in 3 days e. 3 days and above
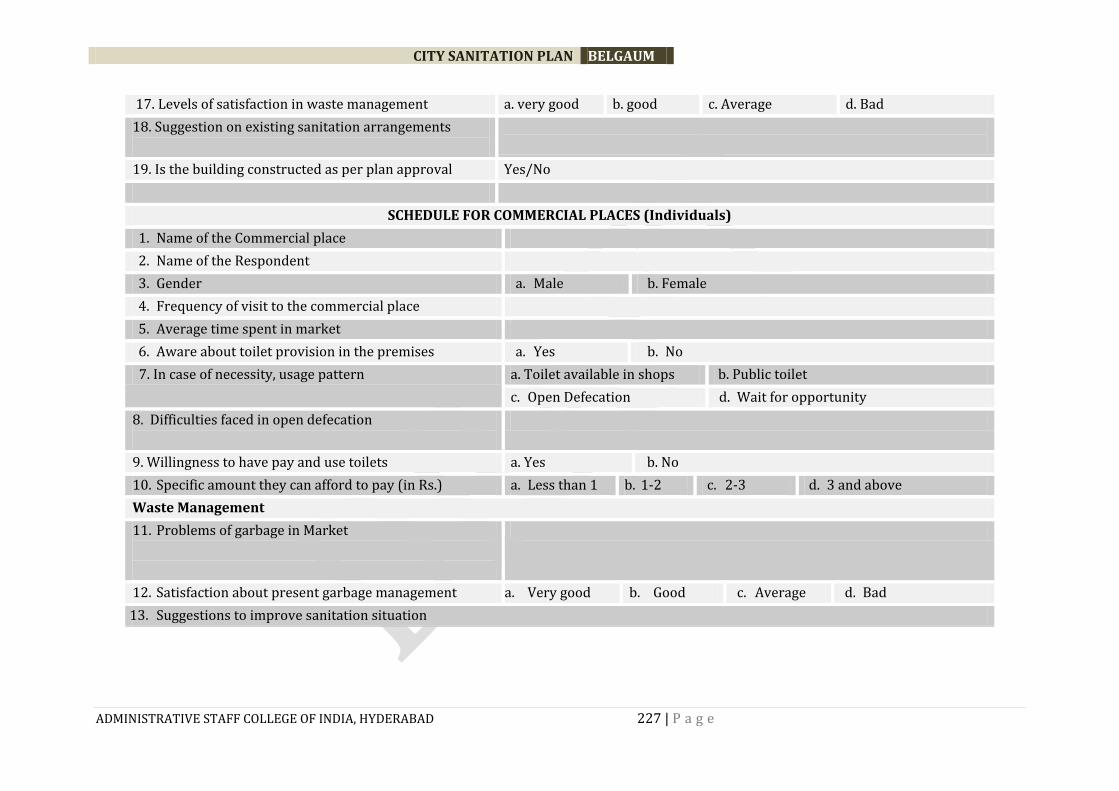
CITY SANITATION PLAN BELGAUM
ADMINISTRATIVE STAFF COLLEGE OF INDIA, HYDERABAD 227 | P a g e
17. Levels of satisfaction in waste management a. very good b. good c. Average d. Bad
18. Suggestion on existing sanitation arrangements
19. Is the building constructed as per plan approval Yes/No
SCHEDULE FOR COMMERCIAL PLACES (Individuals)
1. Name of the Commercial place
2. Name of the Respondent
3. Gender a. Male b. Female
4. Frequency of visit to the commercial place
5. Average time spent in market
6. Aware about toilet provision in the premises a. Yes b. No
7. In case of necessity, usage pattern a. Toilet available in shops b. Public toilet
c. Open Defecation d. Wait for opportunity
8. Difficulties faced in open defecation
9. Willingness to have pay and use toilets a. Yes b. No
10. Specific amount they can afford to pay (in Rs.) a. Less than 1 b. 1-2 c. 2-3 d. 3 and above
Waste Management
11. Problems of garbage in Market
12. Satisfaction about present garbage management a. Very good b. Good c. Average d. Bad
13. Suggestions to improve sanitation situation

CITY SANITATION PLAN BELGAUM
ADMINISTRATIVE STAFF COLLEGE OF INDIA, HYDERABAD 228 | P a g e
SURVEY FORMAT 10
INDUSTRIES
1. Name of the Town/City
2. Name of the industry
3. Type of industry
4. Location of the city
a) Residential Area
b) Institution area
c) Market area
d) Industrial area
e) Other (Specify)
5. Size of the industry
a) Small scale,
b) medium scale
c) large scale
6. Amount of Solid Waste generated per day?
7. How is the Solid Waste managed?
a) By industry itself
b) By municipality
c) Private agency
d) Other (Specify)
8. If it is municipality, how much do you pay per month?
Specify the amount
9. If it is private agency, how much do you pay per month?(Specify the amount)
10. Is source segregation done at industry?
11. Amount of Liquid waste generated per day?
12. How is the liquid waste managed?
1. Treated in PTP (primary treatment plant) in the industry and left to Nalla
2. Directly left to sewerage
3. Directly left to Nalla
4. Led to open place
5. Led to a water body
13. Is there a primary treatment plant in the industry?
14. What is the O&M cost for maintaining PTP in the industry?
Specify the amount
15. Is the industry in conformity with the state and Central Pollution Control Board set
parameters?
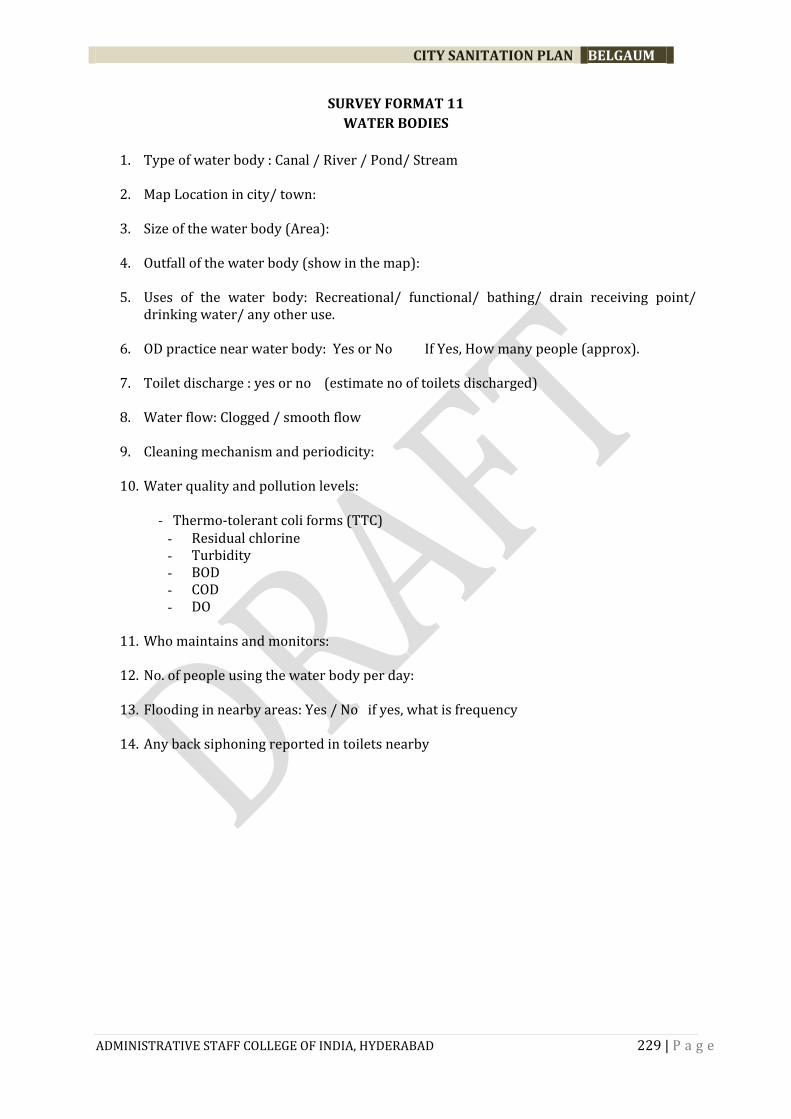
CITY SANITATION PLAN BELGAUM
ADMINISTRATIVE STAFF COLLEGE OF INDIA, HYDERABAD 229 | P a g e
SURVEY FORMAT 11
WATER BODIES
1. Type of water body : Canal / River / Pond/ Stream
2. Map Location in city/ town:
3. Size of the water body (Area):
4. Outfall of the water body (show in the map):
5. Uses of the water body: Recreational/ functional/ bathing/ drain receiving point/
drinking water/ any other use.
6. OD practice near water body: Yes or No If Yes, How many people (approx).
7. Toilet discharge : yes or no (estimate no of toilets discharged)
8. Water flow: Clogged / smooth flow
9. Cleaning mechanism and periodicity:
10. Water quality and pollution levels:
- Thermo-tolerant coli forms (TTC) - Residual chlorine - Turbidity - BOD - COD - DO
11. Who maintains and monitors:
12. No. of people using the water body per day:
13. Flooding in nearby areas: Yes / No if yes, what is frequency
14. Any back siphoning reported in toilets nearby

CITY SANITATION PLAN BELGAUM
ADMINISTRATIVE STAFF COLLEGE OF INDIA, HYDERABAD 230 | P a g e
SURVEY FORMAT 12
A. CHECK LIST
I Base Maps 1. Map showing ward boundaries with population
2. Map showing zone wise boundaries with population
3. Map with location of notified and non-notified slums
4. Map showing location of different types of areas by activities (industries, commercial activity, recreational activity
5. Map showing location of public and community toilets
6. Map showing open defecation areas / Septage disposal sites.
7. Maps showing water supply network, sewerage network, storm water drainage network and SWM facilities
8. Map showing location of water bodies / drain out falls
II Secondary Information
1. District census handbook
2. Data on access to services from census and NSSO studies
3. CDP for the city
4. Master plan for the city
5. DPRs for water supply, sewerage including STPs, sanitation, storm water drainage, SWM, environment including water bodies and slum development
6. Environment status report
7. Data on number of water bodies and extent of pollution
8. Quality of water in water bodies
9. Data on extent of grey water generation, collection and treatment and a comparative assessment with sewage waste
10. Data on number of STPs, volume of waste generated and treated, extent of reuse and recycle of waste water
11. Arrangements for septage treatment
12. Data on access to toilets by type (connected to sewerage, septic tanks, pits) and by wards – in terms of households and properties
13. Data on number of notified and non-notified slums by wards along with population and access to services
14. Data on community toilets by wards and by slums
15. Data on public toilets by wards and by type of areas (residential, industrial, commercial etc.)

CITY SANITATION PLAN BELGAUM
ADMINISTRATIVE STAFF COLLEGE OF INDIA, HYDERABAD 231 | P a g e
16. Data on manual scavenging practices and areas
17. Data on length of sewerage network and percentage of area and population covered by sewerage network by wards
18. Data on length of drainage network , types of drains, location of drainage outfalls and impact areas
19. Type of existing technological choices and feasibility of the same
20. Number of government and private primary, secondary and higher secondary schools and the sanitation status for both boys and girls in terms of number and type of toilet facilities
21. Details of hazardous, industrial, health and other types of wastes
22. Mapping of key institutions along with roles and responsibilities with a specific focus on sanitation
23. Organogram for each key institution
24. Data on programmes and schemes implemented by various institutions with special focus on ULB schemes and sanitation schemes
25. Existing regulatory arrangements for sanitation
26. Number of workers engaged in sanitation
27. Extent of cost recovery and user charges in sewerage and SWM
28. Type of O&M system
29. Monitoring and evaluation arrangements for sanitation and to track open defecation
30. Monthly collection of data on open defecation
31. Reportage on open defecation in a public forum
32. Incentives and awards for preventing open defecation
33. Complaint registration and grievance redressal mechanisms
34. Special focus on historical monuments and major recreation areas
35. Data on health indicators with a special focus on water and sanitation related diseases and incidence of diarrheal diseases reported in the city over the last three financial years
36. Data on drinking water quality
37. Roles of NGOs
38. Collection of existing IEC materials including news paper clippings
39. Number and percentage of floating population
40. Number of flooding and waterlogging incidences
41. Percentage of households/properties openly depositing human excreta into nalas and drains

CITY SANITATION PLAN BELGAUM
ADMINISTRATIVE STAFF COLLEGE OF INDIA, HYDERABAD 232 | P a g e
42. Proportion of storm water that is efficiently and safely managed – 100% pacca drains and flooding and water logging incidences
43. Protective gear and safety equipment to sewerage and STP workers
44. Mechanical, CCTV, systems are being used for monitoring and cleaning sewers
45. Whether workers are provided insurance/provident fund/gratuity
46. Whether there is functioning grievance redressal mechanism for complaints related to sewerage and septage
47. Whether septage/sullage (cleaners) workers use protective gear and safety equipment
48. Whether mechanical (non-manual) systems are being used for cleaning tanks and pits
49. Whether the cleaning and disposal of sludge from tanks and pits is monitored
50. Centralized data base, maps exist for drainage system
51. Pre-monsoon and one other season cleaning, repairs and maintenance of drains undertaken
52. Coverage of households and establishments by daily door-to-door collection
53. Proportion of city streets effectively covered by regular street sweeping, at least once a day
54. Proportion of waste that is processes and recycled
55. Cost recovery for SWM services
56. Availability of written manual and codified procedures for sewerage, septage, drainage and SWM
57. Status of State/ULB Acti provisions for punishments/fines for littering and letting out untreated excreta in the open
58. Implementation of above rules in practice
59. Instances of fines in the last one year for littering and letting out in open
60. Conditions at dumping site and treatment plant