city or location month xx, 20xx -...
TRANSCRIPT

City or location Month XX, 20XX June 28 , 2006
AES CORPORATIONElectricidad de Caracas Business Review
Julian NebredaChief Executive Officer
1www.aes.com
Safe Harbor Disclosure
Certain statements in the following presentation regarding AES’s business operations may constitute “forward looking statements.” Such forward-looking statements include, but are not limited to, those related to future earnings, growth and financial and operating performance. Forward-looking statements are not intended to be a guarantee of future results, but instead constitute AES’s current expectations based on reasonable assumptions. Forecasted financial information is based on certain material assumptions. These assumptions include, but are not limited to continued normal or better levels of operating performance and electricity demand at our distribution companies and operational performance at our contract generation businesses consistent with historical levels, as well as achievements of planned productivity improvements and incremental growth from investments at investment levels and rates of return consistent with prior experience. For additional assumptions see the Appendix to this presentation. Actual results could differ materially from those projected in our forward-looking statements due to risks, uncertainties and other factors. Important factors that could affect actual results are discussed in AES’s filings with the Securities and Exchange Commission including but not limited to the risks discussed under Item 1A “Risk Factors” in the Company’s 2005 Annual Report on Form 10-K as well as our other SEC filings. AES undertakes no obligation to update or revise any forward-looking statements, whether as a result of new information, future events or otherwise.

2www.aes.com
AES Goals AES 2008 Target EDC Role
Electricidad de Caracas Strategic OverviewContains Forward Looking Statements
Financial Goals
Revenue Growth
Gross Margin Growth
Earnings Per Share Growth
ROIC Improvement (1)
Cash Flow Growth
Subsidiary Distributions (1)
Restructuring Opportunities
Growth Goals
Platform Expansion
Greenfield Investment
Privatization/M&A
--
$3.5 Billion
13-19% per Year
11%
$2.6-2.9 Billion
--
--
--
--
--
Below Average
Above Average
Below Average
Above Average
Above Average
Increasing
Largely Completed
Limited Opportunities
Not a Current Focus
Not a Current Focus(1) Non-GAAP financial measure. See Appendix.

3www.aes.com
Venezuela Highlights
Venezuela at a Glance
Bolívar (Bs)US$1= Bs 2.150
US$ 4,77414.4%
OilCaracasCaracas
26.6 million
Currency Exchange Rate (12/1/05)Per Capita GDP (2005E)Inflation Rate (2005)Economic DriversCapital Largest CityPopulation (2005E)

4www.aes.com
Generation DistributionIPP Transmission
Venezuela Electricity Market Characteristics
Sources: Oficina de Operación de Sistemas Interconectados (OPSIS, National Venezuelan Electrical Power Control Center) and Cámara Venezolanade la Industria Eléctrica (CAVEINAL, Venezuelan Electric Industry Chamber), as of December 31, 2005.
Eight generation companies (five state-owned, three private)
Installed capacity of22,462MW
66% hydroelectric 34% thermal
State-owned companiesown 88% of installedcapacity, 10% by EDC,2%by local private companies
EDELCA (state-ownedhydroelectric company)generates 72% of NationalInterconnected System(SIN) electricity
94% of the nationalpopulation (more than 24million) is served by thedistribution companies
71% is served by state-owned companies, mainly CADAFE29% by private companies, mainly EDC
Regulated public serviceExclusive geographic concessions for regulated customersTariffs set every four years based on a “cost plus” methodology
Four companies – threestate-owned and oneprivate (EDC)
Regulated public serviceExclusive geographic concessions for regulated customersOver 22,500 km of linesVoltages: 765kV, 400kV, 230kV, 138kV and 115/kV
Four companies – threeprivate and one state-owned
Installed capacity 1,480MWPDVSA 980MWGENEVAPCA (EDC) 300MWTurboven (PSEG) 120MWTermobarrancas(REPSOL) 80MW
5www.aes.com
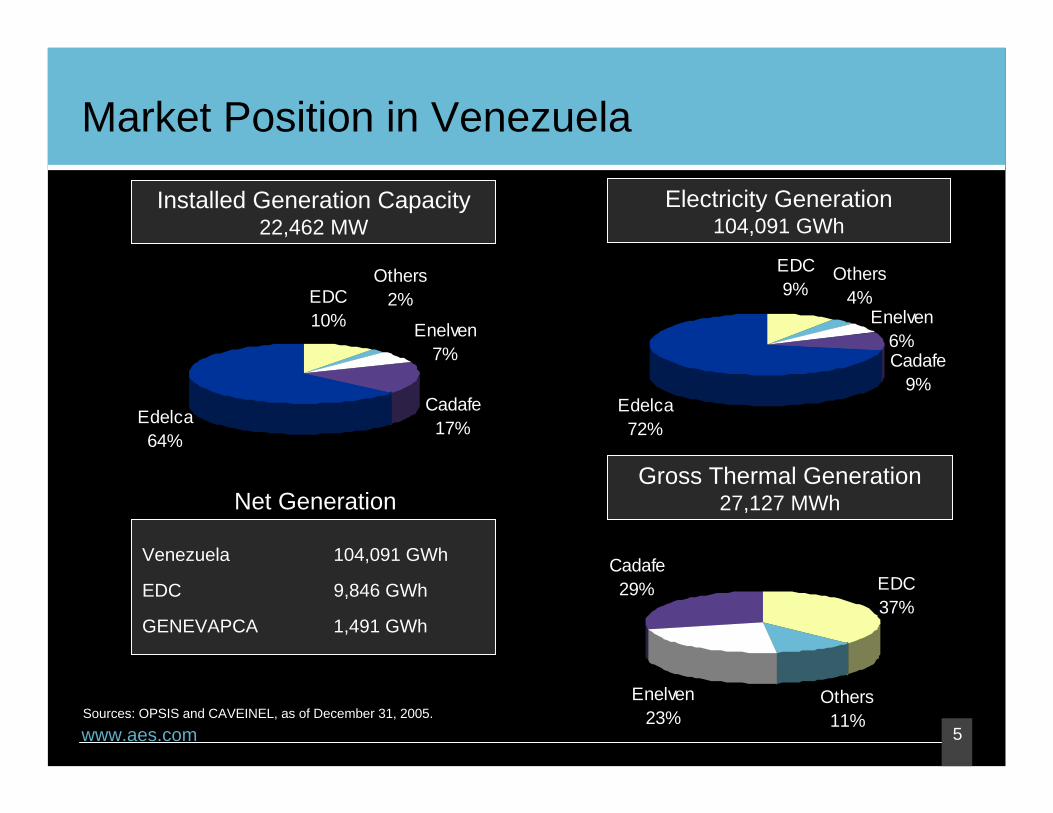
EDC37%
Others11%
Enelven23%
Cadafe29%
Market Position in Venezuela
Edelca72%
Others4%
Enelven6%Cadafe
9%
EDC 9%
Installed Generation Capacity 22,462 MW
Electricity Generation 104,091 GWh
Gross Thermal Generation 27,127 MWh
Venezuela 104,091 GWh
EDC 9,846 GWh
GENEVAPCA 1,491 GWh
Edelca64%
Enelven7%
Others2%
Cadafe17%
EDC10%
Sources: OPSIS and CAVEINEL, as of December 31, 2005.
Net Generation

6www.aes.com
Venezuela Electricity Demand Growth
(15%)
(10%)
(5%)
0%
5%
10%
15%
20%
1995 1996 1997 1998 1999 2000 2001 2002 2003 2004 2005
GDP Growth Energy Demand Growth
Sources: CAVEINEL and Banco Central de Venezuela (BCV).
(Year over Year)
7www.aes.com
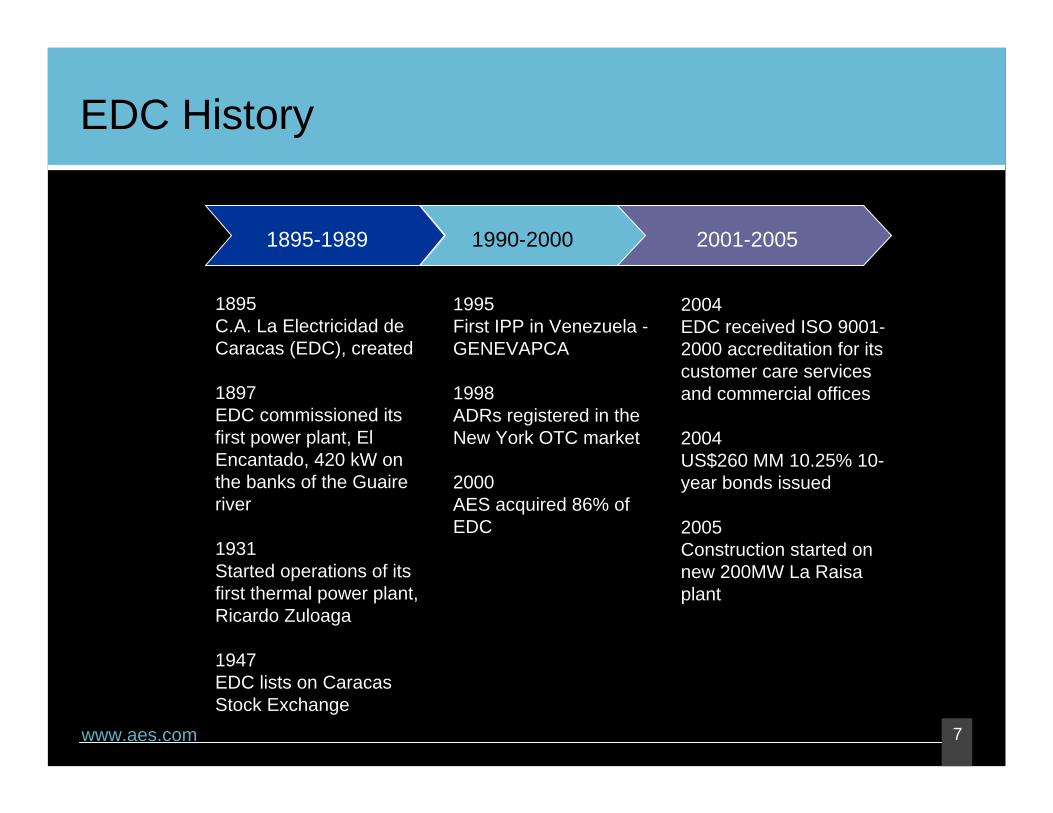
EDC History
1895C.A. La Electricidad de Caracas (EDC), created
1897EDC commissioned its first power plant, El Encantado, 420 kW on the banks of the Guaire river
1931Started operations of its first thermal power plant, Ricardo Zuloaga
1947EDC lists on Caracas Stock Exchange
2004EDC received ISO 9001-2000 accreditation for its customer care services and commercial offices
2004US$260 MM 10.25% 10-year bonds issued
2005Construction started on new 200MW La Raisa plant
1995First IPP in Venezuela -GENEVAPCA
1998ADRs registered in the New York OTC market
2000AES acquired 86% of EDC
1895-1989 1990-2000 2001-2005

8www.aes.com
EDC Service Area
EDC serves the Greater Caracas region, and Vargas State Venezuela’s largest population center, and the smaller San Felipe area
EDC Service Area5,176 km2 service territory
Approximately one million customers serving population of approximately 5 million
10,807 km transmission lines
10,525 GWh of power sold in 2005
Greater CaracasService AreaSan Felipe Service Area

9www.aes.com
EDC Generation Plants
Tacoa
CRZ 1 - 6
OAM
9 - 13
120 MW
Arrecifes
CRZ 11-14Tacoa Expansion
CRZ 7 - 9
2,616MW installed capacity - 20 turbines
336 MW 450 MW1,410 MW 300 MW
GENEVAPCA
IPP
Gas/Fuel Oil #2
Gas/Fuel Oil #2
Gas/Fuel Oil #6
GasGasType of fuel
19951994 - 19951999 - 2000
1978 - 19811956 - 19661951 - 1959Commissioned
3 x 100 MW5 x 90 MW3 x 470 MW2 x 40 MW2 x 60 MW2 x 68 MW
3 x 40 MWInstalled ratedcapacity
CombustionCombustionSteamSteamSteamTurbines

10www.aes.com
81.9%
85.3%84.9%
2003 2004 2005
61.9% 65.8%
61.3% 54.7% 53.0%
2003 2004 2005
EDC Performance KPIs
Net Capacity Factor (NCF)Equivalent Availability
Factor (EAF)
Without Hydro Purchases
Values correspond to a 12-month moving average
11www.aes.com
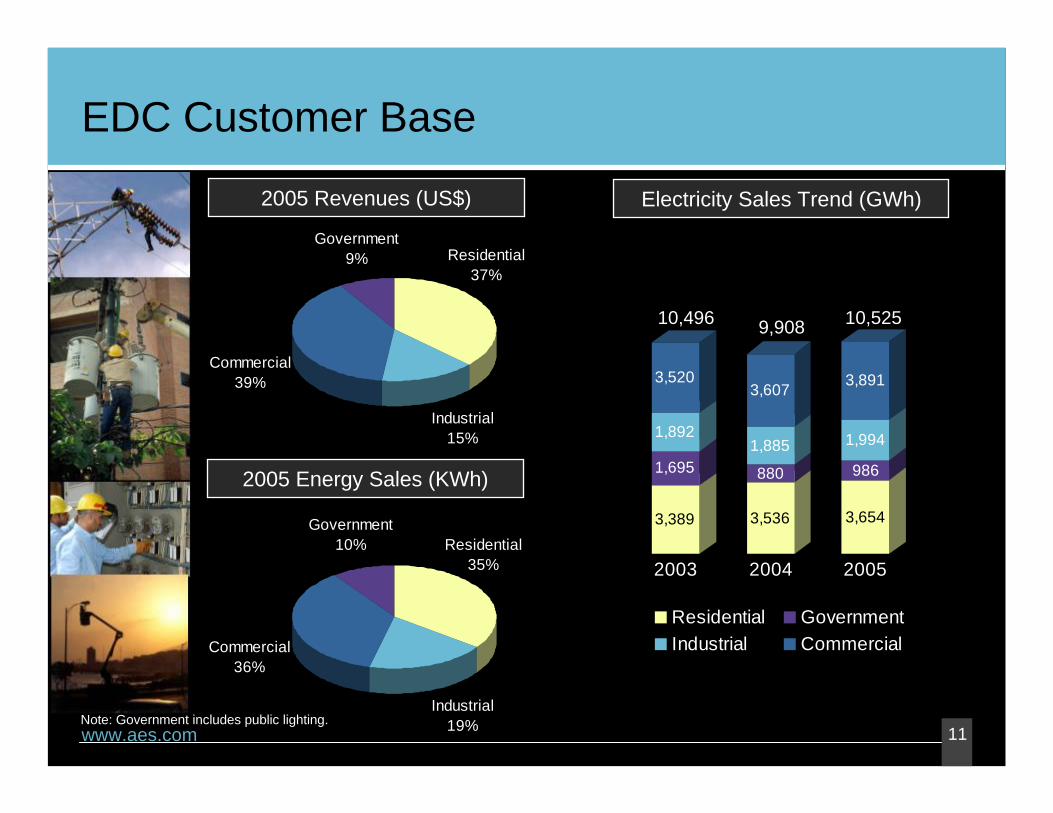
3,389
1,695
1,892
3,520
3,536
880
1,885
3,607
3,654
986
1,994
3,891
2003 2004 2005
Residential GovernmentIndustrial Commercial
Industrial19%
Commercial36%
Government10% Residential
35%
2005 Energy Sales (KWh)
2005 Revenues (US$)
EDC Customer Base
Note: Government includes public lighting.
Electricity Sales Trend (GWh)
10,496 9,908 10,525
Industrial15%
Commercial39%
Government9% Residential
37%
12www.aes.com
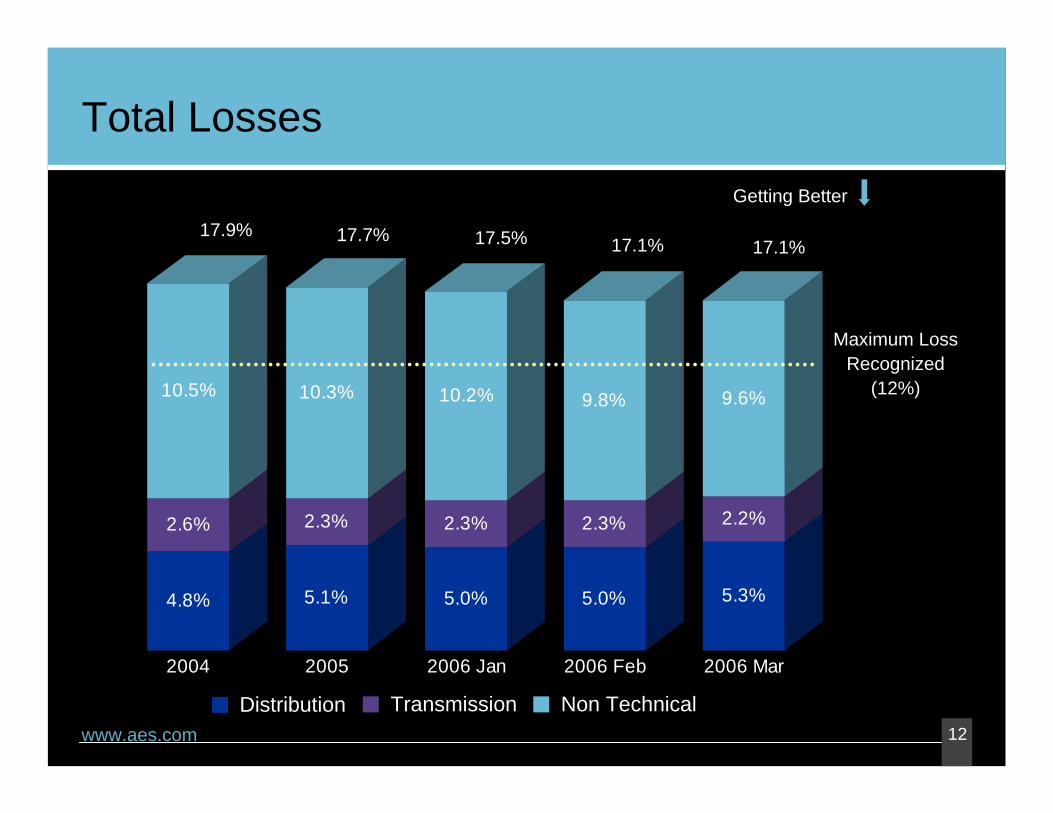
Total Losses
4.8%
2.6%
10.5%
5.1%
2.3%
10.3%
5.0%
2.3%
10.2%
5.0%
2.3%
9.8%
5.3%
2.2%
9.6%
2004 2005 2006 Jan 2006 Feb 2006 Mar
17.9% 17.7% 17.5% 17.1% 17.1%
Maximum Loss Recognized
(12%)
Getting Better
Distribution Transmission Non Technical

13www.aes.com
Venezuela Tariff Regime
COST OF SERVICE
Generation
Energy Purchased
Transmission
Annual depreciation charge (revalued)O&M and other expensesLabor expensesFuel costsIncome taxesReturn on Rate Base
Annual depreciation charge (revalued)O&M and other expensesLabor expensesIncome taxesReturn on Rate Base
Annual depreciation charge (revalued)
O&M and other expenses
Labor expenses
Income taxes
Return on Rate Base
Direct pass-through
COST
+
RETURN
HV Distribution
MV DistributionLV DistributionStreet Lighting
Retail

14www.aes.com
0
20
40
60
80
100
120
EDC’s Tariff Composition
46.9% 7.4%0% 0%
Variable Cost : Fuel + Energy purchasesAdded Value Gen, T&D : Fixed Cost + Tariff return
Annual Changein Added Value
94.57 98.99 103.43 107.11
(1) As of December 31, unless otherwise indicated.
Bs
/ KW
(1)
2003 2004 2005 April2006
15www.aes.com
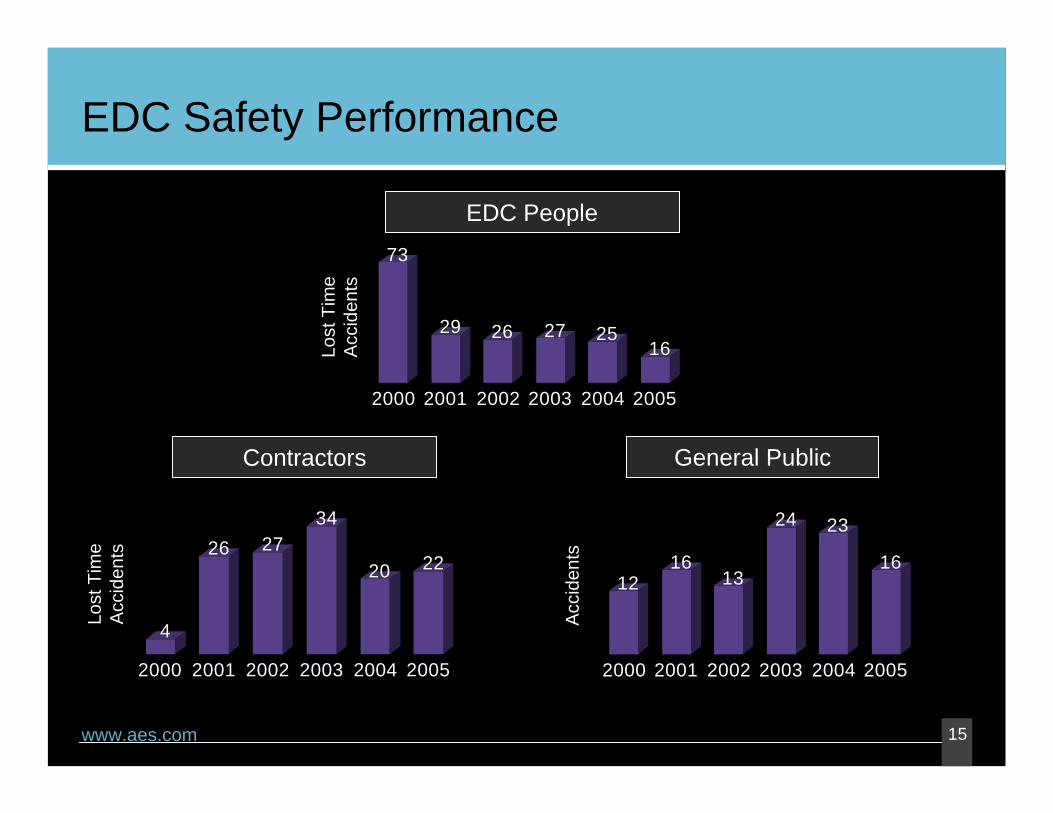
EDC Safety Performance
73
29 26 27 2516
2000 2001 2002 2003 2004 2005
Lost
Tim
eA
ccid
ents
Contractors General Public
EDC People
4
26 2734
20 22
2000 2001 2002 2003 2004 2005
1216
13
24 23
16
2000 2001 2002 2003 2004 2005
Acc
iden
ts
Lost
Tim
eA
ccid
ents
16www.aes.com
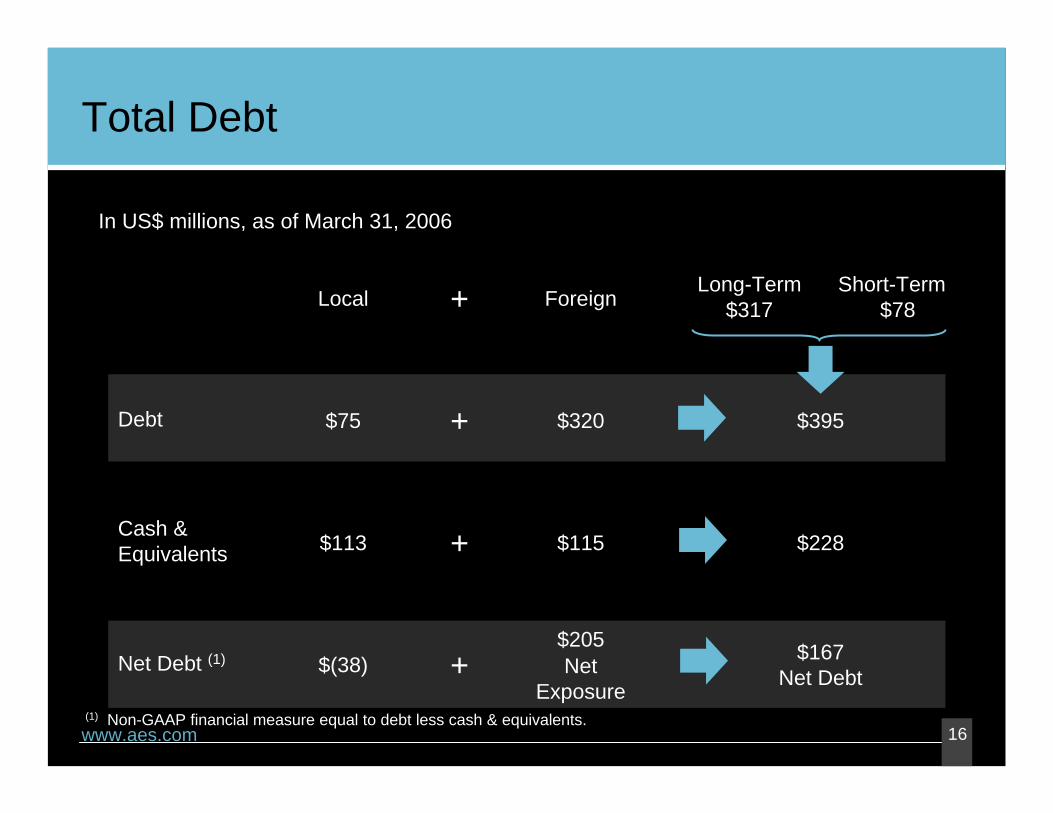
Total Debt
In US$ millions, as of March 31, 2006
+
+
+
+
$167Net Debt
$205Net
Exposure$(38)Net Debt (1)
$228$115$113Cash & Equivalents
$395$320$75Debt
Short-Term$78
Long-Term$317ForeignLocal
(1) Non-GAAP financial measure equal to debt less cash & equivalents.

17www.aes.com
31%
69%
26%
74%
20%
80%
27%
73%
22%
78%
19%
81%
Strengthening EDC’s Financial ProfileTenor
Currency
Rate
Long-Term Short-Term
2004 2005 Contains Forward Looking Statements
BolivarsUS Dollars
Fixed Floating
Dividends Declared (US$ Millions)
2003
$12
2004
$107
2005
$100
2006YTD
$117
Note: Dividends are declared in bolivars; US$ equivalent at exchange rate at declaration date.
0
100
200
300
2006 2007 2008 2009 2010 2011 2012 2013 2014
US$
Milli
ons
Amortization Schedule
18www.aes.com
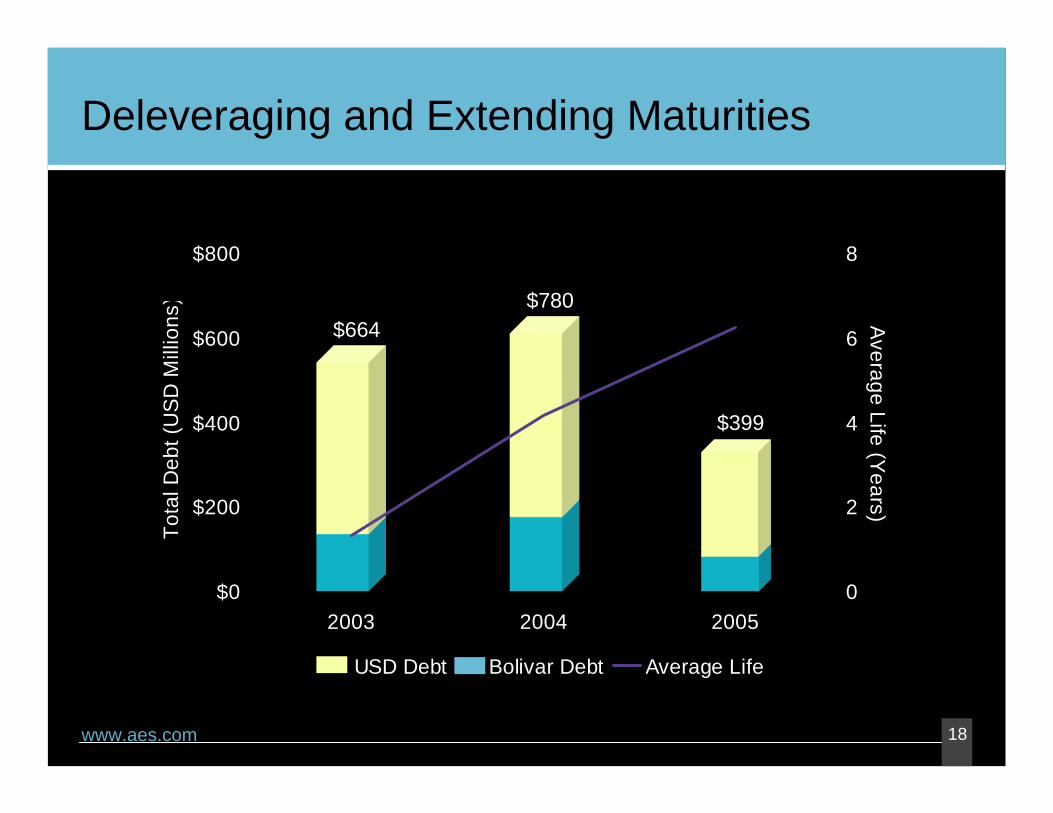
Deleveraging and Extending Maturities
$0
$200
$400
$600
$800
2003 2004 2005
Tota
l Deb
t (U
SD
Mill
ions
)
0
2
4
6
8
Average Life (Y
ears)
USD Debt Bolivar Debt Average Life
$664$780
$399
19www.aes.com
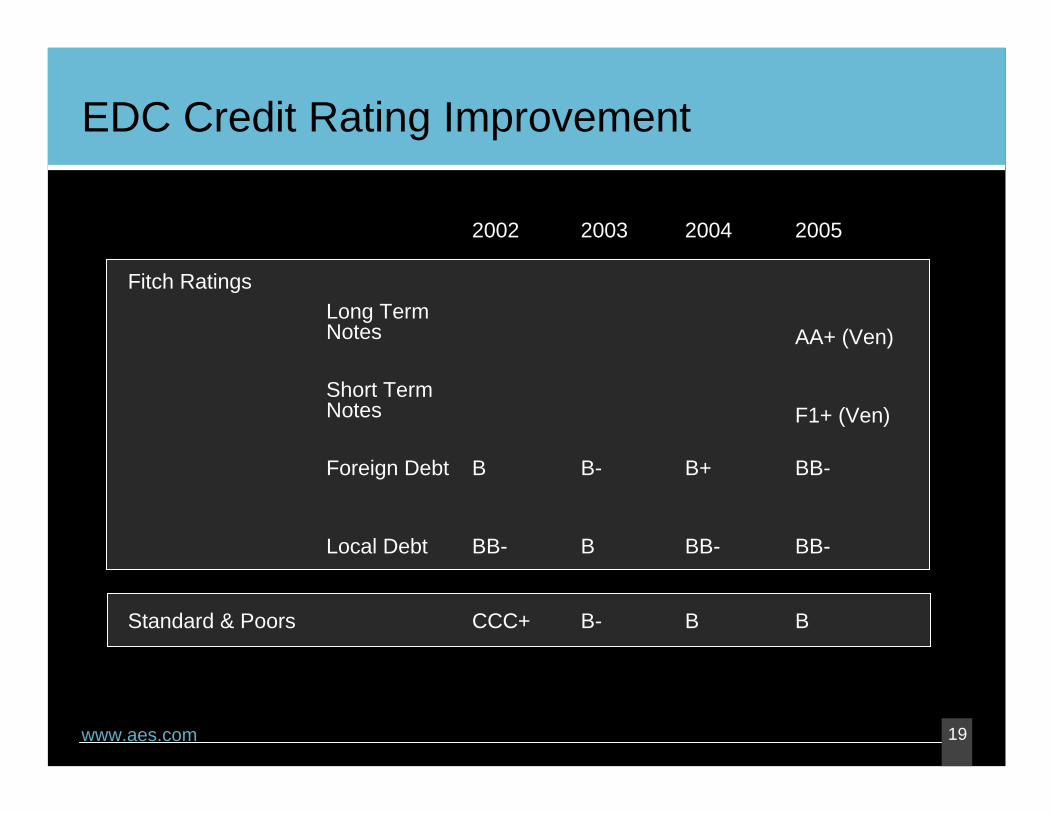
EDC Credit Rating Improvement
BB-B+B-BForeign Debt
BB-BB-BBB-Local Debt
AA+ (Ven)Long Term Notes
B
F1+ (Ven)
2005
Short Term Notes
BB-CCC+Standard & Poors
200420032002
Fitch Ratings
20www.aes.com
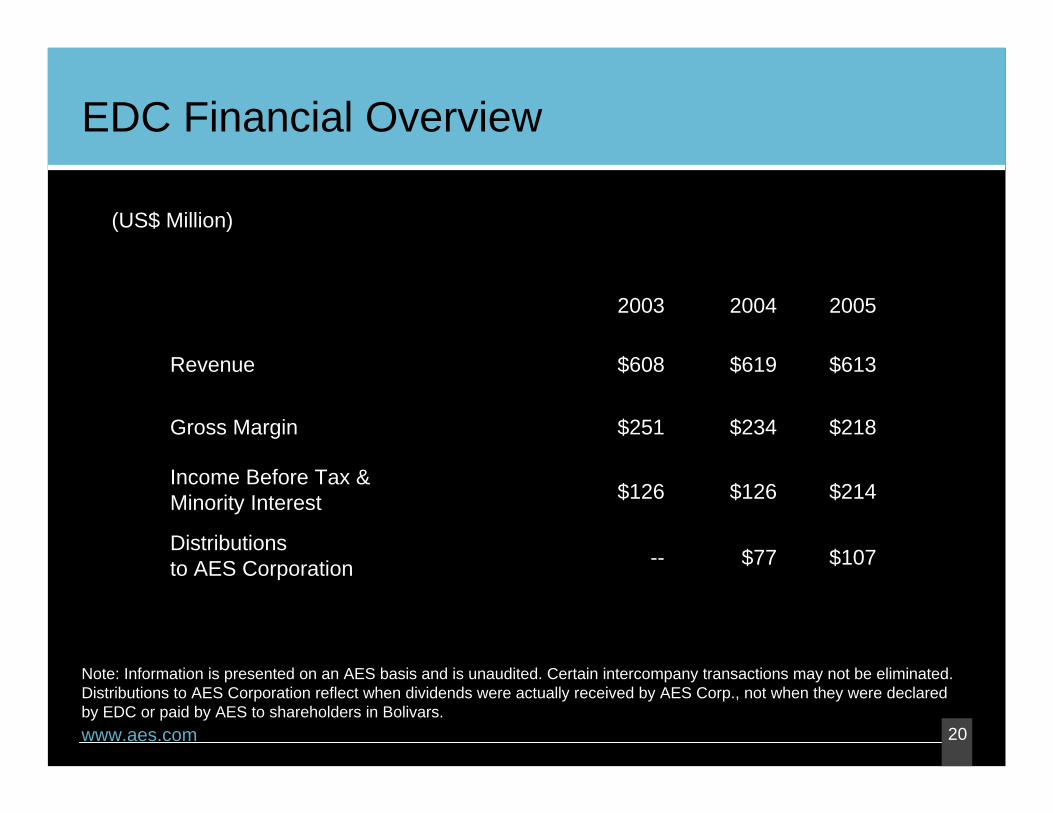
(US$ Million)
EDC Financial Overview
200520042003
$613$619$608Revenue
$107$77--Distributions to AES Corporation
$214$126$126Income Before Tax &Minority Interest
$218$234$251Gross Margin
Note: Information is presented on an AES basis and is unaudited. Certain intercompany transactions may not be eliminated. Distributions to AES Corporation reflect when dividends were actually received by AES Corp., not when they were declared by EDC or paid by AES to shareholders in Bolivars.
21www.aes.com
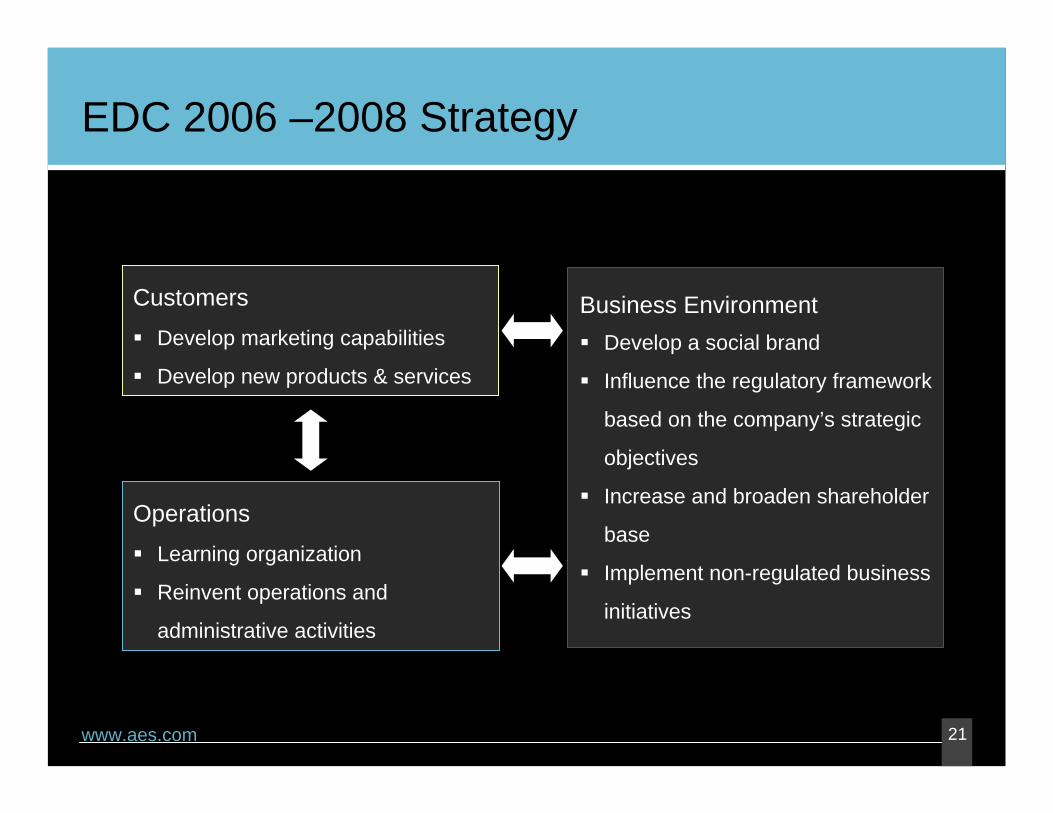
EDC 2006 –2008 Strategy
CustomersDevelop marketing capabilities
Develop new products & services
OperationsLearning organization
Reinvent operations and
administrative activities
Business EnvironmentDevelop a social brand
Influence the regulatory framework
based on the company’s strategic
objectives
Increase and broaden shareholder
base
Implement non-regulated business
initiatives
22www.aes.com
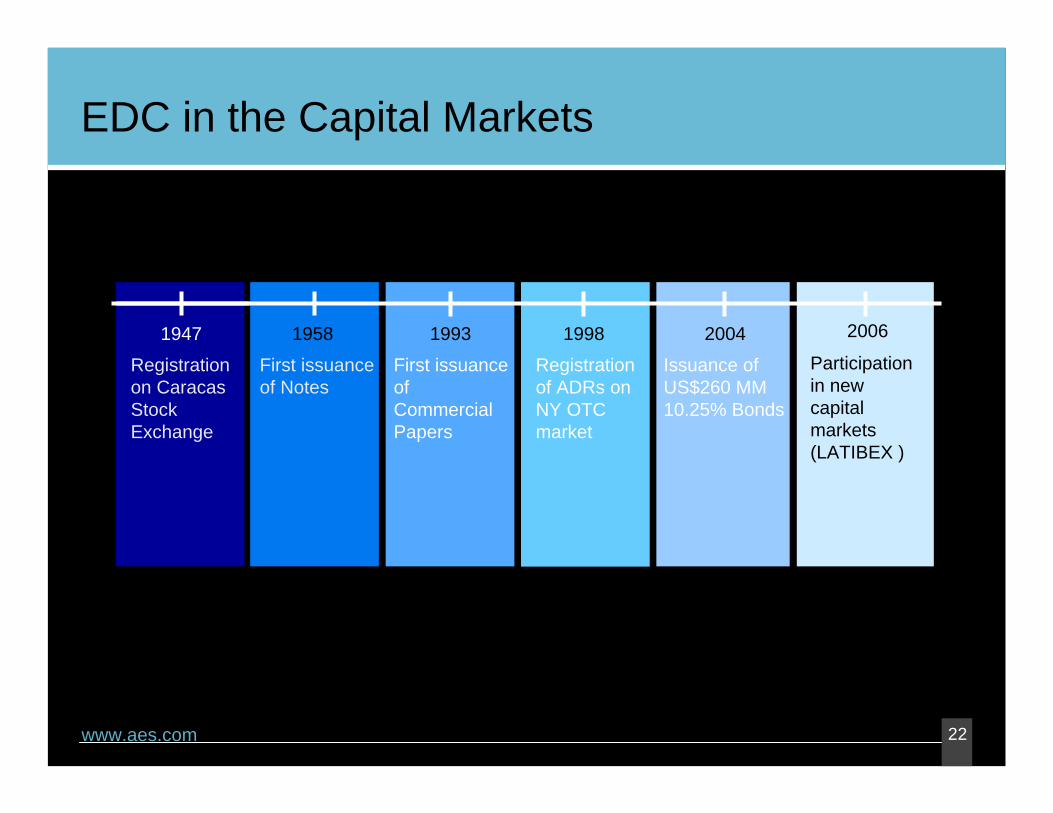
1947
Registration on Caracas Stock Exchange
1958
First issuance of Notes
1993
First issuance of Commercial Papers
1998
Registration of ADRs on NY OTC market
2004
Issuance of US$260 MM 10.25% Bonds
2006
Participation in new capital markets(LATIBEX )
EDC in the Capital Markets