city oof yuma, arizona · city’s mission, and organization chart. a flowchart depicting the...
TRANSCRIPT

CCiittyy ooff YYuummaa,,AArriizzoonnaa
AAddoopptteedd BBuuddggeettFFiissccaall YYeeaarr 22001111‐‐22001122

City of Yuma
Arizona
2011-2012 Annual Budget
PRESENTED TO:
City Council
Alan L. Krieger, Mayor Raul Mendoza, Deputy Mayor
Cody T. Beeson Bobbi Brooks
Paul B. Johnson Leslie L. McClendon
Jerry Stuart
Cover Photo Credit, Fred Phillips
Prepared and Presented By:
Gregory K. Wilkinson City Administrator
Steven W. Moore City Attorney
Lynda L. Bushong City Clerk
Laurie L. Lineberry Community Development
Jay Simonton
Utilities
Paul Brooberg Engineering
Jack McArthur, Chief
Fire Department
Laura S. Neinast
Information Technology
Douglas S. Stanley, Judge
Municipal Court
Becky Chavez
Parks & Recreation
Jerry Geier, Chief
Police Department
Joel Olea Field Operations
Donald (Pat) Wicks
Finance
Jack Dodd
Human Resources
And
The Staff of the City of Yuma

City of Yuma Annual Budget
Fiscal Year 2011-2012
How To Use This Document
This budget is divided into five sections: Overview, Fund Information, Department Information, Capital Spending and Debt Management, and the Appendix. Throughout the document, the City of Yuma is referenced as the “City.”
The Overview contains the City Administrator’s budget message, which discusses the major changes in this year’s budget. It also includes budget highlights, the City’s mission, and organization chart. A flowchart depicting the budget process for both the department budgets and the Capital Improvement Program is shown. Financial policies are included in this section as well as a brief overview of the City’s revenues and funds. The Fund Information section is focused on the different funds the City utilizes. Fund summaries show the activity in each fund to include, beginning balance, revenues, expenditures/expenses, transfers, and ending balance. This summary is followed by a schedule of revenues for the respective fund and an expenditure summary showing what departments utilize that fund.
Department Information provides each department’s budget message. The messages include functions of the department, goals for next year, accomplishments, and staffing level. It also displays department expenditures in two views. One table gives an overall picture of the department listed by division. The other table(s) breaks a department out by fund and then displays the information by the following categories: personal services, operating and maintenance, debt service, and capital outlay. The Capital Spending and Debt Management section covers the Capital Improvement Program budget and a discussion on how the City uses various financing tools to fund these projects. It explains the CIP process, provides information on different funding sources, lists the capital improvement projects, and summarizes the City’s outstanding debt. The Appendix contains a Glossary and seven schedules. Schedule 1 lists revenue information by fund. Schedule 2 lists the department’s expenditures within each fund. These worksheets display 2009-2010 actual expenditures, 2010-2011 adjusted budget, 2010-2011 estimates, and the request for 2011-2012. Schedule 3 shows the Outside Agency listing. Every year the City provides support to various organizations within the city. This page displays their current year funding and the proposed funding for 2011-2012. Schedule 4 details the Supplemental positions the city is requesting listed by funding source. Also shown are positions that are being moved across funds. Schedule 5 is the city’s staffing level and lists all the full time positions within the organization. Schedule 6 is the City’s Budget Resolution for 2012 while Schedule 7 provides the 2012 Maximum Tax Levy Worksheet. Finally, a Glossary is provided.

City of YUMA
2011-2012 Annual Budget Table of Contents
OVERVIEW City Administrator’s Message 1 Mission 5 Organization Chart 6 Budget Process 7 Financial Policies 8 Revenues 10 Funds 11 Budget Overview Table 12 City Profile 13 FUND INFORMATION General Fund 15 Community Investment Trust 18 Riverfront Redevelopment 19 Highway User Revenue Fund 20 Local Transportation Assistance Fund 21 City Road Tax Fund 22 Public Safety Tax Fund 23 Recreation Complex Fund 24 Two Percent Tax Fund 25 Mall Maintenance Fund 26 Radio Communications Fund 27 Grant Funds 28 Debt Service Funds 29 Capital Projects Fund 31 Water Funds 32 Wastewater Funds 35 Solid Waste Fund 38 Desert Hills Golf Course Fund 39 Arroyo Dunes Golf Course Fund 40 Equipment Replacement Fund 40 Equipment Maintenance Fund 41 Insurance Reserve Fund 41
DEPARTMENT INFORMATION Office of the Mayor and Council 43 Yuma Municipal Court 45 City Administration 49 City Attorney’s Office 60 Information Technology Services 63 Finance 68 Human Resources 71 Community Development 74 Public Works 77 Utilities 82 Engineering 90 Parks and Recreation 94 Police 108 Fire 115 CAPITAL SPENDING & DEBT MANAGEMENT Capital Improvement Program 121 Capital Improvement Project Summary 124 2011-2012 Capital Budget 125 Debt Management 128 Table of Outstanding Debt 130 Annual Debt Service Requirements 131
APPENDIX Schedule 1 – Revenues 133 Schedule 2 – Expenditures by Fund/Dept 139 Schedule 3 – Outside Agency Summary 144 Schedule 5 – Authorized Staffing Level 145 Schedule 6 – Budget Resolution 159 Schedule 7 – Maximum Tax Levy 161 Glossary 162

Distinguished Budget Presentation Award
The Government Finance Officers Association of the United States and Canada (GFOA) presented a Distinguished Budget Presentation Award to the City of Yuma, Arizona for its annual budget for the fiscal year beginning July 1, 2010. This is the seventh time the City of Yuma has received this award. In order to receive this award, a governmental unit must publish a budget document that meets program criteria as a policy document, as an operations guide, as a financial plan, and as a communications device. This award is valid for a period of one year only. We believe our current budget continues to conform to program requirements, and we are submitting it to GFOA to determine its eligibility for another award.

Overview
OVERVIEW
Page No.
City Administrator’s Message 1
Mission & Core Values 5
Organization Chart 6
Budget Process 7
Financial Policies 8
Revenues 10
Funds 11
Budget Overview Table 12
City Profile 13

1
Mayor and City Council City of Yuma, Arizona
RE: Budget Message for Fiscal Year 2011-12 Honorable Mayor and City Council, In accordance with the Yuma City Charter, I am transmitting the City Administrator’s proposed city budget for Fiscal Year 2011-2012. This document has been filed with the City Clerk’s office as required and finalizes the annual review process by the City Council leading to eventual adoption. We have discussed and you are intimately aware of the City’s economic condition. The times continue to be trying for all of us. This year working the CIP drew the most attention to bring it in line with estimated funding. The Operational budget for the most part is carried over from last year with minimal changes, although with continued grant funding, you will see a marked increase in capital outlay spending. We are seeing a continued upward trend albeit a small one. In line with that trend I have asked our Human Resources Department to include a classification study to look at our positions and see what realignment needs to be done to help bring us back from three-plus years of having a pay freeze in place. We will be closely watching tax revenues over the first six months of the next fiscal year. As last year we are again being responsible and “living within our means” and are again not asking for any increase in fees. It is required by law that we provide you a balanced budget and we are also looking forward to make sure we can continue that over the next couple of years. There continues to be some heavy workload in several areas which the Department Directors and employees are handling. We are continuing to do more with less, stretch our equipment life out further, and just make it work. Employees should be acknowledged for this as they are the ones who are making this happen. We have adjusted our budget numbers to provide for the increased employee medical insurance costs to the City and have left the 50/50 Arizona State Retirement System Funding in our budget to continue to cover that amount to prevent employees from seeing a reduction in pay. You can be proud of the employees as we are now in the third year of a pay freeze and they continue to show the spirit of doing what is right for the community. Every City employee is doing their part. This budget starts to set our way forward.
CITY ADMINISTRATION
One City Plaza
P.O. Box 13014 Yuma, AZ 85366-3014 928-373-5011 (phone)
928-373-5012 (fax)

2
We have submitted a proposed operating and capital budget of $153 million and $89 million, respectively, yielding an all funds budget of $242 million in anticipated expenditures for the coming fiscal year. You will find that this budget is basically flat in the quantity of personnel from previous years. Please refer to the chart on the next page for an overall breakdown of past, present, and proposed budget costs.
2009-2010 2010-2011 2010-2011 2011-2012ACTUAL BUDGET ESTIMATE REQUEST Change
PERSONAL SERVICES 57,629,980$ 60,966,186$ 59,553,150$ 63,807,123$ 4.66%
MATERIALS AND SERVICES 36,274,443 47,992,933 44,610,052 49,848,953 3.87%
DEBT 30,776,681 29,135,058 30,646,876 30,638,927 5.16%
CAPITAL OUTLAY 2,851,387 4,114,212 2,890,013 9,162,301 122.70%
TOTAL OPERATIONAL 127,532,490 142,208,389 137,700,091 153,457,304 7.91%
CAPITAL IMPROVEMENTS 30,560,883 87,632,349 15,890,221 89,309,313 1.91%
TOTAL BUDGET 158,093,373$ 229,840,738$ 153,590,312$ 242,766,617$ 5.62%
0
50
100
150
200
2010 ACTUAL 2011 BUDGET 2011 ESTIMATE 2012 REQUEST
Mil
lio
ns
PERSONALSERVICES
MATERIALS
DEBT
CAPITALOUTLAY
CIP
During the course of the current FY 2010-11 fiscal year we have held personnel expenditures at the current level. Supervisors have continued to provided oversight over larger areas of responsibility and have proactively managed costs. Our Human Resources Department is working with each of our other Departments and Directors managing vacancies and refilling positions as required to keep our customer service levels where they need to be and next year will oversee the classification study. We are still prioritizing our efforts and starting to look at addressing our equipment replacement. We continue to see a gradual improving trend in our reports. We are optimistically looking forward in anticipation of planning for a positive future this next fiscal year. Observations for This Budget Every Department in the City has done their part to continue to manage expenditures while striving to keep their services up to the level our citizens expect. We have held fees and are working with what we have. Capital purchases for the most part have been limited to replacement of only those items that are critical and broken and in need of replacement but we have been able to make headway on replacement of problematic Police Department vehicles. At the beginning of next year we will look to see where we are

3
with personnel pay and benefits as our number one priority and will also look at our equipment replacement program as the second priority. We have extended equipment replacement and need to assess where our equipment is at. We are not in a sustainable position going forward and it looks like we will be in a position to address it in 2012-13 if the trend continues. Personnel During the previous three fiscal years we have reduced the number of funded personnel through attrition by about 12% (123 total employees) and frozen pay and benefits. This past year we have not filled a couple additional positions but I do not anticipate further attrition of personnel positions and do not see any requirement for furlough days again this year. Outside agencies In the proposed budget the City of Yuma contracts with a number of agencies. Due to funding constraints we have reduced funding for a couple of these agencies to reflect a more accurate fair share of our cost. Additionally we are mainly providing funding to nonprofit agencies that provide direct services to the City. If one of these nonprofit services or funding for these agencies was eliminated the City would have to still provide these services. We had established a policy of decreasing the amount of support for the Fine Arts by decreasing it a little each year. Due to the economic downturn we have left their funding the same as last year. The City of Yuma will continue to work with various agencies to determine the level of services that they can provide to us and those services which will assist us. Property Taxes and Fees The proposed budget includes a property tax rate of $1.5787 which is mainly due to the reduced individual property valuation over last year. Other fees throughout the budget remain the same as in the previous year. The Year Ahead We believe the budget we have provided is balanced and we are hopeful that revenues and the economy will continue its turnaround. Our main goal in the next year is to review our personnel classification and revamp the pay plan. Second, we will put in place a plan to address our aging equipment. Acknowledgements I wish to acknowledge Finance Director Pat Wicks and CIP Administrator Ana Lugo and all our staff for their work in the preparation of this budget. All our Department Directors were a key component to get our budget balanced and deserve recognition. Every employee in the organization deserves recognition as they are making everything work, whether it is dealing with a decrease in funding or having to keep aging equipment operational. Many of their day to day dedication, work, ideas, and suggestions helped keep things going. I continue to be proud to lead this team and hopefully look forward to turning the corner next year. Summary The budget for FY 2011-2012 is again based in the reality of the times and economy. We are optimistically looking to next year to see if our positive trend continues. I again am very pleased that we do not have to ask further sacrifice from the employees. All have done an outstanding job of reducing

4
their budgets and analyzing their financial needs to conform to the dollars that are available to us. We have quality personnel in our organization needed to lead us into the future. We will do everything we need to in order to provide excellent support and services to our citizens now and in the future. We look forward to working with Mayor and Council in the coming year as we continue to provide superb and customer friendly services for the citizens of Yuma. Respectfully Submitted,
Greg Wilkinson City Administrator
5
Our Mission
The Yuma City Government exists to provide a forum for public discussion and decision-making. We are committed to deliver quality public services and to advance the social and economic well being of our present and future citizens.

MUNICIPAL COURT
Field Services
POLICE DEPARTMENT
Support Services
PUBLIC WORKS
Fleet Services
Streets/Solid Waste
Parks/Mall Maintenance
PARKS & RECREATION
Recreation
Civic Center Baseball Complex
Arts and Culture
Golf Courses
Parks Development
INFORMATION TECHNOLOGY SERVICES
Business Application And Support
Telecommunications And Support
FIRE DEPARTMENT
Professional Services
Suppression
Community Risk Reduction
Emergency Medical Services
Special Operations
COMMUNITY DEVELOPMENT
Administration
Building Safety
Community Planning
City of YUMA
Purchasing
Accounting
FINANCE
Administration and Budget
Customer Service
6
CITY ATTORNEY
General Counsel
Litigation
Prosecution
Risk Management
Human Resources
HUMAN RESOURCES
CITIZENS OF YUMA
MAYOR and COUNCIL
Engineering/Capital Improvement Projects
ENGINEERING
Utility Systems
Utility Treatment
UTILITIES
CITY ADMINISTRATOR
CITY ADMINISTRATION
City Clerk
Community Relations
Heritage Area
Administration
Economic Development
Facilities Maintenance

BUDGET PROCESS FLOWCHART OCTOBER JANUARY MARCH JUNE
Prepare Forecast Models
Review Operating Requests
Submit Dept. Operating Requests
Submit CIP Requests
CIP Budget Guidelines
Operating Budget
Guidelines
Review CIP Requests
Develop Annual Dept.
Budgets
Develop CIP Budget
Council Worksession
Review
Council Worksession
Review
Public Hearing & Budget Adoption
7

8
FFiinnaanncciiaall PPoolliicciieess ––
Financial policies provide guidance and direction while developing the operating and capital improvement project’s (CIP) budget and managing the fiscal responsibilities of the City. Their framework lends to responsible long range planning. With these tools, the City continues its quality accounting practices per the Government Finance Officers’ Association and Governmental Accounting Standards Board standards. The City must follow general budget legal requirements established by Arizona law and the City Charter when preparing the annual budget. The chart to the right outlines the various actions and deadlines that must be followed. Under each category are the requirements listed by State Law and City Charter rule. Statutory Limitations The primary property tax levy is limited by state law to a two percent increase over the previous year’s maximum levy with adjustments for growth and annexation. Secondary taxes, if implemented, are tied to the annual debt services requirements of voter-approved general obligation bonds. Primary tax levy limits are established by the Property Tax Oversight Commission. The Arizona Constitution mandates an expenditure limitation on the amount the City can appropriate each fiscal year. Arizona’s Constitution contains limitations on bonded debt. Please refer the debt limitation discussion in the Capital Spending and Debt Management section for a review of these limitations.
Action Required City Charter
Deadline Arizona State
Statute Deadline Process
Dates
City Administrator presents proposed operating budget to Council
On or before first Monday in June
NA May 25
Publish CIP summary and Notice of Public Hearing
No less than two weeks prior to Public
Hearing NA May1
City Administrator submits Preliminary Ten-Year CIP to Council
May 1 NA May 1
CIP Public Hearing
Prior to CIP program adoption
NA May 18
City Administrator submits Preliminary Budget to Council
NA NA May 25
Preliminary Budget adoption NA NA June 1
CIP program adoption On or before first of
July NA June 1
Publish summary of budget and Notice of Public Hearing prior to final budget adoption
NA
Once a week for two consecutive weeks
following preliminary budget adoption
June 9 & June 14
Truth-In-Taxation Public Hearing; Public hearing for budget
NA Before final budget
adoption June 15
Final budget adoption N/A No later than second
Monday in August June 15
Property Tax Levy adoption No later than the third
Monday in August
No sooner than seven days following final budget adoption and no later than the
third Monday in August
July 6

9
Basis of Accounting
The City prepares its annual budget and financial report using the modified accrual basis of accounting for both governmental and proprietary funds in accordance with generally accepted accounting principles (GAAP). There are differences between the basis of budgeting and the basis of accounting that are outlined below.
• Depreciation is not budgeted.
• Capital purchases of proprietary funds are budgeted as expenditures.
• Debt service payments of proprietary funds are budgeted as expenditures. Proceeds of long-term debt are budgeted as revenue-like ‘Other Financing Sources.’
• For all funds, compensated absences expenditures are not recorded as earned; instead, all continuing positions are budgeted at 100% annually. Any differences relating to use of general or other accruable leave is immaterial.
Budget Amendments
• Budget transfers between funds require City Council approval.
• The City Administrator is authorized to make transfers between departments (within the same fund).
• Budgetary transfer authority within department non-personnel line items in the same fund is delegated to the department director.
• Budget transfers are initiated internally from the department with final review and processing performed by the Finance Department.
Operating Budget Preparation
• Current operating costs must be less than or equal to current revenues.
• Ending projected General Fund undesignated fund balance to be maintained at a minimum of 20% of that year’s revenues. All other operating funds will be budgeted to retain sufficient fund balance for cash flow needs for the beginning of the following year. Two exceptions: Solid Waste Fund and Mall Maintenance Fund will be subsidized by the General Fund to assure at least a zero fund balance.
• Authorized staffing level increases or personnel changes across funds must be part of the budget process.
• Rebudgets are limited to capital outlay items, water treatment plant replacement parts, and certain large dollar professional services contracts.
Revenues
• Projected property tax revenues will include estimates of uncollected prior year property taxes in addition to any revenues of current year collections that are subject to the maximum levy.
• All City rates and fees will be reviewed and adjusted if necessary each year.
• Forecasting revenues will involve a combination of a ten year analysis of past revenue history, review of economic trends, and analysis of information obtained from State agencies from which the City receives funds.
Capital Projects
• Project must cost at least $25,000.
• Impact on City’s operating budget must be included in planning of project and incorporated within the respective department’s operating budget.
• Budget fund adjustments must go before Council for approval.
• All projects must have an identified, approved funding source.
• Projects will not start until the funds have been received – bond, loan, cash flow. Exceptions will be for reimbursable projects only.
Debt Management
• Long-term debt is not to be issued to finance current operations.
Investments
• The City of Yuma’s Investment Policy is adopted by the City Council. In accordance with that policy, public funds will be invested in a manner which will provide the maximum security of principal invested with secondary emphasis on providing the highest yield while meeting the daily cash flow needs of the City.
• All investments will conform to applicable State and City statutes governing the investment of public funds.
Miscellaneous
• The City is self-insured for workman’s compensation and dental coverage.
• The Community Investment Trust was established from the sale of city owned properties in 1989. These funds can be used with Council approval only. The balance of the Trust is budgeted in full each year.
• The City’s capitalization policy is for items that have a life of at least two years and a minimum cost of $5,000.

10
SSeerrvviiccee DDeelliivveerryy –– oouurr pprriimmaarryy mmiissssiioonn
City services are delivered by department units. Please refer to the department section of this document for a review of the departments’ missions, accomplishments and goals for fiscal 2008. City charter, ordinance and political discourse determine the nature and extent of the services provided by these departments. Seven major operating departments provide most services:
� Police � Fire � Parks and Recreation–Parks Maintenance; Recreation; Golf Courses; Recreation Complex; Arts and Culture � Community Development–Building Safety; Community Planning � Public Works–Street; Solid Waste; Fleet Services
� Utilities � Engineering
Services are also provided, both to citizens and internally to the ‘line’ departments by these administrative departments:
� Mayor/Council � City Administrator–Public Affairs; Community Relations; City Clerk; Heritage Area; Economic Development � City Attorney � Information Technology � Finance–Accounting; Purchasing; Customer Services
• Human Resources–Personnel
RReevveennuueess ––
Like a business, the city must have revenues to pay for the services it provides its citizens. Unlike the federal government, it cannot spend for services money it does not have. Accordingly, service levels depend entirely on the amount of monies the city collects. Revenues come in two broad categories: taxes and charges for services. Taxes are broad-based revenues over larger tax bases to cover services for which the ultimate user is difficult to determine for fee purposes, i.e., police services. Taxes may be assessed on the basis of property valuation (property taxes) or upon the basis of a business transaction (sales taxes). The City of Yuma uses both methods; however, because of statutory limitations on the former, its reliance is higher on the latter. Charges and fees are assessed directly to the ultimate beneficiary of service and may be intended to cover all or only part of the service provided, such as:
− Licenses and permits
− Utility charges
− Golf fees
− Recreation fees
In those instances in which the charge is insufficient to cover the cost of service, the city must subsidize the service with its general tax revenues. Revenues, both taxes and charges, derive from three sources: local, state-shared and grants and entitlements. The various funding sources are discussed later in the fund section of this document.

11
FFuunnddss ––
Governments separate the accounting of revenue sources because of internal or external requirements and restrictions. For instance: –The city can’t use gas taxes to pay for police services (specific statutory limitations)
–The city can’t use public safety taxes to build streets (ballot language creating the tax and its use)
For these reasons, the city follows rules promulgated by the Governmental Accounting Standards Board and uses fund accounting to record and report its financial transactions. Each fund is a self-balancing set of accounts used to track the activity of a specific revenue or series of revenues. Fund types that involve service delivery include the General Fund, Special Revenue Funds and Enterprise Funds. These three fund types account for most of the city’s service delivery. The General Fund is the largest fund and accounts for most primary services. Special Revenue Funds account for the proceeds of special revenue sources, taxes, charges or grants that are used to finance projects or activities as required by law or contractual agreements. Enterprise funds are used for those activities designated by council to operate on a self-funding basis, using accounting methods similar to business enterprises. The intent of an Enterprise Fund is to earn sufficient profit to insure the fund’s continued existence without reliance on general tax revenues. Other fund types used are Debt Service, Capital Projects and Internal Service Funds. These funds account for transactions not related to service delivery. Instead, they account for the financing, construction and inter-department services of the city.
HHooww IItt AAllll WWoorrkkss ––
This chart shows the interaction of revenues and how they are recorded within the major operating funds and how the related departments expend those revenues in service delivery. Typical of the General Fund is the receipt of a number of different types of revenues, whether they are local or shared. Most departments in the city provide general services, which are paid through the General Fund. Thus, the revenue is “matched” with the expenditure or service provision. Moreover, departments may cover services that are recorded in funds other than the General Fund. These “special revenues” must be segregated from other revenues, because of legislative, regulatory or council requirements. In providing services through these special funds, expenditures are recorded in Special Revenue Funds, again to match the expenditure against its revenue. In this manner, a given department, while a contiguous unit for management purposes, can expend various types of monies when providing certain services upon which the revenue is based. For example, as you can see in the chart at right under the Expenditure Section, the Parks Department provides services through the General Fund for parks maintenance and general recreation; through the Special Revenue Funds (specifically the Recreation Complex fund) for the convention center;
Special
Revenues General Revenue Enterprise
State sales tax X
State income tax X
Vehicle license tax X
Gas tax X
Lottery X
Grants/entitlements X
Property tax X
Sales taxes:
General X
Public Safety X
Road X
Licenses/permits X
Franchise fees X
Fines X
Charges for services:
Utility fees X
Golf courses X
Recreation fees X
Rents/concessions X X X
Solid waste X
Expenditures
Police X X
Fire X X
Parks X X X
Public Works X X
Utilities X
Engineering X X
Com Development X X
Administrative X
S
h
a
r
e
d
L
o
c
a
l
D
e
p
t
s

12
and through the Desert Hills Golf Course Enterprise Fund for operation of the golf course. A more complete summary by fund group is presented below that includes the aforementioned General, Special Revenue and Enterprise Funds as well as the non-operating Capital Projects, Debt Service and Internal Service Funds. Budget Summary-
Fund Group Special Capital Debt Internal 2011-2012 2010-2011 2009-2010
Fiscal Year 2011-2012 General Revenue Projects Service Enterprise Service Total Estimate Actual
Balance, July 1 17,160,470$ 10,240,621$ 28,584,850$ 540,201$ 36,559,627$ 17,122,884$ 110,208,653$ 111,849,530$ 127,108,264$
Sources:
Revenues
Property Taxes 10,295,160 125,000 - - - - 10,420,160 9,775,000 9,374,417
Sales Taxes 17,985,000 16,993,256 - - - - 34,978,256 34,996,838 33,934,562
Franchise taxes 3,277,000 - - - - - 3,277,000 3,237,000 3,251,773
Building Permits, Zoning
and Development Fees 865,400 - - - - - 865,400 865,500 1,032,515
State Sales Taxes 7,040,887 - - - - - 7,040,887 6,680,000 6,553,752
State Revenue Sharing 7,854,995 - - - - - 7,854,995 8,647,500 11,530,338
Vehicle License Tax 2,810,000 - - - - - 2,810,000 3,200,000 3,302,485
State Gasoline Tax - 5,863,023 - - - - 5,863,023 6,550,000 6,626,021
Lottery Tax - - - - - - - 75,764 225,692
Grants - 38,678,178 - - 38,678,178 11,401,297 8,782,299
Charges for Services 3,480,600 491,000 5,302,575 - 44,175,800 3,297,000 56,746,975 57,262,028 53,880,753
Fines, Fees, Interest
and Other 2,432,900 757,000 20,029,850 1,311,058 658,769 2,310,241 27,499,818 9,258,508 8,506,260
Total Revenues 56,041,942 62,907,457 25,332,425 1,311,058 44,834,569 5,607,241 196,034,692 151,949,435 143,035,008
Transfers In 557,323 1,630,200 - 12,209,418 - 250,000 14,646,941 14,561,108 14,954,623
Debt Service Reserve - - - - - - - - 1,413,914
Long-Term Debt Proceeds - - - - - - - 17,653,100 639,275
Total Sources 56,599,265 64,537,657 25,332,425 13,520,476 44,834,569 5,857,241 210,681,633 166,510,543 160,042,820
Uses:
Expenditures
Police 21,216,464 2,484,170 - - - - 23,700,634 22,651,386 21,356,008
Fire 13,180,281 1,557,938 - - - - 14,738,219 12,085,220 10,888,201
Public Works 658,647 5,862,539 - - 2,604,208 3,559,232 12,684,626 12,182,590 12,055,803
Utilities - - - - 19,990,911 - 19,990,911 19,103,548 15,711,012
Engineering 395,309 1,777,503 - - - - 2,172,812 2,058,083 1,769,708
Parks and Recreation 7,637,502 3,984,709 - - 2,031,930 - 13,654,141 12,462,182 12,405,618
Community Development 2,697,516 4,000 - - - - 2,701,516 2,622,964 2,466,023
Administrative
Mayor and Council 250,524 - - - - - 250,524 251,277 249,953
Municipal Court 1,532,254 12,000 - - - - 1,544,254 1,464,783 1,513,016
City Administration 3,890,607 4,035,396 - - - - 7,926,003 7,779,617 6,830,016
City Attorney 1,289,543 5,300 - - - 983,907 2,278,750 1,150,086 2,213,363
Information Technology 2,352,034 7,226,050 - - - - 9,578,084 6,368,325 5,820,698
Finance 1,768,843 - - - - - 1,768,843 1,502,781 1,726,232
Human Resources 891,049 - - - - - 891,049 731,127 735,636
General Government 3,398,322 276,686 - - - 3,900,116 7,575,124 3,375,460 2,330,089
Capital Labor 73,278 933,465 - - 356,144 1,362,887 1,263,786 1,534,031
Intracity Cost Allocation (2,993,025) 1,088,482 - - 1,867,341 37,202 - - -
Debt Service - - - 13,520,476 17,118,451 - 30,638,927 30,646,876 30,180,641
Capital Improvements - 27,813,467 44,471,106 - 17,024,740 - 89,309,313 15,890,221 30,560,883
Total Expenditures 58,239,148 57,061,705 44,471,106 13,520,476 60,993,725 8,480,457 242,766,617 153,590,312 160,346,931
Transfers Out 4,393,672 9,880,981 - - 371,388 900 14,646,941 14,561,108 14,954,623
Total Uses 62,632,820 66,942,686 44,471,106 13,520,476 61,365,113 8,481,357 257,413,558 168,151,420 175,301,554
Balance, June 30 11,126,915$ 7,835,592$ 9,446,169$ 540,201$ 20,029,083$ 14,498,768$ 63,476,728$ 110,208,653$ 111,849,530$
The Fund Information section explores the city’s funds in detail.

13
City Profile
Located in the Yuma and Gila valleys of Southwestern Arizona where Arizona, California, and Mexico converge is Yuma. With a climate that mixes pure desert sunshine with the cool waters of the Colorado and Gila Rivers, Yuma offers our residents a year round vista of surrounding rugged mountains and green agricultural fields.
The incorporated area of Yuma is approximately 119 square miles and houses over 93,064 full-time residents. The City of Yuma is a full service council-manager government and is governed by a charter, Arizona state statutes, and an adopted Strategic Management Plan.
The City employs approximately 1,035 full and part-time employees in fourteen departments. Public services include police, fire, water and wastewater utilities, solid waste services, parks, recreation, and arts & culture services.
History
Yuma's history dates to 1540 when Hernando de Alarcon, the Spanish explorer, became the first European to see the site of the present day City of Yuma. From 1540 to 1854, Yuma was under the flags of Spain and Mexico, but in 1854 became a territorial possession of the United States through the Gadsden Purchase. In the 1850's, Yuma became the major river crossing of the California gold seekers. From the 1850s to the 1870s, steamboats on the Colorado River transported passengers and goods to mines, ranches and military outposts in the area, serving the ports of Yuma, Laguna, Castle Dome, and others.
In the early 1900’s, the Yuma Project was completed by the US Bureau of Reclamation. This project established or expanded an irrigation canal system that has since used the Yuma area’s senior water rights for Colorado River water to make Yuma a prime agricultural center.
Economic Base
Today, agriculture remains the largest segment of Yuma’s economic triad of agriculture, military and tourism.
Agribusiness now contributes over $3.1 billion to Yuma’s economy each year. The industry has grown from field production of vegetables and fruits to include a number of substantive production plants in which are produced fresh-cut salads and other value-added products. Even field production has changed by field-packing vegetables for shipment to market. Those products are now housed, while awaiting shipment across the country, in several large commercial cooling facilities.
Yuma is home to two military bases that are critical to the nation’s defense. Both contribute significantly to Yuma’s economy. The Marine Corps Air Station conducts pilot tactical training using the adjacent Barry M. Goldwater Range. Along with several attack squadrons, including the famous ‘Black Sheep’ squadron, the base is home to the Marine Aviation Weapons and Tactics Squadron One (MAWTS-1), which is the host of the graduate level, Weapons and Tactics Instructor Course (WTI). WTI is the Marine Corps version of ‘Top Gun’.
Another critical installation is the US Army Yuma Proving Ground. The proving ground is the Army’s center for desert natural environment testing and evaluation. This includes testing of all types of materiel; including prototype combat vehicles, artillery, conventional munitions, aircraft and other items critical to the Army’s mission. The proving ground also contracts with other nations for testing of specialized equipment from around the globe.
The third major segment is tourism. Yuma’s abundant sunshine and unbeatable weather drew an estimated 95,000 winter visitors last year. The average visitor stays three months and adds significantly to the economy. Adding to this segment is the Yuma Crossing National Heritage Area. Established in 2000 by Congress, it is the first and one of only two national heritage areas west of the Mississippi River. The city’s long-planned riverfront development is now in progress and will serve to make Yuma a travel destination throughout the year.

14
Yuma Demographics
Form of Government Council/Manager
Mayor's Term 4 Years - Elected at large
Council Term (6 Councilmembers) 4 Years - Elected at large (staggered terms)
Current Area in Square Miles 119
Area in Square Miles as of 2000 106
Current (2010) City of Yuma Population 93,064
2000 City of Yuma Population 77,515
Growth % 2000 - 2010 for City of Yuma 20.1%
Current (2010) Population of Yuma MSA 204,195
1999 Population of Yuma MSA 106,895
Growth % 2000 - 2010 for Yuma MSA 27.6%
# of Winter Visitors to Yuma Area (1998) 89,000
Population within 1 hour driving time 2 Million (approximately)
Village of Yuma Incorporated July 11, 1876 - A.F. Finlay, Mayor
Town of Yuma Incorporated April 6, 1902 - R.S. Patterson, Mayor
City of Yuma Incorporated April 7, 1914 - John H. Shanssey, Mayor
# of Employees (Full & Part Time) 1,102
Average Daily Maximum Temperature 87.3° Fahrenheit
Average Daily Minimum Temperature 53.5° Fahrenheit
Monthly Average Temperature (based on last 50 yrs) 75.2° Fahrenheit
Average Yearly Rainfall in Inches 3 inches
% of Sunshine Overall (Year = 4,456 hours) 90% (4,050 hours)
Relative Humidity - 11:00 AM, July 32%
Elevation above Sea Level 138 feet
# Golf Courses 11
# of School Districts 3 (Crane Elementary, Yuma Elementary, Yuma Union
High School)
# of Public Elementary Schools 21
Total # of Public Elementary School Students 12,138
# of Private Elementary Schools 11
# of Public Junior High Schools 7
Total # of Public Junior High School Students 4,652
# of Private Junior High Schools 10
# of Public High Schools 6
Total # of Public High School Students 10,448
# of Private High Schools 5
# of Colleges/Universities 4 (Arizona Western College, Northern Arizona University - Yuma, Southern
Illinois University, University of Phoenix)
% of households with $100,000 plus income Average 7.1%
Average Median Home Sales Price (City of Yuma) $156,478

Fund Information

FUND INFORMATION
Page No.
General Fund 15
Special Revenue Funds
Community Investment Trust 18
Riverfront Redevelopment 19
Highway User Revenue Fund 20
Local Transportation Assistance Fund 21
City Road Tax Fund 22
Public Safety Tax Fund 23
Recreation Complex Fund 24
Two Percent Tax Fund 25
Mall Maintenance Fund 26
Radio Communications Fund 27
Grant Funds 28
Debt Service Fund 29
Capital Projects Fund 31
Enterprise Funds
Water Funds 32
Wastewater Funds 35
Solid Waste Fund 38
Desert Hills Golf Course Fund 39
Arroyo Dunes Golf Course Fund 40
Internal Service Funds
Equipment Replacement Fund 40
Equipment Maintenance Fund 41
Insurance Reserve Fund 41
15
The following pages list each of the city’s funds including a description of the fund’s major sources of revenue and a recap of the changes in budget for the fiscal year.
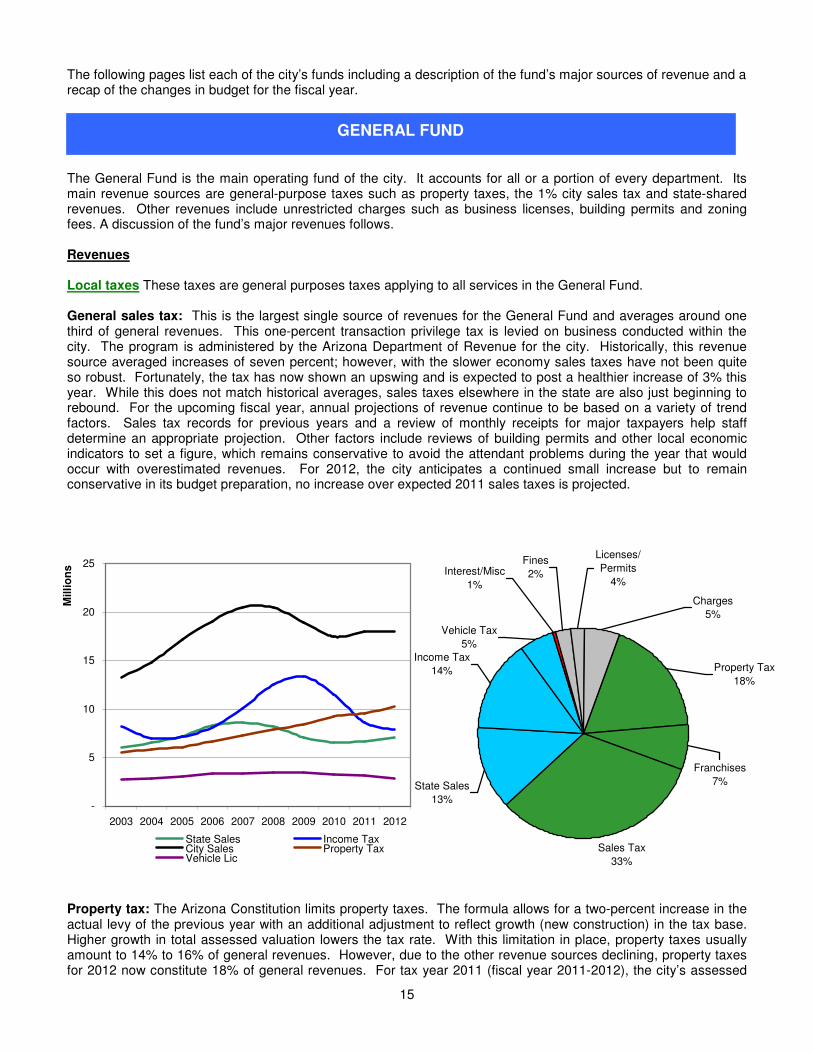
The General Fund is the main operating fund of the city. It accounts for all or a portion of every department. Its main revenue sources are general-purpose taxes such as property taxes, the 1% city sales tax and state-shared revenues. Other revenues include unrestricted charges such as business licenses, building permits and zoning fees. A discussion of the fund’s major revenues follows. Revenues Local taxes These taxes are general purposes taxes applying to all services in the General Fund. General sales tax: This is the largest single source of revenues for the General Fund and averages around one third of general revenues. This one-percent transaction privilege tax is levied on business conducted within the city. The program is administered by the Arizona Department of Revenue for the city. Historically, this revenue source averaged increases of seven percent; however, with the slower economy sales taxes have not been quite so robust. Fortunately, the tax has now shown an upswing and is expected to post a healthier increase of 3% this year. While this does not match historical averages, sales taxes elsewhere in the state are also just beginning to rebound. For the upcoming fiscal year, annual projections of revenue continue to be based on a variety of trend factors. Sales tax records for previous years and a review of monthly receipts for major taxpayers help staff determine an appropriate projection. Other factors include reviews of building permits and other local economic indicators to set a figure, which remains conservative to avoid the attendant problems during the year that would occur with overestimated revenues. For 2012, the city anticipates a continued small increase but to remain conservative in its budget preparation, no increase over expected 2011 sales taxes is projected.
Property tax: The Arizona Constitution limits property taxes. The formula allows for a two-percent increase in the actual levy of the previous year with an additional adjustment to reflect growth (new construction) in the tax base. Higher growth in total assessed valuation lowers the tax rate. With this limitation in place, property taxes usually amount to 14% to 16% of general revenues. However, due to the other revenue sources declining, property taxes for 2012 now constitute 18% of general revenues. For tax year 2011 (fiscal year 2011-2012), the city’s assessed
GENERAL FUND
-
5
10
15
20
25
2003 2004 2005 2006 2007 2008 2009 2010 2011 2012
Milli
on
s
State Sales Income TaxCity Sales Property TaxVehicle Lic
Sales Tax
33%
Charges
5%
Franchises
7%
Fines
2%Interest/Misc
1%
State Sales
13%
Vehicle Tax
5%
Income Tax
14%
Licenses/
Permits
4%
Property Tax
18%

16
value for the same property declined for the first time. Because of this decline, the maximum tax rate is increasing to $1.6103. However, a rate of $1.5787, while higher than 2010, will generate additional property tax because of new construction growth, yet most taxpayers that were on the tax rolls in 2010 should see no tax increase. The tax levy will increase by $181,016 to $10,045,160. The maximum tax levy calculation worksheet is included in the Appendix. Shared revenues include state sales tax, urban revenue sharing (income tax) and vehicle license tax. State sales tax: Twenty-five percent of the total state sales tax collection base (less certain classifications) is distributed to cities and towns based on the relative percentage of their population to the total population of all incorporated cities and towns in the state using the last decennial or special census (Yuma is roughly 1.83% in that calculation). This revenue is unrestricted other than for municipal purposes. Initial projections are set by reviewing historical trends since staff has little statewide information. Ultimately, projections provided by the state and the Arizona League of Cities and Towns are used. For fiscal 2011, state sales tax is projected to increase 2% from 2010 collections with 2012 collections increasing 5.4%.
State Sales Income Tax City Sales Prop Tax Vehicle Lic
2003 6,062,278$ 8,250,011$ 13,237,042$ 5,525,546$ 2,746,086$
2004 6,535,654 7,002,250 14,849,984 5,857,815 2,852,832
2005 7,196,762 7,141,392 17,165,647 6,084,434 3,067,961
2006 8,292,930 8,133,573 19,087,873 6,699,038 3,391,236
2007 8,599,222 10,080,307 20,519,460 7,320,954 3,391,000
2008 8,183,389 12,518,210 20,479,636 7,890,155 3,518,856
2009 7,105,464 13,355,611 18,961,775 8,402,118 3,445,486
2010 6,553,752 11,530,338 17,461,629 9,256,623 3,302,485
2011 estimated 6,680,000 8,647,500 17,985,000 9,575,000 3,200,000
2012 budgeted 7,040,887 7,854,995 17,985,000 10,045,160 2,810,000
Ten-year History of General Fund - Major Revenues
Income taxes: Established by voter initiative in 1972 at 15% of total personal and corporate income tax (collected two years earlier), this tax is distributed to cities and towns by the same basis as state sales tax (the Legislature set the percentage temporarily at 14.8% of collections for fiscal years 2003 and 2004). This revenue is also unrestricted other than to municipal purposes. With declining income tax receipts for the state several years ago, this revenue source declined significantly for 2004 and will again for 2011 and 2012. As noted in the line graph on the previous page and the table above, a decline of 10% is projected for next year. Because the amount to be distributed is based upon actual tax collections from a previous fiscal year, the state provides a near-exact figure for projection purposes. Vehicle license tax: Of the license taxes paid at new or renewal vehicle registrations statewide, 25% is shared with cities and distributed on same basis as sales tax. Again, it is unrestricted other than to municipal purposes. With collections of this tax performed by the state, historical trends are the only data available to determine projections for a given fiscal year. With the State of Arizona battling a continuing budget crisis, the legislature saw fit to reduce this revenue source by moving some of the tax base to the Arizona Department of Public Safety. Accordingly, the city will suffer a decrease of 12% for 2012 compared to 2011 estimates.
Expenditures
The table on the next page and its related graph display the impact of the several departments on the General Fund. A quick review shows the large majority of General fund expenditures are related to public safety in the Police and Fire Departments, respectively. The third largest group is the Administrative Departments that provide support to the operating departments. Parks and Recreation Department follows closely behind with its recreational opportunities and many parks enjoyed by our populace.

17
Municipal Court
3%
Administrative
Depts
18%
Community
Development
5%
Parks
13%
Police
38%
Fire
23%
General revenues not only support the services provided by the departments listed, but, as shown in the fund recap on the next page, help pay a portion of the city’s debt service (attributable to General Fund services). In past years, the General Fund subsidized both the Solid Waste Fund (for residential trash collection) and the Mall Maintenance Fund. However, for 2012, the Solid Waste Fund is now entirely self supporting through the collection of residential collection fee while the Mall Maintenance Fund saw an unexpected rise in property taxes in 2011. To assure a return of a portion of these taxes to the district, the city will maintain its 2011 subsidy but will see that subsidy drop temporarily to zero in 2012.
2009-2010 2010-2011 2010-2011 2011-2012
Actual Budget Estimate Budget
MAYOR AND COUNCIL 249,953$ 249,203$ 251,277$ 250,524$
MUNICIPAL COURTS 1,464,016 1,498,003 1,452,783 1,532,254
CITY ADMINISTRATOR'S OFFICE 3,515,848 2,752,114 2,876,066 333,284
CITY ATTORNEY'S OFFICE 1,195,179 1,236,418 1,145,850 1,289,543
INFORMATION TECH SERVICES 2,443,867 2,546,003 2,431,674 2,352,034
FINANCE 1,726,011 1,645,763 1,502,781 1,768,843
HUMAN RESOURCES 735,636 742,227 731,127 891,049
GENERAL GOVERNMENT 1,266,478 2,237,569 1,512,878 2,446,154
COMMUNITY DEVELOPMENT 2,445,744 2,660,574 2,585,986 2,697,516
UTILITIES - - - -
ENGINEERING 404,166 374,755 393,532 395,309
PARKS AND RECREATION 8,004,350 7,275,744 7,045,454 7,637,502
POLICE DEPARTMENT 19,614,772 20,531,694 20,334,860 21,216,464
FIRE DEPARTMENT 10,862,785 13,147,371 11,080,030 13,180,281
CAPITAL PROJECTS LABOR 18,401 17,938 107,798 73,278
INTRACITY COST ALLOCATION (4,442,642) (4,211,795) (4,211,795) (2,334,378)
49,504,564$ 52,703,581$ 49,240,301$ 53,729,657$
General Fund Expenditures by
Department
Also paid from General Fund resources in the fund recap are capital projects. These are generally park improvements or other general government projects for which there is not a separate dedicated funding source.

18
2009-2010 2010-2011 2010-2011 2011-2012
GENERAL FUND ACTUAL BUDGET ESTIMATE REQUEST
Undesignated Fund Balance July 1, 11,478,550 11,428,205 15,961,158 17,072,637
Sources:
Estimated Revenues 56,698,146 55,611,590 54,875,333 56,041,742
District 67 Reserve 947,380 -
From Debt Service Reserve 1,413,914 1,413,914 - -
Transfers In:
Capital Project Fund 30,732 - - -
Total Transfers In 30,732 - - -
Total Sources 58,142,792 57,972,884 54,875,333 56,041,742
Uses:
Expenditures
Personnel 43,674,148 44,221,248 41,872,140 44,814,796
Operating 5,850,079 7,943,969 7,221,292 12,176,493
Debt Service Reserve -
Capital Outlay 64,898 538,364 146,869 690,536
Capital Improvements 35,994 - - -
Transfers Out:
Solid Waste Fund 1,030,125 - - -
Yuma Mall Maintenance Fund 90,809 120,863 117,891 -
Radio Communication Fund 158,100 123,900 123,900 123,900
Debt Service Fund 2,756,032 2,548,845 4,281,762 4,269,772
Total Transfers Out 4,035,066 2,793,608 4,523,553 4,393,672
Total Uses 53,660,184 55,497,189 53,763,854 62,075,497
Undesignated Fund Balance June 30, 15,961,158 13,903,900 17,072,637 11,038,882 Fund balances approximating 20% of total revenues are targeted for retention each year. This policy maintains sufficient cash flow within the fund as revenue collections are skewed to the winter season in the agriculture and tourism industries. Combined with the General Fund within the City’s financial statements, but shown separately in the budget, is the Community Investment Trust. Revenues from sales of surplus real property are recorded within these accounts. Expenditure of the monies is at the discretion of the council. Each year, all of the available balances of the accounts are budgeted for expenditure should the council desire to fund critical projects that arise during the fiscal year. No expenditures are budgeted in the Community Investment Trust this year.
2009-2010 2010-2011 2010-2011 2011-2012
COMMUNITY INVESTMENT TRUST ACTUAL BUDGET ESTIMATE REQUEST
Undesignated Account Balance July 1, 106,493 87,826 87,633 87,833
Sources:
Estimated Revenues 707 400 200 200
Total Sources 707 400 200 200
Uses:
Expenditures
Operating 19,567 - - -
Capital Outlay - - - -
Capital Improvements - - - -
Total Uses 19,567 - - -
Undesignated Account Balance June 30, 87,633 88,226 87,833 88,033

19
Also included within the General Fund, but separated here for reporting purposes, is the Riverfront Redevelopment Account. After years of planning, the riverfront area in Yuma is in development. As part of the agreement with the developer, the City is required to provide payments each year for 10 years for infrastructure. In addition, sales tax rebates of 70% of the City's general sales taxes and Two Percent taxes generated within the project area are to be paid to the developer. The agreement calls for paying one half the balance of the required deposit at the time building permits are generated. Permits were pulled in FY2007, thus the activity shown below.
2009-2010 2010-2011 2010-2011 2011-2012
RIVERFRONT REDEVELOPMENT ACTUAL BUDGET ESTIMATE BUDGET
Undesignated Account Balance July 1, - - - -
Sources:
Transfers In:
General Fund - - - -
Community Investment Trust - - - -
Two Percent Fund 586,726 440,200 571,931 557,323
Total Transfers In 586,726 440,200 571,931 557,323
Total Sources 586,726 440,200 571,931 557,323
Uses:
Expenditures
Operating 586,726 440,200 571,931 557,323
Transfers Out:
Total Transfers Out - - - -
Total Uses 586,726 440,200 571,931 557,323
Undesignated Account Balance June 30, - - - - The Radio Communications Fund was created to track the expenditures of the new Yuma Regional Communication System, which will include the construction of the new 800/700 MHz digital trunked radio system for use by the city’s public safety agencies. This fund has grown to the point that it has been reclassified as a Special Revenue Fund and moved to that section of the report.

20
HIGHWAY USER REVENUE FUND
The Highway User Revenue Fund accounts for gasoline taxes collected by the state and shared with cities. Of the tax collected statewide, 27.5% is allocated to cities and towns, one half of which is based on the same proportion as state sales tax and one half on the percentage of sales in “county of origin” and distributed based on city’s population to total city and town population in the county. This revenue source is restricted to highway and street purposes, whether it be maintenance or construction. Projections for this revenue are provided by the state and the League of Cities. The precipitous decline in gasoline taxes noted in the graph below is due in small part to a reduction in gallons of gasoline purchased; however, it is primarily due to a growing retention of the dollars by the state legislature for use by the Arizona Department of Public Safety. Accordingly, fewer dollars are available for road maintenance. Contracted maintenance costs have been moved to the Road Fund this year.
Gas Tax
4.0
4.5
5.0
5.5
6.0
6.5
7.0
7.5
8.0
8.5
Millions
Gas Tax 6,732,659 7,198,885 7,627,170 7,816,920 8,137,895 8,144,883 7,029,312 6,626,021 6,550,000 5,863,023
2003 2004 2005 2006 2007 2008 2009 2010 2011 2012
HURF Fund Expenditures by
Division
2009-2010
Actual
2010-2011
Request
2010-2011
Estimate
2011-2012
Request
Capital Projects Labor 11,688$ -$ 24,951$ 32,091$
Curbs, Gutters, Sidewalks 313,931 276,474 338,993 354,142
General Government - 20,844 - -
Code Enforcement 120,395 130,880 77,731 78,430
Public Works Administration - - 159 -
Storm Drain Maintenance 162,267 333,977 287,568 311,756
Street Lighting 861,974 719,620 719,603 719,623
Street Maintenance 2,503,524 2,990,592 3,015,223 2,167,334
Street Sweeping 488,721 434,126 421,181 420,353
Traffic Signals 599,630 725,641 714,008 739,412
Retention Basin Maintenance 1,072,997 1,193,876 1,200,098 989,020
Traffic Signs and Striping 383,992 454,441 401,086 435,658
6,519,119$ 7,280,471$ 7,200,601$ 6,247,819$
The Public Works Department records operational expenditures in this fund for those maintenance efforts. In FY2010, the Retention Basin Maintenance division was moved from the Road Tax Fund and into the HURF fund. Additionally, the Engineering division was moved out of the HURF fund and into the Road Tax Fund. Transfers are made to the Debt Service fund for debt related to capital assets constructed to benefit streets, including a portion of the Public Works building.
SPECIAL REVENUE FUNDS

21
There is no specific target for retention of fund balance; however, because this fund supports personnel service and other expenditures devoted to streets, a smaller fund balance is budgeted for retention at year-end to begin the next year’s operations.
2009-2010 2010-2011 2010-2011 2011-2012
HIGHWAY USERS REVENUE FUND ACTUAL BUDGET ESTIMATE REQUEST
Undesignated Fund Balance July 1, 1,228,873 1,237,980 1,419,559 712,789
Sources:
Estimated Revenues 6,811,877 6,981,000 6,594,800 5,933,023
Total Sources 6,811,877 6,981,000 6,594,800 5,933,023
Uses:
Expenditures
Personnel 2,511,001 2,605,861 2,550,921 2,620,108
Operating 3,992,648 4,540,610 4,515,680 3,493,711
Capital Outlay 15,599 134,000 134,000 134,000
Capital Improvements - - - -
Transfers Out:
Debt Service Fund 101,944 100,787 100,969 101,202
Total Transfers Out 101,944 100,787 100,969 101,202
Total Uses 6,621,191 7,381,258 7,301,570 6,349,021
Undesignated Fund Balance June 30, 1,419,559 837,722 712,789 296,791
LOCAL TRANSPORTATION ASSISTANCE FUND
In past years, a maximum of $23 million from the Lottery was distributed to cities and towns in a similar manner as sales tax and was restricted to street construction or public transportation needs of cities (10% may be expended on cultural activities if matched by outside donors). Beginning in Fiscal Year 2011, the state usurped these monies for their deficit. 2011 did see receipt of some final LTAFII transit funds and these monies will be paid to Yuma County as part of the creation of the Intergovernmental Public Transportation Authority, a new transit agency. Historically, the city opted to expend the 10 percent for cultural activities with the remainder transferred to the Capital Projects Fund for street construction. With the elimination of the funding source by the legislature, the City budgeted no expenditures for next year, beyond the payment to the new agency.
2009-2010 2010-2011 2010-2011 2011-2012
LOCAL TRANSP. ASSISTANCE FUND ACTUAL BUDGET ESTIMATE REQUEST
Undesignated Fund Balance July 1, 117,460 117,460 281 76,045
Sources:
Estimated Revenues 270,407 - 75,764 -
Total Sources 270,407 - 75,764 -
Uses:
Expenditures
Operating 94,429 - - 75,000
Capital Improvements 293,157 - - -
Total Uses 387,586 - - 75,000
Undesignated Fund Balance June 30, 281 117,460 76,045 1,045
LTAF
2003 434,212$
2004 431,754
2005 428,517
2006 427,720
2007 425,847
2008 423,054
2009 394,161
2010 426,236
2011 75,764
2012 -

22
CITY ROAD TAX FUND This fund accounts for the collection and expenditure of a local one-half percent transaction privilege tax approved by voters in 1994 for maintenance and construction of roadways. While some operating expenditures related to retention basins are recorded within the fund, the majority of the funds are eventually transferred to the Capital Projects Fund where construction expenditures for roadways are recorded. The tax base for the Road Tax is the same as the one percent general tax. Its trends and method of projection are the same as that revenue. With the decline in tax revenues for this fund, the City Road Tax is primarily used for paying the debt payments related to the 2007 Series Bond Issue, operating divisions related to street activities, and a small amount for capital projects.
2009-2010 2010-2011 2010-2011 2011-2012
CITY ROAD TAX FUND ACTUAL BUDGET ESTIMATE REQUEST
Undesignated Fund Balance July 1, 2,270,064 2,034,472 2,276,201 3,814,307
Sources:
Estimated Revenues 9,256,958 9,101,221 9,359,500 9,359,500
Transfers In:
Capital Improvement Fund 3,211 - - -
Total Transfers In 3,211 - - -
Total Sources 9,260,169 9,101,221 9,359,500 9,359,500
Uses:
Expenditures
Personnel 1,631,620 1,485,632 1,332,241 1,550,428
Operating 907,607 866,418 735,430 1,574,883
Capital Improvements 1,922,004 2,144,000 942,500 2,208,467
Transfers Out:
Improv. District #67 Debt Service 27,777 26,198 25,084
Debt Service Fund 4,765,025 4,783,525 4,785,025 4,772,025
Total Transfers Out 4,792,802 4,783,525 4,811,223 4,797,109
Total Uses 9,254,032 9,279,575 7,821,394 10,130,887
Undesignated Fund Balance June 30, 2,276,201 1,856,118 3,814,307 3,042,920
Road Tax
4.0
5.0
6.0
7.0
8.0
9.0
10.0
11.0
Millio
ns
Road Tax 6,448,564 6,617,396 8,581,364 9,134,900 10,334,458 10,238,075 9,479,279 8,729,327 8,991,000 8,991,000
2003 2004 2005 2006 2007 2008 2009 2010 2011 2012

23
PUBLIC SAFETY TAX FUND
This fund accounts for a special two-tenths of one percent (.2%) privilege license tax approved by qualified voters in 1994 for public safety and criminal justice facilities and equipment. This tax was scheduled to sunset in 2015; however, voters renewed the tax in 2010 to extend it an additional 25 years. Because it also shares the same tax base as the general sales tax of 1%, the Public Safety Tax is showing a very modest increase in 2011. Other revenues of the fund include interest earnings.
Public Safety Tax
-
0.50
1.00
1.50
2.00
2.50
3.00
3.50
4.00
4.50
Millions
2,646,058 2,968,482 3,431,373 3,815,628 4,132,390 4,093,834 3,790,422 3,490,540 3,595,256 3,595,256
2003 2004 2005 2006 2007 2008 2009 2010 2011 2012
For 2011, the Public Safety Tax Fund will be used to pay the debt incurred for the construction of the police station as well as the new debt issued in 2007 for various public safety projects. With the decline in tax receipts, only a small portion of capital labor is directed at this fund for next fiscal year. With the renewal of the tax came a new provision to allow for expenditures from the fund for capital equipment, which will appear in future budgets.
2009-2010 2010-2011 2010-2011 2011-2012
PUBLIC SAFETY TAX FUND ACTUAL BUDGET ESTIMATE REQUEST
Undesignated Fund Balance July 1, 43,015 233,822 325,188 929,321
Sources:
Estimated Revenues 3,492,782 3,459,800 3,600,256 3,600,256
From Debt Service Reserve -
Total Sources 3,492,782 3,459,800 3,600,256 3,600,256
Uses:
Expenditures
Personnel 64,308 65,528 65,124 72,140
Transfers Out:
Debt Service Fund 3,146,301 3,156,522 2,930,999 2,925,347
Total Transfers Out 3,146,301 3,156,522 2,930,999 2,925,347
Total Uses 3,210,609 3,222,050 2,996,123 2,997,487
Undesignated Fund Balance June 30, 325,188 471,572 929,321 1,532,090
24
RECREATION COMPLEX FUND
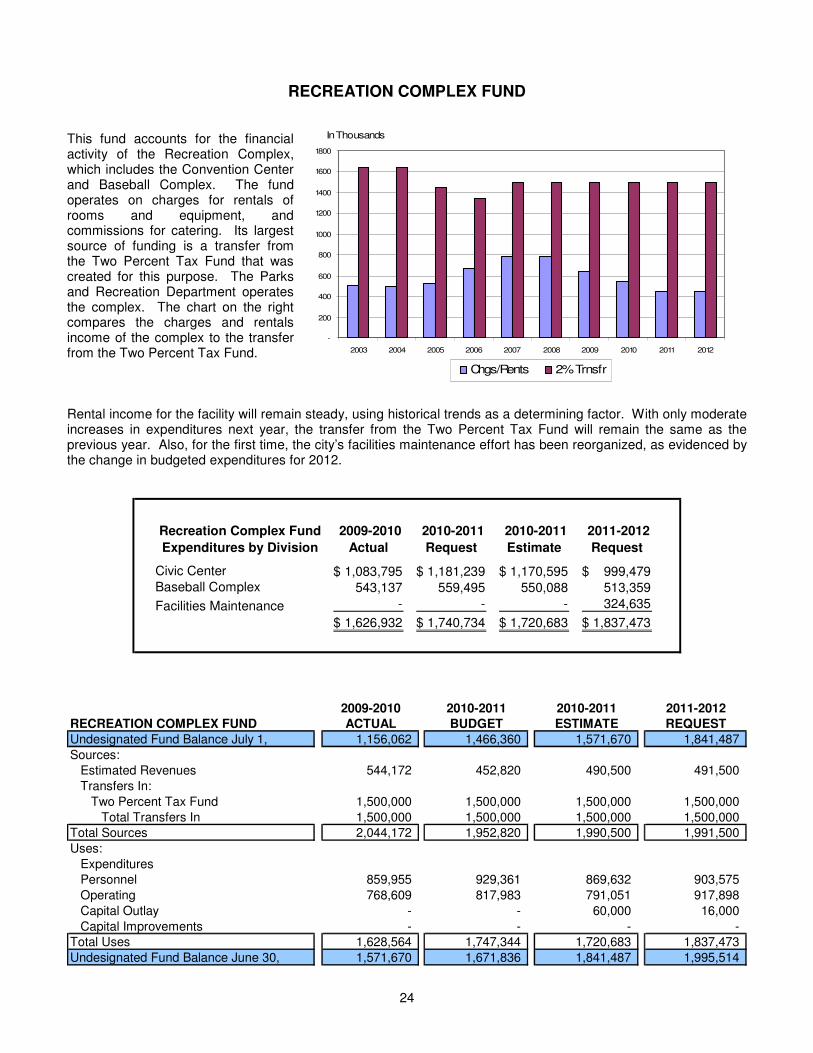
This fund accounts for the financial activity of the Recreation Complex, which includes the Convention Center and Baseball Complex. The fund operates on charges for rentals of rooms and equipment, and commissions for catering. Its largest source of funding is a transfer from the Two Percent Tax Fund that was created for this purpose. The Parks and Recreation Department operates the complex. The chart on the right compares the charges and rentals income of the complex to the transfer from the Two Percent Tax Fund.
Rental income for the facility will remain steady, using historical trends as a determining factor. With only moderate increases in expenditures next year, the transfer from the Two Percent Tax Fund will remain the same as the previous year. Also, for the first time, the city’s facilities maintenance effort has been reorganized, as evidenced by the change in budgeted expenditures for 2012.
Recreation Complex Fund
Expenditures by Division
2009-2010
Actual
2010-2011
Request
2010-2011
Estimate
2011-2012
Request
Civic Center 1,083,795$ 1,181,239$ 1,170,595$ 999,479$ Baseball Complex 543,137 559,495 550,088 513,359
Facilities Maintenance - - - 324,635
1,626,932$ 1,740,734$ 1,720,683$ 1,837,473$
2009-2010 2010-2011 2010-2011 2011-2012
RECREATION COMPLEX FUND ACTUAL BUDGET ESTIMATE REQUEST
Undesignated Fund Balance July 1, 1,156,062 1,466,360 1,571,670 1,841,487
Sources:
Estimated Revenues 544,172 452,820 490,500 491,500
Transfers In:
Two Percent Tax Fund 1,500,000 1,500,000 1,500,000 1,500,000
Total Transfers In 1,500,000 1,500,000 1,500,000 1,500,000
Total Sources 2,044,172 1,952,820 1,990,500 1,991,500
Uses:
Expenditures
Personnel 859,955 929,361 869,632 903,575
Operating 768,609 817,983 791,051 917,898
Capital Outlay - - 60,000 16,000
Capital Improvements - - - -
Total Uses 1,628,564 1,747,344 1,720,683 1,837,473
Undesignated Fund Balance June 30, 1,571,670 1,671,836 1,841,487 1,995,514
-
200
400
600
800
1000
1200
1400
1600
1800
2003 2004 2005 2006 2007 2008 2009 2010 2011 2012
Chgs/Rents 2% Trnsfr
In Thousands
25
TWO PERCENT TAX FUND
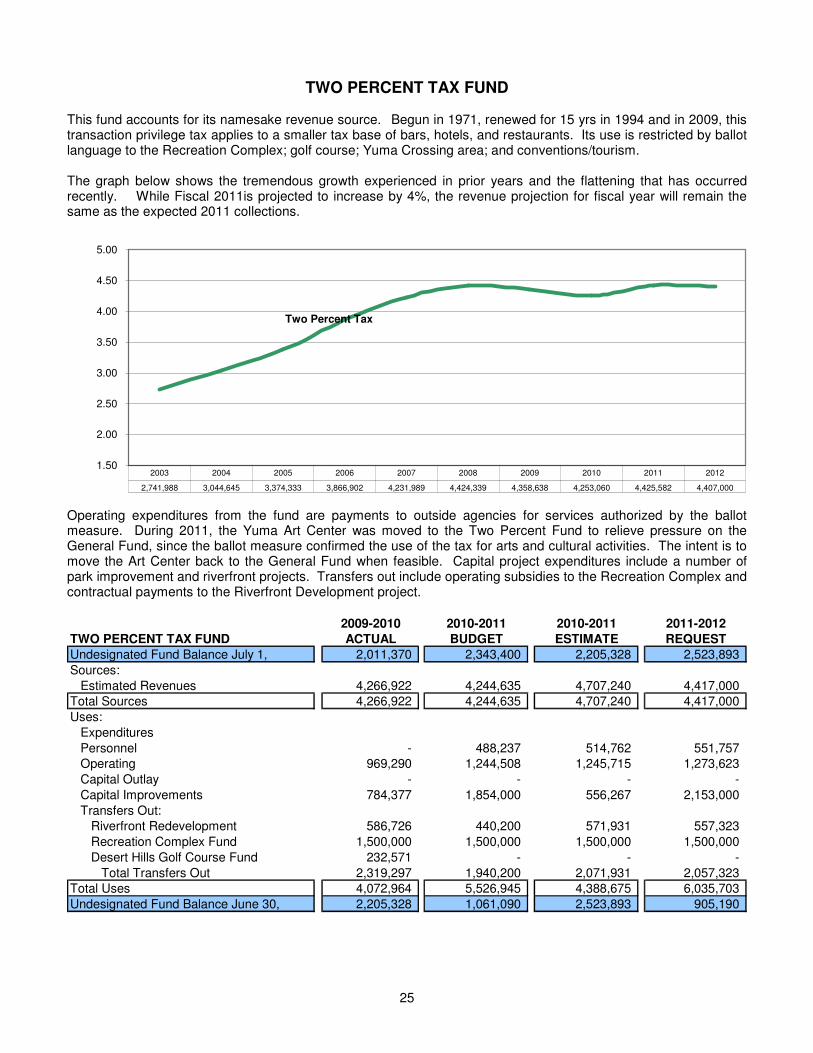
This fund accounts for its namesake revenue source. Begun in 1971, renewed for 15 yrs in 1994 and in 2009, this transaction privilege tax applies to a smaller tax base of bars, hotels, and restaurants. Its use is restricted by ballot language to the Recreation Complex; golf course; Yuma Crossing area; and conventions/tourism. The graph below shows the tremendous growth experienced in prior years and the flattening that has occurred recently. While Fiscal 2011is projected to increase by 4%, the revenue projection for fiscal year will remain the same as the expected 2011 collections.
Operating expenditures from the fund are payments to outside agencies for services authorized by the ballot measure. During 2011, the Yuma Art Center was moved to the Two Percent Fund to relieve pressure on the General Fund, since the ballot measure confirmed the use of the tax for arts and cultural activities. The intent is to move the Art Center back to the General Fund when feasible. Capital project expenditures include a number of park improvement and riverfront projects. Transfers out include operating subsidies to the Recreation Complex and contractual payments to the Riverfront Development project.
2009-2010 2010-2011 2010-2011 2011-2012
TWO PERCENT TAX FUND ACTUAL BUDGET ESTIMATE REQUEST
Undesignated Fund Balance July 1, 2,011,370 2,343,400 2,205,328 2,523,893
Sources:
Estimated Revenues 4,266,922 4,244,635 4,707,240 4,417,000
Total Sources 4,266,922 4,244,635 4,707,240 4,417,000
Uses:
Expenditures
Personnel - 488,237 514,762 551,757
Operating 969,290 1,244,508 1,245,715 1,273,623
Capital Outlay - - - -
Capital Improvements 784,377 1,854,000 556,267 2,153,000
Transfers Out:
Riverfront Redevelopment 586,726 440,200 571,931 557,323
Recreation Complex Fund 1,500,000 1,500,000 1,500,000 1,500,000
Desert Hills Golf Course Fund 232,571 - - -
Total Transfers Out 2,319,297 1,940,200 2,071,931 2,057,323
Total Uses 4,072,964 5,526,945 4,388,675 6,035,703
Undesignated Fund Balance June 30, 2,205,328 1,061,090 2,523,893 905,190
Two Percent Tax
1.50
2.00
2.50
3.00
3.50
4.00
4.50
5.00
2,741,988 3,044,645 3,374,333 3,866,902 4,231,989 4,424,339 4,358,638 4,253,060 4,425,582 4,407,000
2003 2004 2005 2006 2007 2008 2009 2010 2011 2012

26
MALL MAINTENANCE FUND
The Mall Maintenance Fund accounts for the collection and expenditure of a special property tax levied on properties located in the downtown mall. The district maintains the common areas of the downtown mall. The Parks Department is responsible for the maintenance. The district was originally created in 1969 to finance improvements to the downtown business area in an effort to retain retail business as the city grew to the south.
Mall District Levy and Tax Rate
-
50,000
100,000
150,000
200,000
250,000
2.00
4.00
6.00
8.00
10.00
12.00
14.00
Levy 83,184 88,411 93,857 101,821 113,345 105,390 154,174 117,794 200,000 125,000
Rate 4.7747 4.7747 4.7747 4.7747 4.7747 4.7747 4.7747 4.7747 4.7747 2.7927
2003 2004 2005 2006 2007 2008 2009 2010 2011 2012
The plan failed to retain the larger retail outlets that eventually did move south in the city and the downtown area declined. In more recent years, however, new smaller retail developments have flourished. To help spur continued growth, the council reduced the tax rate of the district. Since then, assessed values have increased leading to the improving tax collections as shown in the above chart. In 2011, the city failed to lower the tax rate because of the surge in values and increased tax collections resulted. To mitigate this effect on the district, the city will maintain its subsidy for 2011 and allow the tax levy to stabilize around $125,000. This action will temporarily reduce the 2012 subsidy to zero. The Parks Department is reducing their operating budget slightly for 2012 by reducing the labor effort in the mall area.
2009-2010 2010-2011 2010-2011 2011-2012
MALL MAINTENANCE FUND ACTUAL BUDGET ESTIMATE REQUEST
Undesignated Fund Balance July 1, - - - 97,893
Sources:
Estimated Revenues 126,151 111,500 201,500 126,500
Transfers In:
General Fund 90,809 120,863 117,891 -
Total Transfers In 90,809 120,863 117,891 -
Total Sources 216,960 232,363 319,391 126,500
Uses:
Expenditures
Personnel 108,439 115,680 111,124 89,107
Operating 108,521 116,683 110,374 135,286
Total Uses 216,960 232,363 221,498 224,393
Undesignated Fund Balance June 30, - - 97,893 -

27
RADIO COMMUNICATIONS FUND
The Radio Communications Fund was created to track the expenditures of the new Yuma Regional Communication System, which will include the construction of the new 800/700 MHz digital trunked radio system for use by the city’s public safety agencies. This fund has grown to the point that it has been reclassified as a Special Revenue Fund. The system will be designed to integrate and include interoperability capabilities for use by the County of Yuma and other city and local emergency response agencies. To assist with the construction of this system, grants and other local emergency response agencies contributions are helping fund this deployment. Monies are also included within the Grant Fund for purchase of communications infrastructure related to the project.
2009-2010 2010-2011 2010-2011 2011-2012
RADIO COMMUNICATIONS FUND ACTUAL BUDGET ESTIMATE REQUEST
Undesignated Account Balance July 1, 625,163 548,077 761,779 244,886
Sources:
Estimated Revenues 524,913 302,200 401,500 301,500
Transfers In:
General Fund 158,100 123,900 123,900 123,900
Solid Waste Fund 4,800 5,400 5,400 5,400
Equipment Maintenance Fund - 900 900 900
Total Transfers In 162,900 130,200 130,200 130,200
Total Sources 687,813 432,400 531,700 431,700
Uses:
Expenditures
Personnel 175,158 202,820 181,590 180,429
Operating 297,236 196,563 238,764 204,115
Capital Outlay 78,803 500,000 628,239 230,000
Total Uses 551,197 899,383 1,048,593 614,544
Undesignated Account Balance June 30, 761,779 81,094 244,886 62,042

28
GRANT FUNDS
A variety of federal and state grants and entitlements are recorded in this fund. Individual grant funds included here are the HUD CDBG Entitlement, Community Redevelopment, DOJ Weed and Seed Initiative, and the Appropriated Grants Fund. The largest continuing grant is the Community Development Block Grant (CDBG). The city continues to seek grant funding for a number of transportation, communication and parks projects with related capital projects expenditures planned in the fund. All grant funds are restricted to the purposes for which the grants were authorized. Those purposes range from parks improvements to overtime compensation for police officers. This fund’s budget will vary significantly from year to year as the city budgets for all grants for which staff believes it has a reasonable chance of award. This often causes a distinct variance between the budget of a given year and its actual revenues and expenditures.
2009-2010 2010-2011 2010-2011 2011-2012
GRANT FUNDS ACTUAL BUDGET ESTIMATE REQUEST
Undesignated Fund Balance July 1, - - - -
Sources:
Estimated Revenues 8,782,299 34,179,860 11,401,297 38,678,178
Total Sources 8,782,299 34,179,860 11,401,297 38,678,178
Uses:
Expenditures
Personnel 1,582,178 534,817 1,776,769 2,291,190
Operating 3,474,662 9,380,322 6,844,935 7,810,709
Capital Outlay 2,367,631 191,848 1,132,423 5,124,279
Capital Improvements 1,357,828 24,072,873 1,647,170 23,452,000
Total Uses 8,782,299 34,179,860 11,401,297 38,678,178
Undesignated Fund Balance June 30, - - - -

29
Debt service funds are used to account for payment of principal and interest on bonded debt paid from governmental fund resources. Long-term bonded debt of Enterprise Funds is recorded and paid directly from the fund. A discussion of debt activity is included in the Debt Management section. The City has two types of long-term governmental debt. First is debt of the Yuma Municipal Property Corporation (MPC). The several bond issues of the MPC are represented below. Transfers from the operating funds benefiting from the infrastructure provided by the debt are made each year. Individual Debt Service Funds included here are the 2003 Refunding MPC Debt Service Fund, 2007B MPC Debt Service Fund, the 2007D MPC Debt Service Fund and the 2010 Refunding MPC Debt Service Fund.
2009-2010 2010-2011 2010-2011 2011-2012
DEBT SERVICE FUNDS ACTUAL BUDGET ESTIMATE REQUEST
Undesignated Fund Balance July 1, - (2,000) - -
Sources:
Estimated Revenues - 2,000 - -
Bond Proceeds 639,275
Transfers In:
General Fund 2,756,032 2,548,845 4,281,762 4,269,772
Desert Hills Golf Course Fund 232,571 - - -
Highway Users Revenue Fund 101,944 100,787 100,969 101,202
Road Tax Fund 4,765,025 4,783,525 4,785,025 4,772,025
Solid Waste Fund 21,089 20,849 20,887 20,935
Capital Project Fund 118 - - -
Water Fund 62,683 61,972 62,083 62,227
Wastewater Fund 24,189 23,915 23,958 24,013
Public Safety Tax 3,146,301 3,156,522 2,930,999 2,925,347
Total Transfers In 11,109,952 10,696,415 12,205,683 12,175,521
Total Sources 11,749,227 10,698,415 12,205,683 12,175,521
Uses:
Expenditures
Debt Service 11,749,227 10,696,415 12,205,683 12,175,521
Total Uses 11,749,227 10,696,415 12,205,683 12,175,521
Undesignated Fund Balance June 30, - - - - In addition to governmental debt, the City also records the activity of two Improvement Districts. For Improvement District 67, the proceeds were used to construct public improvements around the new Yuma Palms Regional Center. The mall, the sole property owner within the district, pays the debt service on the bonds after which certain sales tax rebates are made in accordance with a development agreement. Fund balance held by the fund was established through a debt service reserve. The reserve will return to the General Fund at the final payment of the bonds. The activity of that agreement and related debt activity is included on the following page.
DEBT SERVICE FUNDS

30
2009-2010 2010-2011 2010-2011 2011-2012
IMPR DISTRICT #67 DEBT SERVICE ACTUAL BUDGET ESTIMATE REQUEST
Undesignated Account Balance July 1, 530,575 540,575 534,265 534,265
Sources:
Estimated Revenues 919,658 952,168 921,683 926,103
Transfers In:
City Road Tax Fund 27,777 26,198 25,084
Wastewater Fund 8,772 9,205 8,813
Total Transfers In 36,549 - 35,403 33,897
Total Sources 956,207 952,168 957,086 960,000
Uses:
Expenditures
Debt Service 952,518 956,736 957,086 960,000
Total Uses 952,518 956,736 957,086 960,000
Undesignated Account Balance June 30, 534,265 536,007 534,265 534,265 Improvement District 68 was also created to construct public improvements around the new Las Palmillas Shopping Center. The developer of this project, the sole property owner within the district, pays the debt service. The activity of that agreement and related debt activity is included below. For financial statement presentation, the two fund types are combined in the Comprehensive Annual Financial Report, but presented separately herein for the sake of clarity.
2009-2010 2010-2011 2010-2011 2011-2012
IMPR DISTRICT #68 DEBT SERVICE ACTUAL BUDGET ESTIMATE REQUEST
Undesignated Account Balance July 1, 12,323 14,973 5,936 5,936
Sources:
Estimated Revenues 200,365 382,620 382,630 384,955
Transfers In:
Capital Project Fund 171,048 - - -
Total Transfers In 171,048 - - -
Total Sources 371,413 382,620 382,630 384,955
Uses:
Expenditures
Debt Service 377,800 382,280 382,630 384,955
Total Uses 377,800 382,280 382,630 384,955
Undesignated Account Balance June 30, 5,936 15,313 5,936 5,936

31
This fund accounts for the expenditures related to capital improvement projects for governmental funds. Revenues include anticipated or actual bond proceeds and transfers from other funds for their respective projects. Expenditures for capital projects of Enterprise Funds are shown within that section. A list of capital projects is included within the Capital Improvement Section of this document. In 2009, all capital improvements began to be budgeted and paid directly from the fund that they originate. The only remaining capital projects that remain in the capital projects fund are for miscellaneous revenue sources that are not collected in any other existing fund. A series of public meetings and presentations to Council occur with this portion of the budget. By charter, the capital improvement program is developed separately from the operating budget. However, while separate, this budget is not independent, as it relies on revenues from the operating funds for its capital sources. Accordingly, operational needs of the departments come first in determining use of expendable resources. Other sources of revenue for this fund include governmental activity long-term debt proceeds and developer deposits. These are the primary reason why the fund ends a given year with a fund balance, as these proceeds are not always spent in the year received.
2009-2010 2010-2011 2010-2011 2011-2012
CAPITAL PROJECTS FUND ACTUAL BUDGET ESTIMATE REQUEST
Designated Fund Balance July 1, 47,349,127 32,656,741 31,266,626 28,584,850
Sources:
Estimated Revenues 3,031,816 16,397,003 5,868,225 25,332,425
Total Sources 3,031,816 16,397,003 5,868,225 25,332,425
Uses:
Operating - - 3,711 -
Capital Improvements 18,909,208 39,686,376 8,546,290 44,471,106
Transfers Out:
General Fund 30,732 - - -
City Road Tax 3,211 - - -
Debt Service Fund 118 - - -
Improv. District #68 Debt Service 171,048 - - -
Total Transfers Out 205,109 - - -
Total Uses 19,114,317 39,686,376 8,550,001 44,471,106
Undesignated Fund Balance June 30, 31,266,626 9,367,368 28,584,850 9,446,169
CAPITAL PROJECTS FUND

32
As noted in the overview, enterprise funds are used by governments to account for operations in which user charges are the main source of revenue. Taxes and other general revenues are not used to finance these operations for a number of reasons:
• The beneficiary of services of an enterprise-related activity can be readily identified and the service provision can be measured to determine charges.
• General revenues have legal, statutory or charter-related limitations in amount and cannot cover all the services required by its citizens.
• General revenues are historically used to finance expenditures for services in which the ultimate beneficiary cannot be readily determined.
Enterprise funds account for activities using accounting principles similar to commercial businesses. For financial reporting purposes, each fund records transactions on an accrual basis in which long-lived assets are not recorded as expenses when purchased but as assets. The costs of these assets are then amortized over their useful lives as depreciation. Similarly, any debt of an enterprise fund is recorded as a long-term liability within the fund with the only expense recognition related to interest on the debt. For budget purposes, however, the expenditure of monies related to these activities must be accounted for like those of governmental funds. As such, expenditure of funds is generally reported when expended, irrespective of the long-term use of the underlying asset. Moreover, state law requires the budgeting of all funds that are to be expended in a fiscal year. This leads to a budget basis of reporting that is not in accordance with generally accepted accounting principles (GAAP). This “budget basis” results in two types of reporting for Enterprise Funds on the city’s financial statements. That basis shows operating budgets that are similar to GAAP and capital budgets that report in a more traditional governmental display. This display does not included budgets for depreciation.
WATER FUND The Water Fund records the financial activity of the City’s water treatment and distribution system. The system is not tax supported but relies on a combination of charges for water and capacity fees for new development to maintain and expand its services to meet the needs of a growing city. The chart above shows the 48% growth in water customers since 1997. This growth has come with the price of investing in water system infrastructure and plant capacity. The system continues to undergo almost $100 million in new construction to accommodate unprecedented growth in Yuma. While the city was able to avoid rate increases for several years, a series of substantial rate changes occurred through 2008, to provide the cash flow necessary for system expansion. The chart below provides a history of metered water sales versus capacity charges. The term ‘capacity charges’ includes system development fees. Until 2001, the increase in sales was driven only by consumption, whether that consumption was from new or current customers. Since then, rate increases have combined with consumption to
ENTERPRISE FUNDS
WATER CUSTOMER GROWTH
16
17
18
19
20
21
22
23
24
25
26
27
28
29
30
Jan-
02
Jul-
02
Jan-
03
Jul-
03
Jan-
04
Jul-
04
Jan-
05
Jul-
05
Jan-
06
Jul-
06
Jan-
07
Jul-
07
Jan-
08
Jul-
08
Jan-
09
Jul-
09
Jan-
10
Jul-
10
Jan-
11
Thousands o
f C
usto
mers

33
cause the surge in total metered revenues. Also, these very rate increases have caused total capacity charges to increase similarly. These rate increases are the basis for financing the system expansion. Revenues for 2012 are determined on the basis of the systems historical growth along with a series of substantial changes in rates. Because water rate increases are imposed in January, in times of lower consumption, any given rate increase will affect the projection for only half the year.
The operating portion of the budget is presented below. Debt service appears as both expenditure and a transfer because debt is recorded in the Water Fund and because the fund pays a portion of the debt used to construct the Public Works Building. The latter is part of governmental debt not recorded in this fund.
2009-2010 2010-2011 2010-2011 2011-2012
WATER FUND ACTUAL BUDGET ESTIMATE REQUEST
Budgetary Fund Balance July 1, 8,675,959 9,631,453 9,399,354 8,076,704
Sources:
Estimated Revenues 22,377,589 23,655,544 22,398,525 22,445,712
Total Sources 22,377,589 23,655,544 22,398,525 22,445,712
Uses:
Expenditures
Personnel 4,225,541 4,580,632 4,487,172 4,681,454
Operating 6,127,329 8,446,336 8,400,503 7,875,069
Capital Outlay 35,391 - 800 10,340
Debt Service 10,663,187 10,655,242 10,656,484 10,660,132
Capital Improvements 40,063 3,560,500 114,133 1,320,640
Transfers Out:
Debt Service Fund 62,683 61,972 62,083 62,227
Water System Development Fund 500,000 - - -
Total Transfers Out 562,683 61,972 62,083 62,227
Total Uses 21,654,194 27,304,682 23,721,175 24,609,862
Budgetary Fund Balance June 30, 9,399,354 5,982,315 8,076,704 5,912,554
Metered Water Sales vs. Capacity Charges
- 5.0 10.0 15.0 20.0 25.0
2003
2004
2005
2006
2007
2008
2009
2010
2011
2012
Water Sales 9,449,251 10,457,209 12,298,500 15,269,912 18,072,019 21,420,922 22,866,202 22,054,773 22,177,900 22,227,901
Capacity 1,784,476 2,826,218 2,450,000 2,455,133 2,206,942 2,611,726 2,323,817 1,413,426 1,000,000 1,000,000
2003 2004 2005 2006 2007 2008 2009 2010 2011 2012
34
There are four restricted water funds that do not rely on water rates, but on capacity and system charges for new development. A comparison of capacity charges and metered sales is shown on the previous page. The use of these funds is primarily for capital projects and debt service payments.
2009-2010 2010-2011 2010-2011 2011-2012
WATER TRANSFER FUND ACTUAL BUDGET ESTIMATE REQUEST
Budgetary Fund Balance July 1, 280,763 241,653 248,477 204,080
Sources:
Estimated Revenues 1,823 - 1,000 1,000
Total Sources 1,823 - 1,000 1,000
Uses:
Expenditures
Personnel 13,654 15,138 14,490 14,059
Operating 20,455 25,125 30,907 26,750
Total Uses 34,109 40,263 45,397 40,809
Budgetary Fund Balance June 30, 248,477 201,390 204,080 164,271 The Water Capacity Fund and Water System Development Fund are primarily responsible for the debt service on the Water Infrastructure Financing Authority (WIFA) loans.
2009-2010 2010-2011 2010-2011 2011-2012
WATER CAPACITY FUND ACTUAL BUDGET ESTIMATE REQUEST
Budgetary Fund Balance July 1, 919,850 1,034,376 1,235,348 1,141,374
Sources:
Estimated Revenues 1,419,473 998,500 1,010,000 1,010,000
Total Sources 1,419,473 998,500 1,010,000 1,010,000
Uses:
Expenditures
Debt Service 1,103,975 1,103,711 1,103,974 1,117,185
Capital Improvements - - - -
Total Uses 1,103,975 1,103,711 1,103,974 1,117,185
Budgetary Fund Balance June 30, 1,235,348 929,165 1,141,374 1,034,189
2009-2010 2010-2011 2010-2011 2011-2012
WATER SYSTEM DEVELOPMENT ACTUAL BUDGET ESTIMATE REQUEST
Budgetary Fund Balance July 1, (629,181) (47,831) (39,161) 35,839
Sources:
Estimated Revenues 90,020 74,850 75,000 75,000
Transfers In:
Water Fund 500,000 - - -
Total Transfers In 500,000 - - -
Total Sources 590,020 74,850 75,000 75,000
Uses:
Expenditures
Debt Service - - - -
Capital Improvements - - - -
Total Uses - - - -
Budgetary Fund Balance June 30, (39,161) 27,019 35,839 110,839
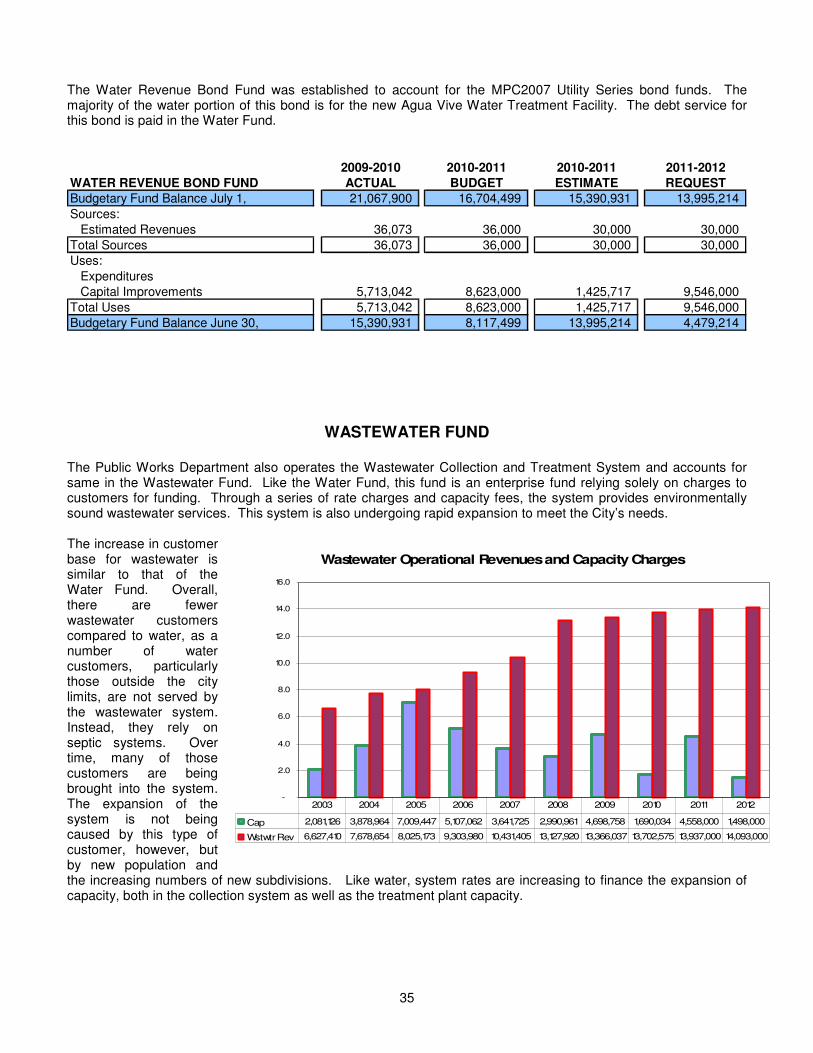
35
The Water Revenue Bond Fund was established to account for the MPC2007 Utility Series bond funds. The majority of the water portion of this bond is for the new Agua Vive Water Treatment Facility. The debt service for this bond is paid in the Water Fund.
2009-2010 2010-2011 2010-2011 2011-2012
WATER REVENUE BOND FUND ACTUAL BUDGET ESTIMATE REQUEST
Budgetary Fund Balance July 1, 21,067,900 16,704,499 15,390,931 13,995,214
Sources:
Estimated Revenues 36,073 36,000 30,000 30,000
Total Sources 36,073 36,000 30,000 30,000
Uses:
Expenditures
Capital Improvements 5,713,042 8,623,000 1,425,717 9,546,000
Total Uses 5,713,042 8,623,000 1,425,717 9,546,000
Budgetary Fund Balance June 30, 15,390,931 8,117,499 13,995,214 4,479,214
WASTEWATER FUND
The Public Works Department also operates the Wastewater Collection and Treatment System and accounts for same in the Wastewater Fund. Like the Water Fund, this fund is an enterprise fund relying solely on charges to customers for funding. Through a series of rate charges and capacity fees, the system provides environmentally sound wastewater services. This system is also undergoing rapid expansion to meet the City’s needs. The increase in customer base for wastewater is similar to that of the Water Fund. Overall, there are fewer wastewater customers compared to water, as a number of water customers, particularly those outside the city limits, are not served by the wastewater system. Instead, they rely on septic systems. Over time, many of those customers are being brought into the system. The expansion of the system is not being caused by this type of customer, however, but by new population and the increasing numbers of new subdivisions. Like water, system rates are increasing to finance the expansion of capacity, both in the collection system as well as the treatment plant capacity.
Wastewater Operational Revenues and Capacity Charges
-
2.0
4.0
6.0
8.0
10.0
12.0
14.0
16.0
Cap 2,081,126 3,878,964 7,009,447 5,107,062 3,641,725 2,990,961 4,698,758 1,690,034 4,558,000 1,498,000
Wstwtr Rev 6,627,410 7,678,654 8,025,173 9,303,980 10,431,405 13,127,920 13,366,037 13,702,575 13,937,000 14,093,000
2003 2004 2005 2006 2007 2008 2009 2010 2011 2012
36
The operations portion of the Wastewater Fund is presented first. As in the Water Fund, this fund transfers monies to the debt service funds to pay its portion of the debt recorded in governmental funds that benefit wastewater operations. For capital projects, both operational revenues and capacity charges pay for their respective share of improvement and capital projects expenditures are budgeted in both portions.
2009-2010 2010-2011 2010-2011 2011-2012
WASTEWATER FUND ACTUAL BUDGET ESTIMATE REQUEST
Budgetary Fund Balance July 1, (1,735,615) 514,821 1,213,685 3,521,353
Sources:
Estimated Revenues 13,744,446 13,632,428 13,961,578 14,117,578
Total Sources 13,744,446 13,632,428 13,961,578 14,117,578
Uses:
Expenditures
Personnel 2,751,051 2,948,770 3,004,108 3,096,801
Operating 5,655,696 6,273,468 6,217,118 5,984,852
Capital Outlay - - 6,000 103,146
Debt Service 2,348,870 2,355,618 2,355,963 2,356,078
Capital Improvements 6,568 200,000 37,558 1,153,100
Transfers Out:
Improv. District #67 Debt Service 8,772 - 9,205 8,813
Debt Service Fund 24,189 23,915 23,958 24,013
Total Transfers Out 32,961 23,915 33,163 32,826
Total Uses 10,795,146 11,801,771 11,653,910 12,726,803
Budgetary Fund Balance June 30, 1,213,685 2,345,478 3,521,353 4,912,128 There are five restricted wastewater funds that are for various capacity charges for system expansion. The Wastewater Capacity Fund and Wastewater Sanitary Sewer Interceptor Charge Fund (SSIC) are primarily responsible for the debt service on the Water Infrastructure Financing Authority (WIFA) loans.
2009-2010 2010-2011 2010-2011 2011-2012
WASTEWATER CAPACITY FUND ACTUAL BUDGET ESTIMATE REQUEST
Budgetary Fund Balance July 1, 6,745,247 5,294,760 5,511,160 5,524,299
Sources:
Estimated Revenues 1,744,440 6,528,000 4,570,000 1,510,000
Loan payback fr WW SSIC - 193,068 193,068 193,068
Total Sources 1,744,440 6,721,068 4,763,068 1,703,068
Uses:
Expenditures
Debt Service 2,978,527 2,978,488 2,978,488 2,978,488
Capital Improvements - 5,140,000 1,771,441 2,700,000
Total Uses 2,978,527 8,118,488 4,749,929 5,678,488
Budgetary Fund Balance June 30, 5,511,160 3,897,340 5,524,299 1,548,879
2009-2010 2010-2011 2010-2011 2011-2012
WASTEWATER SSIC ACTUAL BUDGET ESTIMATE REQUEST
Budgetary Fund Balance July 1, (141,769) (18,419) (13,616) 166,848
Sources:
Estimated Revenues 134,690 629,900 380,100 215,100
Total Sources 134,690 629,900 380,100 215,100
Uses:
Expenditures
Loan payback to WW Capacity - 193,068 193,068 193,068
Debt Service 6,537 6,568 6,568 6,568
Capital Improvements - - - -
Total Uses 6,537 199,636 199,636 199,636
Budgetary Fund Balance June 30, (13,616) 411,845 166,848 182,312

37
There are two wastewater trunk sewer funds that are for the collection of fees for future sanitary trunk sewer improvements in these established areas as defined by the Metropolitan Sanitary Sewer Collection System Master Plan. These two funds are shown below: Wastewater Area A & B and Wastewater 26
th Pl Trunk.
2009-2010 2010-2011 2010-2011 2011-2012
WASTEWATER AREA A&B ACTUAL BUDGET ESTIMATE REQUEST
Budgetary Fund Balance July 1, 890,440 895,940 897,135 898,935
Sources:
Estimated Revenues 6,695 5,000 1,800 1,800
Total Sources 6,695 5,000 1,800 1,800
Uses:
Expenditures
Debt Service - - - -
Total Uses - - - -
Budgetary Fund Balance June 30, 897,135 900,940 898,935 900,735
2009-2010 2010-2011 2010-2011 2011-2012
WASTEWATER 26TH PL TRUNK ACTUAL BUDGET ESTIMATE REQUEST
Budgetary Fund Balance July 1, 140,407 141,207 141,382 142,182
Sources:
Estimated Revenues 975 800 800 800
Total Sources 975 800 800 800
Uses:
Expenditures
Debt Service - - - -
Total Uses - - - -
Budgetary Fund Balance June 30, 141,382 142,007 142,182 142,982 The Wastewater Revenue Bond Fund was established to account for the MPC2007 Utility Series bond funds. The majority of the wastewater portion of this bond is for the Desert Dunes Water Reclamation Facility and the Figueroa Water Pollution Control Facility Aerator Upgrade. The debt service for this bond is paid in the Wastewater Fund.
2009-2010 2010-2011 2010-2011 2011-2012
WASTEWATER REVENUE BOND ACTUAL BUDGET ESTIMATE REQUEST
Budgetary Fund Balance July 1, 4,489,297 2,368,697 2,999,328 2,155,183
Sources:
Estimated Revenues 8,673 9,000 5,000 5,000
Total Sources 8,673 9,000 5,000 5,000
Uses:
Expenditures
Operating - - - -
Capital Improvements 1,498,642 2,351,600 849,145 2,305,000
Total Uses 1,498,642 2,351,600 849,145 2,305,000
Budgetary Fund Balance June 30, 2,999,328 26,097 2,155,183 (144,817)

38
SOLID WASTE FUND
Collection and disposal of residential solid waste is accounted for in this fund. Until fiscal 2000, no fees had been charged for collection of residential trash. Instead, the General Fund subsidized this fund by transferring sufficient monies into the fund to restore a zero fund balance. (A fund was created originally because the city charged for collection of commercial solid waste until 1999.) New for FY2011, a residential collection charge is assessed per customer at the rate of $5 per month. This charge will eliminate the need for the General Fund subsidy and make the Solid Waste fund self-supporting. Accordingly, the Solid Waste Fund is now reorganized as an Enterprise Fund. In 2000, the Environmental Solid Waste Fee was created to offset the ever-increasing costs of landfill disposal and to cover the city’s neighborhood cleanup program, its recycling efforts and its household hazardous waste collection efforts. This fee pays for pass through costs for landfill services and extra sanitation services such as the household hazardous waste days and spring cleanups. Each year, revenue projections are based on the number of solid waste accounts in the program. The Public Works Department is responsible for the Solid Waste Program.
2009-2010 2010-2011 2010-2011 2011-2012
SOLID WASTE FUND ACTUAL BUDGET ESTIMATE REQUEST
Net Working Capital July 1, - - - 165,569
Sources:
Estimated Revenues 1,878,741 3,042,000 2,958,000 3,111,000
Transfers In:
General Fund 1,030,125 - - -
Total Transfers In 1,030,125 - - -
Total Sources 2,908,866 3,042,000 2,958,000 3,111,000
Uses:
Expenditures
Personnel 743,706 790,483 777,318 797,155
Operating 2,139,271 1,988,966 1,988,826 1,930,215
Transfers Out:
Debt Service Fund 21,089 20,849 20,887 20,935
Equipment Replacement Fund - - - 250,000
Radio Maintenance Fund 4,800 5,400 5,400 5,400
Total Transfers Out 25,889 26,249 26,287 276,335
Total Uses 2,908,866 2,805,698 2,792,431 3,003,705
Net Working Capital June 30, - 236,302 165,569 272,864
Solid Waste Fees vs. General Fund Transfer
-
0.5
1.0
1.5
2.0
2.5
3.0
3.5
Fees 1,180,876 1,688,146 1,842,607 1,970,676 1,480,642 1,790,356 1,807,094 1,869,927 2,953,000 3,106,000
Transfer 1,331,569 943,914 898,204 1,172,436 1,877,405 1,939,565 1,345,700 1,193,998
2003 2004 2005 2006 2007 2008 2009 2010 2011 2012

39
DESERT HILLS GOLF COURSE FUND
The Parks and Recreation Department operates the Desert Hills Golf Course. The Two Percent Tax was used historically to subsidize operations at the course, but council has long sought that golf revenues fund the course. To this end, the transfer from the tax has been reduced over the years. Lately, that transfer was limited to the amount of debt service paid by the fund. During fiscal 2003, the fund had intended to limit this transfer even further, believing that operations would allow a reduction in the transfer.
Golf Revenues and 2% Tax Transfer
-
0.5
1.0
1.5
2.0
2.5
3.0
2% Transfer 50,841 233,340 434,805 231,532 231,334 230,725 234,659 232,313
Golf Revenues 1,973,989 2,039,022 2,098,483 2,302,607 2,290,765 2,235,772 2,452,104 2,036,641 2,035,166 2,041,400
2003 2004 2005 2006 2007 2008 2009 2010 2011 2012
However, revenue projections did not meet goals and the transfer was increased to again match the course’s portion of the debt used to finance construction of the new clubhouse and restaurant. During 2005, an additional $200,000 was transferred as planned. Over the years, a transfer from the Two Percent Tax Fund covered the amount necessary to pay debt service. For 2010, the final debt service was paid and no more transfers will be required.
2009-2010 2010-2011 2010-2011 2011-2012
DESERT HILLS GOLF COURSE FUND ACTUAL BUDGET ESTIMATE REQUEST
Net Working Capital July 1, (81,287) (101,089) 97,897 316,202
Sources:
Estimated Revenues 2,064,135 2,168,907 2,035,166 2,041,400
Transfers In:
Two Percent Tax Fund 232,571 - - -
Total Transfers In 232,571 - - -
Total Sources 2,296,706 2,168,907 2,035,166 2,041,400
Uses:
Expenditures
Personnel 829,139 763,602 783,399 890,488
Operating 1,055,812 1,183,987 1,033,462 1,162,222
Transfers Out:
Debt Service Fund 232,571 - - -
Total Transfers Out 232,571 - - -
Total Uses 2,117,522 1,947,589 1,816,861 2,052,710
Net Working Capital June 30, 97,897 120,229 316,202 304,892

40
ARROYO DUNES GOLF COURSE FUND
Also operated by the Parks and Recreation Department is the Arroyo Dunes Golf Course. No operating subsidy from the Two Percent Tax is used for this fund and it relies solely on golf charges
2009-2010 2010-2011 2010-2011 2011-2012
ARROYO DUNES GOLF COURSE FUND ACTUAL BUDGET ESTIMATE REQUEST
Net Working Capital July 1, 197,704 197,560 182,676 215,845
Sources:
Estimated Revenues 252,644 286,119 259,679 270,179
Total Sources 252,644 286,119 259,679 270,179
Uses:
Expenditures
Personnel 120,877 125,557 104,811 134,328
Operating 146,795 125,941 121,699 143,655
Total Uses 267,672 251,498 226,510 277,983
Net Working Capital June 30, 182,676 232,181 215,845 208,041
EQUIPMENT REPLACEMENT FUND
This fund accounts for the accumulation of resources from each department for the replacement of equipment. After initial purchase by the operating fund, the asset is recorded in this fund and “rented” by the operating department. This rent is determined by, and accumulates over, the life of the asset. Along with interest earnings, monies will be available for the purchase of new equipment when the older item is no longer serviceable economically. Since 2009, a suspension of the fund’s activities has been enacted except for emergency situations. All replacements are on hold during this time as well as the rents charged to the City departments. As the economy improves, reinstating this fund is a high priority for the City.
2009-2010 2010-2011 2010-2011 2011-2012
EQUIPMENT REPLACEMENT FUND ACTUAL BUDGET ESTIMATE REQUEST
Net Working Capital July 1, 16,546,767 15,108,005 16,328,924 15,597,524
Sources:
Estimated Revenues 89,816 200,000 60,000 60,000
Transfers In:
Solid Waste Fund 250,000
Total Transfers In - - - 250,000
Total Sources 89,816 200,000 60,000 310,000
Uses:
Expenditures
Operating 18,594 9,718 9,718 37,202
Capital Outlay 289,065 2,750,000 781,682 2,750,000
Total Uses 307,659 2,759,718 791,400 2,787,202
Net Working Capital June 30, 16,328,924 12,548,287 15,597,524 13,120,322
INTERNAL SERVICE FUNDS

41
EQUIPMENT MAINTENANCE FUND
This fund accounts for the operations of fleet maintenance in the city and is managed within the Public Works Department. The equipment maintenance activity used a series of interdepartmental charges to allocate the cost of maintenance to the user funds. By using an internal service fund, the financial affairs of the division will be more easily attended and understood.
2009-2010 2010-2011 2010-2011 2011-2012
EQUIPMENT MAINTENANCE FUND ACTUAL BUDGET ESTIMATE REQUEST
Undesignated Fund Balance July 1, 577,449 509,636 896,840 791,798
Sources:
Estimated Revenues 3,584,371 3,076,830 3,298,500 3,298,500
Total Sources 3,584,371 3,076,830 3,298,500 3,298,500
Uses:
Expenditures
Personnel 1,088,686 1,025,075 1,029,453 1,050,661
Operating 2,176,294 2,326,760 2,373,189 2,404,571
Capital Outlay - - - 104,000
Transfers Out:
Radio Maintenance Fund - 900 900 900
Total Transfers Out - 900 900 900
Total Uses 3,264,980 3,352,735 3,403,542 3,560,132
Undesignated Fund Balance June 30, 896,840 233,731 791,798 530,166
INSURANCE RESERVE FUND
This fund accounts for the insurance activity and risk retention of the city for liability and casualty issues. Until 2004, these expenditures were accounted for within the General Fund. In 2005, an internal service fund was created for this activity. Use of such a fund will make administration of the city's risk management easier. Premiums are charged to each fund based on liability exposure, infrastructure and other parameters Previously, the premiums charged to the operating funds were determined to not only cover claims expenditures, but to increase the reserves held within the insurance fund over time as well. For 2011 and 2012, increased claims activity is driving up premiums.
2009-2010 2010-2011 2010-2011 2011-2012
INSURANCE RESERVE FUND ACTUAL BUDGET ESTIMATE REQUEST
Undesignated Fund Balance July 1, 2,235,258 1,111,181 943,546 733,562
Sources:
Estimated Revenues 673,357 1,942,320 2,023,859 2,248,741
Total Sources 673,357 1,942,320 2,023,859 2,248,741
Uses:
Expenditures
Personnel 67,745 70,149 68,647
Operating 1,965,069 2,065,376 2,163,694 2,065,376
Total Uses 1,965,069 2,133,121 2,233,843 2,134,023
Undesignated Fund Balance June 30, 943,546 920,380 733,562 848,280

42
City of YUMA

Department Information

DEPARTMENT INFORMATION
Page No.
Office of the Mayor and Council 43
Yuma Municipal Court 45
City Administration 49
City Attorney’s Office 60
Information Technology Services 63
Finance 68
Human Resources 71
Community Development 74
Public Works 77
Utilities 82
Engineering 90
Parks and Recreation Department 94
Police Department 108
Fire Department 115

43
Office of the Mayor and Council
The Yuma City Government exists to enhance the quality of life for those who live in, work in, or visit our city. The City faces increasing demands and expectations from a diverse population for its services and resources. In a time of budget challenges at the federal, state and local level, Yuma City Government is committed to provide high quality services in an efficient and cost effective manner. Furthermore, the office of the Mayor and Council advocate for public input in their decision making.
The Mayor and Council of the City of Yuma serve the citizens of Yuma. The Mayor and Council are also responsible for appointing citizens to the City’s Boards and Commissions. The Mayor/Council Executive Assistant provides support to the Mayor and six Councilmembers and works in partnership with other city departments.
*does not reflect elected positions Listed are the Goal Action Items developed to guide our organization for the year ending June 30, 2012. Communication
• Monitor and ensure fiscal accountability with ALL our contracted and city funded agencies.
• Support GYEDC and other community organizations in their efforts to spur job growth.
• Support our community organizations in bringing job opportunities and career growth to our citizens.
• Minimize general fund dollar allocation to outside agencies.
• Re-allocate economic development support and optimize participation.
• As the governing body, we re committed to sustaining the stability and credibility of our City.
AUTHORIZED PERSONNEL
FY 10/11
FY 11/12
Mayor’s Office* 1 1
Total 1 1

44
Innovation
• Encourage and maintain a business friendly environment to facilitate private, and public sector projects and partnerships while at the same time respect and project the taxpayers’ interests.
• Maintain a progressive, modern and proactive approach to our daily business practices. Accessibility
• Participate in community wide organizations and forums to facilitate open and honest problems solving discussion. Make City government open and accessible to residents.
• Encourage community leadership and participate in City government.
• Continue to work with County and other area municipal elected and appointed officials on issues related to economic growth of projects which are beneficial to our city and community.
Commitment
• Provide clear policy directions to city staff.
• Support and fully fund the City’s core public services to ensure the safety and health of our citizens.
• Support the City’s other usual services, consistent with the City’s and State’s continuing decline in revenues.
09/10 Actual 10/11 Adjusted Budget 10/11 Estimate 11/12 Budget
Mayor's Office 249,953 249,203 251,277 250,524
249,953 249,203 251,277 250,524
Operational costs have increased slightly from last year’s budget with the majority of the increase reflected in the staff retirement costs.
09/10 Actual 10/11 Adjusted Budget 10/11 Estimate 11/12 Budget
Personal Services 124,132 111,505 109,959 117,099
Operating 125,821 137,698 141,318 133,425
Capital Outlay - - - -
249,953 249,203 251,277 250,524
GENERAL FUND
FY 2011-2012 General Fund Budget(in thousands)
$117
$133
Personnel Operating Capital Outlay

45
Yuma Municipal Court
The Mission of the Yuma Municipal Court is to enhance the quality of life in the City of Yuma by providing all people that appear in the Court with a responsive and professional judicial branch of government. JUDICIAL GOALS, AUTHORITY: The judicial system is predicated on the belief that all citizens coming before the courts are entitled to equal justice, regardless of race, ethnicity, gender, age, or economic circumstance. Courts must resolve cases swiftly and fairly. Courts must ensure that litigants and victims fully understand their rights and that those rights are protected. Courts must provide meaningful access to all, ensuring that no litigant is denied justice due to the lack of counsel or the inability to understand legal proceedings. The Yuma Municipal Court exists pursuant to the Charter of the City of Yuma, Arizona, the Constitution of the State of Arizona and the Constitution of the United States of America.
COURT FUNCTIONS: The Yuma Municipal court is a limited jurisdiction court. (Third branch of government, non-political.) It has jurisdiction over misdemeanor criminal and criminal traffic cases including, but not limited to:
• DUIs (driving under the influence)
• Driving on suspended licenses
• Reckless driving
• Possession of marijuana, possession of drug paraphernalia
• Assaults, including domestic violence assaults
• Criminal damage
• Shoplifting and theft
• Underage liquor violations
• City Ordinances These misdemeanors must have occurred within the city limits of the City of Yuma. Also included are cases that occur within the City of Yuma, which the County Attorney declines to prosecute as felony cases, and are referred to the City Prosecutor to review for “long form” complaints that are then prosecuted in the Municipal Court.
AUTHORIZED PERSONNEL
FY 10/11
FY 11/12
Municipal Court 17 17
Total 17 17

46
The court also handles civil traffic, parking and various civil matters, including emergency orders of protection (24 hours a day, 7 days a week) and injunctions against harassment. The judges of the court also issue search warrants (24 hours a day, 7 days a week) on alleged felony and misdemeanor cases. The court also adjudicates cases stemming from violations of city ordinances, which can be either civil or criminal. The court has two elected Municipal Judges and four part-time (as needed) pro tem judges that are attorneys. To be qualified for the position of presiding judge, the person must be an attorney and member in good standing for the past five years of the Arizona Bar Association. The associate judge is not required to be an attorney or a member of the Arizona Bar Association, but must be at least 30 years of age, of good moral character with no felony convictions and a resident of the City for at least 5 years proceeding the year of day of election.
2010-2011 ACCOMPLISHMENTS:
• Judicial Enforcement Unit (JEU) monitors approximately 1,292 defendants monthly that are sent to mandatory court ordered domestic violence, alcohol and/or drug counseling.
• Restitution payments to victims from July 2010 to January 2011 total $46,511.
• JEU has continued to work on the collections of delinquent accounts and submit delinquent accounts to the FARE Program which includes the Tax Intercept Program and vehicle registration holds.
• JEU works together with the Yuma County Adult Probation Department to enforce court-ordered compliance. FY 09/10 – 262 arraignments for violation of probation were conducted; and from July 2010 to January 2010 – 402 arraignments have been conducted.
• Obtained authorization for use of Local Judicial Collection Enhancement Fund (JCEF) grant funds in the amount of $61,241 to enhance, replace and repair security equipment for the court as part of a project for a city wide security system undertaken by the City IT Department, resulting in a reduction of duplication of efforts in maintaining two like systems and potentially reduction of support costs.
• Maintained a high level of security and a safe environment for the public and staff.
• The court and city prosecutor’s office have worked together to meet the mandated case processing standards for DUI (85% within 120 days and 93% within 180 days).
• Judges conducted in FY2010 1,575 Initial Appearances (defendants in-custody mostly through video court).
• Improved communications with defendants by emailing forms for those who live out of state and wish to enter a plea by mail.
• Implemented a hearing in absentia process for defendants with civil traffic violations who live outside of the county who wish to present their declaration of facts for a judge or hearing officer to decide without being present for a trial.
• Improve the format of the “bond envelope” to reduce confusion and streamline the information. Bond envelopes are provided to defendants at the time law enforcement issues a citation.
• Court triennial audit was completed and two noted areas for improvement were implemented.
• Staff attended 231.25 hours of continuing judicial education.
• The court no longer has a backlog of records being held pending destruction and is maintaining a current schedule for destruction.
• Court filings in Municipal Courts statewide are showing a 7.8% decrease in filings (criminal and civil). The Municipal Courts in Yuma County are showing a slight increase in filings.
• Court enforcement and collections of fines continue to show a steady increase in the total revenues collected.
• Statewide revenues for Municipal Courts are showing a 5.1% increase.
Did You Know? In FY 09/10 restitution payments to victims totaled $58,276.29

47
Revenues Collected by the Court represent monies collected from four sources:
1. Fines, Sanctions and Forfeitures (monetary penalties assessed and bond forfeitures) 2. Surcharges (monetary assessments authorized by statutes) 3. Fees (collectible fees for services, case processing and other court services) 4. Miscellaneous or any other revenue source
FY 06/07
FY 07/08
FY 08/09
FY 09/10
FY 10/11 (Jul-Jan)
$2,060,278 $2,549,800 $2,647,056 $2,926,340 $1,466,686
GOALS FOR 2011-2012:
• Provide fair and impartial justice. • Provide access to all, ensure that no litigant is denied justice due to lack of counsel or inability to
understand legal proceedings.
• Provide translators for all litigants in all languages needed.
• Examine case processing and other procedures to increase efficiency and implement cost savings without compromising the court’s ability to perform the duties required by law.
• Continue to update and improve the court’s web page.
• Meet the state mandated DUI clearance rate of 85% of cases within 120 days and 93% of cases within 180 days.
• Meet mandatory training hours for staff through the use of: Distance Learning technologies, such as Satellite Broadcasts Computer – Based Training Local trainers
• Continue to work on enforcement of court orders for fines, restitution, counseling, and jail commitments.
• Look for ways to use technology to improve access to the court through online bill pay, e-citation and other methods that may be available through the Administrative Office of the Courts’ grants.
• Encourage staff to continue efforts to be energy efficient.
• Encourage staff to look for opportunities to reduce cost of all court operations.
• Plan for the future needs of the court. The building is now over 10 years old and must be maintained and current equipment is aging.
YUMA MUNICIPAL
COURTS CASE ACTIVITY
FY 2009
FY 2010
% CHG
TOTAL FILINGS 16,031 17,219 .93%
TRAFFIC (CIVIL/CRIMINAL)
11,140 12,246 .91%
Misdemeanors 4,638 4,810 .96%
Orders of Protection 291 338 .86%
Injunctions against harassment
182
183
-%
YUMA COUNTY MUNICIPAL
COURTS CASE ACTIVITY
FY 2009
FY 2010
% CHG
TOTAL FILINGS 24,295 25,763 .94%
TRAFFIC (CIVIL/CRIMINAL)
17,893 18,635 .96%
Misdemeanors 6,114 6,362 .96%
Orders of Protection 372 427 .87%
Injunctions against harassment
271 249 -.92%

48
For fiscal year 2012, the Municipal Court presents a budget of $1,544,254.
FY 2011-2012 General Fund Budget
(in thousands)
$332
$1,200
Personnel Operating Capital Outlay

49
City Administration
City Administration staff manage the City’s resources to implement City Council goals and objectives, to meet the needs of City of Yuma residents and visitors, and to ensure the integrity of the municipal governing process.
The City Administrator is appointed by the City Council to serve as the City’s chief administrative officer. The City Administrator serves as an advisor to Council and ensures that City staff implements policy made by Council. All City staff work under the direction of the City Administrator. The overall City Administration budget covers salaries and associated costs for forty-five full-time personnel. There are seven budgetary divisions: Administration, Community Relations, Heritage Area, City Clerk’s Office, Elections, Economic Development and Facilities Maintenance. The Administration division manages the overall resources of the City, ensures the implementation of Council policy, guides citywide organizational development, monitors progress toward objectives and administers the city debt policy programs.
The Community Relations staff provides information to the citizens of Yuma and international / national/regional/local media outlets about City and community initiatives, projects and events. The team involves the City, and other organizations whenever possible, in regional efforts designed to foster good will and promote community-wide communication opportunities.
The Heritage Area Division provides City staff and operational support by contract to the Yuma Crossing Heritage Area Corporation, a non-profit local management entity established in accordance with the federal law creating the Heritage Area. This funding is part of the local match required for the Heritage Area to receive federal funding through the National Park Service. The staff works with the Heritage Area Board of Directors and other stakeholders to implement the Plan for the Yuma Crossing National Heritage, which was adopted in 2002. The staff also manages the riverfront redevelopment project north of 1
st Street on behalf of the City of Yuma, coordinating with the private developer. A major new
AUTHORIZED PERSONNEL
FY 10/11
FY 11/12
Administration 3 5
Community Relations 6 6
Heritage Area 6 5
City Clerk’s Office 4 4
Neighborhood Services 7 7
Economic Development - 1
Facilities Maintenance 14 9
Total 40 37

50
emphasis for the Heritage Area is operating and upgrading the two state parks historic parks that Arizona State Parks had planned to close due to state budget reductions. The City Clerk is one of four positions whose responsibilities are defined by the City of Yuma Charter. This division administers and safeguards the integrity of the municipal governing process and oversees City elections and election processes. The division also provides for public access to city records and documents, affixes the City seal on official documents, posts meeting notices, prepares City Council agendas, and records and maintains minutes of all City Council proceedings. The Economic Development Division is dramatically reduced and unfunded for the upcoming year, without a Deputy City Administrator and support staff, economic projects will be focused on GYEDC and the CA. This division also supports continued economic development relations with San Luis, Mexicali and Sayula, Mexico.
The Facilities Management Division is responsible for the repairs, maintenance, and ongoing care of 814,000 square feet of buildings, as well as surrounding landscaping and parking areas. The Facilities Management Division manages work requests, maintenance and repair, preventive and predictive maintenance, and custodial support services. Our purpose and mission is to use standardized work practices in the most cost effective and efficient use of personnel, budgeting and operational expenditures.
2010-2011 ACCOMPLISHMENTS: Administration
• This past year Administration has worked to reopen communications within the organization and with the City as a whole.
• We have put back in place our critical partnerships.
• We have moved the CIP Administrator within and are creating a new CIP tied to actual funding and to meet current fiscal realities.
• We have worked with Purchasing and Departments to “Buy Locally” where ever possible.
Community Relations
• With the relocation of the Community Relations team to the first floor of One City Plaza in early 2010, we have been able to provide better access for the Yuma community to City staff. The former “Reading Room” has been re-allocated for use by the Mayor and City Council, and other City departments to allow them to meet with constituents on a more informal level.
• Community Relations oversees the Graffiti Hotline where residents report incidents of graffiti, the information is entered into the database, and the locations reported to the abatement team. Calls to the Graffiti Hotline resulted in over 3,200 incidents of graffiti being removed from our community.
• In cooperation with the Yuma Police Department, the Community Relations team has continued the community awareness cable television series focusing on community issues such as Internet Safety, Gang Awareness, and How to Identify a School Shooter. We also began coverage of the 2011 Citizens’ Police Academy. This program, when edited will run for the next 12 months.
• In addition to the programs above, the Community Relations Team assisted the Yuma Police Department with the production of several other programs and Public Service Announcements, including a series on the Police Explorer Program.
• The Community Relations team was notified that the City of Yuma had been selected to be a Spotlight City at the 2010 International City/County Management Association (ICMA) annual conference in San Jose, complete with a video documentary about our community. The production was scheduled for the latter part of August 2010, when Yuma suffered some of the worst storm damage it had suffered in decades. The production was pushed off and the recognition will be held at the 2011 conference.

51
• Communication opportunities continued to expand with weekly appearances on “Today in Yuma”. These interviews run multiple times per day on KJOK (Outlaw Country) 1400 AM and KLJZ (Z93) 93.1 FM. Up to five interviews are taped each Thursday morning and are then aired numerous times on two local radio stations. These interview opportunities are provided as a community service by KJOK and Z93. Information from KJOK and Z93 shows that the City of Yuma was represented on nearly 65% of the available time.
• We continued to refine and enhance the City’s outside e-mail distribution of City News Releases. During the past 12 months more than 350 media releases were sent to our over 3,700 subscribers around the world in an easy-to-read web-based format.
• The Community Relations team continued to work with the local media to build on the relationships developed over the past several years. Members of the team are on call 24 hours a day, 7 days a week, and 365 days a year to provide accurate information to the local, regional, and national media on City of Yuma issues. In addition, our “Tours de Yuma”, and “lunchtime learning” continue to showcase Yuma’s assets to the local media.
• The Community Relations Team continued to expand and enhance the City’s radio program “CityNews Now” on KBLU 560 AM. With CityNews Now, we have defined a consistent format where City staff and community leaders are guests in the first two hours of the program and the City Administrator and a City Council representative are guests in the third hour. Other refinements include communicating the City’s key projects via the “Parks Update”, “Road Report”, and “What’s Going On” segments of the weekly program. Community Relations Team members hosted over 156 hours of live call-in programming including shows on Thanksgiving, Christmas, and New Year’s Day. These programs normally have a waiting list for guests not only from the City of Yuma but also Yuma County, the State of Arizona, and the federal government. When additional funding returns, we expect to be able to develop the ability to do a “live” remote broadcast. Because of the instantaneous communication opportunities provided by CityNews Now, City staff was able to provide as it happened information about the August storms, on going police operations, feral cats, and other important community issues.
• The Community Relations Team provided video support and technical assistance to nearly 400 meetings, open houses, and events held in and around One City Plaza and the Yuma community during this Fiscal Year.
• The Director of Community Relations represented the City of Yuma and the State of Arizona at the American Academy of Certified Public Managers
® Conference in Oklahoma City. Our involvement in
this organization gives us the opportunity to continue to spread the word about the great work we are doing here in the City of Yuma. Greg Hyland was recognized by the Academy as the 2010 Henning Award for Leadership in the Public Sector. Greg is the 21
st recipient of this award, and the first from
Arizona. This award is named after Kenneth K. Henning, the founder of the Certified Public Manager Program that was developed in Georgia, under then Governor Jimmy Carter. At the 2011 National Board Meeting, a proposal was made to host the 2014 National Conference in Yuma. If successful, this would bring in an additional 600-800 room nights for our local hotels.
• Several brochures were developed for other City departments this past year, including full color brochures with information on the City’s recycling program, and a double sided brochure with the Solid Waste Collection Schedule on one side, and City Hall hours/days of operation on the other. The Community Relations team also maintains and publishes the City of Yuma’s internal telephone directory. This includes updating employee information in the database, printing and distributing the document to all City employees.
• Working with all City departments, we continued to expand communication opportunities between the City of Yuma and the general public. The Community Relations team coordinated weekly appearances with the Parks & Recreation, Police, and Fire Department staffs on the local NBC affiliate, KYMA. Parks & Recreation appeared on Tuesdays and the Police and Fire Departments appeared on alternating Thursdays. Because of a staffing reduction at KYMA, City appearances have been curtailed for the near future.
• We expanded our use of “Social Media” including the implementation of a City of Yuma Facebook®
page and Twitter® account. All City of Yuma media releases are automatically posted to our

52
Facebook page. In a 12 month period, the Community Relations staff posted 345 “Tweets” to our 400+ “followers”. As of this writing, the City of Yuma has nearly 500 “Friends” on Facebook
®.
• Members of the Community Relations team oversee the operation and maintenance of all City Hall copiers, including verifying all supplies are on hand, coordinating service calls, and tracking the monthly usage of each copier.
• Community Relations team members edit and electronically publish “In The Know”, the City’s employee newsletter, which provides information to all City employees on such issues and insurance benefits, tax information, and important department to department information. Currently this publication is only available via the City’s Intranet; our hope is to be able to offer this important document to employees, and any other interested party, through a section on the City’s website.
Yuma Crossing National Heritage Area
• Amassed a total of $11.5 million in grants for restoration of the Yuma East Wetlands since 2001.
• Completed an additional 21 acres of marsh restoration and began an innovative program to clear and plant the bank line of the main stem of the Colorado River.
• Secured funding from Multi-Species Conversation Program (Bureau of Reclamation) for long-term maintenance support for the Yuma East Wetlands.
• Facilitated the approval and development of Yuma Federal Courthouse project, which is beginning construction in summer 2011, and will be completed in 18-24 months.
• Finalized land exchange with Bureau of Reclamation, which completes the assembly of the 22-acres for downtown riverfront redevelopment.
• Operates and maintains the Yuma Quartermaster Depot State Historic Park on behalf of the City and community. Produced and promotes a series of special events which has significantly increased park attendance.
• Assumed financial responsibility and operational management of Yuma Territorial Prison State Historic Park. Addressed deferred maintenance issues at park and designed and implemented a major upgrading of the park’s museum exhibits.
• Expanded multi-use trail system with federal TEA-21 grants along West Wetlands Parkway and along the Yuma Main Canal connecting Pivot Point Plaza to 4
th
Avenue. Completed design and awarded contract to complete a downtown wayfinding system. Secured additional $750,000 of federal funding for these projects, thereby reducing City matching requirements. Secured an additional $750,000.00 TEA-21 grant for enhancements for 4
th Avenue
gateway from California. City Clerk • Successfully conducted the 2010 Special Elections. The May 18th election ballot included questions
related to local preference and two franchise extensions. The November 2nd
election addressed the Public Safety Tax. o Worked to improve outreach to voters by utilizing a variety of media alternatives.
• Processed referendum petitions in accordance with Arizona law.
• Assisted in multiple changes and appointments for 17 City Boards & Commissions; including the alignment of terms to support the recruitment efforts.
• Continued implementation efforts towards the process for adding permanent records into the electronic document management system for search and retrieval.
• Collaborated with City departments and Arizona Department of Library, Archives and Public Records to achieve approval of City’s imaging requests and custom retention schedules.
• Scanned 10+ years of land based documents that allowed IT to build a multi-layer Geographic Information System (GIS) map used Citywide.
• Networked with Community Development and American Legal in the preparation of updated zoning code section of the Yuma City Code.
• Hosted various outside agencies for Public Record Law/Open Meeting Law training as provided through Arizona Ombudsman Office.

53
• Engaged in paperless processes of multiple tasks within the Clerk’s department.
• Received and processed approximately 219 requests for public records.
• Processed 34 Special Event Licenses and 19 Regular Liquor Licenses
• Prepared agendas and minutes for over 60 meetings and workshops for City Council Economic Development • Received $1,013,563 in CDBG funds, $26,469 in American Recovery and Reinvestment Act CDBG-R
Funds, and $230,000 in Arizona Department of Housing funds that were programmed for housing, public facilities and infrastructure improvements, public services activities and program administration. Six of the projects/activities were carried out by sub-recipients and the rest were completed by City staff.
• Worked with a consultant to develop the 2011-2015 Consolidated Plan & Analysis of Impediments to Fair Housing Choice.
• Created and implemented the Financial Literacy Academy to educate low and moderate income (LMI) people on managing their finances and avoiding predatory lending and foreclosures. Provided training to 40 people.
• Completed 17 accessibility modifications projects for disabled and elderly residents through Services Maximizing Independent Living and Empowerment (SMILE).
• Distributed 4 editions of the View from the Front Porch newsletter to residents in the Yuma High and Mesa Heights Neighborhoods.
• Continued participation in the Carver Community Garden. Collaborated with Yuma Private Industry Council to have youth build shade structure and obtain construction skills.
• Collaborated with YPIC, HACY and Boys and Girls Club to hold a youth camp for approximately 30 youth.
• Held or supported various events, services and activities at the Dr. Martin Luther King, Jr. (MLK) Neighborhood Center, including the Northend Thanksgiving Dinner, Dr. Martin Luther King, Jr. Celebration and Day of Service, summer movie nights, Financial Literacy Academy, HACY City Link leadership program, Consolidated Plan public hearing, CDBG public hearing, diabetes nutrition class support groups by Campesinos Sin Fronteras, computer classes, GED classes and college placement testing offered by Arizona Western College, a health fair, Volunteer Income Tax Assistance (VITA) Program training and free tax preparation, a migrant worker seminar, health screening by the Arizona Kidney Foundation, a fair housing awareness event, an election polling place and neighborhood meetings.
• Applied and submitted a grant application for technical assistance for Gangs 101 training through the Department of Justice as part of the continued efforts of the Weed & Seed program. Yuma was one of the 10 sites selected from over 300 Weed & Seed sites. A three day training was provided to approximately 60 individuals from all areas of law enforcement.
• Collaborated with the Yuma County Juvenile Probation office to provide landscape maintenance at the MLK Neighborhood Center, distributed neighborhood newsletters to residents in the Yuma High and Mesa Heights Neighborhoods, and assisted in maintaining the Carver Community Garden.
• Collaborated with Yuma Private Industry Council to offer workforce development programs, and operation of the Youth Computer Lab at the MLK Neighborhood Center.
• Held neighborhood cleanups and assisted elderly and disabled people in cleaning their yards. Removed 114 tons of debris from yards in the Carver Park, Yuma High and Mesa Heights Neighborhoods.
• Resolved 998 Code Enforcement cases in the Carver Park and Yuma High Neighborhoods.
• Collaborated with the Yuma Neighborhood Development Organization (YNDO) to continue affordable housing development in the Carver and Yuma High neighborhoods.
• Funded YNDO to administer an Individual Development Account (IDA) Program. Fourteen IDA's have been completed, an additional 26 are opened and in the process of saving and 16 more are currently under review.
Did You Know? Code Enforcement completed 548 inspections on rental units in the Carver Park and Yuma High Neighborhood, resulting in the correction of 481 code violations.

54
• Funded YNDO to administer an Acquisition/Rehabilitation Program. One home has been purchased for rehabilitation in the Yuma High Neighborhood. The home will be sold to a low to moderate income family.
• Administered the Yuma Community Action Poverty Simulation (CAPS) Program. Three simulations were held with approximately 280 participants. The simulations are designed to raise awareness of the issues experienced by people living in poverty. Participants role-play low-income family or agency staff roles and attempt to live a 'month' in poverty during a one-hour period.
• Contracted with Community Legal Services to administer a Fair Housing Outreach and Education program. Organized a Fair Housing poster contest for elementary school-aged children. Published a calendar using the pictures from the contest. Held a Housing Festival to celebrate Fair Housing Month. A proclamation declaring fair housing month was presented and the winners of the annual elementary school fair housing poster contest were announced.
• Participated in the State of Arizona Rural Continuum of Care by coordinating the Yuma Coalition to End Homelessness and assisting with the annual homeless street count.
• Completed 18 owner-occupied housing rehabilitation projects, including 10 Emergency Home Repair Program and 8 Home Improvement Loan Program projects.
• Completed 7 lead-base paint abatement projects for various homes that participated in the housing programs.
• Collaborated with Western Arizona Council of Governments (WACOG), Yuma County Development Services and Services Maximizing Independent Living and Empowerment (SMILE) for the Rock N’ Roll Paint-A-Thon and painted 11 homes for elderly and/or disabled persons with approximately 300 volunteers and donated paints and supplies.
• Served on a work group and participated in Rural Family Economic Success (RuFES) Action Network to develop a plan to strengthen families economically.
• In collaboration with Housing America Corporation, repaired all stairs and handrails at the Colorado Street Apartment Complex.
• Funded Regional Center for Border Health to provide job training as a Medical Caregiver to 15 at-risk seniors that attend Yuma High School.
• Completed renovations at the Dr. Martin Luther King, Jr. Neighborhood Center, which will improve functionality and energy efficiency of the facility.
• Provided funding to the Excel Group to modify and renovate a group home into 2 housing units that will be rented to low to moderate income people at affordable rates.
Facilities Maintenance • Planned and coordinated expenditures $855,000 Federal Grant using American Recovery and
Reinvestment Act funds for installation of: o 100 kW Photovoltaic Project at City Hall facility, by outside contractor, will result in energy
savings of $600,000 over twenty years. This project will reduce facility energy consumption by approximately 10% per year.
o Retrofitted approximately 2,100 lighting fixtures with new lamps and ballasts in 8 City buildings using in house labor. Estimated energy savings of $318,000 over projects ten year life.
o Installed 300 Lighting Occupancy Sensors in 8 City buildings using in-house labor. o Replaced 30 aged Air Handling Units, with new high efficiency units. o Installed 7 new Electronic Utility Meters for
Internet access to utility records.
• Applied for $60,000 in Public Utility Rebates for Energy Saving Projects.
• Applied for and received funding for APS Production Base Incentives (Utility Rebates) for City Hall
• Photovoltaic Project valued at $160,000 in incentives over ten years. City will receive credits off future utility bills for electricity generated by the photovoltaic system.
• Upgraded roof at City Hall facility in preparation for new Solar Project, and provided thermal coating.

55
• Developed 40 operations budgets for Facilities Maintenance, totaling $3.5 million.
• Switched numerous custodial products used in various facilities to lower cost product, and eliminated duplicate products.
• Reduced operating costs by having mechanical systems serviced less frequently and changing air filters and cleaning coils in house.
• Assumed responsibilities for operation and maintenance of new Class IV Laser at Pivot Point Plaza.
• Development Safety Manual, Training Program, Provided Training, and developed maintenance procedures for the laser and its associated equipment.
• Input Listing of Assets into new Facilities Management Database – approximately 3,000 assets.
• Provided facility maintenance and repair services to 40 buildings and various park sites.
• Upgraded City Pool Facilities through painting, tile replacement, roof replacement, and other cosmetic upgrade projects.
• Transferred Main Computer Room HVAC units (2 each) to generator back up, so that Air Conditioning continues to work, when building power is out.
• Performed a variety of modular furnishing rearrangement projects mostly at City Hall and Police Department.
• Installed Mini Split Air Conditioning Unit in Electrical Room at City Hall.
• Alternated staff work hours, and offered comp time to get projects and work done without paying overtime.
• Replaced 2 Compressors in Air Handlers at City Hall.
• Replaced large tonnage HVAC Compressor at Yuma Art Center.
• Constructed new Laundry Room at Yuma Civic Center and relocated laundry equipment.
• Assisted with various improvement projects at Quartermaster Depot & Yuma Territorial Prison.
• Overall and Inspection of one 180 Ton Chiller and Cooling Tower at Police Department.
• Converted and rearranged multiple office and work areas at the Police Department, including new police administration offices and conference room.
• Replaced Cooling Tower at Yuma Civic Center.
GOALS FOR 2011-2012: Administration
• Administration will continue to work to maintain our core City services at their high level while staying within our budget.
• We will continue to work with our partners to spur economic growth and jobs.
• We will continue to remain flexible to support our Citizens and businesses.
Community Relations
• In conjunction with the Yuma Fire Department, we will continue to expand our utilization of Twitter®.
Although we averaged nearly one “tweet” per day, for the entire year, our goal in 2012 will be to average two tweets per day, or 750+ for the calendar year. We will also determine the best way to expand our “followers” and determine what areas of the community we are not reaching with our Social Media efforts. Twitter is an easy, no-cost tool that enables the City to communicate with another segment of our ever-changing community.
• We will continue to explore additional communication opportunities between the City of Yuma and the Yuma community, finding that “perfect” venue that will encourage our citizens to communicate with City departments and elected officials.
• Because of scheduling and financial difficulties, we were unable to perform our CATV Viewership survey with Time Warner Cable this past year. It is our desire to have that survey completed by the end of the 2011-2012 Fiscal Year.
• We continue to move the City’s television systems toward High Definition Television (HDTV) to enhance the signal quality of customer programming. We currently have several HD Video Cameras that are used for in-house (non City Council Meeting) production. We will also need to look at

56
replacing our video server. The current system was designed eight years ago, and has been installed for over five (5) years. With a technology half-life of 18 months, we have begun to see degradation in our signal quality compared to other channels on the cable system.
• We continue to explore fund-raising opportunities utilizing the assets the City currently has. These may include, but not be limited to, selling “shout-outs” to family and friends during holiday periods such as Valentines Day, Thanksgiving, Christmas, and New Year’s. We will also continue to explore the use of underwriting to help defer the cost of our television and radio production.
• Continue the development of a city-wide communication plan to include all the communications mediums we currently utilize and those we anticipate using in the future. This would include information on: o Television o Radio o Specialized Publications o Media Releases o Podcasting o RSS Feeds o Web Streaming o Video on Demand o Blogs/Vlogs o Social Networks, including Facebook, Myspace, and You Tube
• Continue to develop an educational campaign to inform our employees (including Department Directors) on the benefits of a well thought out, proactive media strategy for City related issues. It is much better to be out front on most issues than it is to play catch up, especially when the media representatives have more information about the issue than the Community Relations Staff does, the employee social security number e-mail for example.
• Review the current City of Yuma Facilities Usage and City73/Ciudad 72 Operating Policies to ensure they are current with the new/updated regulations and technology.
• It is our hope to begin implementation of a media tracking system during this next fiscal year. This system will track not only results of our media releases, but also our use of Social Media and other communication tools.
• Because of budget reallocation, and staffing changes in City Administration, we were unable to produce the brochures we had proposed this last fiscal year. During the next 12 months, we hope to develop brochures for distribution to the Yuma community and the local news media, including: o Welcome to Yuma o Welcome to your new home o Yuma government at a glance o The benefits of living in the City of Yuma (Annexation)
• We will continue to work with Time Warner to utilize their local Video on Demand (VOD) system for customer access to all City of Yuma video programming. This will provide another method for Yuma area residents to access our programming.
• We will continue to work with our partners at El Dorado Broadcasters to develop a “live” remote broadcast capability for CityNews Now to allow for taking the City’s radio program “out of the studio”.
• Reestablish the monthly meetings between Time Warner, the City of Yuma, and Arizona Western College/Northern Arizona University. These monthly breakfast meeting took place from 1997 to 2007 and were discontinued due to lack of available staff time. Restarting these meetings will hopefully resolve any potential communication issues we may have.
• Our plans to revitalize the City of Yuma Speaker’s Bureau, and Sister Cities/Euro Camp programs will have to be postponed into later years, when appropriate funding may become available.
Yuma Crossing National Heritage Area
• Maintain 400 acres of restoration in Yuma East Wetlands, despite expected reductions in federal appropriations.
• Expand and maintain bank line restoration efforts from East Wetlands to downtown riverfront and West Wetlands.
• Provide support to GSA during construction phase of new Federal Courthouse in riverfront project.
• Improve operations at Yuma Territorial Prison State Historic Park by improving visitor experience, increasing admission revenues and reducing operating expense. The goal is to reduce the operating

57
deficit over the next 3-5 years. Until that time, community fundraising and federal funding are critical, as the City is not in a fiscal position to support this park.
• Maintain operations at Yuma Quartermaster Depot State Historic Park. Coordinate with Yuma Visitors Bureau the operations at the Arizona Welcome center. Plan, produce and implement a series of special events to increase attendance and community awareness of the park.
• Coordinate with the riverfront developer to secure additional private investment and development. City Clerk
• Continue working with Arizona Department of Library, Archives and Public Records and individual departments to achieve approval of imaging requests and retention schedules.
• Work with the County Elections Department, County Recorders Office and media to bring attention to the election process and promotion of voting rights.
• Continue evaluation of City Clerk services and processes to maximize efficiency.
• Work with individual liaisons and City Council Office to promote greater community participation in the City’s Boards and Commissions.
Economic Development
• In 2011/2012 the City of Yuma estimates receiving $1,013,563 in CDBG funds, $25,000 in CDBG program income and $70,000 in State Housing Funds from the Arizona Department of Housing. These funds will be used for housing programs, public service activities and program administration all for the benefit of LMI people in the city.
• Will complete 15 owner-occupied housing rehabilitation projects: 10 Emergency Home Repair Projects and 5 Home Improvement Loan Program projects.
• Will complete 5 lead-base paint abatement projects that participate in the housing programs.
• Will partner with various agencies to organize the 4th annual Rock n’ Roll Paint-a-Thon to paint 10 homes for elderly and/or disabled people.
• Will continue Code Enforcement efforts and the Rental Inspection Program in targeted areas.
• Will complete a major neighborhood cleanup campaign in a designated low-income target area.
• Will provide outreach events and activities to low-income neighborhoods.
• Will continue to operate the Dr. Martin Luther King, Jr. Neighborhood Center and provide services and events to LMI people.
• Will assist 15 elderly and disabled people with home accessibility modifications through the SMILE Home Modifications Program.
• Will continue to implement a proactive Fair Housing Program.
• Will continue the Community Action Poverty Simulation Program to educate the public on issues that face those in poverty.
• YNDO will open 6 micro-business Individual Development Accounts (IDA) to assist LMI people in opening small businesses and 11 homeownership IDA’s to assist with the purchase of a home.
• YNDO will purchase 3 vacant homes that are in disrepair to rehabilitate and provide affordable housing to LMI families.
• Fund the Assistance League of Yuma to purchase school clothes for 97 low to moderate income youth from the Yuma High Neighborhood.
• Fund the Saguaro Foundation to improve security of the facility that houses their vehicles used to provide transportation to disabled people.
• Fund the Western Arizona Council of Government to provide foreclosure prevention assistance and financial literacy counseling to 33 low to moderate income people that are in danger of foreclosure.
• Fund Crossroads Mission to provide personal hygiene supplies, over-the-counter medication, first aid supplies and prescription co-pays for homeless people staying at the shelters.
Facilities Maintenance
• Complete integration of Facilities Management with the final transfer of personnel and operations budgets into the consolidated department. Set up operating systems and protocols for the group.
• Complete Facility Classification System defining maintenance requirements by site.

58
• Complete Work Task Analysis for all sites managed defining maintenance services and staffing. Summarize to staffing levels and need.
• Benchmark costs of site operations for major facilities against IFMA. • Update Energy Star Benchmarking – 10 major sites.
• Devise a plan for integrated and replacement Building Automation systems, including expected costs.
• Monitor and report energy savings from Solar Project, and other energy saving projects (lighting retrofits).
• Monitor and control energy consumption at various sites, and report on energy use to internal customers.
• Coordinate Re-design or replacement of mechanical systems at City Hall facility.
• Coordinate design of new Controls System and Air Handler replacements for Yuma Civic Center.
• Update Energy Control ideas, with new recommendations on energy savings.
• Explore Energy Performance Contracting opportunities and viability.
• Explore City participation in APS Peak Demand Response Program.
• Provide monthly budget report to City Administrator.
• Update all Staff Training programs, and provide required training.
09/10 Actual 10/11 Adjusted Budget 10/11 Estimate 11/12 Budget
City Administration 994,159 392,472 390,058 451,484
Strategic
Communications678,625 636,180 617,945 657,890
Heritage Area 1,962,554 2,523,260 2,353,681 2,209,876
City Clerk's Office 294,035 241,592 280,473 262,074
Elections 201,040 - 40,059 -
Neighbood
Development1,819,806 2,504,160 1,995,841 2,382,373
Economic Development - 200,000 206,622 301,562
Facilities Maintenance 878,999 1,632,409 1,383,142 1,510,744
6,829,219 8,130,073 7,267,821 7,926,003
The City Administrator’s budget shows an decrease of 2% from the current year adjusted budget. This decrease s related to grant funds; the General Fund has actually increased by 20%. This is due partly to the reinstatement of two previously unfunded positions, including the Economic Development Manager.
09/10 Actual 10/11 Adjusted Budget 10/11 Estimate 11/12 Budget
Personal Services 2,253,252 1,832,188 1,903,242 2,124,766
Operating 1,218,835 871,656 972,824 1,208,518
Capital Outlay 43,761 - - -
3,515,848 2,703,844 2,876,066 3,333,284
GENERAL FUND

59
FY 2011-2012 General Fund Budget(in thousands)
$2,124
$1,209
Personnel Operating Capital Outlay
09/10 Actual 10/11 Adjusted Budget 10/11 Estimate 11/12 Budget
Personal Services - - - -
Operating 586,726 440,200 571,931 557,323
Capital Outlay - - - -
586,726 440,200 571,931 557,323
RIVERFRONT REDEVELOPMENT FUND
09/10 Actual 10/11 Adjusted Budget 10/11 Estimate 11/12 Budget
Personal Services 321,872 302,237 324,039 280,432
Operating 597,382 1,322,722 731,563 1,337,511
Debt Service - - - -
Capital Outlay - 4,000 4,000 4,000
919,253 1,628,959 1,059,602 1,621,943
HUD CDBG ENTITLEMENT GRANT FUND
09/10 Actual 10/11 Adjusted Budget 10/11 Estimate 11/12 Budget
Personal Services 42,542 30,700 25,632 -
Operating 181,791 301,802 255,655 50,000
Capital Outlay - - - -
224,333 332,502 281,287 50,000
COMMUNITY REDEVELOPMENT GRANT FUND
09/10 Actual 10/11 Adjusted Budget 10/11 Estimate 11/12 Budget
Personal Services 87,875 99,958 51,011 20,109
Operating 1,468,796 2,924,610 2,427,924 2,343,344
Capital Outlay - - - -
1,556,671 3,024,568 2,478,935 2,363,453
APPROPRIATED GRANTS FUND

60
City Attorney’s Office
The City Attorney's Office exists to provide legal services to the City Council, the City Administrator, and all City departments, offices and agencies in order to promote the health, safety, and welfare of our community.
The City Attorney’s Office represents the City of Yuma in all legal proceedings, including civil litigation, criminal prosecution in Municipal Court and provides a significant portion of the State legislative and lobbying support for the City of Yuma.
2010-2011 ACCOMPLISHMENTS: • Assisted in updating Animal Control Ordinance. • Assisted in Golf Course Management and Operation Service RFQ, RFP and contract. • Standardized insurance requirements for use of City facilities/events. • Assisted in Yuma Police Department agreements for use of the Public Safety Training Facility. • Reviewed and revised APS proposed contracts for streetlight pole use license, electrical energy, and
construction and maintenance of streetlights. • Assisted Facilities Maintenance with contracts for installation of the City Hall solar panel system. • Negotiated and assisted with contracts for a photovoltaic (PV) solar system at the Yuma Civic Center. • Provided quality prosecution services in Municipal Court to approximately 4400 criminal and traffic
cases. • Favorably concluded the expenditure limitation penalty issue. • Developed and negotiated long term water wheeling agreement for the Agua Viva water plant. • Provide legal advice and drafting assistance for the Intergovernmental Public Transportation Authority
(IPTA) and Medical Marijuana Zoning Ordinance. GOALS FOR 2011-2012: • Continue to provide legal assistance and coordination for negotiating and drafting development
agreements. • Continue to reorganize office processes and functions to assist City with fiscal efficiency. • Heighten enforcement of 2% City sales tax non-payment violations.
AUTHORIZED PERSONNEL
FY 10/11
FY 11/12
City Attorney’s Office 8 8
Prosecutor’s Office 2 2
Total 10 10
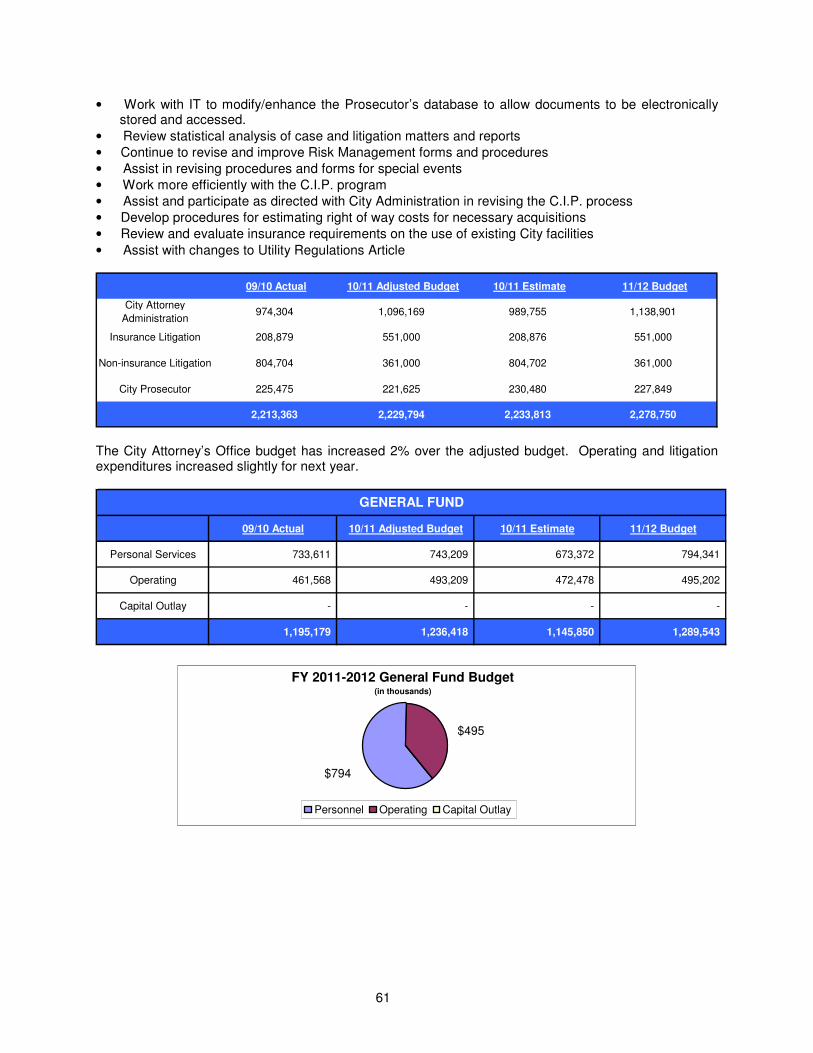
61
• Work with IT to modify/enhance the Prosecutor’s database to allow documents to be electronically stored and accessed.
• Review statistical analysis of case and litigation matters and reports • Continue to revise and improve Risk Management forms and procedures • Assist in revising procedures and forms for special events • Work more efficiently with the C.I.P. program • Assist and participate as directed with City Administration in revising the C.I.P. process • Develop procedures for estimating right of way costs for necessary acquisitions • Review and evaluate insurance requirements on the use of existing City facilities • Assist with changes to Utility Regulations Article
09/10 Actual 10/11 Adjusted Budget 10/11 Estimate 11/12 Budget
City Attorney
Administration974,304 1,096,169 989,755 1,138,901
Insurance Litigation 208,879 551,000 208,876 551,000
Non-insurance Litigation 804,704 361,000 804,702 361,000
City Prosecutor 225,475 221,625 230,480 227,849
2,213,363 2,229,794 2,233,813 2,278,750
The City Attorney’s Office budget has increased 2% over the adjusted budget. Operating and litigation expenditures increased slightly for next year.
09/10 Actual 10/11 Adjusted Budget 10/11 Estimate 11/12 Budget
Personal Services 733,611 743,209 673,372 794,341
Operating 461,568 493,209 472,478 495,202
Capital Outlay - - - -
1,195,179 1,236,418 1,145,850 1,289,543
GENERAL FUND
FY 2011-2012 General Fund Budget(in thousands)
$794
$495
Personnel Operating Capital Outlay

62
09/10 Actual 10/11 Adjusted Budget 10/11 Estimate 11/12 Budget
Personal Services 3,900 9,671 3,901 4,600
Operating 700 700 335 700
Capital Outlay - - - -
4,600 10,371 4,236 5,300
APPROPRIATED GRANTS FUND
09/10 Actual 10/11 Adjusted Budget 10/11 Estimate 11/12 Budget
Personal Services - 67,745 70,149 68,647
Operating 1,013,584 915,260 1,013,578 915,260
Capital Outlay - - - -
1,013,584 983,005 1,083,727 983,907
INSURANCE RESERVE FUND

63
Information Technology Services
The Department of Information Technology Services (ITS) exists to provide expertise in long-range planning, technical guidance, support and services that promote the use of current and future information technologies to help the City achieve their technology mission, vision, and goals. ITS staff provides technology support and service for all technology systems used by the City of Yuma and its employees. ITS also provides support and services to other Law Enforcement agencies servicing the Yuma County area which provide 9-1-1 services or are members of the Yuma Regional Communication System (YRCS) consortium. Department staff is on call 24/7 to ensure the on-going operation and availability of technology systems and consist of the following business areas: Administration: Staff oversees all department operations. Staff administers and manages the technology projects, department budget and ensures that information technology systems are successfully implemented, maintained and secured. Staff also provides contract management and technical leadership to city departments and partnership organizations. Application Support and Integration: Staff specializes in the analysis, design, development, maintenance and implementation of new and/or upgraded automated business systems. Staff manages large scale projects and assists with product selection, implementation, data conversion and systems integration. Examples of applications supported include:
• Public Safety (9-1-1, Computer Aided Dispatch, Records Management and Mobile Data Computing)
• Geographic Information Systems (GIS)
• e-Business
• Document Imaging
• SCADA (i.e. Water and Wastewater)
• Web Development
• Email/Internet Services
• Telephone and Voice Mail Services
• Financials
• Payroll/Personnel
• Community Development
• Parks and Recreation
• Etc. Network Administration and Security: Staff specializes in the installation, maintenance, upgrade and repair of city’s data network systems and infrastructures. Staff troubleshoots and resolves network system malfunctions and oversees the deployment of server-based systems and storage area networks. Staff provides facility and network design engineering and implementation services and manages end-user, system and network security. Additionally staff manages SPAM, Firewall and the city’s calendar, email and Internet services.
AUTHORIZED PERSONNEL
FY 10/11
FY 11/12
Administration 3 3
Technical Support 27 26
Radio Communications 3 3
Total 33 32

64
Telecommunication Administration: Staff specializes in the installation, maintenance, upgrade and repair of the city’s wireless, PBX and landline telephone services, video monitoring cameras, mobile data computing, radio, and paging systems. Staff troubleshoots and resolves system malfunctions, provides end-user training and support and administers all systems. Staff also approves and procures all telecommunications hardware and software purchases, including vendor payment management. Additionally staff is responsible for tracking and managing all related assets, product licenses and contracts as well as FCC filings, registrations, communications impact studies and FAA compliance for navigational hazards for city projects, sites and other liabilities. Help Desk Services: Staff is the main point of contact for all voice, video and data system issues. Staff troubleshoots and resolves end-user hardware and software malfunctions and monitors the city’s computer systems, networks and associated peripherals to ensure availability. Staff also provides application security administration, mid-range system backup services and oversees city facility access and employee ID badge issuance. Computer Hardware and Software Management: Staff members specialize in the installation, maintenance, upgrade and repair of personal computers, midrange business systems and associated peripherals. Staff troubleshoots and resolves technology system malfunctions, provides end-user support, reviews and develops citywide technology based standards and configurations and approves and procures technology systems. Staff also manages vendor payments and tracks and manages all related assets, product licenses and contracts. Computer Hardware and Software Training: Staff provides basic to high-level technical instruction in the use and operation of computer hardware, software, operating systems, telephones, technology peripherals, and department specific applications. Staff develops and implements computer-training programs and assists with the planning, testing and implementation of new and/or upgraded computer hardware and software systems. 2010-2011 ACCOMPLISHMENTS:
• Worked with Yuma County Public Safety agencies in the first stages of implementation of new YRCS Public Safety Software system.
• Continued implementation of new software for Community Development.
• Worked with Yuma Police Department (YPD) to install new Interview Room Recording hardware and software.
• Implementation of YPD on-line Citizen Reporting.
• Continued implementation with Finance Department and Human Resources to replace current financial software and Payroll/Personnel software.
• Worked with Utilities Department on the RFP to expand to a Fixed Network Water Meter Reading System.
• Expansion of Facility and Employee Badge Card Security system.
• Voice Mail Messaging upgrade and server replacement.
• Addition of regional radio infrastructure for cross connection with Arizona Dept of Public Safety.
• Upgrades to regional Microwave infrastructure.
• Addition of YCSO Jail facility into the YRCS Public Safety Software project.
• Replacement and upgrade of 65 YPD mobile computers with mobile air card connectivity.
• Addition of radio tower in San Luis for regional communications.
• Assisted with the upgrade of County wide 911 Intrado/Positron systems.
• Creation of County wide GIS address and mapping information for E911 Wireless implementation.
• Initial stages of City website redesign.
• Acquired over 2.3 million dollars in grants in support of City and County Public Safety operations and

65
services.
• Continued to expand the use and operation of the Yuma Regional Communication System.
• Continued to manage and implement elements of City’s Enterprise GIS System.
• Continued to manage and safeguard the integrity of city automated business systems and network infrastructures.
• Continued to provide technical guidance and support for department specific and citywide technologies.
• Continued to work with city staff to advance computer literacy and use of software systems. GOALS FOR 2011-2012:
• Work with YPD to complete departments’ 3–5 Year Information Technology Strategic Plan.
• Work with Yuma County Public Safety to continue installation of new Yuma County Regional Public Safety System and associated hardware, data migrations and end-user training.
• Work with Yuma County to research possibility of moving to Countywide GIS system.
• Work with all departments to determine if decentralized systems can be centralized to decrease support and maintenance costs.
• Work with Department of Community Development to complete the additional phases of e-Reviews and Citizen Access Portal implementation of new computer software system.
• Work with Utilities and Finance Departments on the assessment and transition to a monthly Utility billing and collection cycle.
• Work with Finance Department to complete the upgrade of financial software.
• Work with Human Resources to complete the upgrade of Payroll/Personnel system.
• Expansion of Storage Area Networks at YPD and City Hall for long term data storage capacity.
• Migration of 10-20 physical servers into a Virtual environment.
• Work to modify and enhance city’s website.
• Continue to expand the use and operation of the YRCS and participate on YRCS Council.
• Continue to manage and enhance elements of City’s Enterprise GIS system.
• Continue to manage and safeguard the integrity of City automated business systems and network infrastructures.
• Continue to provide technical guidance and support for department specific and citywide technologies.
09/10 Actual 10/11 Adjusted Budget 10/11 Estimate 11/12 Budget
IT Administration 337,942 396,721 301,395 4,289,444
Citywide IT Services 295,298 351,644 348,444 397,389
Technical Support 1,811,631 1,797,638 1,781,835 1,665,201
Radio Maintenance 3,361,214 2,746,093 3,850,193 3,226,050
5,806,085 5,292,096 6,281,867 9,578,084
For fiscal year 2012, the Department of Information Technology Services presents a budget of $9,578,084. This is a significant increase from the adjusted budget, primarily in grant funding. The citywide Info Technology fund contains all the expenditures required to support the city’s enterprise wide technology business systems. These expenditures were previously a part of the ITS operational budget. The Radio Communication fund contains expenditures, which will be used to support the on-going implementation and maintenance of the Yuma Regional Communication System. This fund is where the majority of reductions occurred as there is less capital expenditures required at this time.

66
09/10 Actual 10/11 Adjusted Budget 10/11 Estimate 11/12 Budget
Personal Services 2,015,635 2,062,233 1,890,126 1,848,468
Operating 411,563 463,770 430,924 461,966
Capital Outlay 16,669 20,000 110,624 41,600
2,443,867 2,546,003 2,431,674 2,352,034
GENERAL FUND
FY 2011-2012 General Fund Budget(in thousands)
$42
$1,848
$462
Personnel Operating Capital Outlay
09/10 Actual 10/11 Adjusted Budget 10/11 Estimate 11/12 Budget
Personal Services 175,158 201,740 181,590 180,429
Operating 297,236 196,563 238,764 204,115
Capital Outlay 78,803 500,000 628,239 230,000
551,197 898,303 1,048,593 614,544
RADIO COMMUNICATION FUND
The Radio Communications Fund was created to track the expenditures of the new Yuma Regional Communication System, which will include the construction of the new 800/700 MHz digital trunked radio system for use by the city’s public safety agencies. Additionally, the system will be designed to integrate and include interoperability capabilities for use by the County of Yuma and other city and local emergency response agency. To assist with the construction of this system, grants and other local emergency response agencies contributions are helping fund this deployment. Upon completion of this project, all agencies that are on the system will have the ability to communicate with each other during times of disasters or other emergency situations.

67
09/10 Actual 10/11 Adjusted Budget 10/11 Estimate 11/12 Budget
Personal Services 54,590 - 151,819 263,662
Operating 690,547 1,729,235 1,531,226 1,241,728
Capital Outlay 2,065,883 118,555 1,118,555 5,106,116
2,811,021 1,847,790 2,801,600 6,611,506
APPROPRIATED GRANTS FUND
The grant budget for fiscal year 2012 is for operating expenditures related to the Radio Maintenance Fund.

68
Finance
We, as a team, provide financial systems and operational support to assist our customers in achieving their goals.
The Finance Department consists of four divisions that serve the public and all other City departments. The Administration Division oversees the financial activities of the City while providing direction and policy to the Department. This division also directs the City’s investment program, maintains the City’s bond rating, and produces the Annual Budget. The Customer Services Division administers business licenses, 2% tax collections, and utility billings and payments. In addition, the division coordinates and compiles all cash receipts within the City.
The Purchasing Division is responsible for the procurement of supplies, services and construction, operations of the warehouse, surplus property, the City Auction and the City’s mail and distribution services. These functions include research and specification preparation, selection and solicitation of sources, contract award and administration, surplus property activities, including the City live and online Auction, and training personnel in procurement procedures and Purchasing Card program. The Accounting Division manages the accounts payable, accounts receivable, grant reporting, payroll and treasury functions. In addition, Accounting coordinates the annual audit and produces the City of Yuma’s Comprehensive Annual Financial Report. 2010-2011 ACCOMPLISHMENTS: Accounting
• Performed internal audits of department timekeeping and other payroll functions.
• Received 29th consecutive Certificate of Achievement for Excellence in Financial Reporting.
• Continued to maintain favorable bond ratings.
• Implemented use of new construction project manual templates utilized in construction solicitations.
• Managed four new stimulus grants to improve energy usage on City facilities, improve homes in Yuma area, improve PS communication among county and area cities, and improve tourism.
AUTHORIZED PERSONNEL
FY 10/11
FY 11/12
Administration 3 3
Customer Services 6 6
Purchasing Division 7 7
Accounting 10 11
Total 26 27
69
• Setup and trained department users on the new financial system. Purchasing
• Made modifications to the bid processor to reduce staff process time.
• Upgraded Contracts and Bid templates to comply with new state mandates. Continued to provide training for City divisions utilizing the financial software system.
• Peggy Hayes, Buyer, achieved Certified Public Procurement Officer (CPPO) status through the Universal Public Procurement Certification Council (UPPCC).
• Revised and redistributed commodity portfolios to improve customer service.
• Issued all construction solicitations on compact disc and majority of other Quotes, Bids, Request for Proposals (RFP’s) and Request for Qualifications (RFQ’s) electronically.
GOALS FOR 2011-2012: Administration
• Receive the Government Finance Officers Association Distinguished Budget Presentation Award for eighth time.
Accounting
• Produce and distribute the 2011 Comprehensive Annual Financial Report by September 24, 2011.
• Oversee the City’s financial situation in order to maintain or improve our bond rating.
• Receive the City’s 30th Certificate of Achievement for
Excellence in Financial Reporting.
• Implement a pay card system for employees.
Customer Service
• Continue to change out existing water meters with the Automated Meter Readers and switch accounts to a monthly billing.
• Establish Landlord Agreement for providing services to landlords and property management customers.
• Provide Faxback Business License Applications and Utility Service Applications to customers.
• Implement a new utility billing system. Purchasing
• Continue to streamline purchasing and contracting methodology to reduce time in process and provide improved customer service.
• Continue to seek long term contracting opportunities that allow a streamlined ordering process for city staff.
• Issue all construction solicitations on compact disc.
• Continue to provide outreach training for City divisions that utilize the financial software system.
• Implement and continue to train on the new financial system.
Did You Know? The FY2011 Budget Book was awarded its 7
th Government
Finance Officers Association Distinguished Budget Presentation Award.

70
09/10 Actual 10/11 Adjusted Budget 10/11 Estimate 11/12 Budget
Finance Administration 264,485 289,714 244,561 317,342
Customer Services 336,287 95,396 108,771 96,716
Purchasing 390,116 399,789 391,725 405,667
Accounting 735,344 860,864 757,724 949,118
1,726,232 1,645,763 1,502,781 1,768,843
For fiscal year 2012, the Finance Department presents a budget of $1,768,843. This is a 7.5% increase below last year’s budget and is primarily due to the reinstatement of a budget position.
09/10 Actual 10/11 Adjusted Budget 10/11 Estimate 11/12 Budget
Personal Services 1,537,840 1,335,009 1,282,637 1,436,785
Operating 188,171 310,754 220,144 332,058
Capital Outlay - - - -
1,726,011 1,645,763 1,502,781 1,768,843
GENERAL FUND
FY 2011-2012 General Fund Budget( in t housands)
$332
$1,436
Personnel Operating Capital Outlay
09/10 Actual 10/11 Adjusted Budget 10/11 Estimate 11/12 Budget
Personal Services 221 - - -
Operating - - - -
Capital Outlay - - - -
221 - - -
HUD CDBG ENTITLEMENT GRANT FUND

71
Human Resources
The Human Resources Department exists to provide a full range of Human Resources and Environmental Health and Safety services for municipal employers, employees and residents of the City of Yuma. The Human Resources Department provides a full range of Human Resource Management Services for the employees and residents of the City. These activities include recruitment, compensation and classification, compliance with employment laws, and other activities designed to enhance workplace fairness and the City’s ability to attract and retain quality employees. Additionally, the department coordinates programs related to Environmental Health & Safety Compliance; these programs include employee training, and facility and process inspections. We also handle workers compensation, medical and military leave, and retirement.
2010-2011 ACCOMPLISHMENTS:
• The City of Yuma was named as the winner in the Large Business category for Workplace Excellence.
• Recruited and hired an Environmental Program Coordinator. This position is working to protect the City of Yuma, the employees, and the citizens of Yuma from Environmental risks and maintain compliance with regulatory requirements.
• Continued to work with the YABC Board of Trustees during the 2011-2012 fiscal year.
• For the 2010 calendar year, the City of Yuma’s Human Resources Department processed the following:
o 127 personnel requisitions requesting to fill vacant positions o 38,570 hits on our job postings o 3,146 applications o 375 applicants were scheduled for written exams, and 104 applicants were scheduled for
performance exams o After the screening and testing process, we had a total of 959 eligible candidates, in which
593 were referred to the departments and 241 were interviewed o 244 hires and promotions
AUTHORIZED PERSONNEL
FY 10/11
FY 11/12
Human Resources & Environmental Health & Safety
10 10
Total 10 10

72
• Assisted employees with 148 industrial injuries.
• Processed 206 requests for Family Medical Leave for employees or their family members.
• Continued to provide high quality skill and safety focused training to City employees. A total of 910 employees were trained in 76 topic areas. This represented a total of 3,000+ contact hours.
• Continued to receive one of the best insurance rates for City liability insurance due to the management of the risk experience ratings.
GOALS FOR 2011-2012:
• Work to attract and recruit qualified paraprofessional and professionals to the City of Yuma. During this economic downturn, HR worked with all departments to assess the need to refill vacant positions.
• Continue to reassess the City’s hiring process to identify philosophical and technical changes that will expedite the process.
• Review and restructure the current hierarchy of all city positions. • Review and update all of the human resources operating policies
and administrative regulations to make them easier to understand and administer.
• Work with local and state entities to create recruitment and hiring consortiums for bringing qualified out-of-state candidates to Yuma.
• Work as part of a transition team in converting our computer system to the New World system.
• Establish a hiring practice for new supervisors.
• Establish succession planning for the City. Career development and succession planning is used to identify high potential employees and providing them with the necessary training and mentoring to prepare them for advancement within the organization.
• Continue to participate in professional human resource organizations to remain current with philosophies and approaches that will benefit the City and help us continue to be attractive and competitive.
• Continue implementation of city-wide review process/committee to analyze all vehicle accidents and incorporate changes that will reduce these accidents.
• Refine City’s return to work program to decrease lost workdays for employees suffering job-related injuries.
• Increase safety training for all City employees and focus on job and department specific training.
• Continue implementation of new FMLA regulations, design new tracking system, do City-wide employee and supervisor training.
• Provide quarterly department reports on accidents and injury statistics to reduce risk and improve employee safety.
• Continue participation in City’s emergency management planning with focus on both citizen and employee issues.
• Network with Arizona peers for improvement in Human Resources and Safety issues.
• Provide more City-specific training to supervisors and employees on identified areas of need.
• Work closely with the Household Hazardous Waste (Countrywide) program on implementing a safety and regulatory training program, mitigating safety incidents, and providing technical and compliance guidance.
• Develop and manage an Environmental Health & Safety compliance program for all City departments.
• Perform annual site Environmental Health & Safety inspections and assessments.
• Develop and manage a Citywide Regulated Waste program for all hazardous and environmental unfriendly waste.
• Establish rapport with the public on environmental issues. Provide literature and information promoting good environmental stewardship via the intranet on the City webpage.
• Update the Environmental Health & Safety Regulations Manual.
• Begin developing a database for all Environmental Health & Safety compliance requirements.
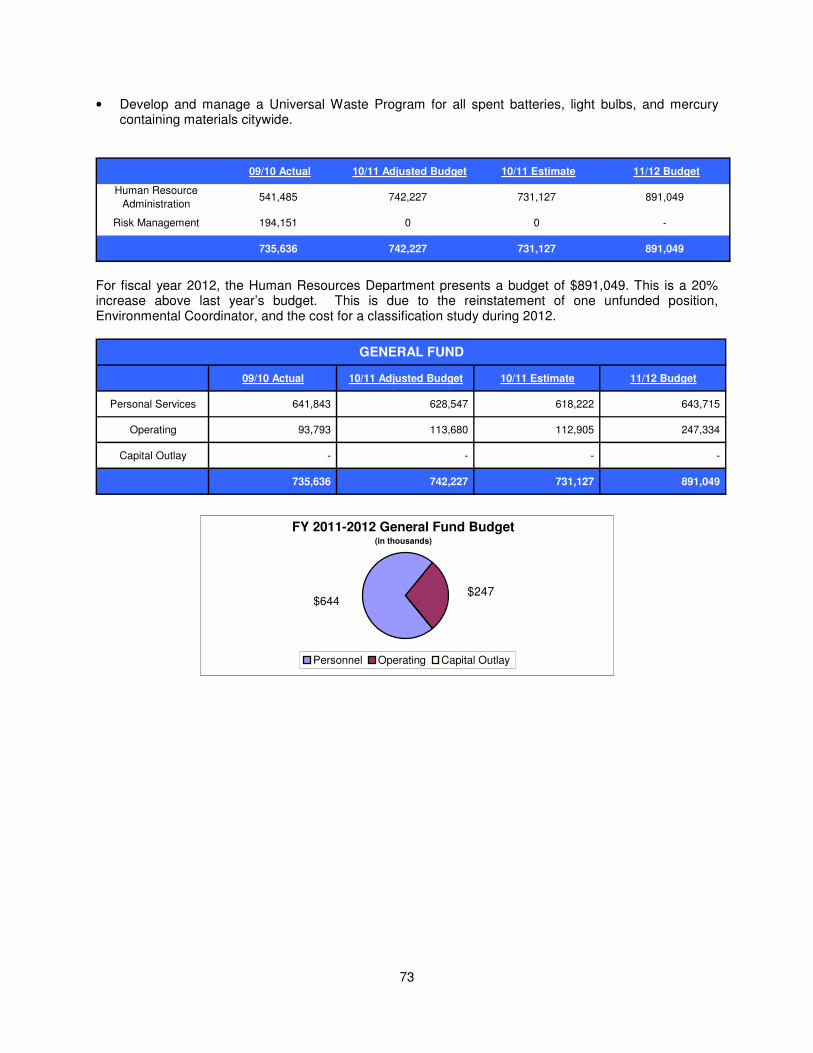
73
• Develop and manage a Universal Waste Program for all spent batteries, light bulbs, and mercury containing materials citywide.
09/10 Actual 10/11 Adjusted Budget 10/11 Estimate 11/12 Budget
Human Resource
Administration541,485 742,227 731,127 891,049
Risk Management 194,151 0 0 -
735,636 742,227 731,127 891,049
For fiscal year 2012, the Human Resources Department presents a budget of $891,049. This is a 20% increase above last year’s budget. This is due to the reinstatement of one unfunded position, Environmental Coordinator, and the cost for a classification study during 2012.
09/10 Actual 10/11 Adjusted Budget 10/11 Estimate 11/12 Budget
Personal Services 641,843 628,547 618,222 643,715
Operating 93,793 113,680 112,905 247,334
Capital Outlay - - - -
735,636 742,227 731,127 891,049
GENERAL FUND
FY 2011-2012 General Fund Budget(in thousands)
$247 $644
Personnel Operating Capital Outlay

74
Community Development
The Community Development Department is committed to
enriching the quality of the natural and built environment for
existing and future residents, in partnership with the community,
through proper planning and development practices. The
Department strives for responsible, responsive and creative
solutions to meet the current needs of customers and the City,
while planning for future generations.
The Department of Community Development (DCD) focuses on planning, building and development issues through the actions of its Community Planning Division and Building Safety Division. The Department continues to met the challenge of the changing economy by doing more with less. The Department handles the projected $1,157,500 in revenues and manages the $2,701,516 in annual operating expenses. DCD interacts with the public in all department activities. The staff is trained to work with homeowners and developers alike, to assist each at the level that is required. The staff problem-solves issues that arise during the planning and development processes. DCD is proud of their extraordinary customer service, which anticipates customers’ needs and many times provides the solution before the customer requests it.
The Building Safety Division provides services needed to meet the needs of all the construction activity in the City. Staff meets with the public, reviews building plans, issues building permits, performs inspections of construction, and ensures Council adopted codes are enforced. This last year the Building Safety Division processed over 4539 total permits. Single-family home permits stayed even with last year, at 1752 units. A
total of 16,653 inspections were conducted. The Code Enforcement Specialists are a part of the Building Safety Division. They provide support and service for the Community Planning Division. During the past year, Code Enforcement has worked closely with the Yuma Police Department to resolve issues that require a multi-disciplined approach.
The Community Planning Division meets with customers, handles requests for rezoning and subdivisions, and addresses needed changes to the zoning or subdivision codes. Long Range Planning staff prepares updates to the General Plan, new or revised policies to guide the City's growth. Staff reviews all city business license applications and assists customers through weekly scheduled pre-development meetings. The planners provide staff support to the Planning and Zoning Commission, Design and Historic Review Commission and Hearing Officer. The current major work item for the entire Community Planning Division is the update of the 2002 General Plan. With fewer staff, all the planners are participating in the General Plan update work effort.
AUTHORIZED PERSONNEL
FY 10/11
FY 11/12
Administration 2 2
Building Safety 19 19
Community Planning 12 12
Total 33 33

75
2010-2011 ACCOMPLISHMENTS:
• Processed approximately 148 new planning and zoning cases including 18 rezones, 69 design review and historic district review applications, and 18 cases that were decided by the Hearing Officer. These numbers are a slight increase over 2009 and 2002 figures.
• Staff facilitated and attended 252 Pre-Development Meetings (PDM).
• Completed the reformat of the City Zoning Code.
• Completed work on the individual elements of the General Plan.
• Revised the draft Historic North End Corridor Plan.
• Issued 1213 building permits, 1658 plan reviews, 172 single-family homes constructed, with a total building valuation of $74M for calendar year 2010.
• Continued scanning Building Division plans and documentation for inclusion in the DM (Document Management) system. This system allows electronic storage of plans and files for easy searching electronically, and printable version of plans and files.
• Worked in conjunction with the owners of the Yuma Indoor Market Place to renovate the empty Mervyns store into Yuma’s only indoor swap meet.
• Worked in conjunction with Yuma County, YCAA and MCAS Yuma, successful on time completion of the “Green-Gate Cooler” project, from Annexation through construction in eight months.
• Abated a house for health hazard that was over-run by over 60 cats.
• Staff offered expedited 3-day permit processing for storm damage repairs from the August 26th storm.
• Provided informational handouts to customers for new federal EPA lead paint rules on residential renovations.
• Transitioned Fire Department fire sprinkler and fire alarm inspections for new construction to Community Development.
• Renewed an IGA with the State of Arizona to continue providing inspections for manufactured housing and factory built buildings.
• Assigned dedicated plan review and inspector staff for work in Palms RV for consistency in applying unique development standards for this subdivision.
• Provided assistance to the Fire Department by installing smoke detectors in 90 homes.
• Provided eight plan reviews for the City Of San Luis and five plan reviews for the City of Somerton.
• Scanned all PDM notes for storage in a central electronic file for ease of access to all employees, reducing the need to print copies for all city staff involved.
• Successfully completed: Arizona DES building; Big curve building containing the Asian Star Restaurant, Subway, and AT&T; two new doctor offices in the Tuscany Plaza; Goldsboro’s Bakery; Green Gate Fresh Cooler; complete renovation of the Hunter Steak House; True Leaf Cooler renovation/addition; two Wow electronics buildings; and six YRMC medical remodels/additions.
• Demolition completed for the abandoned, damaged Fuller house at 1828 W. 16th Place.
GOALS FOR 2011-2012:
• Implement new software system.
• Complete phase one Implementation Plan of EnerGov software system and transition to the GIS based software.
• Begin phase two implementation of the EnerGov software system to include Citizen and Developer Access portal, Integrated Voice Response (IVR) system and attaching property specific files to parcels electronically.
• Bring forward an update to the Business License code in conjunction with the new EnerGov software.
• Hold public hearings for the 2012 General Plan with the Planning and Zoning Commission and the City Council.
• Provide public outreach for the general public on the Fall 2012 election on the 2012 General Plan.

76
• Continue to work in partnership with Yuma County, and the cities of Somerton and San Luis, the Town of Wellton, MCAS and YPG on the Yuma Regional Development Plan.
• Adopt the Historic North End Corridor Plan; A Main Street Renewal Project.
• Initiate a Historic North End website in cooperation with AWC and University of Phoenix.
• Continue to be proactive with code enforcement and property maintenance issues.
• Work with the GSA to provide inspections for the construction of the new Federal court house.
09/10 Actual 10/11 Adjusted Budget 10/11 Estimate 11/12 Budget
Community
Development 256,543 503,275 519,014 515,338
Building Safety 1,277,720 1,260,596 1,249,682 1,219,209
Community Planning 931,759 939,245 854,268 966,969
2,466,022 2,703,116 2,622,964 2,701,516
Overall the department is asking for General Fund support of $2,697,516 which is relatively flat from last
year’s adjusted budget.
09/10 Actual 10/11 Adjusted Budget 10/11 Estimate 11/12 Budget
Personal Services 2,282,604 2,236,184 2,152,438 2,298,270
Operating 163,140 424,390 433,548 399,246
Capital Outlay - - - -
2,445,744 2,660,574 2,585,986 2,697,516
GENERAL FUND
09/10 Actual 10/11 Adjusted Budget 10/11 Estimate 11/12 Budget
Personal Services 14,672 41,262 35,798 4,000
Operating - 1,280 1,180 -
Capital Outlay - - - -
14,672 42,542 36,978 4,000
HUD CDBG ENTITLEMENT GRANT FUND
Grant monies are used to partially pay the salary of one building inspector.
FY 2011-2012 General Fund Budget(in thousands)
$2,298
$399
Personnel Operating Capital Outlay
77
Public Works
The Public Works Department is committed to providing safe, effective and environmentally sound public services including street maintenance and repairs, residential solid waste collection and fleet services.
We pledge continuous improvement through high performance, customer service, communication, training and working together for the needs and requirements of the citizens and visitors of Yuma, as well as our neighboring communities.
The Street Division maintains city streets. Street employees provide maintenance and repair of the transportation infrastructure. The City of Yuma’s paved roads consist of 310 centerline street miles. Street services include:
• Code Enforcement Compliance
• Right-Of-Way Maintenance
• Asphalt Maintenance
• Street Traffic Control
• Street Sweeping
• Concrete repairs for sidewalks, curbs & gutters The Solid Waste Division is responsible for solid waste pickup and serves approximately 20,500 residential customers and 560 commercial customers. This division is also responsible for the recycling and environmental programs such as the annual Neighborhood Clean Up campaign, Christmas Tree Recycling Program, and the Yuma Area Household Hazardous Waste.
The Fleet Services Division manages and provides preventive maintenance on a fleet of 799 vehicles and equipment. Also provided is technical, preventive maintenance, and fuel services to the Housing Authority of the City of Yuma. 2010-2011 ACCOMPLISHMENTS: Fleet Services
• Partnered with Streets Division to place a concrete slab in our tire service area and install a previously purchased twin post vehicle lift to increase the tire shop efficiency.
• Reorganized the tire storage area within the fleet parts warehouse to increase inventory control and tire storage.
• Responded to the reduction in funding for city services and made necessary adjustments to Fleet Services staff and budget.
AUTHORIZED PERSONNEL
FY 10/11
FY 11/12
Fleet Services 17 17
Solid Waste 13 13
Street Maintenance 46 46
Total 76 76

78
Street Maintenance
• Staff applied asphalt emulsion sealant to 38 lanes miles to residential roads.
• Staff applied slurry and chip sealant to 19.5 lane miles to collector roadways.
• Reduced our street sweeping operations from 5 to 4 routes.
• 650 streetlights outage were reported and repaired.
• Staff responded to two major storms in 2010.
• August wind storm generated 13,000 yards of green waste. Solid Waste
• 2010 Neighborhood Cleanup disposed of 630 tons of waste, 96 tons of green waste, recycled 58 refrigerators, 10 tons of metal and 2,595 tires.
• Over 1,440 cars utilized the Household Hazardous Waste Program in four events.
• Residents dropped off 692 Christmas trees to be recycled.
• Residents recycled a combined 1,032 tons at the 45th Avenue and 13
th Avenue drop off locations.
GOALS FOR 2011-2012: Fleet Services
• Continue to provide support services for all City departments and divisions with the reduced staffing levels.
• Continue to seek opportunities to find alternative revenue sources to help Fleet Services budget. Streets
• Focus on major roadway maintenance activities to ensure maximum pavement life.
• Establish a priority list in converting medians to Xeriscape landscaping.
• Work with our Strategic Communication Division to ensure the public is informed on street projects.
• Adjust our operations to equal that of our State shared revenue. Solid Waste
• Provide efficient and economical solid waste services.
• Continue applying GPS technology in solid waste routing.
• Search for grant opportunities to assist with implementing curbside recycling.
• Promote and increase usage of the City’s two recycling drop off sites.
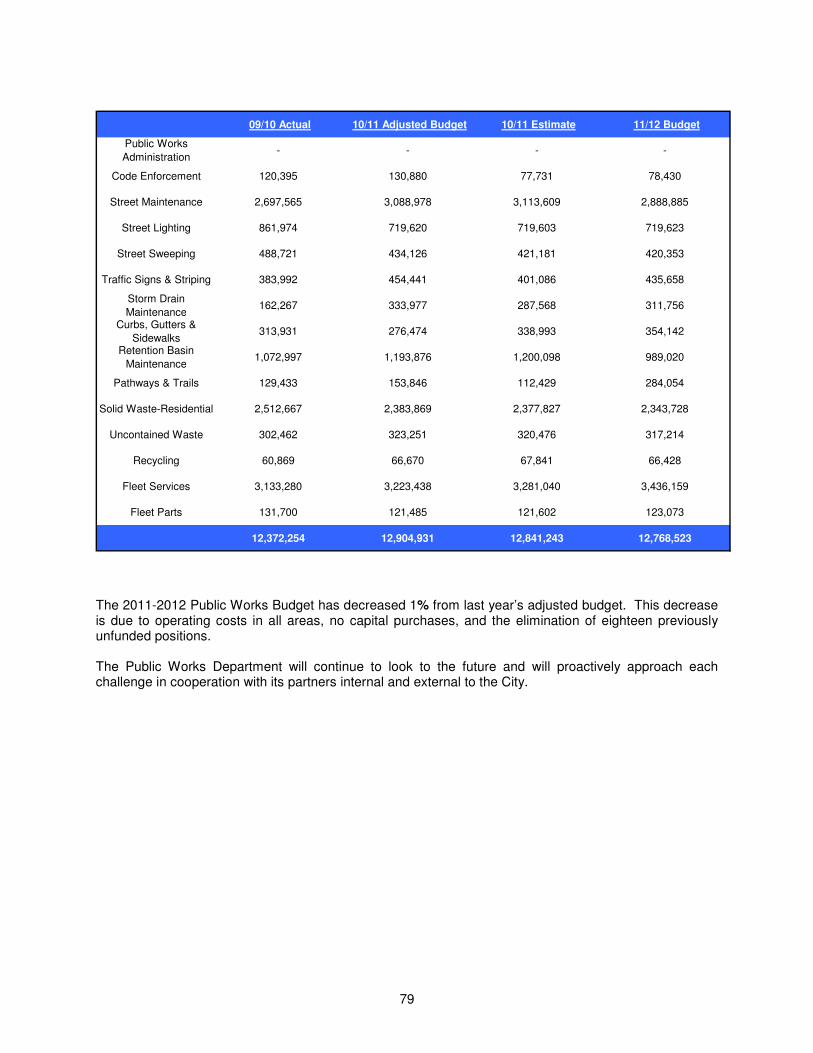
79
09/10 Actual 10/11 Adjusted Budget 10/11 Estimate 11/12 Budget
Public Works
Administration- - - -
Code Enforcement 120,395 130,880 77,731 78,430
Street Maintenance 2,697,565 3,088,978 3,113,609 2,888,885
Street Lighting 861,974 719,620 719,603 719,623
Street Sweeping 488,721 434,126 421,181 420,353
Traffic Signs & Striping 383,992 454,441 401,086 435,658
Storm Drain
Maintenance162,267 333,977 287,568 311,756
Curbs, Gutters &
Sidewalks313,931 276,474 338,993 354,142
Retention Basin
Maintenance1,072,997 1,193,876 1,200,098 989,020
Pathways & Trails 129,433 153,846 112,429 284,054
Solid Waste-Residential 2,512,667 2,383,869 2,377,827 2,343,728
Uncontained Waste 302,462 323,251 320,476 317,214
Recycling 60,869 66,670 67,841 66,428
Fleet Services 3,133,280 3,223,438 3,281,040 3,436,159
Fleet Parts 131,700 121,485 121,602 123,073
12,372,254 12,904,931 12,841,243 12,768,523
The 2011-2012 Public Works Budget has decreased 1% from last year’s adjusted budget. This decrease is due to operating costs in all areas, no capital purchases, and the elimination of eighteen previously unfunded positions. The Public Works Department will continue to look to the future and will proactively approach each challenge in cooperation with its partners internal and external to the City.

80
09/10 Actual 10/11 Adjusted Budget 10/11 Estimate 11/12 Budget
Personal Services 1,088,686 1,018,163 1,029,453 1,050,661
Operating 2,176,294 2,326,760 2,373,189 2,404,571
Capital Outlay - - - 104,000
3,264,980 3,344,923 3,402,642 3,559,232
EQUIPMENT MAINTENANCE FUND
FY 2011-2012 Equipment Maintenance Budget(in thousands)
$104 $1,050
$2,404
Personnel Operating Capital Outlay
09/10 Actual 10/11 Adjusted Budget 10/11 Estimate 11/12 Budget
Personal Services 2,172,281 2,231,590 2,184,733 2,225,690
Operating 3,735,520 4,302,396 4,276,909 3,250,626
Capital Outlay - - - -
5,907,801 6,533,986 6,461,642 5,476,316
HIGHWAY USER REVENUE FUND (HURF)
FY 2011-2012 HURF Budget(in thousands)
$2,226
$3,251
Personnel Operating Capital Outlay

81
09/10 Actual 10/11 Adjusted Budget 10/11 Estimate 11/12 Budget
Personal Services 743,706 784,824 777,318 797,155
Operating 2,132,293 1,988,966 1,988,826 1,930,215
Capital Outlay - - - -
2,875,999 2,773,790 2,766,144 2,727,370
SOLID WASTE FUND
FY 2011-2012 Solid Waste Fund Budget( in tho usands)
$1,930
$797
Personnel Operating Capital Outlay
09/10 Actual 10/11 Adjusted Budget 10/11 Estimate 11/12 Budget
Personal Services 99,443 97,653 59,486 106,445
Operating 224,032 154,579 151,329 899,160
Debt Service - - - -
Capital Outlay - - - -
323,474 252,232 210,815 1,005,605
CITY ROAD TAX FUND
FY 2011-2012 City Road Tax Fund Budget(in thousands)
$899
$106
Personnel Operating Capital Outlay

82
Utilities Department
Our goal, and highest priority, is to ensure the delivery of a reliable drinking water supply of the highest quality, and the most efficient environmentally sound reclamation of Yuma's wastewater. The Utilities Department is divided into two divisions: Treatment and Systems. The Treatment Division includes water and wastewater treatment, industrial discharge pretreatment, cross-connection control and laboratory services. The Systems Division includes water distribution, wastewater collection, and systems customer service. Consistent with its goal, the Utilities Department provides excellent customer service through trained and knowledgeable employees who possess a sense of duty to our customers. The Utilities Department has 136 authorized positions, of which more than half possess an Arizona Department of Environmental Quality issued license for the highly specialized work they perform on a daily basis. These employees are highly skilled, motivated and take great pride in their abilities to provide services at a level that consistently exceeds State and Federal requirements.
Functions The Treatment Division manages the City's drinking water production and wastewater treatment. This division also ensures compliance with EPA's Clean Water Act, Safe Dinking Water Act, and biosolids regulations via Industrial Pretreatment, Cross Connection Control and the Environmental Laboratory. The Water Treatment Section uses Colorado River water and water from wells to produce the continuous supply of drinking water necessary to meet the needs of Yuma's residents, businesses, and industries. Drinking water treatment occurs at two locations: The Main Street Water Treatment Facility and the Agua Viva Water Treatment Facility.
Producing drinking water for the Yuma area since 1891, the Main Street Water Treatment Facility is thought to be one of the first water plants west of the Mississippi River to filter its water. This facility uses
AUTHORIZED PERSONNEL
FY 10/11
FY 11/12
Administration 5 7
Water 73 73
Wastewater 49 49
Total 127 129
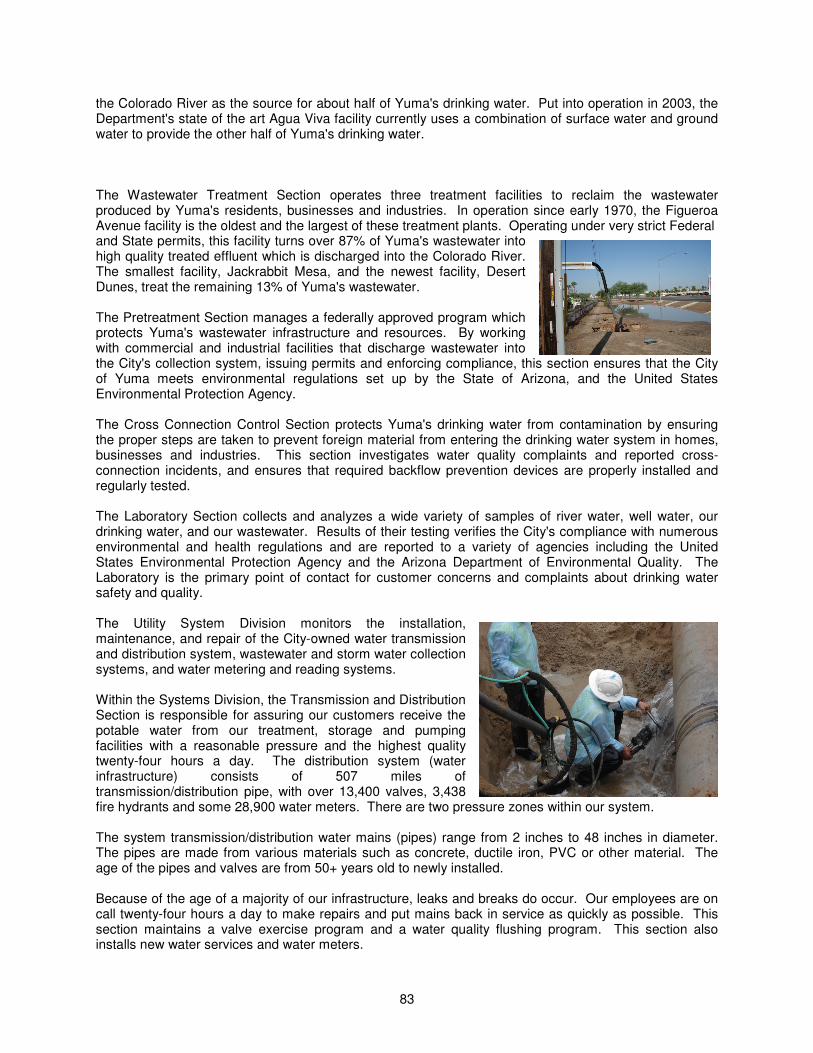
83
the Colorado River as the source for about half of Yuma's drinking water. Put into operation in 2003, the Department's state of the art Agua Viva facility currently uses a combination of surface water and ground water to provide the other half of Yuma's drinking water. The Wastewater Treatment Section operates three treatment facilities to reclaim the wastewater produced by Yuma's residents, businesses and industries. In operation since early 1970, the Figueroa Avenue facility is the oldest and the largest of these treatment plants. Operating under very strict Federal and State permits, this facility turns over 87% of Yuma's wastewater into high quality treated effluent which is discharged into the Colorado River. The smallest facility, Jackrabbit Mesa, and the newest facility, Desert Dunes, treat the remaining 13% of Yuma's wastewater. The Pretreatment Section manages a federally approved program which protects Yuma's wastewater infrastructure and resources. By working with commercial and industrial facilities that discharge wastewater into the City's collection system, issuing permits and enforcing compliance, this section ensures that the City of Yuma meets environmental regulations set up by the State of Arizona, and the United States Environmental Protection Agency. The Cross Connection Control Section protects Yuma's drinking water from contamination by ensuring the proper steps are taken to prevent foreign material from entering the drinking water system in homes, businesses and industries. This section investigates water quality complaints and reported cross-connection incidents, and ensures that required backflow prevention devices are properly installed and regularly tested. The Laboratory Section collects and analyzes a wide variety of samples of river water, well water, our drinking water, and our wastewater. Results of their testing verifies the City's compliance with numerous environmental and health regulations and are reported to a variety of agencies including the United States Environmental Protection Agency and the Arizona Department of Environmental Quality. The Laboratory is the primary point of contact for customer concerns and complaints about drinking water safety and quality. The Utility System Division monitors the installation, maintenance, and repair of the City-owned water transmission and distribution system, wastewater and storm water collection systems, and water metering and reading systems. Within the Systems Division, the Transmission and Distribution Section is responsible for assuring our customers receive the potable water from our treatment, storage and pumping facilities with a reasonable pressure and the highest quality twenty-four hours a day. The distribution system (water infrastructure) consists of 507 miles of transmission/distribution pipe, with over 13,400 valves, 3,438 fire hydrants and some 28,900 water meters. There are two pressure zones within our system. The system transmission/distribution water mains (pipes) range from 2 inches to 48 inches in diameter. The pipes are made from various materials such as concrete, ductile iron, PVC or other material. The age of the pipes and valves are from 50+ years old to newly installed. Because of the age of a majority of our infrastructure, leaks and breaks do occur. Our employees are on call twenty-four hours a day to make repairs and put mains back in service as quickly as possible. This section maintains a valve exercise program and a water quality flushing program. This section also installs new water services and water meters.

84
The Wastewater Collection System Section is responsible for assuring the wastewater collection system is properly maintained and free flowing twenty-four hours a day. The wastewater collection infrastructure consists of 347 miles of sanitary sewer collection lines and force mains with over 5,000 sanitary sewer manholes. The wastewater collection system lines range from 6 inches to 42 inches in diameter. This section is responsible for cleaning and inspecting (utilizing specialized equipment) the wastewater collection lines and all sanitary sewer manholes. This year they inspected via closed circuit TV (CCTV) over 75 miles of sanitary sewer mains, as well as 8,607' of newly installed storm sewer lines. This section is also responsible for all utilities Blue Stake requests and to ensure they are completed in a timely manner. In addition, this section also assists the transmission/distribution section with emergency water leaks. Customer complaints of stoppages, odors and vermin are also resolved promptly.
The Customer Service Section is responsible for all aspects of metering, water and sewer system connections and permits, and utility billing support. This section is comprised of three groups; Field Customer Service, Meter Services and Utility Rates Services. The Field Customer Service group takes care of all water service connects and disconnects (scheduled, emergency, and non-pays), high bill complaints, on-site customer assistance, new customer sign-ups, and thefts of service.
The Meter Services group handles meter readings, all Automated Meter Reading (AMR) applications, manual meter reading, construction roving meter reading, backflow device installations and testing for roving meters, meter repairs, meter tests and utility service history reviews are all duties of the Meter Services group. The Utility Rates Services group is your one place for information and cost estimates which will be needed to obtain water meters, sewer connections, utility rates and permits for residential or commercial projects. The Utilities Administration Section provides professional clerical support for the Public Works and Utilities Departments. 2010-2011 ACCOMPLISHMENTS
• Coordinated major construction jobs with contractors and inspectors.
• Installation of a new 30" water transmission main on 40th Street from 6E to 3E. Also, coordinated the sewer main extension on 6E and 32nd Street. Have been very much involved with the B&C Colonia Sewer Collection System Project which is still ongoing. Coordinated with ADOT personnel the installation of a storm drain system on 2-1/2E and 32nd Street - Installation/replacement of new water services, water mains and fire hydrants on the Casa Mañana Project, the installation of a new sewer forced main (8th Street and Raven Project).

85
• The Utilities Systems personnel participated in various City of Yuma teams and committees like the AEG Group, Utilities Coordinating Committee, Emergency Response Plan Committee, UTCC, 208 Plan, Sanitary Sewer Overflow Plan (SSO), Citywide Safety Committee and Utility Regulations Revision Team.
• Utilities personnel training participation: Fork Lift Training, AZ LTAP Basic Work Zone Traffic Control Flagger Training, Microsoft Excel I and II training, Microsoft Word I and II training, Sanitary Sewer Overflow training and bi-weekly safety meetings.
• Utilities Systems personnel responded to 1,535 after-hours call-outs.
• Replaced, repaired, maintained a total of 2,755 fire hydrants.
• Retrofitted 2,669 meters to Automated Meter Reading (AMR).
• Meter Services has consolidated enough routes into AMR to be able to commit to read all routes monthly, whether through AMR or manually reading.
• Responded to 910 customer complaints such as sewer stoppages, odor, vermin and utility locates.
• Collected $750,000 in deferred water/sewer fees.
• Prepared 168 water/sewer estimates that collected 4.0 million dollars in fees
• Our Utility Rates Technician was selected for the Public Works Service Employee of the Quarter Award. This employee was also nominated for the City of Yuma Administration's Employee of the Quarter and managed to complete the COY S.O.U.L. Leadership Series.
• Water Outreach organize/planned with other entities the Water Festival for over 500 4th graders.
• Processed 3,028 water, wastewater, industrial waste and biosolid samples for compliance and process control purposes.
• Responded to 110 water quality inquiries.
• Meter reads throughout the year, approximately 172,740.
• Water service disconnects for non-payment were 5,268.
• Repaired 153 water mains ranging from 2" in diameter to 24".
• Exercised 1,804 valves and replaced 47 inoperable valves.
• Completed local limits for the Desert Dunes facility.
• Based on our excellent water quality, ADEQ reduced monitoring requirements for radiological chemicals for both the Main Street and Agua Viva Water Treatment Facilities.
• Using the hydraulic model we developed and launched the UDF Program out in the field while utilizing existing personnel. Eight subdivisions have been flushed in this manner.
• Started the Distribution Process Control Sampling to further measure water quality and to determine frequency needed/effectiveness of flushing. We are currently measuring chlorine residual, turbidity and pH.
• 42 Utility Systems employees are ADEQ Certified Operators possessing 81 licenses over four different areas of operations, up to four levels of expertise.
GOALS FOR 2011-2012
• Explore and install alternative energy (solar) at Agua Viva and Desert Dunes Treatment Facilities to reduce electrical costs.
• Explore and recommend alternative methods for biosolids disposal.
• Explore and recommend alternative treatment technology at the Figueroa Water Pollution Control Facility.
• Explore alternative technology to utilize methane gas generated at the Figueroa plant to reduce dependence on outside energy sources and reduce permitting requirements.
• Continue water and wastewater systems modeling.
• Continue efforts to meet the requirements of the Capacity Management, Operations and Maintenance (C-MOM) program.
• Continue improvements of Systems and Treatment Operations.
• Maintain the same high level of quality service the citizens of Yuma and our other customers have come to expect in this time of economic crisis and budget cutting.
Did You Know? 7.78 billion gallons of drinking water were produced in 2010 and 2.9 billion gallons of wastewater were treated.

86
• Continue implementing the Unidirectional Flushing Program to ensure high water quality throughout the system.
• Install auto flushing devices on some of the Distribution System's dead ends.
• GPS Water and Sewer Systems
• Launch water service monthly billing.
• Incorporate THMM testing.
• Combine the Valve Exercising Program with the Unidirectional Flushing Program.
• Continue to compile data to support the estimating of water usage and sewer discharge.
• Increase the amount of sewer line footage cleaned as well as CCTV productivity.
• Meet the demands of growth, identify systems deficiencies, and provide recommendations for sizing and placement of City owned facilities through the integrated water and wastewater master plan.
• Continue update of the Department's Facilities Plan.
• Maintain the Department's public outreach efforts.
09/10 Actual 10/11 Adjusted Budget 10/11 Estimate 11/12 Budget
Utilities Administration - - - -
Water Administration 13,788,678 14,204,426 14,160,108 13,795,794
Main Street Water
Treatment Plant3,141,561 4,476,469 4,415,374 4,372,673
Transmission and
Distribution1,439,868 1,420,409 1,474,927 1,481,612
Water Customer
Service1,286,979 1,293,806 1,290,379 1,312,191
Water Transfer 34,109 40,263 45,397 40,809
Agua Viva Water
Treatment Plant1,965,075 2,696,701 2,715,118 2,805,707
Water Lab 248,709 284,105 281,567 285,326
Wastewater
Administration6,616,788 6,718,482 6,698,600 6,263,021
Figueroa Wstwtr
Treatment Facility4,213,446 4,652,367 4,685,195 4,836,982
Wastewater Collection
System919,042 967,125 953,284 1,038,689
Pretreatment 353,879 413,383 403,249 425,413
Desert Dunes Wstwtr
Treatment Facility1,388,213 1,429,433 1,451,732 1,593,170
Wastewater Lab 182,019 298,244 296,427 303,391
35,578,367 38,895,213 38,871,357 38,554,778
The fiscal year 2012 Utility Budget has decreased 1% from the previous year. Decreases in operating accounts, as well as a decrease in interdepartmental cost allocations, have contributed to this decrease.
The Utilities Department will continue to look to the future and will proactively approach each challenge in cooperation with its partners, internal and external, to the City.

87
09/10 Actual 10/11 Adjusted Budget 10/11 Estimate 11/12 Budget
Personal Services 405,599 372,797 369,218 380,313
Operating (405,600) (372,797) (369,218) (380,313)
Capital Outlay - - - -
(0) - - -
GENERAL FUND
09/10 Actual 10/11 Adjusted Budget 10/11 Estimate 11/12 Budget
Personal Services 3,940,989 4,170,627 4,175,712 4,390,577
Operating 6,127,329 8,446,336 8,400,503 7,875,069
Debt Service 10,663,187 10,655,242 10,656,484 10,660,132
Capital Outlay 35,391 - 800 10,340
20,766,896 23,272,205 23,233,499 22,936,118
WATER FUND
FY 2011-2012 Water Fund Budget(in thousands)
$7,875
$4,391
$10,660
$10
Personnel Operating Debt Service Capital Outlay
09/10 Actual 10/11 Adjusted Budget 10/11 Estimate 11/12 Budget
Personal Services 13,654 15,138 14,490 14,059
Operating 20,455 25,125 30,907 26,750
Debt Service - - - -
Capital Outlay - - - -
34,109 40,263 45,397 40,809
WATER TRANSFER FUND

88
09/10 Actual 10/11 Adjusted Budget 10/11 Estimate 11/12 Budget
Personal Services - - - -
Operating - - - -
Debt Service 1,103,975 1,103,711 1,103,974 1,117,185
Capital Outlay - - - -
1,103,975 1,103,711 1,103,974 1,117,185
WATER CAPACITY FUND
09/10 Actual 10/11 Adjusted Budget 10/11 Estimate 11/12 Budget
Personal Services - - - -
Operating - - - -
Debt Service - - - -
Capital Outlay - - - -
- - - -
WATER SYSTEM DEVELOPMENT FUND
09/10 Actual 10/11 Adjusted Budget 10/11 Estimate 11/12 Budget
Personal Services 2,683,757 2,864,892 2,924,350 3,031,534
Operating 5,655,696 6,273,468 6,217,118 5,984,852
Debt Service 2,348,870 2,355,618 2,355,963 2,356,078
Capital Outlay - - 6,000 103,146
10,688,322 11,493,978 11,503,431 11,475,610
WASTEWATER FUND
FY 2011-2012 Wastewater Fund Budget( in tho usands)
$5,984
$3,031
$2,356
$103
Personnel Operating Debt Service Capital Outlay

89
09/10 Actual 10/11 Adjusted Budget 10/11 Estimate 11/12 Budget
Personal Services - - - -
Operating - - - -
Debt Service 2,978,527 2,978,488 2,978,488 2,978,488
Capital Outlay - - - -
2,978,527 2,978,488 2,978,488 2,978,488
WASTEWATER CAPACITY FUND
09/10 Actual 10/11 Adjusted Budget 10/11 Estimate 11/12 Budget
Personal Services - - - -
Operating - - - -
Debt Service 6,537 6,568 6,568 6,568
Capital Outlay - - - -
6,537 6,568 6,568 6,568
WASTEWATER SANITARY SEWER INTERCEPTOR FUND

90
City Engineering Department
The City Engineering Department is committed to administer, monitor and coordinate a comprehensive 10-year Capital Improvement Program that incorporates adopted Council goals and policies, City infrastructure requirements and the needs of the general public. City Engineering provides inspection of privately-sponsored public works construction projects such as subdivisions, and monitors the execution of encroachment permits as well as coordination of traffic control maintenance. City Engineering is also responsible for the implementation/collection of and coordination of City Council’s adopted Development Fee. The City Engineering Department (the “Department”) participates in the development and designs and administers the Capital Improvement Program and provides coordination with private development, in order to meet environmental, design, funding and public safety requirements. The Department will continue to provide these services, which primarily consist of Capital Improvement Program Administration, Development Engineering, Traffic Engineering and Traffic Signals operation and maintenance, through the Public Works Services group.
Functions The City Engineering Department provides the following services:
• Support for the Capital Improvement Program through Plan and Specification preparation, utility company coordination, processing of permit documentation and as-built plan preparation and archiving.
• Provide support for the Capital Improvement Program and development community with project management and coordination.
• Update water/sanitary sewer/storm sewer atlases with newly-constructed facility information.
• Upgrade of Standard Specifications and Standard Details for construction.
• Development, tracking and maintenance of water and sewer extension payback agreements.
• Maintain and expand State Plane coordinate system within City limits.
• Maintain and expand a network of City benchmarks to Federal standards within City limits.
• Provide CADD support for engineering activities and to other City departments.
• Monitor and inspect activities within City right-of-way to include review and issuance of encroachment permits.
• Provide inspection services to private development for street construction.
AUTHORIZED PERSONNEL
FY 10/11
FY 11/12
Engineering 24 22
Development Engineering
4 4
Street Signals 5 6
Total 33 32
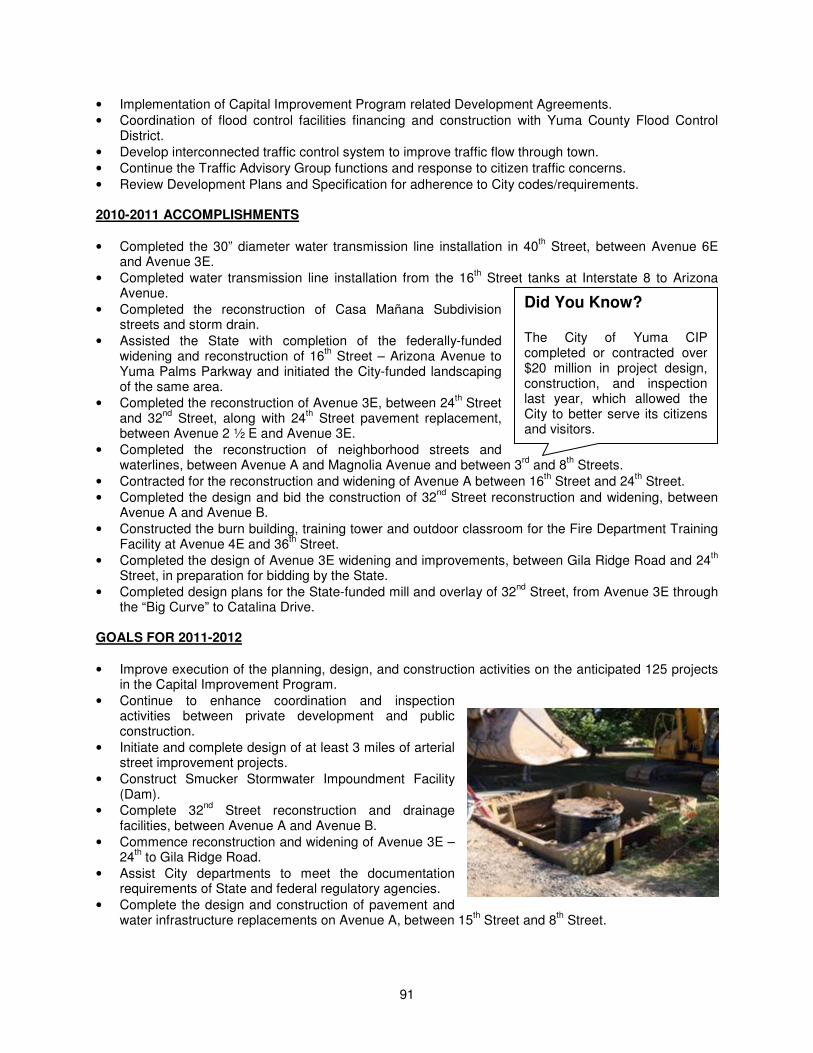
91
• Implementation of Capital Improvement Program related Development Agreements.
• Coordination of flood control facilities financing and construction with Yuma County Flood Control District.
• Develop interconnected traffic control system to improve traffic flow through town.
• Continue the Traffic Advisory Group functions and response to citizen traffic concerns.
• Review Development Plans and Specification for adherence to City codes/requirements. 2010-2011 ACCOMPLISHMENTS
• Completed the 30” diameter water transmission line installation in 40th Street, between Avenue 6E
and Avenue 3E.
• Completed water transmission line installation from the 16th Street tanks at Interstate 8 to Arizona
Avenue.
• Completed the reconstruction of Casa Mañana Subdivision streets and storm drain.
• Assisted the State with completion of the federally-funded widening and reconstruction of 16
th Street – Arizona Avenue to
Yuma Palms Parkway and initiated the City-funded landscaping of the same area.
• Completed the reconstruction of Avenue 3E, between 24th Street
and 32nd
Street, along with 24th Street pavement replacement,
between Avenue 2 ½ E and Avenue 3E.
• Completed the reconstruction of neighborhood streets and waterlines, between Avenue A and Magnolia Avenue and between 3
rd and 8
th Streets.
• Contracted for the reconstruction and widening of Avenue A between 16th Street and 24
th Street.
• Completed the design and bid the construction of 32nd
Street reconstruction and widening, between Avenue A and Avenue B.
• Constructed the burn building, training tower and outdoor classroom for the Fire Department Training Facility at Avenue 4E and 36
th Street.
• Completed the design of Avenue 3E widening and improvements, between Gila Ridge Road and 24th
Street, in preparation for bidding by the State.
• Completed design plans for the State-funded mill and overlay of 32nd
Street, from Avenue 3E through the “Big Curve” to Catalina Drive.
GOALS FOR 2011-2012
• Improve execution of the planning, design, and construction activities on the anticipated 125 projects in the Capital Improvement Program.
• Continue to enhance coordination and inspection activities between private development and public construction.
• Initiate and complete design of at least 3 miles of arterial street improvement projects.
• Construct Smucker Stormwater Impoundment Facility (Dam).
• Complete 32nd
Street reconstruction and drainage facilities, between Avenue A and Avenue B.
• Commence reconstruction and widening of Avenue 3E – 24
th to Gila Ridge Road.
• Assist City departments to meet the documentation requirements of State and federal regulatory agencies.
• Complete the design and construction of pavement and water infrastructure replacements on Avenue A, between 15
th Street and 8
th Street.
Did You Know? The City of Yuma CIP completed or contracted over $20 million in project design, construction, and inspection last year, which allowed the City to better serve its citizens and visitors.

92
• Complete the design and construction pavement and waterline replacements along 8th Avenue,
between 32nd
Street and 24th Street.
09/10 Actual 10/11 Adjusted Budget 10/11 Estimate 11/12 Budget
Engineering - 1,166,772 1,185,872 1,258,381
Development
Engineering404,166 374,755 393,532 395,309
Traffic Signals 599,630 725,641 714,008 739,412
2,124,632 2,267,168 2,293,412 2,393,102
The 2011-2012 City Engineering Department Budget has increased 5% from the previous year. The primary contributing factor is the increase in benefit expenses.
09/10 Actual 10/11 Adjusted Budget 10/11 Estimate 11/12 Budget
Personal Services 396,744 367,309 380,499 385,803
Operating 7,421 7,446 13,033 9,506
Capital Outlay - - - -
404,166 374,755 393,532 395,309
GENERAL FUND
FY 2011-2012 General Fund Budget(in thousands)
$9
$385
Personnel Operating Capital Outlay

93
09/10 Actual 10/11 Adjusted Budget 10/11 Estimate 11/12 Budget
Personal Services 327,032 353,427 341,237 362,327
Operating 257,000 238,214 238,771 243,085
Capital Outlay 15,599 134,000 134,000 134,000
599,630 725,641 714,008 739,412
HIGHWAY USER REVENUE FUND (HURF)
FY 2011-2012 Highway Users Revenue Fund Budget(in thousands)
$134 $362
$243
Personnel Operating Capital Outlay
09/10 Actual 10/11 Adjusted Budget 10/11 Estimate 11/12 Budget
Personal Services 560,319 556,183 601,771 683,908
Operating 560,517 610,589 584,101 574,473
Capital Outlay - - - -
1,120,836 1,166,772 1,185,872 1,258,381
CITY ROAD TAX FUND
FY 2011-2012 City Road Tax Fund Budget(in thousands)
$684 $574
Personnel Operating Capital Outlay

94
Parks & Recreation Department
The Parks and Recreation Department provides opportunities for learning and life experiences that enhance the physical, social, cultural, and environmental well being of our community. We serve a diverse cross-section of citizens and visitors through the provision of programs, services, and facilities that encourage the development of positive, lasting value systems, and self-esteem. The Parks and Recreation Department consists of seven areas that serve the public: the Administrative Division, Arts and Culture Division, Desert Hills and Arroyo Dunes Golf Shops and Restaurant, Urban Forestry, Parks and Golf Course Maintenance Divisions, Recreation Division, and the Yuma Civic Center. The Administrative Division oversees the various administrative functions that keep our Department running smoothly. The Customer service team offers clerical support to staff and customer service in the form of registration for programs and ramada rentals, functioning as a center of information for Parks and Recreational activities in the community. With the addition of the Parks and Recreation Website and online registration and ticket purchasing capabilities, customers now have information at their fingertips and registration and ticketing is made easier and more convenient.
The Arts and Culture Division sustains and supports local arts by providing distinct opportunities for community participation and artistic growth. The Yuma Art Center continues its role as a catalyst for artistic growth in our community. We seek to increase involvement in the arts for artists and participants through our diverse cultural programming targeting a broad audience. Support is extended to arts groups and artists by creating a climate conducive for local artistic development through the priority offering of the facility for non-profit arts use at rates far below the national average. Arts advocacy continues to be a high priority for the Commission and its supporting Public Art Committee. These groups help to gather input on public desires and to be the public face for arts support. In
working to continually expand our outreach, we are building community awareness through local media partnerships in both English and Spanish. Our vision is for all members of our community to live creative lives by being a part of the arts in Yuma. The role of the Desert Hills Golf Course Shop, Restaurant, and Arroyo Dunes is to provide a memorable life experience in a relaxing, environmentally friendly atmosphere. We offer excellent facilities and opportunities to the community and visitors, which encourage socializing, competing, exercising and learning. The Urban Forestry Division focuses on maintaining the City’s urban forest. There are over 8,000 trees in the City’s inventory. The team also provides outreach and education to citizens regarding proper tree care. The Tree and Landscape Expo, which occurs each year in October provides valuable information to
AUTHORIZED PERSONNEL
FY 10/11
FY 11/12
Administration 10 10
Parks Maintenance 64 61
Parks Development 2 2
Recreation 9 7
Arts and Culture 6 6
Civic Center 11 8
Facility Maintenance - 12
Golf Course Maintenance 9 6
Golf Courses 5 7
Total 116 119

95
the community regarding Yuma’s vegetation and plant/tree selection. Yuma has earned the Tree City, USA designation for the last four years.
There are six divisions that make up Parks and Golf Course Maintenance. The Maintenance Division oversees the operation and provides daily maintenance of over 600 acres, which consists of: 33 parks, ten athletic complexes, two golf courses, grounds surrounding 19 City buildings, one gymnasium, four outdoor basketball courts, nine tennis courts, one dog park, and five sand volleyball courts. The Downtown Mall Maintenance District consists of: Giss Parkway north to First Street, and Madison Avenue east to Gila. Staff maintains this entire area, including the right-of-way and planters along the streets, parking lots and shade structures within these boundaries. The Division also provides support services to events that happen in the downtown area. The Baseball Complex Division is responsible for all grounds maintenance at the Ray Kroc Baseball Complex and provides support services for the special events held at the facility. The Desert Hills Golf Course Maintenance Division provides grounds maintenance services to the
155-acre championship style golf course. Arroyo Dunes Golf Course Maintenance Division provides grounds maintenance services to the 40-acre, par-three style golf course. The Graffiti abatement program cleaned up 3,056 cases of graffiti throughout the City of Yuma in 2010. Response time on graffiti abatement is usually within 24 hours of being reported. The Recreation Division consists of eight areas: Recreation General, Senior Adult programming, Adult programming, Youth programming, Outdoor Recreation, Aquatics, Teens, and Adaptive Recreation. Recreation General oversees the management of the entire division. Senior Adult programming, held primarily at the North End Community Center and also at various other locations seasonally, serves adults 50 years of age and over, providing activities including arts and crafts, educational classes, fitness, dance, pool shooting, competitive games, and Senior Games, which boasts over 40 activities that older adults may compete in during the winter. Adult programming includes volleyball, basketball, in-line hockey, year-round softball leagues, tournaments, instructional programs, fitness, and arts and crafts programs. Youth programming offers a variety of sports, recreational, and instructional opportunities for youth of all ages. In addition to the City-run activities, a strong component of the Parks and Recreation Department is the partnership between Co-Sponsored youth sports organizations and the City. The Recreation Division also offers outdoor recreational opportunities such as canoeing, kayaking, and outdoor education programs for all ages. Aquatics programs include the programming of four municipal pools. Fitness and swim programs are offered, as well as Learn-to-Swim lessons during the summer. Adaptive Recreation programming for special needs participants is offered year-round and over the past year, an emphasis has been placed on providing additional activities such as Day Camps and music based programs that participants may register for. The Yuma Readiness and Community Center, a joint-use facility between the Arizona National Guard and the City of Yuma, is a full service recreational facility and serves as an additional site for the community to get information, register for programs or rent park ramadas.
The Yuma Civic Center and Ray Kroc Baseball Complex serves the Yuma region by providing flexible facilities for diverse events. As the only venue capable of hosting the large-scale public and private

96
events where we gather and create community, the complex excels as Yuma’s premiere event venue. The facility has touched the lives of countless citizens and visitors and is the venue of choice for many of Yuma’s most popular events: Midnight at the Oasis, the Home and Garden Show, Prayer Breakfast, Rotary Kammann Sausage Fry, The Desert Lily Quilt Show, American Cancer Society Relay for Life, and Heart of Yuma. The Civic Center is also an important venue for cultural and business exchange, internationally as well as locally, by hosting events such as the annual Mexicali Expo, Canadian Snowbird Association, Sons of Norway Scandinavian Festival and Earthbound Farm Orientation. The Civic Center division provides event coordination, expertise, support, implementation, equipment, refreshments, and facility maintenance for the
large variety of events that occur at the Center and Baseball Complex each year.
2010-2011 ACCOMPLISHMENTS: Arts and Culture Division
• Working collaboratively with Yuma Private Industry Council, the team completed another exceptional outdoor mural project. The mural, some twenty-five feet tall, went up at the Yuma Civic Center’s main entrance and features a wonderfully creative and colorful glimpse of Yuma’s history.
• The third annual ARTbeat 3 brought 2,000 participants to Historic Downtown Yuma this past April and featured over 75 local, regional, and international artists displaying works in this outdoor show.
• With donated funds, the Public Art Committee contributed to the City’s Permanent Art Collection by purchasing original artworks, selected by an appointed panel, from local Yuma artists at ARTbeat 3.
• The Art Center had 44,595 persons visit last year. The numbers of participants in education programs increased from 1,713 to 3,019.
• Continued our partnership with schools, educators, and other local arts entities to program outstanding multi-grade student art exhibits on the second floor of the Art Center.
• Awarded a $2,500 grant from Arizona Public Service for a project to enhance the fencing surrounding the Solar Garden at the West Wetlands Park. The team collaborated with students from the Arizona Western College Welding Program to produce decorative steel panels that will be affixed to the Solar Garden fence.
• The Art Center again presented the outstanding Tribute of the Muses Award, Children’s Festival of the Arts, Roxaboxen Festival, and hosted the nationally recognized 32
nd Annual Yuma Symposium.
• The Art Center “Infinite Imagination Youth Theatre,” comprised of kids ages 9 to 16, was awarded a $1,900 grant to present the first local performance of “High School Musical, Jr.”
• Renewed our partnership with The Sun newspaper – this local collaboration supports programming efforts at the Yuma Art Center and features marketing and promotion of joint projects.
• Received a grant award from Arizona Commission on the Arts for 2009/2010.
• Presented the growing Summer Six Pac - the annual summer series introduced four plays at the Historic Yuma Theatre and featured
everything from Shakespeare to an outstanding children’s production of “Anne of Green Gables.”
• Featured a number of remarkable exhibits and performances including the award-winning Paul Espinosa “Border Film Festival,” the “Save the Prison” exhibit, and outstanding exhibits of local artists.

97
Desert Hills/Arroyo Dunes Golf Courses and Restaurant
• Held nine junior golf clinics with 490 youth participants.
• Reworked breakfast and lunch menu by reducing the menu items, making it more inventory friendly.
• Started a new specialty night at the Restaurant “All You Can Eat Riblets” on Tuesday nights.
• Worked with the National Golf Foundation to find ways to become more profitable.
• Held many new specialty events including beer and wine tasting with approximately 350 attending.
• Developed plan to replace aging greens and make fairway improvements in incremental steps on Desert Hills Golf Course.
• Reduced full-time staffing levels to bring down maintenance costs.
• In the process of removing and replacing perimeter irrigation along Avenue A and 40
th Street with smaller and more cost-effective sprinklers.
Urban Forestry Division
• Removed several large, deceased trees from Joe Henry Memorial Park.
• Managed Burn pits at West Wetlands and Desert Hills Golf Course.
• Worked with Prison Fire Crews to clear undergrowth in the mitigation area.
• Cleaned and trimmed the Quartermaster Depot trees.
• Held Fourth Annual Tree and Landscape Expo.
• Trimmed and removed trees from August 2010 storm.
Parks and Golf Maintenance Divisions
• Painted Pickle Ball courts at the Carver Park Tennis/Basketball courts.
• Installed 5 hole Disc Golf Course at Sunrise Optimist Park .
• Repaired vandalized doors, boarded up windows, and repaired vandalized chain link fencing at the Del Sol Hotel.
• Replaced plywood and carpet at Joe Henry Athletic field’s crow’s-nest.
• Relocated the “Half Pipe” Skate Feature at Kennedy Skate Park
• Abated 3,056 of case of graffiti in 2010.
• Installed new desert landscaping at Desert Sun tennis courts.
• Added the new Saguaro Neighborhood Park to our parks inventory.
• Provided set-up and tear-down to several events on Main Street.
• Installed two soft toss hitting areas next to batting cages 1 and 2 at the Baseball Complex.
• Installed tile mosaic mural as part of the Joe Henry restroom and roadway improvements.
• Provided exceptional support and maintenance for all major tournaments: Memorial Day 16” (Adult Softball), National 16” Softball Tournament, Halloween Ball Bash (Adult Softball), Inline Hockey (Youth), Lightning Tournament (Youth Soccer), AWC Shootout (Adult Softball), ASA Girls Fast Pitch (Youth Softball) as well as regular league play and playoffs for Recreation programs.
• Upgraded irrigation system for the Bark Park by installing new irrigation controller and sprinklers.
• Assisted community organization to construct a basketball court at Winsor Park.
• Produced the 18th Annual Sports Turf Show with over 200 attendees from all over Arizona and
California.
• Assisted the Yuma Crossing Heritage Area in cleaning up and removing two large 120’ Eucalyptus trees at The Quartermaster Depot State Park.
• Installed 40’ of new curbing and asphalt around field #4 valve and blowout area at Ray Kroc Baseball Complex.
• Replaced three barbecue grills at Carver Park and one at Netwest Park.
• Installed a new batting cage safety net to cages 1 and 2.
• Installed eight new tennis courts and one practice court at the Desert Sun complex.
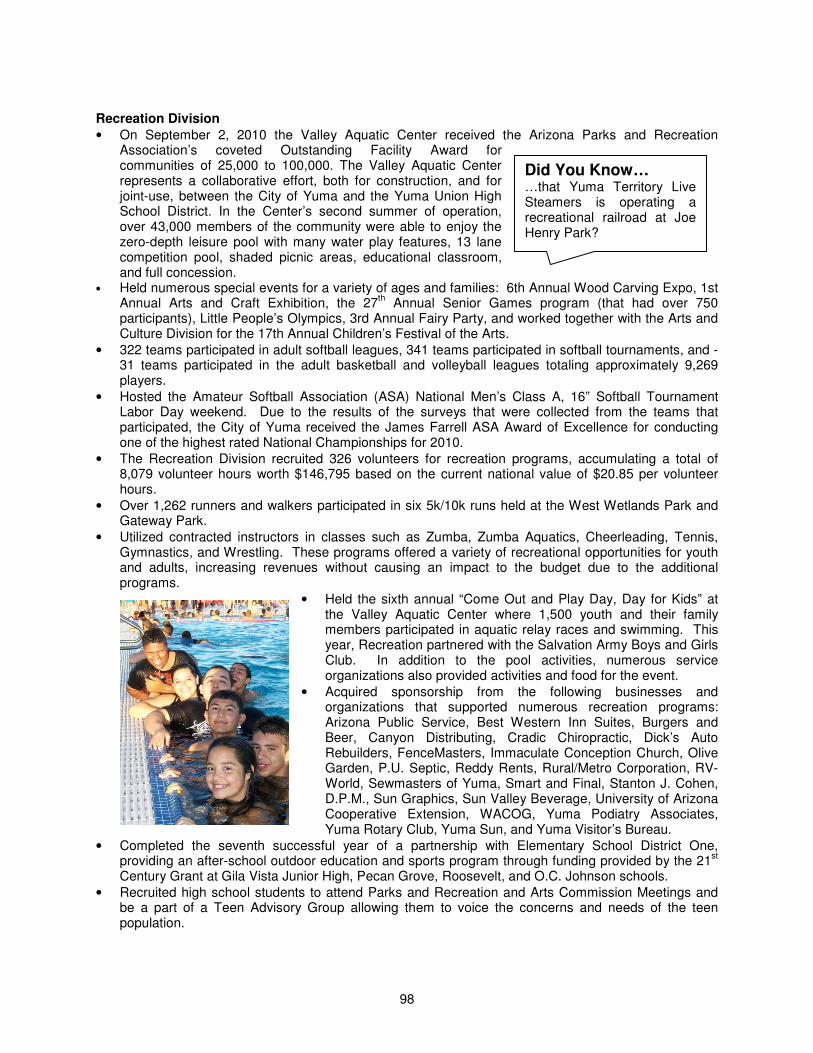
98
Did You Know… …that Yuma Territory Live Steamers is operating a recreational railroad at Joe Henry Park?
Recreation Division
• On September 2, 2010 the Valley Aquatic Center received the Arizona Parks and Recreation Association’s coveted Outstanding Facility Award for communities of 25,000 to 100,000. The Valley Aquatic Center represents a collaborative effort, both for construction, and for joint-use, between the City of Yuma and the Yuma Union High School District. In the Center’s second summer of operation, over 43,000 members of the community were able to enjoy the zero-depth leisure pool with many water play features, 13 lane competition pool, shaded picnic areas, educational classroom, and full concession.
• Held numerous special events for a variety of ages and families: 6th Annual Wood Carving Expo, 1st Annual Arts and Craft Exhibition, the 27
th Annual Senior Games program (that had over 750
participants), Little People’s Olympics, 3rd Annual Fairy Party, and worked together with the Arts and Culture Division for the 17th Annual Children’s Festival of the Arts.
• 322 teams participated in adult softball leagues, 341 teams participated in softball tournaments, and -31 teams participated in the adult basketball and volleyball leagues totaling approximately 9,269 players.
• Hosted the Amateur Softball Association (ASA) National Men’s Class A, 16” Softball Tournament Labor Day weekend. Due to the results of the surveys that were collected from the teams that participated, the City of Yuma received the James Farrell ASA Award of Excellence for conducting one of the highest rated National Championships for 2010.
• The Recreation Division recruited 326 volunteers for recreation programs, accumulating a total of 8,079 volunteer hours worth $146,795 based on the current national value of $20.85 per volunteer hours.
• Over 1,262 runners and walkers participated in six 5k/10k runs held at the West Wetlands Park and Gateway Park.
• Utilized contracted instructors in classes such as Zumba, Zumba Aquatics, Cheerleading, Tennis, Gymnastics, and Wrestling. These programs offered a variety of recreational opportunities for youth and adults, increasing revenues without causing an impact to the budget due to the additional programs.
• Held the sixth annual “Come Out and Play Day, Day for Kids” at the Valley Aquatic Center where 1,500 youth and their family members participated in aquatic relay races and swimming. This year, Recreation partnered with the Salvation Army Boys and Girls Club. In addition to the pool activities, numerous service organizations also provided activities and food for the event.
• Acquired sponsorship from the following businesses and organizations that supported numerous recreation programs: Arizona Public Service, Best Western Inn Suites, Burgers and Beer, Canyon Distributing, Cradic Chiropractic, Dick’s Auto Rebuilders, FenceMasters, Immaculate Conception Church, Olive Garden, P.U. Septic, Reddy Rents, Rural/Metro Corporation, RV-World, Sewmasters of Yuma, Smart and Final, Stanton J. Cohen, D.P.M., Sun Graphics, Sun Valley Beverage, University of Arizona Cooperative Extension, WACOG, Yuma Podiatry Associates, Yuma Rotary Club, Yuma Sun, and Yuma Visitor’s Bureau.
• Completed the seventh successful year of a partnership with Elementary School District One, providing an after-school outdoor education and sports program through funding provided by the 21
st
Century Grant at Gila Vista Junior High, Pecan Grove, Roosevelt, and O.C. Johnson schools.
• Recruited high school students to attend Parks and Recreation and Arts Commission Meetings and be a part of a Teen Advisory Group allowing them to voice the concerns and needs of the teen population.

99
Did You Know… …that Ozark Jubilee sold more tickets this year than since the event started coming to the Yuma Civic Center in 1999?
• Parks and Recreation took the Imagination Playground in a Box to ten different elementary schools in the community allowing hundreds of children to use their imaginations.
• Built a new partnership with “Circle of Friends,” which assists Recreation in bringing weekly physical activities, at no cost, to adults with special needs.
• Held the 2010 Arbor Day Celebration at Gateway Park in collaboration with numerous elementary schools in the community.
• Implemented “Grow Smart Summer Camp”, a six week program for children 7 to 12 years of age that were diagnosed as overweight or obese and referred by a healthcare professional. The camp gained support from George Washington University School of Public Health and plans are in development for the continuation of the camp for the 2011 summer season.
• Began a partnership with the youth Catch & Go Flag Football League after a successful first season of play. This non-profit youth sports league is a member of the NFL Flag Football Program and had partnered with the Arizona Cardinals in bringing the program to Yuma.
• Began to provide Yuma Sun with a bi-weekly column for the Sports Section of the newspaper. Written by Oscar Chavez, Recreation Program Supervisor. Each story highlights programs, services, participants, or facilities that Parks and Recreation offers to the community.
• Planned and organized the first “Spruce Up Your Park Day” at Sunrise Optimist Park. Volunteers worked on various projects to improve the park, which included the installation of five disc golf holes. In addition, with the support of the Sunrise Optimist Club, and donations from Home Depot and BLT Construction, a 30’ by 30’ hopscotch and foursquare concrete play area was built by the Cibola High School Construction Crew that totaled over 90 high school students.
Yuma Civic Center
• The Yuma Civic Center hosted 1,248 events in 2010. There were 141,063 visitors to the Civic Center during the calendar year.
• Partnered with the Yuma Private Industry Council to provide a summer culinary program that created opportunities for students to learn about a food catering operation. They served 1,000 lunch meals to the Arizona Summer League.
• Staff provided the historical context to the Yuma Private Industry Council’s summer mural team through a vintage postcard collection and historical references. Provided equipment and oversight to the mural project completed at the Yuma Civic Center.
• Slurry sealed the parking lot, extending the life of the surface by approximately two years.
• Enhanced the beverage service with the update of the service stations inside the Yuma Room.
• Successfully hosted the first “Grow Smart Summer Camp” in the facility and continued to host summer recreation programs for youth: basketball, soccer, and dodgeball.
• Re-organized the exhibit of the permanent art collection in the facility and upgraded the signage.
• Presented the successful “Fourth Annual New Year’s Eve Family Fun Night.”
• Successfully hosted two summer swap meets inside the facility with great participation.
• Implemented Facebook and Twitter use.
• Installed permanent flag pole.
Parks and Recreation Department 2010-2011 Awards and Support
• Received Arizona Parks and Recreation Association’s Outstanding Facility Award for the Valley Aquatic Center.
• Achieved the Playful City USA designation for the fourth year in a row.
• Received the Tree City USA designation for the fourth year in a row.

100
Did You Know… …that tennis lessons are available at the new Desert Sun Tennis Courts?
• Awarded the National Men’s 16” Softball Tournament for the Amateur Softball Association Class “A” Division.
• Received grant/cash program funding support from the following organizations: APS, Arizona Blue Cross Blue Shield, Arizona Commission on the Arts, Burgers and Beer, Caballeros de Yuma, Canyon Distributing, Home Depot, Immaculate Conception Church, Kool Smiles, Pecan Grove Garden Club, Union Pacific, Yuma Community Foundation, Yuma Regional Medical Center Foundation, and Yuma Rotary.
• Accepted in-kind/supply support from the following organizations: Arizona Game and Fish, Best Western Inn Suites, Fencemasters, Home Depot, Hoops Project, Olive Garden, P.U. Septic, WACOG, Yuma Sun, and Yuma Private Industry Council.
• Working with 11 Youth Co-Sponsor Organizations: Babe Ruth Baseball, Pop Warner Football, NFL Catch & Go Football, Special Olympics, Yuma Boys Baseball League, Yuma Futbol, Yuma Girls Fast Pitch & T-Ball, Yuma Heat Swim Team, Yuma In-Line Hockey, Yuma Little League, and Yuma Youth Soccer Association.
GOALS FOR 2011-2012: Arts and Culture Division
• Plan to install and complete the artistic enhancements to the fencing at the West Wetlands Park Arizona Public Service Solar Garden through our collaboration with the Arizona Western College Welding Program.
• Continue and expand the Summer Six Pac performance series, adding another play produced by local performers to the schedule. This means the Art Center will field a diverse, five play, locally produced series from June through August - the longest summer schedule to date.
• Collaborating with local home-school parent groups the Art Center will develop a schedule of art education classes presented at the Art Center. These classes add depth and arts learning to the home school curriculum while offering another revenue source for the Art Center.
• The recently acquired 270 S. Main building has been sub-leased to a local arts group and generates income for Art Center. This year we will continue to work to maintain and upgrade the facility to be utilized for additional arts education or special event programming.
• To seek additional cost savings associated with arts programming and to maximize revenue opportunities either through increased facility rentals or staff programming endeavors.
• Deepen our collaborative projects with other arts, culture, and history organizations to promote Historic Downtown Yuma and to provide increased opportunities for volunteers.
Desert Hills/Arroyo Dunes Golf Course Shops and Putter Inn Restaurant
• Implement phase one of infrastructure improvements to the course.
• Installation of a security camera system in the golf shop and restaurant.
• Continue to explore new ideas to attract and increase frequency of play in the summer.
• Install new irrigation pump at Arroyo Dunes.
• Remove out of place oleanders on the course and replace with properly placed trees.
Urban Forestry Division
• Start on tree inventory program and log into the GIS system.
• Work with the Prison Forestry crew to provide annual maintenance and clearing of the lower bench at the West Wetlands.
• Continue to remove hazardous trees from Joe Henry Park.

101
Parks and Golf Course Maintenance Divisions
• Plant new shade trees near bleachers on fields 2 and 3 at Ray Kroc Baseball Complex.
• Continue replacing aging barbecue grills in parks.
• Add new restroom and concession stand at newly re-built tennis courts.
• Promote and coordinate 19th Annual Sports Turf Show.
• Replace worn fence at athletic fields on outfields as funding permits.
• Install court alternative to failing exhibition court at Desert Sun Tennis Facility.
• Replant lower bench Cottonwood trees that burned in fire.
• Continue to work with City Project Managers for fill dirt to raise the grade in cleared area of Riverside Park.
• Rebuild crow’s nests at the Joe Henry Athletic Complex as funding permits.
• Start on design of Smucker Park restroom
• Move forward on the design process for the Yuma Valley Area Park.
• Finish desert landscaping behind Desert Sun Tennis Courts.
• Start the first phase of the build out of West Wetlands Park.
• Remove and relocate the Remote Control Car track at Kiwanis Park.
• Xeriscape grass islands on Ave A between 32nd
St and 36th St.
• Repaint all outfield score boards and light poles. Recreation Division
• Continue to increase volunteer opportunities in all recreation programs.
• Host 2012 Hooters ASA Men’s Western Class D National Tournament. • Host a tournament for Senior Softball players in January of 2012. • Create a Youth Sports Parent Orientation Program which will provide information concerning City of
Yuma youth sports programs. The orientation program will be administered to all parents of youth that participate in City of Yuma youth sports programs and we will offer the program to all Co-sponsor organizations as well. Information concerning program rules and standards, parent conduct at practices and games, league responsibilities, and general goals and objectives of the program will be presented and discussed.
• Develop and provide recreational opportunities for younger children, age 3 to 13 years old, that have special needs, by working with Circle of Friends, Special Olympics, and local elementary schools.
• Provide overnight canoe and kayaks trips, allowing members of the community, and groups such as Boy Scouts and Girl Scouts, the opportunity to experience the outdoor environment.
• Revise summer aquatic schedule at Kennedy Pool, allowing for additional swim lessons to be offered for youth.
Yuma Civic Center
• Provide flexible, committed, and congenial service to all patrons in our facility. Service is paramount.
• Present a successful Taco Festival and Wedding Expo to launch as annual events.
• Continue to identify collaborators/supporters to assist in the presentation of special events.
• Identify a programming replacement for the Travelogue Series.
• Increase marketing and social media efforts to attract more business and participation.
• Work with Facilities Maintenance to get APS Solar Project installed and operational.
• Purchase additional pipe and drape to better serve expo style shows.
• Perform cost analysis on Food and Beverage operation to inform future policies.
• Increase follow-up and feedback mechanism for current customers.

102
09/10 Actual 10/11 Adjusted Budget 10/11 Estimate 11/12 Budget
Parks & Recreation
Administration1,616,255 1,424,224 1,453,410 1,346,896
Parks Maintenance 4,234,248 4,526,608 4,425,702 4,483,619
Facilities Maintenance - - - 1,575,078
Urban Forestry 142,390 170,338 167,518 172,795
Recreation General 602,552 573,477 553,340 572,124
Senior Adult Activities 158,139 191,498 184,246 122,883
Adult Activities 210,968 214,396 200,927 216,864
Youth Activities 202,267 260,699 190,272 257,009
Aquatics 1,017,519 1,076,137 1,006,891 492,438
Yuma Readiness
Center120,823 141,571 139,659 125,744
Yuma Arts Center 744,858 767,314 795,778 606,340
Heritage Events - - - 81,000
Civic Center 1,083,795 1,181,239 1,170,595 999,479
Baseball Complex 543,137 559,495 550,088 513,359
Downtown Mall 216,960 231,024 221,498 224,393
Maintenance ADGC 231,631 211,059 191,883 238,159
Pro Shop Concessions
ADGC36,041 39,402 34,627 39,824
Maintenance DHGC 874,779 973,042 852,440 965,360
Restaurant
Concessions541,990 546,867 516,322 583,359
Pro Shop Concessions
DHGC468,697 421,632 448,099 503,991
13,047,051 13,510,022 13,103,295 14,120,714
Changes to the 2011/2012 Budget: Belt Tightening With several years of declining City revenues, the Parks and Recreation Department has analyzed services, maintenance procedures, and collaborations. Budgetary reductions have occurred in every division over the past three fiscal cycles and further strategies are being implemented to make our operations leaner. We will continue overseeding grass only at riverfront parks and athletic facilities to reduce winter green grass dependence. We will be analyzing use of paspalum grass in some areas to totally eliminate overseeding of certain areas. The nursery operation at West Wetlands Park will be brought back to create more replacement vegetation. Social media and other marketing strategies will be utilized to inform the public, enhance collaborations, and enhance participation in existing programs to increase revenue. Personnel Expenditures We are utilizing more inmate labor in areas deemed appropriate. Parks and Golf Course Divisions have re-organized to create greater efficiency and absorb duties of positions that have been vacated. Department part-time hours have been reduced through volunteers, some independent instructors for programs, and elimination of services such as scorekeepers. Equipment We are not requesting any equipment this year.

103
Operation and Maintenance The Facility Maintenance team is being transferred to a separate division to create a clearer overall picture of City costs for City operated buildings, energy, and maintenance costs. We continue to evaluate park operations to reduce costs through locking facilities at night, installation of automatic timers on lighting systems, and reduction of watering schedules. Outreach and Promotion Social media and other marketing strategies will be utilized to inform the public, enhance collaborations, and enhance participation in existing programs to increase revenue. The twice yearly Activity Guide continues to be an effective tool to inform the public and garner support. Sponsorship opportunities will be explored with future guides to reduce the expense of printing and distributing. Outside Agency Agreements The Administration Division budget contains the funding for three Outside Agency agreements. The following agency agreements have been assigned to the department for monitoring: Catholic Community Services – Adult Day / Health Care Yuma Fine Arts Association Salvation Army Boys & Girls Club There are also three Outside Agencies that receive financial support through the two percent fund that Parks and Recreation provides services, collaboration, and support to: Yuma Crossing Park/Riverfront Development Yuma Visitors Bureau Heritage Festivals was previously supported as an outside agency. For 2012, a new program has been created within the department entitled Heritage Events. City staff will now coordinate these events. The Greatest Challenge Facing the Parks and Recreation Department in 2011/2012: The Capital Improvement Program as it relates to development of future Yuma Parks and Recreation facilities is a challenge due to limited staff resources for capital project management, phased nature of projects that involve other City Departments or other entities that are often delayed, and sharing of already tight funding sources. Athletic Fields are in short supply and the scheduling for Co-Sponsors, City Programs, and Special Events continues to be a challenge and creates negative service perceptions from our Co-Sponsor groups. Parks and Recreation believes that we have to focus on completing the five projects that were shared as part of the Hospitality Tax renewal: completion of West Wetlands Park, completion of Smucker Park, construction of a new Yuma Valley Area Park, construction of a new East Mesa Park, and providing athletic lighting for the joint use Arizona Western College Soccer Facility. Athletic Fields are a high priority and meeting the National Recreation and Park standards for a community our size is the objective.
09/10 Actual 10/11 Adjusted Budget 10/11 Estimate 11/12 Budget
Personal Services 5,327,686 4,596,892 4,363,273 4,894,809
Operating 2,676,665 2,695,009 2,682,181 2,742,693
Capital Outlay - - - -
8,004,350 7,291,901 7,045,454 7,637,502
GENERAL FUND
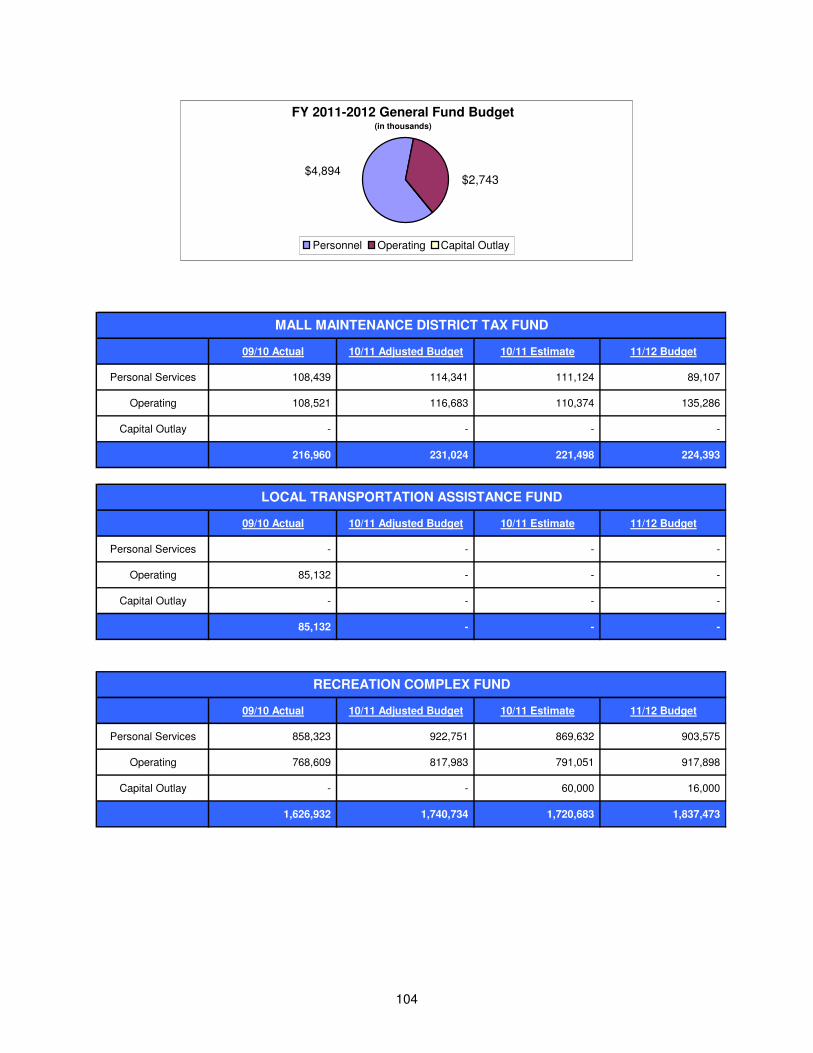
104
FY 2011-2012 General Fund Budget(in thousands)
$4,894 $2,743
Personnel Operating Capital Outlay
09/10 Actual 10/11 Adjusted Budget 10/11 Estimate 11/12 Budget
Personal Services 108,439 114,341 111,124 89,107
Operating 108,521 116,683 110,374 135,286
Capital Outlay - - - -
216,960 231,024 221,498 224,393
MALL MAINTENANCE DISTRICT TAX FUND
09/10 Actual 10/11 Adjusted Budget 10/11 Estimate 11/12 Budget
Personal Services - - - -
Operating 85,132 - - -
Capital Outlay - - - -
85,132 - - -
LOCAL TRANSPORTATION ASSISTANCE FUND
09/10 Actual 10/11 Adjusted Budget 10/11 Estimate 11/12 Budget
Personal Services 858,323 922,751 869,632 903,575
Operating 768,609 817,983 791,051 917,898
Capital Outlay - - 60,000 16,000
1,626,932 1,740,734 1,720,683 1,837,473
RECREATION COMPLEX FUND

105
FY 2011-2012 Recreation Complex Fund Budget(in thousands)
$16
$903
$918
Personnel Operating Capital Outlay
09/10 Actual 10/11 Adjusted Budget 10/11 Estimate 11/12 Budget
Personal Services - 488,237 514,762 551,757
Operating 915,000 1,180,955 1,181,290 1,148,028
Capital Outlay - - - -
915,000 1,669,192 1,696,052 1,699,785
TWO PERCENT TAX FUND
The Arts Center division was moved out of General Fund and into the Two Percent Tax Fund. Since Two Percent Tax collections is to fund Arts activities, it was deemed appropriate to move this division.
FY 2011-2012 Two Percent Tax Fund Budget(in thousands)
$551
$1,148
Personnel Operating Capital Outlay
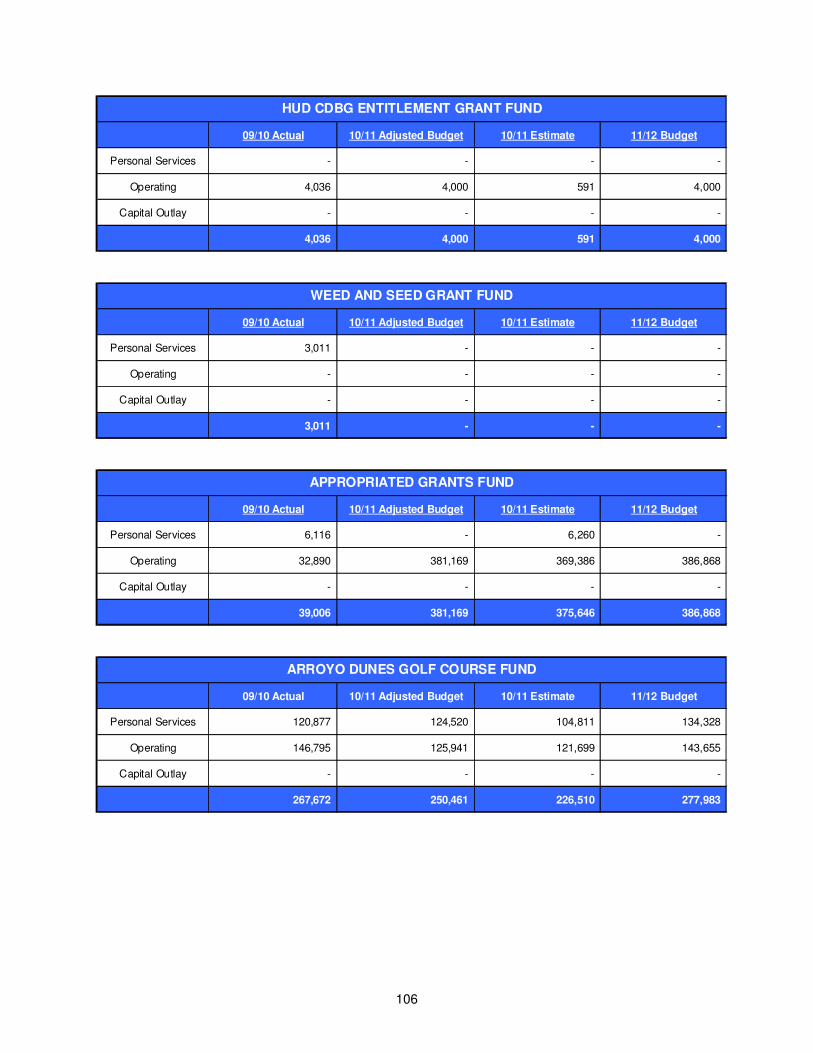
106
09/10 Actual 10/11 Adjusted Budget 10/11 Estimate 11/12 Budget
Personal Services - - - -
Operating 4,036 4,000 591 4,000
Capital Outlay - - - -
4,036 4,000 591 4,000
HUD CDBG ENTITLEMENT GRANT FUND
09/10 Actual 10/11 Adjusted Budget 10/11 Estimate 11/12 Budget
Personal Services 3,011 - - -
Operating - - - -
Capital Outlay - - - -
3,011 - - -
WEED AND SEED GRANT FUND
09/10 Actual 10/11 Adjusted Budget 10/11 Estimate 11/12 Budget
Personal Services 6,116 - 6,260 -
Operating 32,890 381,169 369,386 386,868
Capital Outlay - - - -
39,006 381,169 375,646 386,868
APPROPRIATED GRANTS FUND
09/10 Actual 10/11 Adjusted Budget 10/11 Estimate 11/12 Budget
Personal Services 120,877 124,520 104,811 134,328
Operating 146,795 125,941 121,699 143,655
Capital Outlay - - - -
267,672 250,461 226,510 277,983
ARROYO DUNES GOLF COURSE FUND

107
09/10 Actual 10/11 Adjusted Budget 10/11 Estimate 11/12 Budget
Personal Services 829,139 757,554 783,399 890,488
Operating 1,055,812 1,183,987 1,033,462 1,162,222
Capital Outlay - - - -
1,884,951 1,941,541 1,816,861 2,052,710
DESERT HILLS GOLF COURSE FUND
FY 2011-2012 Desert Hills Golf Fund Budget(in thousands)
$1,162
$-
Personnel Operating Capital Outlay
$890

108
Police
The mission of the Yuma Police Department is to enhance the quality of life in the City of Yuma by providing all people with responsive and professional police service with compassion and concern. To accomplish its mission, the Yuma Police Department will work in collaboration with the citizens of Yuma and within the framework of the United States Constitution to enforce the laws, preserve the peace, reduce fear, and provide for a safe environment. The Police Department’s Administration oversees the Field Services Division, Support Services Division, and Investigations Division. The Professional Standards and Accountability Unit reports directly to the Chief of Police. Administration is responsible for the overall management of the department. The Chief of Police along with a Deputy Chief of Police and three Captains provide the vision and leadership to achieve the goals and objectives of the Police Department. The Patrol Division is the largest and most visible division in the agency. Uniformed patrol personnel are responsible for the protection of life and property, response to 9-1-1 and other calls for service, and preliminary investigation of crimes. The Patrol Division also consists of specialized units including Traffic Unit which is staffed with traffic enforcement units and civilian accident investigators, a School Services Unit, a Gang Unit, a Public Safety Communications Center, and K-9 Officers.
AUTHORIZED PERSONNEL
FY 10/11
FY 11/12
Administration 9 9
Patrol 123 126
Investigations 43 44
Support Services 64 64
Total 239 243

109
The Support Services Division consists of a Records Unit which is responsible for receiving, entering, archiving, and retrieving police reports as well as collecting data for statistical purposes. A Training Unit, Hiring/Recruitment Unit, Public Affairs Unit, and Facilities Maintenance also comprise Support Services. The Investigations Division is responsible for the in-depth follow up investigations as well as preparing cases for court. The Investigations Division consists of a Crimes Against Persons Unit, Sex Crimes Unit, Property Crimes Unit, Narcotics Unit, Evidence Unit, an I.D. Crime Lab Unit, and Crime Analysis. 2010-2011 ACCOMPLISHMENTS:
GRANTS
• Rocky Mountain Information Network – $4,675. YPD requested funding for DNA testing to further our investigative efforts in solving a homicide case.
• High Intensity Drug Trafficking Area/City of Tucson – The City of Tucson had fiduciary duties for Federal funds that were to be awarded for overtime for officers assigned to the U.S. Marshals Fugitive Apprehension Task Force. YPD has one officer assigned to the Task Force and was awarded $5,000 to be used for overtime for that officer.
• Border Security Enhancement Program - The Governor’s Office of Economic Recovery authorized the utilization of funds from the American Recovery and Reinvestment Act of 2009 to fund the Border Security Enhancement Program. Funds are used to supplement law enforcement’s ability to combat criminal activity associated with or directly stemming from the international border. Specifically, the funds must be used for activities that address illegal drug trafficking, human smuggling, and illegal immigration. The Yuma Police Department requested and has been awarded $334,750 to be used for overtime, training, and the purchase of equipment.
• DUI Enforcement Grants – During 2010, YPD received two grants from the Arizona Governor’s Office of Highway Safety to enhance our efforts to combat impaired driving in the City of Yuma. Combined, the two grants provided over $72,000, the majority of which was used to purchase two fully-equipped 2010 Chevrolet Tahoe’s to be used as DUI and Aggressive Driving Enforcement Vehicles. The vehicles are equipped with digital mobile video systems and Doppler radar systems. They are being deployed to detect and apprehend impaired driving, aggressive driving, speeding, red light running, and seatbelt and child restraint device violations in an effort to reduce serious injury and fatal accidents.
• DUI Abatement Grant – Through the Arizona Criminal Justice Commission, the Oversight Council on Driving or Operating under the Influence Abatement awarded state funds in the amount of $15,162 to the Yuma Police Department for overtime. Funding was to assist local programs in enforcement, prosecutorial, and judicial activities related to preventing and abating driving or operating under the influence in motor vehicles.
• Operation Stonegarden – The Yuma Police Department continues its efforts to support the United States Border Patrol in enhancing border security through the interdiction of illegal activity. YPD has been the recipient of numerous and various grants through the Arizona Department of Homeland Security. In the summer of 2010, funds that had previously been awarded in Federal Fiscal Year 2008, but had not been expended, were reallocated. YPD received two grant awards as a result of reallocations: $10,560 was awarded for the purchase of equipment, including surveillance equipment and GPS units, and $197,500 was awarded for overtime and mileage. Additionally, YPD applied for and was recently notified that we have been awarded $447,390 in funding for overtime and mileage, and $483,510 for equipment. The agreement for overtime runs from October 1, 2010, through March 31, 2012, and the agreement for equipment runs from October 1, 2010, through December 31, 2011.
• COPS – In early October, the Yuma Police Department received notification that we were awarded a Department of Justice Community Oriented Policing Services (COPS) Hiring Program Grant in the amount of $987,180. The grant provides funding for five additional officers over a three year period. The grant will allow YPD to put five additional officers on the streets now, while allowing three years to prepare our budget to retain those positions.

110
SUPPORT SERVICES DIVISION Public Affairs Unit
• Hispanic Community Liaison/PIO – In April 2010, Chief Geier appointed Master Police Officer Cruz Vidal to the Public Affairs Unit as the liaison to our Hispanic community. Her duties include keeping lines of communication open with our Hispanic citizens through the use of local Spanish newspapers and news media, assisting with press releases in Spanish, and making presentations and taking part in various events that require a bilingual officer. She is also working on a future Citizens Academy for the Hispanic community.
• Citizens Police Academy - During March and April of 2010, the Yuma Police Department held the 13th Citizens Police Academy. Students attended classes at the Police Department every Tuesday evening for eight weeks. The academy consisted of classroom and “hands on” instruction. Topics covered included an overview of police functions from patrol and traffic laws, to criminal investigations. The Citizens Police Academy is designed for citizens of all backgrounds and occupations. It is part of a continuing program to develop citizen awareness and understanding of the role of law enforcement. Graduates are not police officers, but better-informed citizens. Sixteen attendees graduated on May 4, 2010.
• Crime Free Multi-Housing Program – On January 26th and 27th, YPD held a Crime Free Multi-Housing Training Seminar, the first phase in a three-phase certification process. The seminar was open to all owners, managers and staff of any Yuma area apartment community or multi-house rental property and was provided at no cost to the attendee; 13 were in attendance. Topics of discussion included: Crime Prevention through Environmental Design, applicant screening procedures, combating crime problems, warning signs of illegal activity, and actions to take if illegal activity is discovered. A second, identical event was held on September 1st, and 15 area property owners or managers attended.
• Splash Out Crime Night – In August 2010, YPD employees participated in Splash Out Crime Night, co-sponsored by the City of Yuma and 78-Crime Stoppers of Yuma. The event took place at the Valley Aquatics Center and over 1000 people attended. Chief Geier and Public Information Officer Sgt. Norred were among those that took turns in the dunk tank.
• GAIN Event – Getting Arizona Involved in Neighborhoods. The GAIN event is an annual event hosted by YPD. Local area law enforcement agencies along with fire and rescue agencies bring some of their equipment to show the public. Officers and rescue personnel are available to meet and talk with the public about a variety of topics. There are raffles and refreshments. This year’s event took place on October 9, 2010, at the Yuma Palms Mall. There were about 3,000 in attendance and the majority of the public safety entities were represented at the event, which was attended by Mayor Krieger and Chief Geier.
• Scary and Safe Trick or Treat at the Yuma Territorial Prison - The Yuma Police Department and the Yuma Crossing National Heritage Area hosted this event on October 31, 2010. Local, state, tribal and federal law enforcement agencies, along with local non-profit organizations and businesses, became temporary “cellmates” at the Prison and gave away “tricks or treats” to children 12 and under. Proceeds from the admission fee of $1 per person were shared by the Arizona Law Enforcement Torch Run for Special Olympics and Crossroads Mission.
• National Take Back Initiative – The Yuma Police Department participated with the Drug Enforcement Administration and other state and local law enforcement agencies in a “Take-Back” initiative that sought to prevent pill abuse and theft. On September 25, 2010, the Police Department collected potentially dangerous expired, unused, and unwanted prescription drugs for destruction at no charge to citizens. DEA later announced that over 6,200 pounds of prescription drugs were collected statewide. Locally, there were approximately 55 participants and numerous boxes were filled.
• Law Enforcement Torch Run for Special Olympics - The Yuma Police Department is a proud supporter of the Arizona Law Enforcement Torch Run for Special Olympics (LETR). The main mission of the Arizona LETR is to raise money and awareness in support of the 9,100 Special Olympians who train and compete year-round in Arizona. There is no cost to the athletes to participate in Special Olympics, and our contributions make it possible for the athletes and their families to receive the level of support that they do. All the money raised in Yuma County, stays in Yuma County, and YPD has been very active in fundraising for this event. The actual Torch Run occurs in April.
111
• Besides the special events mentioned above, the members of the Public Affairs Unit attend numerous Neighborhood Watch meetings, instruct car seat classes to our Spanish community members, and fulfill requests for speaking engagements, department tours, etc.
TRAINING UNIT
• The Training Unit, which was significantly revamped as part of the September 2009 reorganization, hit the ground running in 2010. One of their major accomplishments this year was the implementation of Block Training. The training must meet specific requirements set by AZPOST. Through block training, every officer completes 40 hours of training, including some proficiency training, and usually completes it in one week. Training modules include Excited Delirium, Search & Seizure Update, Taser Recertification, Defensive Tactics, Defensive Driving, Firearms, and Practical Scenarios.
HIRING/RECRUITMENT UNIT
• Currently, YPD employs 159 sworn officers and 82 civilian employees. The Hiring and Recruitment Unit has spent time looking at our testing requirements and processes and has made some changes where necessary, and implemented some of those changes in the many recruitments and selection processes we’ve undertaken this year. We are currently preparing to begin the hiring process for the five new officers we’ll be bringing on as a result of our COPS Hiring Program Grant.
VOLUNTEERS/RESERVES/EXPLORERS
• As of December 31st, YPD has the assistance of 19 VIP’s (Volunteers in Policing), 2 Reserve
Officers, and 13 Explorers. The total number of volunteer hours put in by these individuals was 1,827. T.A.G.S.
• In April 2010, the City of Yuma announced the formation of TAGS – The Anti-Graffiti Strategy program, sponsored by Mayor Krieger and Chief Geier. TAGS is a comprehensive approach to vandalism and graffiti that includes stepped-up enforcement, greater education and awareness through the City’s communications resources, and enhanced partnerships between City departments and with other government agencies, businesses, and community groups such as 78-CRIME and Neighborhood Watch programs. The program’s goals are to facilitate the overall reduction and fast-as-possible removal of graffiti within the city limits, the addition of removal and abatement resources for YPD and Parks and Recreation, an increase in enforcement, improvement in the way graffiti incidents and statistics are tracked, an increase in successful prosecution of offenders, and an increase in community awareness of graffiti issues.
Since its inception, more than a dozen “taggers” have been identified and several have been arrested and prosecuted. From January 1, 2010, to November 1, 2010, there have been 2,552 calls to the Graffiti Hotline. In May 2010, officers working through TAGS were able to locate and identify “SKREW,” a 16 year old living in an area in which many graffiti incidents occurred. He was responsible for approximately $5,000 in damage, and was subsequently committed to the Arizona Department of Juvenile Corrections for incarceration until his 18th birthday and ordered to pay restitution.
On November 11th, 2010, officers responded to a citizen report of graffiti in progress at 3rd Street and 24th Avenue. Officers located two 13 year old males in the immediate area. Both admitted to being members of ABK “Always Bombing Krew” and are responsible for damaging property belonging to Rancho Viejo and Salida Del Sol Schools in excess of $1000. Both were booked into the Yuma County Juvenile Justice Center for felony charges of Aggravated Criminal Damage. This case is still under investigation as there are several other locations in the city and county.
112
At the City Council meeting of August 18, 2010, Yuma City Council approved an amendment to Yuma City Code simplifying signage requirements for businesses that sell merchandise used as graffiti implements, and increasing the penalty for businesses not in compliance with the ordinance. YPD personnel have met and continue to meet with local businesses to educate them on the recent changes and provide them with the required signs.
Prescription Drug Collection & Destruction Program
• In January 2011, YPD began our community’s first 24-hours prescription drug collection program. A large metal collection box is in the foyer of the Yuma Police Department. The program is anonymous and free to the public. Items collected are incinerated.
Report It
• The Report It Program is a free personal property program offered to our community. This is an electronic alternative to making an inventory list of valuable items in your home and keeping the list in case you are a victim of a crime or disaster. The program was sponsored by Leads Online, which is a program YPD detectives use to assist in property crimes.
PATROL
• During 2010, Yuma Police Officers responded to 63,906 calls for service, documented 13,480 police reports, responded to 2,337 non-injury accidents, responded to 917 injury accidents, and responded to 4,859 alarm calls resulting in 30 police reports. In addition, 3,799 adults were been arrested, 1,248 juveniles were arrested and 7,614 traffic citations were issued. In 2010 the Public Safety Communications Center fielded a total of 182,066 calls have been received in the Public Safety Communications Center, and 46,096 9-1-1 calls have been received.
• DUI Checkpoints – On March 17, 2010, through funding with a grant from the Arizona Governor’s Office of Highway Safety, YPD conducted an impaired driving checkpoint. The checkpoint, the first in YPD history, affected the westbound lanes in the 700 block of East 24th Street. Officers stopped all westbound vehicles for brief contact with each driver to detect any signs of impairment and to provide an educational handout. The checkpoint began at 9:00 p.m. and ended at 11:30 p.m. Over 500 vehicles were contacted, and approximately ten were directed to the secondary area. Four arrests were made for aggravated DUI, possession of dangerous drugs, possession of marijuana and driving on a suspended license.
• A second impaired driving checkpoint was conducted on July 3, 2010, at the same location. The checkpoint began at 9:00 p.m. and concluded at 1:45 a.m. Approximately 700 vehicles were contacted, approximately ten were directed to the secondary area, and three arrests were made. The three arrests were for open alcohol containers in the passenger compartment and possession of drug paraphernalia.
• Summer Storm – on August 26, 2010, a severe storm hit the Yuma area, with strong winds, plenty of rain, and some hail. There were no reported injuries, however the north end of Yuma sustained significant damages, and there were multiple reports of power outages, downed power lines, downed trees, and flooding. A temporary shelter was established at the North End Community Center with the assistance of the City of Yuma Parks and Recreation Department and the American Red Cross. Residents displaced by structural damage, without power, or in need of temporary relief visited the shelter. At its peak, the shelter assisted approximately 100 residents. Restoration of power and clean up of major and dangerous debris took several days.
• National Public Safety Telecommunications Week – As part of National Public Safety Telecommunications Week, The Yuma Public Safety Communications Division hosted two full day training sessions and celebratory luncheons for all Yuma area public safety telecommunications professionals. All events took place at the Yuma Police Department.
• New K-9 Unit - On July 30, 2010, Chief Geier announced the creation and implementation of the Yuma Police Department’s first ever Patrol-based K-9 Unit. Joining Tina, the Department’s narcotics-based K-9, two new K-9’s, Grumphy and Troy, are trained in areas such as building/area searches, tracking, and apprehension of serious offenders in flight. They are also cross-trained in narcotics detection.

113
• GREAT - YPD announced in August that we will participate in the GREAT program, aiming to launch the program by the start of the second semester in January 2011. GREAT, or Gang Resistance Education and Training, is a nationwide program that provides a prepared curriculum local police officers take into the classrooms of elementary and middle schools to teach the students skills that will help them avoid destructive behavior. Two officers will be assigned to the School Services Unit beginning in January 2011 and will begin training for the GREAT program.
• Supported the COE program through local high schools.
• The Gang Unit investigated numerous gang-related incidents and has a total of 6 officers, a sergeant, and two USBP agents. One of these officers is assigned to the FBI Safe Streets Task Force and another is assigned to the US Marshal’s Office.
• Project Drive Safe! 2010 accounted for 751 staff hours that resulted in 2,771 citations.
• In 2010, YPD arrested 299 DUI drivers and issued over 7,500 traffic citations.
• K-9 Unit consisted with three K-9 teams, conducted 174 patrol canine deployments which resulted in 35 suspect arrests, conducted 410 narcotic detection searches which resulted in 1325 pounds of Marijuana, 138 grams of Methamphetamine, 3.2 grams of Heroin, 22 grams of Cocaine, and over $25,000 in currency seized.
• 3,971 cases were assigned to the Investigations Division.
• The Special Enforcement Team was activated on eight occasions for high risk incidents.
GOALS FOR 2011-2012:
• Begin construction/acquire a remote evidence/vehicle storage site.
• Continue to work towards Commission on Accreditation for Law Enforcement Agencies accreditation.
• Conduct two Citizen’s Police Academies and an Open House at YPD.
• Continue timely and professional response to calls for service.
• Continue active recruitment to fill authorized vacancies.
• Continue to rewrite and revise outdated policies.
• Continue public outreach to educate the community on personal safety and security matters.
• Continue to work with YRCS in expanding the radio system into a truly regional system.
• Continue to work with ITS in choosing a CAD/RMS system to replace the outdated system we currently use.
• Improve building security systems through upgrades or replacements.
• Obtain further funding through Stonegarden, Governor’s Office of Highway Safety, and the Arizona Criminal Justice Commission grants to further enhance efforts in the Yuma area.
• Continue with Project Drive Safe enforcement utilizing intelligence-based data to place greater emphasis on traffic safety.
• Increase traffic safety education and awareness through new technology and public presentations to enhance driver safety in the City of Yuma.
• Conduct a sobriety check point to raise awareness of impaired driving.
• Utilize technology to develop “intelligence driven deployment of police resources.”
• Implement additional computer forensics capabilities.
• Continue the strong emphasis on Community Oriented Policing and Problem Oriented Policing in Department philosophy.
• Continue with New World implementation.
• Implementation of the Corporal rank within YPD.
• Continue our efforts to reduce crime in Yuma.

114
09/10 Actual 10/11 Adjusted Budget 10/11 Estimate 11/12 Budget
Police Administration 1,713,717 2,311,074 2,324,251 1,619,591
Patrol-Field Services 11,211,798 11,490,103 11,300,986 12,571,779
Investigation-Field
Services4,163,328 3,974,965 3,990,533 4,091,300
911 Administration 21,499 12,577 32,950 31,355
Quality Assurance 1,348,152 1,446,722 1,543,898 1,212,387
Records &
Communication1,022,294 844,896 908,635 1,062,172
Public Safety
Communication Center1,875,217 1,840,161 1,856,501 1,891,476
Animal Control - - - 650,000
Facilities Maintenance - - - 570,574
21,356,006 21,920,498 21,957,754 23,700,634
For fiscal year 2011-2012, the Police Department presents a budget of $23,700,634. The Police Department’s budget increased 8% from last year's budget. The most significant increases to the Police Department budget include increases in grant-funded overtime and benefit costs.
09/10 Actual 10/11 Adjusted Budget 10/11 Estimate 11/12 Budget
Personal Services 16,964,573 17,370,986 17,083,909 17,715,311
Operating 2,645,731 3,114,551 3,214,706 3,483,153
Capital Outlay 4,468 30,000 36,245 18,000
19,614,772 20,515,537 20,334,860 21,216,464
GENERAL FUND
09/10 Actual 10/11 Adjusted Budget 10/11 Estimate 11/12 Budget
Personal Services 1,030,859 507,500 1,088,253 1,368,387
Operating 406,104 897,461 528,376 1,105,223
Capital Outlay 301,748 - 6,265 10,560
1,738,711 1,404,961 1,622,894 2,484,170
APPROPRIATED GRANTS FUND
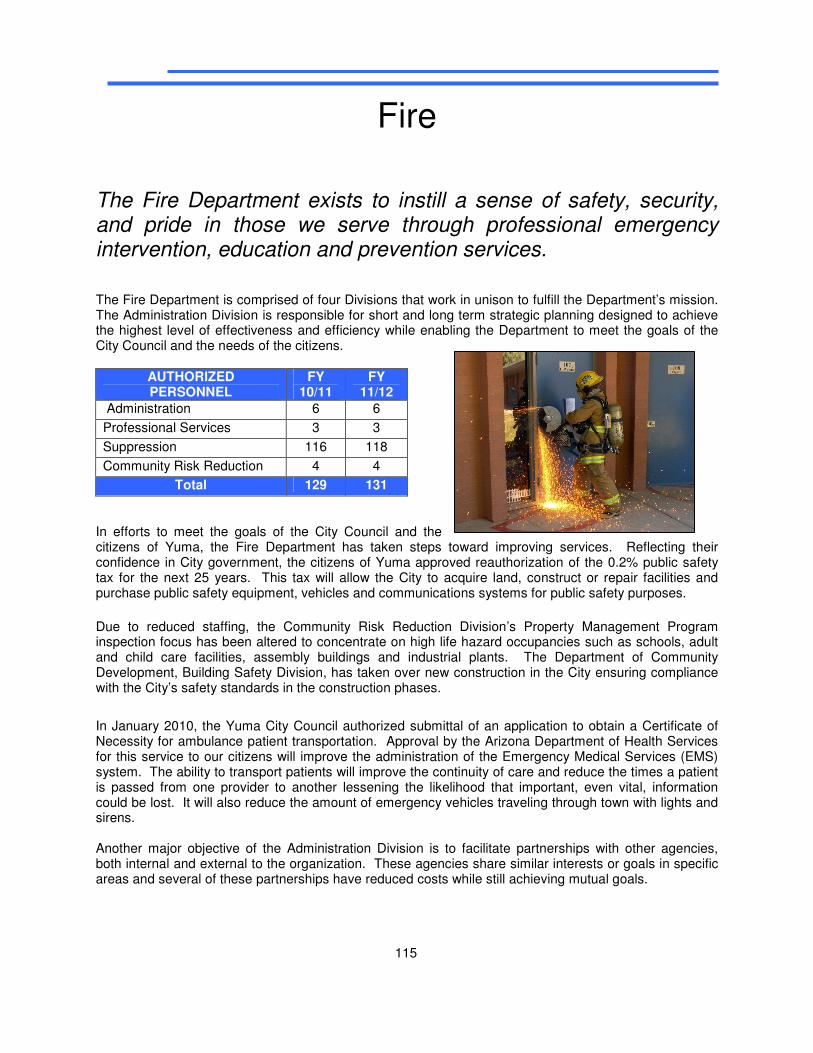
115
Fire
The Fire Department exists to instill a sense of safety, security, and pride in those we serve through professional emergency intervention, education and prevention services.
The Fire Department is comprised of four Divisions that work in unison to fulfill the Department’s mission. The Administration Division is responsible for short and long term strategic planning designed to achieve the highest level of effectiveness and efficiency while enabling the Department to meet the goals of the City Council and the needs of the citizens.
AUTHORIZED PERSONNEL
FY 10/11
FY 11/12
Administration 6 6
Professional Services 3 3
Suppression 116 118
Community Risk Reduction 4 4
Total 129 131
In efforts to meet the goals of the City Council and the citizens of Yuma, the Fire Department has taken steps toward improving services. Reflecting their confidence in City government, the citizens of Yuma approved reauthorization of the 0.2% public safety tax for the next 25 years. This tax will allow the City to acquire land, construct or repair facilities and purchase public safety equipment, vehicles and communications systems for public safety purposes.
Due to reduced staffing, the Community Risk Reduction Division’s Property Management Program inspection focus has been altered to concentrate on high life hazard occupancies such as schools, adult and child care facilities, assembly buildings and industrial plants. The Department of Community Development, Building Safety Division, has taken over new construction in the City ensuring compliance with the City’s safety standards in the construction phases.
In January 2010, the Yuma City Council authorized submittal of an application to obtain a Certificate of Necessity for ambulance patient transportation. Approval by the Arizona Department of Health Services for this service to our citizens will improve the administration of the Emergency Medical Services (EMS) system. The ability to transport patients will improve the continuity of care and reduce the times a patient is passed from one provider to another lessening the likelihood that important, even vital, information could be lost. It will also reduce the amount of emergency vehicles traveling through town with lights and sirens. Another major objective of the Administration Division is to facilitate partnerships with other agencies, both internal and external to the organization. These agencies share similar interests or goals in specific areas and several of these partnerships have reduced costs while still achieving mutual goals.

116
One example of a partnership was recently developed between the Fire Department, Yuma Regional Medical Center (YRMC) and the City of Yuma Information Technology Department to implement a new procedure wherein 12 lead EKG’s are sent to the Emergency Room from the scene of a patient experiencing chest pain. The EKG’s are sent using a cell phone, and routed through the City’s computer network which then sends them to YRMC. For patients experiencing a serious type of myocardial infarction time is critical and the objective is to get the patient into the cardiac catheterization lab within ninety minutes. The goal of this project is to eventually bypass the Emergency Room and take the patient straight to the catheterization lab, saving precious minutes.
Another important partnership is with the Saving Hearts in Arizona Registry and Education (SHARE) Program through the Arizona Department of Health Services and University of Arizona Sarver Heart Center. The Fire Department submits data collected on all out of hospital cardiac arrests and is using a new protocol in cooperation with the Sarver Heart Center, cardio cerebral resuscitation (CCR), which has been shown to increase survivability for cardiac arrest patients.
The Emergency Services Division delivers services activated by the E-9-1-1 and emergency calls received by the traditional seven-digit system. It provides for emergency response to “all risks” in the community including those associated with fire, EMS, technical rescue, hazardous materials and disaster response. Utilizing a three platoon system, this team provides for the needed staffing to complete its mission 24 hours a day/365 days a year. The platoons are led by an assigned shift commander who has collateral duties in providing oversight for EMS, suppression or special operations while providing the crew with the leadership of a Chief Officer. Fleet Services is also a key component of
this Division. The Fleet Manager, in a coordinated effort with the Public Works Fleet Management staff that is certified as Emergency Vehicle Technicians (EVTs), ensures the readiness of our apparatus to respond.
The Professional Services Division is responsible for Department training, internal affairs, safety, succession planning, agency accreditation and improvements, design and construction of Department facilities. Training is provided in the areas of fire suppression, operational tactics and emergency medical certification. Continuing education for basic emergency medical technicians is also provided. Training is coordinated by the Professional Services Division for special operations teams. Internal Affairs reviews the accidents, injuries, personnel actions and customer complaints. Succession planning activities includes recruitment and testing of entry level and internal promotional candidates. In addition, the Division forecasts and plans for the long and short-term personnel needs of the Department. A key responsibility of the Division is the Department’s successful re-certification as an Accredited Agency through the Center for Public Safety Excellence.
The mission of the Community Risk Reduction Division is to increase public safety through education, engineering and enforcement. The Division achieves this mission through a number of public outreach programs. Some examples include: distributing smoke detectors and managing the Juvenile Fire Setter Program. The Juvenile Fire Setter Program is nationally recognized and provides training and education to juvenile offenders. The Division is also actively involved in the pre-development process for new growth in the City. Another major responsibility is inspections of high risk hazard occupancies with focus on conditions that could pose life-threatening danger. As a result of these on-site inspections, Fire Department staff is able to instill a positive relationship with building owners, managers and staff which establishes communication and allows development of training for such things as emergency planning, fire extinguisher use and fire evacuation plans. In addition, the Division has certified personnel who are

117
responsible for providing fire investigations. The purpose of the investigation is to determine the cause and origin of a fire. These investigations are conducted in conjunction with the Yuma Police Department with a common goal to arrive at the true cause of a fire. Another aspect of the Division’s responsibilities is their liaison with the victims of a fire; they are available to provide emergency assistance which may include such assistance as putting the victims in touch with Red Cross personnel and/or assisting to secure their property.
2010-2011 ACCOMPLISHMENTS:
• Commenced with Phase II of the training site to include the installation of a public safety classroom, construction of the training tower and burn building at the Public Safety Training Center site.
• Actively participated in planning and conducting the 7th Annual Yuma Ammonia Awareness Safety
Day. • Acquired new Cardiopulmonary Resuscitation (CPR) mannequins through a Neighborhood Grant. • Completed the City of Yuma's Emergency
Operations Plan. • Continued our program to provide smoke
alarms and educational outreach materials to high risk citizens utilizing a U.S. Fire Administration Grant.
• Sought out and obtained grant funding for a partnership to minimize fall injuries to our senior population.
• Implemented a program to provide and install smoke alarms and provide educational outreach materials to high risk citizens utilizing a U.S. Fire Administration Grant.
• Continued the Juvenile Firesetters Program for referred participants. • Continued to refine the Departmental EMS Quality Assurance Program. Results are now shared with
YRMC and the Physician Medical Director. • The Department EMS Chief was reappointed to the Arizona EMS Council. This is a statutory council
with members appointed by the Governor. • Utilized a U.S. Fire Administration Grant to rehabilitate the Exit Drills in the Home (EDITH) Trailer.
GOALS FOR 2011-2012:
The Yuma Fire Department’s Strategic Plan, developed in support of the City Council’s Strategic Management Plan, has identified succession planning, organizational excellence, service delivery and organizational culture as the primary focus areas to be addressed. To move this plan forward the following goals have been established:
• Begin the design of Fire Station #7. • Continue the review of the new Fire Code for City Council adoption. • Implement an ordinance for City registration of contractors that provide fire protection features such
as fire sprinklers, fire alarm systems and underground fire mains. • Continue to educate Yuma Fire Department personnel at the National Fire Academy. • Continue to seek out the latest EMS equipment and treatment innovations to provide the highest level
of service to our customers. • Continue to use our Quality Improvement Program to improve our service delivery and provide
optimum care to the community. • Continue succession planning for Chief Officers through participation in the Arizona State University
Fire Service Institute, Peoria’s Battalion Chief Academy and the National Fire Academy attendance. • Hold Company Officer and Fire Engineer academies. • Provide promotional testing for Fire Captain and Fire Engineer.

118
• Continue to provide outreach training to businesses on disaster and emergency preparedness.
Due to the City’s attrition policy developed last Fiscal Year, the Fire Department experienced personnel vacancies. These vacancies include: three clerical positions, a Fire Inspector, a Fire Plans Examiner and the Fire Marshal. An Emergency Services Battalion Chief was moved into Community Risk Reduction to provide administration of that Division. This reduction in personnel has, on occasion, required the Department to close the office whenever there is insufficient staffing to keep it open.
Recognizing the challenges the City of Yuma is facing due to these nation-wide financial conditions, the Yuma Fire Department responded by developing a business plan for ambulance transport. Key to this effort was the adoption of the Emergency Medical Needs Assessment by the City Council. This instrument provides the framework for service delivery of EMS for our citizens and secures the highest quality of care. The City Council’s direction to secure a Certificate of Necessity for the purpose of ambulance transport has prompted the Department to move forward with efforts to achieve this goal and we expect that approval will be granted early in the next Fiscal Year.
The mission of the Fire Department continues even through these difficult times. We have maintained our certification as an Accredited Agency through the Center for Public Safety Excellence. This self-assessment process requires the staff and firefighters to assess many critical elements including governance, administration, assessment, planning, financial resources, programs, physical resources, external relationships, training and competency. Once Accreditation is obtained, annual submittals to maintain this prestigious rating are necessary. This Accreditation admits membership of the Yuma Fire Department into a very exclusive club as there are only 142 Fire Departments internationally recognized with this distinction.
The City of Yuma Fire Department responded to over 11,000 calls last calendar year, some of them include commercial and residential fires, hazardous materials and emergency medical assistance. In addition to these emergency activities, the Emergency Services Division is also very active and visible in the community. Some of the more noteworthy appearances are Midnight at the Oasis, Scorpion Baseball games, Yuma County Fair Week, visits to most of the local schools and a host of other community events.
Over the last year our Department provided mutual aid to the municipalities of Somerton, Wellton, Winterhaven, the California County of Imperial, the United States Border Patrol and Marine Corps Air Station Yuma. Our relationship with our neighbors has never been stronger. The Yuma Fire Department is involved at the National and State level. We have been invited to participate with the International Association of Fire Chiefs Professional Development Committee, the
Call Volume
7,000
8,000
9,000
10,000
11,000
12,000
2001
2002
2003
2004
2005
2006
2007
2008
2009
2010
Year
Nu
mb
er
of
Ca
lls

119
Arizona State Fire Marshal’s Office, the Arizona Fire Chiefs Mutual Aid Coordinating Committee, and most recently the National Fire Service Data Summit. Yuma Fire Department personnel hold offices on the boards of the Yuma County Fire Officers Association, the Arizona Emergency Medical Services Council, and the Arizona Fire Chiefs Association.
09/10 Actual 10/11 Adjusted Budget 10/11 Estimate 11/12 Budget
Fire Administration 495,027 720,128 735,118 771,860
Fire-Training 428,491 480,556 400,366 694,054
Suppression 9,065,927 12,112,657 10,188,951 11,871,989
Prevention 756,718 716,925 622,552 751,562
Special Operations 40,404 35,936 34,931 58,066
Emergency
Medical Service101,620 360,320 99,098 414,405
Emergency
Management13 10,474 2,612 165,000
Emergency Mgmt Grant
Allocations- (40,000) - -
Facilities Maintenance - - - 11,283
10,888,200 14,396,996 12,083,628 14,738,219
The Yuma Fire Department continues to educate our members at the best schools in the Nation for emergency services. This year our members attended the National Fire Academy, the National Emergency Management Institute and the Naval Postgraduate School.
09/10 Actual 10/11 Adjusted Budget 10/11 Estimate 11/12 Budget
Personal Services 9,791,536 11,062,890 9,779,029 10,872,835
Operating 1,071,249 1,865,481 1,301,001 1,978,141
Capital Outlay - 219,000 - 329,305
10,862,785 13,147,371 11,080,030 13,180,281
GENERAL FUND
FY 2011-2012 General Fund Budget(in thousands)
$329
$10,872
$1,978
Personnel Operating Capital Outlay

120
09/10 Actual 10/11 Adjusted Budget 10/11 Estimate 11/12 Budget
Personal Services 4,240 50,000 90,056 350,000
Operating 21,176 1,196,022 909,939 1,204,335
Capital Outlay - 3,603 3,603 3,603
25,416 1,249,625 1,003,598 1,557,938
APPROPRIATED GRANTS FUND

Capital Spending & Debt Management

CAPITAL SPENDING AND DEBT
MANAGEMENT
Page No.
Capital Improvement Program 121
Capital Improvement Project Summary 124
2009-2010 Capital Budget 125
Debt Management 128
Table of Outstanding Debt 130
Annual Debt Service Requirements 131
121
Capital Improvement Program
The City of Yuma Capital Improvement Program (CIP) is a 10-year schedule of public physical improvements to the City’s infrastructure. The CIP sets forth proposed expenditures for systematically constructing, maintaining, upgrading, expanding, and replacing the community’s physical plant, as required by the City Charter. This section describes the CIP process and provides limited detail of projects included within the capital improvements area of this adopted budget. The end result of the capital program is a separately published document, which includes detailed mapping, revenue source and the complete ten-year program. The reader should refer to that document to attain more descriptive detail than is included herein. THE PROCESS Projects are typically major expenditures. They can be either infrequent projects, such as the Municipal Government Complex construction project or systematic improvements, such as street surface replacement. Regular street maintenance of city facilities is not considered a Capital Improvement. Therefore, a project such as street slurry seals, which seals minor surface cracks, would not be found in this document and is funded, scheduled and completed within the Public Works Department’s Operations and Maintenance (O&M) budget. Because the CIP identifies what City facilities will be improved it is more than a schedule of expenditures. It is a statement of budgetary policy and a planning document. Implementation of the CIP is a tool to accomplish the adopted goals and policies of the City Council. Projects are developed through the course of the fiscal year. The process involves council, citizens, or staff proposing needed projects. Staff then coordinates the project with any related projects, reviews for compatibility with the City’s goals, identifies a funding source, and
develops a project schedule. Projects are reviewed by the responsible department and placed within the department’s ten-year schedule. During the annual review of the 10-year CIP, completed projects are removed, new projects are proposed, and scheduled projects move forward in the schedule or out to later years. The timing of a project is dependent on the current condition of the facility and funding availability.
As the 10-year CIP is fine-tuned, it is under the oversight of the CIP Review Committee, which is composed of senior staff and the City Administrator. At this time, the specific dollar amounts available for each funding source are known or reliable projections can be made and projects may be added or dropped based on the amount of funds available in the next five years. After review by staff, the next step is referral to the Planning and Zoning Commission for comments and recommendations. The Planning and Zoning Commission’s role is to review the CIP for consistency with the goals and policies of the General Plan. A Public Hearing is held at a commission meeting, which results in a formal recommendation to the City Council. The Capital Budget, which is the first year of the CIP and the 10-year CIP are then brought before the City Council. The City Council will hold a public hearing on the draft CIP at a regular Council meeting. Adoption then occurs at a subsequent Council meeting.
122
CIP BUDGET The first year of the ten-year CIP program is called the capital budget. An extensive project, such as the installation of a major waterline, will typically be a multi-year project. The first year of the project is the design stage and the second year will involve the actual construction. The capital budget is integrated with the operating budget of the City and adopted in one motion. The projects within the first year of the CIP are prioritized. Prioritization is developed within each section and is established by the responsible departments. The prioritization is based on the need for the project and the available resources needed to complete the project. The availability of funds is the key factor as to whether a project will be initiated and completed. There are a variety of funding sources available, but these sources are limited in both the amount available and how these funds can be used. The same funding restrictions discussed in the Funds section hold true here. Projects can be funded by city, state or federal monies and outside agencies and individuals. City funding sources typically are sales and property taxes, service and utility fees, the Road tax and the Highway Users Revenue fund (a state gasoline tax with specific amounts allotted to municipalities based on population). IMPACT ON OPERATING BUDGET Because much of the funding for capital projects comes from the general and special revenues, the operating budget must have a clear connection to the CIP process. Those same revenues drive the daily services provided by the city. Accordingly, its operating budget often comes first when priorities for projects are set, should tax or other revenues not be sufficient to maintain current operations and to build infrastructure. This is especially important when
the project will create new or expanded facilities. For example, if a new park is planned, then the Parks and Recreation Department must include supplemental information in its budget to maintain the new park. This would include not only employees or contractors to maintain the park, but equipment and supplies for the park’s upkeep. For most items in the 2012 capital budget, there is little actual impact on the operating budget since many capital items are replacement items already affecting operations cost. However, the following projects are new facilities with their associated operating costs that are included in the FY12 operating budget.
Project FY12
Capital Cost
FY12 Operating
Cost
Public Safety Training Facility
1,170,000 $14,700
Police Storage Facility
$375,000 $25,005
City of Yuma Animal Services
$200,000 $650,000
Following this discussion are three tables related to capital projects. The first table lists the various funding source descriptions the Capital Improvement Program uses. The Fund name is the abbreviation used in the program. The second table provides a summary by funding source of capital projects while the third table lists the actual projects included in the capital portion of the adopted budget. The list is grouped by funding source and shows the project number, a brief descriptive title and the amount included in this year’s adopted budget. The project number is useful in finding the detailed project information in the separately published ten-year capital improvement program.

123
FUND DESCRIPTION
ADEF Arroyo Dunes Funds: Collected from user fees at the golf course
BOND This fund can be either the voter approved bond issue for specific projects or City dollars, which are developed through a Bond financing mechanism.
CDBG Community Development Block Grants: Non-City dollars, federal funds for redevelopment projects.
CIT Community Investment Trust Funds: General Fund dollars, which may be used at Council’s direction.
DD Developer Deposits: Deposits paid by developers in place of completing construction on specific projects.
DEV Development Fees
DH Desert Hills Enterprise Fund: Collected from golf fees.
GEN General Fund: Revenues from fees paid, sales tax, property tax, fines, etc.
GRNT Grant: Non-City dollars, which can be federal or state grants.
HERI Heritage Area Grant Funding: Funds allocated to the City of Yuma for specific improvements to the city’s riverfront and downtown area.
HURF
Highway Users Fund: Highway Users Gasoline Tax monies the City receives based on population. Funds are used for street improvements or street related projects.
IMP Improvement District:
LTAF Local Transportation Assistance Fund: Lottery dollars the City receives based on population. Funds are used for street improvements or street related projects.
OTHR Non-City dollars such as ADOT, APS funds or other agency funds.
PBSF Public Safety Tax Fund: two-tenths percent sales tax collected for the acquisition, construction or improvements to public safety facilities.
PRO
Pro-rata: financing that has been collected and is available for development of projects. Impact: money collected from Citywide Impact Fees.
RCX Recreation Complex funds: City dollars, which are collected from fees paid at the civic center and baseball complex. Also can be 2% excise tax dollars, depending on the specific project.
ROAD City road tax: five-tenths percent sales tax used for specific road projects.
SANI Sanitation funds: General Fund dollars, which are reserved for sanitation projects.
SCF Sewer Capacity Fund: City dollars, collected from fees paid at time of sewer connection.
STP Surface Transportation Program: Non-City dollars, federal highway funds for roads and bridges.
SUF Sewer Utility Fund: City dollars, collected from fees paid for specific sewer utility items, such as a meter.
SYSD System Development Charges: A separate fee paid at the time of issuance of a water permit. The fee is based on the acreage of the property.
SSIC Sanitary Sewer Interceptor Charge: City dollars, collected from fees paid at time of issuance of a sewer permit.
TWO%
2% Tax financing: A special excise tax on hotel, motel, restaurant and bar sales, which finances the Yuma Civic and Convention Center facility, the Baseball Complex, the Arroyo Dunes and Desert Hills Golf Courses, the Yuma Crossing Park and surrounding area and convention/tourism related activities.
WCF Water Capacity Fund: City dollars, collected from fees paid at time of water connection.
WUF Water Utility Fund: City dollars, collected from fees paid for specific utility items, such as a meter.

Capital Improvement Project Summary
2011-2012 Capital Budget
FUND 2011-2012
Grants Fund
Appropriated Grants Fund 23,422,000$
CDBG Grant Fund 30,000
Recreation Complex Fund -
Two Percent Tax Fund 2,153,000
City Road Tax Fund 2,208,467
Local Transportation Assistance Fund -
Water Fund 1,320,640
Wastewater Fund 1,153,100
Restricted Funds
Bond General 8,280,000
Bond Road 8,963,500
Bond Water 9,546,000
Bond Wastewater 2,305,000
Developer Deposits 91,294
Prorata 2,810,245
Development Fees 5,490,000
Improvement District -
Water System Development -
Water Capacity -
Sewer Capacity Fees 2,700,000
Sanitary Sewer Interceptor Charge -
Other 18,836,067
89,309,313$
124

CAPITAL IMPROVEMENT PROJECTS
2011-2012 Capital Budget
FUNDING SOURCE PROJECT TITLE 2011/2012
BOND GENERAL City Hall Modification 1,340,000
Budget Authority Reserve 400,000
Software System Purchase 200,000
Financial Administration Software 200,000
Joe Henry Park Improvements 5,000
Fire Station No. 1 Replacement 4,500,000
Fire Department Training Facility 1,170,000
Budget Authority Reserve 150,000
Police Storage Facility 300,000
Police K9 Training Area 15,000
BOND GENERAL Total 8,280,000
Villa Hermosa No. 2 100,000
32nd Street - Avenue A to Avenue B 4,350,000
8th Avenue - 24th Street to 32nd Street 500,000
16th Street - Arizona Avenue to Pacific Avenue 800,000
Avenue A - 8th Street to 16th Street Paving 545,000
Avenue A - 16th Street to 24th Street 2,100,000
5th Avenue - 8th Street to 16th Street Paving 488,500
Pacific Avenue and 32nd Street Lane Changes 30,000
Giss Parkway Roundabout Improvements 50,000
BOND ROAD Total 8,963,500
Desert Dunes Water Reclamation Facility Expansion 100,000
Figueroa Avenue WPCF Corrosion Control Imps 575,000
Figueroa WPCF Power Improvements 1,000,000
Figueroa Avenue WPCF Biosolids Dewatering Process 600,000
Pinto Lane Sanitary Sewer Lift Station 30,000
BOND WASTEWATER Total 2,305,000
5th Avenue Watermain - 8th Street to 16th Street 506,000
36th Street Waterline - 4th Avenue to 8th Avenue 350,000
Avenue 3E 12" Waterline - 12th to 15th Street 220,000
Engler Ave Waterline - 16th St to Calle Chapalla 210,000
Main Street WTF Chlorine System Modification 780,000
Avenue 4E and 36th Street Watermain Intersection 610,000
30th Street Watermain - Avenue 6¾E to Avenue 7E 315,000
24th Street Waterline - Pacific to Arizona Avenue 1,640,000
Avenue C Waterline - 16th Street to 18th Street 400,000
Edenwood Subdivision Water Service Line Repl. 335,000
Yuma Corona Subdivision Water Line Service Repl. 175,000
Rancho Verde Subdivision Water Service Line Repl. 100,000
Villa Cordova Water Service Line Replacement 250,000
Agua Viva WTP Solar Power 200,000
Urban Lake 500,000
22nd Street - Avenue A to 4th Avenue Waterline 475,000
4th Avenue Waterline Crossing Replacements 380,000
Waterline Replacement/Improvements 2,100,000
BOND WATER Total 9,546,000
CDBG Dr. Martin Luther King, Jr. Neighborhood Center 30,000
CDBG Total 30,000
BOND
WASTEWATER
BOND WATER
BOND ROAD
General Fund
Public Safety Tax
125

CAPITAL IMPROVEMENT PROJECTS
2011-2012 Capital Budget
FUNDING SOURCE PROJECT TITLE 2011/2012
Budget Authority Reserve 50,000
Traffic Signal Install - 32nd Street at Avenue 6E 20,000
Cibola Heights Stormwater Basin Improvements 21,294
DD Total 91,294
Vehicle Acquisitions 200,000
Budget Authority Reserve 300,000
Park Facility Improvements 1,800,000
Police Storage Facility 75,000
Police Substation 1,540,000
City Hall Modification 1,000,000
Citywide Development Fee Update 160,000
Police K9 Training Area 15,000
32nd Street - Avenue A to Avenue B 400,000
DEV Total 5,490,000
Budget Authority Reserve 100,000
Multi-Modal Reconstruction 2,800,000
Giss Parkway Downtown Entrance 750,000
Paradise Cove Wetlands Restoration 200,000
800 MHZ New Radio Site 2,582,000
Yuma Regional CAD/RMS/MDC 2,000,000
West Main Canal Multi-use Path 750,000
Avenue 3E - Gila Ridge Rd. to 32nd St. 7,000,000
4th Avenue - Catalina Drive to 1st Street Paving 3,900,000
Yuma Expressway 2,000,000
Main Street WTF Auxiliary Power 615,000
Pivot Point Retail Village Components - Canal Walk 10,000
West Wetlands Multi-Use Pathway (MUP) 15,000
Downtown / I-8 Trailblazing & City ID Imps. 200,000
Expansion of Yuma's Multi-Use Pathway System 500,000
GRNT Total 23,422,000
Quarter Master Depot Roof Replacement 85,000
Avenue 3E - Gila Ridge Rd. to 32nd St. 2,179,000
4th Avenue - Catalina Drive to 1st Street Paving 222,300
Budget Authority Reserve 300,000
Fourth Avenue Gateway 999,767
Yuma Territorial Prison SHP - Sally Port 290,000
800 MHZ New Radio Site 4,000,000
32nd Street - Avenue A to Avenue B 300,000
16th Street and Yuma Palms Pkwy Pedestrian Refuge 60,000
Figueroa WPCF Co-Gen Project 1,000,000
28th Street Storm Drainage 9,400,000
OTHR Total 18,836,067
Yuma Valley Area Park 442,032
24th Street - Avenue B to Avenue C 2,368,213
PRO Total 2,810,245
DD
DEV
GRNT
OTHR
PRO
126
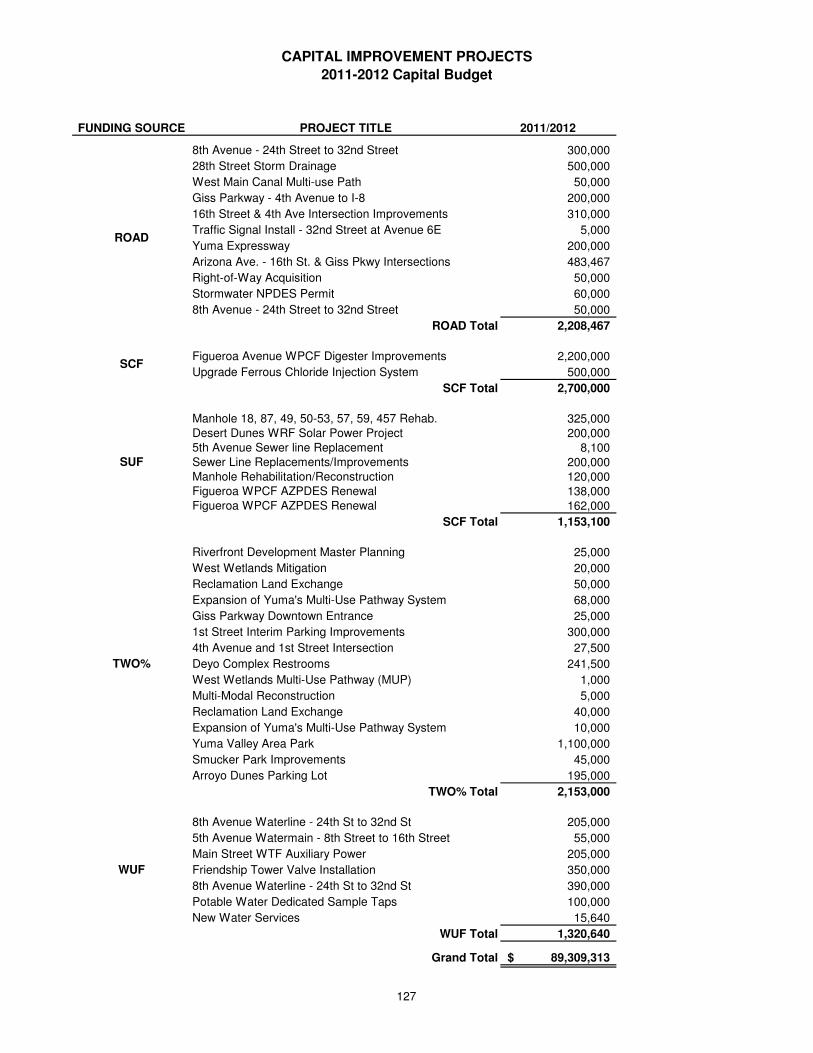
CAPITAL IMPROVEMENT PROJECTS
2011-2012 Capital Budget
FUNDING SOURCE PROJECT TITLE 2011/2012
8th Avenue - 24th Street to 32nd Street 300,000
28th Street Storm Drainage 500,000
West Main Canal Multi-use Path 50,000
Giss Parkway - 4th Avenue to I-8 200,000
16th Street & 4th Ave Intersection Improvements 310,000
Traffic Signal Install - 32nd Street at Avenue 6E 5,000
Yuma Expressway 200,000
Arizona Ave. - 16th St. & Giss Pkwy Intersections 483,467
Right-of-Way Acquisition 50,000
Stormwater NPDES Permit 60,000
8th Avenue - 24th Street to 32nd Street 50,000
ROAD Total 2,208,467
Figueroa Avenue WPCF Digester Improvements 2,200,000
Upgrade Ferrous Chloride Injection System 500,000
SCF Total 2,700,000
Manhole 18, 87, 49, 50-53, 57, 59, 457 Rehab. 325,000
Desert Dunes WRF Solar Power Project 200,000
5th Avenue Sewer line Replacement 8,100
Sewer Line Replacements/Improvements 200,000
Manhole Rehabilitation/Reconstruction 120,000
Figueroa WPCF AZPDES Renewal 138,000
Figueroa WPCF AZPDES Renewal 162,000
SCF Total 1,153,100
Riverfront Development Master Planning 25,000
West Wetlands Mitigation 20,000
Reclamation Land Exchange 50,000
Expansion of Yuma's Multi-Use Pathway System 68,000
Giss Parkway Downtown Entrance 25,000
1st Street Interim Parking Improvements 300,000
4th Avenue and 1st Street Intersection 27,500
Deyo Complex Restrooms 241,500
West Wetlands Multi-Use Pathway (MUP) 1,000
Multi-Modal Reconstruction 5,000
Reclamation Land Exchange 40,000
Expansion of Yuma's Multi-Use Pathway System 10,000
Yuma Valley Area Park 1,100,000
Smucker Park Improvements 45,000
Arroyo Dunes Parking Lot 195,000
TWO% Total 2,153,000
8th Avenue Waterline - 24th St to 32nd St 205,000
5th Avenue Watermain - 8th Street to 16th Street 55,000
Main Street WTF Auxiliary Power 205,000
Friendship Tower Valve Installation 350,000
8th Avenue Waterline - 24th St to 32nd St 390,000
Potable Water Dedicated Sample Taps 100,000
New Water Services 15,640
WUF Total 1,320,640
Grand Total 89,309,313$
TWO%
ROAD
SCF
WUF
SUF
127

128
Debt Management
The last section described how the city provided for its infrastructure needs. It was noted that operating revenues were the primary source for CIP projects. This ‘pay-as-you-go’ financing plan works well for smaller projects that can be paid out of current revenues. It doesn't work when project cost is greater than the annual collections from that source of revenue. When more significant projects are planned which are beyond current revenues ability to spend, the City will seek financing solutions that provide the necessary resources immediately. Although a variety of forms of financing are available, the City usually turns to long-term bonds as a source of its financing. LONG-TERM BONDS Much like bank financing, the City sells bonds on the open market to secure enough proceeds to pay for a project. With a ready source of cash, the City can complete a large project without the cash-flow concerns of using 'pay-as-you-go'. Again, like bank financing, the bonds must be repaid over time, at market driven interest rates. These payback terms are spread based on the flow assumptions of the underlying revenue and can range from five to twenty years or more. There are several reasons why bond financing is the most attractive source of capital. Because of their lower risk, with particular revenue types pledged to bond repayment, interest rates are lower. Municipal bonds are attractive to investors also because of favorable income tax treatment of bond interest payments. Interest rates are fixed at the time of the bond sale, providing the City with a known payment schedule. Servicing this debt becomes part of the operating budget along with operational and capital needs. As
noted earlier, the City maintains a Debt Service Fund, which is used to account for payment of the debt. Into this fund are transferred monies from other operating funds that can now pay over time for a costly project rather than trying to set aside monies until sufficient resources are available. Most governments have been active in the bond markets for years, especially with low long-term rates. The City of Yuma is no exception. This bond financing to pay for capital projects is especially prevalent in fast-growing cities, like Yuma. BOND TYPES There are different types of bonds used depending on the type of project and its anticipated repayment funding. A description of the bond types and their use by the City follows. General Obligation Bonds - This type of bond relies on secondary property tax financing rather than a current operating revenue. This bonding method is subject to voter approval because it creates a new tax to support repayment. This secondary property tax is levied, when in use, by the City directly for bond repayment. The City does currently have general obligation bonds outstanding; however, the proceeds were used by the Water Fund to expand the current water plant. While the full faith and credit of the City supports the bonds and a tax levy could be generated if necessary, the bonds are paid by current revenues of the Water Fund. Revenue Bonds - These bonds are similar to general obligation bonds except that they do not have the support of the local property tax base for repayment. Instead, a source of revenue related to the project is pledged for repayment of the bonds. A typical revenue bond is related to the Highway User

129
Revenue Fund (HURF), previously discussed in the Fund Information Section. The gas tax of the HURF fund can be pledged for repayment of the bonds, as it is a reliable source of revenue. Debt service payments would then claim priority for spending from the fund until the bonds were repaid. The City does not presently use this type of bonding, however, it has been used in the past. Municipal Property Corporation (MPC) Bonds - The City issued its first MPC bonds in 1970 to finance the construction of the Convention Center, Baseball Complex and Desert Hills Golf Course. The Municipal Property Corporation was created to sell the bonds for that project. The bonds, because they do not necessarily rely on new sources of revenue for repayment, are not subject to voter approval for each project. (With its initial bond sale, however, the City created a new sales tax, the 2% Special Tax, for bond repayment and the new tax was subject to, and won, voter approval.) This method of bond financing has been used many times to finance a variety of projects. Improvement Districts – Improvement district financing is a special bonding arrangement for capital improvements in limited areas of the City. This debt is authorized by the property owners of the district and secured by assessments paid by those property owners. The City retains an obligation to pay should those assessments fail to meet the obligations of the bond; however, the City then retains title to the property should that unlikely failure occur. The City has used improvement district financing on a number of occasions, the most recent being Improvement District 67 which financed public improvements adjacent to the Yuma Palms Regional Center. LONG-TERM CONTRACTS Another form of financing the City has used recently is a long-term financing contract (loans). Theses include the Arizona Water Infrastructure Financing Authority (WIFA), US Department of Housing and Urban Development (HUD), and the Arizona Department of Transportation (ADOT). In cases like WIFA, the authority sells bonds at
a lower rate than the City can attain and loans the proceeds to various municipalities throughout the state. In each case, a fixed repayment schedule is created, much like a bond repayment schedule. For WIFA participation, Arizona statutes require voter approval. The City received such approval in 2002. DEBT LIMITATIONS Under Arizona’s Constitution, outstanding general obligation bonded debt for combined water, sewer, artificial light, parks, open space preserves, playgrounds and recreational facilities may not exceed 20% of a City’s net secondary assessed valuation. Outstanding general obligation debt for all other purposes may not exceed 6% of a City’s net secondary assessed valuation. The legal borrowing capacity of the City of Yuma at June 30, 2009 follows:
Water, Etc. (20%) Legal Limit $133,365,545 Outstanding GO Debt 2,765,000 Available Debt Margin $130,600,545 All Others (6%) Legal Limit $40,009,637 Outstanding GO Debt - Available Debt Margin $40,009,637
These limitations apply to general obligation debt only. Limitations other than statutory exist in many of the debt covenants associated with the bonds. These limitations include coverage requirements in which further debt is restricted if revenues related to the outstanding debt do not exceed certain percentages. In each case, the City is well within these limitations. Detailed coverage information is provided within the City’s annual Comprehensive Annual Financial Report. IMPACT OF DEBT SERVICE ON BUDGET Much like the impact of capital projects, debt service payments are derived from the same general revenues that are used for operations. A balance must be achieved between operational needs, debt requirements and capital expenditures to
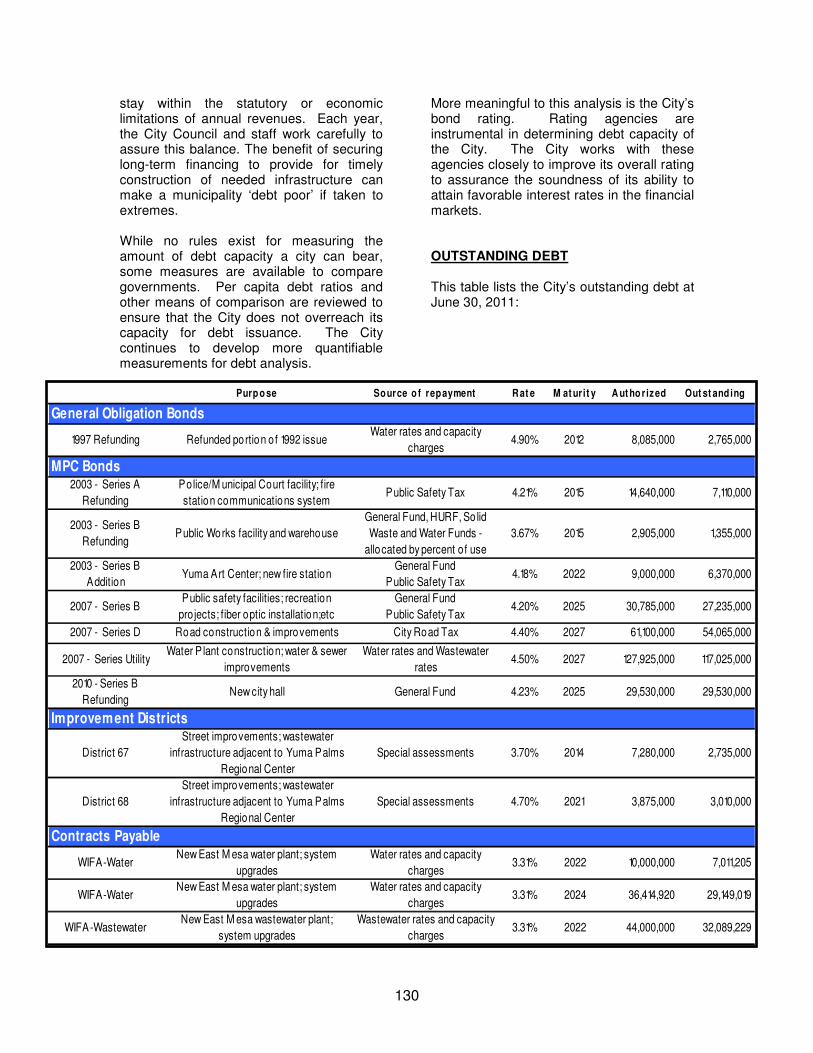
130
stay within the statutory or economic limitations of annual revenues. Each year, the City Council and staff work carefully to assure this balance. The benefit of securing long-term financing to provide for timely construction of needed infrastructure can make a municipality ‘debt poor’ if taken to extremes. While no rules exist for measuring the amount of debt capacity a city can bear, some measures are available to compare governments. Per capita debt ratios and other means of comparison are reviewed to ensure that the City does not overreach its capacity for debt issuance. The City continues to develop more quantifiable measurements for debt analysis.
More meaningful to this analysis is the City’s bond rating. Rating agencies are instrumental in determining debt capacity of the City. The City works with these agencies closely to improve its overall rating to assurance the soundness of its ability to attain favorable interest rates in the financial markets. OUTSTANDING DEBT This table lists the City’s outstanding debt at June 30, 2011:
Purp o se Source o f repayment R at e M at ur it y A ut ho r ized Out st anding
1997 Refunding Refunded portion o f 1992 issueWater rates and capacity
charges4.90% 2012 8,085,000 2,765,000
2003 - Series A
Refunding
Police/M unicipal Court facility; fire
station communications systemPublic Safety Tax 4.21% 2015 14,640,000 7,110,000
2003 - Series B
RefundingPublic Works facility and warehouse
General Fund, HURF, So lid
Waste and Water Funds -
allocated by percent of use
3.67% 2015 2,905,000 1,355,000
2003 - Series B
AdditionYuma Art Center; new fire station
General Fund
Public Safety Tax4.18% 2022 9,000,000 6,370,000
2007 - Series BPublic safety facilities; recreation
projects; fiber optic installation;etc
General Fund
Public Safety Tax4.20% 2025 30,785,000 27,235,000
2007 - Series D Road construction & improvements City Road Tax 4.40% 2027 61,100,000 54,065,000
2007 - Series UtilityWater P lant construction; water & sewer
improvements
Water rates and Wastewater
rates4.50% 2027 127,925,000 117,025,000
2010 - Series B
RefundingNew city hall General Fund 4.23% 2025 29,530,000 29,530,000
District 67
Street improvements; wastewater
infrastructure adjacent to Yuma Palms
Regional Center
Special assessments 3.70% 2014 7,280,000 2,735,000
District 68
Street improvements; wastewater
infrastructure adjacent to Yuma Palms
Regional Center
Special assessments 4.70% 2021 3,875,000 3,010,000
WIFA-WaterNew East M esa water plant; system
upgrades
Water rates and capacity
charges3.31% 2022 10,000,000 7,011,205
WIFA-WaterNew East M esa water plant; system
upgrades
Water rates and capacity
charges3.31% 2024 36,414,920 29,149,019
WIFA-WastewaterNew East M esa wastewater plant;
system upgrades
Wastewater rates and capacity
charges3.31% 2022 44,000,000 32,089,229
General Obligation Bonds
MPC Bonds
Contracts Payable
Improvement Districts

131
Annual Debt Service Requirements
July
1 Principal Interest Total Principal Interest Total
2011 1,345,000 134,140 1,479,140 875,000 101,196 976,196
2012 1,420,000 69,580 1,489,580 910,000 68,820 978,820
2013 - - - 950,000 35,150 985,150
2,765,000$ 203,720$ 2,968,720$ 2,735,000$ 205,166$ 2,940,166$
2011 1,300,000 1,227,865 2,527,865 420,000 272,207 692,207 245,000 141,470 386,470
2012 1,340,000 1,188,581 2,528,581 435,000 257,507 692,507 255,000 129,955 384,955
2013 1,375,000 1,155,081 2,530,081 450,000 241,847 691,847 265,000 117,970 382,970
2014 1,425,000 1,100,082 2,525,082 470,000 224,973 694,973 280,000 105,515 385,515
2015 1,465,000 1,057,332 2,522,332 490,000 207,347 697,347 290,000 92,355 382,355
2016 1,840,000 1,013,381 2,853,381 515,000 182,847 697,847 305,000 78,725 383,725
2017 1,910,000 939,781 2,849,781 535,000 157,098 692,098 320,000 64,390 384,390
2018 2,010,000 844,282 2,854,282 560,000 134,628 694,628 335,000 49,350 384,350
2019 2,110,000 743,781 2,853,781 585,000 110,828 695,828 350,000 33,605 383,605
2020 2,210,000 638,281 2,848,281 610,000 85,672 695,672 365,000 17,155 382,155
2021 2,305,000 549,881 2,854,881 635,000 58,833 693,833 - - -
2022 2,400,000 454,800 2,854,800 665,000 30,258 695,258 - - -
2023 2,500,000 352,800 2,852,800 - - - - - -
2024 2,610,000 240,300 2,850,300 - - - - - -
2025 2,730,000 122,850 2,852,850 - - - - - -
29,530,000$ 11,629,078$ 41,159,078$ 6,370,000$ 1,964,045$ 8,334,045$ 3,010,000$ 830,490$ 3,840,490$
2011 1,285,000 304,953 1,589,953 250,000 53,485 303,485
2012 1,350,000 240,703 1,590,703 260,000 44,735 304,735
2013 1,425,000 173,203 1,598,203 270,000 35,375 305,375
2014 1,490,000 119,765 1,609,765 280,000 25,250 305,250
2015 1,560,000 62,400 1,622,400 295,000 14,750 309,750
7,110,000$ 901,024$ 8,011,024$ 1,355,000$ 173,595$ 1,528,595$
1997 Refunding Bonds Improvement District No. 67 Bonds
MPC Bonds 2003 Series
BONDS AND IMPROVEMENT DISTRICTS
Improvement District No. 68 BondsMPC Bonds 2010 Refunding 2001
MPC Bonds 2003 Refunding 1995A MPC Bonds 2003 Refunding 1995B

132
Principal Interest Total Principal Interest Total Principal Interest Total
1,125,000 1,168,220 2,293,220 2,230,000 2,553,525 4,783,525 3,260,000 5,682,538 8,942,538
1,175,000 1,111,970 2,286,970 2,330,000 2,442,025 4,772,025 3,425,000 5,519,538 8,944,538
1,230,000 1,064,970 2,294,970 2,435,000 2,348,825 4,783,825 3,585,000 5,382,538 8,967,538
1,280,000 1,015,770 2,295,770 2,540,000 2,251,425 4,791,425 3,750,000 5,239,138 8,989,138
1,335,000 964,570 2,299,570 2,655,000 2,149,825 4,804,825 3,920,000 5,089,138 9,009,138
1,390,000 911,170 2,301,170 2,760,000 2,043,625 4,803,625 4,095,000 4,893,138 8,988,138
1,445,000 855,570 2,300,570 2,870,000 1,905,625 4,775,625 4,270,000 4,688,388 8,958,388
1,505,000 797,770 2,302,770 2,985,000 1,762,125 4,747,125 4,440,000 4,453,538 8,893,538
1,565,000 737,570 2,302,570 3,110,000 1,612,875 4,722,875 4,620,000 4,231,538 8,851,538
1,630,000 674,970 2,304,970 3,240,000 1,457,375 4,697,375 4,810,000 4,000,538 8,810,538
1,700,000 606,510 2,306,510 3,375,000 1,323,725 4,698,725 5,015,000 3,802,125 8,817,125
1,770,000 534,260 2,304,260 3,520,000 1,154,975 4,674,975 5,225,000 3,551,375 8,776,375
1,850,000 458,150 2,308,150 3,670,000 978,975 4,648,975 5,450,000 3,290,125 8,740,125
1,930,000 365,650 2,295,650 3,825,000 795,475 4,620,475 5,685,000 3,017,625 8,702,625
2,010,000 281,212 2,291,212 3,995,000 604,225 4,599,225 5,930,000 2,733,375 8,663,375
2,100,000 193,275 2,293,275 4,170,000 404,475 4,574,475 6,190,000 2,436,875 8,626,875
2,195,000 98,775 2,293,775 4,355,000 195,975 4,550,975 6,460,000 2,127,375 8,587,375
- - - - - - 6,745,000 1,844,750 8,589,750
- - - - - - 7,050,000 1,507,500 8,557,500
- - - - - - 7,365,000 1,155,000 8,520,000
- - - - - - 7,695,000 786,750 8,481,750
- - - - - - 8,040,000 402,000 8,442,000
27,235,000$ 11,840,382$ 39,075,382$ 54,065,000$ 25,985,075$ 80,050,075$ 117,025,000$ 75,834,905$ 192,859,905$
Principal Interest Total Principal Interest Total Principal Interest Total
485,359 232,141 717,500 2,221,416 1,062,474 3,283,890 1,620,809 1,063,265 2,684,074
501,429 216,071 717,500 2,294,967 988,923 3,283,890 1,681,632 1,001,311 2,682,943
518,032 199,468 717,500 2,370,953 912,937 3,283,890 1,744,727 937,033 2,681,760
535,184 182,316 717,500 2,449,455 834,435 3,283,890 1,810,189 870,342 2,680,531
552,904 164,596 717,500 2,530,557 753,333 3,283,890 1,878,108 801,150 2,679,258
571,210 146,290 717,500 2,614,343 669,547 3,283,890 1,948,574 729,361 2,677,935
590,123 127,377 717,500 2,700,904 582,986 3,283,890 2,021,685 654,879 2,676,564
609,662 107,838 717,500 2,790,331 493,559 3,283,890 2,097,539 577,603 2,675,142
629,848 87,652 717,500 2,882,719 401,171 3,283,890 2,176,238 497,427 2,673,665
650,702 66,798 717,500 2,978,166 305,724 3,283,890 2,257,891 414,242 2,672,133
672,247 45,253 717,500 3,076,773 207,117 3,283,890 2,342,607 327,937 2,670,544
694,505 22,995 717,500 3,178,645 105,245 3,283,890 2,430,501 238,393 2,668,894
- - - - - - 2,521,694 145,490 2,667,184
- - - - - - 2,616,825 49,092 2,665,917
7,011,205$ 1,598,796$ 8,610,001$ 32,089,229$ 7,317,450$ 39,406,679$ 29,149,019$ 8,307,524$ 37,456,543$
CONTRACTS PAYABLE
WIFA Loan #920088-04WIFA Loan #920069-03 WIFA Loan #910043-03
MPC Bonds 2007 Series Utility
BONDS AND IMPROVEMENT DISTRICTS
MPC Bonds 2007 Series B MPC Bonds 2007 Series D

Appendix

APPENDIX
Page No.
Schedule 1 – Revenues 133
Schedule 2 – Department Expenditure 139
By Fund
Schedule 3 – Outside Agency Summary 144
Schedule 4 – Authorized Staffing Level 145
Schedule 5 – Budget Resolution 159
Schedule 6 – Maximum Tax Levy 161
Glossary 162

2009-2010 2010-2011 2010-2011 2011-2012
ACTUAL BUDGET ESTIMATE FORECAST
GENERAL FUND
Local Taxes:
Sales tax (1%) 17,461,629 17,300,000 17,985,000 17,985,000
Property Tax 9,023,480 9,864,144 9,300,000 10,045,160
Delinquent Property Tax 233,143 140,000 275,000 250,000
Franchise Tax 3,251,773 3,297,000 3,237,000 3,277,000
Intergovernmental Revenues:
State revenue sharing 11,530,338 8,647,500 8,647,500 7,854,995
State sales tax 6,553,752 6,500,000 6,680,000 7,040,887
Auto in-lieu tax 3,302,485 3,200,000 3,200,000 2,810,000
Tribal contribution 44,700 45,000 52,000 52,000
Licenses and Permits:
Business licenses 315,491 320,000 375,000 320,000
Liquor licenses 45,904 42,600 48,200 48,200
Building permits 711,146 511,000 603,500 603,400
Electrical permits 168,508 125,000 142,000 142,000
Plumbing permits 72,932 50,000 50,000 50,000
Mechanical permits 79,929 57,500 70,000 70,000
Charges for Services:
Zoning and subdivision fees 127,308 44,327 36,075 37,100
Plan check fees 261,076 270,000 286,000 275,000
Other development fees 4,163 2,500 3,803 2,000
Swimming fees 208,509 158,000 179,600 180,000
Recreation fees 285,444 266,850 275,000 273,500
Art Center fees 87,133 60,500 54,222 53,500
Other charges 265,243 2,340,469 182,364 2,134,500
Police services 664,228 690,000 527,326 525,000
Use of Money and Property:
Investment income 164,499 131,500 100,000 100,000
Recreation facility rents 188,447 152,200 195,842 188,500
Art Center facility rents 17,989 13,000 20,000 20,000
Vehicle code fines 929,881 779,500 929,500 929,000
Parking & other fines 497,829 440,000 551,000 551,000
Miscellaneous Revenues:
Sale of property 5,084 - 662,700 5,000
Animal control licenses - - - 100,000
Unclassified revenues 196,103 163,000 206,701 119,000
Total 56,698,146 55,611,590 54,875,333 56,041,742
COMMUNITY INVESTMENT TRUST FUND
Use of Money and Property:
Investment income 207 400 200 200
Miscellaneous Revenues:
Unclassified revenues 500 - - -
Total 707 400 200 200
SCHEDULE 1
REVENUES
133

2009-2010 2010-2011 2010-2011 2011-2012
ACTUAL BUDGET ESTIMATE FORECAST
SCHEDULE 1
REVENUES
HIGHWAY USERS REVENUE FUND
Intergovernmental Revenues:
State gasoline tax 6,626,021 6,875,000 6,550,000 5,863,023
Charges for Services
Development Charges 554 - - -
Signal maintenance - - 12,000 12,000
Use of Money and Property:
Investment income 6,133 6,000 7,800 8,000
Miscellaneous Revenues:
Unclassified revenues 179,041 100,000 25,000 50,000
Total 6,811,749 6,981,000 6,594,800 5,933,023
CITY ROAD TAX FUND
Local Taxes:
Sales tax (0.5%) 8,729,333 8,652,665 8,991,000 8,991,000
Charges for Services
Development Charges 12,219 10,000 5,000 5,000
Use of Money and Property:
Investment income 21,417 40,000 8,500 8,500
Rental income 458,203 398,556 355,000 355,000
Sale of property 200 - - -
Miscellaneous Revenues:
Unclassified revenues 35,586 - - -
Total 9,256,958 9,101,221 9,359,500 9,359,500
LOCAL TRANSPORTATION ASSISTANCE FUND
Intergovernmental Revenues:
Lottery tax 226,306 - 75,764 -
Use of Money and Property:
Investment income 1,535 - - -
Miscellaneous Revenues:
Contributions 42,566 - - -
Total 270,407 - 75,764 -
PUBLIC SAFETY TAX FUND
Local Taxes:
Sales tax (0.2%) 3,490,540 3,459,800 3,595,256 3,595,256
Use of Money & Property:
Investment income 2,243 - 5,000 5,000
Total 3,492,783 3,459,800 3,600,256 3,600,256
RECREATION COMPLEX FUND
Charges for Services:
Liquor sales 41,216 40,000 45,000 45,000
Concession stand sales 110,122 87,000 114,000 114,000
Other sales 1,243 2,000 1,000 2,000
Commissions & fees 21,502 13,000 13,000 13,000
Use of Money and Property:
Investment income 10,193 4,000 7,500 7,500
Room rents 228,184 184,000 190,000 190,000
Equipment rents 44,317 41,000 41,000 41,000
Other rents 82,971 77,800 75,000 75,000
Miscellaneous Revenues:
Unclassified revenues 4,424 4,020 4,000 4,000
Total 544,172 452,820 490,500 491,500
134
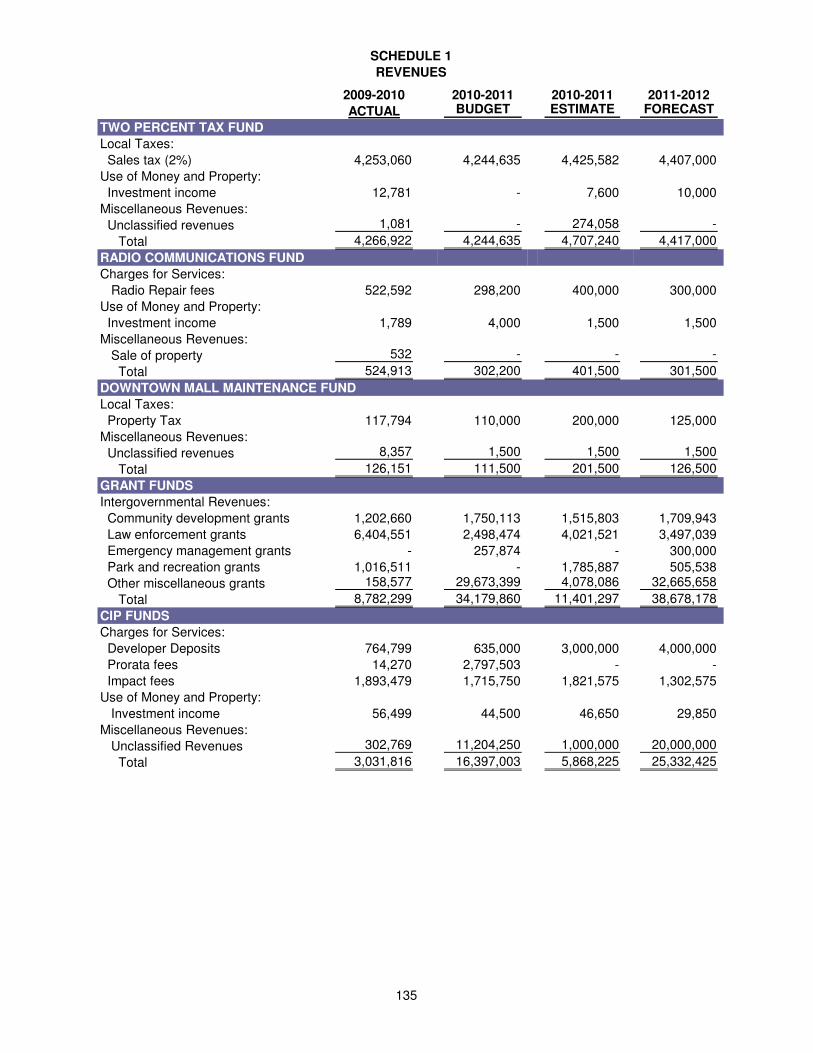
2009-2010 2010-2011 2010-2011 2011-2012
ACTUAL BUDGET ESTIMATE FORECAST
SCHEDULE 1
REVENUES
TWO PERCENT TAX FUND
Local Taxes:
Sales tax (2%) 4,253,060 4,244,635 4,425,582 4,407,000
Use of Money and Property:
Investment income 12,781 - 7,600 10,000
Miscellaneous Revenues:
Unclassified revenues 1,081 - 274,058 -
Total 4,266,922 4,244,635 4,707,240 4,417,000
RADIO COMMUNICATIONS FUND
Charges for Services:
Radio Repair fees 522,592 298,200 400,000 300,000
Use of Money and Property:
Investment income 1,789 4,000 1,500 1,500
Miscellaneous Revenues:
Sale of property 532 - - -
Total 524,913 302,200 401,500 301,500
DOWNTOWN MALL MAINTENANCE FUND
Local Taxes:
Property Tax 117,794 110,000 200,000 125,000
Miscellaneous Revenues:
Unclassified revenues 8,357 1,500 1,500 1,500
Total 126,151 111,500 201,500 126,500
GRANT FUNDS
Intergovernmental Revenues:
Community development grants 1,202,660 1,750,113 1,515,803 1,709,943
Law enforcement grants 6,404,551 2,498,474 4,021,521 3,497,039
Emergency management grants - 257,874 - 300,000
Park and recreation grants 1,016,511 - 1,785,887 505,538
Other miscellaneous grants 158,577 29,673,399 4,078,086 32,665,658
Total 8,782,299 34,179,860 11,401,297 38,678,178
CIP FUNDS
Charges for Services:
Developer Deposits 764,799 635,000 3,000,000 4,000,000
Prorata fees 14,270 2,797,503 - -
Impact fees 1,893,479 1,715,750 1,821,575 1,302,575
Use of Money and Property:
Investment income 56,499 44,500 46,650 29,850
Miscellaneous Revenues:
Unclassified Revenues 302,769 11,204,250 1,000,000 20,000,000
Total 3,031,816 16,397,003 5,868,225 25,332,425
135

2009-2010 2010-2011 2010-2011 2011-2012
ACTUAL BUDGET ESTIMATE FORECAST
SCHEDULE 1
REVENUES
DEBT SERVICE FUNDS
Special Assessments:
Principal 817,600 1,025,000 1,039,000 1,099,000
Interest 299,419 309,788 265,313 212,058
Use of Money & Property:
Investment income 3,002 2,000 - -
Total 1,120,021 1,336,788 1,304,313 1,311,058
ARROYO DUNES GOLF COURSE FUND
Charges for Services:
Green fees 226,615 258,677 236,500 246,500
Merchandise sales 1,271 1,744 1,000 1,000
Range fees 13,212 13,840 12,000 12,500
Use of Money and Property:
Equipment rents 10,248 11,108 9,429 9,429
Investment income 1,252 750 750 750
Miscellaneous Revenues:
Unclassified revenues 46 - - -
Total 252,644 286,119 259,679 270,179
DESERT HILLS GOLF COURSE FUND
Charges for Services:
Green fees 977,067 962,598 959,203 970,000
Merchandise sales 174,085 180,819 164,560 164,000
Liquor sales - - - -
Concession stand sales 507,404 600,434 517,000 517,000
Food sales - - - -
Range fees 54,110 59,116 50,000 50,000
Use of Money and Property:
Investment income 5 - - -
Equipment rents 338,811 352,727 336,403 336,400
Room rents 9,540 13,213 6,000 6,000
Miscellaneous Revenues:
Unclassified revenues 3,113 - 2,000 (2,000)
Total 2,064,135 2,168,907 2,035,166 2,041,400
SOLID WASTE FUND
Charges for Services:
Collection fees 1,859,698 3,025,000 2,942,000 3,095,000
Receptacles sales 13,585 12,000 11,000 11,000
Miscellaneous Revenues:
Unclassified revenues 5,458 5,000 5,000 5,000
Total 1,878,741 3,042,000 2,958,000 3,111,000
136

2009-2010 2010-2011 2010-2011 2011-2012
ACTUAL BUDGET ESTIMATE FORECAST
SCHEDULE 1
REVENUES
WATER FUND
Charges for Services:
Residential water fees 11,921,070 12,952,000 11,950,000 11,950,000
Commercial water fees 9,606,887 9,950,000 9,665,000 9,715,000
Fire hydrant fees 340,101 319,840 350,900 350,900
Service establishment fees 219,120 212,000 212,000 212,000
Use of Money and Property:
Investment income 97,475 75,000 75,000 75,000
Rental Income - - - -
Miscellaneous Revenues:
Unclassified revenues 192,936 146,704 145,625 142,812
Total 22,377,589 23,655,544 22,398,525 22,445,712
WASTEWATER FUND
Charges for Services:
Residential sewer fees 7,161,559 6,721,500 7,324,000 7,380,000
Commercial sewer fees 6,541,016 6,878,850 6,613,000 6,713,000
Developer deposits - - - -
Use of Money and Property:
Investment income 3,205 10,000 2,500 2,500
Miscellaneous Revenues:
Unclassified revenues 38,666 22,078 22,078 22,078
Total 13,744,446 13,632,428 13,961,578 14,117,578
WATER RESTRICTED FUNDS
Charges for Services:
Water capacity fees 1,419,736 998,500 1,000,000 1,000,000
Water system dev. fees 90,383 74,850 75,000 75,000
Use of Money and Property:
Bond proceeds - - - -
Investment income - Water Trfr 1,801 - 1,000 1,000
Investment income - Capacity (263) - 10,000 10,000
Investment income - System Dev (404) - - -
Investment income - Bonds 36,073 36,000 30,000 30,000
Miscellaneous Revenues:
Unclassified revenues - Water Trf 22 - - -
Unclassified revenues - System Dev 41 - - -
Total 1,547,389 1,109,350 1,116,000 1,116,000
137

2009-2010 2010-2011 2010-2011 2011-2012
ACTUAL BUDGET ESTIMATE FORECAST
SCHEDULE 1
REVENUES
WASTEWATER RESTRICTED FUNDS
Charges for Services:
Sewer capacity fees 1,691,797 1,498,000 4,558,000 1,498,000
Sewer system dev. Fees - SSIC 132,246 129,900 379,900 214,900
Sewer system dev. fees - Area A/B 500 - - -
Use of Money and Property:
Investment income - Capacity 52,643 30,000 12,000 12,000
Investment income - SSIC 2,392 - 200 200
Investment income - Area A/B 6,195 5,000 1,800 1,800
Investment income - 26th Pl Trunk 975 800 800 800
Investment income - Bonds 8,673 9,000 5,000 5,000
Miscellaneous Revenues:
Unclassified revenues - Capacity - 5,000,000 - -
Unclassified revenues - SSIC 52 500,000 - -
Total 1,895,473 7,172,700 4,957,700 1,732,700
EQUIPMENT REPLACEMENT FUND
Use of Money and Property:
Equipment rentals - - - -
Investment income 79,628 200,000 60,000 60,000
Miscellaneous Revenues:
Unclassified revenues 10,188 - - -
Total 89,816 200,000 60,000 60,000
EQUIPMENT MAINTENANCE FUND
Charges for Services:
Guaranteed maintenance 2,070,310 1,632,780 1,650,000 1,650,000
Non-guaranteed maintenance 306,563 64,750 300,000 300,000
Fuel sales 1,200,228 1,379,300 1,347,000 1,347,000
Use of Money and Property:
Investment income 4,520 - 1,500 1,500
Miscellaneous Revenues:
Unclassified revenues 2,202 - - -
Sale of property 548 - - -
Total 3,584,371 3,076,830 3,298,500 3,298,500
INSURANCE RESERVE FUND
Use of Money and Property:
Insurance Premiums 630,521 1,909,820 1,909,820 2,231,241
Investment income 7,970 5,000 853 1,500
Miscellaneous Revenues:
Unclassified revenues 34,866 27,500 113,186 16,000
Total 673,357 1,942,320 2,023,859 2,248,741
138

Actual Budget Estimate Budget
(By Fund/Dept)
OPERATIONAL EXPENDITURES
SCHEDULE 2
2011-20122010-20112010-20112009-2010
GENERAL FUND
249,953 249,203 251,277 250,524 MAYOR AND COUNCIL
1,464,016 1,498,003 1,452,783 1,532,254 MUNICIPAL COURTS
3,515,848 2,703,844 2,876,066 3,333,284 CITY ADMINISTRATOR'S OFFICE
1,195,179 1,236,418 1,145,850 1,289,543 CITY ATTORNEY'S OFFICE
2,443,867 2,546,003 2,431,674 2,352,034 INFORMATION TECH SERVICES
1,726,011 1,645,763 1,502,781 1,768,843 FINANCE
735,636 742,227 731,127 891,049 HUMAN RESOURCES
350,509 1,285,401 560,710 2,446,154 GENERAL GOVERNMENT
2,445,744 2,660,574 2,585,986 2,697,516 COMMUNITY DEVELOPMENT
- - - - UTILITIES
404,166 374,755 393,532 395,309 ENGINEERING
8,004,350 7,291,901 7,045,454 7,637,502 PARKS AND RECREATION
19,614,772 20,515,537 20,334,860 21,216,464 POLICE DEPARTMENT
10,862,785 13,147,371 11,080,030 13,180,281 FIRE DEPARTMENT
(4,442,642) (4,211,795) (4,211,795) (2,334,378)INTRACITY COST ALLOCATION
18,401 66,208 107,798 73,278 CAPITAL PROJECTS LABOR
48,588,593 51,751,413 48,288,133 56,729,657 TOTAL
COMMUNITY INVESTMENT TRUST
19,567 - - - GENERAL GOVERNMENT
19,567 - - - TOTAL
RIVERFRONT REDEVELOPMENT FUND
586,726 440,200 571,931 557,323 CITY ADMINISTRATOR'S OFFICE
586,726 440,200 571,931 557,323 TOTAL
GF SALES TAX REBATE
915,969 952,168 952,168 952,168 GENERAL GOVERNMENT
915,969 952,168 952,168 952,168 TOTAL
HIGHWAY USERS REVENUE FUND
- 20,844 - - GENERAL GOVERNMENT
5,907,801 6,533,986 6,461,642 5,476,316 PUBLIC WORKS DEPARTMENT
599,630 725,641 714,008 739,412 ENGINEERING
11,688 - 24,951 32,091 CAPITAL PROJECTS LABOR
6,519,119 7,280,471 7,200,601 6,247,819 TOTAL
139
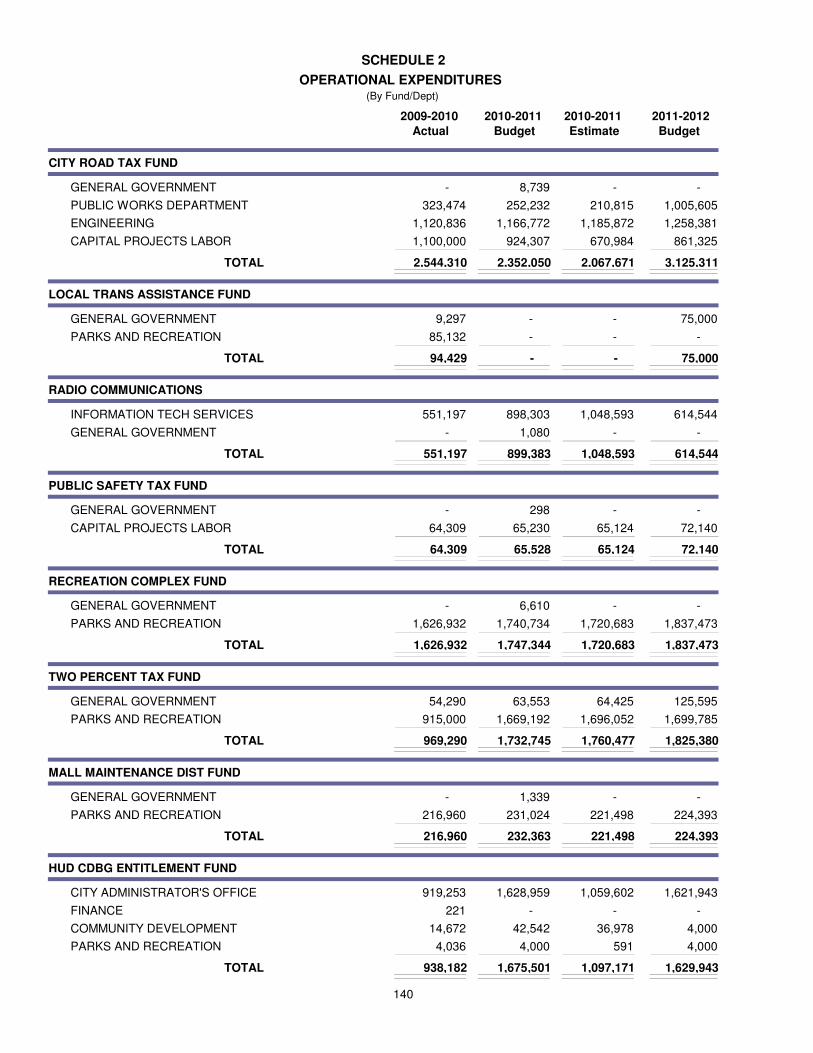
Actual Budget Estimate Budget
(By Fund/Dept)
OPERATIONAL EXPENDITURES
SCHEDULE 2
2011-20122010-20112010-20112009-2010
CITY ROAD TAX FUND
- 8,739 - - GENERAL GOVERNMENT
323,474 252,232 210,815 1,005,605 PUBLIC WORKS DEPARTMENT
1,120,836 1,166,772 1,185,872 1,258,381 ENGINEERING
1,100,000 924,307 670,984 861,325 CAPITAL PROJECTS LABOR
2,544,310 2,352,050 2,067,671 3,125,311 TOTAL
LOCAL TRANS ASSISTANCE FUND
9,297 - - 75,000 GENERAL GOVERNMENT
85,132 - - - PARKS AND RECREATION
94,429 - - 75,000 TOTAL
RADIO COMMUNICATIONS
551,197 898,303 1,048,593 614,544 INFORMATION TECH SERVICES
- 1,080 - - GENERAL GOVERNMENT
551,197 899,383 1,048,593 614,544 TOTAL
PUBLIC SAFETY TAX FUND
- 298 - - GENERAL GOVERNMENT
64,309 65,230 65,124 72,140 CAPITAL PROJECTS LABOR
64,309 65,528 65,124 72,140 TOTAL
RECREATION COMPLEX FUND
- 6,610 - - GENERAL GOVERNMENT
1,626,932 1,740,734 1,720,683 1,837,473 PARKS AND RECREATION
1,626,932 1,747,344 1,720,683 1,837,473 TOTAL
TWO PERCENT TAX FUND
54,290 63,553 64,425 125,595 GENERAL GOVERNMENT
915,000 1,669,192 1,696,052 1,699,785 PARKS AND RECREATION
969,290 1,732,745 1,760,477 1,825,380 TOTAL
MALL MAINTENANCE DIST FUND
- 1,339 - - GENERAL GOVERNMENT
216,960 231,024 221,498 224,393 PARKS AND RECREATION
216,960 232,363 221,498 224,393 TOTAL
HUD CDBG ENTITLEMENT FUND
919,253 1,628,959 1,059,602 1,621,943 CITY ADMINISTRATOR'S OFFICE
221 - - - FINANCE
14,672 42,542 36,978 4,000 COMMUNITY DEVELOPMENT
4,036 4,000 591 4,000 PARKS AND RECREATION
938,182 1,675,501 1,097,171 1,629,943 TOTAL
140

Actual Budget Estimate Budget
(By Fund/Dept)
OPERATIONAL EXPENDITURES
SCHEDULE 2
2011-20122010-20112010-20112009-2010
COMMUNITY REDEVELOPMENT FUND
224,333 332,502 281,287 50,000 CITY ADMINISTRATOR'S OFFICE
224,333 332,502 281,287 50,000 TOTAL
DOJ WEED & SEED INITIATIVE
26,389 - - - CITY ADMINISTRATOR'S OFFICE
3,011 - - - PARKS AND RECREATION
2,524 - - - POLICE DEPARTMENT
31,924 - - - TOTAL
APPROPRIATED GRANTS FUND
49,000 104,390 12,000 12,000 MUNICIPAL COURTS
1,556,671 3,024,568 2,478,935 2,363,453 CITY ADMINISTRATOR'S OFFICE
4,600 10,371 4,236 5,300 CITY ATTORNEY'S OFFICE
2,811,021 1,847,790 2,801,600 6,611,506 INFORMATION TECH SERVICES
- 126,110 76,110 125,000 GENERAL GOVERNMENT
5,607 - - - COMMUNITY DEVELOPMENT
- - 650 - PUBLIC WORKS DEPARTMENT
39,006 381,169 375,646 386,868 PARKS AND RECREATION
1,738,711 1,404,961 1,622,894 2,484,170 POLICE DEPARTMENT
25,416 1,249,625 1,003,598 1,557,938 FIRE DEPARTMENT
6,230,031 8,148,984 8,375,669 13,546,235 TOTAL
1995 REF MPC DEBT SERVICE FUND
2,814,745 2,585,645 2,590,645 2,587,945 DEBT SERVICE
2,814,745 2,585,645 2,590,645 2,587,945 TOTAL
2001 MPC DEBT SERVICE FUND
1,451,425 1,034,025 1,500 - DEBT SERVICE
1,451,425 1,034,025 1,500 - TOTAL
2007B MPC DEBT SERVICE FUND
2,298,470 2,293,220 2,294,720 2,286,970 DEBT SERVICE
2,298,470 2,293,220 2,294,720 2,286,970 TOTAL
2007D MPC DEBT SERVICE FUND
4,765,025 4,783,525 4,785,025 4,772,025 DEBT SERVICE
4,765,025 4,783,525 4,785,025 4,772,025 TOTAL
2010 MPC DEBT SERVICE FUND
419,562 - 2,533,793 2,528,581 DEBT SERVICE
419,562 - 2,533,793 2,528,581 TOTAL
141

Actual Budget Estimate Budget
(By Fund/Dept)
OPERATIONAL EXPENDITURES
SCHEDULE 2
2011-20122010-20112010-20112009-2010
SPECIAL ASSMT DIST 67 FUND
952,518 956,736 957,086 960,000 DEBT SERVICE
952,518 956,736 957,086 960,000 TOTAL
SPECIAL ASSMT DIST 68 FUND
377,800 382,280 382,630 384,955 DEBT SERVICE
377,800 382,280 382,630 384,955 TOTAL
CAPITAL PROJECTS FUND
- - 3,711 - CAPITAL PROJECTS LABOR
- - 3,711 - TOTAL
ARROYO DUNES GOLF COURSE FUND
- 1,037 - - GENERAL GOVERNMENT
267,672 250,461 226,510 277,983 PARKS AND RECREATION
267,672 251,498 226,510 277,983 TOTAL
DESERT HILLS GOLF COURSE FUND
- 6,048 - - GENERAL GOVERNMENT
1,884,951 1,941,541 1,816,861 2,052,710 PARKS AND RECREATION
1,884,951 1,947,589 1,816,861 2,052,710 TOTAL
SOLID WASTE FUND
- 5,659 - - GENERAL GOVERNMENT
2,875,999 2,773,790 2,766,144 2,727,370 PUBLIC WORKS DEPARTMENT
2,875,999 2,779,449 2,766,144 2,727,370 TOTAL
WATER FUND
- 31,908 - - GENERAL GOVERNMENT
20,766,896 23,272,205 23,233,499 22,936,118 UTILITIES
284,552 378,097 311,460 290,877 CAPITAL PROJECTS LABOR
21,051,448 23,682,210 23,544,959 23,226,995 TOTAL
WATER TRANSFER FUND
34,109 40,263 45,397 40,809 UTILITIES
34,109 40,263 45,397 40,809 TOTAL
WATER CAPACITY FUND
1,103,975 1,103,711 1,103,974 1,117,185 UTILITIES
1,103,975 1,103,711 1,103,974 1,117,185 TOTAL
142

Actual Budget Estimate Budget
(By Fund/Dept)
OPERATIONAL EXPENDITURES
SCHEDULE 2
2011-20122010-20112010-20112009-2010
WASTEWATER FUND
- 20,170 - - GENERAL GOVERNMENT
10,688,322 11,493,978 11,503,431 11,475,610 UTILITIES
67,236 63,708 79,758 65,267 CAPITAL PROJECTS LABOR
10,755,559 11,577,856 11,583,189 11,540,877 TOTAL
WASTEWATER CAPACITY FUND
2,978,527 2,978,488 2,978,488 2,978,488 UTILITIES
2,978,527 2,978,488 2,978,488 2,978,488 TOTAL
WASTEWATER SNTRY SWR INTC
6,537 6,568 6,568 6,568 UTILITIES
6,537 6,568 6,568 6,568 TOTAL
EQUIPMENT MAINTENANCE FUND
- 6,912 - - GENERAL GOVERNMENT
3,264,980 3,344,923 3,402,642 3,559,232 PUBLIC WORKS DEPARTMENT
3,264,980 3,351,835 3,402,642 3,559,232 TOTAL
INSURANCE RESERVE FUND
1,013,584 983,005 1,083,727 983,907 CITY ATTORNEY'S OFFICE
951,485 1,150,116 1,150,116 1,150,116 GENERAL GOVERNMENT
1,965,069 2,133,121 2,233,843 2,134,023 TOTAL
EQUIPMENT REPLACEMENT FUND
796 - - - CITY ADMINISTRATOR'S OFFICE
14,614 - 86,458 - INFORMATION TECH SERVICES
270,258 - - - PUBLIC WORKS DEPARTMENT
3,398 - - - PARKS AND RECREATION
- - 693,632 - POLICE DEPARTMENT
- - 1,592 - FIRE DEPARTMENT
18,594 2,759,718 9,718 2,787,202 GENERAL GOVERNMENT
307,659 2,759,718 791,400 2,787,202 TOTAL
129,697,900 142,258,389 137,700,091 153,457,304 Total Operational Budget
143

SCHEDULE 3
Fund/Cognizant 2010-2011 2010-2011 2011-2012
Department OUTSIDE AGENCY BY FUNCTION BUDGET ESTIMATE BUDGET
Economic Development
2%/City Admin Quartermaster Depot Contract 150,000$ 150,000$ 150,000$
2%/City Admin Yuma Visitors Bureau 650,000 650,000 650,000
General/City Attorney Lobbying 217,656 217,656 217,656
General/City Admin GYEDC 200,000 202,500 180,000
Water/Utility Admin GYEDC 22,500 22,500 20,000
2%/Parks&Rec Heritage Festivals (now division 5066-Heritage Events) 81,000 81,000 -
General/Mayor Greater Yuma Port Authority 55,000 55,000 50,000
General/City Admin Intergovernmental Public Transportation Authority (IPTA) - - 125,000
LTAF/City Admin IPTA - - 75,000
HURF/Public Works Yuma Metropolitan Planning Organization 248,426 248,426 77,843
Health and Welfare
General/Police Humane Society (now division 6011-Animal Control) 457,875 457,875 -
General/Police Catholic Services - Safe House 15,500 15,500 15,500
General/Police Amberly's Place 41,580 41,580 41,580
General/Police Crossroads Mission/Detox 27,000 27,000 27,000
Culture and Recreation
2%/Parks&Rec Yuma Fine Arts Assoc. 31,500 31,500 31,500 General/Parks&Rec Salvation Army Boys & Girls Club 5,400 10,800 -
TOTAL 2,203,437$ 2,211,337$ 1,661,079$
Listed by Function
2011-2012 OUTSIDE AGENCY SUMMARY
144

AUTHORIZED
PERSONNEL
MAYOR AND CITY COUNCIL
Executive Assistant 1 1 1
Administrative Specialist 1 - -
Department Total 2 1 1
MUNICIPAL COURT
Court Clerk 11 9 9
Court Specialist 1 1 1
Court Supervisor 1 - -
Lead Municipal Court Officer 1 1 1
Municipal Court Officer 4 4 4
Municipal Court Administrator 1 1 1
Legal Assistant 1 - -
Senior Customer Service Specialist 1 1 1
Custodian 1 - -
Department Total 22 17 17
CITY ADMINISTRATOR'S OFFICE
Administration
City Administrator 1 1 1
Executive Assistant 1 - 1
Deputy City Administrator 2 -
Economic Development Program Manager 1 - -
Training & Development Program Manager 1 -
Assistant to the City Administrator 1 -
C.I.P. Administrator - - 1
Management Analyst - 1 1
Management Intern 1 - -
Principal Customer Service Specialist 1 1 1
Division Total 9 3 5
Community Relations
Director of Public Affairs & Communications 1 1 1
Public Affairs Coordinator 1 1 1
TV Production & Operation Manager 1 1 1
Video Production & Operations Specialist 3 2 1
Management Analyst 1 1
Senior Customer Service Specialist 1 1 1
Division Total 8 6 6
Heritage Area Development
Exec Director YCNH Area Corp 1 1 1
CIP Project Manager 1 1 1
Grants Writer/City Archaeologist 1 1 1
Management Analyst - 1 -
Senior Customer Service Specialist 2 2 2
Division Total 5 6 5
2011-2012 AUTHORIZED STAFFING LEVEL
SCHEDULE 4
FY
09/10
FY
10/11
FY
11/12
145

AUTHORIZED
PERSONNEL
2011-2012 AUTHORIZED STAFFING LEVEL
SCHEDULE 4
FY
09/10
FY
10/11
FY
11/12
City Clerk
City Clerk 1 1 1
Deputy City Clerk 1 1 1
Administrative Specialist 1 1 1
Senior Customer Service Specialist 1 1 1
Division Total 4 4 4
Neighborhood Services
Neighborhood Services Manager 1 - -
Senior Neighborhood Specialist 1 1 1
Neighborhood Specialist 2 2 2
Code Enforcement Specialist 1 1 1
Housing Rehabilitation Technician 1 1 1
Senior Customer Service Specialist 3 2 2
Division Total 9 7 7
Economic Development
Economic Development Program Manager - - 1
Division Total - - 1
Facilities Maintenance
Facility Maintenance Manager 1 1 1
Facility Maintenance Supervisor 1
Lead Custodian 1 1 1
Building Maintenance Specialist 2 2 1
Senior Facility Maintenance Worker 1 1 -
Facility Maintenance Worker 1 1 -
Custodian 8 8 5
Division Total 14 14 9
Department Total 49 40 37
CITY ATTORNEY
City Attorney's Office
City Attorney 1 1 1
Deputy City Attorney 1 1 1
Assistant City Attorney 3 2 2
Real Property Agent 1 1 1
Risk Coordinator - 1 1
Administrative Legal Assistant 1 - -
Legal Assistant 4 2 2
Division Total 11 8 8
Prosecutor's Office
Assistant City Attorney/Prosecutor 1 1 1
Legal Assistant 1 1 1
Senior Customer Service Specialist 1 - -
Division Total 3 2 2
Department Total 14 10 10
146

AUTHORIZED
PERSONNEL
2011-2012 AUTHORIZED STAFFING LEVEL
SCHEDULE 4
FY
09/10
FY
10/11
FY
11/12
INFORMATION TECHNOLOGY SERVICES
Administration
Director of ITS 1 1 1
Assistant Director Business Applications 1 1 1
Assistant Director Telecommunications 1 1 1
Division Total 3 3 3
Technical Support
Network Engineer 1 1 1
Network Administrator 2 2 2
Wireless Services Administrator 1 1 1
GIS Administrator 1 1 1
GIS Analyst 1 1 2
Telecom Administrator 1 1 1
ITS Senior Business Applications Analyst 2 2 2
Police Technology Operations Coordinator 1 - -
Public Safety Computer Specialist 2 1 1
Technical Support Specialist 4 4 5
Computer Support Specialist 3 3 4
Computer Training Specialist 1 1 -
Technical Support Assistant 2 2 2
ITS Project Assistant 1 1 -
Help Desk Support Specialist 2 1 -
Web Development Administrator 1 1 1
CADD Technician 1 1 1
Senior GIS Technician 2 2 1
GIS Technician 1 1 1
Division Total 30 27 26
Radio Communications
Sr Wireless Communication Technician 1 1 1
Wireless Communication Technician 2 2 2
Division Total 3 3 3
Department Total 36 33 32
FINANCE DEPARTMENT
Administration
Finance Director 1 1 1
Budget Manager 1 1 1
Administrative Specialist 1 1 1
Division Total 3 3 3
Customer Services
Customer Service Supervisor 1 1 1
Tax & License Specialist 1 1 1
Senior Customer Service Specialist 1 1 1
Customer Service Specialist 3 3 3
Division Total 6 6 6
147

AUTHORIZED
PERSONNEL
2011-2012 AUTHORIZED STAFFING LEVEL
SCHEDULE 4
FY
09/10
FY
10/11
FY
11/12
Purchasing
Purchasing & Contracts Manager 1 1 1
Senior Buyer 2 1 1
Buyer 2 1 1
Senior Purchasing Clerk 1 1 -
Purchasing Clerk Specialist 3 2 3
Customer Service Specialist 1 - -
Inventory Control Specialist 1 - -
Mail Clerk 1 1 1
Division Total 12 7 7
Accounting
Accounting Manager 1 1 1
Accountant 3 3 4
Lead Accounting Specialist 2 2 2
Senior Accounting Specialist 2 2 2
Accounting Specialist 2 2 2
Division Total 10 10 11
Department Total 31 26 27
HUMAN RESOURCES DEPARTMENT
Human Resources
Human Resources Director 1 1 1
Employment Manager 1 - -
Human Resource Analyst 1 1 2
Human Resources Specialist - 1 1
Human Resource Technician 6 4 4
Risk Coordinator 1 - -
Training & Development Program Manager - 1 -
Environmental Program Coordinator - - 1
Safety & Environmental Specialist - 1 -
Senior Customer Service Specialist 1 1 1
Division Total 11 10 10
Risk Management
Environmental Program Coordinator 1 - -
Safety & Environmental Specialist 1 - -
Human Resources Technician 1 - -
Division Total 3 - -
Department Total 14 10 10
COMMUNITY DEVELOPMENT
Administration
Director Community Development 1 1 1
Senior Management Analyst 1 1 1
Division Total 2 2 2
148

AUTHORIZED
PERSONNEL
2011-2012 AUTHORIZED STAFFING LEVEL
SCHEDULE 4
FY
09/10
FY
10/11
FY
11/12
Building Safety
Building Official 1 1 1
Deputy Building Official 1 1 1
Building Plans Examiner 4 4 4
Building Inspection Field Supervisor 1 1 1
Combination Building Inspector 2 2 2
Building Inspector 7 4 4
Code Enforcement Specialist 2 2 2
Senior Permit Technician 1 1 1
Permit Technician 2 2 2
Senior Customer Service Specialist 1 1 1 Division Total 22 19 19
Community Planning
Planning Manager 1 1 1
Principal Customer Service Specialist 1 1 1
Senior Customer Service Specialist 2 1 1
Principal Planner 3 3 3
Associate Planner 1 1 1
Assistant Planner 3 3 3
Planning Technician 2 - -
Senior Planner 4 2 2 Division Total 17 12 12
Department Total 41 33 33
PUBLIC WORKS DEPARTMENT
Fleet Services
Fleet Manager 1 1 1
Equipment Maintenance Supervisor 1 1 1
Fleet Services Crew Leader 2 2 2
Senior Auto Equipment Mechanic 5 3 3
Auto Equipment Mechanic 7 6 6
Principal Customer Service Specialist 1 1 1
Mechanic Assistant 1 1 1 Division Total 18 15 15
Fleet Parts
Inventory Control Specialist 2 2 2
Parts Runner 1 - - Division Total 3 2 2
Solid Waste
Environmental Sanitation Service Crew Leader 1 1 1
Heavy Equipment Operator 12 9 8 Division Total 13 10 9
Uncontained Waste
Heavy Equipment Operator 2 1 2
Senior Street Maintenance Worker 1 1 1
Street Maintenance Worker 1 1 1 Division Total 4 3 4
149
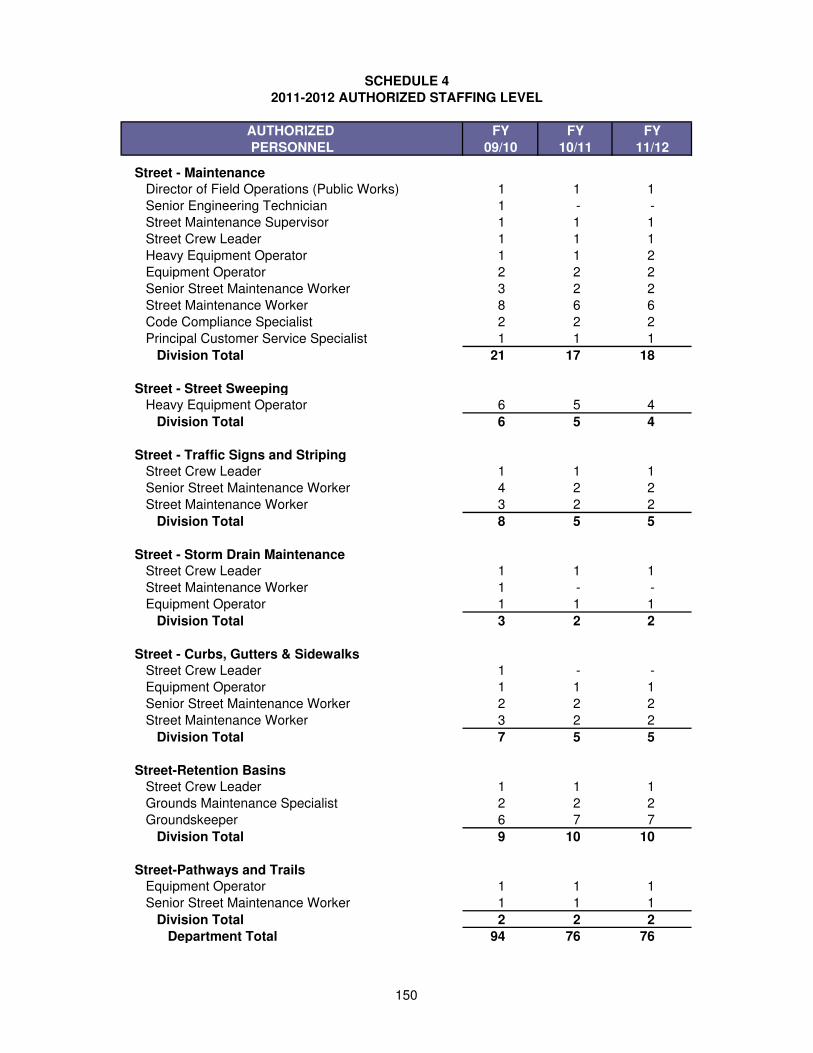
AUTHORIZED
PERSONNEL
2011-2012 AUTHORIZED STAFFING LEVEL
SCHEDULE 4
FY
09/10
FY
10/11
FY
11/12
Street - Maintenance
Director of Field Operations (Public Works) 1 1 1
Senior Engineering Technician 1 - -
Street Maintenance Supervisor 1 1 1
Street Crew Leader 1 1 1
Heavy Equipment Operator 1 1 2
Equipment Operator 2 2 2
Senior Street Maintenance Worker 3 2 2
Street Maintenance Worker 8 6 6
Code Compliance Specialist 2 2 2
Principal Customer Service Specialist 1 1 1
Division Total 21 17 18
Street - Street Sweeping
Heavy Equipment Operator 6 5 4
Division Total 6 5 4
Street - Traffic Signs and Striping
Street Crew Leader 1 1 1
Senior Street Maintenance Worker 4 2 2
Street Maintenance Worker 3 2 2
Division Total 8 5 5
Street - Storm Drain Maintenance
Street Crew Leader 1 1 1
Street Maintenance Worker 1 - -
Equipment Operator 1 1 1
Division Total 3 2 2
Street - Curbs, Gutters & Sidewalks
Street Crew Leader 1 - -
Equipment Operator 1 1 1
Senior Street Maintenance Worker 2 2 2
Street Maintenance Worker 3 2 2
Division Total 7 5 5
Street-Retention Basins
Street Crew Leader 1 1 1
Grounds Maintenance Specialist 2 2 2
Groundskeeper 6 7 7
Division Total 9 10 10
Street-Pathways and Trails
Equipment Operator 1 1 1
Senior Street Maintenance Worker 1 1 1
Division Total 2 2 2
Department Total 94 76 76
150

AUTHORIZED
PERSONNEL
2011-2012 AUTHORIZED STAFFING LEVEL
SCHEDULE 4
FY
09/10
FY
10/11
FY
11/12
UTILITIES DEPARTMENT
Administration
Utilities Director 1 1 1
Customer Service Supervisor 1 1 1
Principal Customer Service Specialist 1 1 1
Senior Customer Service Specialist 1 1 1
Customer Service Specialist 1 1 1
Division Total 5 5 5
Facility Maintenance
Senior Facility Maintenance Worker - - 1
Custodian - - 1
Division Total - - 2
Water - Administration
W/WW Treatment Manager 1 1 1
Utility Systems Division Manager 1 1 1
Senior Customer Service Specialist 1 1 1
Division Total 3 3 3
Water - Main Street Treatment Plant
W/WW Treatment Plant Supervisor 1 1 1
Chief W/WW Treatment Plant Operator 1 1 1
Senior W/WW Treatment Plant Operator 5 5 5
W/WW Treatment Plant Operator 4 4 4
Utility Security Patrol 2 - -
Groundskeeper 4 3 3
Chief W/WW Treatment Plant Mechanic 1 1 1
W/WW Treatment Plant Mechanic 3 3 2
W/WW Electronic Technician 1 1 1
Electrician 1 1 1
W/WW Electronic Technician Assistant 1 1 1
Senior Customer Service Specialist 1 1 1
Utility Compliance Specialist 1 1 1
Cross Connection Specialist 1 1 1
Senior Security Patrol 1 - -
Division Total 28 24 23
Water - Transmission/Distribution
Utility Systems Supervisor 1 1 1
Utility Systems Crew Leader 2 2 2
Utility Maintenance Technician 11 10 10
Senior Water Distribution Maintenance Tech 3 3 3
Utility System Modeler 1 1 1
Division Total 18 17 17
151

AUTHORIZED
PERSONNEL
2011-2012 AUTHORIZED STAFFING LEVEL
SCHEDULE 4
FY
09/10
FY
10/11
FY
11/12
Water - Customer Service
Customer Service Field Crew Leader 1 1 1
Meter Service Program Coordinator 1 1 1
Customer Service Field Representative 4 4 4
Meter Reader 3 2 2
Development Utility Rates Technician 1 1 1
Senior Customer Service Specialist 1 - -
Utility Rates Program Coordinator 1 1 1
Meter Repair Worker 1 1 1
Utility Inventory Specialist 1 1 1
Senior Meter Service Technician 1 1 1
Division Total 15 13 13
Water - Agua Viva Water Treatment Plant
Chief W/WW Treatment Plant Operator 1 1 1
Senior W/WW Treatment Plant Operator 1 1 2
Senior W/WW Treatment Plant Mechanic 1 1 1
W/WW Electronic Technician Assistant 1 1 1
W/WW Treatment Plant Mechanic 1 1 2
W/WW Treatment Plant Operator 4 4 3
Electrician 1 1 1
Electronics Technician 1 1 1
Groundskeeper 3 3 3
Division Total 14 14 15
Water - Laboratory
Lab Director 1 1 1
Lab Analyst 1 1 1
Division Total 2 2 2
Wastewater - Figueroa
W/WW Treatment Supervisor 1 1 1
Chief W/WW Treatment Plant Operator 1 1 -
SCADA & Instrumentation Supervisor - - 1
Senior W/WW Treatment Plant Operator 6 6 6
Groundskeepers 3 1 1
W/WW Treatment Plant Operator 4 4 4
Electrician 2 2 2
Chief W/WW Treatment Plant Mechanic 1 1 1
W/WW Treatment Plant Mechanic 4 4 4
Senior Customer Service Specialist 1 1 1
Utility Inventory Specialist 1 1 1
W/WW Electronic Technician 1 1 1
Division Total 25 23 23
Wastewater - Collection
Utility Systems Crew Leader 2 2 2
Utility Maintenance Technician 11 11 11
Senior WW Collections Maintenance Tech 2 2 2
152

AUTHORIZED
PERSONNEL
2011-2012 AUTHORIZED STAFFING LEVEL
SCHEDULE 4
FY
09/10
FY
10/11
FY
11/12
Division Total 15 15 15
Wastewater - Pretreatment
Water Quality Assurance Supervisor 1 1 1
Industrial Waste Inspector 2 2 -
Pretreatment Specialist 1 1 1
Industrial Pretreatment Inspector 1 1 3
Division Total 5 5 5
Wastewater - Desert Dunes
W/WW Treatment Plant Mechanic 1 1 1
Facilities Maintenance Worker 1 1 1
Senior W/WW Treatment Plant Operator 1 1 1
W/WW Treatment Plant Operator 1 1 1
Division Total 4 4 4
Wastewater - Laboratory
Chemist 1 1 1
Lab Analyst 1 1 1
Division Total 2 2 2
Department Total 136 127 129
ENGINEERING DEPARTMENT
Engineering Services
Director of Engineering 1 1 1
Engineering Field Supervisor 2 1 1
C.I.P. Project Manager 7 4 3
C.I.P. Administrator 1 1 -
Civil Engineer 1 - -
Traffic Engineer 2 1 1
Engineer in Training 1 1 1
Registered Land Surveyor 1 1 1
CADD Technician 2 1 1
Senior Engineering Technician 7 6 6
Engineering Technician 4 4 4
Senior Customer Service Specialist 1 1 1
Engineering Design Manager 1 1 1
Administrative Specialist 1 1 1
Development Fee Specialist 1 - -
Division Total 33 24 22
Development Engineering
Assistant City Engineer 1 1 1
Community Development Engineer 3 3 3
Civil Plans Examiner 1 - -
Senior Customer Service Specialist 1 - -
Division Total 6 4 4
153

AUTHORIZED
PERSONNEL
2011-2012 AUTHORIZED STAFFING LEVEL
SCHEDULE 4
FY
09/10
FY
10/11
FY
11/12
Street - Traffic Signals
Traffic Systems Supervisor 1 1 1
Assistant Traffic Engineer - - 1
Traffic Signal Technician 3 3 3
Senior Engineering Technician 1 1 1
Division Totals 5 5 6
Department Total 44 33 32
PARKS AND RECREATION DEPARTMENT
Administration
Director of Parks & Recreation 1 1 1
Assistant Director of Parks & Recreation 1 1 1
Park & Golf Course Superintendent 1 1 1
Recreation Superintendent 1 1 1
Customer Service Supervisor 1 1 1
Senior Customer Service Specialist 4 3 3
Arts & Culture Program Manager 1 1 1
Arts Specialist 1 1 1
Division Total 11 10 10
Parks Maintenance
Assistant Parks Superintendent 1 1 1
Grounds Maintenance Supervisor 3 1 1
HVAC Mechanic 1 1 -
Grounds Maintenance Crew Leader 8 8 8
Facility Maintenance Supervisor 1 - -
Building Maintenance Specialist 2 2 -
Senior Parks Equipment Mechanic 1 1 1
Parks Equipment Mechanic 1 1 1
Parks Construction Specialist 3 3 2
Grounds Maintenance Specialist 19 18 18
Groundskeepers 21 20 22
Division Total 61 56 54
Urban Forestry
Urban Forestry Supervisor 1 1 1
Groundskeeper 1 1 1
Division Total 2 2 2
Civic Center
Civic Center Operations Supervisor 1 1 1
Event Operation Leader 4 4 4
Building Maintenance Specialist 2 2 -
Custodian 1 1 -
Civic Center Booking & Event Supervisor 1 1 1
Civic Center Box Office/Event Specialist 1 1 1
Senior Customer Service Specialist 1 1 1
Division Total 11 11 8
154

AUTHORIZED
PERSONNEL
2011-2012 AUTHORIZED STAFFING LEVEL
SCHEDULE 4
FY
09/10
FY
10/11
FY
11/12
Baseball Complex
Grounds Maintenance Supervisor 1 1 1
Grounds Maintenance Crew Leader 1 1 1
Grounds Maintenance Specialist 1 - -
Groundskeeper 3 3 3 Division Total 6 5 5
Downtown Mall
Grounds Maintenance Specialist - - 1
Groundskeeper 3 3 1
Division Total 3 3 2
Recreation - General
Recreation Program Supervisor 5 4 4
Recreation Program Coordinator 2 2 2 Division Total 7 6 6
Aquatics
Aquatics Crew Leader 1 - -
Facilities Maintenance Worker - - -
Building Maintenance Specialist 2 2 - Division Total 3 2 -
Yuma Readiness & Community Center
Recreation Program Coordinator 1 1 1 Division Total 1 1 1
Arts and Culture
Arts Program Supervisor 1 - -
Theatre Production Coordinator 1 1 1
Arts Specialist 2 1 1
Senior Customer Service Specialist 2 2 2
Art Center Booking Sales Specialist 1 1 1
Events Operations Leader 1 1 1 Division Total 8 6 6
Facility Maintenance
HVAC Mechanic - - 1
Building Maintenance Specialist - - 6
Facility Maintenance Worker - - 2
Custodian - - 3 Division Total - - 12
Desert Hills Golf Course-Maintenance
Grounds Maintenance Crew Leader 1 1 1
Grounds Maintenance Supervisor 1 1 1
Senior Parks Equipment Mechanic 1 1 1
Parks Equipment Mechanic 1 - -
Grounds Maintenance Specialist 1 1 1
Groundskeeper 5 3 - Division Total 10 7 4
155

AUTHORIZED
PERSONNEL
2011-2012 AUTHORIZED STAFFING LEVEL
SCHEDULE 4
FY
09/10
FY
10/11
FY
11/12
Desert Hills Golf Course-Restaurant
Restaurant Supervisor 1 1 1
Assistant Restaurant Supervisor 1 - -
Kitchen Supervisor 1 1 1
Cook 1 1 1
Division Total 4 3 3
Desert Hills Golf Course-Pro Shop
Golf Shop Manager 1 - 1
Golf Professional 1 1 1
Assistant Golf Shop Manager 1 1 1
Customer Service Specialist 1 - 1
Division Total 4 2 4
Arroyo Dunes Golf Course-Maintenance
Groundskeeper 2 2 2
Division Total 2 2 2
Department Total 133 116 119
POLICE DEPARTMENT
Administration
Police Chief 1 1 1
Deputy Police Chief - 1 1
Police Captain - Field Services 1 1 1
Police Captain - Support Services 1 1 1
Police Captain - Investigations 1 1 1
Police Sergeant 1 1 1
Police Officer 1 1 1
Administrative Specialist 1 1 1
Senior Customer Service Specialist 1 1 1
Division Total 8 9 9
Patrol
Lieutenant 5 5 5
Sergeant 12 12 12
Corporal - - 12
Master Police Officer 8 8 9
Police Officer 91 86 76
Accident Investigator 5 5 5
Police Assistant 8 6 7
Principal Customer Service Specialist 1 1 1
Parts Runner 1 - -
Division Total 131 123 127
156

AUTHORIZED
PERSONNEL
2011-2012 AUTHORIZED STAFFING LEVEL
SCHEDULE 4
FY
09/10
FY
10/11
FY
11/12
Investigations
Police Lieutenant 2 2 2
Police Sergeant 4 4 4
Master Police Officer 6 3 7
Police Officer 27 21 18
Accident Investigator 1 1 1
Police Assistant - 1 -
Police Crime Analyst - 1 1
Senior Customer Service Specialist 1 1 1
Evidence Supervisor 1 1 1
Evidence Custodian 3 3 3
Police Identification Technician 4 4 4
Principal Customer Service Specialist 1 1 1
Division Total 50 43 43
Quality Assurance
Police Lieutenant 1 1 1
Police Sergeant 3 3 3
Corporal - - 1
Master Police Officer 1 1 1
Police Officer 8 4 4
Police Assistant 1 2 2
Senior Facility Maintenance Worker 1 1 -
Polygraph Examiner 1 1 1
Police Facility Maintenance Supervisor 1 1 -
Asst Police Facility Maintenance Supervisor 1 1 -
Custodian 3 2 -
Evidence Custodian - - -
Division Total 21 17 13
Records and Communications
Police Records Administrator - 1 1
Police Records Supervisor 2 - -
Police Crime Analyst 1 - -
Police Records Specialist 13 12 12
Customer Service Specialist 3 2 2
Division Total 19 15 15
Public Safety Communications Center
Police Lieutenant - - 1
Police Records & Communications Manager 1 1 -
911 Coordinator (YMPO funded) 1 - -
911 Emergency Dispatch Supervisor 5 4 4
911 Emergency Dispatcher 29 26 26
Senior Customer Service Specialist 1 1 1
Division Total 37 32 32
157

AUTHORIZED
PERSONNEL
2011-2012 AUTHORIZED STAFFING LEVEL
SCHEDULE 4
FY
09/10
FY
10/11
FY
11/12
Facility Maintenance
Senior Facility Maintenance Worker - - 1
Asst Police Facility Maintenance Supervisor - - 1
Custodian - - 2
Division Total - - 4
Department Total 266 239 243
FIRE DEPARTMENT
Administration
Fire Chief 1 1 1
Assistant Fire Chief 1 1 1
Fire Public Information/Education Specialist 1 1 1
Administrative Specialist 1 1 1
Senior Customer Service Specialist - 2 2
Division Total 4 6 6
Professional Services
Fire Battalion Chief 1 1 1
Fire Training Captain 2 2 2
Senior Customer Service Specialist 1 - -
Division Total 4 3 3
Suppression
Fire Battalion Chief 3 3 3
Fire Captain 24 25 26
Fire Engineer 24 24 24
Firefighter- EMT 51 56 57
Firefighter- CEP - 6 6
Senior Customer Service Specialist 1 - -
Customer Service Specialist 1 1 1
Fire Equipment Fleet Manager 1 1 1
Division Total 105 116 118
Community Risk Reduction
Fire Marshal 1 1 -
Deputy Fire Marshal 1 1 1
Fire Inspector 3 2 2
Fire Battalion Chief - - 1
Senior Customer Service Specialist 1 - -
Fire Code Plans Examiner 1 - -
Fire Public Information/Education Specialist - - -
Division Total 7 4 4
Department Total 120 129 131
CITY TOTAL 1002 890 897
158

SCHEDULE 5 Budget Resolution
159
RESOLUTION NO. R2011-14
A RESOLUTION OF THE CITY COUNCIL OF THE CITY OF YUMA, ARIZONA, ADOPTING ESTIMATES OF PROPOSED EXPENDITURES BY THE CITY OF YUMA FOR THE FISCAL YEAR BEGINNING JULY 1, 2011, AND ENDING JUNE 30, 2012; DECLARING THAT SUCH SHALL CONSTITUTE THE ADOPTED BUDGET OF THE CITY OF YUMA FOR SUCH FISCAL YEAR; DECLARING NECESSITY OF BOARDS AND COMMISSIONS; AND AUTHORIZING EMPLOYMENT OF OUTSIDE LEGAL COUNSEL
WHEREAS, pursuant to the provisions of the laws of the State of Arizona and the Charter and Ordinances of the City of Yuma, the City Council is required to adopt a Budget; and, WHEREAS, the City Council has prepared and filed with the City Clerk a proposed Budget for the Fiscal Year beginning July 1, 2011, and ending June 30, 2012, and which was tentatively adopted on June 1, 2011; and, WHEREAS, due notice has been given by the City Clerk, as required by law, that the Budget for Fiscal Year 2011-2012 with supplementary schedules and details is on file and open to inspection by anyone interested; and, WHEREAS, it appears that the sums to be raised by primary taxation, as specified therein, do not in the aggregate amount exceed that amount as computed in Section 42-17051, Arizona Revised Statutes; and, WHEREAS, the total of amounts proposed for expenditure in the Fiscal Year from July 1, 2011, to June 30, 2012, do not exceed the expenditure limitation established for the City of Yuma; and, WHEREAS, a public hearing has been held on this Budget for Fiscal Year 2011-2012, as required by law; and, WHEREAS, the Yuma City Charter requires, at Article IX, Section 1, that the City Council annually review all current Boards and Commissions and determine whether such are necessary; and, WHEREAS, the Yuma City Charter states that the City Council shall have control of all litigation of the city, and may employ other attorneys to take charge of any litigation or to assist the City Attorney therein. NOW, THEREFORE, BE IT RESOLVED by the City Council of the City of Yuma as follows: SECTION 1: That the City Council has finally determined the estimates of expenditures which will be required of the City of Yuma for the Fiscal Year beginning July 1, 2011 and ending June 30, 2012. SECTION 2: That the Purposes of Expenditure and the amount finally determined upon for each purpose as set forth in Exhibits A through F attached hereto constitutes the official and finally adopted Budget of the City and the Main Street Mall and Offstreet Parking Maintenance District No. 1 for the 2011-2012 Fiscal Year as subject to the State Budget Law.

SCHEDULE 5 Budget Resolution
160
SECTION 3: That money from any fund may be used for any of the purposes set forth in SECTION 2, except money specifically restricted by State Law or City Charter, Ordinance or Resolutions. SECTION 4: That all current City Boards and Commissions are necessary for the public health, safety and welfare of the City and should be continued. SECTION 5: That the City Attorney is authorized to employ outside legal counsel to take charge of any litigation or to assist the City Attorney. Adopted this 15th day of June 2011. APPROVED: Alan L. Krieger Mayor ATTESTED: Lynda L. Bushong City Clerk APPROVED AS TO FORM Steven W. Moore City Attorney

COUNTY OF: YUMA TAX AUTHORITY: CITY OF YUMA
Construction 11,483,272
SECTION A. 2010 ACTUAL LEVY
A.1 2009 MAXIMUM ALLOWABLE PRIMARY TAX LEVY LIMIT 9,864,144
A.2 LINE A.1 MULTIPLIED BY 1.02 EQUALS 10,061,427
SECTION B. 2011 NET ASSESSED VALUE OF ALL PROPERTY
SUBJECT TO TAXATION IN 2010
B.1 CENTRALLY ASSESSED 30,599,323
B.2 LOCALLY ASSESSED REAL 560,993,198
B.3A LOCALLY ASSESSED MOBILE 8,059,327
B.3B LOCALLY ASSESSED PERSONAL PROPERTY 25,158,035
B.4 TOTAL OF B.1 THROUGH B.3 EQUALS 624,809,883
B.5 B.4 DIVIDED BY 100 EQUALS 6,248,099
SECTION C. 2011 NET ASSESSED VALUES
C.1 CENTRALLY ASSESSED 31,425,171
C.2 LOCALLY ASSESSED REAL 570,083,993
C.3A LOCALLY ASSESSED MOBILE (PR YR) 9,566,517
C.3B LOCALLY ASSESSED PERSONAL PROP (PR YR) 25,217,474
C.4 TOTAL OF C.1 THROUGH C.3 EQUALS 636,293,155
C.5 C.4 DIVIDED BY 100 EQUALS 6,362,932
SECTION D. 2011 LEVY LIMIT CALCULATION
D.1 ENTER LINE A.2 10,061,427
D.2 ENTER LINE B.5 6,248,099
D.3 DIVIDE D.1 BY D.2 AND ENTER RESULT 1.6103
D.4 ENTER LINE C.5 6,362,932
D.5 MULTIPLY D.4 BY D.3 AND ENTER RESULT
LINE D.5 EQUALS 2010 ---- MAXIMUM ALLOWABLE LEVY LIMIT 10,246,229
D.6 ENTER EXCESS PROPERTY TAXES COLLECTIBLE PURSUANT
TO ARS 42-17051, SECTION B -
D.7 ENTER AMOUNT IN EXCESS OF EXPENDITURE LIMITATION
PURSUANT TO ARS 42-17051, SECTION C -
D.8 LINE D.5 MINUS LINE D.6 AND LINE D.7 EQUALS
2010 ALLOWABLE LEVY 10,246,229
SCHEDULE 6
2011 LEVY LIMIT WORKSHEET
161

162
Glossary
Actual vs. Budgeted: Difference between the amounts projected (budgeted) in revenues or expenditures at the beginning of the fiscal year and the actual receipts or expenses, which are incurred by the end of the fiscal year. Assessed Value/Valuation: Value of real and personal property determined by the County Assessor and Arizona Department of Revenue upon which property taxation is based. Bonds: Debt instruments that require repayment of a specified principal amount on a certain date (maturity date), and interest at a stated rate or according to a formula for determining the interest rate. Bond Rating: An evaluation of a bond issuer’s credit quality and perceived ability to pay the principal and interest on time and in full. Budget: A plan of financial operation for a specific time period. The budget contains the estimated expenditures needed to continue the City’s operations for the year and the anticipated revenues to finance them. Budgetary guidelines: Recommendations on budgeting issued by the National Advisory Council on State and Local Budgeting (NACSLB). The NACSLB’s budgetary guidelines are chiefly of interest to accountants because of the emphasis they place on performance measurement in the context of the budgetary process. Capital Improvement Program (CIP): A plan for capital expenditures needed to maintain and expand the public infrastructure. It projects these infrastructure needs for ten years and is updated annually to reflect the latest priorities. The first year of the CIP is adopted with the City’s operating budget. Capital Outlay: Items that cost more than $5000 and have a useful life of more than two years. CIP: See Capital Improvement Program. Contingency: An appropriation of funds to cover unforeseen events that may occur during the fiscal year, such as natural emergencies, shortfalls in revenue and similar events. Debt Service: Principal and interest payments on outstanding bonds. Enterprise Funds: Funds that are accounted for in a manner similar to a private business with the intention to cover their costs through user fees. The City has four enterprise funds: Arroyo Dunes Golf Course, Desert Hills Golf Course, Water, and Wastewater. Estimate: The most recent estimate of current year revenue and expenditures. Expenditure: Current operating expenses.
Fiscal Year (FY): The period designated by the City for the beginning and ending of financial transactions. The fiscal year for the City of Yuma begins July 1 and ends June 30. Full-time Equivalent Position (FTE): A position converted to the decimal equivalent of a full-time position based on 2,080 hours per year. For example, an employee may be split 50% between two divisions, thus .5 in one division and .5 in the other. Fund: A fiscal and accounting entity with a self-balancing set of accounts recording cash and other financial resources. Fund Balance: A balance or carry over that occurs when actual revenues exceed budgeted revenues and/or when actual expenditures are less than budgeted expenditures. The beginning fund balance is the residual funds brought forward from the previous fiscal year. Generally Accepted Accounting Principles (GAAP): Uniform minimum standards of financial accounting and reporting that govern the form and content of basic financial statements. Governmental Funds: Funds that house tax-supported activities; i.e., General Fund, Special Revenue Funds, Debt Service Funds, and Capital Projects Funds. Grant: A contribution by a government unit or funding source to aid in the support of a specified function. Infrastructure: Facilities that support the continuance and growth of a community. Examples include roads, water lines, and sewers. Internal Service Funds: Fund that provides goods or services to another department, agency or government on a cost-reimbursement basis. The City has three internal service funds: Equipment Maintenance, Equipment Replacement, and Insurance Reserve. Modified Accrual Basis of Accounting: Basis of accounting according to which (a) revenues are recognized in the accounting period in which they become available and measurable and (b) expenditures are recognized in the accounting period in which the liability is incurred, if measurable, except for unmatured interest on general long-term debt and certain similar accrued obligations, which should be recognized when due. Operating Budget: Day-to-day costs of delivering city services and estimates of revenues to be collected that comprise the City’s financial affairs for a fiscal year. Operating Expenses: The cost of personnel, materials and equipment required for a department to function.

163
Operating Revenue: Funds received as income to pay for ongoing operations. For example, taxes, user fees, interest earnings, and grants. Personal Services: Expenditures for salaries and fringe benefits for employees. Primary Tax: Property tax levied for government operating budgets. Arizona statutes limit the primary property tax levy amount. Property Tax: A tax based on the assessed value of property, both real property (land and buildings) and personal property (equipment). The total property tax levied by a municipality. Arizona’s municipal property tax system is divided into a primary and secondary rate. Proprietary Funds: Funds that are focused on changes in net assets, operating income, financial position, and cash flow; i.e., Enterprise Funds and Internal Service Funds. Reappropriation (Rebudget): The inclusion of a balance from the prior year’s budget as part of the budget of the subsequent fiscal year. Reappropriation is common for encumbrances outstanding at the end of a fiscal year that a government intends to honor in the subsequent fiscal year. Reserved fund balance: The portion of a governmental fund’s net assets that is not available for appropriation. Revenue: Financial resources received from taxes, user charges and other levels of government. Secondary Tax: Property tax used to pay general obligation debt of the government. Arizona statute limits the overall amount of general obligation debt but, unlike primary property tax, does not limit on the tax itself, as the secondary tax is based on voter-approved debt issuance.
Special Revenue Fund: A fund used to account for receipts from revenue sources that have been earmarked for specific activities. For example, Highway User Revenue funds must be used for street maintenance. State-Shared Revenue: Includes the City’s portion of the state sales tax revenues, state income tax receipts, and Motor Vehicle In-Lieu taxes. Supplemental: A request to add a position to the authorized staffing list and all associated costs with that position. Tax Levy: The total amount of the general property taxes collected for purposes specified in the Tax Levy Ordinance. Tax Rate: The amount of tax levied for each $100 of assessed valuation. Transfer: Movement of resources from one fund into another fund in which the resources are expended. For example, an interfund transfer would include the transfer of operating resources from the General Fund to the Capital Projects Fund, where long-term capital expenditures are recorded. Other examples include a transfer from the General Fund to the Solid Waste Fund, as user charges in Solid Waste are not sufficient to cover the cost of services and general revenues must be used (subsidy). Undesignated Fund Balance: Funds remaining from prior year that are available for appropriation and expenditure in the current year. User Charges: The payment of a fee in direct receipt of a public service by the party who benefits from the service.

164
City of YUMA