city of woodinville, wa report to the city council avenue ... · pdf filecity of woodinville,...
TRANSCRIPT
• To: B: Sub·ect:
CITY OF WOODINVILLE, WA
REPORT TO THE CITY COUNCIL 17301 133rd Avenue NE, Wood inville, WA 98072 WWW.Cl.WOODINVILLE.WA.US
Honorable City Council Date: 03/07/2017
FINANCIAL ACTION SUMMARY Ex enditure Re uired roved
ISSUE: Shall the City Council receive the Treasury Report for January 2017?
RECOMMENDATION: To receive the Treasury Report for the month of January 2017.
BACKGROUND/DISCUSSION: Revenues and expenditures are reported through January 2017 (4% of the biennium).
Total Operating Revenues The City received $855,800 in operating revenues in January which were $188,000, or 28%, more than forecast.
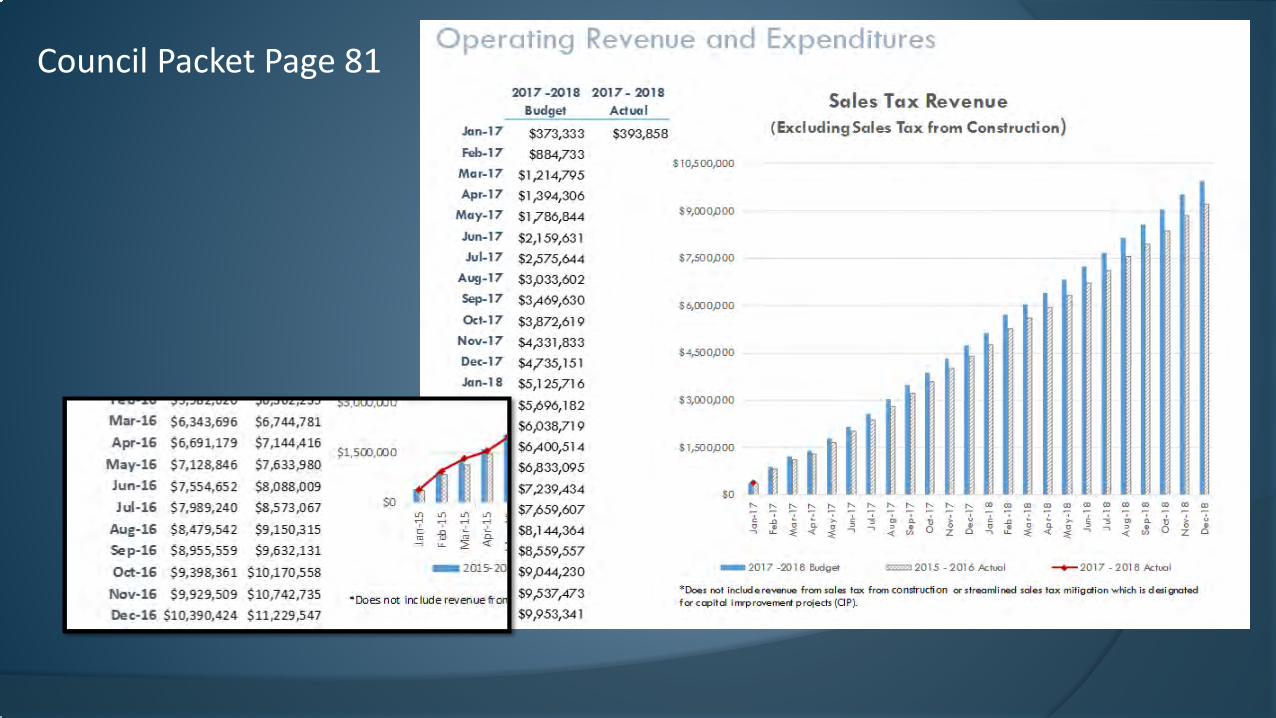
Primary Operating Revenues January 2017 Sales Tax revenues used for operations were $393,900, a $32,000, or 9% increase over January of 2016. Sales tax from Retail Trade contributed $17,200 to the increase, due to higher sales in furniture and home furnishings and beer, wine and liquor stores. Sales tax from Accommodation and Food Services increased by $7,200, or 13%, mainly because of new restaurants. Sales tax from Wholesale Trade and Manufacturing both grew at the modest rate of 2%.
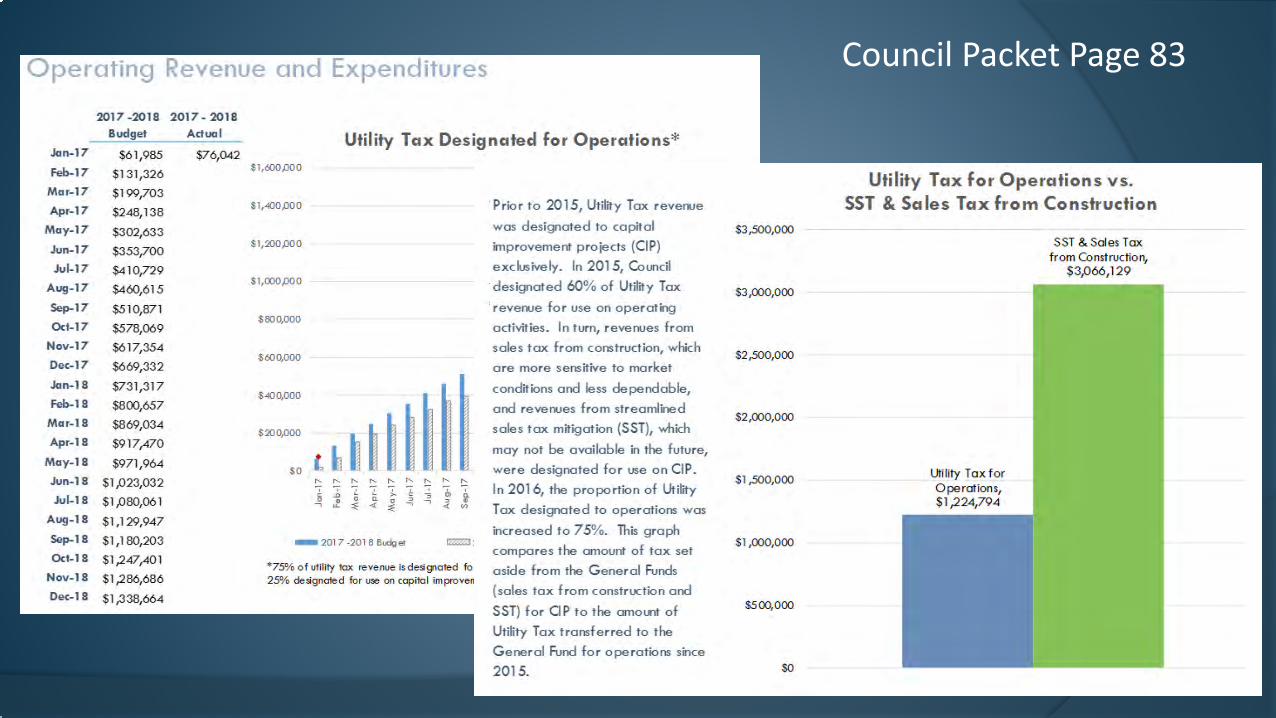
Utility Tax revenues designated for operating activities totaled $76,000 in January, $14,100 more than anticipated due to December receipts received in January.
January 2017 Property Tax revenues were $3,000, as forecast.
Development Services revenues were $102,300 higher than forecast in January, due to the timing of significant projects.
Park & Recreation revenues were $38,300, $6,300, or 19. 7% higher than forecast.
The City received $7,000 in revenue from Business License fees in January.
Capital Project Revenues Utility Tax revenues designated for capital projects totaled $26,200 in January, $5,500 more than anticipated due to December receipts received in January.
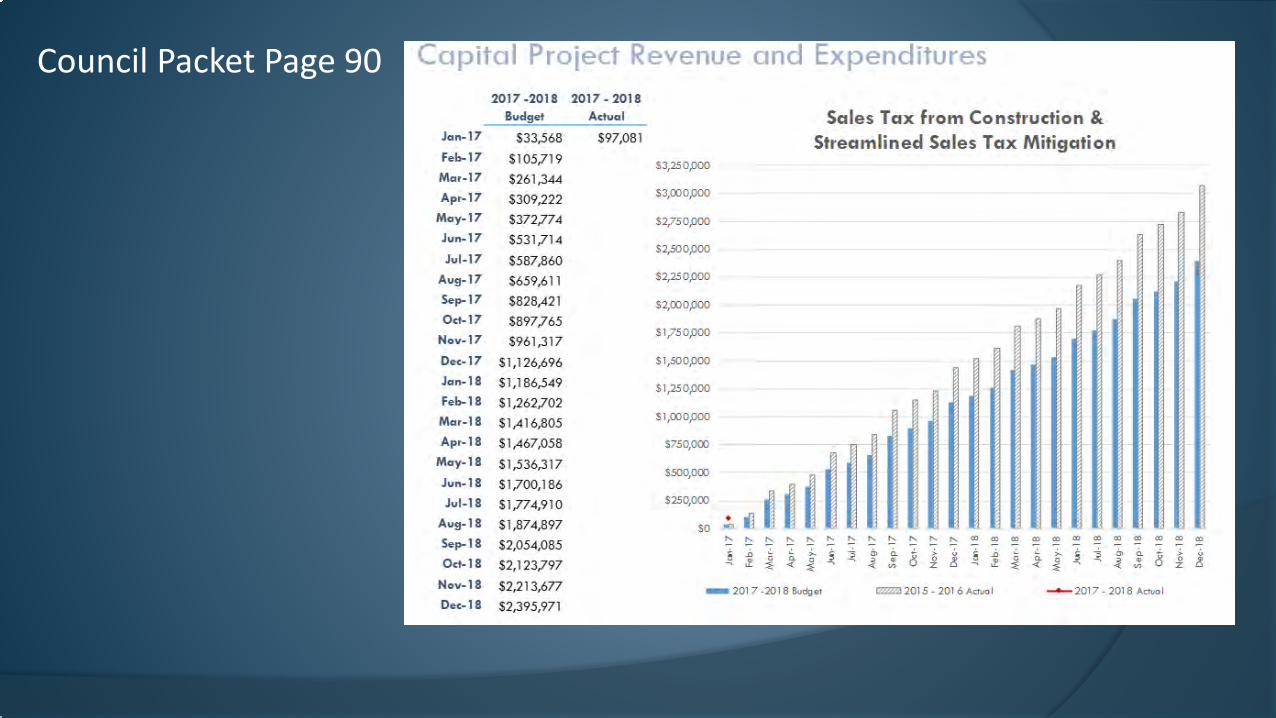
Sales Tax from Construction revenues were $97,100 in January, $20,500, or 27%, more than January of 2016.
The City received $108,900 in Real Estate Excise Tax (REET I & II) in January.
The City received $295,900 in Traffic Impact fees in January, $230,000 more than anticipated due to the timing of a significant development. As forecast, no Park Impact fee revenue, other than interest, was received in January.
Expenditures Operating Expenditures were $624,523 in January, 9.5%, or $65,400, lower than forecast.
RECOMMENDED MOTION: I MOVE TO RECEIVE THE JANUARY 2017 TREASURY REPORT.
77

Bl
Attachment 1: January 2017 Treasury Report
TREASURY REPORT
January 2017
79
City of Woodinville, Washington 17301 133rd Avenue NE
Woodinville, Washington 98072

08

Operating Revenue and Expenditures
2017 -2018 2017. 2018 Budget Actual
Jan-17 $373,333 $393,858 Feb-17 $884,733
Mar-17 $1,2 14,795 Apr-17 $1,394,306
May-17 $1,786,844 Jun-17 $2,159,631
Jul-17 $2,575,644 Aug-17 $3,033,602
Sep-17 $3,469,630 Oct-17 $3,872,619
Nov-17 $4,331,833 Dec-17 $4,735,151
Jan- 18 $5,125,716 Feb-18 $5,696,182
Mar-18 $6,038,719 Apr-18 $6,400,514
May-18 $6,833,095 Jun- 18 $7,239,434
Jul-18 $7,659,607 Aug- 18 $8,144,364 Sep-18 $8,559,557 Oct- 18 $9,044,230
Nov- 18 $9,537,473 Dec-18 $9,953,341
2017 -2018 2017. 2018 Budget Actual
Jan-17 $2,975 $2,982 Feb- 17 $22,259 Mar- 17 $95,810
Apr-17 $859,418 May-17 $1,596,021
Jun-17 $1,606,009 Jul-17 $1,612,589
Aug-17 $1,617,241 Sep-17 $1,652,74 1
Oct-17 $2,260,843 Nov-17 $3,082,087 Dec-17 $3,093,908
Jan-18 $3,097,411 Feb-18 $3,124,349
Mar-18 $3,195,423
Apr- 18 $3,902,462
May-18 $4,726,705 Jun- 18 $4,737,310
Jul- 18 $4,742,865
Aug- 18 $4,758,096 Sep-18 $4,803,410
Oct- 18 $5,393,364
Nov- 18 $6,165,1 27
Dec-18 $6,201,956
$10,500,000
$9,ooopoo
$7,500POO
$6,ooopoo
$4,500,000
$3,000,000
$1,500poo
$0 fl ~ j
Sales Tax Revenue (Excluding Sales Tax from Construction)
~~,~~u !::: !::: !::: !::: " ~ " " " " " CX) CX) co to CX)
J, ~ ~ ;.. c ~ &, a. 8 > u § J, 0 ll. >-" 0 ~ ~ " 0 "' l a u. ~ <(
~ "' z 0 ~ <( ~
CX) to CX) CX) co
c ~ 6, ii 8 ~ ~ .. "'
- 2017 -20 18 Budget =2015 -2016 Actua l --2017 - 2018 Actual
to
> 0 z
*Does not include revenue from sales tax from construction or streamlined sales tax mitigation which ls designated for capital imrprovement p rojecn(CIP).
Property Tax Revenue
$6,750,000
$6,000,000
$5,250,000
$4,500,000
$3,750,000
$3,000,000
$2,250,000
$1,500,000
$750,000
$0 ~ - J~~~H " !::: !::: !::: !::: " " " !::: " " " a, CX) ~ ~ to to CX) CX) co to co ~ j J, ~ ~ >- c ~ &, ii v > u ii J, 0 a. >- c ~ 6, ii .!. > ~ " 0 ~ ~ " 0 " .f j ~ :, "
u 0 u. ~ <( ~ "' 0 z 0 ~ <( <( 1/) 0 z 0
- 2017 -2018 Budget = 2015 - 201 6 Aclval --2017 - 2018 Actual
81
a,
~ 0

Operating Revenue and Expenditures
Jan- 17
Feb-17
Mar-17
Apr-17
May-17
Jun-17
Jul-17
Aug-17
Sep-1 7
Od-17
Nov-17
Dec- 17
Jan-18
Feb-18
Mar- 18
Apr- 18
May- 18
Jun- 18
Jul-18
Aug-18
Sep-18
Oct-18
Nov-18
Dec-18
Jan-17
Feb-1 7
Mar- 17
Apr-17
May-17
Jun-17
Jul- 17
Aug- 17
Sep- 17
Od-17
Nov-17
Dec-17
Jan-18
Feb-18
Mar-18
Apr- 18
May-18
Jun- 18
Jul-18
Aug-18
Sep-18
Od-1 8
Nov-18
Dec- 18
2017 -2018 2017 - 2018 Budget Adual
$37,894
$188,695 $140,082 $2,750,000
Development Services Revenue from Permits, Licenses & Fees*
$215,612
$273,974
$330,81 1
$420,219
$588,653
$660,354
$783,041
$832,422
$899,951
$942,909
$981,254
$1,078,921
$1,174,637
$1,230,057
$1,278,277
$1,379,356
$1,425,393
$1,479,353
$1,539,685
$1,643,762
$1,993,642
$2,136,580
2017-2018 2017 - 2018 Budget Adual
$31,970 $38,277
$36,587
$64,487
$68,71 1
$75,800
$133,106
$141,925
$147,534
$166,310
$168,826
$171,372
$205,875
$237,845
$242,462
$270,362
$274,586
$281,675
$338,981
$347,800
$353,409
$372,185
$374,701
$377,247
$4 11 ,750
$2,500,000
$2,250,000
$2,000,000
$1,750,000
$1,500,000
$1,250,000
$1,000,000
$750,000
$500,000
$250,000
$0 ~ ~~~~~1 !::: !::: !::: !::: !::: !::: !::: §~~i~§~ ~u.::;:<::;:~
- 2017-2018 Budget
""'""'"coco co CO ~ 00 CO ~ CO CO 00 -- - -- - - - - - - - - - - -I I I I I I I I I I I I I I I I
I ! 8 l ~ ] ~ "°'>-§;i0>Q.8>U ~ l ~ ~ ~ ~ ~ ~
r= 2015 • 2016 Acrual --201 7 • 2018 Actual
*Does not include revenue received for tree mitigation which is budgeted for use on capital projects.
Parks and Recreation Revenue
$450,000
$400,000
$350,000
$300,000
$250,000
$200,000
$150,000
$100,000
$50,000
$0 L~~u " " !::: !::: !::: " !::: !::: !::: !::: " !::: "' CX) CX) CX) CX) "' CX) CX) CX) CX) CX) a,
6 J, 0 ~ " c 3 g> ~ t; > u ii J, ~ a. " c 3 &, a. ~ > u ., a , ~ 0 ., ., a a ,
~ ~ ., 0 ~
~ u. ::;: < ::;: ~ < V) 0 z 0 ~ u.. ::;: < ::;: ~ V) z
- 2017 -2018 Budget = 2015. 2016 Actual* --2017 . 201 8 Actual
82

Operating Revenue and Expenditures
2017 -2018 2017 • 2018 Budget Actual
Jan-17 $61,985 $76,042
Feb-17 $131,326
Mar-17 $199,703
Apr-17 $248,138
May-17 $302,633
Jun-17 $353,700
Jul-17 $410,729
Aug-17 $460,615
Sep-17 $510,871
Oct- 17 $578,069
Nov-17 $617,354
Dec-17 $669,332
Jon-18 $731,317
Feb-18 $800,657
Mar-18 $869,034
Apr-18 $917,470
Moy-18 $971,964
Jun-18 $1,023,032
Jul-18 $1,080,061
Aug-18 $1,129,947
Sep-18 $1,180,203
Od-18 $1,247,401
Nov-18 $1,286,686
Dec-18 $1,338,664
· Prior to 2015, Utility Tax revenue
was designated to capital
improvement projects (CIP)
exclusively. In 2015, Council
· designated 60% of Utility Tax
' revenue for use on operating
activities. In turn, revenues from
sales tax from construction, which
are more sensitive to market
conditions and less dependable,
and revenues from streamlined
safes tax mitigation (SST), which
may not be available in the future,
were designated for use on CIP.
In 2016, the proportion of Utility
Tax designated to operations was
increased to 75%. This graph
compares the amount of tax set
aside from the General Funds
(sales tax from construction and
SST) for CIP to the amount of
Utility Tax transferred to the
General Fund for operations since
2015.
Utility Tax Designated for Operations* $1,600POO
$1,400POO
$1,200,000
$1,000,000
$800,000
$600,000
$400,000
d~~~~u $200,000
$0
" ~ ~ ~ " " " " " " " ~ CD CD ~ CD CD CD CD CD CD CX) ~
i J, 0 ii :,.. ] ~ &, Q. u > ~ i ;, l ii :,.. ] ~ &, Q. 8 >
" 0 ~ .. 0 0 .. ~ 0 ~ " 0 u. ~ < ~ < "' z 0 u. < ~ < "' z
- 2017 -2018 Budget c::::::1201 s -2016 Actual --2017 - 2018 Actual
*75% of utility tax revenue is designated for operating activities. This g raph does not include the 25% designated for use on capital Improvement projeds.
$3,500,000
$3,000,000
$2,500,000
$2,000,000
$1,500,000
$1,000,000
$500,000
$0
Utility Tax for Operations vs. SST & Sales Tax from Construction
83
SST & Sales Tax from Construction,
$3,066,129
~
~ 0
Operating Revenue and Expenditures
2017 -2011 2017 - 2011 llc,dget Adual
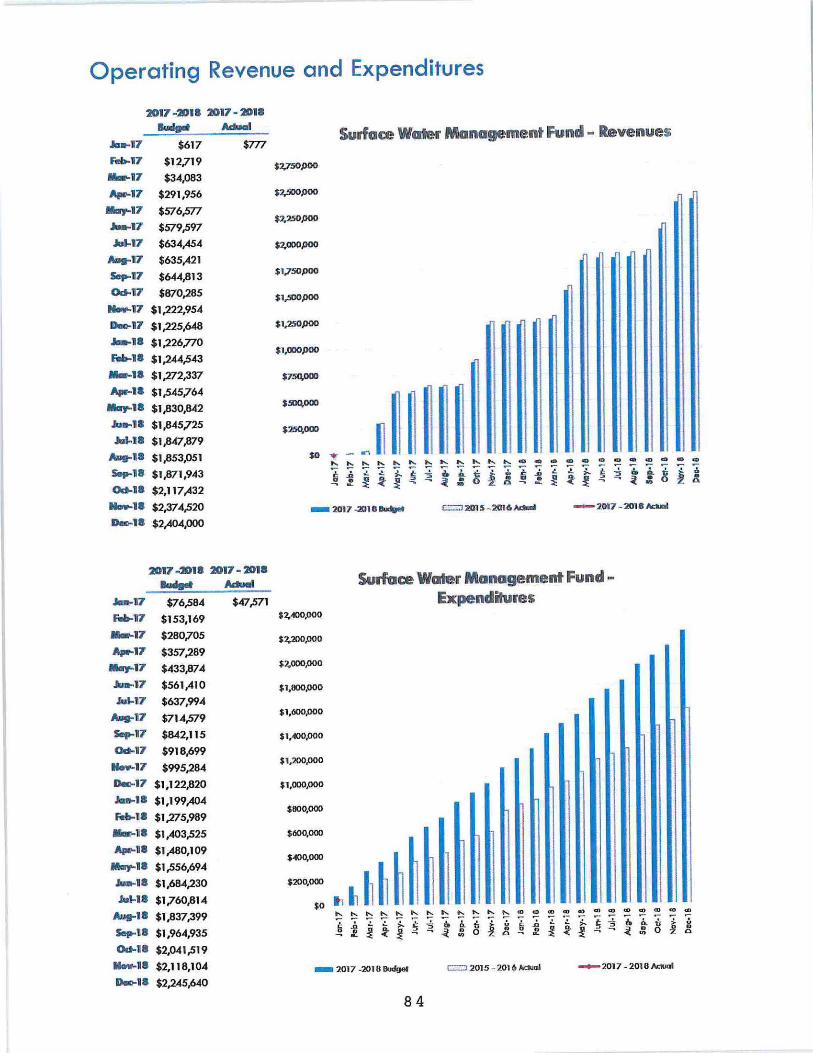
Ja•17 $617
Feb-17 $12719 ..... 7 $34,083 Apa-17 $291,956
.,..17 $576,5Tl
Ju•17 $579,597 Jul-17 $634,.454
Aug-17 $635,.421
Sep-17 $644,813
Od-17 $870,285
..... ,7 $1,222,954
Deo-17 $1,225,648
Ja..11 $1,226770
Feb-18 $1,244,543
.... ,. $1,272,337
Apa-18 $1,545764 ...,..11 $1,830,842
Jra..11 $1,845725
Jml-11 $1,847,879
Aug-II $ 1,853,051
Sep-18 $1,871,943
Od-18 $2,117 ,.432
..... , . $2,374,520
Deo-18 $2,404,000
$777
2017 -2018 2017 - 2018 ...... Ja..17 $76,564
Feb-17 $153,169
..... 7 $280705 Apa-17 $357,289
...,..17 $433,874
.Jw..17 $561,410 A,1-17 $637,994
Aug-17 $714,579 Sep-17 $842,115
Od-17 $918,699
..... 17 $995,284
0.-17 $1,122,820
JD.II $1,199,404
Fcb-18 $1,275,989
---·· $1,403,525 Apa-18 $1,480,109 .,...8 $1,556,694
..... 11 $1,684,230
Jul-US $1760,814
Aus-11 $1,837,399
Sep-18 $1,964,935
Od-11 $2,041,519
..... 1. $2,118,104
0.-18 $2,245,640
Adual
$47,571
$2,750.000
$2,500.000
$1,250.000
$?.000.000
$1,750.000
$1,500.000
$1,250.000
$1,000.000
$750,000
Surface Water Management Fund - Revenues
=: . - J~~~~~ ~ ~ ~ t,.,, t-.. ~ ~ ~ ~ ~ ~ ~ e ~ • ~ • ~ • m C e e ~
i~ LL ~ j~~~t~~£A L L~j~~~~ ~ ~ ~ .f i ~ i ~ ~ ~ : o I & ~ ~ I ~ t ~ ~ ~ : o I &
- 2017 -201ea....,. c==i 21n s - 2016.A4ml --2017 - 2018Al:Mll
$1.«>0,000
$2,.200,000
$1.000,000
$1,000,000
$1,600,000
$1,«>0,000
$1,200,000
$1,000,000
$800,000
Surface Water Management Fund -Expenditures
~ ~~~~~H ..... ..... ..... "' cO «> co ~ ~ ~ ~ ~ ~ ~ ~ ~
L >,. C "5 Q O. t;>:, t ! .:! ~ ~ : 0 ~ ~
.... ..... t,.,, ..... ..... t,... t,,.. .....
~~LL~ ~.::: ~ o ,ejt { ~.:!~
b.~1-;;;i~L : 0 z ~ - .f 1
- 2017 -2018 Budget = 201 5 - 201 6 Adual
84
- 20 17-2018Aduol

Operating Revenue and Expenditures
2017 -2018 2017- 2018 Budget Adual
Jan-17 $667,787 $855,791 Feb-17 $1,616,277
Mar-17 $2,31 1,016 Apr-17 $3,759,909
May- 17 $5,423,465 Jun-17 $6,176,447 Jul-17 $7,067,937
Aug-17 $7,844,441 Sep-17 $8,695,583 Od-17 $10,191 ,717
Nov- 17 $12,077,652 Dec- 17 $12,784,921 Jan-18 $13,476,282 Feb-18 $14,432,730
Mar- 18 $15,232,995 Apr-18 $16,829,045
May- 18 $18,614,638 Jun-18 $19,429,405 Jul-18 $20,128,338
Aug-18 $20,912,452 Sep-18 $21,689,463 Od-18 $23,340,433
Nov-18 $25,460,882 Dec- 18 $26,340,489
2017 -2018 2017- 2018 Budget Adual
Jan-17 $689,880 $624,523 Feb-17 $1 ,253,246
Mar-17 $1 ,944,685 Apr-17 $2,630,893
May-17 $3,550,597 Jun-17 $5,599,320 Jul-17 $6,573,491
Aug-17 $7,495,741 Sep-17 $8,698,679 Od-17 $9,672,573
Nov-17 $10,874,129 Dec- 17 $ 12,300,502 Jan-18 $ 1 3, l 22,049 Feb-18 $13,716,484
Mar-18 $14,355,972 Apr-18 $15,360,240
May-18 $15,923,395
Jun-18 $18,033,370 Jul-18 $19,063,314
Aug-18 $19,975,962
Sep-18 $20,979,879 Od-18 $21,859,32 1
Nov- 18 $23,126,628 Dec-18 $24,932,749
Operating Revenue
Revenue from the General*, Street, Park & Recreation, Development Services**, Admissions Tax**, Hotel Motel, Surface Water Management & Internal Service Funds
$27,000,000
$24,000,000
$21,000,000
$18,000,000
$ 15,000,000
$12,000,000
$9,000,000
ti dd~U $6,000,000
$3,000,000
$0
" " " !::, " " " " " " " " a, ~ a, a, a, a, a, CX) a, "' a,
] .0 c i,_ ,;.. I, ~
6, a. 8 ~ /, § .0 ~ l ,;.. c ~
I,, a. ~ ~ ~ o ~ ~ " 0 .. ,f a. 0 ~ ~ .. 0 ~ < ~
.,, z C, ~ < ~ < .,, z - 2017 -2018 Budget =2015 . 2016Actua l -- 2017 · 201 8 Actua l
• Includes 75%, of utility tax revenues designated for operations. Does not include revenues from sales tax from construction or streamlined soles tax mitigation. ••ooes not include revenue restricted for use on capita l projects.
Operating Expenditures Expenditures from the General*, St reet, Park& Recreation, Development Services, Admissions Tax**, Hotel Motel, Surface Water Management, Debt Service & Internal Service Funds
$24,000,000
$21,000,000
$18,000,000
$1 5,000,000
$12,000,000
$9,000,000
$6,000,000
~ ~~~~ ,1 ~~ $3,000,000
$0
" !::, ~ " " " " " !::, " ] .0 ,;.. c b, 0. ~ ,f c Q_ o ~ ~ ~ .. 0 ~ < ~ < .,,
- 2017 -2018 Budget =2015. 2016 Actual
COCOCQCDCD~
:; ~0..0~r-o>V " " o" < "' z
-- 2017 · 2018 Actual
*General Fund expenditures do not include amount expended on property acquisitions. **Admissions Tax amounts do not include $256,463 budgeted For sports fie ld replacement.
85
a,
/,
" C,
Operating Revenue and Expenditures
Jan-17
Feb-17
Mar-17
Apr-17
May- 17
Jun-17
Jul-17
Aug-17
Sep-17
Od- 17
Nov- 17
Dec-17
Jan-18
Feb-18
Mar-18
Apr-18
May-18
Jun-18
Jul-18
Aug-18
Sep-18
Od-18
Nov-18
Dec-18
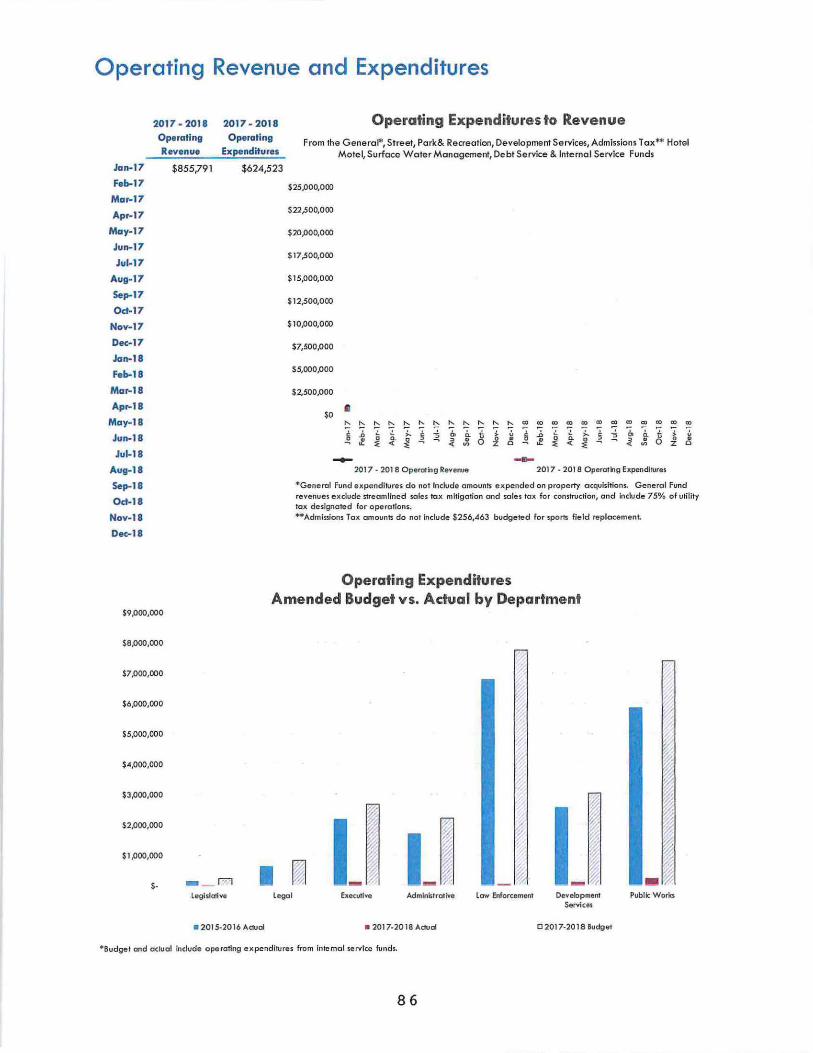
2017 - 201 8 2017 - 2018 Operating Operating Revenue Expenditures
$855,791 $624,523
Operating Expenditures to Revenue From the General*, Street, Park& Recreation, Development Services, Admissions Tax** Hotel
Motel, Surface Water Management, Debt Service & Internal Service Funds
$25,000,000
$22,500,000
$20,000,000
S 17 ,S00,000
$15,000,000
$12,500,000
$10,000,000
$7,500,000
$5,000,000
$2,500,000
$0 I
" 1 ~ -
!:::: !:::: !:::: !:::: " " " " " .D ~ .!. ;... 1 3
6, ";" ";" of D
~ ~ ~ ! 8 ~ ~
2017 - 2018 Operoting Revenue
" " "' ; u 1 0 u z 0 ~ -"' "' "' "' co "' co "' "' "' "' J, ~ ~ }. 5 "5 6, a. ~ > ~ ,f ~ D ~ ~ .. 0
<( ~ ~
"' z 0
2017 - 2018 Operoting Expenditures
*General Fund expendltures do not include amounts expended on property acquisitions. General Fund revenues exclude streamlined sales tax mitigation a nd soles tax for construction, and include 75% of utility tax designated for operations. **Admissions Tox amounts do nol include $256,463 budgeted for sports field replacement.
Operating Expenditures Amended Budget vs. Actual by Department
$9,000,000
SS,000,000
$7,000,000
$6,000,000
$5,000,000
$4,000,000
$3,000,000
$2,000,000
$1,000,000
$-
_ _ m
legislative
I ~ Lego!
a 2015-2016 Actual
I f 7'. I ~ ti ~ .
0 y, ./. _ ,,, _ ., ..
Executive Administrative
a 2017-2018 Actual
*Budget and actual Include operating expenditures from Internal service funds.
86
~ (
~ ;/
low Enforcement
I r:.,, % -~ ~ f -Development
Servicts
o 2017-2018 audget
~ ~ "' h
/
i
~·· f ~ ~ ~ :;: :?; * t
• Ip Public: Works

Operating Revenue and Expenditures
_pperating Re~enues ~-~d Expenditures .. Budget to Actual
20 17-2018 ThruJanuary 0 Operating Revenue Amended Budget 2017 Yo of Budget
General Fund
Property Tax $ 6,201,95_6 $ 2,982 0% Sales Tax* $ 9,953,341 $ 393,~58 4% Other Taxes $ 662,180 $ 33_!158 5% Cable TV / Licenses $ 588,178 $ 52,720 9% Grants/ Intergovernmental $ 400,716 $ 22,091 6% Other Charges for Services $ 582,303 $ 4,288 1% Fines/ !v\is~ellaneous $ 563,567 $ 39,306 7%
Subtotal General Fund $ 18,952,241 $ 548,703 3%
Other Operating Sources
Surface Water Fees $ 2!404,000 $ 777 0% Gas & Multimodal Transportation Tax $ 527,825 $ 18,774 4% Utility Tax $ 1,332,664 $ 76,042 6% Development Services** ~ 2,136,580 $ 140,082 7% Porks & Recreation $ 411?50 $ 38,277 9% Hotel Motel $ 191_,400 $ 5,541 3% Equ(pment Replacement $ 200 $ 0% Equipment Rental $ 116,200 $ 508 0% Unemp_loyment $ ?5,380 $ 7 0% Admission T ox** $ 202,250 $ 27,079 13%
Subtotal O~her Op Fund~ $ 7,388,249 $ 307,087 4% Total Operating Revenue $ 26,340,490 $ 855,791 3%
2017 -2018 Thru January Operating Expend itures A d d B d
20 % of Budget
men e u gel 17
General Fund*** $ Street Fund*** $ Development ~ervices $ Surfoc_e Water Mo_nogement*** $ Porks & Recreation $ Equipment Rental*** $ Unemployment $ Hotel Motel $ Total Operating Expenditures $
Debt Service $
15,2~6,729
?,07~,72~ ~,029,631 ?,241 ,64_0 1!173,600
120,000
60,000
164,000 24,148,320
784,429
$ $
~ $ $ $ $ $ $
327,569 62,628
125,833
17,551 58,425
2,517
624,523
$0
2%
3% 4% 2%
5% 2%
0% 0%
3%
0%
*Excludes sales tax from construction and streamlined sales tax mitigation revenue which has been designated for capital prefects.
**Excludes revenue restricted for capital p rojects.
***Ex cludes transfers out and/ o r e xpenditures for capital outla y and property acquisition.
87

Capital Proiect Revenue and Expenditures
Jan-17
Feb-17
Mar- 17
Apr- 17
May-17
Jun-17
Jul-17
Aug- 17
Sep-17
Od-17
Nov-17
Dec- 17
Jan-18
Feb-18
Mar-18
Apr-1 8
May-18
Jun-18
Jul-18
Aug-18
Sep-18
Od-18
Nov-18
Dec-18
Jan- 17
Feb-17
Mar-17
Apr-17
May-17
Jun-17
Jul-17
Aug-17
Sep-17
Od-17
Nov-17
Dec-17
Jan- 18
Feb-18
Mar- 18
Apr- 18
May-18
Jun-18
Jul- 18
Aug- 18
Sep-18
Od- 18
Nov- 18
Dec- 18
2017 -2018 2017 • 2018 Budget Adual
Real Estate Excise Tax I & II $57,796 $108,916
$115,592 $3,SOOPOO
$173,389 $3,250,000
$231,185 $3,000,000
$288,981
$346,777 $2,750,000
$404,573 $2,SOOPOO
$462,370 $2,250,000
$520,166
$577,962 $2,ooopoo
$635,758 $1,750,000
$693,554 $1,soopoo $751,351
$1,250P OO $809,147
$866,943 $1,000,000
$924,739 $750,000
$982,535
$1,040,332
$1,098,128
$ 1,155,924
$1,213,720
$1,271,516
$500,000
$ 250,000
$0 u~ " !::, " " !::, " !::, " !::, ..... " !::, .. a) a) a) co .. a) a, (I) CD .. ~ J, i ii. ;,. § :i C> Q. 8 > ~ 1 .D ~ ~ ,.. 5 "3 C> Q. ~ >
of 0 ~ ~ u 0 .. 0 0. 0 ~ ~ J! 0 ~ <( ~
~ <( "' z 0 ~ LL ~ <( ~ ~ <( z
$ 1,329,313 - 2017 . 201 a Budget = 2015 • 2016 Acluol --2017 • 2018 Acluol
$1 ,386,000
2017-2018 2017 • 2018 a - · Adual Utility Tax Designated for Capital Proiects* _ Budget
$20,662
$43,775
$66,568
$82,713
$100,878
$117,900
$136,910
$153,538
$1 70,290
$192,690
$205,785
$223,111
$243,772
$266,886
$289,678
$305,823
$323,988
$341,011
$360,020
$376,649
$393,401
$415,800
$4 28,895
$446,221
$26,209 $700,000
$600,000
$500,000
$400,000
$300,000
::::: t ~ ~ ~~I ~ ~ ~ ~ ~ ~ ~ ~ ~ ~ ~ ~ oo oo oo oo oo ~ m m m m .. 1 ~ ~ ~ i 1 ~ ~ i ~ ~ : 1 ~ ~ ~ i 1 ~ ~ l ~ /,
t>oa. -. c, 011 .,oa.c -.:,v • ~ LL ~ <( i ~ J v, Q Z O ~ LL ~ <( ~ ~ <( v, 0
- 2017 ·2018 Budget = 2015 · 2016 Aclual --2017 · 2018 A<luo l
* 25% of utility tax revenue is d esignated for capltal improvement projects. This graph do es not include 7 5% desginated for ape ration activites.
88
.. u u
0

Capital Proiect Revenue and Expenditures 2017 -2018 2017-2018
Budget Adual
Jan-17 $0 $34
Feb-17 $0
Mar-17 $0
Apr-17 $2,533
May-17 $179,826
Jun-17 $197,555
Jul-17 $425,504
Aug-17 $438,168
Sep-17 $663,584
Od-17 $666,116
Nov- 17 $681,313
Dec-17 $701,575
Jan-18 $901,663
Feb-18 $926,991 Mar-18 $987,777 Apr-18 $1,010,572
May-18 $1,033,367
Jun- 18 $1,056,162
Jul- 18 $1,078,957
Aug-18 $1,101,752
Sep-18 $1 ,122,014
Od- 18 $1,142,276
Nov-18 $1,162,538
Dec- 18 $1,182,800
2017 -2018 2017 • 2018 Budget Adual
Jan-17 $66,677 $295,922
Feb-17 $66,677
Mar- 17 $66,677
Apr- 17 $66,677
May-17 $207,457
Jun-17 $209,827
Jul-17 $477,482
Aug-17 $479,536
Sep-17 $625,372
Od-1 7 $641,172
Nov-17 $641,883
Dec- 17 $643,147
Jan-18 $792,617
Feb-18 $794,197
Mar- 18 $834,014
Apr-18 $983,800
May-18 $986,486
Jun- 18 $989,172
Jul-18 $991,858
Aug-18 $994,544
Sep-18 $995,808
Od-18 $997,072
Nov-18 $998,336
Dec- 18 $999,600
$1,300,000
$1,200,000
$1,100,000
$1,000,000
$900,000
$800,000
$700,000
$600,000
$500,000
$400,000
$300,000
$200,000
$100,000
$0 ... I " !:::
! J,
" ....
~]U !::: !::: " " .!. a. ,;.. j 0 0 :E <( :E
- 2017 -2018 Budget
Park Impact Fees
" " !::: " ~ Cl 0. i
~ " 0 V)
!::: CD CD CD ~ u ii J, ~ ~
" of 0 0. 0 :E <(
m:::'Zl 2015 - 2016 Actual
Traffic Impact Fees
$1,050,000
$900,000
$750,000
$600,000
$450,000
$300,000 •
S 150,000 uuU $0
" !::: ~ " " " ~ " " " ~ !::: CD CD "' C: J, a. ,;.. i ~ Cl 0. 8 > " C: J, a. ~ of 0 0 ~ " 0 " ~ of :E <( :E V) z 0 <(
- 2017 -20 18 Budget = 2015 - 2016 Acluol
89
CD CD CD CD CD CD -,;.. i i I,, 0. 8 0 ~ " :E <( V,
--. 2017 - 2018 Acluol
~ "' a, "' a, CD a, a,
,;.. 1 ~ I,, 0. i > u 0 ~ " 0 0 " :E <( "' z 0
--. 2017 - 2018 Acluol

Capital Proiect Revenue and Expenditures 2017 -2018 2017. 2018
Budget Actual Sales Tax from Construction & Jan-17 $33,568 $97,081 Streamlined Sales Tax Mitigation Feb-17 $105,719 $3,250,000
Mar-17 $261,344 Apr-17 $309,222 $J,ooo.ooo
May-17 $372,774 $2,750,000
Jun-17 $531,714
Jul-17 $587,860 S2,500.000
Aug-17 $659,611 $2,2so,ooo
Sep-17 $828,421 $2,000,000
Od-17 $897,765 $1,750,000
Nov-17 $961,317
De<:-17 $1 ,1 26,696 s 1,soo,000
Jan·-18 $1,186,549 s1,2so,ooo
Feb-18 $1,262,702 Mar-18 $1,416,805 Sl,OOO,OOO
Apr-18 $1,467,058 $750,ooo ~ ~ May-1 8 $1,536,317 ssoo,ooo
Jun-18 $1700,186
''"" $.:774,910 "'""' • JI j] ~ ~ Aug-18 $1,874,897 $O .., 11 IJ 11 IJ II
~ ~ ~ ~ ~ ~ ~ ~ ~ ~ ~ ~ ~ ~ ~ ~ ~ ~ m ~ ~ ~ ~ m Sep-18 $2,054,085 1 1, .:. .:. .... 5 ""5 I,, 0. i; > u /; 1, .:. .:. .... 5 ;; I,, 0. i; > u
Od-18 $2 123 797 ~ J! { ~ { ~ ~ i .,: o ~ ~ ~ l ! ~ J ~ ~ i Jl o ~ ~ ' '
Nov-18 $2,213,677 - 2017 -2018 Budget =201s. 2016Actuol --2017 • 2018 Actual
De<:0 18 $2,395,971
90

Capital Proiect Revenue and Expenditures
Capital Projed Revenue Sources• Budgeted Receipts to Actual Source 2017- 2018 Budget Biennium lo Dale % of Budget·
Rea! Estat~ Excise Tax I & II Sales Tax fro111 Construction and Stream_lined Sales Tax Mitigation Utility Tax Tree f,\itlgatlon Admissions Tax Parks Levy Floog L~vy_ Park lrJlP.act Fees T raffle Impact Fees Grants ~lsc;:ellaneous <;:IP R~venu~/lnterfund Charges for Services
Total Capital Projects Revenu~ - - ---- --·· Capital Project Expenditures - Budgeted UHs to Actual
$ l ,.38t,,OOQ $108,916 8% $2,395,971 $97,QSl 4% . $452,221 $J6,209 6%
_$0 $0 0% $256,4(;>3 $19,686 4%
$60,000 $0 0% $120,099 $0 O°lo
$1,182,800 $34 0% $999,600 $295,922 30%
$7,657,600 $0 Qr., $559,200 $767 0%
$15,069,855 $539,614 4%
Pro·ect 2017- 2018 Budget Biennium to Dale % of Budget
Street ~ Side~lk ?roj~s 2015/ 2016 Carryover,
Trestle Replacement/ Widening on SR 202 Corridor - Design / $tudy $100,000 $0 0% NE 171 st Stre~t Urban Parkway lmprovem~nts/133rd Roundabout $5,000,000 $0 0% SR 522/NE 195th St Intersection lnt~rim lmprqv~ment_s-Design $20,000 $0 0% Art~rig! Street Overlay Program $10,000 $0 0% Residential Neighborhood Street Overl~y Program $10,009 $0 0% Wayflnding Signs $24,000 $0 0% Woodinville-Duvall Road Widening (2013-14 CIP) $30,000 $335 1% Sammamis~ Bridge Replacement (2013-14 <;:IP) $6,400,000 $0 0%
2017 / 2018 Projects Center Curb Replac_ement - Trip Ro!Jndabouts $60.,QOO $0 0% NE North Woodinville Way -Wood/ Sno to NE ~O(!d/ Duvall Rd $1 ,1 10,000 $0 0% 195th & 164th Overl,ay and Walkways - Residential Overlay $1,500,000 $0 0% 124th Ave NE Sidewalk - J.56th to 1_¢,0th $1,010.000 $0 or~
Total Street & Sidewalk Projects $15,274,000 ! 335 0% Parks Projects
Eastslde Rail Cooridor - Desigri $500,000 $0 0% Wilmot Park - Play Struct.ure Replac~ment $300,0Q.9 $0 Q% Vi'~odinville Heights - Place Structure Replacement $125,000 $0 0% DeYoung Park R~storati91] . $759,000 $0 0% NE 145th Street Pede.strian Path. - Design $300,000 $0 0% West Slope ~Ike/ Pedestrian Park and T_rail $100,000 $0 0%
Total Parks Projects $2,01s,ooo $0 Oo/o Surf~ce ~ater Proj~s -
NE 171 st Drainage System l)pslzing - <::ity Share $250,000 $0 0% Albertson Pond Sendiment Vault $270,000 $0 0%
Total Surface Water Projects i s20,ooo 10 Oo/o Facilit}'. P_rojects
Pub)ic Works ShoR Roof Replacement l2015/ 2916. CIP) $10,000 $0 0% Civic Center Desjgn/Study $150,090 $0 0% City Hall HVAC SY.st~rn Repl_ac;ement $120,000 $0 0% City Hall Fire C9ntrol Sprinkler Syst~m Replacement $11 0,000 $0 0% City Hall Carpet Replacemert $125,000 $0 0% City Hall lnterLor Paint $35,000 $0 0% lnclemel'!t Weather _Materials Shelter $350,009 $0 0% Shop Expansi,;m $135,090 $0 0% Fire Pan~I ~eplacement $35,000 $0 00'9
T ~tal ~ac!lity Projects $1 ,070,000 $0 0% Property Acquisition
Little Bear Creek Park $80,000 $0 0% Misc~llaneous Property Acquisition $4000000 $0 0%
Total Property Acq~isition ! 4,080,000 10 Oo/o Capital Outlay $845,200 $43 0%
Total Capital Project/Outlay Expenditures 123,864,200 1377 0%
9 1
Budget to Actual
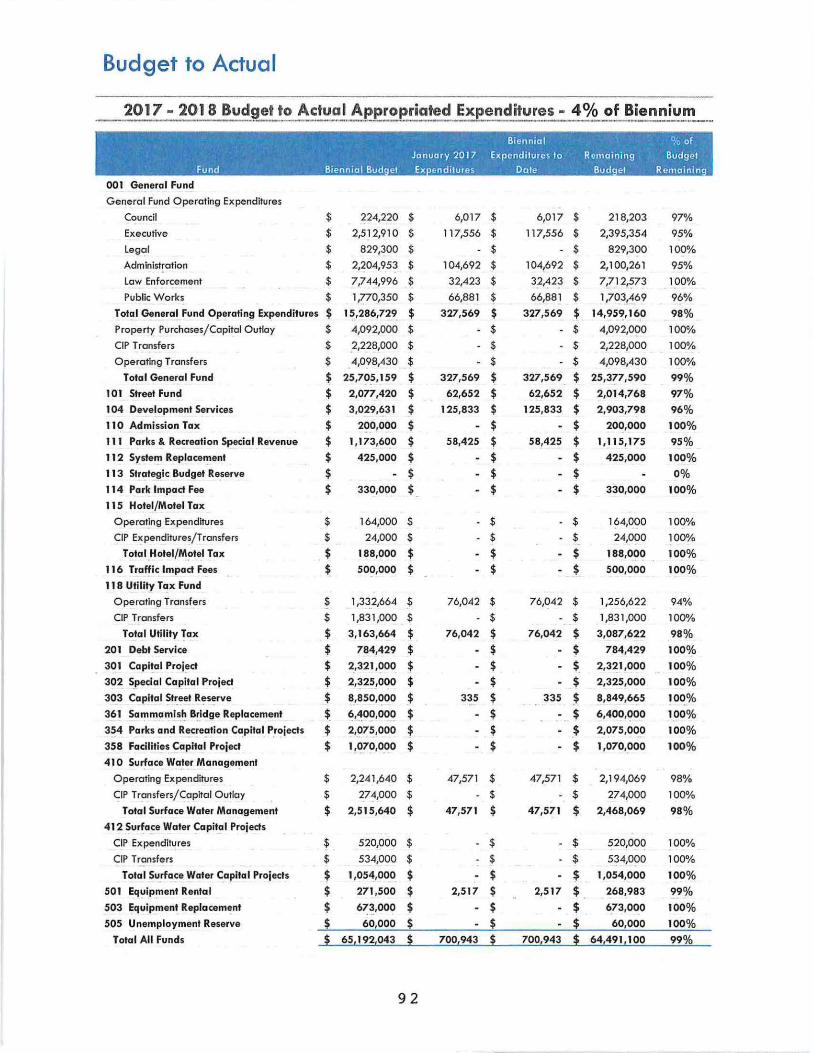
2017 - 2018 Bud~_et to Actual_~ppropriated E~enditures - 4°/o ~ f Bienni~.!!!_-
Biennio-1 -~ \ ' - · % ~f ' January 20 17. Expenditures to · Remaining ,· Budget
Fund Biennial Bud el Ex enditures · Dote · Bud el . Ren.1ainiri·,
001 General Fund
General Fund Operating Ex penditures
Council $ 224,220 $ 6,017 $ 6,017 $ 218,203 97%
Executive $ 2,512,910 $ 117,556 ~ 11 7,556 $ 2,395,354 95%
Legal $ 829,300 $ $ - $ 829,300 100%
Administration $ 2,204,953 $ 104,692 $ 104,692 $ 2,100,261 95%
Law Enforcement $ 7,744,996 $ 32,423 $ 3_2,42~ $ 7,712,~73 100%
Public Works $ 1,770,350 $ 66,881 $ 66,881 $ 1,703,469 96%
Tot~I General Fund Operating Expenditures $ 15,286,729 $ 327,569 $ 327,569 $ 14,959,160 98%
Property Purchases/Capitol Outlay $ 4,092,000 $ - $ - $ 4,092,000 100%
CIP Transfers $ ,2,228,000 $ - $ $ 2,228,000 100%
Operating Transfers $ 4,098,430 $ - $ $ 4,098,430 100%
Total General Fund ~ 25,7~?, 159 $ 327,569 ~ 327,569 $ 25,3!7,590 99%
101 Street Fund $ 2,077,420 $ 62,652 $ 62,652 $ 2,014,768 97%
104 Development Services $ 3,029,631 $ 125,833 $ 125,833 $ 2,903,798 96%
110 Admission Tax $ 200,000 $ - $ - $ 200,000 100%
111 Parks & Recreation Special Revenue $ 1,173,600 $ 58,425 ~ 58,425 $ 1, 115,175 95%
112 System Replace'!lent $ 425,000 $ - $ - $ 425,000 100%
113 Strategic Budget Reserve $ - $ - $ - $ Oo/o
114 Park Impact Fee $ 330,000 $ - $ - $ 330,000 100%
115 Hotel/ Motel Tax
Operating Expenditures $ 164,000 $ - $ $ 1~4,000 100%
CIP Expenditures/Transfers $ 24,000 $ - $ - $ 24,000 100%
Total Hotel/M~tel Tax $ 188,000 $ - $ - $ 188,000 100%
116 Trafficlmpact Fees $ 500,000 $ - $ - $ 500,000 100%
118 Utility Tax Fund
Operating Transfers ¥ 1,3~2,664 $ 76,042 $ 76,042 $ 1,256,622 94%
CIP Transfers $ 1,831,000 $ $ - $ 1,831,000 100%
Total Utility Tax $ 3,163,664 $ 76,042 $ 76,042 $ 3,087,622 98%
201 Debt Service $ 784,429 $ - $ - $ 784,429 100%
301 Capital Project $ 2_,321 ,000 $ - $ - $_ 2,321 ,000 100%
302 Special Capital Project $ 2,325,000 $ - $ - $ 2,325,000 100%
303 Capit<1I St~eet R!serve $ 8,850,~00 $ 335 $ 335 $ 8,849,665 100%
361 Sammamish Bridge Replacement $ ~.~00,000 $ - $ - $ 6,400,000 100%
354 Parks and Recreation Capital Projects $ 2,_075,000 ' - $ - _$ 2,075,000 100%
358 Facilities Capital Project $ 1,070,000 $ - $ - $ 1,070,000 100%
410 Surface Wa_ter Manage'!'ent
Operating Expenditures $ 2,241,640 $ 47,571 $ 47,571 $ 2,194,069 98%
CIP Transfers/Capital Outlay $ 274,000 $ - $ - $ 274,000 100%
Total Surface Water Management $ 2,515,640 $ 47,571 $ 47,571 $ 2,468,069 98%
412 Surface Water Capital Projects
CIP Expenditures ~ 520,000 $ - $ - $ 520,000 100%
CIP Transfers $ 534,000 $ - $ - $ 534,000 100%
Total Surface Water Capital Projects } 1,054,000 $ - $ - $ 1,054,000 100%
501 Equipment Rental $ 271 ,500 $ 2,517 $ 2,517 $ 268,983 99%
503 Equipmen! Replacement $ 67'.~,000 $ - $ - $ 673,000 I OOo/o
505 Unemployment Reserve $ 60,000 $ - $ - $ 60,000 100%
Total All Funds i 65,192,043 i 700,943 1 700,943 i 64,491 , 100 _ 9_9_%
92

Cash and Investments
Cash and_ l!'vestment Acti,_v_it __ y __________________ _
2017 2016 2016 Januar December November
Beginning Cash & Investments $ 36,392,803 $ 37!456,900 $ 36,216,766
Receipts
Deposits $ 691,333 $ 378,029 $ 605,269
King County - ACH $ 11 0,11 4 $ 11 2,553 $ 1,095,603
State of Washington - W ire ~ 568,946 $ 70~,736 $ 1,122, l 93
State Investment Inte rest Revenue $ 19,058 $ 15,190 $ 13,092
Total Receipts $ 1,389,450 $ 1,212,508 $ 2,836,157
Total Available $ 37,782,253 $ 38,669,409 $ 39,052,923
Disbursements
Claims $ 229,258 $ 1,952,71_6 $ 1,246,523
Pa yroll $ 336,667 $ 323,890 $ 349,499
Total Disbursements $ 565,926 $ 2,276,606 $ 1,596,022
Ending Cash & Investments $ 37,216,327 $ 361392,803 $ 37,456,900
---·------------ ·----Cash and Investments at Month End ---- ---
2017 2016 2016
January December November
Cash Bonk Accounts Ill
State Investment Poo l (2)
Total Cash and Investment Holdings
$ $
1,217,130 $ 35,999,1 97 $
$ 37,216,327 $ ( 1) Cash Balances reflect General ledger book balances and not actual bank cash balances.
481,609 $
35,911,194 $ 36,392,803 $
(2) As of month end January 2017, 1he State Investment Pool provided net earnings rote of 0.63%
Interest Rate Comparison
3.00%
2.50%
2.00%
1.50%
1.00%
0.50%
0.00%
2,267,632
35,189,268
·37,456,900
Jan-16 Feb-16 Mar-16 Apr-16 May-16 Jun-16 Jul-16 Aug-16 Sep-16 Oct-16 Nov-16 Dec-16 Jan-17
- LGIP Net Earnings Rote - 10 Year T-8111 -3 Month T -Bill
Treasury info: http://www.treos.gov/ offices/domestic-finance/ d 9 3 onagement/interest-rate/yield_historical.shtrnl

Business License Revenue
Month/Y- Total R-
Sep-15 $ Oct-15 $
Nov-15 $ Dec-15 $ Jan-16 $ Feb-16 $ Mal'-16 $ Apr-16 $
May-16 $ Jurt-16 $ Jul-16 $
Aug-16 $ Sep-16 $ Oct-16 $
Nov-16 $ Dec-16 $ JaD-17 $
117 3,591 7,179 $2\000
29,023 37,079 42,023 $20.000
49702 55,539 $lS.000
62793 66,914 $10.000
71741 76765 $5,000 83,912 89,606 94,673 $-
Business lic:ense Revenue by Month
§ - --... ,., -~II
.., ~ ;. ..
... 0 .. .. <t '"!.
iii • ~ 8 ~
~ ~ ~ ~ ~ ~ ....,"' ,olO._:-o,..t,.,, ..... ~
iiiliiilii ~ ~ ~ ~ ~ ~ ~ ~ ~ ~ ~ ~ ~ ~ ~ ~ ~
102,378 109,343
~- -8 ... -~ ~ !O' ,. ,. " ,( ¥ ($ ~· ..L'i ... - -~ ,( </' CT ~o <J' .... CT ,._., ~ 'l"Q ~o .... ~ 'i ~ <!' CT ~o <J' .... CT
Business Licenses from in City limils vs. Business Licenses from Outside of City Umils
1, '..100
1,000 953 999
800
600 557 593
396 406 400
200
NowU.-S R.,.,....als Totd licenses
• l!Gsinesses Registettd w /In •e Qiy Lhls lloiness legis!eo'ed from Oubide of Oty U..ls
Tolal New lic:enses vs .. New Limnses in Cly Limits uo 127 126
120
100
80 69 70 63
60
38 37 34 31 37
0 ,'> ,., ," ,., , b , b , b , b ,b , b .,_b ,b , b , b ,b , b ," ,,,.f ,: ,I' C: 6' ,,_;p' <' ,· :\ $' ~ <$ qi ,: .... C: ~ o" ~o <:J" 'i ~o 'l"Q ~o ~ ',,/1 .,.~ o" ~o <:J"' 'i
- New Lia!noes - New l.la!nses ·Gly U.its
94


Council Packet Page 81
Council Packet Page 83
Council Packet Page 90

Business Licensing
