city of tshwane by region - teda2017-12-20 · city of tshwane by region the city is divided into...
TRANSCRIPT
City of Tshwane by region
The City is divided into seven administrative and functional regions that have been created to assist
with a multidimensional approach to improve service delivery. The Regionalisation Model has
assisted the City to better organise, coordinate and align the interaction between government and the
people.
The Human Development Index (HDI) is a composite relative index used to compare human
development across population groups or regions. HDI is the combination of three basic dimensions
of human development: a long and healthy life, knowledge and a decent standard of living. This index
is applied across the regions. The HDI can assume a maximum value of 1, indicating a very high level
of human development. It has a minimum value of 0, indicating no human development.
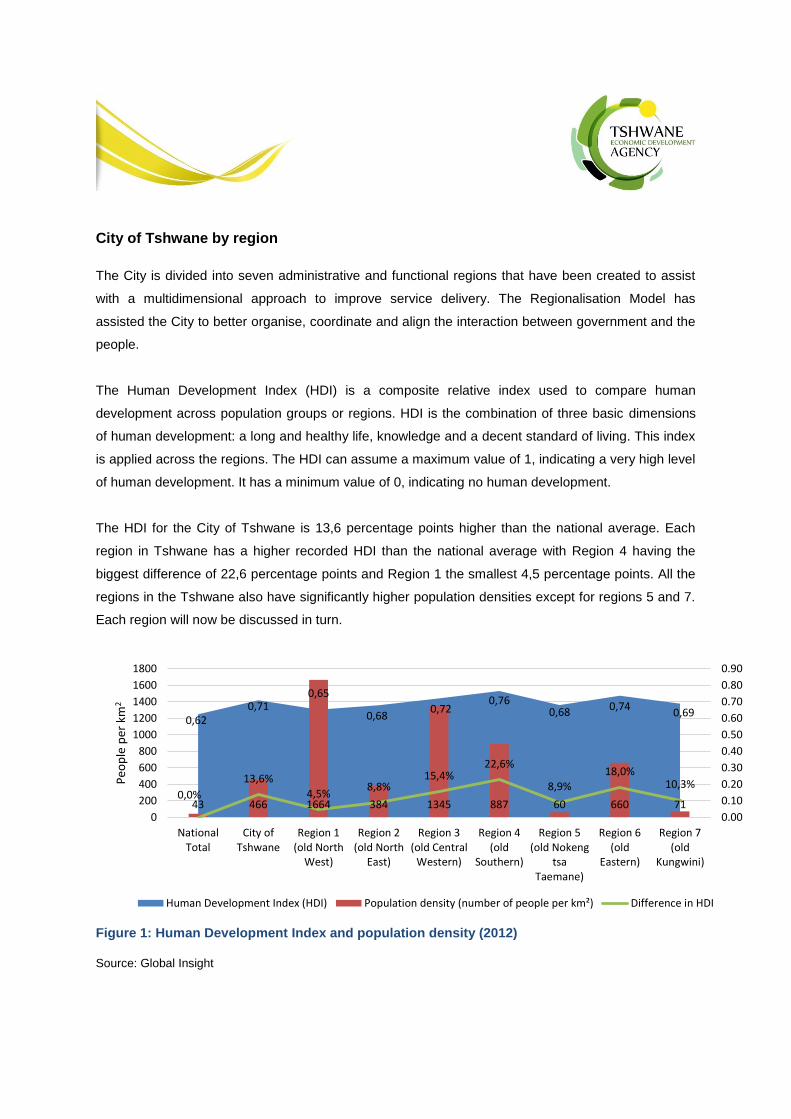
The HDI for the City of Tshwane is 13,6 percentage points higher than the national average. Each
region in Tshwane has a higher recorded HDI than the national average with Region 4 having the
biggest difference of 22,6 percentage points and Region 1 the smallest 4,5 percentage points. All the
regions in the Tshwane also have significantly higher population densities except for regions 5 and 7.
Each region will now be discussed in turn.
Figure 1: Human Development Index and population density (2012)
Source: Global Insight
0,62 0,71
0,65
0,68 0,72
0,76 0,68 0,74
0,69
43 466 1664 384 1345 887 60 660 71 0,0%
13,6%
4,5% 8,8%
15,4% 22,6%
8,9%
18,0% 10,3%
0.00
0.10
0.20
0.30
0.40
0.50
0.60
0.70
0.80
0.90
0
200
400
600
800
1000
1200
1400
1600
1800
NationalTotal
City ofTshwane
Region 1(old North
West)
Region 2(old North
East)
Region 3(old Central
Western)
Region 4(old
Southern)
Region 5(old Nokeng
tsaTaemane)
Region 6(old
Eastern)
Region 7(old
Kungwini)
Peo
ple
per
km
2
Human Development Index (HDI) Population density (number of people per km²) Difference in HDI
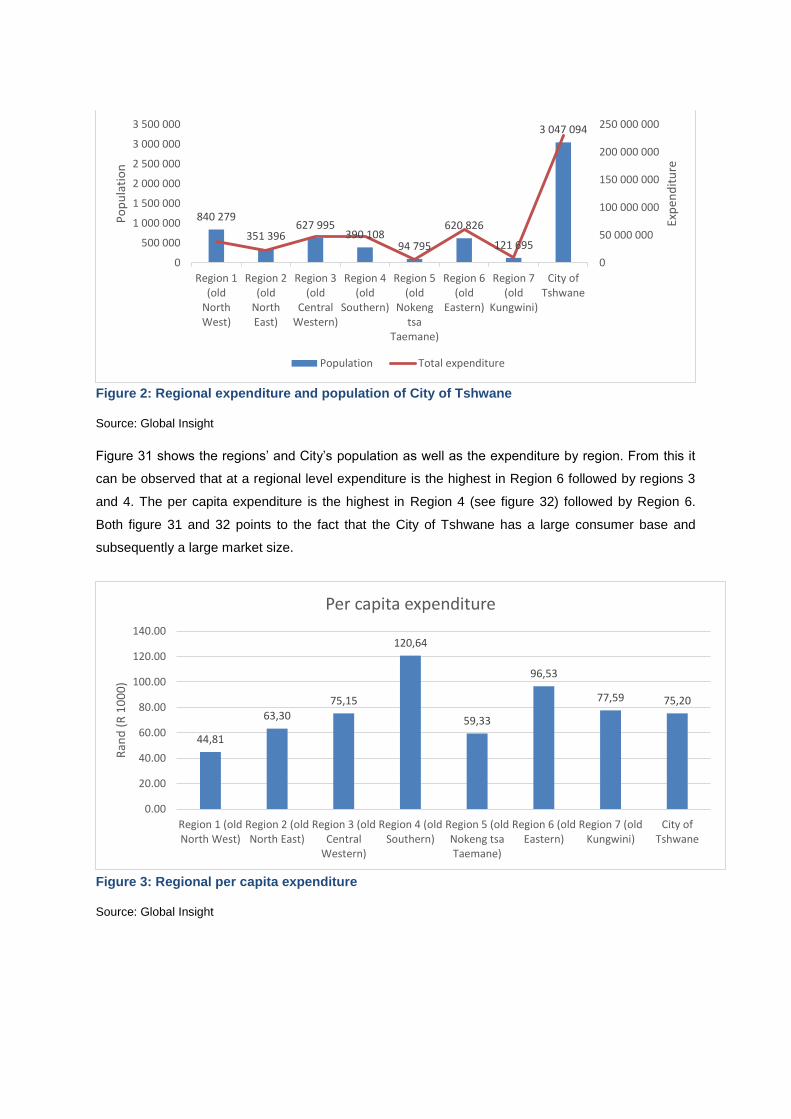
Figure 2: Regional expenditure and population of City of Tshwane
Source: Global Insight
Figure 31 shows the regions’ and City’s population as well as the expenditure by region. From this it
can be observed that at a regional level expenditure is the highest in Region 6 followed by regions 3
and 4. The per capita expenditure is the highest in Region 4 (see figure 32) followed by Region 6.
Both figure 31 and 32 points to the fact that the City of Tshwane has a large consumer base and
subsequently a large market size.
Figure 3: Regional per capita expenditure
Source: Global Insight
840 279
351 396 627 995
390 108 94 795
620 826
121 695
3 047 094
0
500 000
1 000 000
1 500 000
2 000 000
2 500 000
3 000 000
3 500 000
Region 1(old
NorthWest)
Region 2(old
NorthEast)
Region 3(old
CentralWestern)
Region 4(old
Southern)
Region 5(old
Nokengtsa
Taemane)
Region 6(old
Eastern)
Region 7(old
Kungwini)
City ofTshwane
0
50 000 000
100 000 000
150 000 000
200 000 000
250 000 000P
op
ula
tio
n
Exp
end
itu
re
Population Total expenditure
44,81
63,30
75,15
120,64
59,33
96,53
77,59 75,20
0.00
20.00
40.00
60.00
80.00
100.00
120.00
140.00
Region 1 (oldNorth West)
Region 2 (oldNorth East)
Region 3 (oldCentral
Western)
Region 4 (oldSouthern)
Region 5 (oldNokeng tsaTaemane)
Region 6 (oldEastern)
Region 7 (oldKungwini)
City ofTshwane
Ran
d (
R 1
00
0)
Per capita expenditure
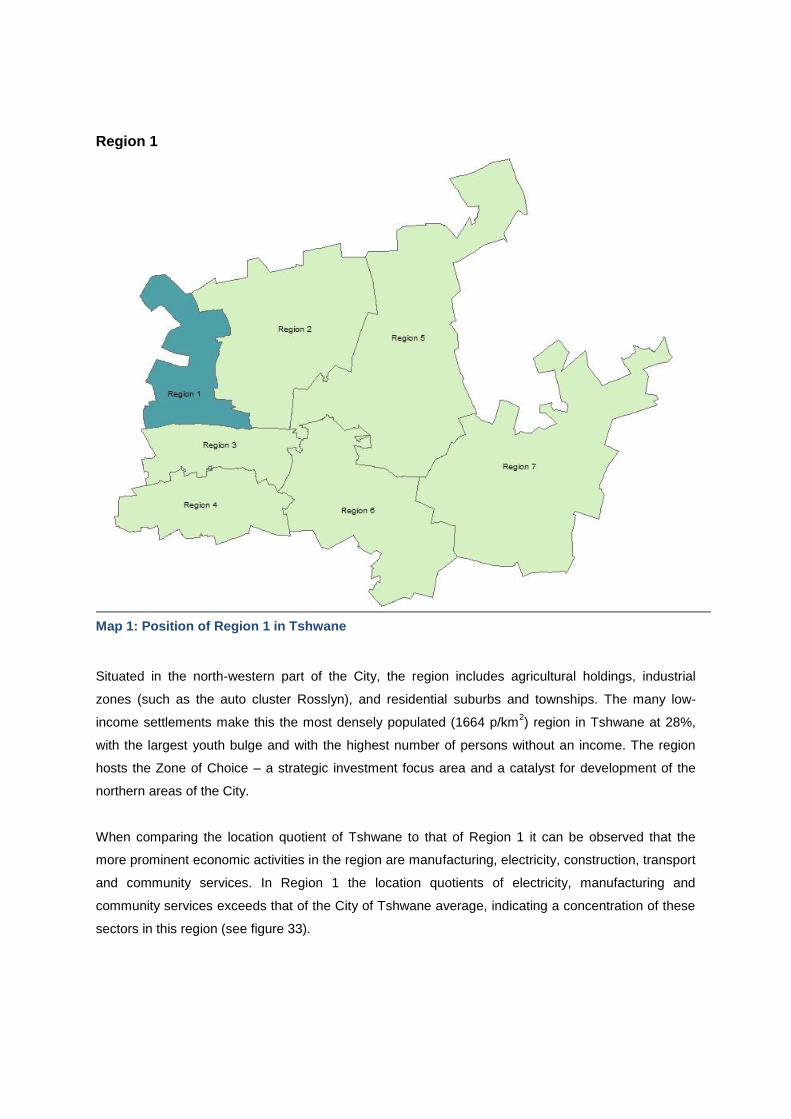
Region 1
Map 1: Position of Region 1 in Tshwane
Situated in the north-western part of the City, the region includes agricultural holdings, industrial
zones (such as the auto cluster Rosslyn), and residential suburbs and townships. The many low-
income settlements make this the most densely populated (1664 p/km2) region in Tshwane at 28%,
with the largest youth bulge and with the highest number of persons without an income. The region
hosts the Zone of Choice – a strategic investment focus area and a catalyst for development of the
northern areas of the City.
When comparing the location quotient of Tshwane to that of Region 1 it can be observed that the
more prominent economic activities in the region are manufacturing, electricity, construction, transport
and community services. In Region 1 the location quotients of electricity, manufacturing and
community services exceeds that of the City of Tshwane average, indicating a concentration of these
sectors in this region (see figure 33).
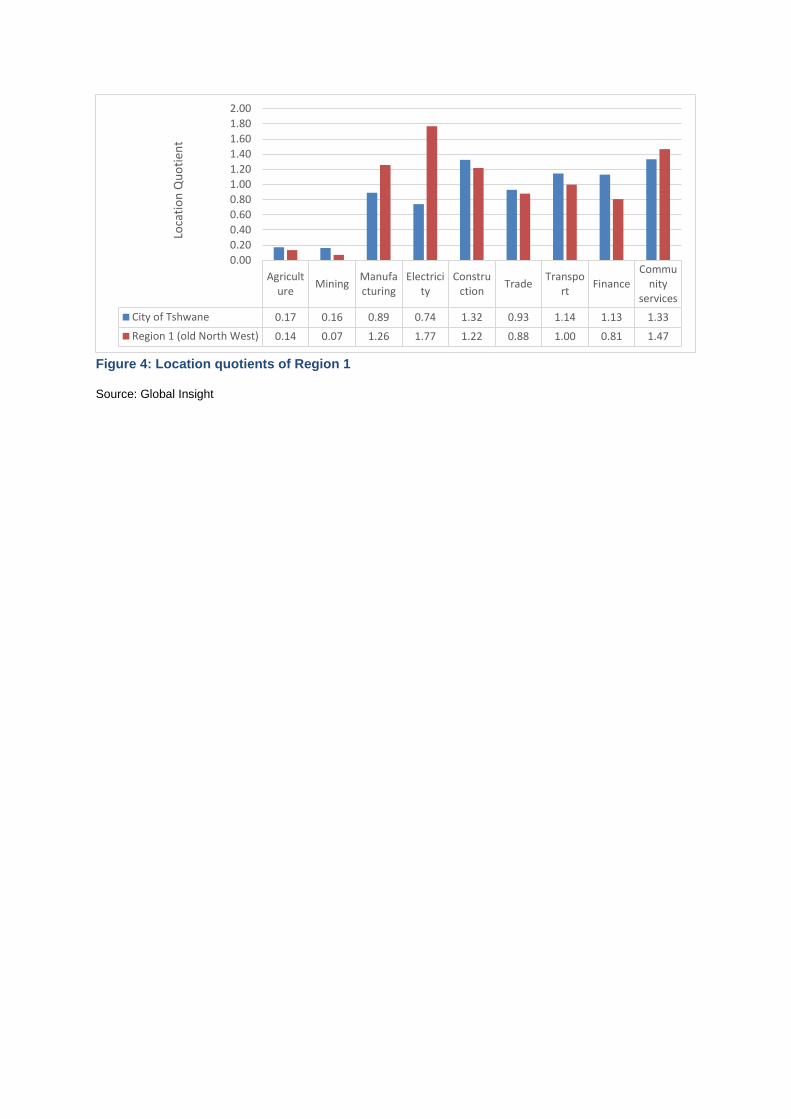
Figure 4: Location quotients of Region 1
Source: Global Insight
Agriculture
MiningManufacturing
Electricity
Construction
TradeTranspo
rtFinance
Community
services
City of Tshwane 0.17 0.16 0.89 0.74 1.32 0.93 1.14 1.13 1.33
Region 1 (old North West) 0.14 0.07 1.26 1.77 1.22 0.88 1.00 0.81 1.47
0.00
0.20
0.40
0.60
0.80
1.00
1.20
1.40
1.60
1.80
2.00
Loca
tio
n Q
uo
tien
t
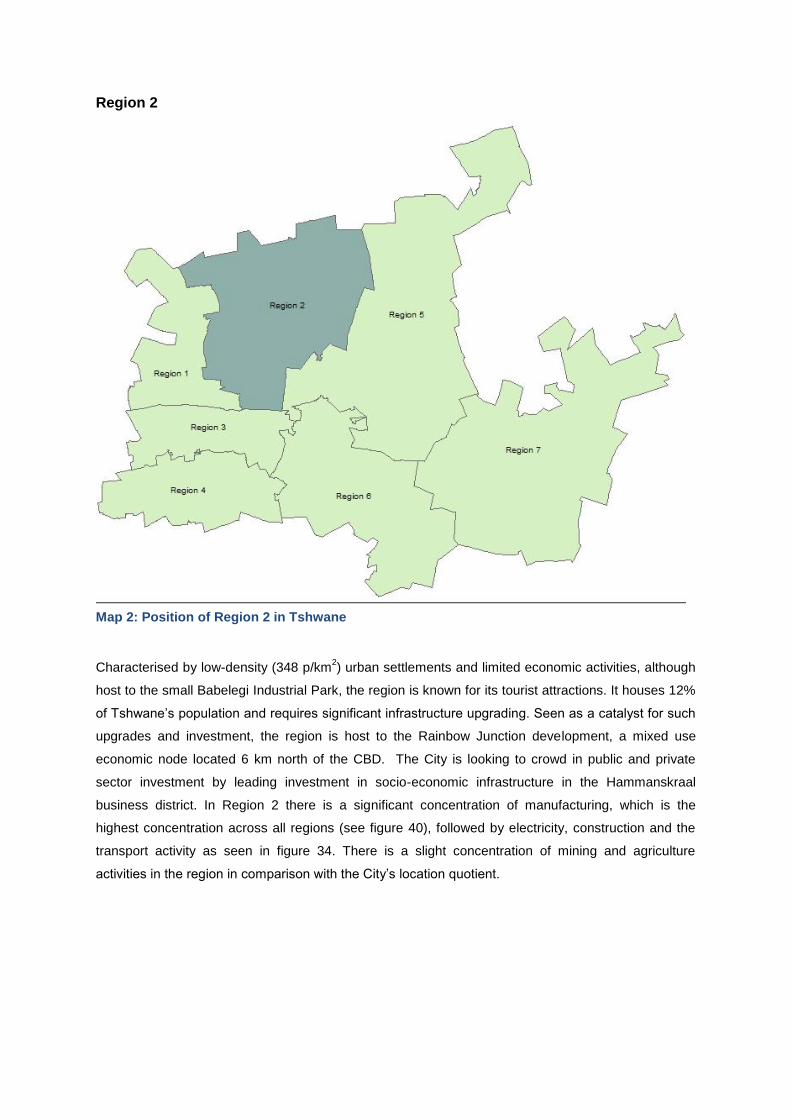
Region 2
Map 2: Position of Region 2 in Tshwane
Characterised by low-density (348 p/km2) urban settlements and limited economic activities, although
host to the small Babelegi Industrial Park, the region is known for its tourist attractions. It houses 12%
of Tshwane’s population and requires significant infrastructure upgrading. Seen as a catalyst for such
upgrades and investment, the region is host to the Rainbow Junction development, a mixed use
economic node located 6 km north of the CBD. The City is looking to crowd in public and private
sector investment by leading investment in socio-economic infrastructure in the Hammanskraal
business district. In Region 2 there is a significant concentration of manufacturing, which is the
highest concentration across all regions (see figure 40), followed by electricity, construction and the
transport activity as seen in figure 34. There is a slight concentration of mining and agriculture
activities in the region in comparison with the City’s location quotient.
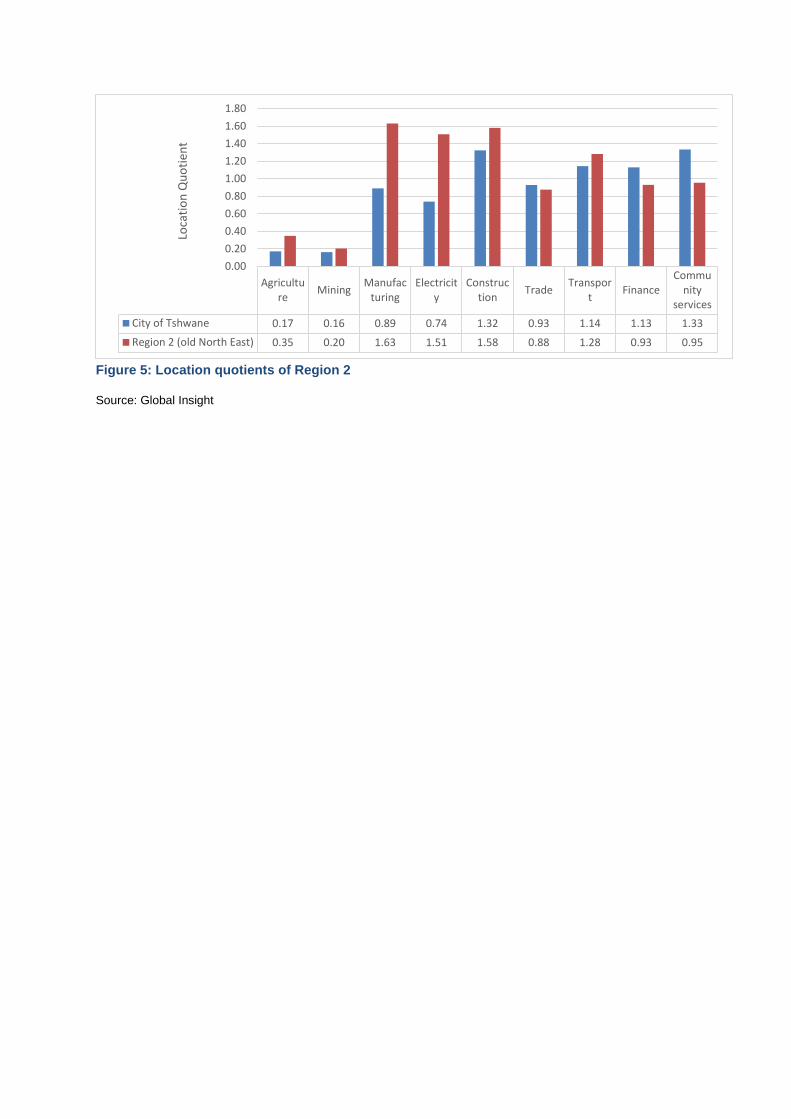
Figure 5: Location quotients of Region 2
Source: Global Insight
Agriculture
MiningManufac
turingElectricit
yConstruc
tionTrade
Transport
FinanceCommu
nityservices
City of Tshwane 0.17 0.16 0.89 0.74 1.32 0.93 1.14 1.13 1.33
Region 2 (old North East) 0.35 0.20 1.63 1.51 1.58 0.88 1.28 0.93 0.95
0.00
0.20
0.40
0.60
0.80
1.00
1.20
1.40
1.60
1.80
Loca
tio
n Q
uo
tien
t

Region 3
Map 3: Position of Region 3 in Tshwane
This region includes the Tshwane central business district (CBD), as well as Brooklyn and Hatfield. It
consists of the inner capital core, the administrative heartland of government, institutions of higher
learning, as well as research and knowledge centres. It accommodates two of the current three
Gautrain stations in Tshwane and the first phase of the Tshwane Rapid Transit (TRT) system, thus
making it an interchange for various public transport modes. The region contributes the most in terms
of regional GVA and is home to the second largest number of persons employed in the formal sector.
Modernising and revitalising the inner capital core forms an integral part of the City’s vision of
remaking of the capital city.
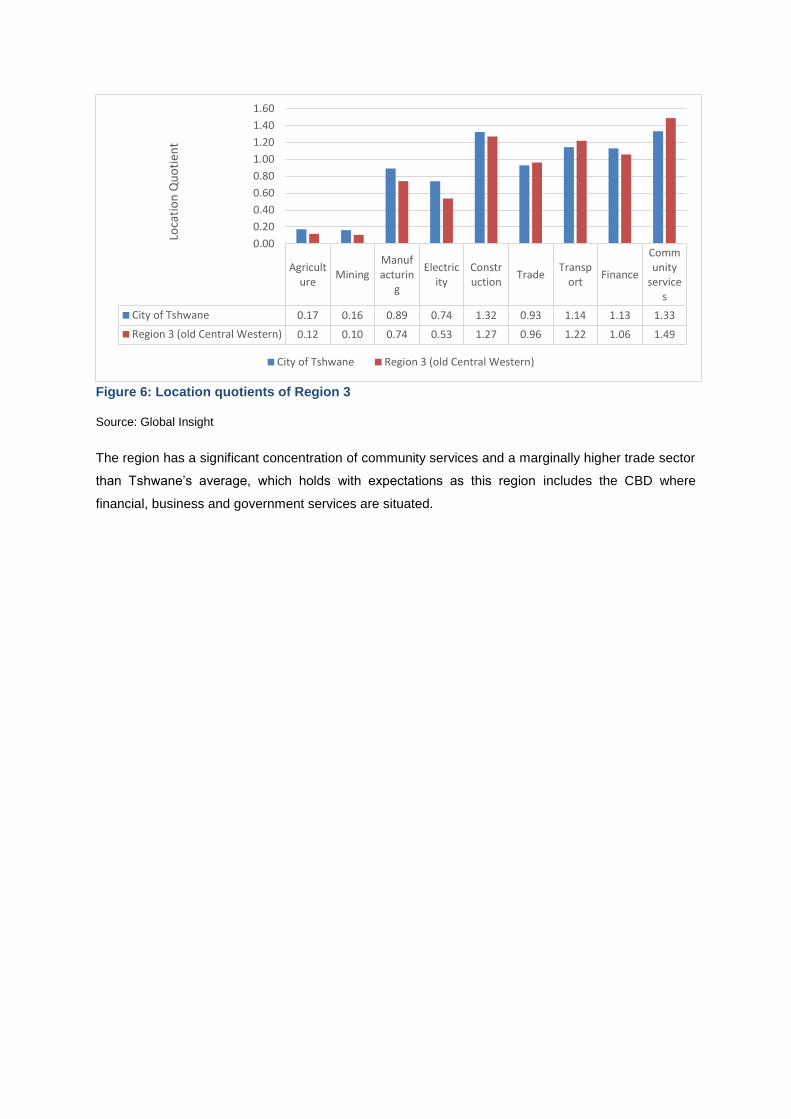
Figure 6: Location quotients of Region 3
Source: Global Insight
The region has a significant concentration of community services and a marginally higher trade sector
than Tshwane’s average, which holds with expectations as this region includes the CBD where
financial, business and government services are situated.
Agriculture
MiningManufacturin
g
Electricity
Construction
TradeTransp
ortFinance
Community
services
City of Tshwane 0.17 0.16 0.89 0.74 1.32 0.93 1.14 1.13 1.33
Region 3 (old Central Western) 0.12 0.10 0.74 0.53 1.27 0.96 1.22 1.06 1.49
0.00
0.20
0.40
0.60
0.80
1.00
1.20
1.40
1.60
Loca
tio
n Q
uo
tien
t
City of Tshwane Region 3 (old Central Western)
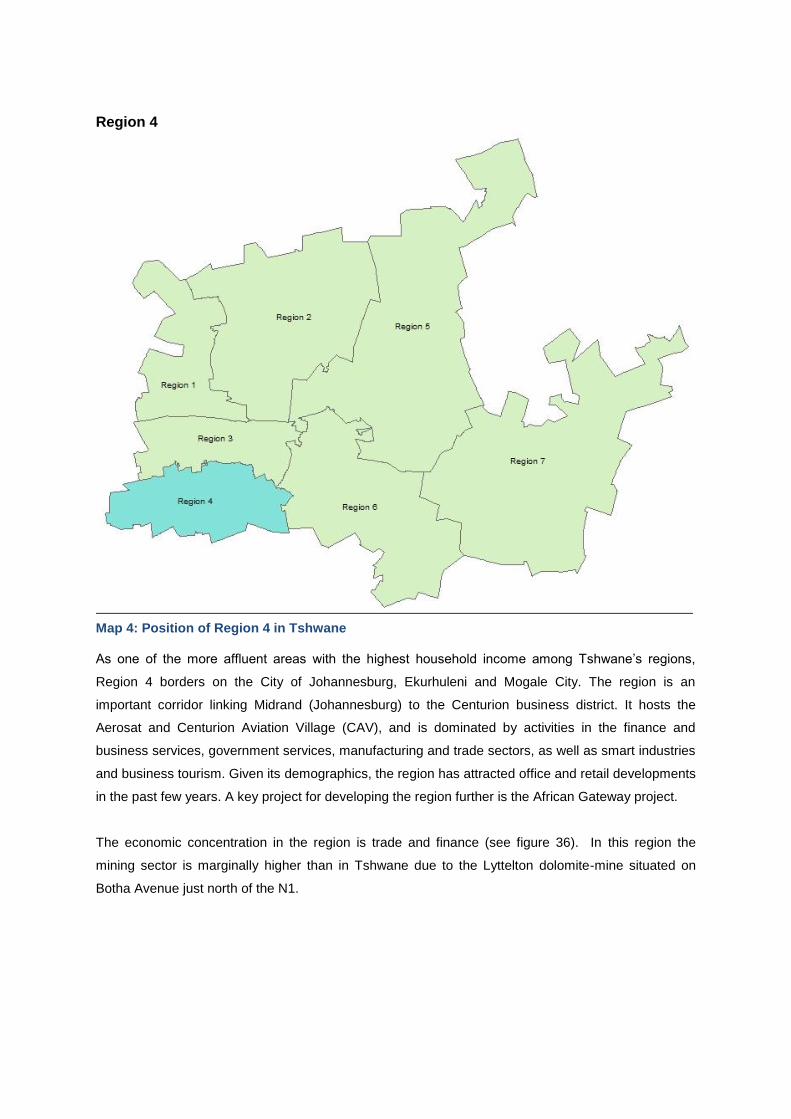
Region 4
Map 4: Position of Region 4 in Tshwane
As one of the more affluent areas with the highest household income among Tshwane’s regions,
Region 4 borders on the City of Johannesburg, Ekurhuleni and Mogale City. The region is an
important corridor linking Midrand (Johannesburg) to the Centurion business district. It hosts the
Aerosat and Centurion Aviation Village (CAV), and is dominated by activities in the finance and
business services, government services, manufacturing and trade sectors, as well as smart industries
and business tourism. Given its demographics, the region has attracted office and retail developments
in the past few years. A key project for developing the region further is the African Gateway project.
The economic concentration in the region is trade and finance (see figure 36). In this region the
mining sector is marginally higher than in Tshwane due to the Lyttelton dolomite-mine situated on
Botha Avenue just north of the N1.
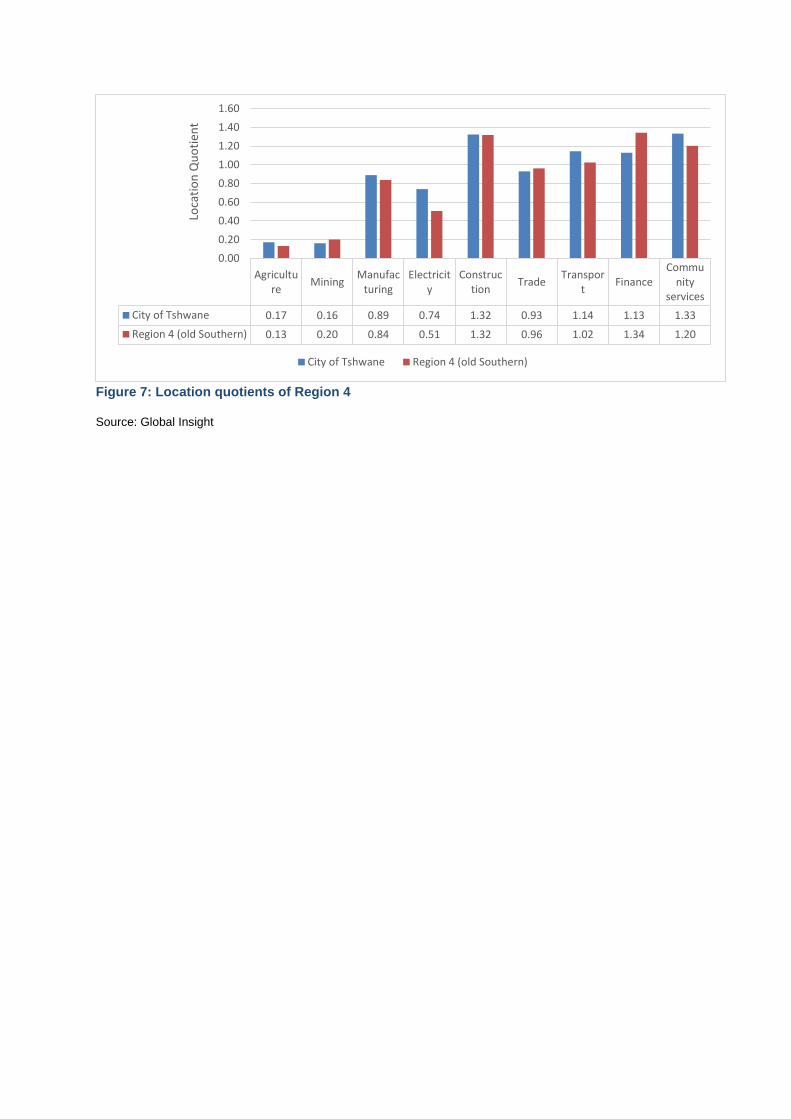
Figure 7: Location quotients of Region 4
Source: Global Insight
Agriculture
MiningManufac
turingElectricit
yConstruc
tionTrade
Transport
FinanceCommu
nityservices
City of Tshwane 0.17 0.16 0.89 0.74 1.32 0.93 1.14 1.13 1.33
Region 4 (old Southern) 0.13 0.20 0.84 0.51 1.32 0.96 1.02 1.34 1.20
0.00
0.20
0.40
0.60
0.80
1.00
1.20
1.40
1.60
Loca
tio
n Q
uo
tien
t
City of Tshwane Region 4 (old Southern)
Region 5
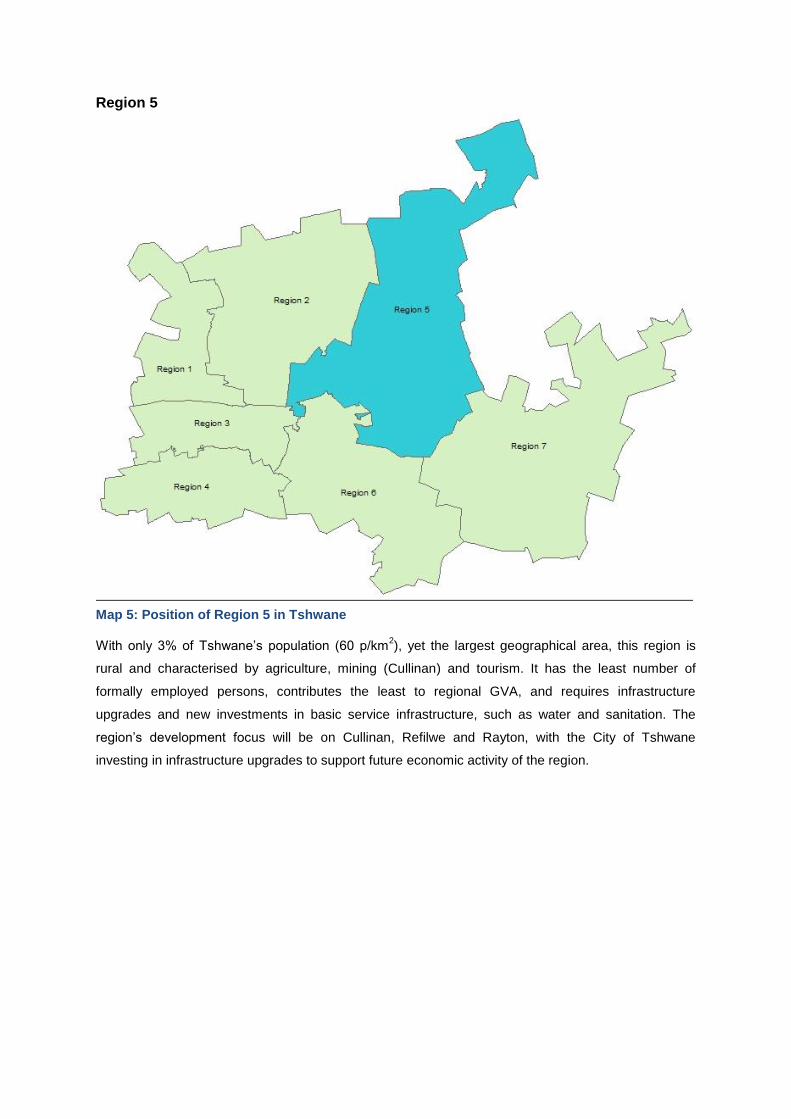
Map 5: Position of Region 5 in Tshwane
With only 3% of Tshwane’s population (60 p/km2), yet the largest geographical area, this region is
rural and characterised by agriculture, mining (Cullinan) and tourism. It has the least number of
formally employed persons, contributes the least to regional GVA, and requires infrastructure
upgrades and new investments in basic service infrastructure, such as water and sanitation. The
region’s development focus will be on Cullinan, Refilwe and Rayton, with the City of Tshwane
investing in infrastructure upgrades to support future economic activity of the region.
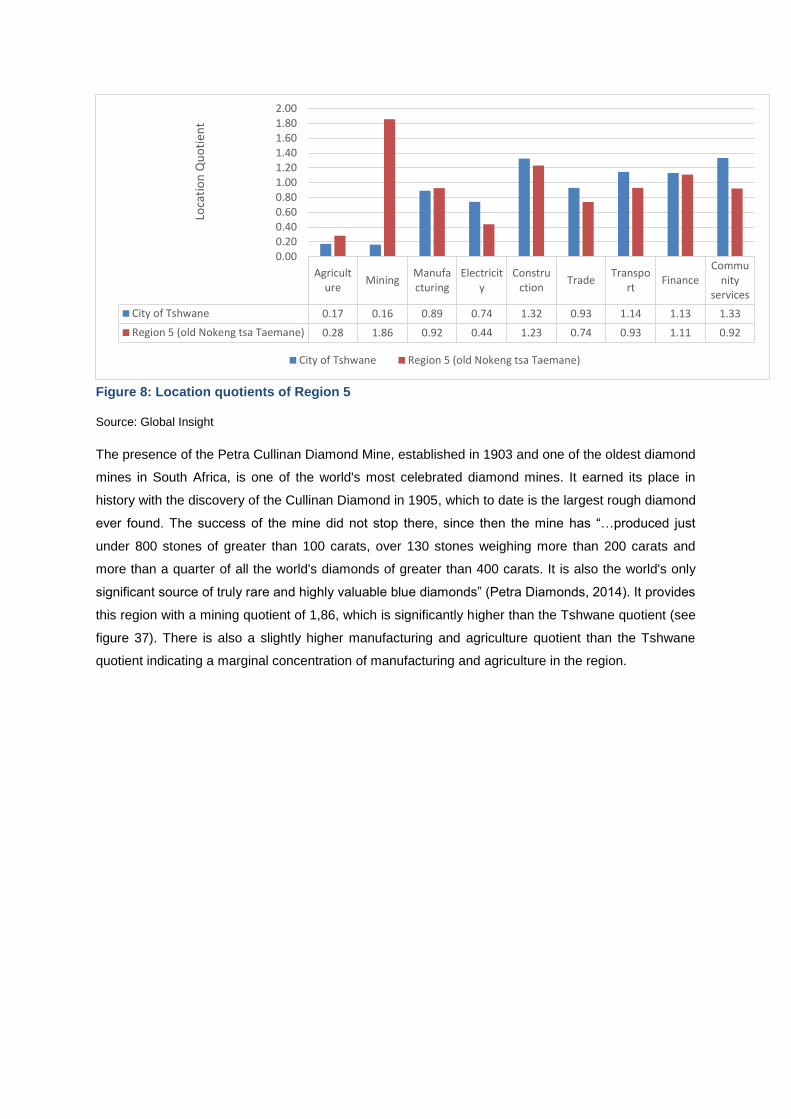
Figure 8: Location quotients of Region 5
Source: Global Insight
The presence of the Petra Cullinan Diamond Mine, established in 1903 and one of the oldest diamond
mines in South Africa, is one of the world's most celebrated diamond mines. It earned its place in
history with the discovery of the Cullinan Diamond in 1905, which to date is the largest rough diamond
ever found. The success of the mine did not stop there, since then the mine has “…produced just
under 800 stones of greater than 100 carats, over 130 stones weighing more than 200 carats and
more than a quarter of all the world's diamonds of greater than 400 carats. It is also the world's only
significant source of truly rare and highly valuable blue diamonds” (Petra Diamonds, 2014). It provides
this region with a mining quotient of 1,86, which is significantly higher than the Tshwane quotient (see
figure 37). There is also a slightly higher manufacturing and agriculture quotient than the Tshwane
quotient indicating a marginal concentration of manufacturing and agriculture in the region.
Agriculture
MiningManufacturing
Electricity
Construction
TradeTranspo
rtFinance
Community
services
City of Tshwane 0.17 0.16 0.89 0.74 1.32 0.93 1.14 1.13 1.33
Region 5 (old Nokeng tsa Taemane) 0.28 1.86 0.92 0.44 1.23 0.74 0.93 1.11 0.92
0.000.200.400.600.801.001.201.401.601.802.00
Loca
tio
n Q
uo
tien
t
City of Tshwane Region 5 (old Nokeng tsa Taemane)
Region 6
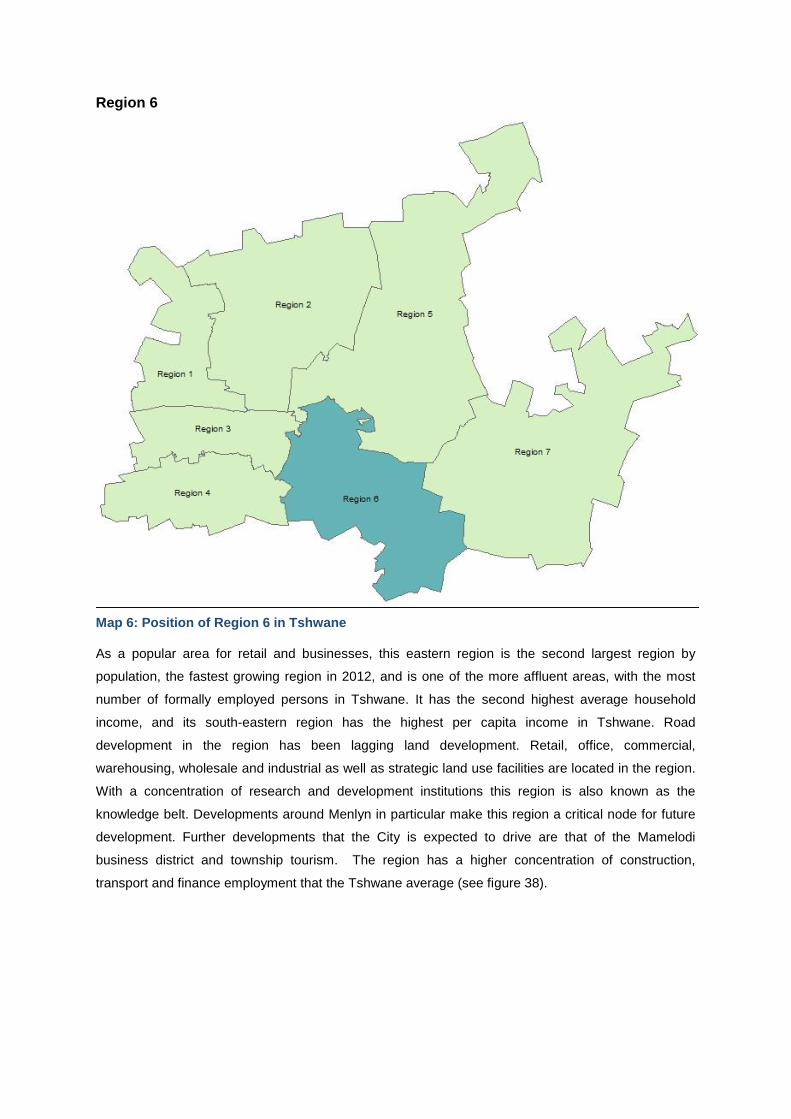
Map 6: Position of Region 6 in Tshwane
As a popular area for retail and businesses, this eastern region is the second largest region by
population, the fastest growing region in 2012, and is one of the more affluent areas, with the most
number of formally employed persons in Tshwane. It has the second highest average household
income, and its south-eastern region has the highest per capita income in Tshwane. Road
development in the region has been lagging land development. Retail, office, commercial,
warehousing, wholesale and industrial as well as strategic land use facilities are located in the region.
With a concentration of research and development institutions this region is also known as the
knowledge belt. Developments around Menlyn in particular make this region a critical node for future
development. Further developments that the City is expected to drive are that of the Mamelodi
business district and township tourism. The region has a higher concentration of construction,
transport and finance employment that the Tshwane average (see figure 38).
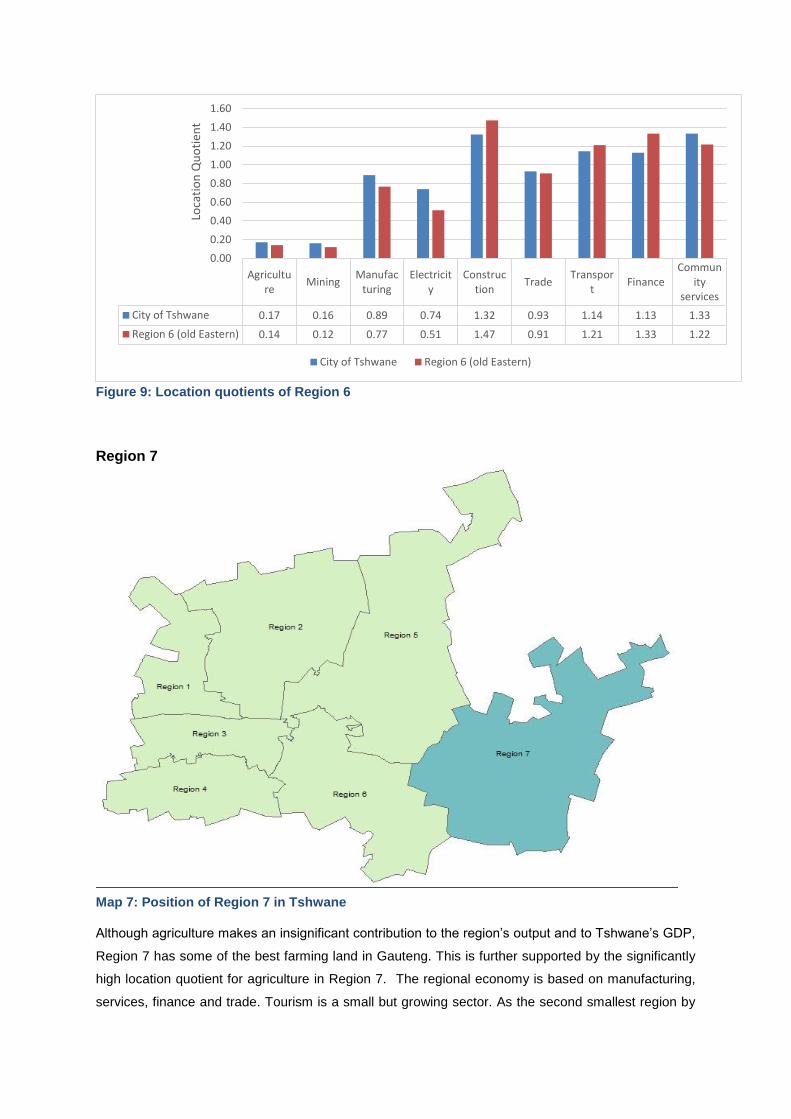
Figure 9: Location quotients of Region 6
Region 7
Map 7: Position of Region 7 in Tshwane
Although agriculture makes an insignificant contribution to the region’s output and to Tshwane’s GDP,
Region 7 has some of the best farming land in Gauteng. This is further supported by the significantly
high location quotient for agriculture in Region 7. The regional economy is based on manufacturing,
services, finance and trade. Tourism is a small but growing sector. As the second smallest region by
Agriculture
MiningManufac
turingElectricit
yConstruc
tionTrade
Transport
FinanceCommun
ityservices
City of Tshwane 0.17 0.16 0.89 0.74 1.32 0.93 1.14 1.13 1.33
Region 6 (old Eastern) 0.14 0.12 0.77 0.51 1.47 0.91 1.21 1.33 1.22
0.00
0.20
0.40
0.60
0.80
1.00
1.20
1.40
1.60
Loca
tio
n Q
uo
tien
t
City of Tshwane Region 6 (old Eastern)
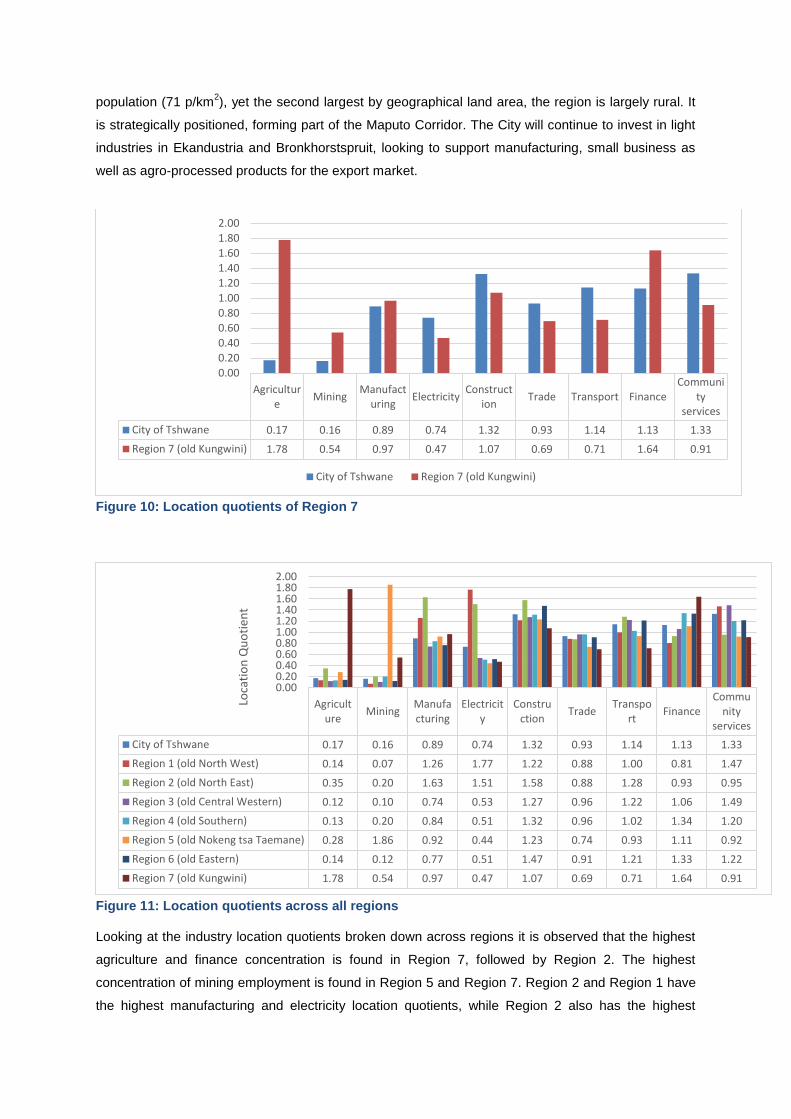
population (71 p/km2), yet the second largest by geographical land area, the region is largely rural. It
is strategically positioned, forming part of the Maputo Corridor. The City will continue to invest in light
industries in Ekandustria and Bronkhorstspruit, looking to support manufacturing, small business as
well as agro-processed products for the export market.
Figure 10: Location quotients of Region 7
Figure 11: Location quotients across all regions
Looking at the industry location quotients broken down across regions it is observed that the highest
agriculture and finance concentration is found in Region 7, followed by Region 2. The highest
concentration of mining employment is found in Region 5 and Region 7. Region 2 and Region 1 have
the highest manufacturing and electricity location quotients, while Region 2 also has the highest
Agriculture
MiningManufact
uringElectricity
Construction
Trade Transport FinanceCommuni
tyservices
City of Tshwane 0.17 0.16 0.89 0.74 1.32 0.93 1.14 1.13 1.33
Region 7 (old Kungwini) 1.78 0.54 0.97 0.47 1.07 0.69 0.71 1.64 0.91
0.00
0.200.40
0.600.80
1.00
1.20
1.401.60
1.80
2.00
City of Tshwane Region 7 (old Kungwini)
Agriculture
MiningManufacturing
Electricity
Construction
TradeTranspo
rtFinance
Community
services
City of Tshwane 0.17 0.16 0.89 0.74 1.32 0.93 1.14 1.13 1.33
Region 1 (old North West) 0.14 0.07 1.26 1.77 1.22 0.88 1.00 0.81 1.47
Region 2 (old North East) 0.35 0.20 1.63 1.51 1.58 0.88 1.28 0.93 0.95
Region 3 (old Central Western) 0.12 0.10 0.74 0.53 1.27 0.96 1.22 1.06 1.49
Region 4 (old Southern) 0.13 0.20 0.84 0.51 1.32 0.96 1.02 1.34 1.20
Region 5 (old Nokeng tsa Taemane) 0.28 1.86 0.92 0.44 1.23 0.74 0.93 1.11 0.92
Region 6 (old Eastern) 0.14 0.12 0.77 0.51 1.47 0.91 1.21 1.33 1.22
Region 7 (old Kungwini) 1.78 0.54 0.97 0.47 1.07 0.69 0.71 1.64 0.91
0.000.200.400.600.801.001.201.401.601.802.00
Loca
tio
n Q
uo
tien
t
construction and transport location quotients. Region 4 and Region 3 have the highest trade
concentration followed by Region 6. Region 3 and Region 1 are the biggest employers in the services
sector, followed by Region 6 (see figure 40).
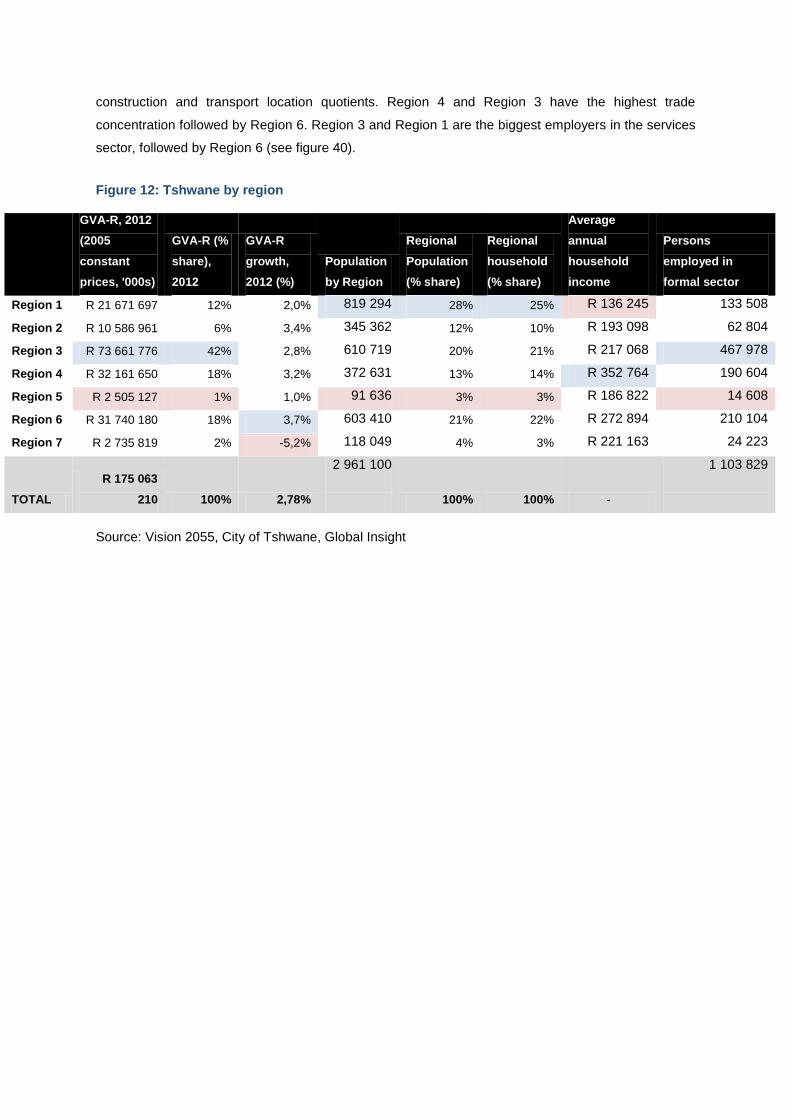
Figure 12: Tshwane by region
GVA-R, 2012
(2005
constant
prices, '000s)
GVA-R (%
share),
2012
GVA-R
growth,
2012 (%)
Population
by Region
Regional
Population
(% share)
Regional
household
(% share)
Average
annual
household
income
Persons
employed in
formal sector
Region 1 R 21 671 697 12% 2,0% 819 294 28% 25% R 136 245 133 508
Region 2 R 10 586 961 6% 3,4% 345 362 12% 10% R 193 098 62 804
Region 3 R 73 661 776 42% 2,8% 610 719 20% 21% R 217 068 467 978
Region 4 R 32 161 650 18% 3,2% 372 631 13% 14% R 352 764 190 604
Region 5 R 2 505 127 1% 1,0% 91 636 3% 3% R 186 822 14 608
Region 6 R 31 740 180 18% 3,7% 603 410 21% 22% R 272 894 210 104
Region 7 R 2 735 819 2% -5,2% 118 049 4% 3% R 221 163 24 223
TOTAL
R 175 063
210 100% 2,78%
2 961 100
100% 100% -
1 103 829
Source: Vision 2055, City of Tshwane, Global Insight
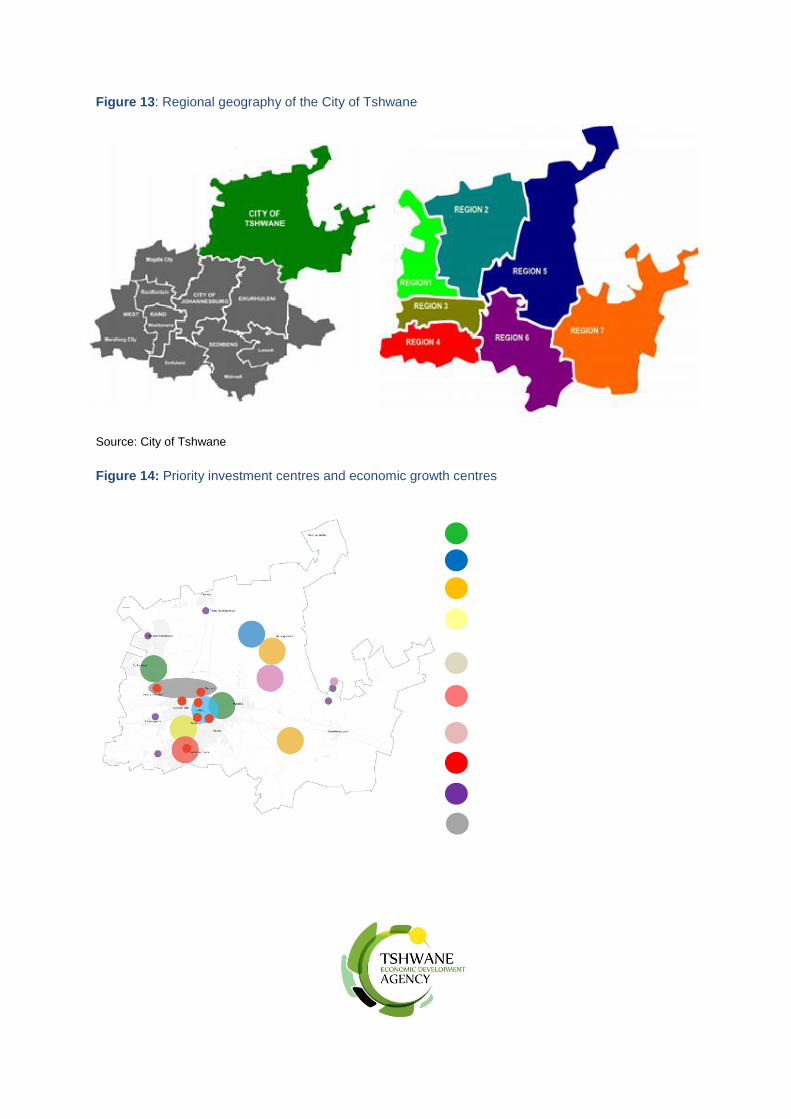
Figure 13: Regional geography of the City of Tshwane
Source: City of Tshwane
Figure 14: Priority investment centres and economic growth centres