city of seattle refrigerant emissions analysis
TRANSCRIPT

City of Seattle Refrigerant Emissions Analysis GHG Emissions Calculation Methodologies
May 5, 2020
pae-engineers.com

This page intentionally left blank

May 5, 2020
City of Seattle Refrigerant Emissions Analysis – 19-1415 pae-engineers.com | i
Table of Contents
Executive Summary .................................................................................................... 1 Literature Review ........................................................................................................ 3
2.1 State of Refrigerant Recovery .............................................................................. 3 2.2 LEED Leakage Methodology ................................................................................. 3 2.3 Life Front Leakage Methodology ........................................................................... 3 2.4 Component Leakage Methodology ......................................................................... 4 2.5 UK Department of Energy & Climate Change Data ................................................... 8 2.6 Lifefront – Leak Rates by System and Application .................................................. 10 2.7 Germany - Research Council for Refrigeration Technology ....................................... 11
Definitions and Key Principles ...................................................................................... 13 3.1 Definitions ........................................................................................................ 13 3.2 Estimating Refrigerant Emissions ......................................................................... 14 3.3 Refrigerant Metrics ............................................................................................ 14
Methodology ............................................................................................................. 16 4.1 Summary of Approach ....................................................................................... 16 The table below shows where the reference values come from. You can see LEED and the UK
Department of Energy & Climate Change (DECC) are the main sources. The other literature papers have supporting data as well. ...................................................... 16
4.2 Refrigerant Boundaries....................................................................................... 18 4.3 Seattle Building Types ....................................................................................... 19 4.4 Mechanical System Types ................................................................................... 20 4.5 Refrigerant Leakage Methodology ........................................................................ 27
Lifecycle Refrigerant Emissions .................................................................................... 29 5.1 Leakage Scenario Timeline ................................................................................. 29 5.2 Applying Leakage to Existing Building Inventory .................................................... 42
Conclusions and Recommendations .............................................................................. 43 References ................................................................................................................ 44
Figures
Figure 1: Refrigerants Lifecycle ................................................................................................ 1 Figure 2: Holes in brazed fitting Source: Life Front – Recommended leak hole size and mass flow rates by system and application characteristics .................................................................................. 4 Figure 3: Leak Size Relative to System Age Source: Life Front – Recommended leak hole size and mass flow rates by system and application characteristics ............................................................ 4 Figure 4: Fitting Types Source: Assessment of Leakage Rate and Durability of Field-made Mechanical Joints for Systems Using Low-GWP Flammable Refrigerants (ASHRAE RP-1808) .............................. 5 Figure 5: Harshness Testing Source: Assessment of Leakage Rate and Durability of Field-made Mechanical Joints for Systems Using Low-GWP Flammable Refrigerants (ASHRAE RP-1808) .............. 5 Figure 6: Fitting Failure Examples Source: Assessment of Leakage Rate and Durability of Field-made Mechanical Joints for Systems Using Low-GWP Flammable Refrigerants (ASHRAE RP-1808) .............. 6 Figure 7: Fitting Failure Rates Source: Assessment of Leakage Rate and Durability of Field-made Mechanical Joints for Systems Using Low-GWP Flammable Refrigerants (ASHRAE RP-1808) .............. 6
May 5, 2020
City of Seattle Refrigerant Emissions Analysis – 19-1415 pae-engineers.com | ii
Figure 8: Leakage by Fitting Type per Year Source: Assessment of Leakage Rate and Durability of Field-made Mechanical Joints for Systems Using Low-GWP Flammable Refrigerants (ASHRAE RP-1808) ........................................................................................................................................... 7 Figure 9: Average Leakage Rate by Connection Source: Assessment of Leakage Rate and Durability of Field-made Mechanical Joints for Systems Using Low-GWP Flammable Refrigerants (ASHRAE RP-1808) ........................................................................................................................................... 8 Figure 10: Leakage Probability by Pipe Length Source: Life Front – Recommended leak hole size and mass flow rates by system and application characteristics ........................................................... 11 Figure 11: Leakage Probability by Pipe Length Source: Life Front – Recommended leak hole size and mass flow rates by system and application characteristics ........................................................... 11 Figure 12: Frequency of Field Applied Joints Source: FORSCHUNGSRAT KÄLTETECHNIK - Tightness of Commercial Refrigeration Systems .......................................................................................... 12 Figure 13: VRF + Mini-split Refrigerant Boundary Example .......................................................... 18 Figure 14: Air Source Heat Pump (ASHP) Boundary Example ....................................................... 19 Figure 15: Refrigerant Pounds/Cooling Ton - Multifamily ............................................................. 21 Figure 16: Refrigerant Pounds/Cooling Ton - Multifamily ............................................................. 21 Figure 17: Refrigerant Pounds/Cooling Ton - Office .................................................................... 22 Figure 18: Refrigerant Pounds/Cooling Ton – Office High Rise ...................................................... 22 Figure 19: Refrigerant Pounds/Cooling Ton – School .................................................................. 23 Figure 20: Refrigerant Load Intensity (RLI) – All Building Types ................................................... 23 Figure 21: Refrigerant Charge Intensity – Multifamily ................................................................. 24 Figure 22: Refrigerant Charge Intensity – Multifamily ................................................................. 25 Figure 23: Refrigerant Charge Intensity – Office ........................................................................ 25 Figure 24: Refrigerant Charge Intensity – Office High Rise .......................................................... 26 Figure 25: Refrigerant Charge Intensity – School ....................................................................... 26 Figure 26: Leakage Scenarios ................................................................................................. 27 Figure 27: GHG Emission Scenarios ......................................................................................... 28 Figure 28: Leakage Scenario Timeline - LEED ............................................................................ 29 Figure 29: LEED Leakage GHG Emission Scenarios ..................................................................... 30 Figure 30: Low Estimated Actual GHG Emission Scenarios ........................................................... 31 Figure 31: High Estimated Actual GHG Emission Scenarios .......................................................... 32 Figure 32: All GHG Emission Scenarios ..................................................................................... 33 Figure 33: School GHG Emission Scenarios ............................................................................... 34 Figure 34: Residential 7+ GHG Emission Scenarios .................................................................... 35 Figure 35: Residential 4-6 GHG Emission Scenarios ................................................................... 35 Figure 36: Office Low Rise GHG Emission Scenarios ................................................................... 36 Figure 37: Office High Rise GHG Emission Scenarios .................................................................. 36 Figure 38: Refrigerant Use Intensity – All Buildings, systems and leak scenarios ............................ 42
Tables
Table 1: Study Leakage Scenarios Source: UK Department of Energy & Climate Change – Impacts of Leakage from Refrigerants in Heat Pumps ................................................................................. 9 Table 2: Study End of Life Leakage Scenarios Source: UK Department of Energy & Climate Change – Impacts of Leakage from Refrigerants in Heat Pumps ................................................................. 10 Table 3: Global Warming Potential of Common Refrigerants ........................................................ 13 Table 4: Refrigerant Leakage Methodology ............................................................................... 27

May 5, 2020
City of Seattle Refrigerant Emissions Analysis – 19-1415 pae-engineers.com | iii
Project Directory
Owner City of Seattle & the C40 Building Analysis & Modeling PAE
1501 E Madison Street Suite 300 Seattle, WA 98122
Allan Montpellier
Principal-in-Charge [email protected]
David Mead
Project Manager [email protected]
Jess Scanlon [email protected] Dave Stecher [email protected]
Carley Heinen
Project Coordinator [email protected]

May 5, 2020
City of Seattle Refrigerant Emissions Analysis – 19-1415 pae-engineers.com | 1
Executive Summary
This analysis aims to assist in a holistic greenhouse gas (GHG) emissions assessment from Seattle’s existing building stock and future construction. This includes analysis of building refrigerant types, volumes and estimated leakage rates.
Refrigerant leakage from heat-pump based building heating and cooling systems can be a significant source of greenhouse gas (GHG) emissions. The diagram below shows the lifecycle of refrigerants. Note how refrigerants can be recovered or leaked to the atmosphere. Globally it is estimated that around 50% of all refrigerants leak into the atmospherei. In the USA, leakage is lower for CFCs but data on HFC refrigerant leakage is not well knownii.
Figure 1: Refrigerants Lifecycle
Better management of refrigerants offers a significant opportunity to reduce our global greenhouse gas (GHG) emissions. The global building industry specifies more refrigerants than any other industryiii. We also have design strategies available today that require little to no harmful refrigerants. Yet, today we highly encourage the use of building systems with large quantities of harmful refrigerants like variable refrigerant flow (VRF) and mini-split systems. These systems are especially prevalent as design solutions in the City of Seattle.
This report outlines a leakage calculation methodology using recent research from ASHRAE and organizations from the European Union. The goal is to use this to set refrigerant emissions estimates for the following building types in the City of Seattle:
— Multifamily (4-6)
— Multifamily (7+)
— Office (Low/mid & High rise)
— School (K-12)
This report considered four mechanical systems commonly used to condition buildings:
— Electric mini-split heat pump
— Variable refrigerant flow (VRF)

May 5, 2020
City of Seattle Refrigerant Emissions Analysis – 19-1415 pae-engineers.com | 2
— Air source heat pump (ASHP) with hydronic distribution
— Natural refrigerant systems
The study works to define metrics for measuring the amount of refrigerant present in a building and how to account for the possible emissions from that system. The metrics are presented based on the building cooling load (in tons) when possible and the building area. The intent is to provide a metric for the city that will assist in greenhouse gas emissions accounting based on building type, system type and refrigerant selection.
This investigation shows that natural refrigerant pose a lower threat to global warming than hydrofluorocarbons (HFCs) and/or traditional refrigerants found in building heating and cooling systems; heating and cooling systems with lower volumes of refrigerants and less connections may reduce possible greenhouse gas emissions over the lifespan of the equipment.
May 5, 2020
City of Seattle Refrigerant Emissions Analysis – 19-1415 pae-engineers.com | 3
Literature Review
2.1 State of Refrigerant Recovery The rate at which refrigerants are released into the atmosphere is debated as data on leakage rates has not been well documented. As a clear, odorless substance it is hard to detect leaks in a system. Leakage rates from refrigerants vary significantly between systems and designs. In general, the larger the refrigerant charge per gross square feet (GSF) of building the higher the risk of refrigerant leakage. This is especially true in site built applications like variable refrigerant flow (VRF) and mini-split systems where refrigerant lines are constructed on-site by HVAC contractors. There are a number of different leakage methodologies that are outlined below.
2.2 LEED Leakage Methodology The U.S. Green Building Council (USGBC) includes refrigerant management in the LEED rating system. There is a mandatory requirement and optional credit for advanced refrigerant management. As part of the credit requirements they include a leakage calculation methodology that assumes a 2% leakage rate per year and 10% leakage at the end of a refrigerant’s life. Many refrigerants typically last around 15 years before they need to be reclaimed, but this varies based on refrigerant type and equipment. The following from the LEED method can be used as an emissions calculation:
— 2% leakage/year of the total refrigerant volume
— 10% leakage of the total volume at 15 years
This is a conservative calculation as most systems tend to see higher leakage rates. It is therefore a good baseline emissions assessment for buildings.
2.3 Life Front Leakage Methodology Life Frontiv is a demonstration project out of the European Union (EU) looking at removing barriers for flammable refrigerants. They have been doing extensive testing of refrigerant systems to quantify the following:
— How many leaks tend to exist in systems?
— What types of leaks are they?
— How big are the leaks in size and what is their flow rate?
— What is a typical annual leakage rate?
— How often do catastrophic leaks occur?
This research is the most detailed leak data found for this study. It represents the best data set known at this time estimating leakage amounts and rates. The Life Front database includes around 250 leak samples from a variety of system types including flammable and HFC refrigerants. They believe leakage rates shouldn’t be affected much by refrigerant type. The study did include two installations where technician interventions created much larger leaks including a 1.1 mm2 hole that was created from a technician repeatedly trying to rebraze a hole closed as seen below:

May 5, 2020
City of Seattle Refrigerant Emissions Analysis – 19-1415 pae-engineers.com | 4
Figure 2: Holes in brazed fitting Source: Life Front – Recommended leak hole size and mass flow rates by system and application characteristics
For large holes like this the entire refrigerant charge can leak out.
The chart below shows the measured leak size relative to the age of a system:
Figure 3: Leak Size Relative to System Age Source: Life Front – Recommended leak hole size and mass flow rates by system and application characteristics
This shows that leakage often happens years after the initial installation as components of the system start to leak. Life Front estimates that the typical leakage rate from systems is 5% per year. They do not address end of life leakage in the data that was found for this report. The leakage rate can then be assumed to be as follows:
— 5% leakage/year of the total refrigerant volume
2.4 Component Leakage Methodology ASHRAE recently funded a studyv to look at leakage of flammable refrigerants as well. HFC leakage has never received as much focus as flammable refrigerants since it has minimal visible impacts to a project as compared to the risk of fire. The research investigated the assembly, durability, and leakage rate of different types of field-made joints for HVAC systems. The research focused on the following joining methods:
— Brazed
— Press/crimp fittings
— Compression fittings

May 5, 2020
City of Seattle Refrigerant Emissions Analysis – 19-1415 pae-engineers.com | 5
— Flare fittings
The image below shows examples of the fittings from the study:
Figure 4: Fitting Types Source: Assessment of Leakage Rate and Durability of Field-made Mechanical Joints for Systems Using Low-GWP Flammable Refrigerants (ASHRAE RP-1808)
The research put all of these fittings through stress tests as follows as an evaluation of the assembly, durability and leakage potential:
Figure 5: Harshness Testing Source: Assessment of Leakage Rate and Durability of Field-made Mechanical Joints for Systems Using Low-GWP Flammable Refrigerants (ASHRAE RP-1808)
The research showed that all the fittings had failures as shown in the image below:

May 5, 2020
City of Seattle Refrigerant Emissions Analysis – 19-1415 pae-engineers.com | 6
Figure 6: Fitting Failure Examples Source: Assessment of Leakage Rate and Durability of Field-made Mechanical Joints for Systems Using Low-GWP Flammable Refrigerants (ASHRAE RP-1808)
The chart below shows the leakage percentage by type and how difficult the connection was. Note how high of a failure rate the compression and flare fittings have.
Figure 7: Fitting Failure Rates Source: Assessment of Leakage Rate and Durability of Field-made Mechanical Joints for Systems Using Low-GWP Flammable Refrigerants (ASHRAE RP-1808)
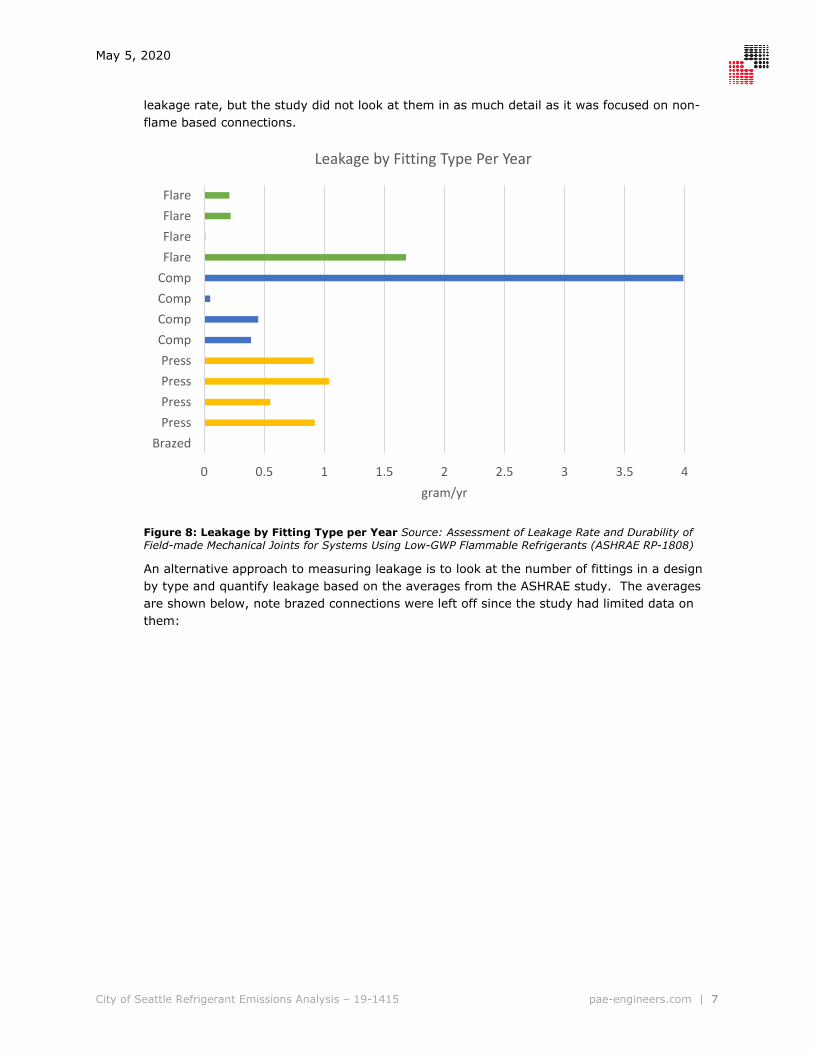
The chart below shows the leakage rate (grams per year) by fitting type per year. There were many leaks reported for the compression and flare fittings which shows the importance of proper leak checking of the systems.
The majority of the leaks observed in flare and compression fittings could be fixed by tightening the fittings. Note how all the connections had leakage. Brazed fittings had a lower
0%10%20%30%40%50%60%70%80%90%
100%
1-1/8 in. 3/8 in. 1-1/8 in. 3/8 in. 3/4 in. 3/8 in. 3/4 in.
Brazed Press Press Compression Compression Flare Flare
Leakage by Fitting Type & Difficulty
Experienced Normal Experienced Difficult Inexperienced Normal Inexperienced Difficult
May 5, 2020
City of Seattle Refrigerant Emissions Analysis – 19-1415 pae-engineers.com | 7
leakage rate, but the study did not look at them in as much detail as it was focused on non-flame based connections.
Figure 8: Leakage by Fitting Type per Year Source: Assessment of Leakage Rate and Durability of Field-made Mechanical Joints for Systems Using Low-GWP Flammable Refrigerants (ASHRAE RP-1808)
An alternative approach to measuring leakage is to look at the number of fittings in a design by type and quantify leakage based on the averages from the ASHRAE study. The averages are shown below, note brazed connections were left off since the study had limited data on them:
0 0.5 1 1.5 2 2.5 3 3.5 4
BrazedPressPressPressPress
CompCompCompCompFlareFlareFlareFlare
gram/yr
Leakage by Fitting Type Per Year

May 5, 2020
City of Seattle Refrigerant Emissions Analysis – 19-1415 pae-engineers.com | 8
Figure 9: Average Leakage Rate by Connection Source: Assessment of Leakage Rate and Durability of Field-made Mechanical Joints for Systems Using Low-GWP Flammable Refrigerants (ASHRAE RP-1808)
For systems where the total number of connections are known these averages could be calculated by fitting type to come up with estimates of leakage rates for a design. PAE has not seen any engineers or manufacturers do any calculations like this to date. A methodology could be established for new buildings, but it will be challenging for many existing buildings where record documents often don’t show total fitting counts.
This research has shown all the connection types leak and have failures and that the failures can vary from small to significant. Brazed fittings likely have the lowest leakage rate, but data was limited on field research, the study did note some failures in these as well from technician errors.
2.5 UK Department of Energy & Climate Change Data The United Kingdom (UK) implemented research recently to better understand refrigerant leakage of systems. The goal of this study was to provide an evidence based assessment of likely leakage rates for different heat pump installations over time in the UK. Driven by the EU F-Gas Regulations it was also important to estimate the likely trends in refrigerant emissions. The key findings from their reportvi (relative to this study) are summarized in the points below (direct text from their executive summary):
1. It was determined from analysis of F-gas log books that annual leakage rates from operation of heat pumps were of the order of 3.8% of installation charge for non-domestic applications and 3.5% for domestic applications;
2. F-gas log books were used to determine leakage rates from heat pump operation, data was collected from 6 organizations which covered 528 unique installations. Analysis of this data suggests that 9% of non-domestic installations and 10% of domestic installations leaked each year;
3. Analysis of the F-gas log books indicated that when leaks occurred, the median proportion of refrigerant lost was 42% for non-domestic installations and 35% for domestic installations;
0.86
1.22
0.53
0
0.2
0.4
0.6
0.8
1
1.2
1.4
Press Comp Flare
gram
s/ye
ar
Average Leakage Rate by Connection

May 5, 2020
City of Seattle Refrigerant Emissions Analysis – 19-1415 pae-engineers.com | 9
4. Analysis of the F-gas Log books also suggests very high proportions of charge loss associated with catastrophic leakage. For non-domestic applications, 75% of refrigerant loss is due to catastrophic leakage, whilst for domestic applications this rises to 92%. This suggests that the proportion of leakage associated with catastrophic failure is very high. As a result, this may represent an area for improvement in heat pump design to reduce the overall impact of leakage;
5. It was determined, however, that these log books were generally of poor quality, with many exhibiting the following characteristics:
a. Refrigerant types not recorded; b. Type of installation was not recorded (i.e. heat pump / chiller etc.) c. Quantities of refrigerant added not recorded; d. Quantities of recovered refrigerant not recorded; e. The ID of the personnel performing the maintenance not recorded; f. Dates and results of leakage checks not recorded; and g. Cause and location of leak not recorded.
6. A further piece of practical research was undertaken to assess the impact of reduced levels of charge upon heat pump performance. These tests suggest that a refrigerant charge reduction of 10% would lead to a relative coefficient of performance (COP) reduction of about 3% in heating and 15% in cooling operation respectively. Undercharging the heat pump by 40% would reduce the relative COP by around 45% in heating mode and 24% in cooling operation. For the heating mode, in particular, this is a very significant reduction in performance;
7. It was determined from the limited data available relating to the supply chain that the leakage from ongoing operation was the major contributor to refrigerant loss from such installations, contributing 90% of quantifiable loss. This proportion declines moderately during the period but remains largely stable, indicating that the vast majority of the impact of refrigerants in heat pumps comes from the ongoing leakage, rather than losses associated with other life-cycle (or supply chain) stages. This indicates that a reduction in operational leakage rates would have the largest impact on refrigerant loss, despite the relatively high rate of loss due to end of life decommissioning. It is clear, therefore, that improvement of leak detection would have a significant impact on the overall loss of refrigerants from heat pumps;
8. The UK analysis clearly suggests that the projected increased roll-out of heat pumps is beneficial in reducing CO2e impacts through the displacement of more carbon intense technologies despite the associated rise in emissions due to refrigerant losses. If losses could be reduced through early leak detection this net benefit would grow further;
9. The analysis suggests that trying to reduce the level of leakage in the short-term whilst incentivizing low GWP refrigerants in the longer term would be the most appropriate course of action to maximize the CO2e benefits associated with heat pumps.
The study also expands on leakage scenarios as shown in the table below:
Table 1: Study Leakage Scenarios Source: UK Department of Energy & Climate Change – Impacts of Leakage from Refrigerants in Heat Pumps

May 5, 2020
City of Seattle Refrigerant Emissions Analysis – 19-1415 pae-engineers.com | 10
The research also looks at end of life leakage scenarios as shown in the table below:
Table 2: Study End of Life Leakage Scenarios Source: UK Department of Energy & Climate Change – Impacts of Leakage from Refrigerants in Heat Pumps
The research notes that there is a large uncertainty on leakage rates at the point of decommissioning. This can also be used as a proxy for reclamation leakage rates. All studies referenced by the UK report note leakage of 10% or higher.
2.6 Lifefront – Leak Rates by System and Application Lifefront released a reportvii on the ‘Recommended leak hole size and mass flow rates by system and application characteristics’ report in 2019. This has a number of interesting research points including estimated leakage probability based on the length of pipe and the size of the hole.

May 5, 2020
City of Seattle Refrigerant Emissions Analysis – 19-1415 pae-engineers.com | 11
Figure 10: Leakage Probability by Pipe Length Source: Life Front – Recommended leak hole size and mass flow rates by system and application characteristics
The chart above tries to predict the probability of a leak based on pipe length. The longer the length the probability of a leak goes up dramatically. The equations to support this are outlined below:
Figure 11: Leakage Probability by Pipe Length Source: Life Front – Recommended leak hole size and mass flow rates by system and application characteristics
A key concept from this research is the estimated leakage rate goes up dramatically based on the length of pipe. This is due to the probability of a leak going up with higher numbers of connections. This applies specifically to site built refrigerant piping in systems like mini-split and variable refrigerant flow (VRF) units. The challenge with the Lifefront equation is that it has a bit of an exponential increase in the chance of leakage based on pipe length. While possible, the equation seems unlikely due to the exponential nature of the equation.
2.7 Germany - Research Council for Refrigeration Technology

May 5, 2020
City of Seattle Refrigerant Emissions Analysis – 19-1415 pae-engineers.com | 12
A German based research project commissioned by the Forschungsrat Kaltetechnik focused on the Tightness of Commercial Refrigeration Systems in Germany. The studyviii analyzes leakage of refrigerants from refrigeration systems in regions of Germany. The research investigated overall leakage rates and sources. The following are some key findings summarized from the study:
1. More than half of all the leakages are in the range of 0.5 to 30 g/a. As far as systems technology, ecological and economic aspects are concerned, this range can virtually be disregarded. This is made clear by the fact that these 51.9% of all leaks contribute only with 1 percent to the total leakage.
2. On the other hand, it must be stated that 14.4% of the identified leaks in the range of 1,001 to 10,000 g/a make up 85% of the refrigerant loss in the systems.
3. This corresponds with the results of the statistical evaluation. The leak rates of the investigated systems are within the normal logarithmic distribution. This results in a 95% predictability that the mean of all leaks is in a reliability range (confidence interval) between 25.3 and 66.9 g/a. The mean as the most frequent and thus the most probable leak rate for all leaks is 41.9 g/a.
4. It is interesting that of the 104 identified leaks 18 occurred in the cycle components and 86 in the assembly joints.
5. 96% of the total refrigerant loss was through field assembled joints.
6. 15% of the leaks were responsible for 85% of refrigerant loss.
7. 21.6% of all detected leaks where flared joints – They are responsible for close to 50% of lost refrigerant.
The chart below shows the issue with field applied joints. This research clearly shows there are significant issues in buildings with field built refrigeration systems as 96% of the losses happened in field assembled joints.
Figure 12: Frequency of Field Applied Joints Source: FORSCHUNGSRAT KÄLTETECHNIK - Tightness of Commercial Refrigeration Systems

May 5, 2020
City of Seattle Refrigerant Emissions Analysis – 19-1415 pae-engineers.com | 13
Definitions and Key Principles
3.1 Definitions GLOBAL WARMING POTENTIAL
Refrigerants are a threat to our natural environment because of their high global warming potential (GWP). A small volume released into the atmosphere is thousands of times more harmful than the same volume of carbon dioxide released into the atmosphere. The table below lists the GWP of refrigerants commonly used in building systems. Notice that natural refrigerants have significantly lower global warming potentials than HFCs. Natural refrigerants present a solution to efficient building conditioning with lower emissions.
Table 3: Global Warming Potential of Common Refrigerants
Refrigerant GWP 100
Chlorofluorocarbons
CFC-11 4,680
CFC-12 10,720
CFC-114 9,800
CFC-500 7,900
CFC-502 4,600
Hydrochlorofluorocarbons HCFC-22 1,780
HCFC-123 76
Hydrofluorocarbons
HFC-23 12,240
HFC-134a 1,320
HFC-245fa 1,020
HFC-404A 3,900
HFC-407C 1,700
HFC-410A 1,890
HFC-507A 3,900
Natural Refrigerants
Carbon Dioxide (CO2) 1
Ammonia (NH3) 0
Propane 3
GWP is used to normalize emissions accounting and enable comparisons between different greenhouse gases. Volumes of gas emitted into the atmosphere are presented in pounds of carbon dioxide equivalent (lb CO2e). This is a widely accepted measurement to compare the danger of one type of greenhouse gas to another. Carbon dioxide is assumed to have a GWP of one.
TERM DEFINITIONS
REFRIGERANT CHARGE - The total mass of refrigerant (pounds (lb)) in a system LEAKAGE RATES - The annual mass of refrigerant (pounds/yr) in a system leaked into the atmosphere (typically from field assembled fittings)

May 5, 2020
City of Seattle Refrigerant Emissions Analysis – 19-1415 pae-engineers.com | 14
LEED - The rating system established by the U.S. Green Building Council and the credits that pertain to refrigerant management. MECHANICAL SYSTEM TYPES - These were established as example systems for this study. There are many variations on each of the system types shown but these represent examples from actual buildings that have been designed or are in the design process in the Puget Sound region.
3.2 Estimating Refrigerant Emissions The volume of refrigerants in a building is dependent on a myriad of variables. Refrigerant charge is directly tied to the mechanical load for heating and cooling a building as well as the type of system chosen to meet those loads.
The cooling load (peak condition for system sizing in a building) is most often the larger between heating and cooling loads and often defines the size of the mechanical equipment and therefore the volume of refrigerant charge. The cooling load of a building depends on the building’s location, façade design, occupant density, lighting design and equipment use. Anything that introduces heat into the building creates a cooling load. This may include, but is not limited to, large areas of poor performing, south-facing glass, densely occupied spaces, and/or an abundance of electrical equipment (i.e. multiple monitors, desktops and other equipment one workstation).
3.3 Refrigerant Metrics Standardized metrics are needed to measure the impact of refrigerant leakage in terms of annual greenhouse gas (GHG) emissions. Though there is research on leakage rates, metrics specific to refrigerant charge and losses were not found in the literature review. In order to have metrics that can be used for estimating overall emissions and compare designs PAE has developed the following metrics for use in this study.
REFRIGERANT LBS / LOAD TON
Measuring performance in terms of pounds (lbs) of refrigerant per load ton is a method to have an apples to apples comparison of HVAC system designs. This can be used for comparing systems and designs as the load on a building is what drives the size of mechanical heating and cooling equipment. By comparing it by load, factors like higher occupant density don’t misrepresent a design. For example, an office building with dense seating layouts will have a higher load. The refrigerant charge will thus be higher to meet the load, but different mechanical systems can meet the same load with different charges. The systems with the lowest charge are thus better.
REFRIGERANT LOAD INTENSITY (RLI)
In order to compare system designs in terms of the total refrigerant charge PAE has created a metric titled Refrigerant Load Intensity (RLI). Similar to the lbs/load ton metric this metric looks at comparable designs but measures the overall global warming potential per cooling or heating ton (GWP/ton) instead of just pounds of refrigerant. This is important as a natural refrigerant with a GWP of 1 could have a higher charge in pounds, but a fraction of the potential emissions.
May 5, 2020
City of Seattle Refrigerant Emissions Analysis – 19-1415 pae-engineers.com | 15
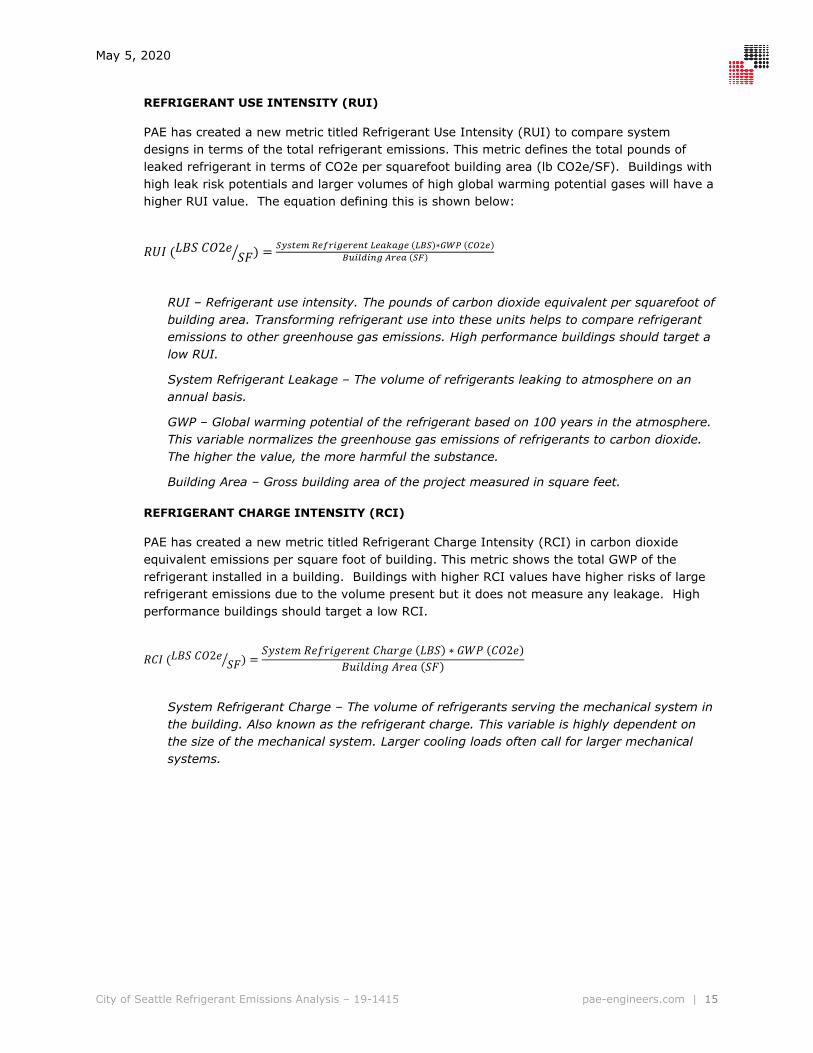
REFRIGERANT USE INTENSITY (RUI)
PAE has created a new metric titled Refrigerant Use Intensity (RUI) to compare system designs in terms of the total refrigerant emissions. This metric defines the total pounds of leaked refrigerant in terms of CO2e per squarefoot building area (lb CO2e/SF). Buildings with high leak risk potentials and larger volumes of high global warming potential gases will have a higher RUI value. The equation defining this is shown below:
𝑅𝑅𝑅𝑅𝑅𝑅 (𝐿𝐿𝐿𝐿𝐿𝐿 𝐶𝐶𝐶𝐶2𝑒𝑒𝐿𝐿𝑆𝑆� ) = 𝑆𝑆𝑆𝑆𝑆𝑆𝑆𝑆𝑆𝑆𝑆𝑆 𝑅𝑅𝑆𝑆𝑅𝑅𝑅𝑅𝑅𝑅𝑅𝑅𝑆𝑆𝑅𝑅𝑆𝑆𝑅𝑅𝑆𝑆 𝐿𝐿𝑆𝑆𝐿𝐿𝐿𝐿𝐿𝐿𝑅𝑅𝑆𝑆 (𝐿𝐿𝐿𝐿𝑆𝑆)∗𝐺𝐺𝐺𝐺𝐺𝐺 (𝐶𝐶𝐶𝐶2𝑆𝑆)
𝐿𝐿𝐵𝐵𝑅𝑅𝐵𝐵𝐵𝐵𝑅𝑅𝑅𝑅𝑅𝑅 𝐴𝐴𝑅𝑅𝑆𝑆𝐿𝐿 (𝑆𝑆𝑆𝑆)
RUI – Refrigerant use intensity. The pounds of carbon dioxide equivalent per squarefoot of building area. Transforming refrigerant use into these units helps to compare refrigerant emissions to other greenhouse gas emissions. High performance buildings should target a low RUI.
System Refrigerant Leakage – The volume of refrigerants leaking to atmosphere on an annual basis.
GWP – Global warming potential of the refrigerant based on 100 years in the atmosphere. This variable normalizes the greenhouse gas emissions of refrigerants to carbon dioxide. The higher the value, the more harmful the substance.
Building Area – Gross building area of the project measured in square feet.
REFRIGERANT CHARGE INTENSITY (RCI)
PAE has created a new metric titled Refrigerant Charge Intensity (RCI) in carbon dioxide equivalent emissions per square foot of building. This metric shows the total GWP of the refrigerant installed in a building. Buildings with higher RCI values have higher risks of large refrigerant emissions due to the volume present but it does not measure any leakage. High performance buildings should target a low RCI.
𝑅𝑅𝐶𝐶𝑅𝑅 (𝐿𝐿𝐿𝐿𝐿𝐿 𝐶𝐶𝐶𝐶2𝑒𝑒𝐿𝐿𝑆𝑆� ) =
𝐿𝐿𝑆𝑆𝑆𝑆𝑆𝑆𝑒𝑒𝑆𝑆 𝑅𝑅𝑒𝑒𝑅𝑅𝑅𝑅𝑅𝑅𝑅𝑅𝑒𝑒𝑅𝑅𝑒𝑒𝑅𝑅𝑆𝑆 𝐶𝐶ℎ𝑎𝑎𝑅𝑅𝑅𝑅𝑒𝑒 (𝐿𝐿𝐿𝐿𝐿𝐿) ∗ 𝐺𝐺𝐺𝐺𝐺𝐺 (𝐶𝐶𝐶𝐶2𝑒𝑒)𝐿𝐿𝐵𝐵𝑅𝑅𝐵𝐵𝐵𝐵𝑅𝑅𝑅𝑅𝑅𝑅 𝐴𝐴𝑅𝑅𝑒𝑒𝑎𝑎 (𝐿𝐿𝑆𝑆)
System Refrigerant Charge – The volume of refrigerants serving the mechanical system in the building. Also known as the refrigerant charge. This variable is highly dependent on the size of the mechanical system. Larger cooling loads often call for larger mechanical systems.

May 5, 2020
City of Seattle Refrigerant Emissions Analysis – 19-1415 pae-engineers.com | 16
Methodology
4.1 Summary of Approach In order to estimate GHG emissions from refrigerants the total charge and leakage rates for different system types needs to be established. Based on the literature review, these rates are a trend for actual leakage data that shows significant differences between site built and factory built equipment. In order to address these differences the following leakage scenarios were established.
System Type LEED Method Low Estimated Actual High Estimated Actual
Annual % Reclamation
% Lost Annual % Reclamation % Lost Annual % Reclamation
% Lost
ASHP & Hydronic 2% 10% 2% 10% 4% 15%
Mini-Split 2% 10% 4% 10% 9% 20%
VRF 2% 10% 4% 10% 9% 20%
The table below shows where the reference values come from. You can see LEED and the UK Department of Energy & Climate Change (DECC) are the main sources. The other literature papers have supporting data as well. See section 4.5 for additional information on the refrigerant leakage methodology.
System Type LEED Method Low Estimated Actual High Estimated Actual
Annual % Reclamation
% Lost Annual % Reclamation % Lost Annual % Reclamation
% Lost
ASHP & Hydronic LEED LEED DECC (low)
DECC (low)
DECC (central)
DECC (central)
Mini-Split LEED LEED DECC (central)
DECC (low)
DECC (high average)
DECC (high)
VRF LEED LEED DECC (central)
DECC (low)
DECC (high average)
DECC (high)
Details on each leakage method are described in the refrigerant leakage methodology section of this report. The refrigerant charges were established by using data from project designs PAE has been involved with. Each charge was given a +/-20% range to show the potential variations in building loads which can drive the total refrigerant charge. Though this is a reasonable estimate actual loads can vary more than this if buildings have higher occupancy density or larger façade loads. Based on the total volumes of refrigerant for each building and system combination leakage scenarios were then applied. These created the total leakage amount which has been shown in terms of the total GHG/ft² of each building type. By creating an emissions metric per square foot the City can use these to estimate emissions from the Seattle building stock.

May 5, 2020
City of Seattle Refrigerant Emissions Analysis – 19-1415 pae-engineers.com | 17
These results are very specific to the Seattle climate and building stock. Any emissions data shown should not be applied to other regions and climate zones as the RUI values can vary significantly by region.
May 5, 2020
City of Seattle Refrigerant Emissions Analysis – 19-1415 pae-engineers.com | 18
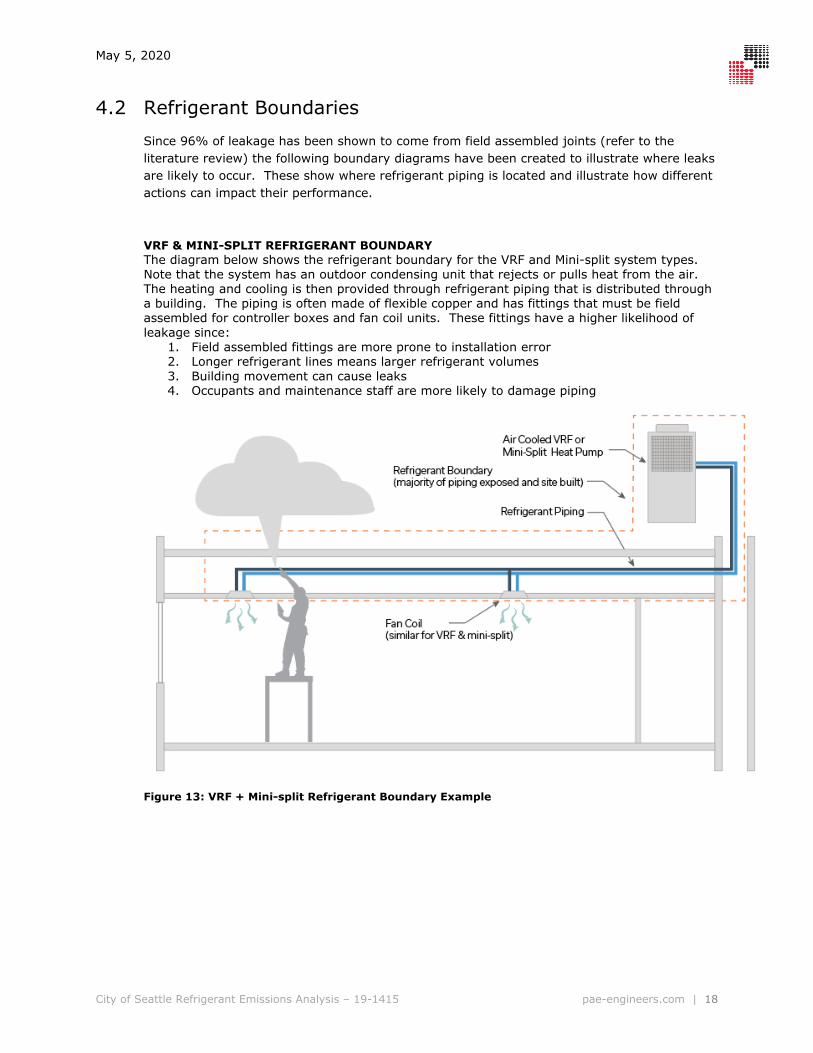
4.2 Refrigerant Boundaries Since 96% of leakage has been shown to come from field assembled joints (refer to the literature review) the following boundary diagrams have been created to illustrate where leaks are likely to occur. These show where refrigerant piping is located and illustrate how different actions can impact their performance.
VRF & MINI-SPLIT REFRIGERANT BOUNDARY The diagram below shows the refrigerant boundary for the VRF and Mini-split system types. Note that the system has an outdoor condensing unit that rejects or pulls heat from the air. The heating and cooling is then provided through refrigerant piping that is distributed through a building. The piping is often made of flexible copper and has fittings that must be field assembled for controller boxes and fan coil units. These fittings have a higher likelihood of leakage since:
1. Field assembled fittings are more prone to installation error 2. Longer refrigerant lines means larger refrigerant volumes 3. Building movement can cause leaks 4. Occupants and maintenance staff are more likely to damage piping
Figure 13: VRF + Mini-split Refrigerant Boundary Example

May 5, 2020
City of Seattle Refrigerant Emissions Analysis – 19-1415 pae-engineers.com | 19
AIR SOURCE HEAT PUMP The diagram below shows the refrigerant boundary for the air source heat pump (ASHP). Note that the system has all of the refrigerant contained in the mechanical equipment. Heating and cooling is accomplished through hydronic (water) piping through the building. Refrigerant fittings are limited to those inside of the mechanical equipment. These are far less prone to leakage based on the literature review. This is due to less stress put upon them and better quality control that occurs inside of manufacturing facilities. Note, ASHP units can include either HFC gases or newer natural refrigerants.
Figure 14: Air Source Heat Pump (ASHP) Boundary Example
4.3 Seattle Building Types The following building types were included in this study:
Building Type
Multifamily (4-6 Levels)
Multifamily (7+ Levels)
Low/Mid Rise Office
High Rise Office
School (K-12) Note the large office is 100,000 sf and larger. Small/mid offices are 20,000 – 99,999 sf.

May 5, 2020
City of Seattle Refrigerant Emissions Analysis – 19-1415 pae-engineers.com | 20
4.4 Mechanical System Types The system selected to meet building loads has a large impact on reducing overall refrigerant volumes. Variable refrigerant flow systems (VRF) that pipe refrigerants around the building to individual zones may use significantly higher volumes than heat pumps that localize the charge in one place. More runs and connections in the VRF systems may lead to a higher likelihood of leaks and increased greenhouse gas emissions. The following heating and cooling system types were included in this study:
Building Type Majority Factory
Fittings Majority Field
Assembled Fittings
Electric mini-split heat pump X
Variable refrigerant flow (VRF) X
Air source heat pump (ASHP) with hydronic distribution (HFC refrigerants)
X
Air source heat pump (ASHP) with hydronic distribution (Natural refrigerants)
X
May 5, 2020
City of Seattle Refrigerant Emissions Analysis – 19-1415 pae-engineers.com | 21
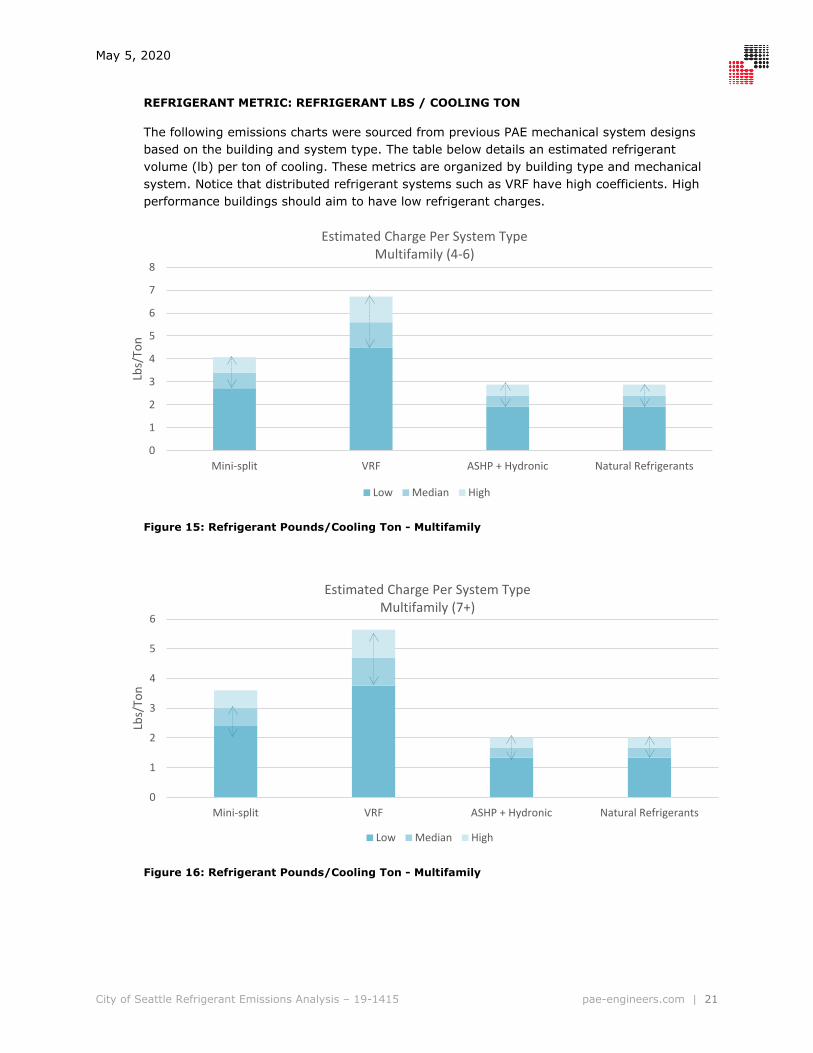
REFRIGERANT METRIC: REFRIGERANT LBS / COOLING TON
The following emissions charts were sourced from previous PAE mechanical system designs based on the building and system type. The table below details an estimated refrigerant volume (lb) per ton of cooling. These metrics are organized by building type and mechanical system. Notice that distributed refrigerant systems such as VRF have high coefficients. High performance buildings should aim to have low refrigerant charges.
Figure 15: Refrigerant Pounds/Cooling Ton - Multifamily
Figure 16: Refrigerant Pounds/Cooling Ton - Multifamily
0
1
2
3
4
5
6
7
8
Mini-split VRF ASHP + Hydronic Natural Refrigerants
Lbs/
Ton
Estimated Charge Per System TypeMultifamily (4-6)
Low Median High
0
1
2
3
4
5
6
Mini-split VRF ASHP + Hydronic Natural Refrigerants
Lbs/
Ton
Estimated Charge Per System TypeMultifamily (7+)
Low Median High

May 5, 2020
City of Seattle Refrigerant Emissions Analysis – 19-1415 pae-engineers.com | 22
Figure 17: Refrigerant Pounds/Cooling Ton - Office
Figure 18: Refrigerant Pounds/Cooling Ton – Office High Rise
0
1
2
3
4
5
6
Mini-split VRF ASHP + Hydronic Natural Refrigerants
Lbs/
Ton
Estimated Charge Per System TypeOffice - Low/mid
Low Median High
0
1
2
3
4
5
6
7
8
Mini-split VRF ASHP + Hydronic Natural Refrigerants
Lbs/
Ton
Estimated Charge Per System TypeOffice - High Rise
Low Median High

May 5, 2020
City of Seattle Refrigerant Emissions Analysis – 19-1415 pae-engineers.com | 23
Figure 19: Refrigerant Pounds/Cooling Ton – School
REFRIGERANT METRIC: RLI (REFRIGERANT LOAD INTENSITY)
The chart below shows the RLI values for each of the building and system types. Note how the natural refrigerants have almost no values. This metric can be used to show the overall risk created by adding HFC gases to a building (by measuring the GWP converted to Mt CO2e per ton of heating or cooling). The lower the value the less risk of a large GHG release to the atmosphere.
Figure 20: Refrigerant Load Intensity (RLI) – All Building Types
0
1
2
3
4
5
6
7
Mini-split VRF ASHP + Hydronic Natural Refrigerants
Lbs/
Ton
Estimated Charge Per System TypeSchool (K-12)
Low Median High
0
1
2
3
4
5
6
Residential -Multifamily (4-6)
Residential -Multifamily (7+)
Office - Low/mid Office - High rise School ( K-12 )
Mt C
O2e
/Ton
Refrigerant Load Intensity (RLI) - Mt CO2e/ Ton
Mini-split VRF ASHP + Hydronic Natural Refrigerants
May 5, 2020
City of Seattle Refrigerant Emissions Analysis – 19-1415 pae-engineers.com | 24
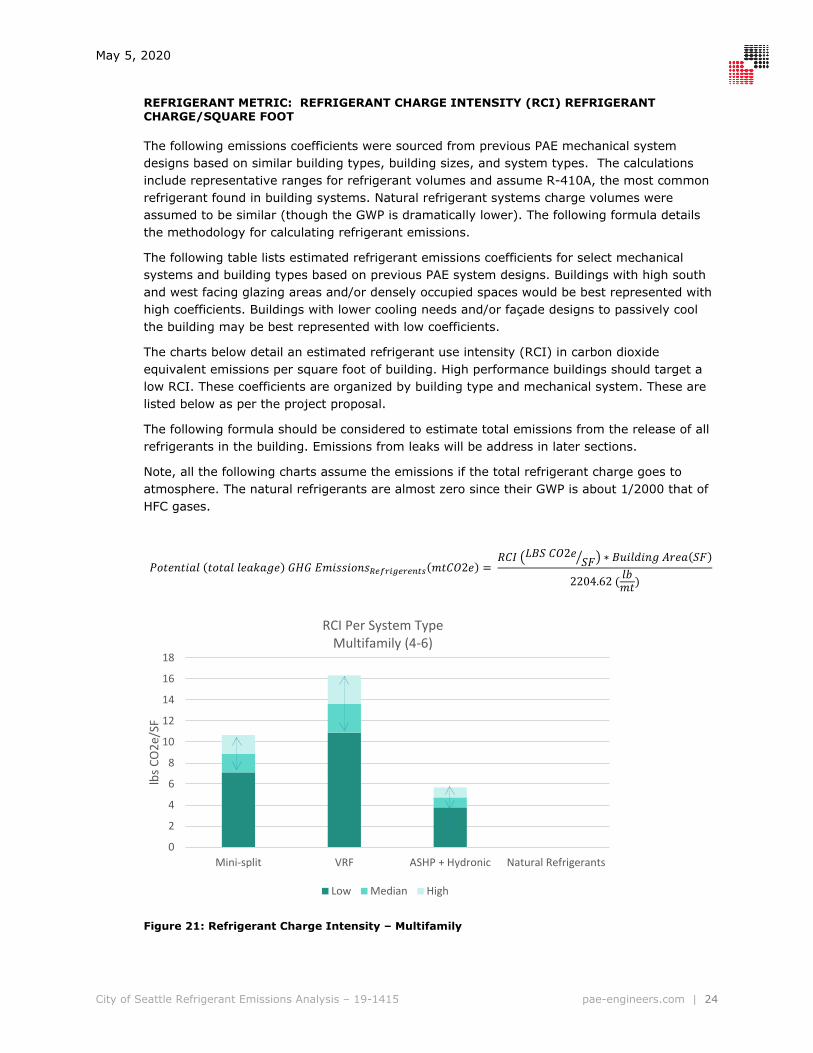
REFRIGERANT METRIC: REFRIGERANT CHARGE INTENSITY (RCI) REFRIGERANT CHARGE/SQUARE FOOT
The following emissions coefficients were sourced from previous PAE mechanical system designs based on similar building types, building sizes, and system types. The calculations include representative ranges for refrigerant volumes and assume R-410A, the most common refrigerant found in building systems. Natural refrigerant systems charge volumes were assumed to be similar (though the GWP is dramatically lower). The following formula details the methodology for calculating refrigerant emissions.
The following table lists estimated refrigerant emissions coefficients for select mechanical systems and building types based on previous PAE system designs. Buildings with high south and west facing glazing areas and/or densely occupied spaces would be best represented with high coefficients. Buildings with lower cooling needs and/or façade designs to passively cool the building may be best represented with low coefficients.
The charts below detail an estimated refrigerant use intensity (RCI) in carbon dioxide equivalent emissions per square foot of building. High performance buildings should target a low RCI. These coefficients are organized by building type and mechanical system. These are listed below as per the project proposal.
The following formula should be considered to estimate total emissions from the release of all refrigerants in the building. Emissions from leaks will be address in later sections.
Note, all the following charts assume the emissions if the total refrigerant charge goes to atmosphere. The natural refrigerants are almost zero since their GWP is about 1/2000 that of HFC gases.
𝐺𝐺𝑃𝑃𝑆𝑆𝑒𝑒𝑅𝑅𝑆𝑆𝑅𝑅𝑎𝑎𝐵𝐵 (𝑆𝑆𝑃𝑃𝑆𝑆𝑎𝑎𝐵𝐵 𝐵𝐵𝑒𝑒𝑎𝑎𝑙𝑙𝑎𝑎𝑅𝑅𝑒𝑒) 𝐺𝐺𝐺𝐺𝐺𝐺 𝐸𝐸𝑆𝑆𝑅𝑅𝑆𝑆𝑆𝑆𝑅𝑅𝑃𝑃𝑅𝑅𝑆𝑆𝑅𝑅𝑆𝑆𝑅𝑅𝑅𝑅𝑅𝑅𝑅𝑅𝑆𝑆𝑅𝑅𝑆𝑆𝑅𝑅𝑆𝑆𝑆𝑆(𝑆𝑆𝑆𝑆𝐶𝐶𝐶𝐶2𝑒𝑒) = 𝑅𝑅𝐶𝐶𝑅𝑅 �𝐿𝐿𝐿𝐿𝐿𝐿 𝐶𝐶𝐶𝐶2𝑒𝑒
𝐿𝐿𝑆𝑆� � ∗ 𝐿𝐿𝐵𝐵𝑅𝑅𝐵𝐵𝐵𝐵𝑅𝑅𝑅𝑅𝑅𝑅 𝐴𝐴𝑅𝑅𝑒𝑒𝑎𝑎(𝐿𝐿𝑆𝑆)
2204.62 ( 𝐵𝐵𝑙𝑙𝑆𝑆𝑆𝑆)
Figure 21: Refrigerant Charge Intensity – Multifamily
0
2
4
6
8
10
12
14
16
18
Mini-split VRF ASHP + Hydronic Natural Refrigerants
lbs C
O2e
/SF
RCI Per System TypeMultifamily (4-6)
Low Median High

May 5, 2020
City of Seattle Refrigerant Emissions Analysis – 19-1415 pae-engineers.com | 25
Figure 22: Refrigerant Charge Intensity – Multifamily
Figure 23: Refrigerant Charge Intensity – Office
0
2
4
6
8
10
12
14
16
Mini-split VRF ASHP + Hydronic Natural Refrigerants
lbs C
O2e
/SF
RCI Per System TypeMultifamily (7+)
Low Median High
0
5
10
15
20
25
30
Mini-split VRF ASHP + Hydronic Natural Refrigerants
lbs C
O2e
/SF
RCI Per System TypeOffice - Low/mid
Low Median High

May 5, 2020
City of Seattle Refrigerant Emissions Analysis – 19-1415 pae-engineers.com | 26
Figure 24: Refrigerant Charge Intensity – Office High Rise
Figure 25: Refrigerant Charge Intensity – School
0
5
10
15
20
25
Mini-split VRF ASHP + Hydronic Natural Refrigerants
lbs C
O2e
/SF
RCI Per System TypeOffice - High Rise
Low Median High
0
5
10
15
20
25
30
35
Mini-split VRF ASHP + Hydronic Natural Refrigerants
lbs C
O2e
/SF
RCI Per System TypeSchool (K-12)
Low Median High

May 5, 2020
City of Seattle Refrigerant Emissions Analysis – 19-1415 pae-engineers.com | 27
4.5 Refrigerant Leakage Methodology The amount of refrigerant released into the atmosphere is dependent on a multitude of factors depending on the charge of the system, the location of refrigerants in the building, the craftsmanship of the system installation. Based on the literature review on refrigerant leakage the following methodology has been used for the rest of the study:
Table 4: Refrigerant Leakage Methodology
System Type LEED Method Low Estimated Actual High Estimated Actual
Annual % Reclamation % Lost Annual % Reclamation
% Lost Annual % Reclamation % Lost
ASHP & Hydronic 2% 10% 2% 10% 4% 15% Mini-Split 2% 10% 4% 10% 9% 20% VRF 2% 10% 4% 10% 9% 20%
Figure 26: Leakage Scenarios
By setting three scenarios it shows the potential variation in leakage across systems. Here is a quick summary of each leakage scenario:
LEED METHOD
The LEED rating system has included a refrigerant management credit for a very long time that is a standard for estimating refrigerant usage in buildings. The leakage scenario within LEED is an idealized scenario based on the literature review. In the other studies, almost no systems had leakage rates on average as low as this. The LEED assumptions can be viewed as a best in class system with minimal to no leakage.
LOW ESTIMATED ACTUAL METHOD
The low estimated actual method pulls data from a few sources within the literature review. The UK, German and Life Front studies all had average annual leakage rates of around 3-5% from field research. The literature was also very clear that field assembled fittings create the majority of leaks. Thus the systems with a majority of field assembled joints (VRF and mini-
2%
10%
2%
10%
4%
15%
2%
10%
4%
10%9%
20%
2%
10%
4%
10%9%
20%
0%
5%
10%
15%
20%
25%
Annual % Reclamation % Lost Annual % Reclamation % Lost Annual % Reclamation % Lost
LEED Method Low Estimated Actual High Estimated Actual
Leakage Scenarios
ASHP & Hydronic Mini-Split VRF
May 5, 2020
City of Seattle Refrigerant Emissions Analysis – 19-1415 pae-engineers.com | 28
split) have the 4% leakage rate while the ASHP & hydronic system has the lower 2% value. The DECC study identified end of life leakage rates which supported the LEED assumption of 10% used here as the low estimate.
HIGH ESTIMATED ACTUAL METHOD
The high estimated actual method includes values from the literature review that show that field assembled joints have higher rates of failure and that the annual overall leakage can be close to 10%. It also takes data from end of life leakage and applies the higher rates to the point of reclamation. Though this high emissions scenario is much higher than the other methods it is in line with measured data from the literature review and can be used as a reasonable estimate for setting ranges of possible emissions from buildings.
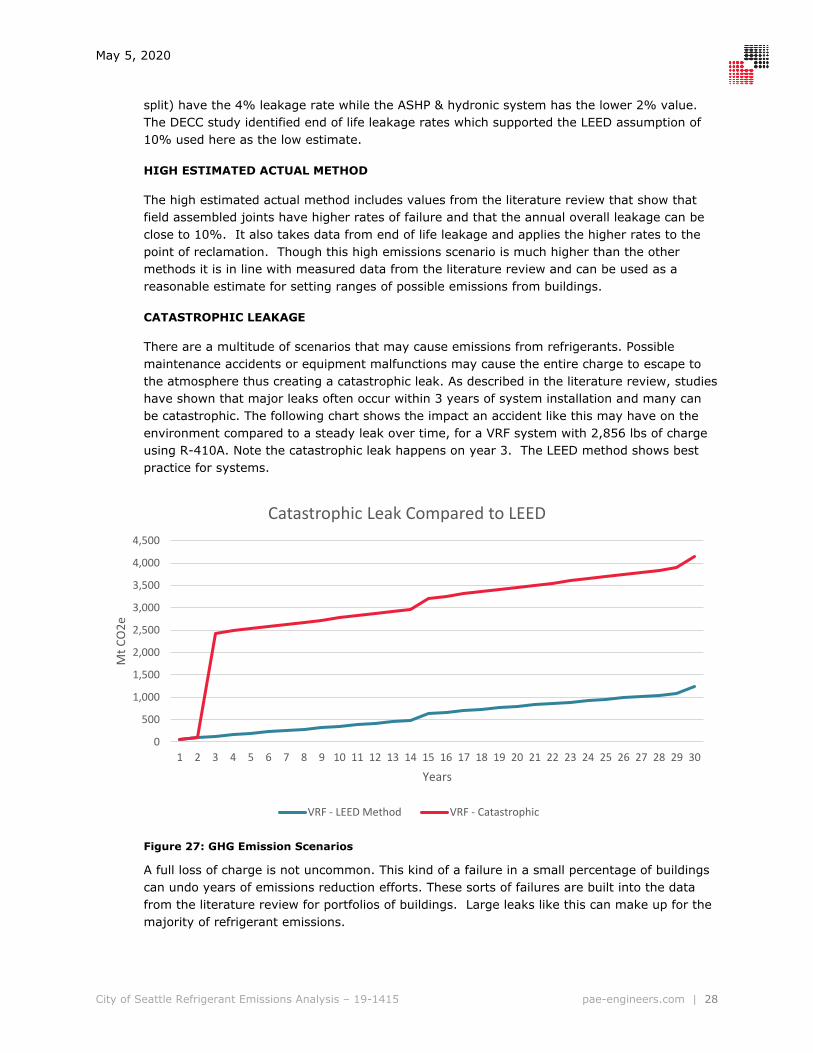
CATASTROPHIC LEAKAGE
There are a multitude of scenarios that may cause emissions from refrigerants. Possible maintenance accidents or equipment malfunctions may cause the entire charge to escape to the atmosphere thus creating a catastrophic leak. As described in the literature review, studies have shown that major leaks often occur within 3 years of system installation and many can be catastrophic. The following chart shows the impact an accident like this may have on the environment compared to a steady leak over time, for a VRF system with 2,856 lbs of charge using R-410A. Note the catastrophic leak happens on year 3. The LEED method shows best practice for systems.
Figure 27: GHG Emission Scenarios
A full loss of charge is not uncommon. This kind of a failure in a small percentage of buildings can undo years of emissions reduction efforts. These sorts of failures are built into the data from the literature review for portfolios of buildings. Large leaks like this can make up for the majority of refrigerant emissions.
0
500
1,000
1,500
2,000
2,500
3,000
3,500
4,000
4,500
1 2 3 4 5 6 7 8 9 10 11 12 13 14 15 16 17 18 19 20 21 22 23 24 25 26 27 28 29 30
Mt C
O2e
Years
Catastrophic Leak Compared to LEED
VRF - LEED Method VRF - Catastrophic
May 5, 2020
City of Seattle Refrigerant Emissions Analysis – 19-1415 pae-engineers.com | 29
Lifecycle Refrigerant Emissions
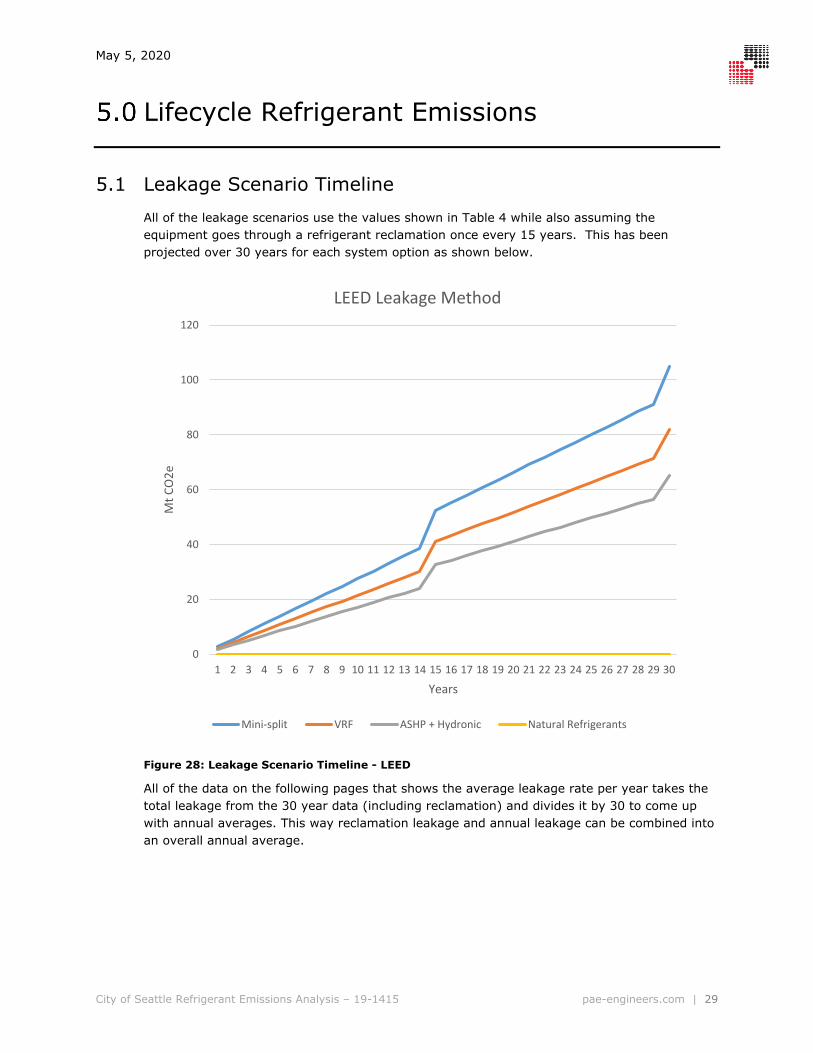
5.1 Leakage Scenario Timeline All of the leakage scenarios use the values shown in Table 4 while also assuming the equipment goes through a refrigerant reclamation once every 15 years. This has been projected over 30 years for each system option as shown below.
Figure 28: Leakage Scenario Timeline - LEED
All of the data on the following pages that shows the average leakage rate per year takes the total leakage from the 30 year data (including reclamation) and divides it by 30 to come up with annual averages. This way reclamation leakage and annual leakage can be combined into an overall annual average.
0
20
40
60
80
100
120
1 2 3 4 5 6 7 8 9 10 11 12 13 14 15 16 17 18 19 20 21 22 23 24 25 26 27 28 29 30
Mt C
O2e
Years
LEED Leakage Method
Mini-split VRF ASHP + Hydronic Natural Refrigerants

May 5, 2020
City of Seattle Refrigerant Emissions Analysis – 19-1415 pae-engineers.com | 30
RUI 30 YEAR AVERAGE LEAKAGE – LEED
The chart below shows the average leakage (lbs CO2e/SF/yr) for each building type and system using the LEED method. These values include the reclamation data and the annual leakage data as an average. Note, the LEED leakage methodology is a best case scenario. The literature review clearly shows almost all real world leakage rates are higher than this when surveying portfolios of buildings. It does not mean every building will have this leakage rate but on average across a portfolio these are the predicted rates.
Figure 29: LEED Leakage GHG Emission Scenarios
0.0
0.2
0.4
0.6
0.8
1.0
1.2
1.4
1.6
1.8
2.0
2.2
2.4
Mini-split VRF ASHP + Hydronic Natural Refrigerants
lbs C
O2e
/SF/
yr
Refrigerant Use Intensity (LEED Leakage)
School Resi 7+ Resi 4-6 Office (low rise) Office (high rise)

May 5, 2020
City of Seattle Refrigerant Emissions Analysis – 19-1415 pae-engineers.com | 31
RUI 30 YEAR AVERAGE LEAKAGE – LOW ESTIMATED ACTUAL
The chart below shows the average leakage (lbs CO2e/SF/yr) for each building type and system using the low estimated actual method. These values include the LEED estimated 10% reclamation data and the annual leakage data from the literature review as an average. Note, the low estimated actual leakage methodology is a likely scenario. The literature review clearly shows many of the real world annual leakage studies are similar to this. These numbers would be reasonable values to use when projecting emissions from refrigerant leakage across a portfolio of buildings.
Figure 30: Low Estimated Actual GHG Emission Scenarios
0.0
0.2
0.4
0.6
0.8
1.0
1.2
1.4
1.6
1.8
2.0
2.2
2.4
Mini-split VRF ASHP + Hydronic Natural Refrigerants
lbs C
O2e
/SF/
yr
Refrigerant Use Intensity (Low Estimated Actual Leakage)
School Resi 7+ Resi 4-6 Office (low rise) Office (high rise)
May 5, 2020
City of Seattle Refrigerant Emissions Analysis – 19-1415 pae-engineers.com | 32
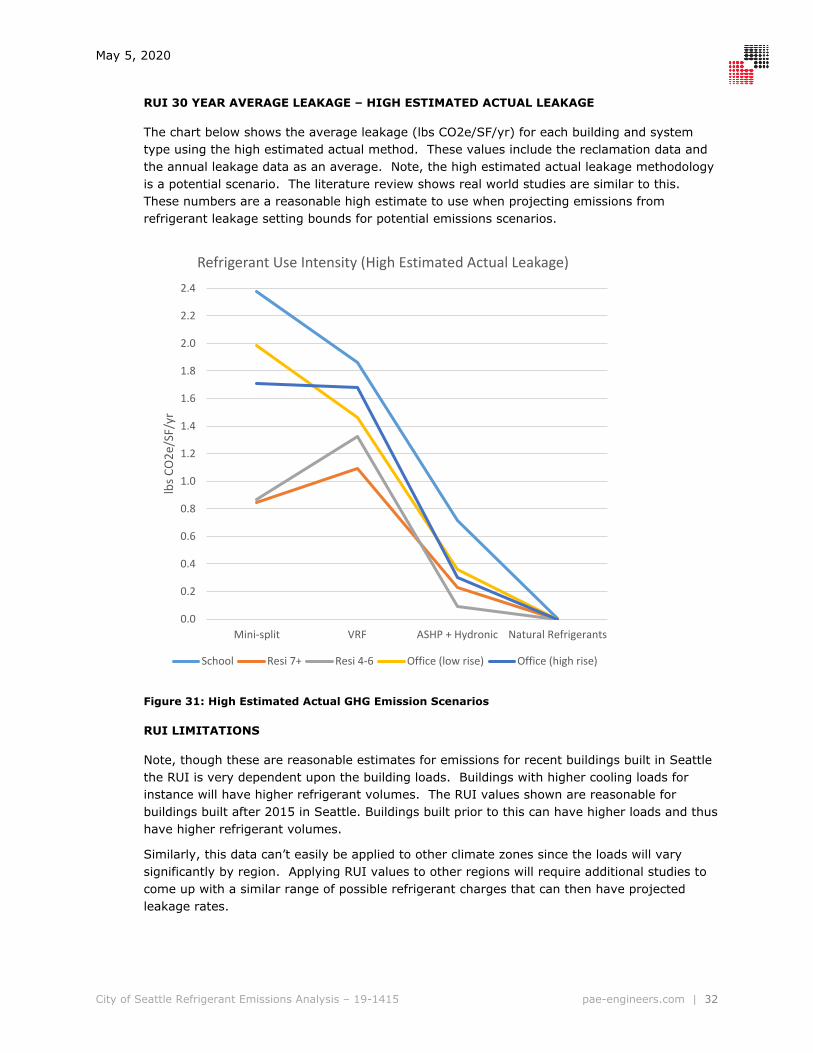
RUI 30 YEAR AVERAGE LEAKAGE – HIGH ESTIMATED ACTUAL LEAKAGE
The chart below shows the average leakage (lbs CO2e/SF/yr) for each building and system type using the high estimated actual method. These values include the reclamation data and the annual leakage data as an average. Note, the high estimated actual leakage methodology is a potential scenario. The literature review shows real world studies are similar to this. These numbers are a reasonable high estimate to use when projecting emissions from refrigerant leakage setting bounds for potential emissions scenarios.
Figure 31: High Estimated Actual GHG Emission Scenarios
RUI LIMITATIONS
Note, though these are reasonable estimates for emissions for recent buildings built in Seattle the RUI is very dependent upon the building loads. Buildings with higher cooling loads for instance will have higher refrigerant volumes. The RUI values shown are reasonable for buildings built after 2015 in Seattle. Buildings built prior to this can have higher loads and thus have higher refrigerant volumes.
Similarly, this data can’t easily be applied to other climate zones since the loads will vary significantly by region. Applying RUI values to other regions will require additional studies to come up with a similar range of possible refrigerant charges that can then have projected leakage rates.
0.0
0.2
0.4
0.6
0.8
1.0
1.2
1.4
1.6
1.8
2.0
2.2
2.4
Mini-split VRF ASHP + Hydronic Natural Refrigerants
lbs C
O2e
/SF/
yr
Refrigerant Use Intensity (High Estimated Actual Leakage)
School Resi 7+ Resi 4-6 Office (low rise) Office (high rise)
May 5, 2020
City of Seattle Refrigerant Emissions Analysis – 19-1415 pae-engineers.com | 33
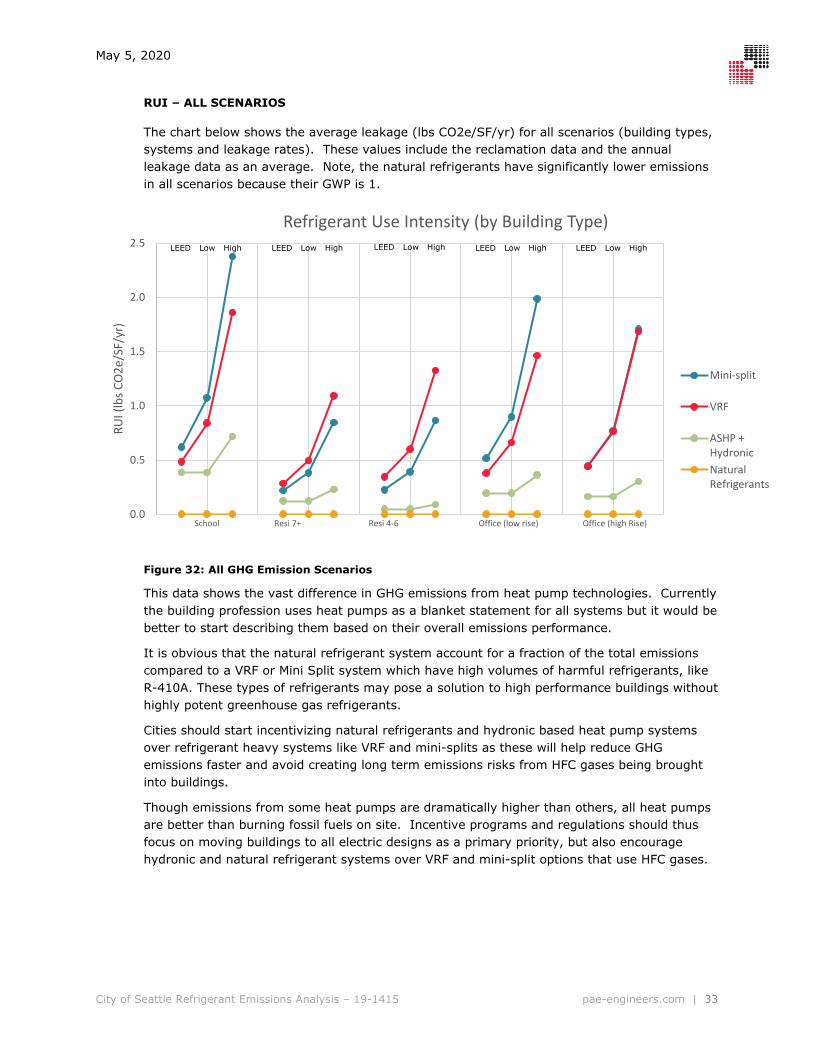
RUI – ALL SCENARIOS
The chart below shows the average leakage (lbs CO2e/SF/yr) for all scenarios (building types, systems and leakage rates). These values include the reclamation data and the annual leakage data as an average. Note, the natural refrigerants have significantly lower emissions in all scenarios because their GWP is 1.
Figure 32: All GHG Emission Scenarios
This data shows the vast difference in GHG emissions from heat pump technologies. Currently the building profession uses heat pumps as a blanket statement for all systems but it would be better to start describing them based on their overall emissions performance.
It is obvious that the natural refrigerant system account for a fraction of the total emissions compared to a VRF or Mini Split system which have high volumes of harmful refrigerants, like R-410A. These types of refrigerants may pose a solution to high performance buildings without highly potent greenhouse gas refrigerants.
Cities should start incentivizing natural refrigerants and hydronic based heat pump systems over refrigerant heavy systems like VRF and mini-splits as these will help reduce GHG emissions faster and avoid creating long term emissions risks from HFC gases being brought into buildings.
Though emissions from some heat pumps are dramatically higher than others, all heat pumps are better than burning fossil fuels on site. Incentive programs and regulations should thus focus on moving buildings to all electric designs as a primary priority, but also encourage hydronic and natural refrigerant systems over VRF and mini-split options that use HFC gases.
0.0
0.5
1.0
1.5
2.0
2.5
RUI (
lbs C
O2e
/SF/
yr)
School Resi 7+ Resi 4-6 Office (low rise) Office (high Rise)
Refrigerant Use Intensity (by Building Type)
Mini-split
VRF
ASHP +HydronicNaturalRefrigerants
LEED Low High LEED Low High LEED Low High LEED Low High LEED Low High
May 5, 2020
City of Seattle Refrigerant Emissions Analysis – 19-1415 pae-engineers.com | 34
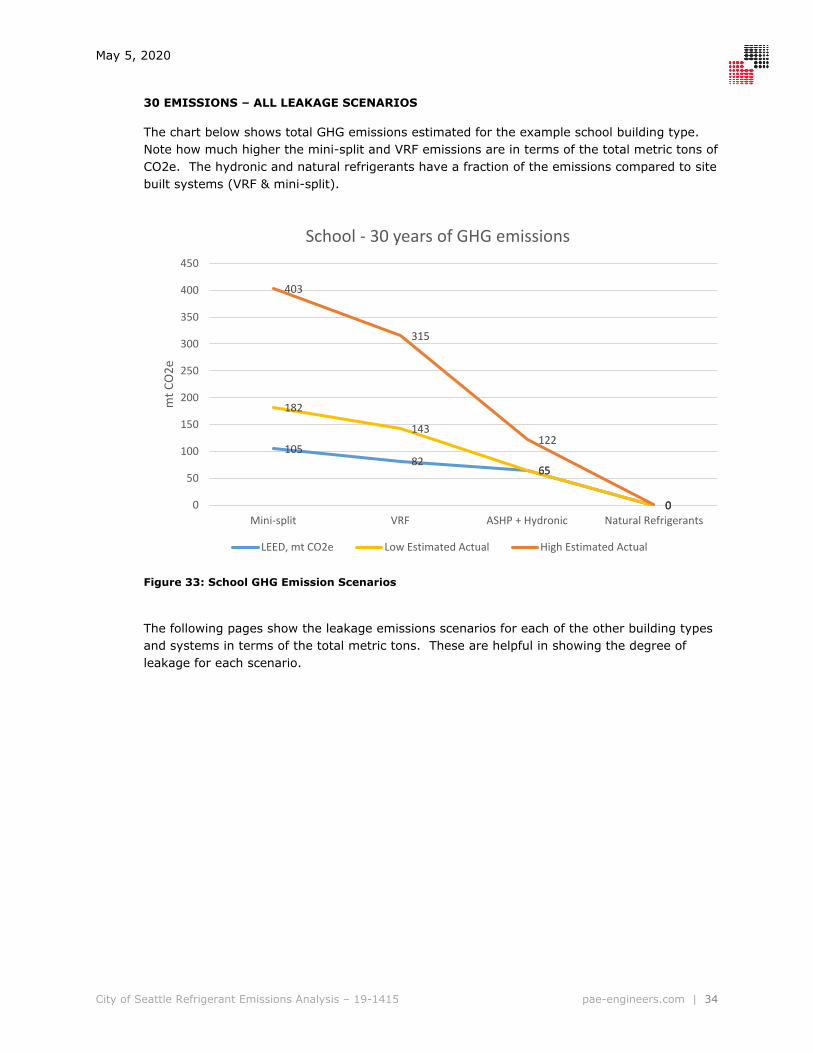
30 EMISSIONS – ALL LEAKAGE SCENARIOS
The chart below shows total GHG emissions estimated for the example school building type. Note how much higher the mini-split and VRF emissions are in terms of the total metric tons of CO2e. The hydronic and natural refrigerants have a fraction of the emissions compared to site built systems (VRF & mini-split).
Figure 33: School GHG Emission Scenarios
The following pages show the leakage emissions scenarios for each of the other building types and systems in terms of the total metric tons. These are helpful in showing the degree of leakage for each scenario.
10582
65
0
182
143
65
0
403
315
122
00
50
100
150
200
250
300
350
400
450
Mini-split VRF ASHP + Hydronic Natural Refrigerants
mt C
O2e
School - 30 years of GHG emissions
LEED, mt CO2e Low Estimated Actual High Estimated Actual

May 5, 2020
City of Seattle Refrigerant Emissions Analysis – 19-1415 pae-engineers.com | 35
Figure 34: Residential 7+ GHG Emission Scenarios
Figure 35: Residential 4-6 GHG Emission Scenarios
377487
211
0
654
846
211
0
1,448
1,871
394
10
200
400
600
800
1,000
1,200
1,400
1,600
1,800
2,000
Mini-split VRF ASHP + Hydronic Natural Refrigerants
mt C
O2e
Residential 7+ - 30 years of GHG emissions
LEED, mt CO2e Low Estimated Actual High Estimated Actual
1,2071,849
257 0
2,096
3,211
257 0
4,636
7,102
48010
1,000
2,000
3,000
4,000
5,000
6,000
7,000
8,000
Mini-split VRF ASHP + Hydronic Natural Refrigerants
mt C
O2e
Residential 4-6 - 30 years of GHG emissions
LEED, mt CO2e Low Estimated Actual High Estimated Actual

May 5, 2020
City of Seattle Refrigerant Emissions Analysis – 19-1415 pae-engineers.com | 36
Figure 36: Office Low Rise GHG Emission Scenarios
Figure 37: Office High Rise GHG Emission Scenarios
936689
352
1
1,625
1,196
352
1
3,596
2,646
657
10
500
1,000
1,500
2,000
2,500
3,000
3,500
4,000
Mini-split VRF ASHP + Hydronic Natural Refrigerants
mt C
O2e
Office Low Rise - 30 years of GHG emissions
LEED, mt CO2e Low Estimated Actual High Estimated Actual
1,450 1,431
528
1
2,519 2,485
528
1
5,572 5,497
986
20
1,000
2,000
3,000
4,000
5,000
6,000
Mini-split VRF ASHP + Hydronic Natural Refrigerants
mt C
O2e
Office High Rise - 30 years of GHG emissions
LEED, mt CO2e Low Estimated Actual High Estimated Actual

May 5, 2020
City of Seattle Refrigerant Emissions Analysis – 19-1415 pae-engineers.com | 37
SCHOOL EMISSIONS – RUI BY LEAKAGE SCENARIO
0.00
0.20
0.40
0.60
0.80
Mini-split VRF ASHP + Hydronic Natural Refrigerants
Annual Emissions (lbs/CO2e/SF)
Low Median High
0.00
0.20
0.40
0.60
0.80
1.00
1.20
1.40
Mini-split VRF ASHP + Hydronic Natural Refrigerants
Annual Emissions (lbs/CO2e/SF)
Low Median High
0.00
0.50
1.00
1.50
2.00
2.50
3.00
Mini-split VRF ASHP + Hydronic Natural Refrigerants
Annual Emissions (lbs/CO2e/SF)
Low Median High
LEED
Low Estimated Actual
High Estimated Actual

May 5, 2020
City of Seattle Refrigerant Emissions Analysis – 19-1415 pae-engineers.com | 38
RESIDENTIAL 7+ EMISSIONS – RUI BY LEAKAGE SCENARIO
0.00
0.10
0.20
0.30
0.40
Mini-split VRF ASHP + Hydronic Natural Refrigerants
Annual Emissions (lbs/CO2e/SF)
Low Median High
0.000.100.200.300.400.500.600.70
Mini-split VRF ASHP + Hydronic Natural Refrigerants
Annual Emissions (lbs/CO2e/SF)
Low Median High
0.00
0.20
0.40
0.60
0.80
1.00
1.20
1.40
Mini-split VRF ASHP + Hydronic Natural Refrigerants
Annual Emissions (lbs/CO2e/SF)
Low Median High
LEED
Low Estimated Actual
High Estimated Actual

May 5, 2020
City of Seattle Refrigerant Emissions Analysis – 19-1415 pae-engineers.com | 39
RESIDENTIAL 4-6 EMISSIONS – RUI BY LEAKAGE SCENARIO
0.00
0.10
0.20
0.30
0.40
0.50
Mini-split VRF ASHP + Hydronic Natural Refrigerants
Annual Emissions (lbs/CO2e/SF)
Low Median High
0.000.100.200.300.400.500.600.700.80
Mini-split VRF ASHP + Hydronic Natural Refrigerants
Annual Emissions (lbs/CO2e/SF)
Low Median High
0.00
0.20
0.40
0.60
0.80
1.00
1.20
1.40
1.60
1.80
Mini-split VRF ASHP + Hydronic Natural Refrigerants
Annual Emissions (lbs/CO2e/SF)
Low Median High
LEED
Low Estimated Actual
High Estimated Actual

May 5, 2020
City of Seattle Refrigerant Emissions Analysis – 19-1415 pae-engineers.com | 40
OFFICE LOW RISE EMISSIONS – RUI BY LEAKAGE SCENARIO
0.00
0.20
0.40
0.60
0.80
Mini-split VRF ASHP + Hydronic Natural Refrigerants
Annual Emissions (lbs/CO2e/SF)
Low Median High
0.00
0.20
0.40
0.60
0.80
1.00
1.20
Mini-split VRF ASHP + Hydronic Natural Refrigerants
Annual Emissions (lbs/CO2e/SF)
Low Median High
0.00
0.50
1.00
1.50
2.00
2.50
3.00
Mini-split VRF ASHP + Hydronic Natural Refrigerants
Annual Emissions (lbs/CO2e/SF)
Low Median High
LEED
Low Estimated Actual
High Estimated Actual

May 5, 2020
City of Seattle Refrigerant Emissions Analysis – 19-1415 pae-engineers.com | 41
OFFICE HIGH RISE EMISSIONS – RUI BY LEAKAGE SCENARIO
0.00
0.20
0.40
0.60
Mini-split VRF ASHP + Hydronic Natural Refrigerants
Annual Emissions (lbs/CO2e/SF)
Low Median High
0.00
0.20
0.40
0.60
0.80
1.00
Mini-split VRF ASHP + Hydronic Natural Refrigerants
Annual Emissions (lbs/CO2e/SF)
Low Median High
0.00
0.50
1.00
1.50
2.00
2.50
Mini-split VRF ASHP + Hydronic Natural Refrigerants
Annual Emissions (lbs/CO2e/SF)
Low Median High
LEED
Low Estimated Actual
High Estimated Actual

May 5, 2020
City of Seattle Refrigerant Emissions Analysis – 19-1415 pae-engineers.com | 42
5.2 Applying Leakage to Existing Building Inventory The summary chart below shows the refrigerant use intensity (RUI) values for each building and system type along with each leakage scenario. These values can be applied to the Seattle building portfolio to estimate overall emissions.
Figure 38: Refrigerant Use Intensity – All Buildings, systems and leak scenarios
The distribution of the mechanical system types was not part of this study but based on recent project experience PAE would estimate almost all heat pumps being installed in the City are either mini-split or VRF systems. When doing holistic GHG calculations for buildings in Seattle (measuring the operational, embodied and refrigerant emissions) PAE has found refrigerant leakage can be the second highest source of emissions after embodied carbon. This high number is driven by how clean the Seattle City Light electricity is but it clearly shows refrigerant emissions need to be part of the decision making process.
0.0
0.5
1.0
1.5
2.0
2.5
RUI (
lbs C
O2e
/SF/
yr)
School Resi 7+ Resi 4-6 Office (low rise) Office (high Rise)
Refrigerant Use Intensity (by Building Type)
Mini-split
VRF
ASHP +HydronicNaturalRefrigerants
LEED Low High LEED Low High LEED Low High LEED Low High LEED Low High

May 5, 2020
City of Seattle Refrigerant Emissions Analysis – 19-1415 pae-engineers.com | 43
Conclusions and Recommendations
CONCLUSIONS
1. Leakage rates from refrigerants vary significantly between systems and designs. Here are a few key details when evaluating potential leakage rates:
- The larger the refrigerant charge the higher the risk of leakage since larger volumes of refrigerant are present in a building.
- Higher numbers of fittings for designs creates higher leakage rates as most fittings have some level of leakage over their life.
- Site built systems with refrigerant being distributed through buildings will have higher chances of leakage for the following reasons:
- Site built systems are more prone to installer error (compared to factory systems)
- Site built systems have more connections which creates higher leakage rates
- Distributed refrigerant lines are more prone to leakage from building movement than packaged equipment (where refrigerant lines can be better protected).
- Research data shows that 96% of the total refrigerant loss was through field assembled joints.
2. RUI is a new metric that can be used in comparative analysis for new building heating and cooling systems but is very climate specific. Values in this report should not be applied to other climate regions.
3. RLI is a new metric that can be used to compare system designs for the total risk of leakage
RECOMMENDATIONS
1. Refrigerant emissions have not traditionally been included when looking at heat pump technologies. In the City of Seattle, these can be much higher than operational emissions when using Seattle City Light GHG emissions rates (and avoiding burning fossil fuels). Estimated refrigerant leakage emissions should be used for emissions estimates moving forward.
2. The dramatic differences in predicted emissions from different heat pump technologies shows that heat pumps should not be treated equally, but should be identified based on their leakage risks.
3. Projects with a goal to reduce refrigerant leakage should use HVAC technologies where refrigerants are contained inside of packaged units.
4. Natural refrigerants such as propane and CO2 have a dramatically lower global warming potential than HFCs. These types of refrigerants present a pathway to meeting climate action plans. They are already being incorporated in many building systems in Asian and European market due to their low GWP. They should start being incentivized over other heat pump technologies.

May 5, 2020
City of Seattle Refrigerant Emissions Analysis – 19-1415 pae-engineers.com | 44
References
i https://www.drawdown.org/solutions/materials/refrigerant-management ii https://www.drawdown.org/solutions/materials/refrigerant-management iii https://www.ipcc.ch/site/assets/uploads/2018/02/ipcc_wg3_ar5_chapter9.pdf iv http://lifefront.eu/about-us/ v https://docs.lib.purdue.edu/cgi/viewcontent.cgi?article=2939&context=iracc vi Impacts of Leakage from Refrigerants in Heat Pumps. Department of Energy & Climate Change. Eunomia Research & Consulting Ltd and the Centre for Air Conditioning and Refrigeration Research. March 2014. vii http://lifefront.eu/wp-content/uploads/2019/10/recommended-leak-hole-size-and-mass-flow-rates-by-system-and-application-characteristics-october-2019.pdf viii https://www.fluorocarbons.org/wp-content/uploads/2001/01/tightness-commercial-refrigeration.pdf