city of richmond a result, global economic ... the rbc economists expect british columbia's...
TRANSCRIPT

City of Richmond
Report to Committee
To: Finance Committee Date: February 8, 2013
From: Jerry Chong File: Director, Finance
Re: Financial Information - 4 th Quarter December 31, 2012
Staff Recommendati.on
That the report titled Financial Information - 4th Quarter December 31 , 2012 be received for information.
Jerry Chong Director, Finance (604-276-4064)
REPORT CONCURRENCE
ROUTED To: CONCURRENCE CONCURRENCE OF GENERAL MANAGER
Affordable Housing liZ! ~---'-Business Licences !iLl' Economic Development g'
Recreation Services [2f Engineering [i Project Development IZl Sewerage & Drainage 0 Water Services [J'
Community Bylaws g Fire Rescue [i1
RCMP ~
Building Approvals Ii Development Applications ~ Transportation Parks [i REVIEWED BY SMT INITIALS: REVIEWED BY CAO l01):' SUBCOMMITTEE ~
'J .
FIN - 9

February 8, 2013 - 2 -
Staff Report
Origin
Financial information for the 4th quarter ended December 31, 2012 is being provided to Council for review. Global and more specific economic updates outline the current environment with respect to Canada, the Province of B.C., and the City of Richmond. The City's financial results, significant revenues, investments, capital projects and other key indicator information are provided.
Analysis
Global Economic Overview l
• Economists at TD Bank feel the global economic momentum remained soft during the fourth quarter as industrial output and trade weakened across most regions. As a result, global economic growth will slow to 2.9% this year, 0.2 percentage points lower than their September forecast.
• Next year, emerging markets like China should regain some momentum owing to the Chinese government's intention to double their per-capita by the year 2020. This should allow global economic activity to accelerate, but economic growth will remain sub-par at 3.2% in 2013.
• Between the US and Europe, political risks loom large in the Canadian economic outlook. Fiscal consolidation and private deleveraging have resulted in protracted recessions in Greece and Portugal, and to a lesser extent in Italy and Spain, while the rest of the common currency area has seen very modest growth. Rising unemployment levels and a weak regional backdrop will keep economic activity subdued, exacerbating the challenge of fiscal consolidation.
Canadian Economic Overvie~,3
The US fiscal cliff, a European recession and the resulting dampening impact on commodity prices are the biggest challenges facing the Canadian economy over the next six months. Domestic demand is also likely to be further tempered by a slowing housing market.
• TD Bank economists believe now that a compromise on the U.S. fiscal cliff has been reached, fiscal consolidation in the US alone could shave up to 0.7 percentage points off Canadian economic growth through lower exports and the knock-on-effects to other areas of the economy in 2013.
1 TD Economics Quarterly Economic Forecast - Global Outlook December 2012 2 TD Economics Quarterly Economic Forecast - Canadian Outlook December 2012 3 TD Economics Quarterly Economic Forecast - February 8th
, 2013 Data Releases
3797568 FIN - 10

February 8, 2013 - 3 -
• Canadian housing starts plunged into 2013 , falling to 160,577 (seasonally adjusted at annual rates) in January, the lowest level since July 2009. Despite January's drop, housing starts have averaged 186,000 units over the last three months, a level that is consistent with demographic fundamentals.
• The Canadian job market started 2013 on a sour note, as it gave back 22,000 net new positions in January. This outcome was four times as large as what the market had been expecting. On a three-month and six month moving average, job creation was 21 ,900 and 27,000 respectively.
• The national unemployment rate inched down 0.1 percentage points to 7.0% in January. While this is the lowest jobless rate in four years, the improvement came on the heels of fewer people looking for work. Labour force participation decreased from 66.8% in December to 66.6% in January.
Table 1 (.,!'~'!'. !H.::(I{'l~('l l'j ["'l"~ ;·'~1~I>':f·~~;~~F.~ .. ;;,. . :' '. .. . ' . . .. :1·· .. . ~ . -. . ' .
2012 2013 2014 Annual Average 4th Qtr/4th Qtr
Q1 I Q2 I Q3 I Q4F Q1F I Q2F I Q3F I Q4F Q1F I Q2F I Q3F I Q4F 12F 113F 114F 12F 113F 114F Real GOP 1.7 1.7 0.6 1.2 1.7 2.1 2.4 2.6 2.7 2.5 2.3 2.2 2.0 1.7 2.5 1.3 2.2 2.4 Labour Force 0.8 2.1 0.7 1.8 1.3 1.2 1.2 1.2 1.0 1.0 1.0 1.0 1.0 1.3 1.1 1.3 1.2 1.0 Unemployment Rate 7.4 7.3 7.3 7.3 7.4 7.5 7.5 7.4 7.3 7.1 7.1 6.9 7.3 7.4 7.1 -- - -Cons. Price Index (Y/y) 2.3 1.6 1.2 1.4 2.1 2.4 2.1 2.0 2.1 2.1 2.1 2.1 1.6 2.2 2.1 1.4 2.0 2.1 Core CPI (Y/y) 2.1 2.0 1.5 1.5 1.7 1.6 1.8 1.8 1.8 1.9 2.0 2.0 1.8 1.7 1.9 1.5 1.8 2.0 Housing Starts (ODD's) 206 231 222 203 196 194 194 197 186 185 184 185 216 195 185 -- - -Productility: Real GOP I worker (Y/Y) 1.3 1.7 0.6 ~ -0.2 -0.2 0.4 0.6 1.1 1.1 1.1 1.0 0.8 0.8 0.5 1:0 -0.2 1.1 0.8 F: Forecast by TD Econorrics as at DecentJer 2012 Source: Statistics Cananda, Bank of Canada, Canada Mortgage and Housing Corporation, Haver Analy tics
Province of B.C. Economic Overview 4
The RBC economists expect British Columbia's economy to be successful in overcoming the drag generated by the downturn of its housing market and more extensive public sector restraint in 2013. Improving demand from the United States and stronger non-residential investment will provide solid support for the province's economic growth to maintain a fairly steady course. They project British Columbia's real GDP to grow by 2.3% in 2013, only slightly faster than the 2.1 % that they forecasted for 2012 (both rates will nearly match the national averages). Their initial take on the 2014 outlook keeps the course almost unaltered, as they project a growth rate of 2.6% that year.
• The BC economy enters 2013 dealing with a substantial cooling of its previously red-hot . housing market. While a moderation in home prices is a welcomed development for many households in the province - considering the poor levels of affordability of the province's largest market, Vancouver. The correction in home re-sales casts a large shadow on residential investment in the province (home ownership transfer costs, which are directly related to the volume of real estate activity, represent approximately one-fifth of residential investment) . RBC believes that lower levels of home re-sales will cause new home construction to decline in 2013.
4 Royal Bank Economics - Provincial Outlook , December 2012
3797568 FIN - 11

February 8, 2013 - 4-
• Another challenge facing the BC economy in 2013 will be a tightening in public administration spending, particularly at the provincial level. The BC government recently announced that it must aim at more ambitious expenditure targets than previously set (including for wages in the public service) in light of weaker than earlier anticipated revenues from natural gas royalties.
• On a more positive note, RBC economists believe that further recovery in the US housing sector will benefit British Columbia's economy disproportionately. RBC expects US housing starts to continue climbing out of their deep hole in 2013 and 2014, which bodes well for further gains in what was traditionally the province's top export commodity. RBC believes that the turnaround in exports to the United States will more than offset any possible weakening in other markets such as China.
Table 2 ' British Columbia forecast at a glance % change unless otherwise indicated
.3:~ Real GDP 2,8 2,1 2.3 2.6 Employment 0.8 1,7 1.4 1.4 Unemployment rate (%) 7,5 6,8 6.5 6.4 Retail Sales 3,1 2,7 3.1 3.7 Housing starts (units) 26,400 27,700 23,800 23,500 Consumer price index 2,3 1.3 1.2 1.7 Source: Royal Bank Economics - Provincial Outlook - December 2012
• Labour market weakness observed near the tail end of2012 extended into January as B.C.'s economy shed jobs for a third time in four months. Estimated total employment in the province fell to a seasonally adjusted 2.298 million persons, marking a decline of 0.7 per cent or 15,900 persons from December. The decline was led by a two per cent tumble in the number of part-time employed individuals, while full-time employment also dipped by 0.3%.
• Dollar volume of building permits issued by B.C. municipalities fell for a third consecutive month in December as non-residential activity pulled back sharply, and residential builders slowed activity Total building permits reached an estimated $697.5 million which marked a 14.5% decline from November, and extended the downside momentum observed since May.
3797568 FIN - 12

February 8, 2013
Table 3
- 5-
Buildlng Permits B.C., M onthly
Dollars (Mill ions.s.a_l 1.400-,,-----,---,.-----,--------,----,-----,
1.20~-++____1---t__--_+_-___..,._+---___1--___l
1 .ooo-tl-N-~ffM=f'-~-+_--+--+1_l_---__lH+lnH
60~---___1--~~·~L-_+_--~---___1--___l
40·~---___1--~+_\~-_+_--_+---___1--___l
2o.~~""~~""~+m~""~~~~~~~~~~ 200.7 200.8 2(}"09 20.10. 2(111 20.1 2
Sour~e: Statistics Cana d.a and Cent ra l 1
Lower Mainland Overviews, 6
Economic activity in the lower mainland region is expected to hold steady through 2013 on moderate employment gains and modest growth in housing activity.
• While sales in the Lower Mainland were already in decline prior to tighter federal mortgage insurance rules, downward momentum accelerated as some buyers were priced out of the market for their desired properties and availability of government-backed mortgage insurance was limited to homes with a purchase price of less than $1 million
Table 4
ILower Mai nland M ILS'! Home Prke Index MOllthly
1" d...,,@1l05-11l0)
1 7~ I----,
6 --. .--. /
~
.-/. ,.........,,"\ ~ ,-:;.--;:-~-..,
It I- ""-,.-~ f-:,/ '\: r-,./ /
1
// I~
~~
/ '/ 1
J o~
~bdled To f'mh",m .. - l'.p _nt ~~
2005 2iI06 2007 2iI0B 21l0!l 20111 2011 .20.12 20 1.3
SOlH",,: R£1IG'I. I'IIIREI!l. ,,,,d 'C""1n1 1
5 Central 1 Credit Union-BC Economic Briefing ,Volume 18- Issue 51 6 Central 1 Credit Union-BC Economic Briefing ,Volume 19, Issues 1 to 4
3797568 FIN - 13

February 8, 2013 - 6 -
• Housing starts in the Vancouver Census Metropolitan Area (CMA) fell 2.2%.
• December's pace of housing starts was the slowest in more than two years, and while monthly activity can fluctuate significantly due to multi-family apartment and town home project starts, the underlying pace has clearly fallen in recent months. This suggests builders, particularly those in the Vancouver region, are making necessary adjustments in response to weak housing demand and high levels of resale and new home inventories.
Table 5
Units
30,00 'IT
25,00 ,~
2 0,0 0 '~
15 .'00
HOllsing Under Construction Quarterly
VanCOLr er CMA Rest of B . . .~
/' ~ \ (-./ \
~ 1/ \ ~ I~
--V/ \..... 10.'0'0
-.,...-1-5,0'0
0
r r
/
~ -
2'0'00 2 '002 2004 2006 2 00S 2 '010 2'012
Source: CMHC, statistics c anada and Ce ntral l,lat est: Q3 2 '012
• On an annual basis, employment growth in the Lower Mainland-Southwest was a respectable 2%.
City of Richmond Overview
Overall Richmond is performing well in face of global and provincial economic trends. The figures described below indicate a slowing but still strong Richmond economy.
The office market remained stagnant in the last quarter of 20 12, with vacancies edging up slightly to 20.3% from 20.1 % in the previous quarter and 19.2% in the last quarter a year ago. Office inventory remained unchanged at 4.4 million square feet compared to the third quarter in 2012. A notable transaction in the last quarter of2012 is MacDonald Dettwiler and Associates ' renewal of their 181,588 square feet lease at Crestwood Corporate Centre.
3797568 FIN - 14
February 8, 2013 - 7 -
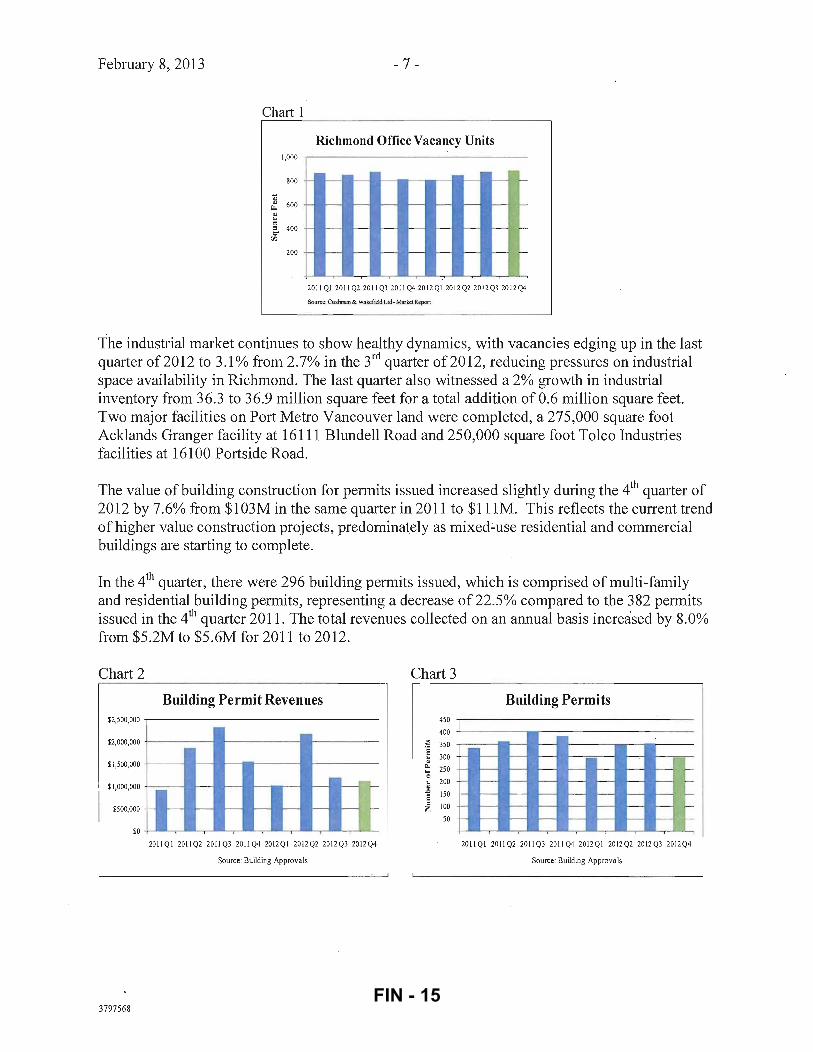
Chart 1
Richmond Office Vacancy Units 1,000
800
'OS " 600 ~
" ... " " 400 0-
m
200
t - r- N -I:
~ - f-- f-- ~;> -
- r- r- -
1" t- -H
r- -
i i ~ '--r-- "" ~
2011 QI 2011 Q2 2011 Q3 2011 Q4 2012 QI 201 2 Q2 2012 Q3 2012 Q4
Source: Cushman & Wakefidd Ltd- Market Report
The industrial market continues to show healthy dynamics, with vacancies edging up in the last quarter of2012 to 3.1 % from 2.7% in the 3rd quarter of2012, reducing pressures on industrial space availability in Richmond. The last quarter also witnessed a 2% growth in industrial inventory from 36.3 to 36.9 million square feet for a total addition of 0.6 million square feet. Two major facilities on Port Metro Vancouver land were completed, a 275,000 square foot Acklands Granger facility at 16111 Blundell Road and 250,000 square foot Tolco Industries facilities at 16100 Portside Road.
The value of building construction for permits issued increased slightly during the 4th quarter of 2012 by 7.6% from $103M in the same quarter in 2011 to $lllM. This reflects the current trend of higher value construction projects, predominately as mixed.:.use residential and commercial buildings are starting to complete.
In the 4th quarter, there were 296 building permits issued, which is comprised of multi-family and residential building permits, representing a decrease of22.5% compared to the 382 permits issued in the 4th quarter 2011. The total revenues collected on an annual basis increased by 8.0% from $5.2M to $5.6M for 2011 to 2012.
Chart 2 Chart 3
Building Permit Revenues Building Permits $2,500,000 450
400
- - -
r-- - -
I
$2,000,000
$1,500,000
$1 ,000,000
$500,000
$0
:l 350 's '" 300 ~ 250 ... 0
'" 200
" .c 150 5 i 100
50
,----1-- r'i r-- fOi ;-r--
I~' r-- c-
I-- r-- c-
l:ij r--r-- c-
~r--r-- c-r-- c-
20llQI 201lQ2 20 ll Q3 20llQ4 20 12QI 2012Q2 2012Q3 2012Q4 201lQI 201lQ2 201lQ3 201lQ4 2012QI 2012Q2 2012Q3 2012Q4
Source: Building Approvals Source: Building Approvals
3797568 FIN - 15

February 8, 2013 - 8 -
There were 36 development applications received in the 4th quarter which is a decrease of 30.8% as compared to the same quarter in 2011. The monthly figures fluctuated significantly; however, the overall annual development applications received in 2012 was 206 as compared to 208 in 2011. The total development application revenues received year over year are down slightly by 0.9%.
Chart 4
$300,000
$250,000
$200,000
$150,000
$100,000
$50,000
$0
Development Application Fee Revenues
I---
I--- I---
11 I---
[I I--- I--- I---
L 2011Ql 2011Q2 2011Q3 2011Q4 2012Ql 2012Q2 2012Q3 2012Q4
Source: Development Applications
Chart 5
70
Ie 60 o '" .~ 50
C. 40 ~ '0 30
~ 20 e i 10
Development Applications
f---
I---
f--- i-
I--- f-
I--- f-
L-- '-
20IIQI 2011Q2 2011Q3 2011Q4 2012Ql 2012Q2 2012Q3 2012Q4
Source: Development Applications
The year-over-year valid licenses show a modest increase reflecting improved collection of delinquent license fees and the net change from a slight increase in commercial business licenses, including an additional Night Market, offset by a year over year decrease in new Home Occupation and Non-Resident (Contractors) Business Licenses. Following a timing adjustment, Business License revenue increased mainly due to the 2% fee increase year-over-year.
Chart 6
Business Licence Revenues $1,800,000 ,-----------------
$1 ,500,000 -l---------
$1 ,200,000
$900,000
$600,000
$300,000
$0
2011Ql 2011Q2 2011Q3 2011Q4 2012Ql 2012Q2 2012Q3 2012Q4
Source:_ Business Licence System
3797568
Chart 7
700
600
500
400
300
200
100
New Business Licences
t-
c- - -
f- - - - - r-- f---.. : -
i- - - - - I--- li. -c- - - - - I--- " -
f- -r- -,- L ~
2011Ql 2011Q2 2011Q3 201IQ4 2012Ql 2012Q2 2012Q3 2012Q4
Source: Business Licence System
FIN - 16

February 8, 2013 - 9 -
Parking Program revenues from meters, permits and enforcement for the 4th quarter of2012 increased by $28,000 to $0.365M from $0.337M for the same period in2011.
Chart 8
Parking Program Revenue $500,000
$400,000 - r---
$300,000 - r-- -
$200,000 - r-- -
$100,000 - r-- -$0
2011 Q12011 Q2 2011 Q3 2011 Q42012Q12012Q22012Q3 2012Q4
Source: Community Bylaws
Gaming revenues have increased year over year and the comparable figures described below indicate a slowing but still strong Richmond economy. Revenue for the 4th quarter is $4.49M compared to $3.98M in the same quarter last year. This represents a 12.8% increase. Overall, Gaming revenue increased by 13.5% from $13.7M to $15.6M for the period of2011 to 2012.
3797568
Chart 9
Gaming Revenue $5,000,000 -,----------------
$4,000,000
$3,000,000
$2,000,000
$1,000,000
$0
-
+- - e--- !--- r-- r-- -
+- - r-- e--- r-- r-- -
T- - r-- r-- r-- c--- -
L..C
201lQI 201lQ2 201lQ3 201lQ4 2012QI 2012Q2 2012Q3 2012Q4
Source: Finance
FIN - 17

February 8, 2013 - 10-
Dee contributions received in the 4th quarter of 2011 were higher than 2012 due to a large multifamily development that was recognized in 2011. The year-over-year contributions decreased by 15.9% from $23.5M in 2011 to $19.7M in 2012 due in part to the slowing of the housing market.
3797568
Chart 10
DCC Contributions Collected $18,000,000 -r----------------
$15,000,000 +------
$12,000,000 +-----
$9,000,000 +------
$6,000,000 +-------$3,000,000
$0
201lQ I 20 1l Q2 20 1l Q3 20 1l Q4 20 12Q I 20 12 Q2 2012 Q3 20 12Q4
Source: Finance
FIN - 18

February 8, 2013 - 11 -
Statement of (net revenues)/expenditures for
December 31, 2012 (unaudited)
Operating Budget (OOO's) Unaudited General Fund Budget Actuals Annual
,RCMP Fire Rescue C0rrlllllJ.nity Services E,ngineering & Public Works Financ~ & CQrporate Services Library Planning & Development Corporate Administration Law &J:1ommunitySafety Fiscal & Transfer to Reserves
2012 Dec 31, 2012* Surplus* 36,9~6
29,283 33,090 28,679 ·16,285
7,945 6,016 7,453 4,414
(170,15 1)
36,341 28,774 33,123 28,591 15,787 7,989 4,627 7,203 4,192
(170,351)
645 509 (33)
88 498 (44)
1,389 250 222 200
Total $0 . ($3,724) $3,724 * These figures may change due to audit adjustments.
The $3. 7M operating surplus amount will be transferred to the Rate Stabilization account which can be usedto minimize fluctuations in the tax rate and/or to fund one-time expenditures as approved at the December 10,2012 Council meeting.
The following describes the net expenditure variances at the departmental level:
• RCMP has a favourable variance due to unfilled positions and contract costs slightly below budget.
• Richmond Fire Rescue has a favourable variance due to lower than expected ECOMM costs relating to Fire Records Management System modu~es. Delays in the delivery of turnout gear equipment resulted in the transaction costs not impacting the 2012 budget. A reduction in overtime attributed to training, as well as unfilled vacant positions also contributed to the favourable variance.
• Community Services experienced a minor deficit in 2012, mostly driven by the unexpected and unbudgeted expenditures associated with Watermania building repairs.
• Engineering and Public Works had a small surplus at the end of the year. A relatively mild winter and favourable weather conditions contributed to a surplus in the snow and ice and storm drainage programs, those savings were moved to a provision for future weather events. Project Development had savings due to a vacancy and uncompleted infrastructure initiatives which were carried forward to 2013 to complete the projects. There were savings in Fleet which will be transferred to a Reserve per the Green Fleet policy for future replacement of vehicles.
3797568 FIN - 19

February 8, 2013 - 12 -
• Finance and Corporate Services had a favourable variance for the year due to unfilled vacant positions, increased business license revenues and lower than expected expenditures for IT maintenance contracts.
• Library has completed the year with a slight deficit due to grant revenue received being less than budgeted.
• Planning and Development has realized higher than budgeted building permit revenue and development application revenue and a favourable variance due to unfilled positions for the end of2012. The number of development applications received in 2012 is a result of previous development enquiries becoming applications and developers wishing to take advantage of the housing market conditions, which held stable for Richmond throughout the year. It is anticipated that this number could slow in the coming quarters in 2013.
• Corporate Administration has ended the year with a favourable variance.
• Law and Community Safety has a favourable variance due to lower than expected operational costs.
• Fiscal finished the year with a surplus due to the net effect of better than expected results from Traffic Fine revenue sharing, rental properties and offset by the transfers to reserves.
Utilities
• Utilities had a surplus of $1.2M at the end ofthe year. The favourable variance can be attributed to higher than expected water consumption which allowed for additional revenue in the Water and Sewer utilities. Also, operational efficiencies and preventative maintenance programs, yielded positive results, such as a reduction in the number of sewer and water main breaks.
3797568 FIN - 20

February 8, 2013 - 13 -
Active Capital Project Summary
The 2012 Capital Budget of$64.8M (excluding internal payment transfers and debt repayments) are included in the figures below as are amounts relating to capital projects from previous years' Capital budgets that remain active.
The projects within the Infrastructure, Building, Land & Parks and Equipment Programs are in progress.
3797568
1. 0 Infrastructure Pro gram 2.0 Building Program 3.0 Land & Parks Program
4.0 Equipment Program
124,134 95,379 45,838
25,386
70,606 65,489 28,476
15,696 - - - ---------- - ~- ------
53,528 29,890 17,362
9,690 Grand Total $124,134 $70,606 $53,528
1.0 Infrastructure Program
2.0 Building Program
3.0 Land & Parks Program
4.0 Equipment Program
Active Capital Project Summary
40 80 120
Millions ($)
160
• Spent to Date
• Budget
FIN - 21

February 8, 2013 - 14 -
Infrastructure Highlights:
• Nelson Road Improvements - Widening Nelson Road between Blundell Road and Westminster Highway:
- Approved Budget: $4.1M - Construction tendering is currently in process.
• Westminster Hwy: Nelson Rd. to McMillan Way - Widening Westminster Hwy: - Approved Budget: $10AM - Construction tendering is currently in process.
• Steveston Drainage Area Replacement and Upgrades - Williams Road West Drainage Pump Station Upgrade:
- Approved Budget: $2.0M - Construction is scheduled to be substantially complete in February 2013.
• No.1 Road Drainage Pump Station: - Approved Budget: $3.45M - Construction is scheduled to be substantially complete in February 2013.
• No.6 Road Widening: - Approved Budget: $1.5M - Construction tendering is anticipated for the February 2013 timeframe.
• Seaton Laneway Drainage and Pavement Upgrade: - Approved Budget: $632K - The laneway restoration and re-grade of the surface to address 'ride-ability' and drainage
issues was completed in November 2012.
Building Highlights:
• Japanese Fishermen's Benevolent Society Building (formerly 4091 Chatham Street) -
3797568
Exterior Rehabilitation: Approved Budget: $419K The building from 4091 Chatham Street was relocated and placed on a foundation adjacent to the Steveston Museum building. Exterior restoration is underway with completion anticipated in February 2013.
FIN - 22

February 8, 2013 - 15 -
• Interurban Tram Structure: Approved Budget: $1.9M Construction of the new structure which will house the Interurban Tram Car in Steveston Park is nearing completion. The building will permit the restoration of the Tram Car as well as viewing by the public. Target completion date is February 2013.
• Britannia Heritage Shipyards - Seine Net Loft: Approved Budget: $1.2M Construction is underway as of January 2013.
• Hamilton Childcare Centre: Approved Budget: $1.8M (Land value $480K) A site plan and preliminary drawings have been developed, and rezoning is complete for this modular childcare service facility. Preloading placement at the site is complete. The design services have been awarded and design commenced in January 2013.
Parks Highlights:
• Railway Corridor: Approved Budget: $200K ($2M approved in the 2013 budget) The terms of reference have been completed with major construction starting this year.
• Terra Nova Play Environment: Approved Budget: $1.0M The planning and design is in progress with the site preparations completed, with construction anticipated to be complete in the summer of 20 13.
• Garden City Community Park: Approved Budget: $500K Concept planning and park improvements
• Oval West Waterfront Park: Approved Budget: $850K The detailed design was started in November with construction beginning this year.
• Terra Nova Heritage Buildings Restorations: Approved Budget: $2.0M The construction is in progress.
• Thompson Youth Park: Approved Budget: $673K The Phase two construction is near completion.
• Woodwards School Park Characterization: Approved Budget: $185K The construction was substantially completed in December 2012.
3797568 FIN - 23

February 8, 2013 - 16 -
Cash and Investment Portfolio
The City's cash and investment portfolio at December 31, 2012 was $633.7M, with an average yield on investment for the 4th quarter of 1.79%. The City's investment policy and cash flow proj ections have been factored into the types of investments that the City holds (Appendix 1).
The Bank of Canada has left the key interest rates unchanged and has revised its growth expectations for Canada, now forecasting the real GDP to advance by 2.0% in 2013 and 2.7% in 2014, compared to October's forecast of 2.3% arid 2.4% respectively. The global economic outlook is slightly weaker than the Bank had projected in its .october Monetary Policy Report. The economic expansion in the United States is continuing at a gradual pace while Europe remains in recession. Growth in China is improving, though economic activity has slowed further in some other major emerging economies. In Canada, the slowdown in the second half of 20 12 was more pronounced than the Bank had anticipated, owing to weaker business investment and exports. The Bank expects economic growth to pick up through 2013 and reach full capacity in the second half of2014.
Reflecting on all these factors, yields across the Canadian yield curve remained low during the quarter as investor' s exercised "flight to safety". The interest rate remained at a low level in 2012 and is not likely to increase until late 2013.
The City, in accordance with its Investment Policy (3702) is required to carry a diversified investment mix with strong credit quality and at the same time meeting the objectives of managing its investment activities in a manner that seeks to preserve capital and to realize a reasonable rate of return.
5 to 6 years J
4to 5 years '.' ., ... ~,
3 to 4 years
2 to 3 years
1 to 2 years
6 months to 1 year . I
3 to 6 months I
Oto 3 months ,
o 20 40
3797568
Investment Maturity
,'., I
60
.
I
80 Millions ($)
100
, !
I
120 140 160
FIN - 24

February 8, 2013 - 17 -
Cash and Investment Portfolio
December 31, 2012 (In'OOOs)
Appendix 1
- -- - --- ------- ---- - ------ ~ --- - ------ - - - --- - - - --
Issuer Amount % of Portfolio
FederaJ .Government and Federal Crown Corporations Canadian Mortgage and Housing Corporation $ 320,783 50.62% Government of Canada" $ 6,048 0·95% Total $ 326,831 51.57%
Provincial Governments and Provincial Crown Corporations Province of Ontario $ 101,547 16.02% Alberta Treasury Board $ 24,294 3.83% Financement Quebec $ 21,280 3.36% Total $ 147,121 23.22%
Schedule I Banks Royal Bank of Canada 15,411 2.43% crnc 8,989 1.42%
TD Financial 8,524 1.35% Scotia Bank 7,695 1.21%
Total 40,619 6.41%
Credit Unions Gulf & Fraser Financial Group $ 29,969 4.73% Vancity Savings (Sredit Union 24,879 3.93% Coast Capital Savings 10,078 1.59%
Total $ 64,926 10.25%
Pooled Investments Municipal Finance Authority $ 21,691 3.42%
Total $ 21,691 3.42%
Total Investments $ 601,188 Funds held in trust for Richmond Community Associations -$ 1,091 Total Cash & Cash Equivalents $ 33,633 5.31 %
~e~ts and Casb& Ca~h ¥~~_$ __ 633,730 _________ _
3797568 FIN - 25

February 8, 2013 - 18 -
Key Indicators (Appendix 2)
This appendix provides information with regard to various financial and market indicators for the year 2012 as compared to 2011.
Contract Awards (Appendix 3)
This report provides Committee members information with regard to the formal contracts awarded by the City during the 4th quarter.
Financial Impact
The approximate $3. 7M operating surplus will be transferred to the Rate Stabilization account for future consideration by Council as part of the 2014 budget process.
Conclusion
The City of Richmond has finished the fiscal year by maintaining the favourable trend that was started at the beginning of2012. The City continues with positive increases in Gaming revenue and Planning and Development show a favourable variance in revenues. It is expected that the slowing of the housin market may moderate these favourable amounts in 2013 and 2014.
. y Gilfillan Manager, Financial Reporting (604) 276-4077
3797568 FIN - 26

February 8, 2013 - 19 - Appendix 2
Key Indicators
Q42012 Q42011 Year to Date Year to Date Year to date % All $ in OOOs Oct - Dec 2012 Oct - Dec 2011 % Change Jan-Dec 2012 Jan-Dec 2011 change
Housing Starts Number of Housing Starts (number of units) 384 204 88.2% 1,602 1,237 29 .5% Number of Demolitions 71 122 (41.8%) 492 653 (24.7%) Net Housing Units Added 313 82 281 .7% 1,110 584 90.1%
Building Permits Number of Building Permits Issued 296 382 (22 .5%) 1,291 1,480 (12 .8%) Permit Revenues Collected $1,127 $1,194 (5.6%) $5,599 $5,187 8.0% Value of Building Construction for Permits Issued $111,404 $103,538 7 .6% $457,247 $424,366 7.7%
Development Applications Development Applications Received 36 52 (30.8%) 206 208 (1.0%) Development Applications Revenue $72 $224 (67.9%) $648 $654 (0.9%) Revenue reported for Development Applications reflects deferred revenue adjustmens for 2011 & 2012
Business Licenses Number of New Business Licenses Issued 339 335 1.2% 1,898 1,712 10.9% Number of Employees Reported - New Licenses 1,025 1,482 (30 .8%) 5,662 5,474 3.4% Total Valid Licenses Renewed/(Discontinued) (469) (119) 294.1% 13,336 12,988 2.7% Revenue Received for Current Year Licenses $378 $262 44.2% $3,447 $3,029 13.8% Revenue Received for Next Year (Deferred) $1,423 $1,223 16.4% $1 ,936 $1 ,669 16.0% Total License Revenue $1 ,801 $1,485 21 .3% $5,382 $4,697 14.6%
Year to date valid licenses and revenue include current year licenses issued in the prior year.
Other Revenues Parking Program Revenue $365 $337 8.2% $1 ,591 $1,432 11 .1% Gaming Revenue $4,493 $3,983 12.8% $15,585 $13,728 13.5% Traffic Fine Revenue to date $390 $544 (28.4%) $3,472 $2,176 59.6%
Development Cost Charges Income Roads, Water, Sewer DCC's Received $1,663 $3,611 (54.0%) $8,613 $11,972 (28.1%) Parks DCC's Received $1,440 $1,475 (2.4%) $11,158 $11,535 (3.3%) Total DCC Fees Received $3,102 $5,086 (39.0%) $19,771 $23,507 (15.9%)
Uncommitted Reserves DCC Reserves to date $47,401 $42,437 11 .7% $47,401 $42,437 11 .7% Capital Funding Reserves to date $85,796 $77,220 11.1 % $85,796 $77,220 11 .1% Affordable Housing Reserves to date $7,662 $2,198 248.5% $7,662 $2,198 248.5% Other Reserves to date $109,516 $107,806 1.6% $109,516 $107,806 1.6%
Total Uncommitted Reserves to date $250,376 $229,661 9.0% $250,376 $229,661 9.0%
Taxes to date
Taxes Collected $8,580 $8,070 6.3% $339,370 $328,767 3.2%
City Portion ofTaxes Collected $4,204 $3,954 6.3% $166,291 $161,096 3.2%
Unpaid Taxes - Delinquent & Arrears $1 ,544 $1,519 1.6% $1,544 $1,519 1.6%
No. of Participants on PAWS (Pre authorized withdrawal) 6,031 5,842 3.2% 6,031 5,842 3.2%
PAWS $6 ,608 $5,992 10.3% $21,234 $18,580 14.3%
Interest Rate Paid to PAWS 1.00% 1.00% 0.00% 1.00% 1.00% 0.00%
Sources : All data is from City of Richmond records
3797568 FIN - 27

February 8, 2013 - 20- Appendix 2
Q42012 Q42011 Year to Date Year to Date Year to date % All $ in ODDs Oct - Dec 2012 Oct - Dec 2011 % Change Jan-Dec 2012 Jan-Dec 2011 change
Employees Number of City Employees (City and Library) 1,919 1,883 1.9% 1,919 1,883 1.9%
Fire Rescue Responses 2,515 2,278 10.4% 9,596 9,141 5.0%
RCMP - Calls for Service Handled 17,127 17,396 (1.5%) 70,861 72,423 (2.2%)
Affordable Housing Affordable Rental Units 33 16 106.3% 156 21 642.9% Secondary Suite/Coach House Units 7 4 75.0% 19 29 (34.5%) Market Rental Units 135 (100.0%) 303 303 0.0% Unspent Funds Allocated to Capital Projects to date $10,478 $9,145 14.6% $10,478 $9,145 14.6%
Investments Total Investments $633,732 $571,246 10.9% $633,732 $571,246 10.9%
Interest Earned on Investments Average City Rate of Retum on Investments 1.79% 2.34% (0.55%) 1.97% 2.56% (0 .59%)
Sources: All data is from City of Richmond records
Market Indicators
Median Residential Selling Prices - Richmond Single Family Detached $1 ,070 $965 10.9% $987 $994 (0.8%) Townhouse $495 $530 (6.6%) $529 $548 (3.5%) Apartment $320 $343 (6.7%) $339 $349 (2.8%) Number of Sales (all housing types) 570 713 (20.1%) 2,809 5,403 (48 .0%)
Source: Real Estate Board of Greater Vancouver
Unemployment Rate-Greater Vancouver 6.2% 6.5% (0.3%) 6.2% 6.5% (0.3%)
Regional Unemployment Rate (3 month moving average)
Source: Statistics Canada & BC Stats (Data not available for Richmond)
Economic Development Total sq . ft space Office YfO 4,358,727 4,241,927 2.8% 4,358,727 4,241,927 2.8% Total sq. ft vacant space available Office YfO 885,622 816,210 8.5% 885,622 816,210 8.5% Vacancy rate - Office (in %) YfO 20.32% 19.24% 5.6% 20.32% 19.24% 5.6% Total sq. ft space Industrial YfO 36,897,163 36,306,863 1.6% 36,897,163 36,306,863 1.6% Total sq . ft vacant space available Industrial YfO 855,572 1,332,255 (35.8%) 855,572 1,332,255 (35.8%) Vacancy rate -Industrial (in %) YfO 3.08% 4.56% (32.5%) 3 .08% 4.56% (32.5%)
Source: Cushman & Wakefield Ltd. - Market Report
Richmond Population Estimate Year End" 2012 201,160
"Note: BC Stats Population figures 2011 197,631
3797568 FIN - 28

1
2
3
4
5
6
7
8
9
10
11
February 8, 2013 - 21 -
Contract Awards> $ 25,000 October 1,2012 - December 31, 2012
Contract Name and Description : Award
4462F - City Hall Annex: Supply and install DDC controls
4463F - City Grants Web-based System online tool
4464Q - Asbestos abatement and demolition of 8091 Granville Ave and 8080 Anderson Road (over 77% recycling achieved)
4466F - Supply and install wastewater heat recovery system at Gateway Theatre
4467F - Road markings (crosswalks, stop bars, "elephant feet"). Road markings (green anti -skid bike lanes, 14 bike stencils)
4568Q - Supply and Delivery of Tum Out Gear
4616Q - On-Call Contractor: Supply, Install, Repair and Service HeatingN enting and Air Conditioning (HV AC) Systems
4710Q - Supply and Delivery of Street Banners
4717Q - Supply and Delivery of Two (2) 6,500 KG GVW Cutaway Vans with Dual Rear Wheels
4718Q - Supply and Delivery of Five (5) 19,500 LB GVW Regular Cab and Chassis with Dual Rear Wheels
4719Q - Supply and Delivery of one (1) mlm paver
I Airon Heating and Air I Conditioning
I I Mountain Interactive
I
Litchfield Demolition
Commercial Residential Industrial Mechanical Ltd.
Scottish Line Painting Ltd.
Associated Fire Safety
Airon Heating and Air Conditioning
-Big Bold Beautiful Banner Co. -Textile Image Inc. (The Flag Shop)
Dams Ford Lincoln Sales
Metro Motors .
Douglas Lake Equipment
12 JOC C41914A.03 & JOC IR2012K.02A Ashton Service Group - City Hall Annex Supply of material and preparation for HV AC installation and
3797568
Appendix 3
$ 77,330 Project Development & Facilities Services
$34,500 Information Technology
$56,825 project Development & Facilities Services
$54,370 PW - Engineering
$27,930 PW - Engineering
$240,000 Fire-Rescue
$450,000 Project Development & Facilities Services
$8,272 I PW - Parks .
I $30,722 1
$131,330 PWlFleet
$249,000 PW/Fleet
$88,984 PW 1F1eet
$657,165 Project Development & Facility
FIN - 29

February 8, 2013 - 22- Appendix 3 Contract Awards> $ 25,000
October 1,2012 - December 31, 2012
Contract Name and Description : Award I Amount I Department I
mechanical equipment supplemental for coils, exhaust fans, pumps
I Maintenance
.~------~~----=-=-~.~.-------------I
$229,945 Ipw -Engi~eering 13 Install 6" water meter -in imdergr01md chl:lmber at 10177 Pugwash PL} a~ part of Multi-Family water meter program; Illstall 8" water meter in underground chaIl}ber at 11631 7th Avenue, as part of IIlulti-family water meter program; .InstaU 8" water meter in underground ¢hamber at 3500 Cunningham Drive, as part of multi-family water meter program; Install 4" water meter in vnderground chamber at 6099 Alder Street (south), as part of multi-family water .meter program; Install 6" water
I meter in underground chamber at 3031 I Williams Road (NWS 438,PH 2/3) East,
as part of multi-family water meter I program; Install 6" water meter in
II
I I underground chamber at 7831 Garden City Road, as part of multi-family water
, meter program I •
1 14 I 4765F - Design, fabricate, transport and I ! install Public Artwork at Riverport Flats
!iAshto"n Service Group2
!
i
: I
, I i ,
! Sara Graham .J~~~I
$34,600 I Community
II l development at 14000 Riverport Way
. . i5··-1 47-69.i~-JOCi3i20i2AiMi~~;~ -A;~~~: r---~-~ Ref~~ee room Conversion . _
I Services
lASh~~S;;;,,;~e Qt~]lp r $70:665 ~~t~~:rJjeht i ·---·---··---"-~-·-··T-----t_------·=·-~----··-·
i 16 I 4770J - Citrix Netscaler MPX 5500 ENT
Network, 1 year Gold Maintenance
I CDW j $31 ,915 I Information i I Technology
i I I' Edition Load Balancer for Internal
... - .----- - -'---------------------'-
3797568 FIN - 30