city of newport beach energy action plan (eap)
TRANSCRIPT
July 2013
City of Newport Beach 100 Civic Center Drive,Newport Beach, CA 92660
Submitted to:
City of Newport BeachEnergy Action Plan (EAP)
128 Auburn Court, Suite 106Westlake Village, CA 91362
Submitted by:
DDiiggggggiiiittaall EEnneerrggyyyy,, IInncc.Digital Energy, Inc.
City of Newport Beach ‐ Energy Action Plan Page i
ACKNOWLEDGEMENTS
This plan was prepared by Digital Energy, Inc. for the City of Newport Beach, California. The preparation of this plan was funded by Southern California Edison Company as part of the Local Government Strategic Plan Strategies Program funding for the 2010–2012 Program Period under the auspices of the California Public Utilities Commission.
City of Newport Beach ‐ Energy Action Plan Page ii
TABLE OF CONTENTS ACKNOWLEDGEMENTS ......................................................................................................................... i
TABLE OF FIGURES .............................................................................................................................. iii
TABLE OF TABLES ................................................................................................................................ iii
EXECUTIVE SUMMARY ......................................................................................................................... 1
SECTION 1 – INTRODUCTION ................................................................................................................ 2
A. Recent Energy Actions ...................................................................................................................... 3
B. Completed Energy Projects ............................................................................................................... 5
SECTION 2 ‐ CITY OF NEWPORT BEACH ENERGY USE............................................................................. 9
A. City Departments .............................................................................................................................. 9
B. Electricity Energy Usage .................................................................................................................. 10
C. Natural Gas Energy Usage ............................................................................................................... 14
D. Highest Energy Users ...................................................................................................................... 16
E. Current Energy Programs/Policies .................................................................................................. 21
SECTION 3 – CITY OF NEWPORT BEACH TARGET REDUCTION GOALS .................................................. 23
A. Municipal Energy Use Goals ............................................................................................................ 23
B. Community‐Wide Energy Use Goals ............................................................................................... 26
SECTION 4 – CITY OF NEWPORT BEACH ACTION STEPS ....................................................................... 29
A. Municipal Facility Energy Efficiency Projects .................................................................................. 29
B. Funding of Projects ......................................................................................................................... 59
C. Policies and Guidelines ................................................................................................................... 63
D. Tracking ........................................................................................................................................... 67
SECTION 5 – CONCLUSION .................................................................................................................. 69
APPENDICES
Appendix A – Historical Energy Use (Baseline)
Appendix B – Proposed Projects ‐ Savings Calculations
Appendix C – Corporation Yard and Utilities Yard ‐ Building Area Estimate
Appendix D – Electricity and Natural Gas Rate Calculations
City of Newport Beach ‐ Energy Action Plan Page iii
TABLE OF FIGURES Figure 1 – OCCELP Tiers and Criteria for Each .............................................................................................. 4 Figure 2 – City Streetlight 15‐Year Master Plan ............................................................................................ 5 Figure 3 – Structure of Utility Expenses ........................................................................................................ 9 Figure 4 ‐ Electricity Use (kWh) ‐ by Fund ................................................................................................... 10 Figure 5 ‐ Electricity Use (kWh) ‐ by Department ....................................................................................... 11 Figure 6 ‐ Electricity Use (kWh) ‐ by Department Division (Enterprise Only) ............................................. 12 Figure 7 ‐ Electricity Usage (kWh) ‐ by Department Division (General Fund Only) .................................... 13 Figure 8 ‐ Natural Gas Use (Therms) ‐ by Fund ........................................................................................... 14 Figure 9 ‐ Natural Gas Usage (Therms) ‐ by Department ............................................................................ 15 Figure 10 – AB 32 Scoping Plan to Reduce Greenhouse Gas Emissions ..................................................... 23 Figure 11 – Municipal Electricity Use Savings Goal ..................................................................................... 25 Figure 12 ‐ Municipal Natural Gas Use Savings Goal .................................................................................. 25 Figure 13 – Community Electricity Use Savings Goal .................................................................................. 26 Figure 14 – Summary of Electricity Use vs. Goal ......................................................................................... 70 Figure 15– Summary of Natural Gas Use vs. Goal ...................................................................................... 70
TABLE OF TABLES
Table 1– Summary of Energy Savings ‐ City Streetlight Efficiency Project ................................................... 6 Table 2 ‐ Electricity Use and Cost ‐ by Fund ................................................................................................ 10 Table 3 ‐ Electricity Use and Cost ‐ by Department .................................................................................... 11 Table 4 ‐ Electricity Use and Cost ‐ by Department Division (Enterprise Only) .......................................... 12 Table 5 ‐ Electricity Usage and Cost – by Department Division (General Fund Only) ................................ 13 Table 6 ‐ Natural Gas Use ‐ by Fund ............................................................................................................ 14 Table 7 – Natural Gas Use ‐ by Department ............................................................................................... 15 Table 8 – Highest Energy Using Buildings – Top 10 .................................................................................... 16 Table 9 ‐ Highest Energy Using Buildings – Notable Mentions ................................................................... 17 Table 10 ‐ Highest Energy Using Accounts – Top 10 ................................................................................... 18 Table 11 ‐ Highest Energy Using Accounts – Notable Mentions ................................................................. 19 Table 12 – Highest Energy Using Buildings per Square Foot – Top 10 ....................................................... 20 Table 13 – Summary of Energy Efficiency Measures in the Pipeline – Central Library .............................. 29 Table 14 – Summary of Energy Efficiency Measures in the Pipeline – Water Pumping Systems ............... 30 Table 15 ‐ Summary of Proposed Projects – Central Library ...................................................................... 32 Table 16 ‐ Summary of Proposed Projects – Police Department ................................................................ 38 Table 17 ‐ Summary of Proposed Energy Efficiency Measures ................................................................... 44 Table 18 – Summary of Past, Present, and Future Energy Efficiency Projects ........................................... 69 Table 19 – EAP Implementation Plan .......................................................................................................... 71
Executive Summary
City of Newport Beach ‐ Energy Action Plan Page 1
EXECUTIVE SUMMARY The California Assembly Bill 32 ‐ California Global Warming Solutions Act (AB 32) sets a target to decrease emissions statewide to 1990 levels by the year 2020. Reducing greenhouse gas emissions to 1990 levels means cutting approximately 30% from business‐as‐usual emissions levels projected for 2020, or about 15% from today’s levels. The City of Newport Beach recognizes the impact carbon emissions have on global climate change. The City is aiming to reduce its energy consumption and greenhouse gas emissions (GHG) to become a more sustainable community. The main goal of the Energy Action Plan (EAP) is to provide a roadmap for the City of Newport Beach to reduce GHG through reductions in energy used in facility buildings and operations. This EAP identifies past energy measures that have been implemented and present measures that currently are in that process, all of which will contribute to the energy reduction goal. In addition, this EAP identifies other potential energy reduction measures that the City will consider for future implementation.
This EAP outlines various measures and strategizes numerous methods on how the City’s long term vision can be achieved. Key goals of this EAP are highlighted in the list below.
• Meet and exceed AB 32 energy reduction goals; • Be an example for energy efficiency and sustainability at City facilities; • Continue interacting, educating, and informing the community about energy efficiency and
greenhouse gas emissions; • Explore the newest "green" technologies and methods to decrease future energy dependency; • Explore renewable energy recourses (not limited to solar) and possible financing based on
available grants/rebates; • Enhance energy efficiency and operations in existing buildings through systematic
commissioning strategies or independent energy efficiency studies; • Evaluate all the suggested energy efficiency action measures presented in this EAP, establish a
priority for implementation, and determine possible funding sources.
The City’s long term vision for energy efficiency focuses around three primary objectives:
1) Reduce the City’s carbon footprint and its adverse effect on the environment 2) Conserve energy at the local government facilities 3) Raise energy conservation awareness in local community and improve the quality of life
Section 1 Introduction
City of Newport Beach ‐ Energy Action Plan Page 2
SECTION 1 – INTRODUCTION The purpose of this Energy Action Plan (EAP) is to identify the City of Newport Beach's long‐term vision and goals on achieving energy efficiency in local government facilities and in the community. The driving force for City of Newport Beach's energy efficiency efforts includes demonstrating leadership through the implementation of cost‐effective energy efficiency improvements in their own facilities, minimizing costs associated with energy and utilities, and protecting the environment. The EAP is intended to guide the City to reduce greenhouse emissions by lowering municipal and community wide energy use. The City of Newport Beach understands the role energy usage and energy efficiency plays in maintaining a sustainable environment. The City is committed to promoting long‐term climate action activities in order to reduce energy usage and mitigate greenhouse gas (GHG) emissions. Local governments play an important role in leading the community by example. This EAP shows the multiple strides the City has taken towards a more sustainable environment. These energy efficiency improvements in government operations provide a foundation for more comprehensive community‐wide efficiency strategies. This EAP provides additional strategies that provide a path towards optimizing energy use in the city, reducing utility costs, and maximizing operational productivity of facilities. Created in partnership with Southern California Edison (SCE) and Southern California Gas Company (SCG), this EAP identifies municipal strategies to achieve the City‘s long‐term electricity and natural gas efficiency goals. This integration of City‐wide municipal strategies allows the City to lead by example.
The key objectives of this Energy Action Plan are as follows:
• Create a long‐term vision for energy efficiency. • Provide and assess information related to City energy use and greenhouse gas emissions. • Highlight the City’s major energy using facilities. • Establish reduction targets for energy efficiency. • Identify and prioritize goals, policies, and actions to achieve energy reductions. • Provide a framework implementing the identified goals, policies, and actions.
Section 1 Introduction
City of Newport Beach ‐ Energy Action Plan Page 3
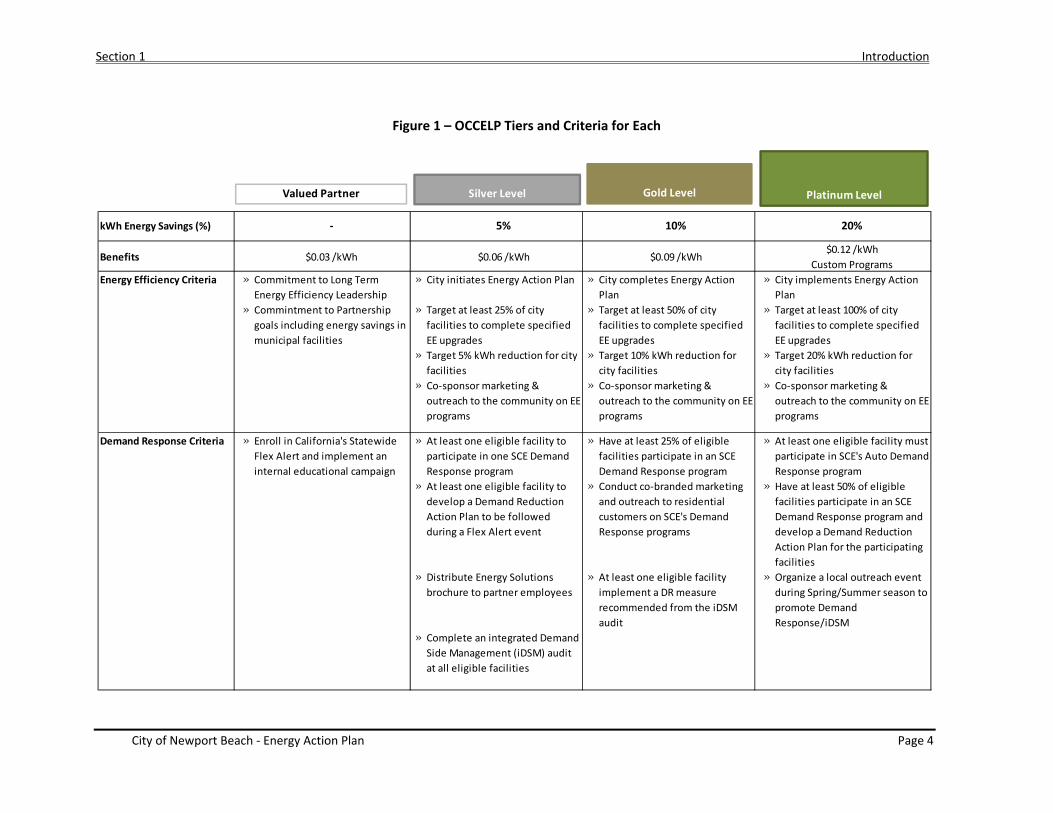
A. Recent Energy Actions The City of Newport Beach has a history of promoting sustainability and energy conservation. Specifically as it pertains to municipal facilities, the City has taken a proactive role in implementing energy reduction measures whenever possible and as funding permits. In the pursuit of its energy saving goals, the City has always sought out assistance and leveraged available resources. These have included grants from the federal government, incentives from utility companies, and assistance from energy partnerships. Orange County Cities Energy Leadership Partnership Program (OCCELP) In an effort to increase City‐wide energy efficiency, the City of Newport Beach entered into a joint partnership in 2011 with Southern California Edison (SCE) via the Orange County Cities Energy Leadership Partnership Program (herein called, “OCCELP” or “Partnership”) for the 2010‐2012 funding cycle. The Partnership allows the City of Newport Beach to be incentivized for electricity and natural gas saved for municipal retrofit projects and community outreach efforts. The OCCELP was initially established to provide funds to participating Partnership cities when the cities invest in energy efficiency projects. It was designed to provide integrated technical and financial assistance to help local governments effectively lead their communities to increase energy efficiency, reduce greenhouse gas emissions, protect air quality, and ensure that communities are sustainable. Existing Partnership participants include the cities of Newport Beach, Huntington Beach, Fountain Valley, Westminster, and Costa Mesa. The Partnership provides a performance‐based opportunity for the City of Newport Beach to demonstrate energy efficiency leadership in its community through energy saving actions, including retrofitting its municipal facilities as well as providing opportunities for constituents to take action in their homes and businesses. By implementing measures in its own facilities, the City of Newport Beach has led by example. The City, SCE, and SCG have worked together to increase community awareness of energy efficiency and positioned the City as a leader in energy management practices. There are four Partnership levels in the OCCELP – Valued, Silver, Gold, and Platinum. As the City’s energy efficiency increases, the monetary benefits per kWh saved also increase. The City is presently a Valued level partner and is aiming towards the higher level tiers. The figure below outlines the various criteria and incentives for the various partnership levels. As shown, to achieve Silver, Gold and Platinum status, the City needs to initiate, complete, and implement an Energy Action Plan (EAP).
Section 1 Introduction
City of Newport Beach ‐ Energy Action Plan Page 4
Figure 1 – OCCELP Tiers and Criteria for Each
Valued Partner Silver Level Gold Level Platinum Level
kWh Energy Savings (%) ‐ 5% 10% 20%
Benefits $0.03 /kWh $0.06 /kWh $0.09 /kWh$0.12 /kWh
Custom ProgramsEnergy Efficiency Criteria » Commitment to Long Term
Energy Efficiency Leadership» City initiates Energy Action Plan » City completes Energy Action
Plan» City implements Energy Action Plan
» Commintment to Partnership goals including energy savings in municipal facilities
» Target at least 25% of city facilities to complete specified EE upgrades
» Target at least 50% of city facilities to complete specified EE upgrades
» Target at least 100% of city facilities to complete specified EE upgrades
» Target 5% kWh reduction for city facilities
» Target 10% kWh reduction for city facilities
» Target 20% kWh reduction for city facilities
» Co‐sponsor marketing & outreach to the community on EE programs
» Co‐sponsor marketing & outreach to the community on EE programs
» Co‐sponsor marketing & outreach to the community on EE programs
Demand Response Criteria » Enroll in California's Statewide Flex Alert and implement an internal educational campaign
» At least one eligible facility to participate in one SCE Demand Response program
» Have at least 25% of eligible facilities participate in an SCE Demand Response program
» At least one eligible facility must participate in SCE's Auto Demand Response program
» At least one eligible facility to develop a Demand Reduction Action Plan to be followed during a Flex Alert event
» Conduct co‐branded marketing and outreach to residential customers on SCE's Demand Response programs
» Have at least 50% of eligible facilities participate in an SCE Demand Response program and develop a Demand Reduction Action Plan for the participating facilities
» Distribute Energy Solutions brochure to partner employees
» At least one eligible facility implement a DR measure recommended from the iDSM audit
» Organize a local outreach event during Spring/Summer season to promote Demand Response/iDSM
» Complete an integrated Demand Side Management (iDSM) audit at all eligible facilities
Silver Level Gold Level Platinum LevelValued Partner
Section 1 Introduction
City of Newport Beach ‐ Energy Action Plan Page 5
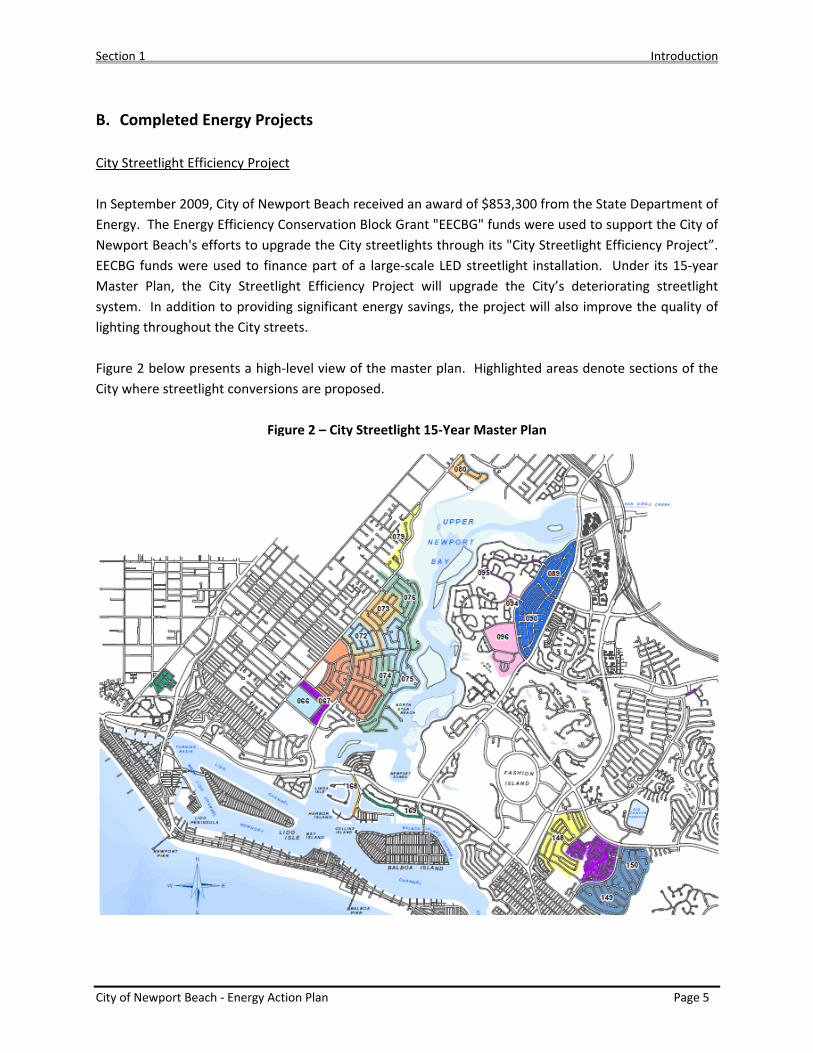
B. Completed Energy Projects City Streetlight Efficiency Project In September 2009, City of Newport Beach received an award of $853,300 from the State Department of Energy. The Energy Efficiency Conservation Block Grant "EECBG" funds were used to support the City of Newport Beach's efforts to upgrade the City streetlights through its "City Streetlight Efficiency Project”. EECBG funds were used to finance part of a large‐scale LED streetlight installation. Under its 15‐year Master Plan, the City Streetlight Efficiency Project will upgrade the City’s deteriorating streetlight system. In addition to providing significant energy savings, the project will also improve the quality of lighting throughout the City streets. Figure 2 below presents a high‐level view of the master plan. Highlighted areas denote sections of the City where streetlight conversions are proposed.
Figure 2 – City Streetlight 15‐Year Master Plan
Section 1 Introduction
City of Newport Beach ‐ Energy Action Plan Page 6
Over the past four years, the City has completed installations at multiple site‐locations including:
• Balboa Pier • Newport Pier and adjacent McFadden Plaza • Harbor View Community • San Joaquin Hills Road • Irvine Avenue • Bayside Drive • Harbor Island Drive • Westcliff Community • Anniversary Tract
General scope‐of‐work has included the following:
1. Remove existing incandescent streetlights that run on an old series circuit and replace them with light‐emitting diode (LED) or high‐pressure sodium (HPS) fixtures that connect to the City's parallel circuit system.
2. Replace existing double arm streetlights with single arm streetlights. The single arm streetlights will use high‐output, low energy consuming luminaries, which will consume less than half the power of the double‐arm fixtures.
3. Permanently remove selected streetlight poles. Strategic placement of the new high‐efficiency streetlights will provide the same level of brightness in the area with a fewer number of lights.
The multiple installations were broken up into three different projects, namely: FY 09/10, FY 10/11, FY 11/12, and FY 12/13. Total annual energy savings for the projects are summarized in the table below:
Table 1– Summary of Energy Savings ‐ City Streetlight Efficiency Project
Project Annual Electricity Savings
(kWh) [1] Annual Natural Gas
Savings (Therms) Fiscal Year 2009‐2010 Streetlight Conversion 29,802 0 Fiscal Year 2010‐11 Streetlight Conversion 69,167 0 Fiscal Year 2011‐2012 Streetlight Conversion 27,470 0 Fiscal year 2012‐2013 Streetlight Conversion 20,200 0
TOTAL 126,439 0 [1] Savings based on SCE Installation Report
Section 1 Introduction
City of Newport Beach ‐ Energy Action Plan Page 7
New Building Construction – LEED
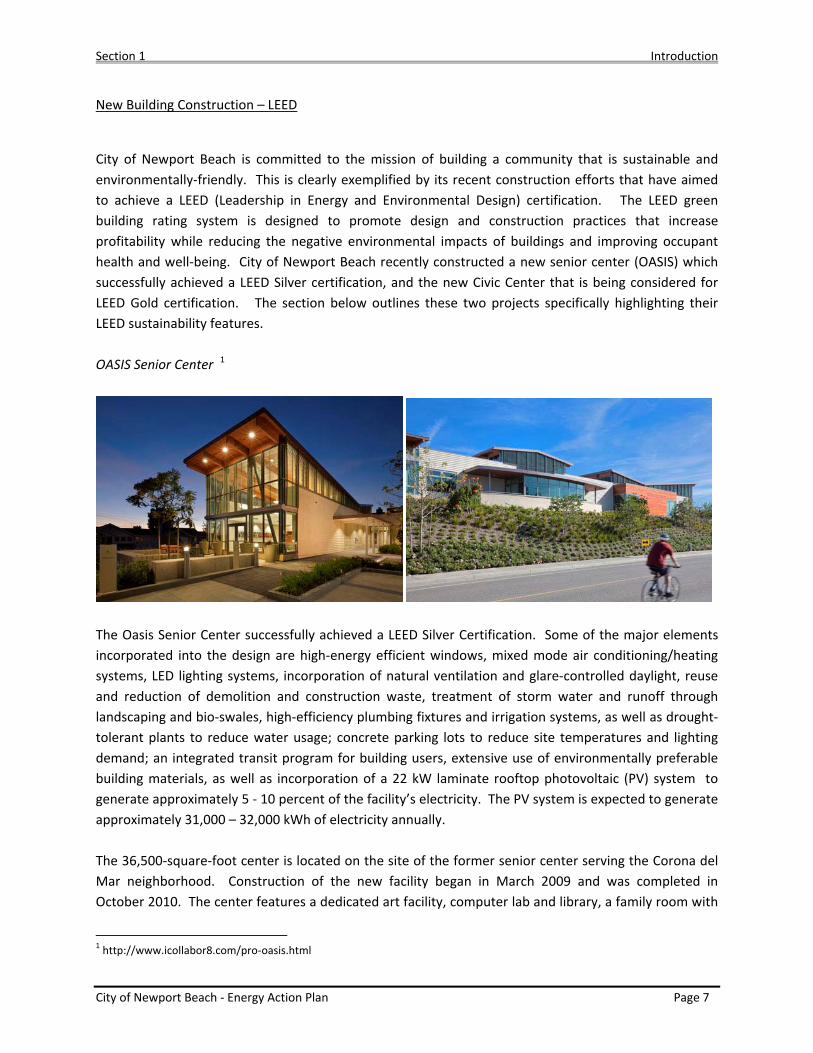
City of Newport Beach is committed to the mission of building a community that is sustainable and environmentally‐friendly. This is clearly exemplified by its recent construction efforts that have aimed to achieve a LEED (Leadership in Energy and Environmental Design) certification. The LEED green building rating system is designed to promote design and construction practices that increase profitability while reducing the negative environmental impacts of buildings and improving occupant health and well‐being. City of Newport Beach recently constructed a new senior center (OASIS) which successfully achieved a LEED Silver certification, and the new Civic Center that is being considered for LEED Gold certification. The section below outlines these two projects specifically highlighting their LEED sustainability features. OASIS Senior Center 1
The Oasis Senior Center successfully achieved a LEED Silver Certification. Some of the major elements incorporated into the design are high‐energy efficient windows, mixed mode air conditioning/heating systems, LED lighting systems, incorporation of natural ventilation and glare‐controlled daylight, reuse and reduction of demolition and construction waste, treatment of storm water and runoff through landscaping and bio‐swales, high‐efficiency plumbing fixtures and irrigation systems, as well as drought‐tolerant plants to reduce water usage; concrete parking lots to reduce site temperatures and lighting demand; an integrated transit program for building users, extensive use of environmentally preferable building materials, as well as incorporation of a 22 kW laminate rooftop photovoltaic (PV) system to generate approximately 5 ‐ 10 percent of the facility’s electricity. The PV system is expected to generate approximately 31,000 – 32,000 kWh of electricity annually. The 36,500‐square‐foot center is located on the site of the former senior center serving the Corona del Mar neighborhood. Construction of the new facility began in March 2009 and was completed in October 2010. The center features a dedicated art facility, computer lab and library, a family room with
1 http://www.icollabor8.com/pro‐oasis.html
Section 1 Introduction
City of Newport Beach ‐ Energy Action Plan Page 8
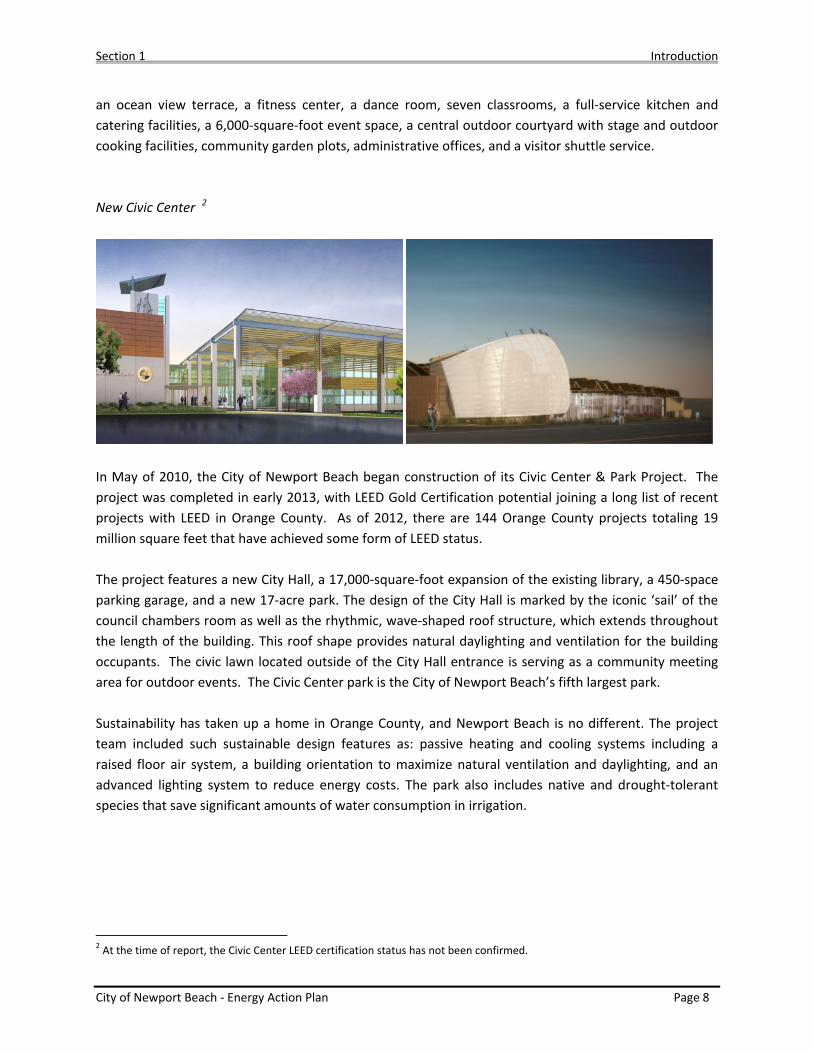
an ocean view terrace, a fitness center, a dance room, seven classrooms, a full‐service kitchen and catering facilities, a 6,000‐square‐foot event space, a central outdoor courtyard with stage and outdoor cooking facilities, community garden plots, administrative offices, and a visitor shuttle service. New Civic Center 2
In May of 2010, the City of Newport Beach began construction of its Civic Center & Park Project. The project was completed in early 2013, with LEED Gold Certification potential joining a long list of recent projects with LEED in Orange County. As of 2012, there are 144 Orange County projects totaling 19 million square feet that have achieved some form of LEED status. The project features a new City Hall, a 17,000‐square‐foot expansion of the existing library, a 450‐space parking garage, and a new 17‐acre park. The design of the City Hall is marked by the iconic ‘sail’ of the council chambers room as well as the rhythmic, wave‐shaped roof structure, which extends throughout the length of the building. This roof shape provides natural daylighting and ventilation for the building occupants. The civic lawn located outside of the City Hall entrance is serving as a community meeting area for outdoor events. The Civic Center park is the City of Newport Beach’s fifth largest park. Sustainability has taken up a home in Orange County, and Newport Beach is no different. The project team included such sustainable design features as: passive heating and cooling systems including a raised floor air system, a building orientation to maximize natural ventilation and daylighting, and an advanced lighting system to reduce energy costs. The park also includes native and drought‐tolerant species that save significant amounts of water consumption in irrigation.
2 At the time of report, the Civic Center LEED certification status has not been confirmed.
Section 2 City of Newport Beach Energy Use
City of Newport Beach ‐ Energy Action Plan Page 9
SECTION 2 ‐ CITY OF NEWPORT BEACH ENERGY USE
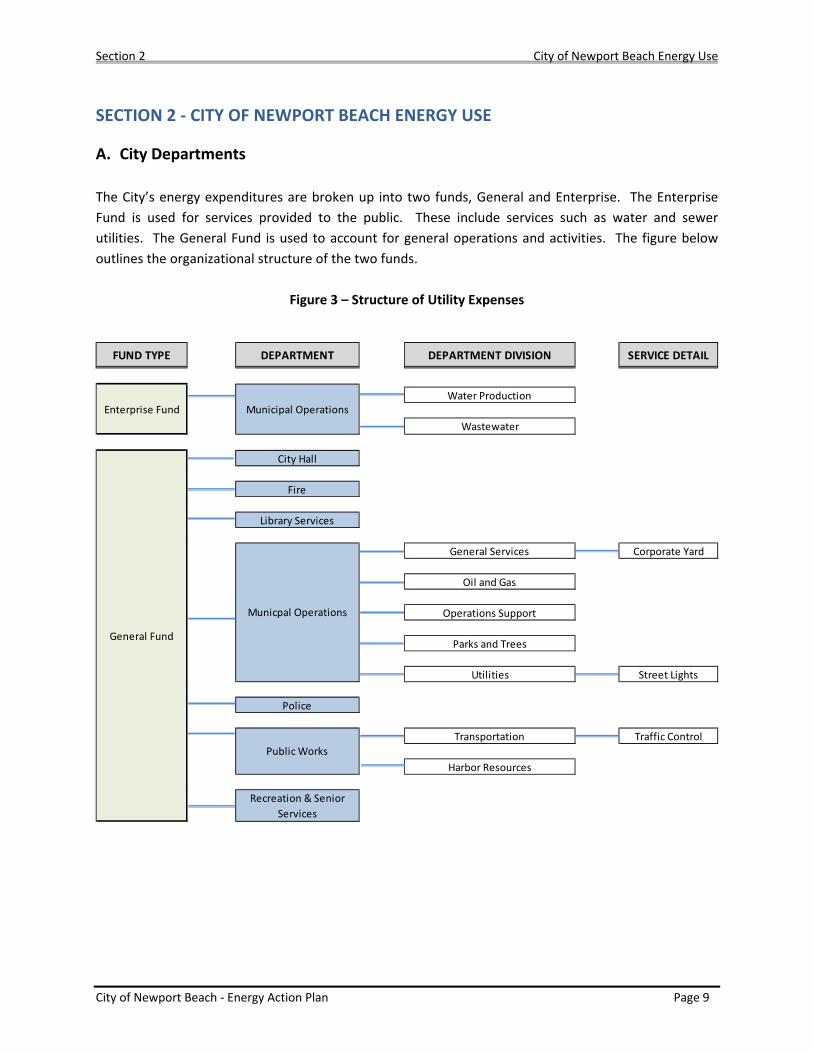
A. City Departments The City’s energy expenditures are broken up into two funds, General and Enterprise. The Enterprise Fund is used for services provided to the public. These include services such as water and sewer utilities. The General Fund is used to account for general operations and activities. The figure below outlines the organizational structure of the two funds.
Figure 3 – Structure of Utility Expenses
FUND TYPE DEPARTMENT DEPARTMENT DIVISION SERVICE DETAIL
Water Production
Wastewater
City Hall
Fire
Library Services
General Services Corporate Yard
Oil and Gas
Operations Support
Parks and Trees
Utilities Street Lights
Police
Transportation Traffic Control
Harbor Resources
Recreation & Senior Services
Enterprise Fund Municipal Operations
General Fund
Municpal Operations
Public Works
Section 2 City of Newport Beach Energy Use
City of Newport Beach ‐ Energy Action Plan Page 10
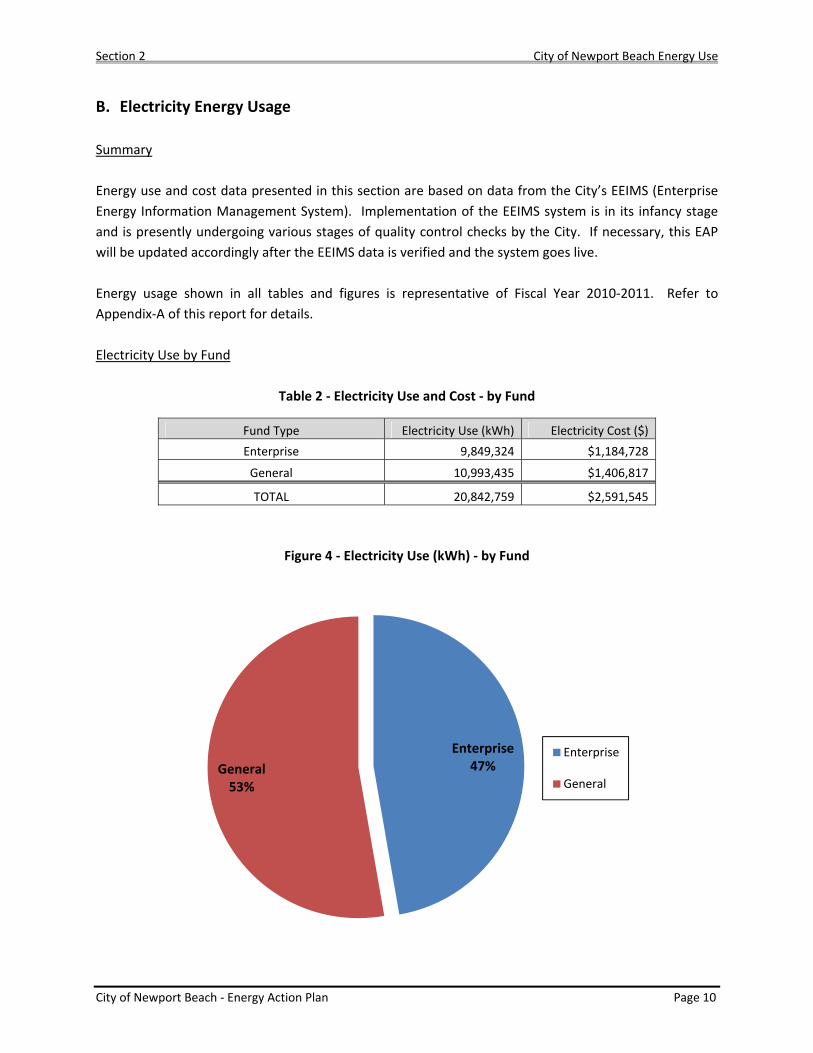
B. Electricity Energy Usage Summary Energy use and cost data presented in this section are based on data from the City’s EEIMS (Enterprise Energy Information Management System). Implementation of the EEIMS system is in its infancy stage and is presently undergoing various stages of quality control checks by the City. If necessary, this EAP will be updated accordingly after the EEIMS data is verified and the system goes live. Energy usage shown in all tables and figures is representative of Fiscal Year 2010‐2011. Refer to Appendix‐A of this report for details. Electricity Use by Fund
Table 2 ‐ Electricity Use and Cost ‐ by Fund
Fund Type Electricity Use (kWh) Electricity Cost ($) Enterprise 9,849,324 $1,184,728
General 10,993,435 $1,406,817
TOTAL 20,842,759 $2,591,545
Figure 4 ‐ Electricity Use (kWh) ‐ by Fund
Enterprise47%General
53%
Enterprise
General
Section 2 City of Newport Beach Energy Use
City of Newport Beach ‐ Energy Action Plan Page 11
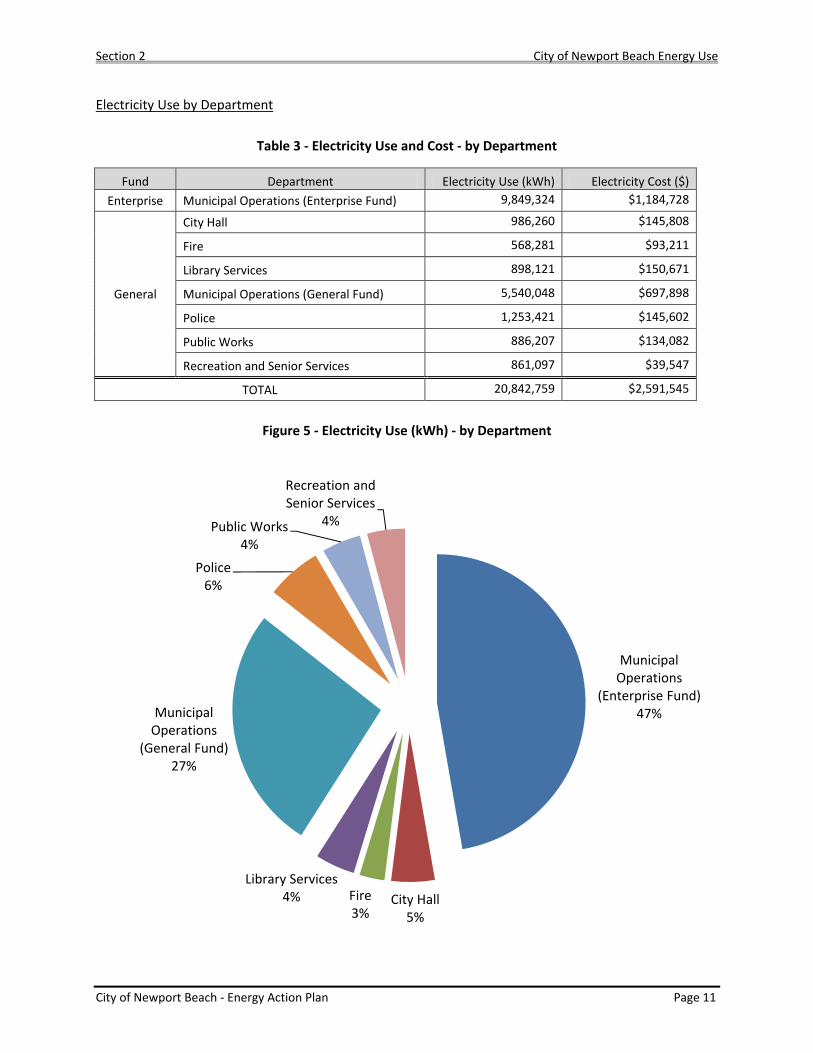
Electricity Use by Department
Table 3 ‐ Electricity Use and Cost ‐ by Department
Fund Department Electricity Use (kWh) Electricity Cost ($) Enterprise Municipal Operations (Enterprise Fund) 9,849,324 $1,184,728
General
City Hall 986,260 $145,808
Fire 568,281 $93,211
Library Services 898,121 $150,671
Municipal Operations (General Fund) 5,540,048 $697,898
Police 1,253,421 $145,602
Public Works 886,207 $134,082
Recreation and Senior Services 861,097 $39,547
TOTAL 20,842,759 $2,591,545
Figure 5 ‐ Electricity Use (kWh) ‐ by Department
Municipal Operations
(Enterprise Fund)47%
City Hall5%
Fire 3%
Library Services4%
Municipal Operations
(General Fund)27%
Police6%
Public Works4%
Recreation and Senior Services
4%
Section 2 City of Newport Beach Energy Use
City of Newport Beach ‐ Energy Action Plan Page 12
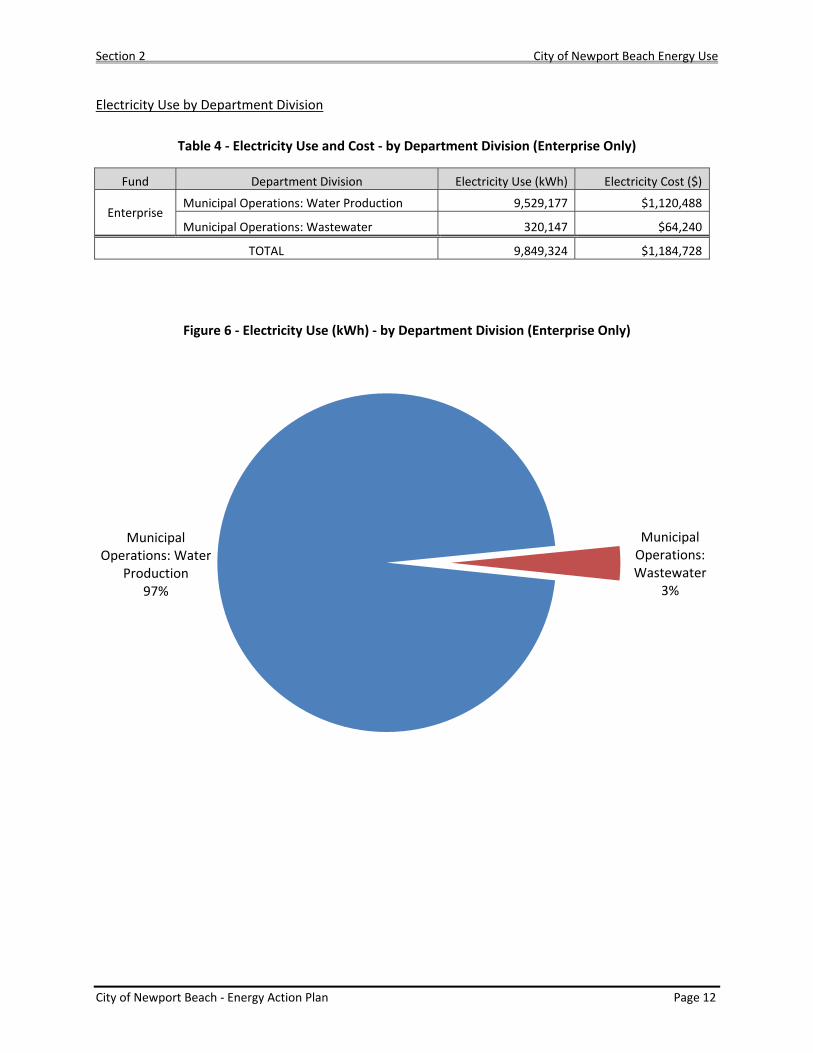
Electricity Use by Department Division
Table 4 ‐ Electricity Use and Cost ‐ by Department Division (Enterprise Only)
Fund Department Division Electricity Use (kWh) Electricity Cost ($)
Enterprise Municipal Operations: Water Production 9,529,177 $1,120,488
Municipal Operations: Wastewater 320,147 $64,240
TOTAL 9,849,324 $1,184,728
Figure 6 ‐ Electricity Use (kWh) ‐ by Department Division (Enterprise Only)
Municipal Operations: Water
Production97%
Municipal Operations: Wastewater
3%
Section 2 City of Newport Beach Energy Use
City of Newport Beach ‐ Energy Action Plan Page 13
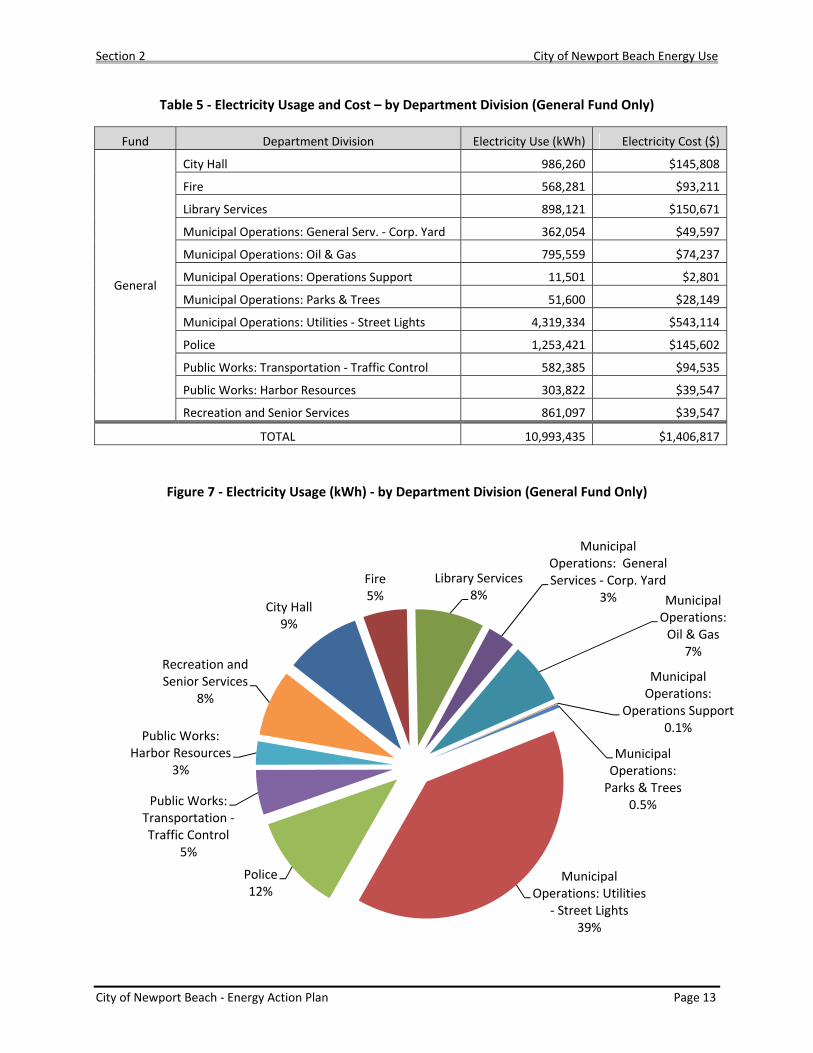
Table 5 ‐ Electricity Usage and Cost – by Department Division (General Fund Only)
Fund Department Division Electricity Use (kWh) Electricity Cost ($)
General
City Hall 986,260 $145,808
Fire 568,281 $93,211
Library Services 898,121 $150,671
Municipal Operations: General Serv. ‐ Corp. Yard 362,054 $49,597
Municipal Operations: Oil & Gas 795,559 $74,237
Municipal Operations: Operations Support 11,501 $2,801
Municipal Operations: Parks & Trees 51,600 $28,149
Municipal Operations: Utilities ‐ Street Lights 4,319,334 $543,114
Police 1,253,421 $145,602
Public Works: Transportation ‐ Traffic Control 582,385 $94,535
Public Works: Harbor Resources 303,822 $39,547
Recreation and Senior Services 861,097 $39,547
TOTAL 10,993,435 $1,406,817
Figure 7 ‐ Electricity Usage (kWh) ‐ by Department Division (General Fund Only)
City Hall9%
Fire 5%
Library Services8%
Municipal Operations: General Services ‐ Corp. Yard
3% Municipal Operations: Oil & Gas
7%
Municipal Operations:
Operations Support0.1%
Municipal Operations: Parks & Trees
0.5%
Municipal Operations: Utilities
‐ Street Lights39%
Police12%
Public Works: Transportation ‐Traffic Control
5%
Public Works: Harbor Resources
3%
Recreation and Senior Services
8%
Section 2 City of Newport Beach Energy Use
City of Newport Beach ‐ Energy Action Plan Page 14
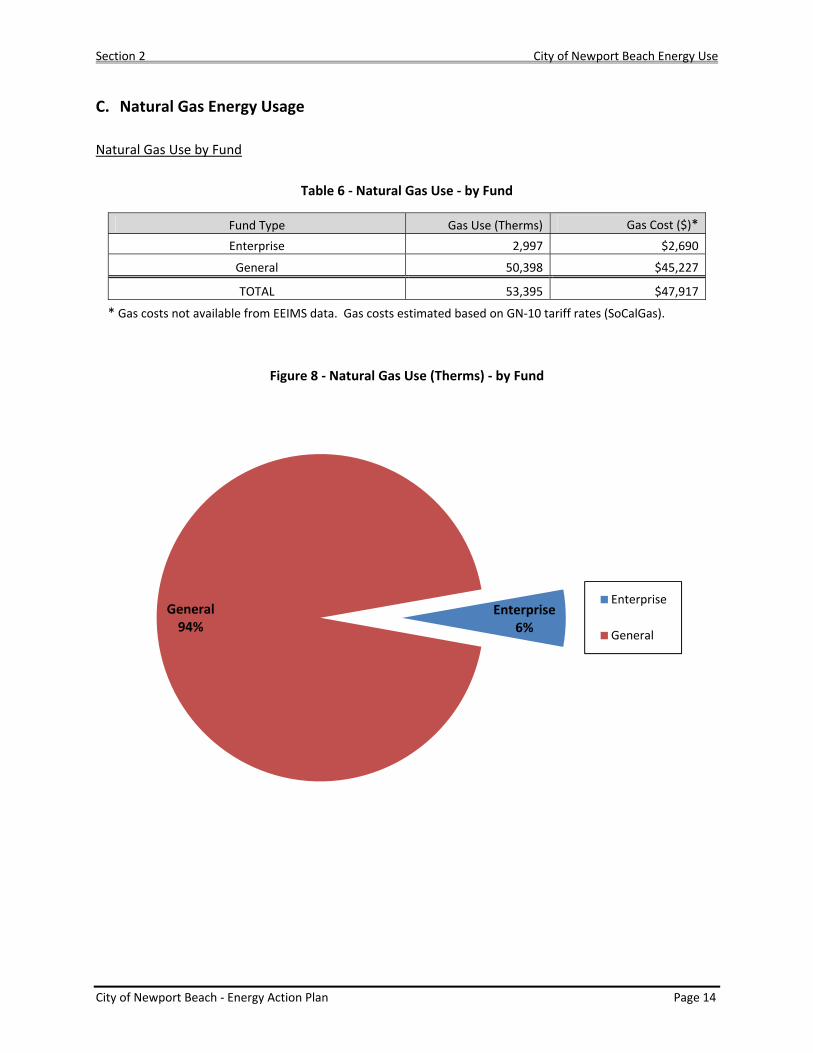
C. Natural Gas Energy Usage Natural Gas Use by Fund
Table 6 ‐ Natural Gas Use ‐ by Fund
Fund Type Gas Use (Therms) Gas Cost ($)* Enterprise 2,997 $2,690
General 50,398 $45,227
TOTAL 53,395 $47,917
* Gas costs not available from EEIMS data. Gas costs estimated based on GN‐10 tariff rates (SoCalGas).
Figure 8 ‐ Natural Gas Use (Therms) ‐ by Fund
Enterprise6%
General94%
Enterprise
General
Section 2 City of Newport Beach Energy Use
City of Newport Beach ‐ Energy Action Plan Page 15
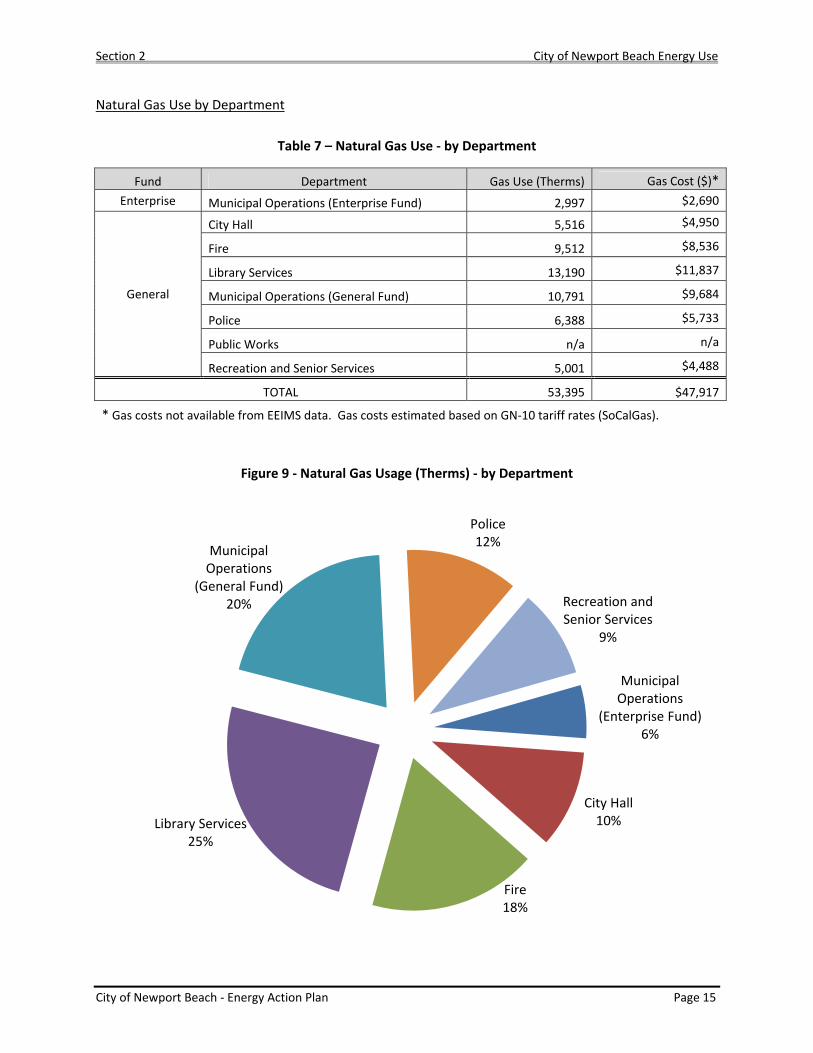
Natural Gas Use by Department
Table 7 – Natural Gas Use ‐ by Department
Fund Department Gas Use (Therms) Gas Cost ($)* Enterprise Municipal Operations (Enterprise Fund) 2,997 $2,690
General
City Hall 5,516 $4,950
Fire 9,512 $8,536
Library Services 13,190 $11,837
Municipal Operations (General Fund) 10,791 $9,684
Police 6,388 $5,733
Public Works n/a n/a
Recreation and Senior Services 5,001 $4,488
TOTAL 53,395 $47,917
* Gas costs not available from EEIMS data. Gas costs estimated based on GN‐10 tariff rates (SoCalGas).
Figure 9 ‐ Natural Gas Usage (Therms) ‐ by Department
Municipal Operations
(Enterprise Fund)6%
City Hall10%
Fire 18%
Library Services25%
Municipal Operations
(General Fund)20%
Police12%
Recreation and Senior Services
9%
Section 2 City of Newport Beach Energy Use
City of Newport Beach ‐ Energy Action Plan Page 16
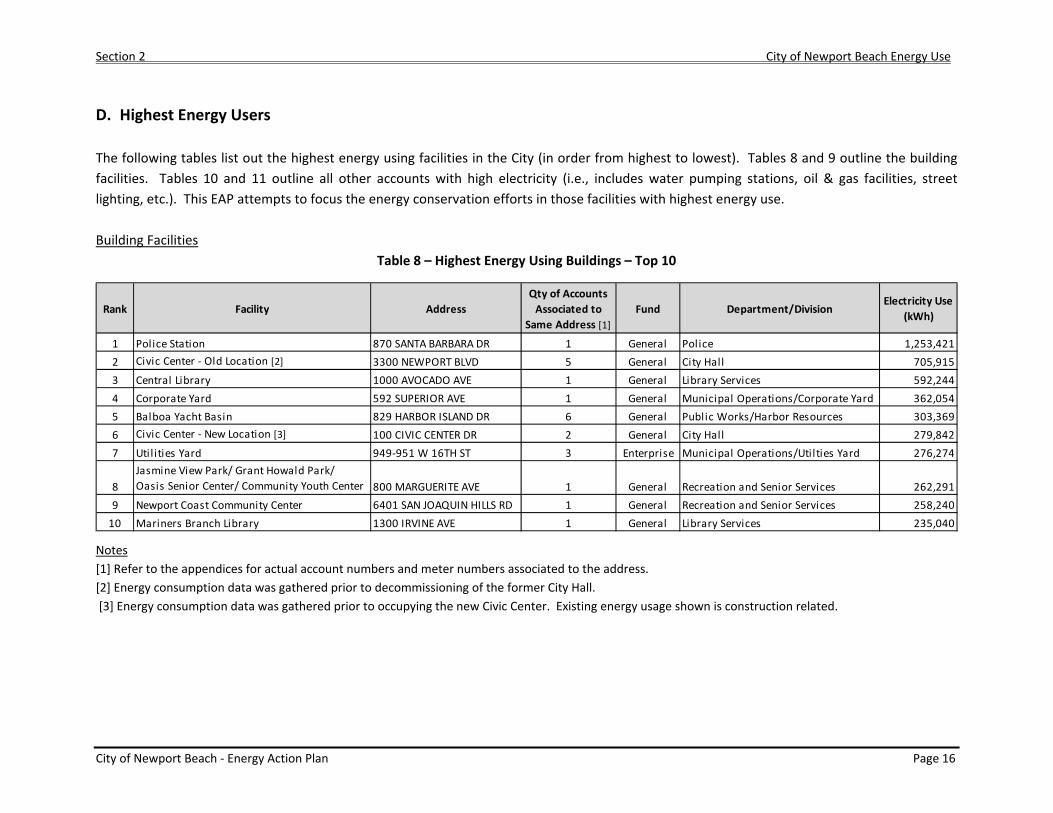
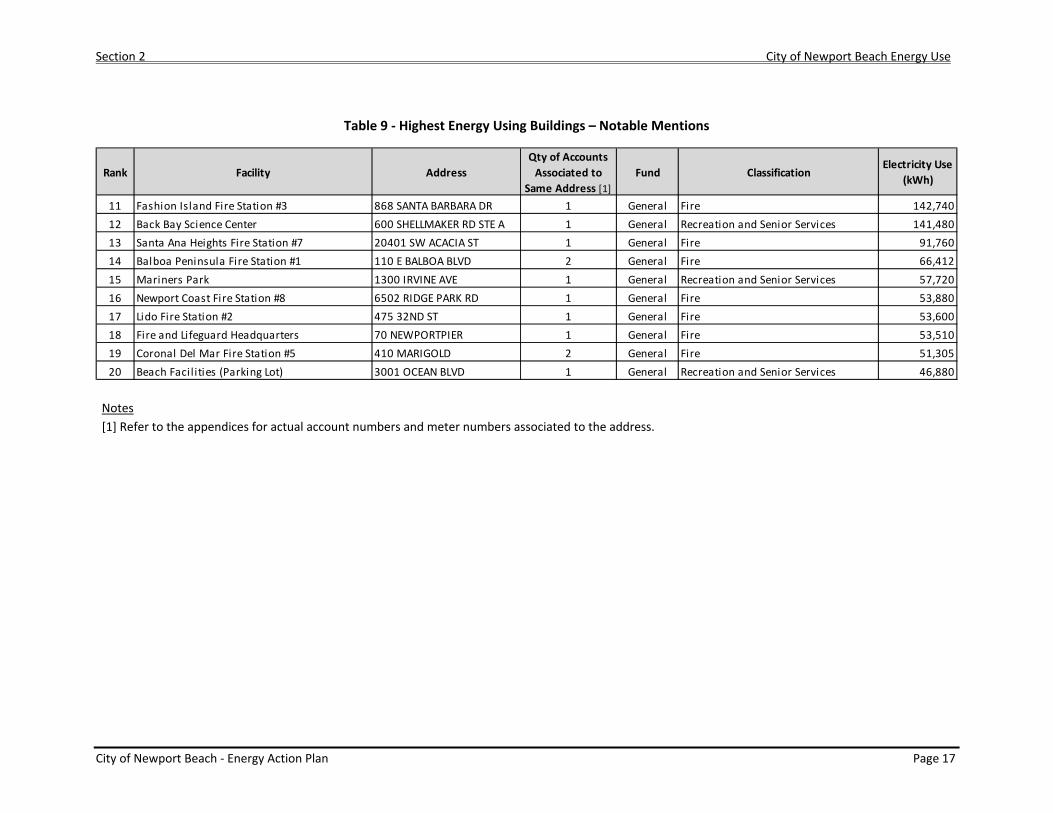
D. Highest Energy Users The following tables list out the highest energy using facilities in the City (in order from highest to lowest). Tables 8 and 9 outline the building facilities. Tables 10 and 11 outline all other accounts with high electricity (i.e., includes water pumping stations, oil & gas facilities, street lighting, etc.). This EAP attempts to focus the energy conservation efforts in those facilities with highest energy use. Building Facilities
Table 8 – Highest Energy Using Buildings – Top 10
Notes [1] Refer to the appendices for actual account numbers and meter numbers associated to the address. [2] Energy consumption data was gathered prior to decommissioning of the former City Hall. [3] Energy consumption data was gathered prior to occupying the new Civic Center. Existing energy usage shown is construction related.
Rank Facility AddressQty of Accounts Associated to
Same Address [1]Fund Department/Division
Electricity Use (kWh)
1 Police Station 870 SANTA BARBARA DR 1 General Police 1,253,4212 Civic Center ‐ Old Location [2] 3300 NEWPORT BLVD 5 General City Hall 705,9153 Central Library 1000 AVOCADO AVE 1 General Library Services 592,2444 Corporate Yard 592 SUPERIOR AVE 1 General Municipal Operations/Corporate Yard 362,0545 Balboa Yacht Basin 829 HARBOR ISLAND DR 6 General Public Works/Harbor Resources 303,3696 Civic Center ‐ New Location [3] 100 CIVIC CENTER DR 2 General City Hall 279,8427 Utilities Yard 949‐951 W 16TH ST 3 Enterprise Municipal Operations/Utilties Yard 276,274
8Jasmine View Park/ Grant Howald Park/ Oasis Senior Center/ Community Youth Center 800 MARGUERITE AVE 1 General Recreation and Senior Services 262,291
9 Newport Coast Community Center 6401 SAN JOAQUIN HILLS RD 1 General Recreation and Senior Services 258,24010 Mariners Branch Library 1300 IRVINE AVE 1 General Library Services 235,040
Section 2 City of Newport Beach Energy Use
City of Newport Beach ‐ Energy Action Plan Page 17
Table 9 ‐ Highest Energy Using Buildings – Notable Mentions
Notes [1] Refer to the appendices for actual account numbers and meter numbers associated to the address.
Rank Facility AddressQty of Accounts Associated to
Same Address [1]Fund Classification
Electricity Use (kWh)
11 Fashion Island Fire Station #3 868 SANTA BARBARA DR 1 General Fire 142,74012 Back Bay Science Center 600 SHELLMAKER RD STE A 1 General Recreation and Senior Services 141,48013 Santa Ana Heights Fire Station #7 20401 SW ACACIA ST 1 General Fire 91,76014 Balboa Peninsula Fire Station #1 110 E BALBOA BLVD 2 General Fire 66,41215 Mariners Park 1300 IRVINE AVE 1 General Recreation and Senior Services 57,72016 Newport Coast Fire Station #8 6502 RIDGE PARK RD 1 General Fire 53,88017 Lido Fire Station #2 475 32ND ST 1 General Fire 53,60018 Fire and Lifeguard Headquarters 70 NEWPORTPIER 1 General Fire 53,51019 Coronal Del Mar Fire Station #5 410 MARIGOLD 2 General Fire 51,30520 Beach Facil ities (Parking Lot) 3001 OCEAN BLVD 1 General Recreation and Senior Services 46,880
Section 2 City of Newport Beach Energy Use
City of Newport Beach ‐ Energy Action Plan Page 18
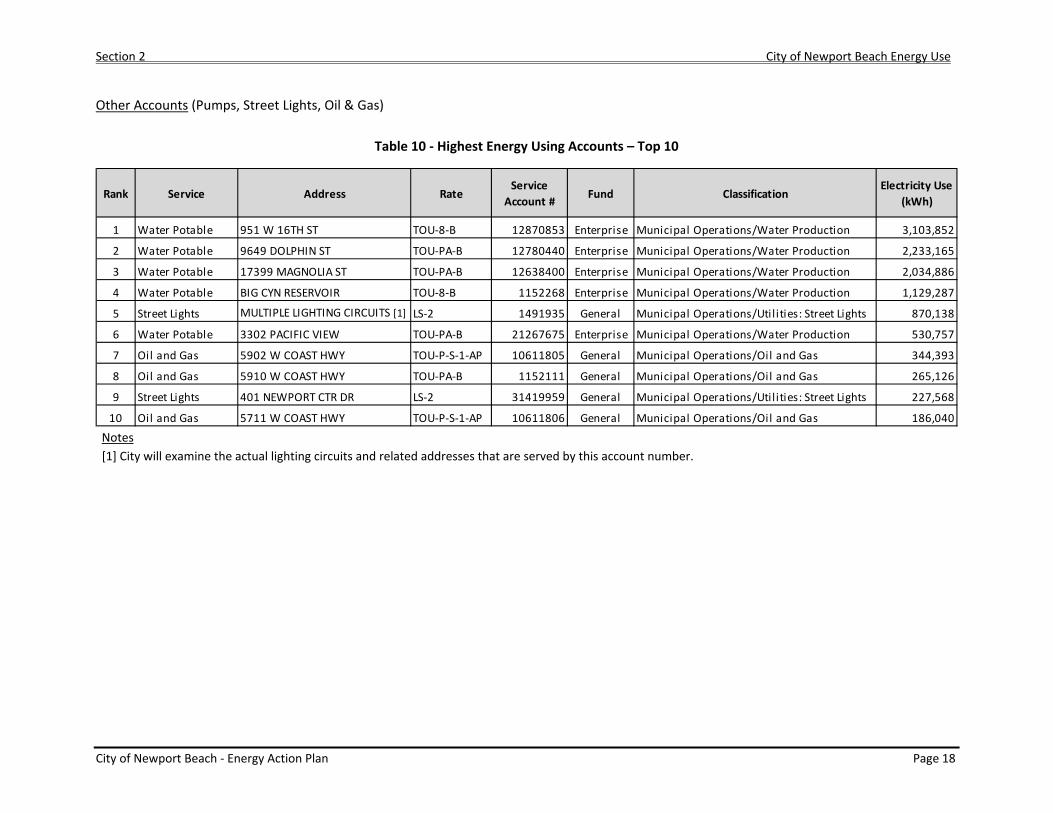
Other Accounts (Pumps, Street Lights, Oil & Gas)
Table 10 ‐ Highest Energy Using Accounts – Top 10
Notes [1] City will examine the actual lighting circuits and related addresses that are served by this account number.
Rank Service Address RateService
Account # Fund ClassificationElectricity Use
(kWh)
1 Water Potable 951 W 16TH ST TOU‐8‐B 12870853 Enterprise Municipal Operations/Water Production 3,103,852
2 Water Potable 9649 DOLPHIN ST TOU‐PA‐B 12780440 Enterprise Municipal Operations/Water Production 2,233,165
3 Water Potable 17399 MAGNOLIA ST TOU‐PA‐B 12638400 Enterprise Municipal Operations/Water Production 2,034,886
4 Water Potable BIG CYN RESERVOIR TOU‐8‐B 1152268 Enterprise Municipal Operations/Water Production 1,129,287
5 Street Lights MULTIPLE LIGHTING CIRCUITS [1] LS‐2 1491935 General Municipal Operations/Utilities: Street Lights 870,138
6 Water Potable 3302 PACIFIC VIEW TOU‐PA‐B 21267675 Enterprise Municipal Operations/Water Production 530,757
7 Oil and Gas 5902 W COAST HWY TOU‐P‐S‐1‐AP 10611805 General Municipal Operations/Oil and Gas 344,393
8 Oil and Gas 5910 W COAST HWY TOU‐PA‐B 1152111 General Municipal Operations/Oil and Gas 265,126
9 Street Lights 401 NEWPORT CTR DR LS‐2 31419959 General Municipal Operations/Utilities: Street Lights 227,568
10 Oil and Gas 5711 W COAST HWY TOU‐P‐S‐1‐AP 10611806 General Municipal Operations/Oil and Gas 186,040
Section 2 City of Newport Beach Energy Use
City of Newport Beach ‐ Energy Action Plan Page 19
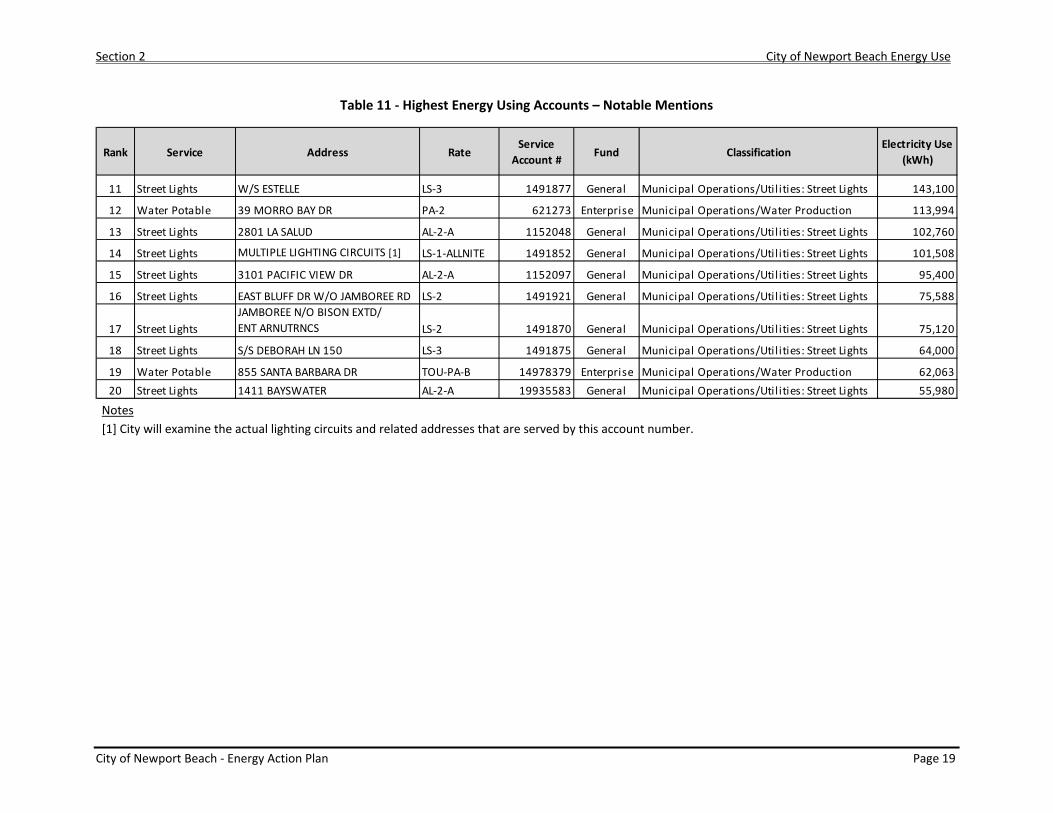
Table 11 ‐ Highest Energy Using Accounts – Notable Mentions
Notes [1] City will examine the actual lighting circuits and related addresses that are served by this account number.
Rank Service Address RateService
Account # Fund ClassificationElectricity Use
(kWh)
11 Street Lights W/S ESTELLE LS‐3 1491877 General Municipal Operations/Util ities: Street Lights 143,100
12 Water Potable 39 MORRO BAY DR PA‐2 621273 Enterprise Municipal Operations/Water Production 113,994
13 Street Lights 2801 LA SALUD AL‐2‐A 1152048 General Municipal Operations/Util ities: Street Lights 102,760
14 Street Lights MULTIPLE LIGHTING CIRCUITS [1] LS‐1‐ALLNITE 1491852 General Municipal Operations/Util ities: Street Lights 101,508
15 Street Lights 3101 PACIFIC VIEW DR AL‐2‐A 1152097 General Municipal Operations/Util ities: Street Lights 95,400
16 Street Lights EAST BLUFF DR W/O JAMBOREE RD LS‐2 1491921 General Municipal Operations/Util ities: Street Lights 75,588
17 Street LightsJAMBOREE N/O BISON EXTD/ENT ARNUTRNCS LS‐2 1491870 General Municipal Operations/Util ities: Street Lights 75,120
18 Street Lights S/S DEBORAH LN 150 LS‐3 1491875 General Municipal Operations/Util ities: Street Lights 64,000
19 Water Potable 855 SANTA BARBARA DR TOU‐PA‐B 14978379 Enterprise Municipal Operations/Water Production 62,06320 Street Lights 1411 BAYSWATER AL‐2‐A 19935583 General Municipal Operations/Util ities: Street Lights 55,980
Section 2 City of Newport Beach Energy Use
City of Newport Beach ‐ Energy Action Plan Page 20
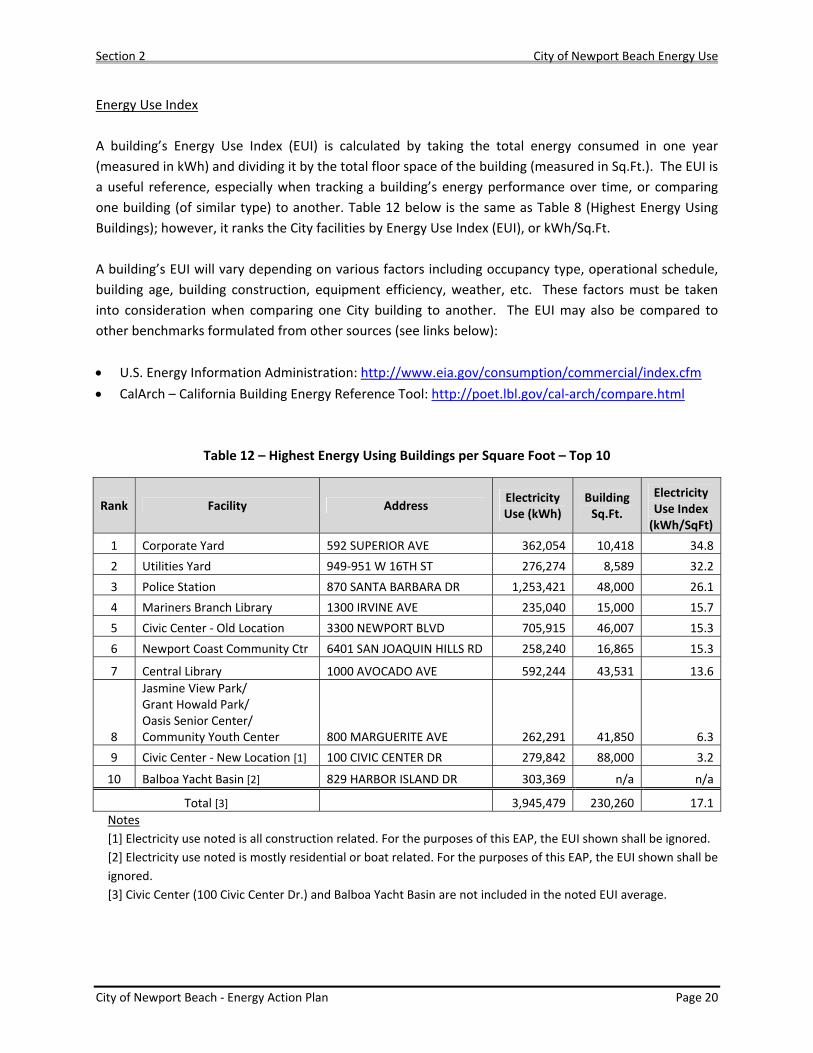
Energy Use Index A building’s Energy Use Index (EUI) is calculated by taking the total energy consumed in one year (measured in kWh) and dividing it by the total floor space of the building (measured in Sq.Ft.). The EUI is a useful reference, especially when tracking a building’s energy performance over time, or comparing one building (of similar type) to another. Table 12 below is the same as Table 8 (Highest Energy Using Buildings); however, it ranks the City facilities by Energy Use Index (EUI), or kWh/Sq.Ft. A building’s EUI will vary depending on various factors including occupancy type, operational schedule, building age, building construction, equipment efficiency, weather, etc. These factors must be taken into consideration when comparing one City building to another. The EUI may also be compared to other benchmarks formulated from other sources (see links below): • U.S. Energy Information Administration: http://www.eia.gov/consumption/commercial/index.cfm • CalArch – California Building Energy Reference Tool: http://poet.lbl.gov/cal‐arch/compare.html
Table 12 – Highest Energy Using Buildings per Square Foot – Top 10
Rank Facility Address Electricity Use (kWh)
Building Sq.Ft.
Electricity Use Index (kWh/SqFt)
1 Corporate Yard 592 SUPERIOR AVE 362,054 10,418 34.8 2 Utilities Yard 949‐951 W 16TH ST 276,274 8,589 32.2 3 Police Station 870 SANTA BARBARA DR 1,253,421 48,000 26.1 4 Mariners Branch Library 1300 IRVINE AVE 235,040 15,000 15.7 5 Civic Center ‐ Old Location 3300 NEWPORT BLVD 705,915 46,007 15.3 6 Newport Coast Community Ctr 6401 SAN JOAQUIN HILLS RD 258,240 16,865 15.3
7 Central Library 1000 AVOCADO AVE 592,244 43,531 13.6
8
Jasmine View Park/ Grant Howald Park/ Oasis Senior Center/ Community Youth Center 800 MARGUERITE AVE 262,291 41,850 6.3
9 Civic Center ‐ New Location [1] 100 CIVIC CENTER DR 279,842 88,000 3.2
10 Balboa Yacht Basin [2] 829 HARBOR ISLAND DR 303,369 n/a n/a
Total [3] 3,945,479 230,260 17.1 Notes [1] Electricity use noted is all construction related. For the purposes of this EAP, the EUI shown shall be ignored. [2] Electricity use noted is mostly residential or boat related. For the purposes of this EAP, the EUI shown shall be ignored. [3] Civic Center (100 Civic Center Dr.) and Balboa Yacht Basin are not included in the noted EUI average.
Section 2 City of Newport Beach Energy Use
City of Newport Beach ‐ Energy Action Plan Page 21
E. Current Energy Programs/Policies AB 32 – Global Warming Solutions Act The Global Warming Solutions Act of 2006, or Assembly Bill (AB) 32, is a California State Law that fights climate change by establishing a comprehensive program to reduce greenhouse gas emissions from all sources throughout the state. AB 32 requires the California Air Resources Board (CARB or ARB) to develop regulations and market mechanisms to reduce California's greenhouse gas emissions to 1990 levels by 2020, with mandatory caps beginning in 2012 for significant emissions sources. The bill provides the Governor the ability to suspend the emissions caps for up to one year in the case of an emergency or significant economic harm. 3 Energy Efficiency and Conservation Block Grant (EECBG) Program 4 The Energy Efficiency and Conservation Block Grant (EECBG) Program, funded for the first time by the American Recovery and Reinvestment Act (Recovery Act) of 2009, represents a Presidential priority to deploy the cheapest, cleanest, and most reliable energy technologies available ‐ energy efficiency and conservation ‐ across the country. It is intended to assist U.S. cities, counties, states, territories, and Indian tribes to develop, promote, implement, and manage energy efficiency and conservation projects and programs designed to do the following:
• Reduce fossil fuel emissions; • Reduce the total energy use of the eligible entities; • Improve energy efficiency in the transportation, building, and other appropriate sectors; and • Create and retain jobs.
Through formula and competitive grants, the Program empowers local communities to make strategic investments to meet the nation's long‐term goals for energy independence and leadership on climate change. Grants can be used for energy efficiency and conservation programs and projects communitywide, as well as renewable energy installations on government buildings. Activities eligible for use of funds include the following:
• Development of an energy efficiency and conservation strategy; • Building energy audits and retrofits, including weatherization; • Financial incentive programs for energy efficiency such as energy savings performance
contracting, on‐bill financing, and revolving loan funds; • Transportation programs to conserve energy and support renewable fuel infrastructure; • Building code development, implementation, and inspections;
3 Global Warming Solutions Act of 2006, http://en.wikipedia.org/wiki/Global_Warming_Solutions_Act_of_2006 4 Energy Efficiency and Conservation Block Grant Program, http://www1.eere.energy.gov/wip/eecbg.html
Section 2 City of Newport Beach Energy Use
City of Newport Beach ‐ Energy Action Plan Page 22
• Installation of distributed energy technologies including combined heat and power and district heating and cooling systems;
• Material conservation programs including source reduction, recycling, and recycled content procurement programs;
• Reduction and capture of greenhouse gas emissions generated by landfills or similar waste‐related sources;
• Installation of energy efficient traffic signals and street lighting; • Installation of renewable energy technologies on government buildings; and • Any other appropriate activity that meets the purposes of the program and is approved by DOE.
Energy Action Plan This Energy Action Plan (EAP) is intended to provide a roadmap that the City can follow to meet its long‐term energy efficiency and sustainability goals. The EAP aims to identify quantifiable goals and provides various measures and policies that the City can implement to achieve.
Section 3 City of Newport Beach Target Reduction Goals
City of Newport Beach ‐ Energy Action Plan Page 23
SECTION 3 – CITY OF NEWPORT BEACH TARGET REDUCTION GOALS
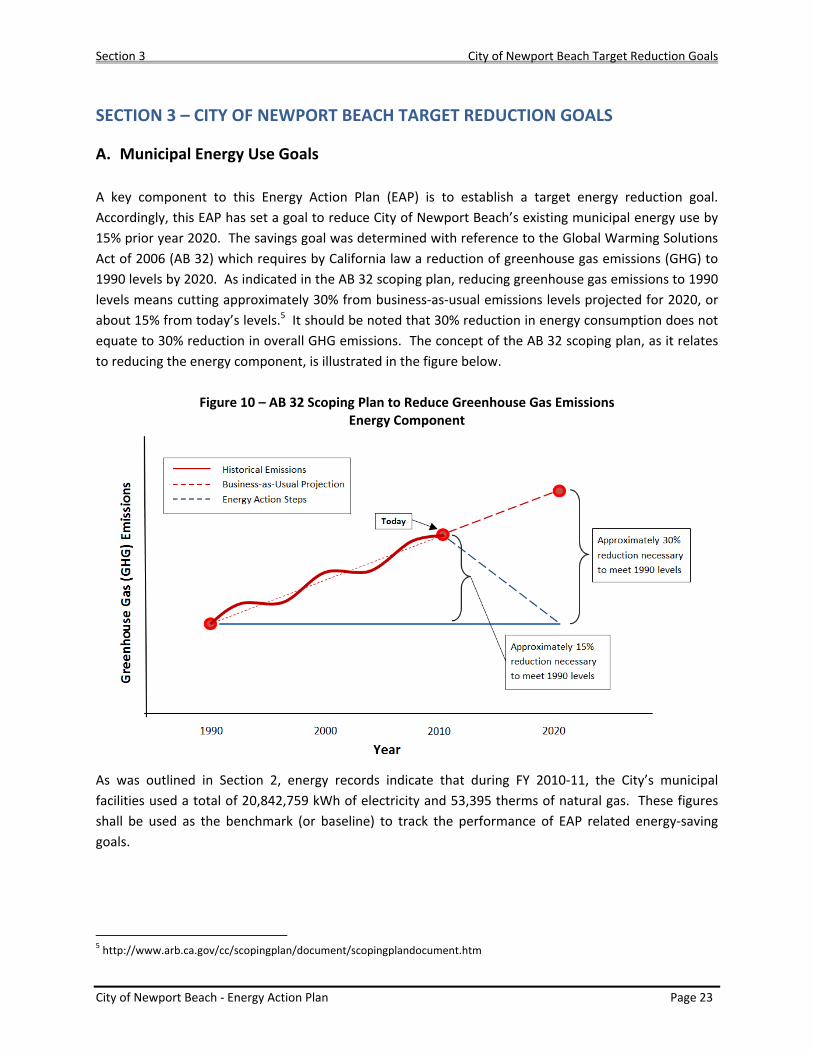
A. Municipal Energy Use Goals A key component to this Energy Action Plan (EAP) is to establish a target energy reduction goal. Accordingly, this EAP has set a goal to reduce City of Newport Beach’s existing municipal energy use by 15% prior year 2020. The savings goal was determined with reference to the Global Warming Solutions Act of 2006 (AB 32) which requires by California law a reduction of greenhouse gas emissions (GHG) to 1990 levels by 2020. As indicated in the AB 32 scoping plan, reducing greenhouse gas emissions to 1990 levels means cutting approximately 30% from business‐as‐usual emissions levels projected for 2020, or about 15% from today’s levels.5 It should be noted that 30% reduction in energy consumption does not equate to 30% reduction in overall GHG emissions. The concept of the AB 32 scoping plan, as it relates to reducing the energy component, is illustrated in the figure below.
Figure 10 – AB 32 Scoping Plan to Reduce Greenhouse Gas Emissions Energy Component
As was outlined in Section 2, energy records indicate that during FY 2010‐11, the City’s municipal facilities used a total of 20,842,759 kWh of electricity and 53,395 therms of natural gas. These figures shall be used as the benchmark (or baseline) to track the performance of EAP related energy‐saving goals.
5 http://www.arb.ca.gov/cc/scopingplan/document/scopingplandocument.htm

Section 3 City of Newport Beach Target Reduction Goals
City of Newport Beach ‐ Energy Action Plan Page 24
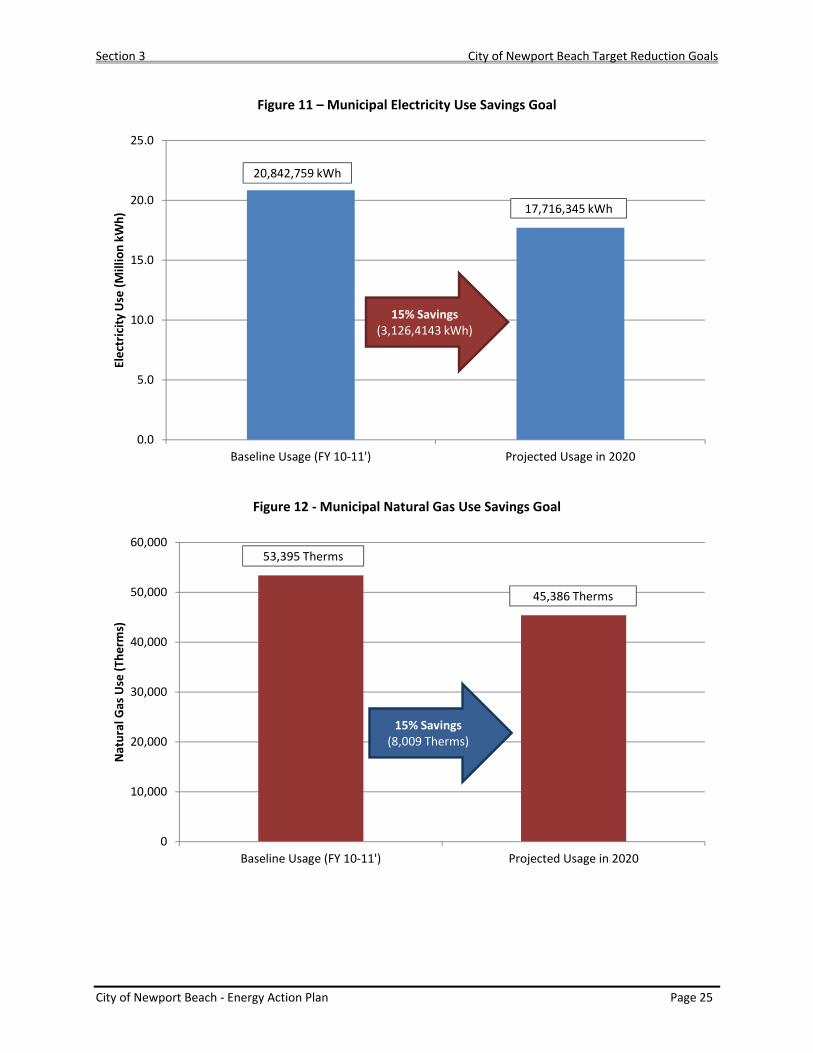
Per the 15% savings goal established above, the target energy use for 2020 is 17,716,345 kWh for electricity and 45,386 therms for natural gas. These are projected savings of approximately 3.1 million kWh of electricity and 8,000 therms of natural gas. See figures below.
Section 4 demonstrates action steps the City will employ to meet its energy reduction goals.
Section 3 City of Newport Beach Target Reduction Goals
City of Newport Beach ‐ Energy Action Plan Page 25
Figure 11 – Municipal Electricity Use Savings Goal
Figure 12 ‐ Municipal Natural Gas Use Savings Goal
0.0
5.0
10.0
15.0
20.0
25.0
Baseline Usage (FY 10‐11') Projected Usage in 2020
Electricity
Use (M
illion kW
h)
17,716,345 kWh
20,842,759 kWh
15% Savings(3,126,4143 kWh)
0
10,000
20,000
30,000
40,000
50,000
60,000
Baseline Usage (FY 10‐11') Projected Usage in 2020
Natural Gas Use (T
herm
s)
45,386 Therms
53,395 Therms
15% Savings(8,009 Therms)
Section 3 City of Newport Beach Target Reduction Goals
City of Newport Beach ‐ Energy Action Plan Page 26
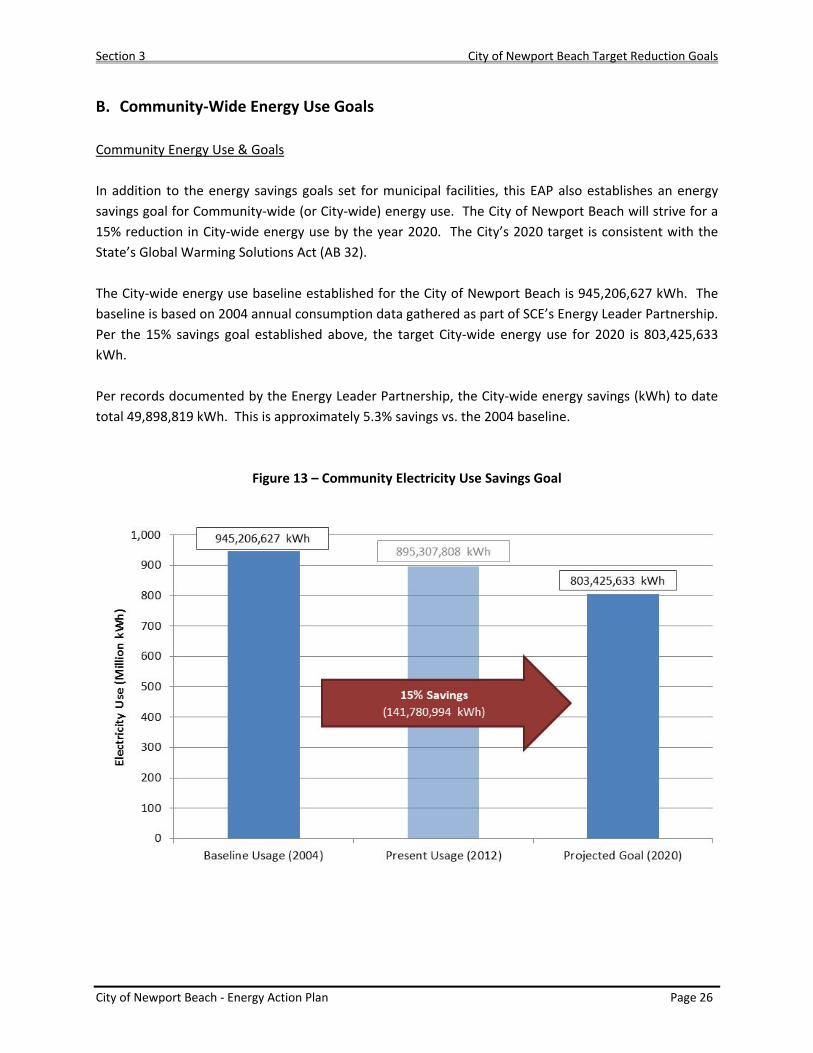
B. Community‐Wide Energy Use Goals Community Energy Use & Goals In addition to the energy savings goals set for municipal facilities, this EAP also establishes an energy savings goal for Community‐wide (or City‐wide) energy use. The City of Newport Beach will strive for a 15% reduction in City‐wide energy use by the year 2020. The City’s 2020 target is consistent with the State’s Global Warming Solutions Act (AB 32). The City‐wide energy use baseline established for the City of Newport Beach is 945,206,627 kWh. The baseline is based on 2004 annual consumption data gathered as part of SCE’s Energy Leader Partnership. Per the 15% savings goal established above, the target City‐wide energy use for 2020 is 803,425,633 kWh. Per records documented by the Energy Leader Partnership, the City‐wide energy savings (kWh) to date total 49,898,819 kWh. This is approximately 5.3% savings vs. the 2004 baseline.
Figure 13 – Community Electricity Use Savings Goal
Section 3 City of Newport Beach Target Reduction Goals
City of Newport Beach ‐ Energy Action Plan Page 27
Community Outreach Community‐wide energy awareness and outreach programs are essential to achieve the City‐wide energy reduction goals. The City has to lead by example before it asks its citizens for cooperation in achieving these goals. Lead by example may include ensuring that new City facilities are built to the highest energy performance and green building standards, providing education and training to the municipal users, changing operations and maintenance practices, and opportunities for use of renewable energy resources. The following outlines a few policies that can be implemented to help achieve the energy savings goal for City‐wide energy use. Community Outreach Groups By leveraging Energy Partnership resources and other funding opportunities, the City can organize outreach groups consisting of representatives from City, SCE, and SCG. Outreach staff will be responsible for developing energy awareness materials and programs that educate the community about energy use in a simple manner. Residents should be aware of their impact on the environment and alternative energy efficiency options to reduce energy consumption. All the material and programs should be explained in a simple language and take into account seasonal changes. City may partner with the local utilities and organizations to educate the community by various media types including newspapers, radio, and television. Also, information can be distributed via utility bill inserts, community/HOA meetings, and special events. Energy Awareness The City and related partners should work together to share information with the public. Community residents should have easy access to information on what to do to make their homes or businesses more energy efficient and whom to contact for support. This information can be made publicly available through the dedicated “green” web‐page on the City’s web site. For example, various links to useful resources can be posted on this same site. These can include the following:
• Energy Upgrade California – Resource for projects, rebates, and State‐certified energy efficiency contractors all in one place. (https://energyupgradeca.org/)
• Electric Vehicle Readiness ‐ Southern California Edison's website with information about purchasing a plug‐in electric vehicle. (http://www.sce.com/info/electric‐car/)
• Flex Your Power ‐ Get quick tips for easy things you can do to save energy, and find rebates for appliances, lighting, heating and cooling, energy audits, and more. (http://www.fypower.org/)
• Cool California ‐ Find rebates and incentive programs for making the home or business more energy efficient. (http://www.coolcalifornia.org/funding‐wizard‐home)
• Energy Kids On‐Line ‐ Fun games and activities for kids and teachers, to help educate kids about the importance of energy efficiency. (http://www.eia.gov/kids/index.cfm)
• Database for Energy Efficient Resources (DEER) ‐ Provides estimates for the energy‐savings potential of various energy‐efficient technologies. (http://www.deeresources.com/)

Section 3 City of Newport Beach Target Reduction Goals
City of Newport Beach ‐ Energy Action Plan Page 28
As an option, the City can provide a summary of municipal facility energy use including recent energy action steps taken to reduce energy. The City is in the process of compiling an Enterprise Energy Management Information System (EEMIS) that can generate various energy reports and track energy data. While this information may be too complex for an average user to understand, a concise easy‐to‐read summary of annual usage will be helpful. If the City leads by example, it will encourage citizens to reduce their own energy consumption and respective impact on the environment.
Section 4 City of Newport Beach Action Steps
City of Newport Beach ‐ Energy Action Plan Page 29
SECTION 4 – CITY OF NEWPORT BEACH ACTION STEPS
A. Municipal Facility Energy Efficiency Projects Pending Projects in the Pipeline • HVAC System Commissioning – Central Library
The City has begun plans to retro‐commission the HVAC systems and controls at the Central Library. Although all systems are functional and generally operating to maintain space temperature, systems can be better optimized through a commissioning process. Specifically, retro‐commissioning (RCx) is a form of commissioning. Commissioning (Cx) is the process of ensuring that systems are designed, installed, functionally tested, and capable of being operated and maintained according to the owner’s operational needs. RCx is the same systematic process applied to existing buildings that have never been commissioned to ensure that systems can be operated and maintained according to the owner’s needs. RCx can often resolve problems that occurred during design or construction, or address problems that have developed throughout the building’s life. In all, RCx improves a building’s operations and maintenance (O&M) procedures to enhance overall building performance. Estimated energy savings for the project are noted in the table below.
Table 13 – Summary of Energy Efficiency Measures in the Pipeline – Central Library
Measure Annual Electricity Savings
(kWh) Annual Natural Gas
Savings (Therms) Central Library:
Retro‐Commissioning of HVAC and controls 20,592 988
• Water Pumping System Optimization
The City has tentative plans to implement various water pumping system measures resulting from a Water System Optimization Feasibility Study performed by Lincus, Inc. in early 2012. The study was performed for various water pumping stations including the Dolphin Well Site, Tamura Well Site, and the 16th Street Booster Station. The Dolphin and Tamura Well Sites are identical to each other. Each station contains two (2) deep wells (each with a 400hp pumping unit) and two (2) shallow wells (each with a 250hp pumping unit). The pumps have a soft starter installed on them for start‐up and shut down. The pumping units cycle on and off based on the levels at the 16th Street reservoir. This measure proposes
Section 4 City of Newport Beach Action Steps
City of Newport Beach ‐ Energy Action Plan Page 30
decommissioning the existing valves and orifice plates and installing VFDs on the pump motors for flow control. The 16th Street Booster Station consists of five (5) 350hp turbine booster pumps which are used to pump water to Zones 1 & 2 and Big Canyon Reservoir (BCR). The pumps have a soft starter installed on them for start‐up and shut down. Existing flow control is though a throttling valve installed at the discharge of each of these (5) pumps. This measure proposes decommissioning the existing valves and orifice plates and installing VFDs on the pump motors for flow control. Estimated energy savings for the proposed projects are noted in the table below. Table 14 – Summary of Energy Efficiency Measures in the Pipeline – Water Pumping Systems
Measure Annual Electricity Savings (kWh)
Annual Natural Gas Savings (Therms)
Install Variable Frequency Drives (VFDs) at the Dolphin Well Site to control flow 712,497 0
Install Variable Frequency Drives (VFDs) at the Tamura Well Site to control flow 713,822 0
Install Variable Frequency Drives (VFDs) at the(16th Street) SSWS station to control flow 324,792 0
TOTAL 1,751,111 0
Section 4 City of Newport Beach Action Steps
City of Newport Beach ‐ Energy Action Plan Page 31
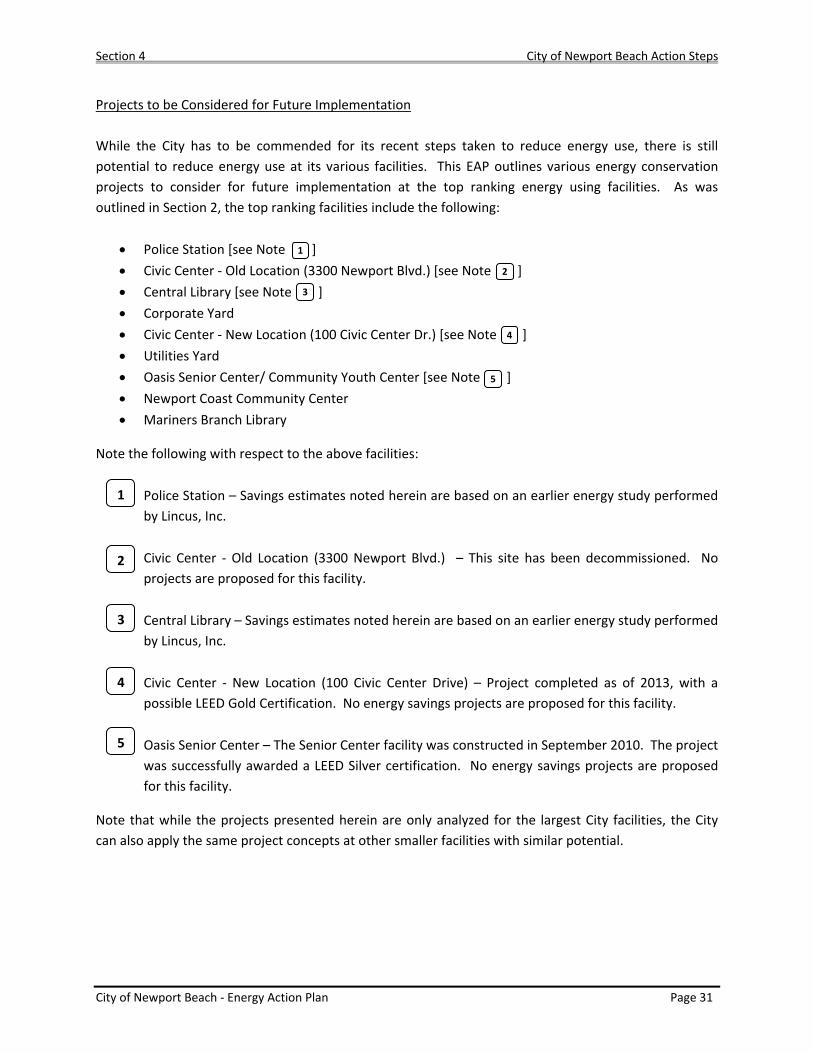
Projects to be Considered for Future Implementation While the City has to be commended for its recent steps taken to reduce energy use, there is still potential to reduce energy use at its various facilities. This EAP outlines various energy conservation projects to consider for future implementation at the top ranking energy using facilities. As was outlined in Section 2, the top ranking facilities include the following:
• Police Station [see Note ] • Civic Center ‐ Old Location (3300 Newport Blvd.) [see Note ] • Central Library [see Note ] • Corporate Yard • Civic Center ‐ New Location (100 Civic Center Dr.) [see Note ] • Utilities Yard • Oasis Senior Center/ Community Youth Center [see Note ] • Newport Coast Community Center • Mariners Branch Library
Note the following with respect to the above facilities:
• Police Station – Savings estimates noted herein are based on an earlier energy study performed by Lincus, Inc.
• Civic Center ‐ Old Location (3300 Newport Blvd.) – This site has been decommissioned. No projects are proposed for this facility.
• Central Library – Savings estimates noted herein are based on an earlier energy study performed by Lincus, Inc.
• Civic Center ‐ New Location (100 Civic Center Drive) – Project completed as of 2013, with a possible LEED Gold Certification. No energy savings projects are proposed for this facility.
• Oasis Senior Center – The Senior Center facility was constructed in September 2010. The project was successfully awarded a LEED Silver certification. No energy savings projects are proposed for this facility.
Note that while the projects presented herein are only analyzed for the largest City facilities, the City can also apply the same project concepts at other smaller facilities with similar potential.
1
2
3
4
5
1
2
3
4
5
Section 4 City of Newport Beach Action Steps
City of Newport Beach ‐ Energy Action Plan Page 32
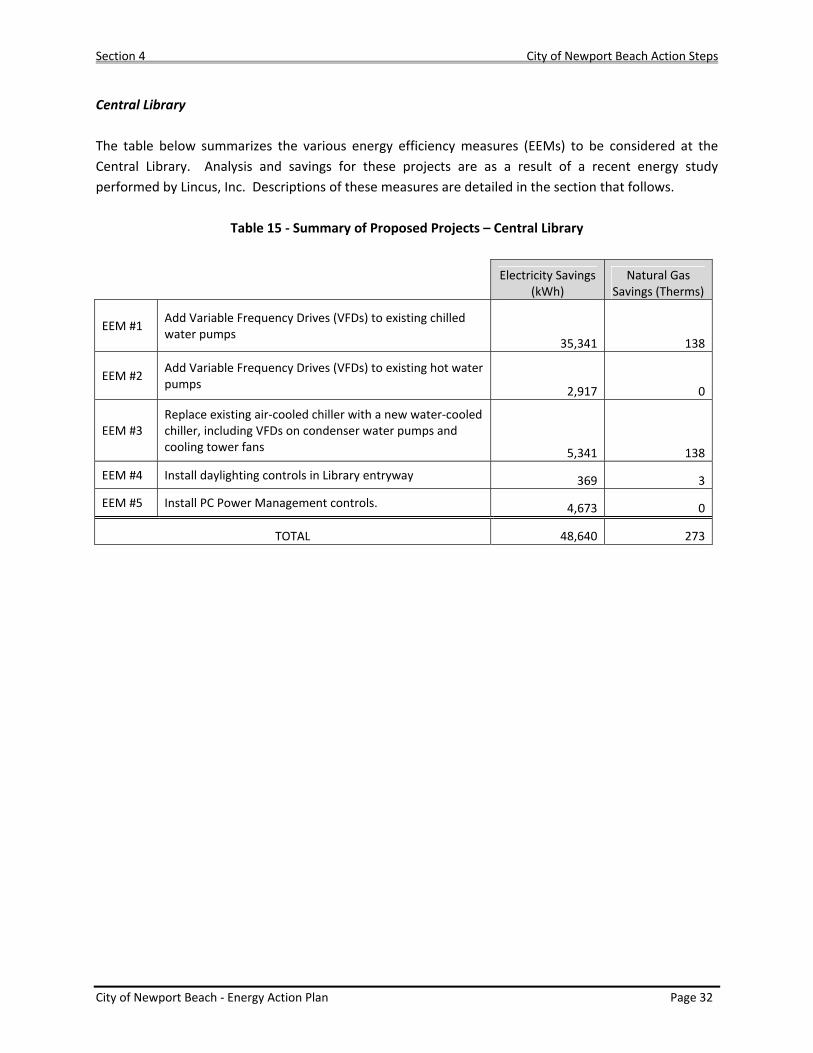
Central Library The table below summarizes the various energy efficiency measures (EEMs) to be considered at the Central Library. Analysis and savings for these projects are as a result of a recent energy study performed by Lincus, Inc. Descriptions of these measures are detailed in the section that follows.
Table 15 ‐ Summary of Proposed Projects – Central Library
Electricity Savings
(kWh) Natural Gas
Savings (Therms)
EEM #1 Add Variable Frequency Drives (VFDs) to existing chilled water pumps
35,341 138
EEM #2 Add Variable Frequency Drives (VFDs) to existing hot water pumps 2,917 0
EEM #3 Replace existing air‐cooled chiller with a new water‐cooled chiller, including VFDs on condenser water pumps and cooling tower fans 5,341 138
EEM #4 Install daylighting controls in Library entryway 369 3
EEM #5 Install PC Power Management controls. 4,673 0
TOTAL 48,640 273
Section 4 City of Newport Beach Action Steps
City of Newport Beach ‐ Energy Action Plan Page 33
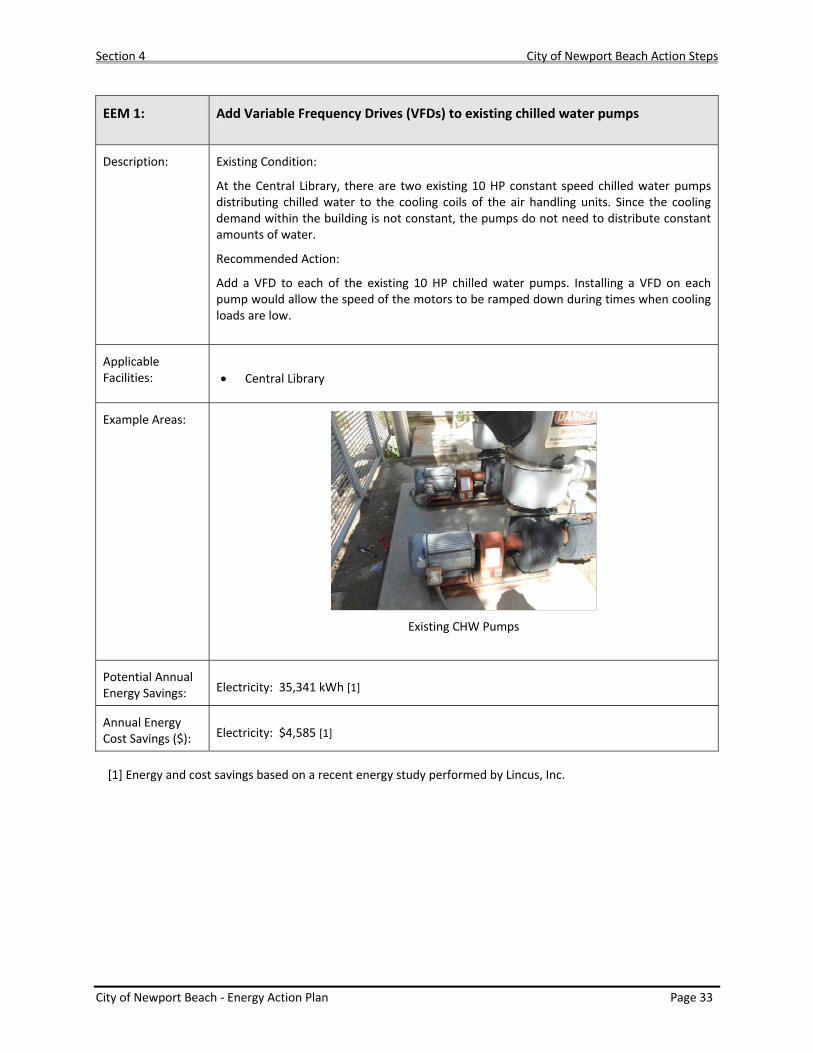
EEM 1: Add Variable Frequency Drives (VFDs) to existing chilled water pumps
Description: Existing Condition:
At the Central Library, there are two existing 10 HP constant speed chilled water pumps distributing chilled water to the cooling coils of the air handling units. Since the cooling demand within the building is not constant, the pumps do not need to distribute constant amounts of water.
Recommended Action:
Add a VFD to each of the existing 10 HP chilled water pumps. Installing a VFD on each pump would allow the speed of the motors to be ramped down during times when cooling loads are low.
Applicable Facilities:
• Central Library
Example Areas:
Existing CHW Pumps
Potential Annual Energy Savings: Electricity: 35,341 kWh [1]
Annual Energy Cost Savings ($): Electricity: $4,585 [1]
[1] Energy and cost savings based on a recent energy study performed by Lincus, Inc.
Section 4 City of Newport Beach Action Steps
City of Newport Beach ‐ Energy Action Plan Page 34
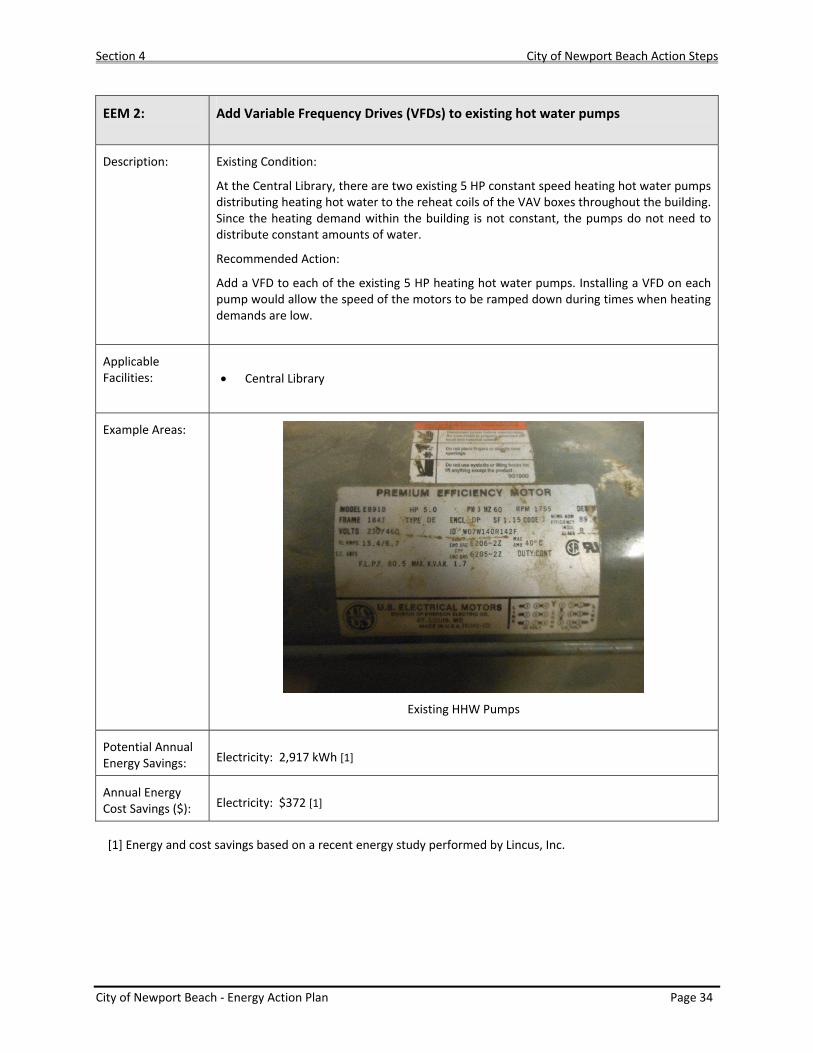
EEM 2: Add Variable Frequency Drives (VFDs) to existing hot water pumps
Description: Existing Condition:
At the Central Library, there are two existing 5 HP constant speed heating hot water pumps distributing heating hot water to the reheat coils of the VAV boxes throughout the building. Since the heating demand within the building is not constant, the pumps do not need to distribute constant amounts of water.
Recommended Action:
Add a VFD to each of the existing 5 HP heating hot water pumps. Installing a VFD on each pump would allow the speed of the motors to be ramped down during times when heating demands are low.
Applicable Facilities:
• Central Library
Example Areas:
Existing HHW Pumps
Potential Annual Energy Savings: Electricity: 2,917 kWh [1]
Annual Energy Cost Savings ($): Electricity: $372 [1]
[1] Energy and cost savings based on a recent energy study performed by Lincus, Inc.
Section 4 City of Newport Beach Action Steps
City of Newport Beach ‐ Energy Action Plan Page 35
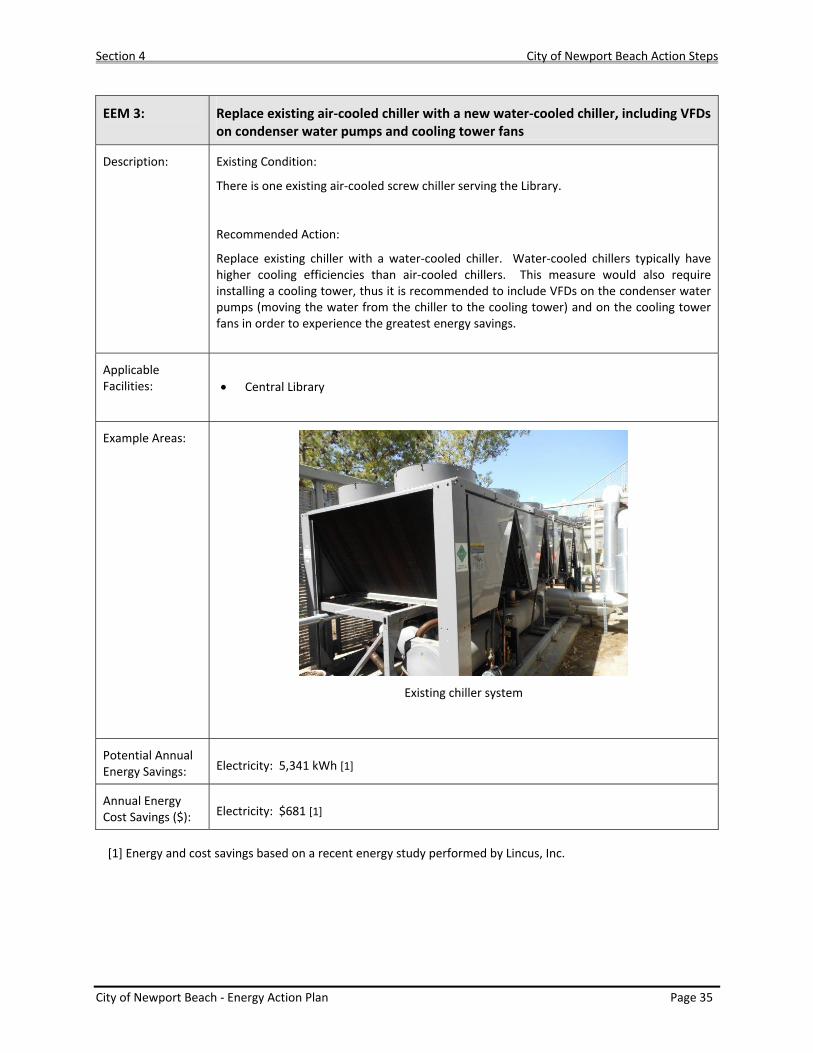
EEM 3: Replace existing air‐cooled chiller with a new water‐cooled chiller, including VFDs on condenser water pumps and cooling tower fans
Description: Existing Condition:
There is one existing air‐cooled screw chiller serving the Library.
Recommended Action:
Replace existing chiller with a water‐cooled chiller. Water‐cooled chillers typically have higher cooling efficiencies than air‐cooled chillers. This measure would also require installing a cooling tower, thus it is recommended to include VFDs on the condenser water pumps (moving the water from the chiller to the cooling tower) and on the cooling tower fans in order to experience the greatest energy savings.
Applicable Facilities:
• Central Library
Example Areas:
Existing chiller system
Potential Annual Energy Savings: Electricity: 5,341 kWh [1]
Annual Energy Cost Savings ($): Electricity: $681 [1]
[1] Energy and cost savings based on a recent energy study performed by Lincus, Inc.
Section 4 City of Newport Beach Action Steps
City of Newport Beach ‐ Energy Action Plan Page 36
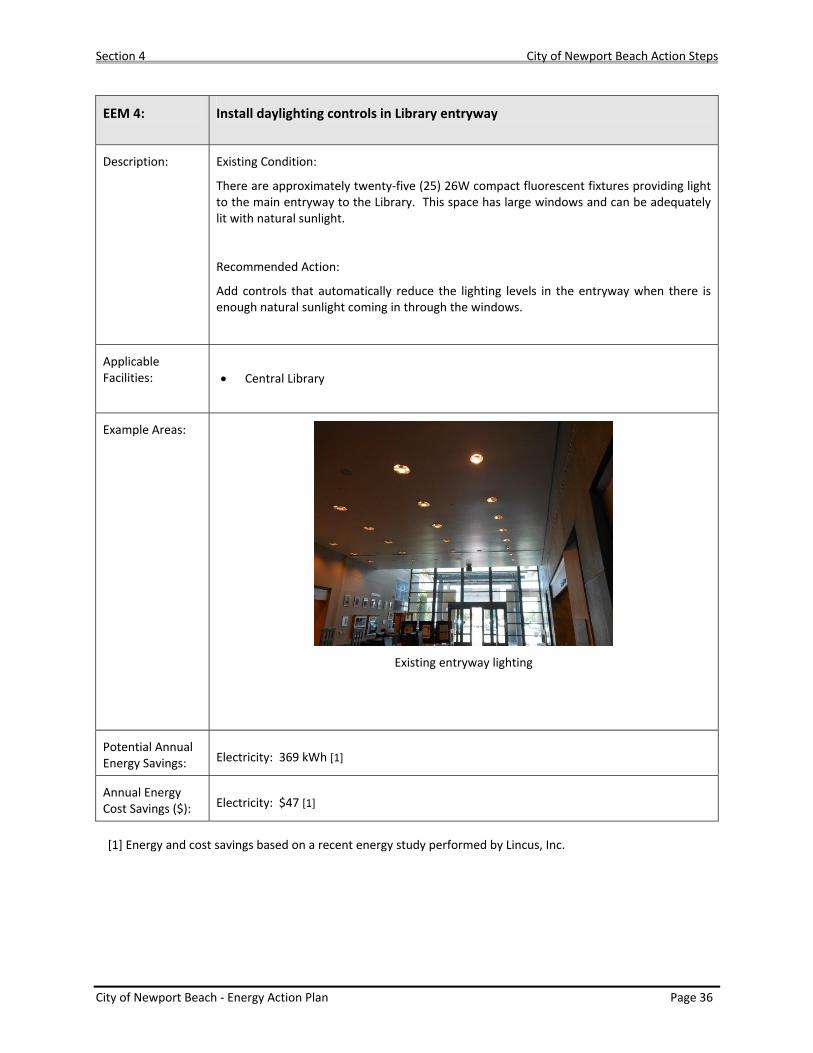
EEM 4: Install daylighting controls in Library entryway
Description: Existing Condition:
There are approximately twenty‐five (25) 26W compact fluorescent fixtures providing light to the main entryway to the Library. This space has large windows and can be adequately lit with natural sunlight.
Recommended Action:
Add controls that automatically reduce the lighting levels in the entryway when there is enough natural sunlight coming in through the windows.
Applicable Facilities:
• Central Library
Example Areas:
Existing entryway lighting
Potential Annual Energy Savings: Electricity: 369 kWh [1]
Annual Energy Cost Savings ($): Electricity: $47 [1]
[1] Energy and cost savings based on a recent energy study performed by Lincus, Inc.
Section 4 City of Newport Beach Action Steps
City of Newport Beach ‐ Energy Action Plan Page 37
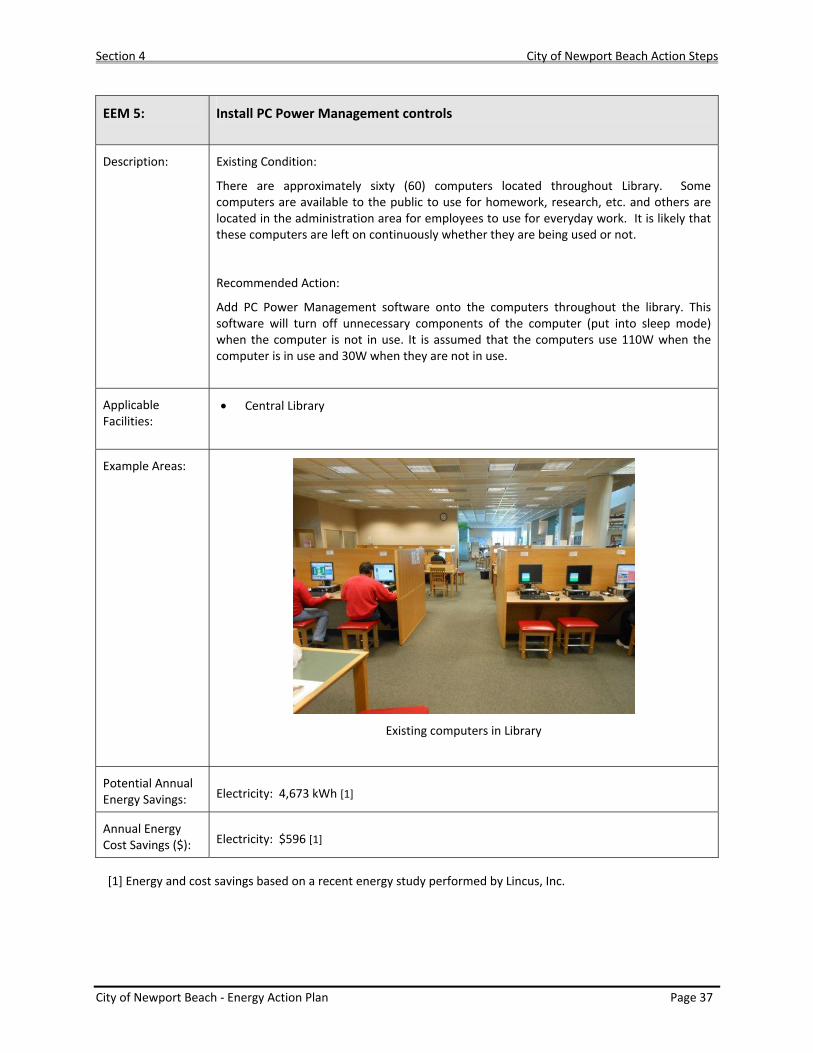
EEM 5: Install PC Power Management controls
Description: Existing Condition:
There are approximately sixty (60) computers located throughout Library. Some computers are available to the public to use for homework, research, etc. and others are located in the administration area for employees to use for everyday work. It is likely that these computers are left on continuously whether they are being used or not.
Recommended Action:
Add PC Power Management software onto the computers throughout the library. This software will turn off unnecessary components of the computer (put into sleep mode) when the computer is not in use. It is assumed that the computers use 110W when the computer is in use and 30W when they are not in use.
Applicable Facilities:
• Central Library
Example Areas:
Existing computers in Library
Potential Annual Energy Savings: Electricity: 4,673 kWh [1]
Annual Energy Cost Savings ($): Electricity: $596 [1]
[1] Energy and cost savings based on a recent energy study performed by Lincus, Inc.
Section 4 City of Newport Beach Action Steps
City of Newport Beach ‐ Energy Action Plan Page 38
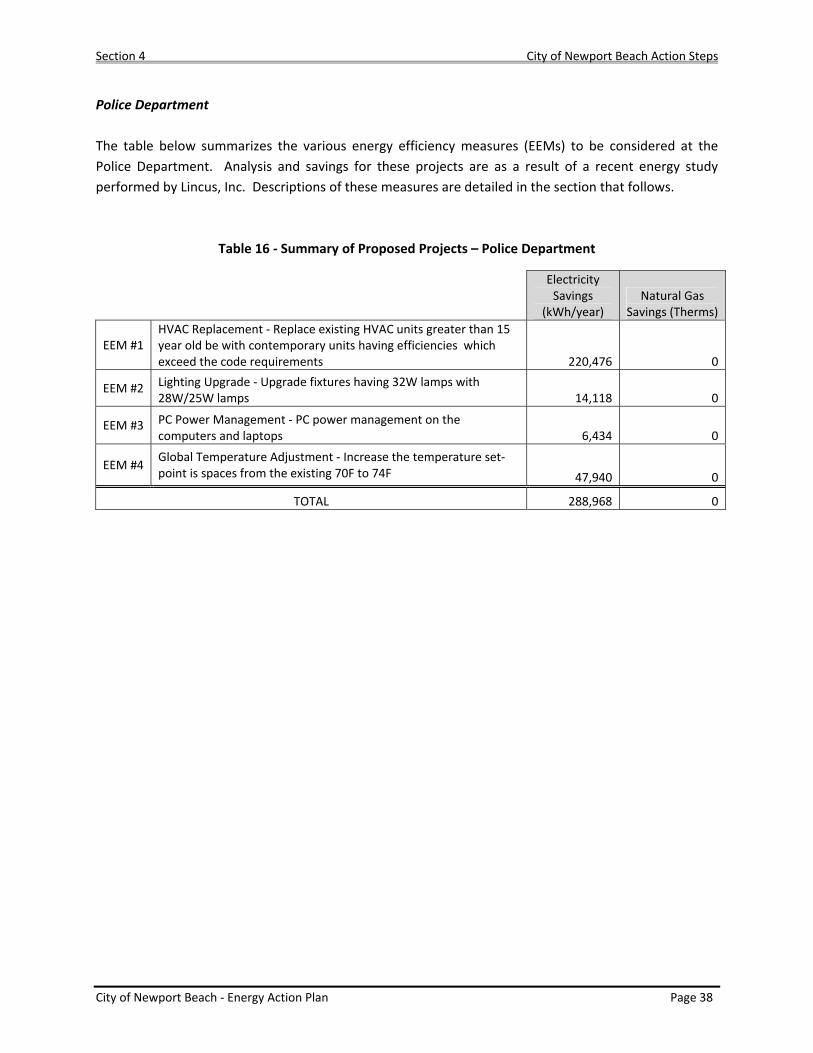
Police Department The table below summarizes the various energy efficiency measures (EEMs) to be considered at the Police Department. Analysis and savings for these projects are as a result of a recent energy study performed by Lincus, Inc. Descriptions of these measures are detailed in the section that follows.
Table 16 ‐ Summary of Proposed Projects – Police Department
Electricity Savings
(kWh/year) Natural Gas
Savings (Therms)
EEM #1 HVAC Replacement ‐ Replace existing HVAC units greater than 15 year old be with contemporary units having efficiencies which exceed the code requirements 220,476 0
EEM #2 Lighting Upgrade ‐ Upgrade fixtures having 32W lamps with 28W/25W lamps 14,118 0
EEM #3 PC Power Management ‐ PC power management on the computers and laptops 6,434 0
EEM #4 Global Temperature Adjustment ‐ Increase the temperature set‐point is spaces from the existing 70F to 74F 47,940 0
TOTAL 288,968 0
Section 4 City of Newport Beach Action Steps
City of Newport Beach ‐ Energy Action Plan Page 39
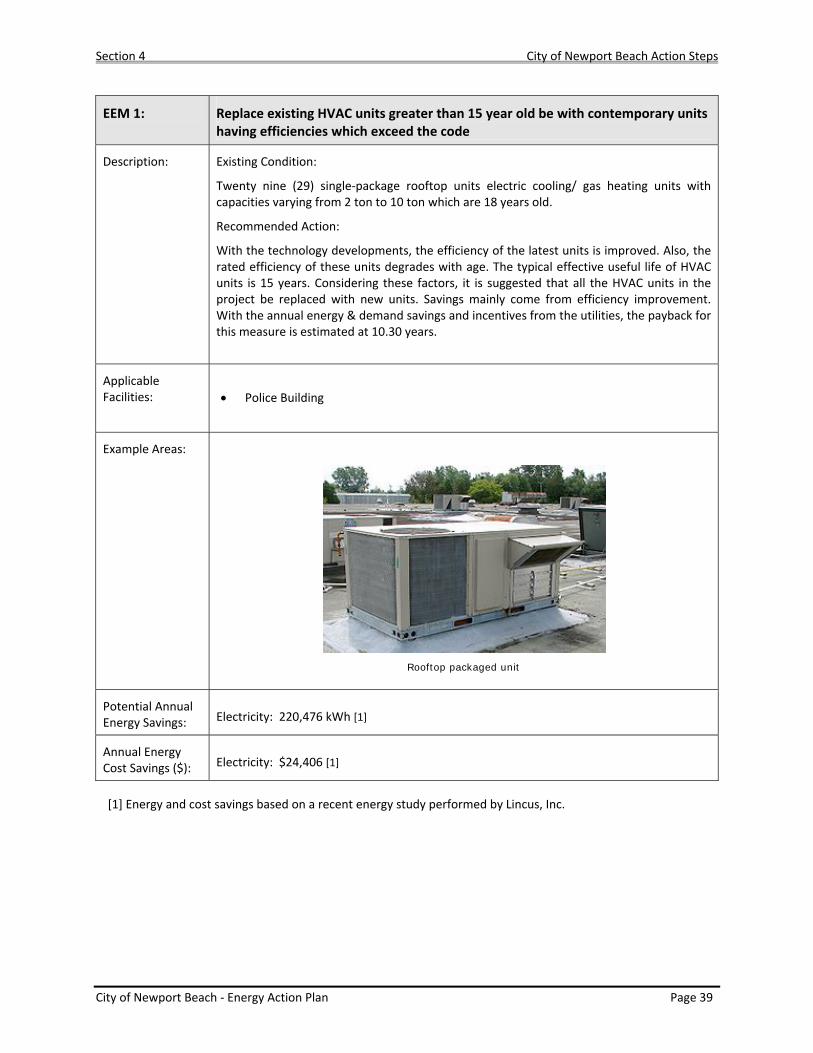
EEM 1: Replace existing HVAC units greater than 15 year old be with contemporary units having efficiencies which exceed the code
Description: Existing Condition:
Twenty nine (29) single‐package rooftop units electric cooling/ gas heating units with capacities varying from 2 ton to 10 ton which are 18 years old.
Recommended Action:
With the technology developments, the efficiency of the latest units is improved. Also, the rated efficiency of these units degrades with age. The typical effective useful life of HVAC units is 15 years. Considering these factors, it is suggested that all the HVAC units in the project be replaced with new units. Savings mainly come from efficiency improvement. With the annual energy & demand savings and incentives from the utilities, the payback for this measure is estimated at 10.30 years.
Applicable Facilities:
• Police Building
Example Areas:
Rooftop packaged unit
Potential Annual Energy Savings: Electricity: 220,476 kWh [1]
Annual Energy Cost Savings ($): Electricity: $24,406 [1]
[1] Energy and cost savings based on a recent energy study performed by Lincus, Inc.
Section 4 City of Newport Beach Action Steps
City of Newport Beach ‐ Energy Action Plan Page 40
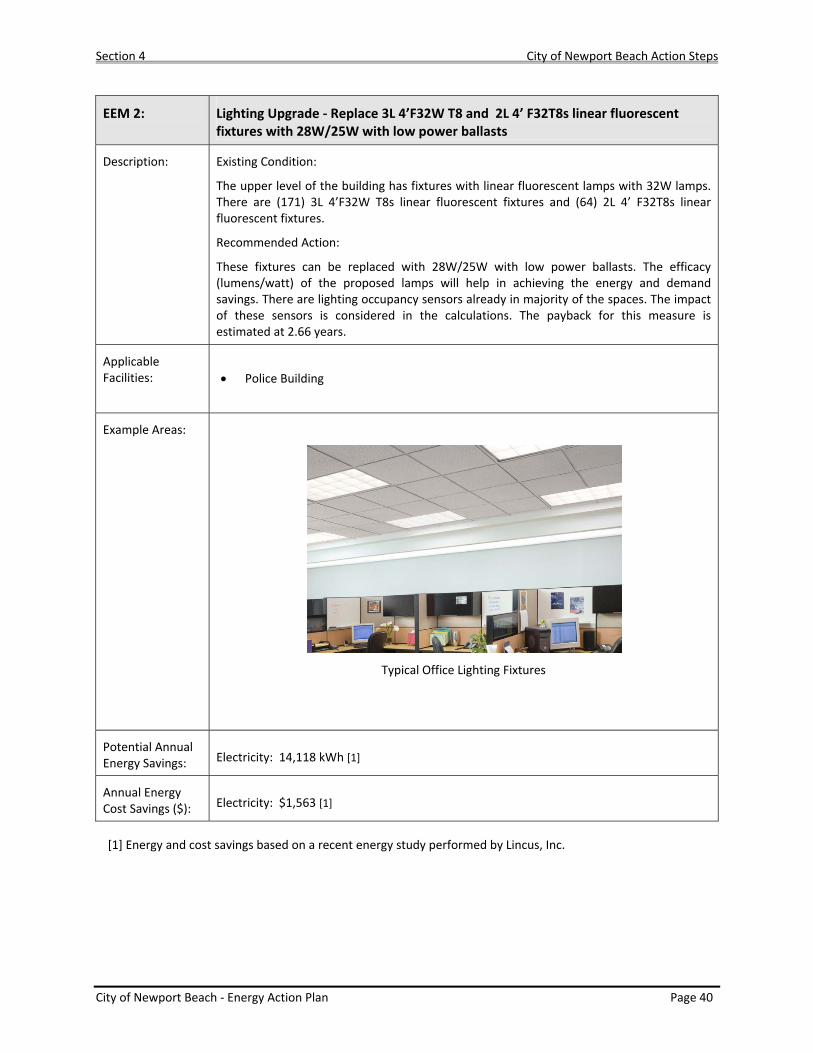
EEM 2: Lighting Upgrade ‐ Replace 3L 4’F32W T8 and 2L 4’ F32T8s linear fluorescent fixtures with 28W/25W with low power ballasts
Description: Existing Condition:
The upper level of the building has fixtures with linear fluorescent lamps with 32W lamps. There are (171) 3L 4’F32W T8s linear fluorescent fixtures and (64) 2L 4’ F32T8s linear fluorescent fixtures.
Recommended Action:
These fixtures can be replaced with 28W/25W with low power ballasts. The efficacy (lumens/watt) of the proposed lamps will help in achieving the energy and demand savings. There are lighting occupancy sensors already in majority of the spaces. The impact of these sensors is considered in the calculations. The payback for this measure is estimated at 2.66 years.
Applicable Facilities:
• Police Building
Example Areas:
Typical Office Lighting Fixtures
Potential Annual Energy Savings: Electricity: 14,118 kWh [1]
Annual Energy Cost Savings ($): Electricity: $1,563 [1]
[1] Energy and cost savings based on a recent energy study performed by Lincus, Inc.
Section 4 City of Newport Beach Action Steps
City of Newport Beach ‐ Energy Action Plan Page 41
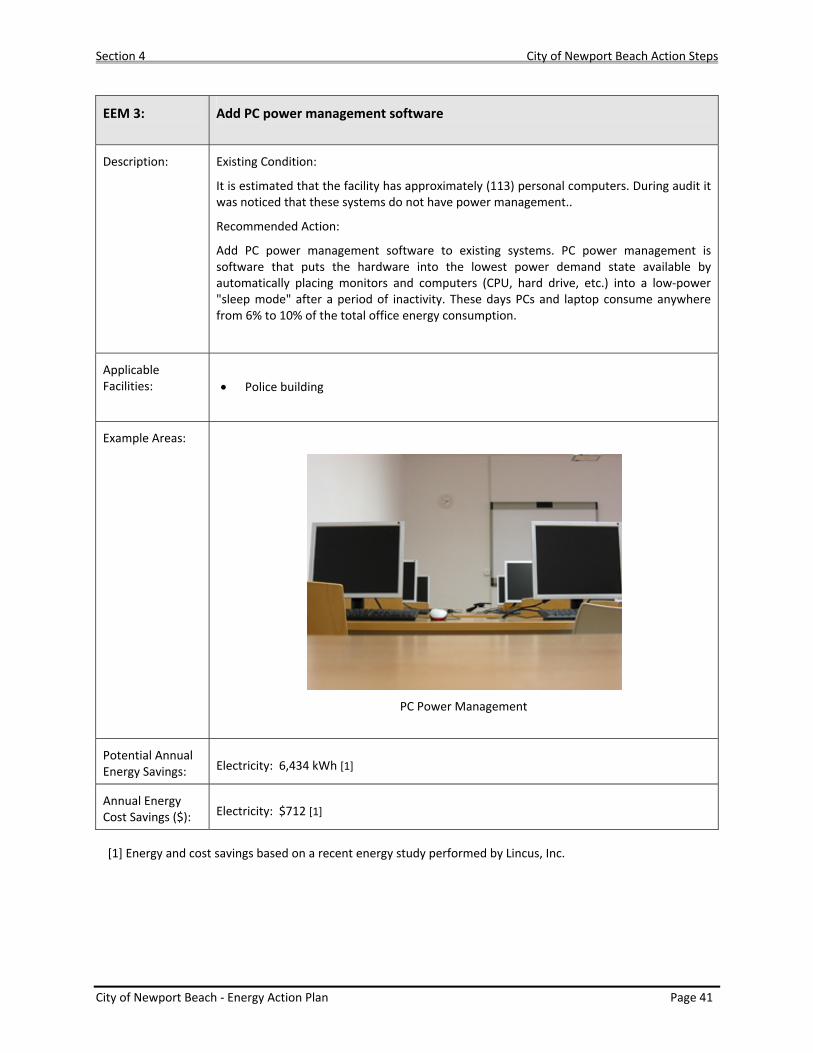
EEM 3: Add PC power management software
Description: Existing Condition:
It is estimated that the facility has approximately (113) personal computers. During audit it was noticed that these systems do not have power management..
Recommended Action:
Add PC power management software to existing systems. PC power management is software that puts the hardware into the lowest power demand state available by automatically placing monitors and computers (CPU, hard drive, etc.) into a low‐power "sleep mode" after a period of inactivity. These days PCs and laptop consume anywhere from 6% to 10% of the total office energy consumption.
Applicable Facilities:
• Police building
Example Areas:
PC Power Management
Potential Annual Energy Savings: Electricity: 6,434 kWh [1]
Annual Energy Cost Savings ($): Electricity: $712 [1]
[1] Energy and cost savings based on a recent energy study performed by Lincus, Inc.
Section 4 City of Newport Beach Action Steps
City of Newport Beach ‐ Energy Action Plan Page 42
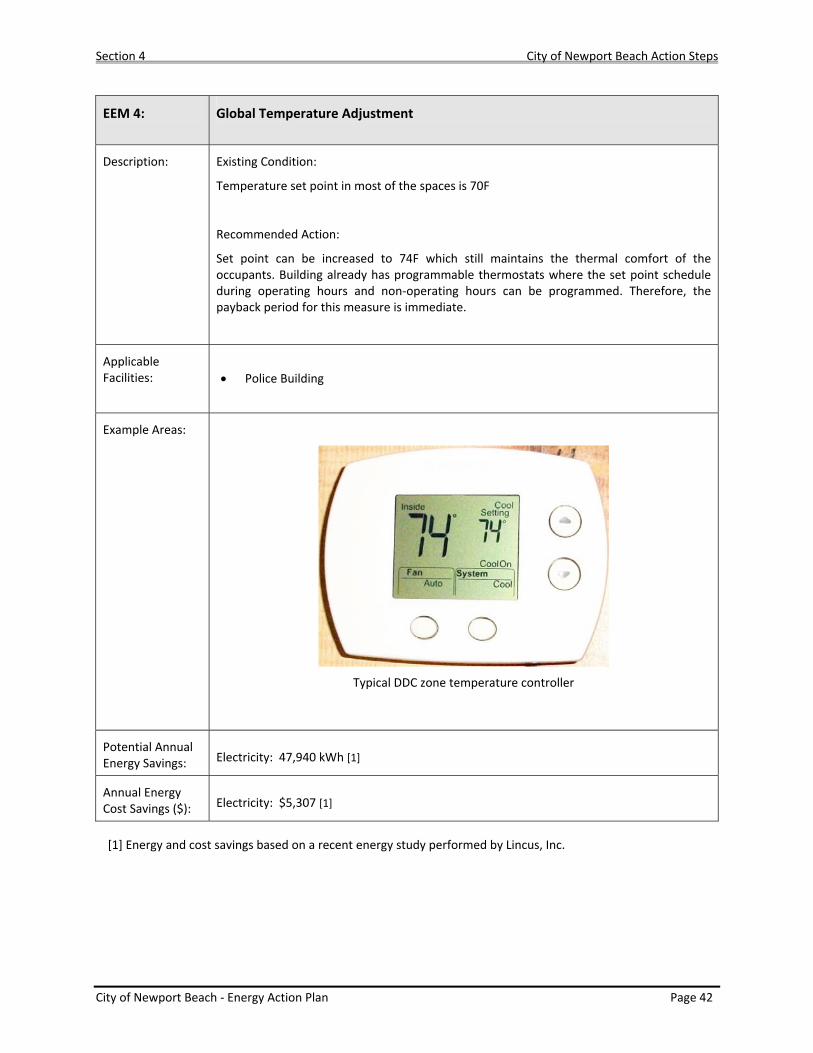
EEM 4: Global Temperature Adjustment
Description: Existing Condition:
Temperature set point in most of the spaces is 70F
Recommended Action:
Set point can be increased to 74F which still maintains the thermal comfort of the occupants. Building already has programmable thermostats where the set point schedule during operating hours and non‐operating hours can be programmed. Therefore, the payback period for this measure is immediate.
Applicable Facilities:
• Police Building
Example Areas:
Typical DDC zone temperature controller
Potential Annual Energy Savings: Electricity: 47,940 kWh [1]
Annual Energy Cost Savings ($): Electricity: $5,307 [1]
[1] Energy and cost savings based on a recent energy study performed by Lincus, Inc.
Section 4 City of Newport Beach Action Steps
City of Newport Beach ‐ Energy Action Plan Page 43
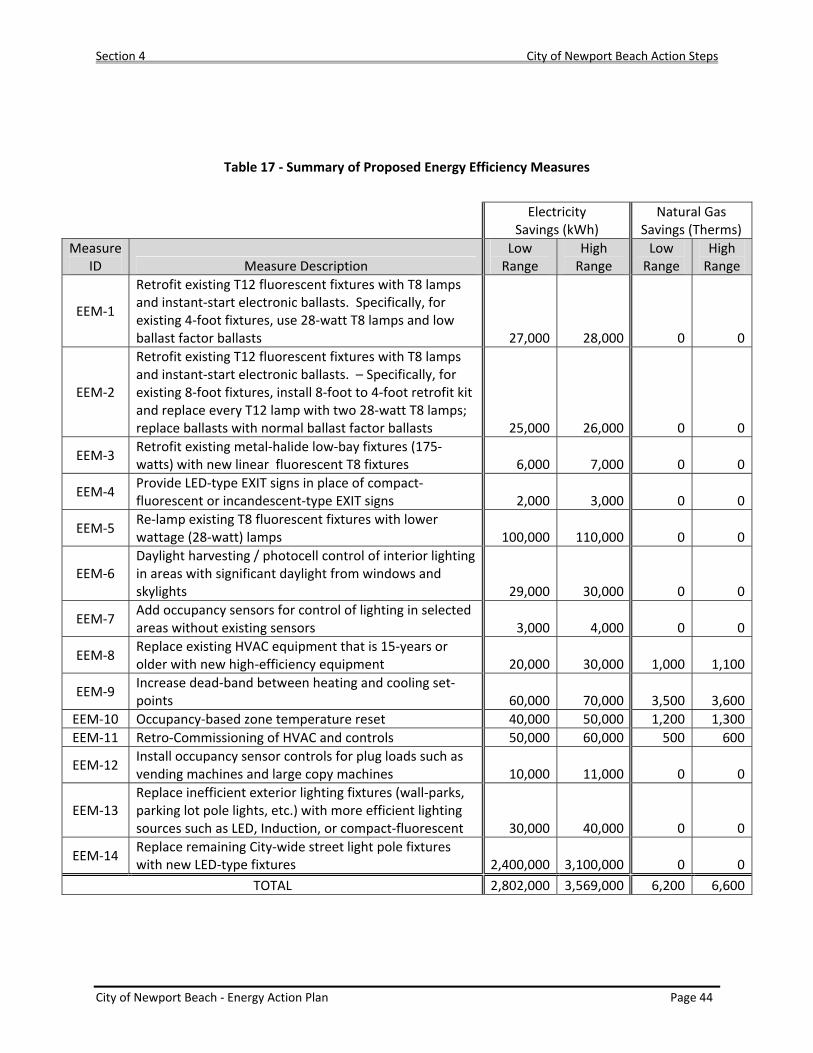
City‐Wide Facilities The table below summarizes the various energy efficiency measures (EEMs) to be considered at various City facilities. Note that the energy savings values presented are based on rule‐of‐thumb estimates only and shall only be used a guideline of the savings potential. Refer to Appendix‐B of this EAP for detailed energy savings calculations. Estimation of energy cost savings are based on a city‐wide average rate calculated for both electricity ($/kWh) and natural gas ($/Therms). See Appendix‐D for rate calculation details.
Section 4 City of Newport Beach Action Steps
City of Newport Beach ‐ Energy Action Plan Page 44
Table 17 ‐ Summary of Proposed Energy Efficiency Measures
Electricity
Savings (kWh) Natural Gas
Savings (Therms) Measure
ID Measure Description Low Range
High Range
Low Range
High Range
EEM‐1
Retrofit existing T12 fluorescent fixtures with T8 lamps and instant‐start electronic ballasts. Specifically, for existing 4‐foot fixtures, use 28‐watt T8 lamps and low ballast factor ballasts 27,000 28,000 0 0
EEM‐2
Retrofit existing T12 fluorescent fixtures with T8 lamps and instant‐start electronic ballasts. – Specifically, for existing 8‐foot fixtures, install 8‐foot to 4‐foot retrofit kit and replace every T12 lamp with two 28‐watt T8 lamps; replace ballasts with normal ballast factor ballasts 25,000 26,000 0 0
EEM‐3 Retrofit existing metal‐halide low‐bay fixtures (175‐watts) with new linear fluorescent T8 fixtures 6,000 7,000 0 0
EEM‐4 Provide LED‐type EXIT signs in place of compact‐fluorescent or incandescent‐type EXIT signs 2,000 3,000 0 0
EEM‐5 Re‐lamp existing T8 fluorescent fixtures with lower wattage (28‐watt) lamps 100,000 110,000 0 0
EEM‐6 Daylight harvesting / photocell control of interior lighting in areas with significant daylight from windows and skylights 29,000 30,000 0 0
EEM‐7 Add occupancy sensors for control of lighting in selected areas without existing sensors 3,000 4,000 0 0
EEM‐8 Replace existing HVAC equipment that is 15‐years or older with new high‐efficiency equipment 20,000 30,000 1,000 1,100
EEM‐9 Increase dead‐band between heating and cooling set‐points 60,000 70,000 3,500 3,600
EEM‐10 Occupancy‐based zone temperature reset 40,000 50,000 1,200 1,300EEM‐11 Retro‐Commissioning of HVAC and controls 50,000 60,000 500 600
EEM‐12 Install occupancy sensor controls for plug loads such as vending machines and large copy machines 10,000 11,000 0 0
EEM‐13 Replace inefficient exterior lighting fixtures (wall‐parks, parking lot pole lights, etc.) with more efficient lighting sources such as LED, Induction, or compact‐fluorescent 30,000 40,000 0 0
EEM‐14 Replace remaining City‐wide street light pole fixtures with new LED‐type fixtures 2,400,000 3,100,000 0 0
TOTAL 2,802,000 3,569,000 6,200 6,600
Section 4 City of Newport Beach Action Steps
City of Newport Beach ‐ Energy Action Plan Page 45
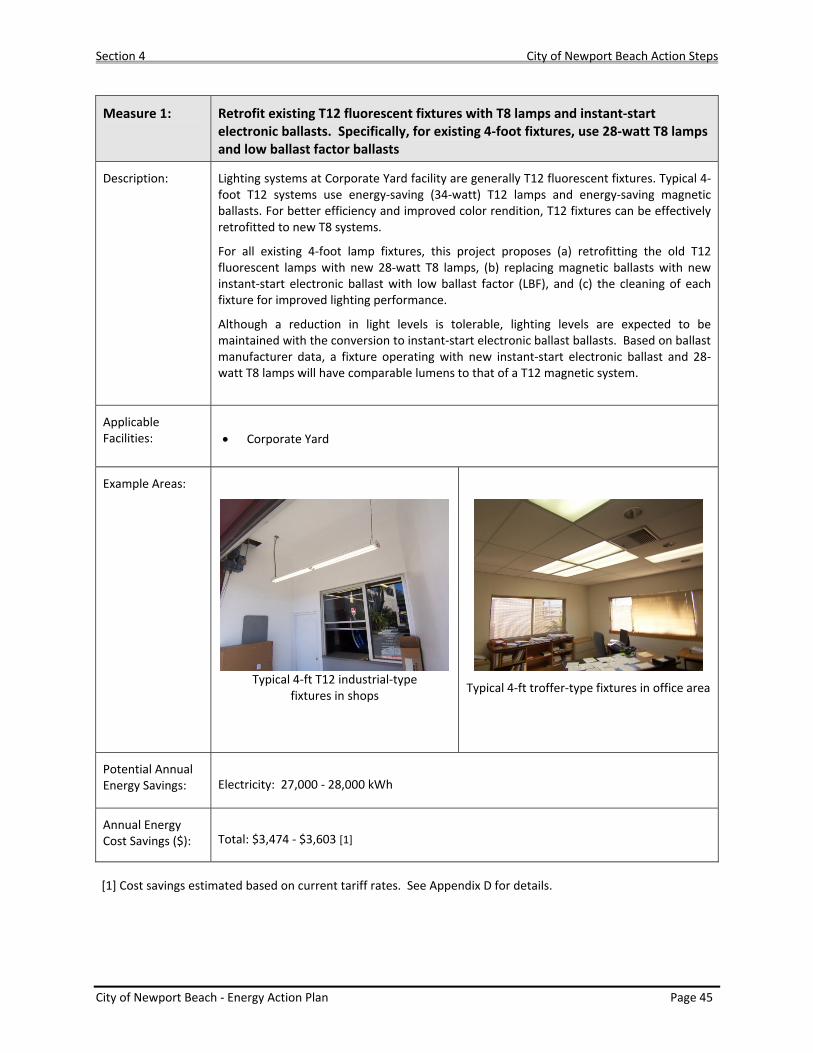
Measure 1: Retrofit existing T12 fluorescent fixtures with T8 lamps and instant‐start electronic ballasts. Specifically, for existing 4‐foot fixtures, use 28‐watt T8 lamps and low ballast factor ballasts
Description: Lighting systems at Corporate Yard facility are generally T12 fluorescent fixtures. Typical 4‐foot T12 systems use energy‐saving (34‐watt) T12 lamps and energy‐saving magnetic ballasts. For better efficiency and improved color rendition, T12 fixtures can be effectively retrofitted to new T8 systems.
For all existing 4‐foot lamp fixtures, this project proposes (a) retrofitting the old T12 fluorescent lamps with new 28‐watt T8 lamps, (b) replacing magnetic ballasts with new instant‐start electronic ballast with low ballast factor (LBF), and (c) the cleaning of each fixture for improved lighting performance.
Although a reduction in light levels is tolerable, lighting levels are expected to be maintained with the conversion to instant‐start electronic ballast ballasts. Based on ballast manufacturer data, a fixture operating with new instant‐start electronic ballast and 28‐watt T8 lamps will have comparable lumens to that of a T12 magnetic system.
Applicable Facilities:
• Corporate Yard
Example Areas:
Typical 4‐ft T12 industrial‐type
fixtures in shops
Typical 4‐ft troffer‐type fixtures in office area
Potential Annual Energy Savings: Electricity: 27,000 ‐ 28,000 kWh
Annual Energy Cost Savings ($):
Total: $3,474 ‐ $3,603 [1]
[1] Cost savings estimated based on current tariff rates. See Appendix D for details.
Section 4 City of Newport Beach Action Steps
City of Newport Beach ‐ Energy Action Plan Page 46
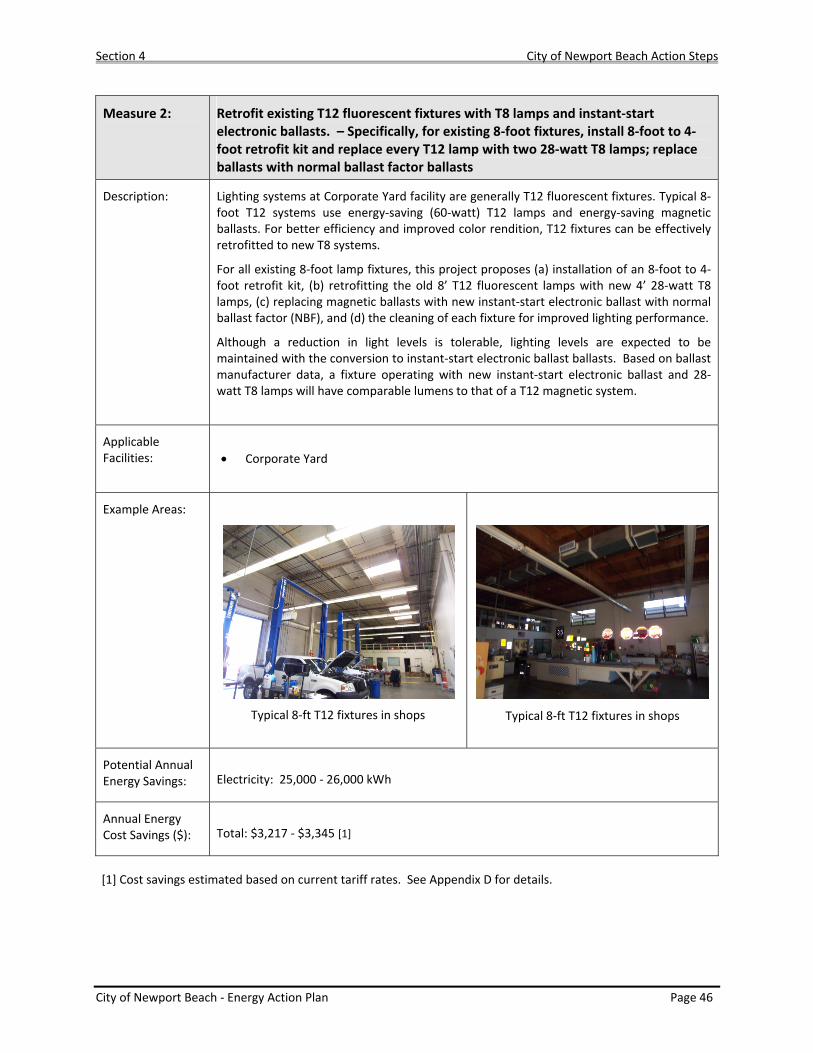
Measure 2: Retrofit existing T12 fluorescent fixtures with T8 lamps and instant‐start electronic ballasts. – Specifically, for existing 8‐foot fixtures, install 8‐foot to 4‐foot retrofit kit and replace every T12 lamp with two 28‐watt T8 lamps; replace ballasts with normal ballast factor ballasts
Description: Lighting systems at Corporate Yard facility are generally T12 fluorescent fixtures. Typical 8‐foot T12 systems use energy‐saving (60‐watt) T12 lamps and energy‐saving magnetic ballasts. For better efficiency and improved color rendition, T12 fixtures can be effectively retrofitted to new T8 systems.
For all existing 8‐foot lamp fixtures, this project proposes (a) installation of an 8‐foot to 4‐foot retrofit kit, (b) retrofitting the old 8’ T12 fluorescent lamps with new 4’ 28‐watt T8 lamps, (c) replacing magnetic ballasts with new instant‐start electronic ballast with normal ballast factor (NBF), and (d) the cleaning of each fixture for improved lighting performance.
Although a reduction in light levels is tolerable, lighting levels are expected to be maintained with the conversion to instant‐start electronic ballast ballasts. Based on ballast manufacturer data, a fixture operating with new instant‐start electronic ballast and 28‐watt T8 lamps will have comparable lumens to that of a T12 magnetic system.
Applicable Facilities:
• Corporate Yard
Example Areas:
Typical 8‐ft T12 fixtures in shops
Typical 8‐ft T12 fixtures in shops
Potential Annual Energy Savings: Electricity: 25,000 ‐ 26,000 kWh
Annual Energy Cost Savings ($):
Total: $3,217 ‐ $3,345 [1]
[1] Cost savings estimated based on current tariff rates. See Appendix D for details.
Section 4 City of Newport Beach Action Steps
City of Newport Beach ‐ Energy Action Plan Page 47
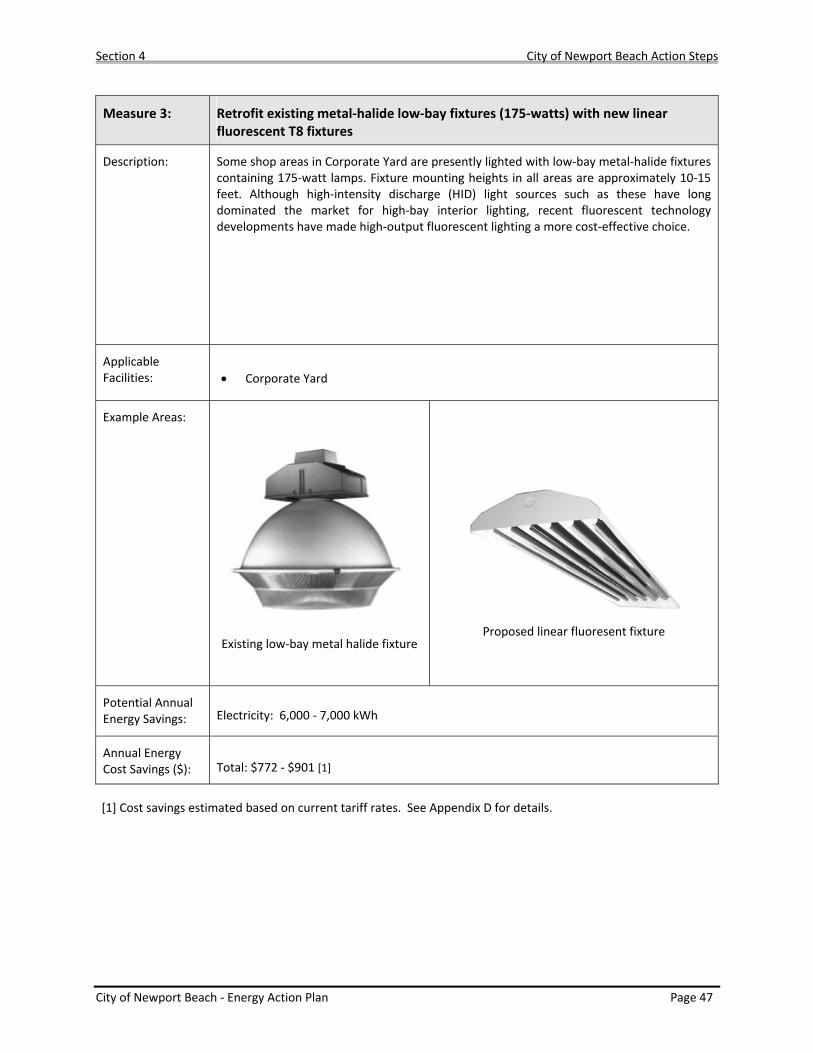
Measure 3: Retrofit existing metal‐halide low‐bay fixtures (175‐watts) with new linear fluorescent T8 fixtures
Description: Some shop areas in Corporate Yard are presently lighted with low‐bay metal‐halide fixtures containing 175‐watt lamps. Fixture mounting heights in all areas are approximately 10‐15 feet. Although high‐intensity discharge (HID) light sources such as these have long dominated the market for high‐bay interior lighting, recent fluorescent technology developments have made high‐output fluorescent lighting a more cost‐effective choice.
Applicable Facilities:
• Corporate Yard
Example Areas:
Existing low‐bay metal halide fixture
Proposed linear fluoresent fixture
Potential Annual Energy Savings: Electricity: 6,000 ‐ 7,000 kWh
Annual Energy Cost Savings ($):
Total: $772 ‐ $901 [1]
[1] Cost savings estimated based on current tariff rates. See Appendix D for details.
Section 4 City of Newport Beach Action Steps
City of Newport Beach ‐ Energy Action Plan Page 48
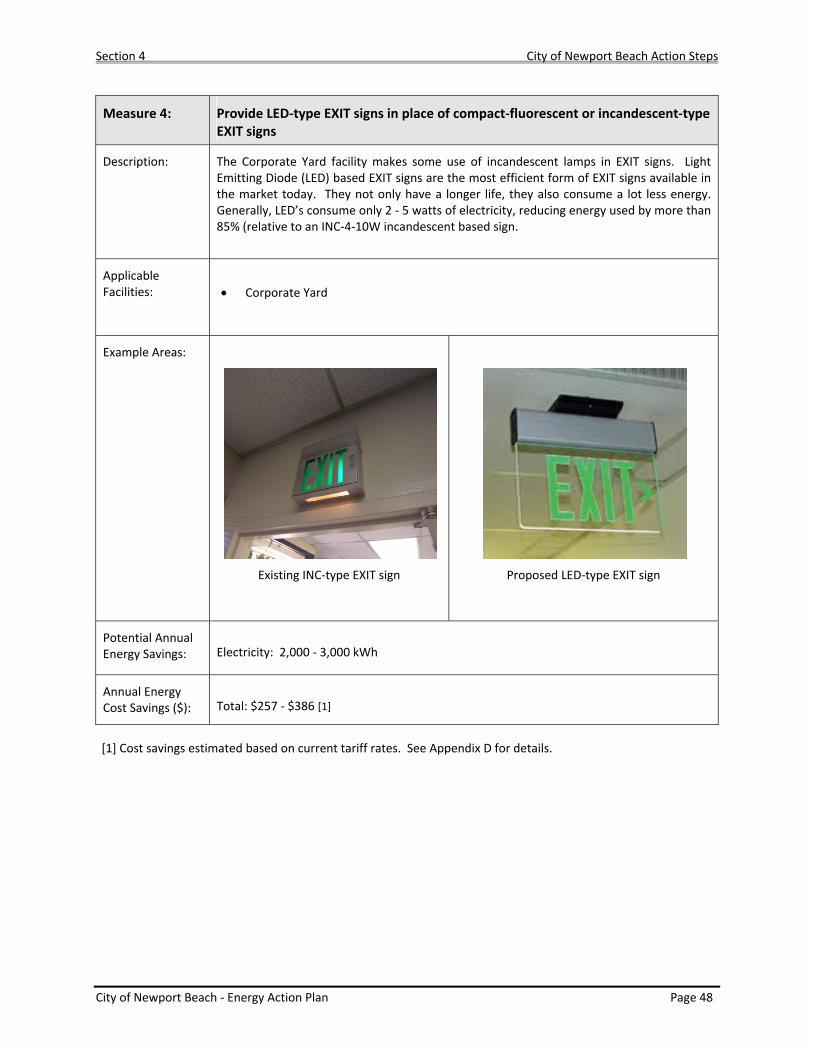
Measure 4: Provide LED‐type EXIT signs in place of compact‐fluorescent or incandescent‐type EXIT signs
Description: The Corporate Yard facility makes some use of incandescent lamps in EXIT signs. Light Emitting Diode (LED) based EXIT signs are the most efficient form of EXIT signs available in the market today. They not only have a longer life, they also consume a lot less energy. Generally, LED’s consume only 2 ‐ 5 watts of electricity, reducing energy used by more than 85% (relative to an INC‐4‐10W incandescent based sign.
Applicable Facilities:
• Corporate Yard
Example Areas:
Existing INC‐type EXIT sign
Proposed LED‐type EXIT sign
Potential Annual Energy Savings: Electricity: 2,000 ‐ 3,000 kWh
Annual Energy Cost Savings ($):
Total: $257 ‐ $386 [1]
[1] Cost savings estimated based on current tariff rates. See Appendix D for details.
Section 4 City of Newport Beach Action Steps
City of Newport Beach ‐ Energy Action Plan Page 49
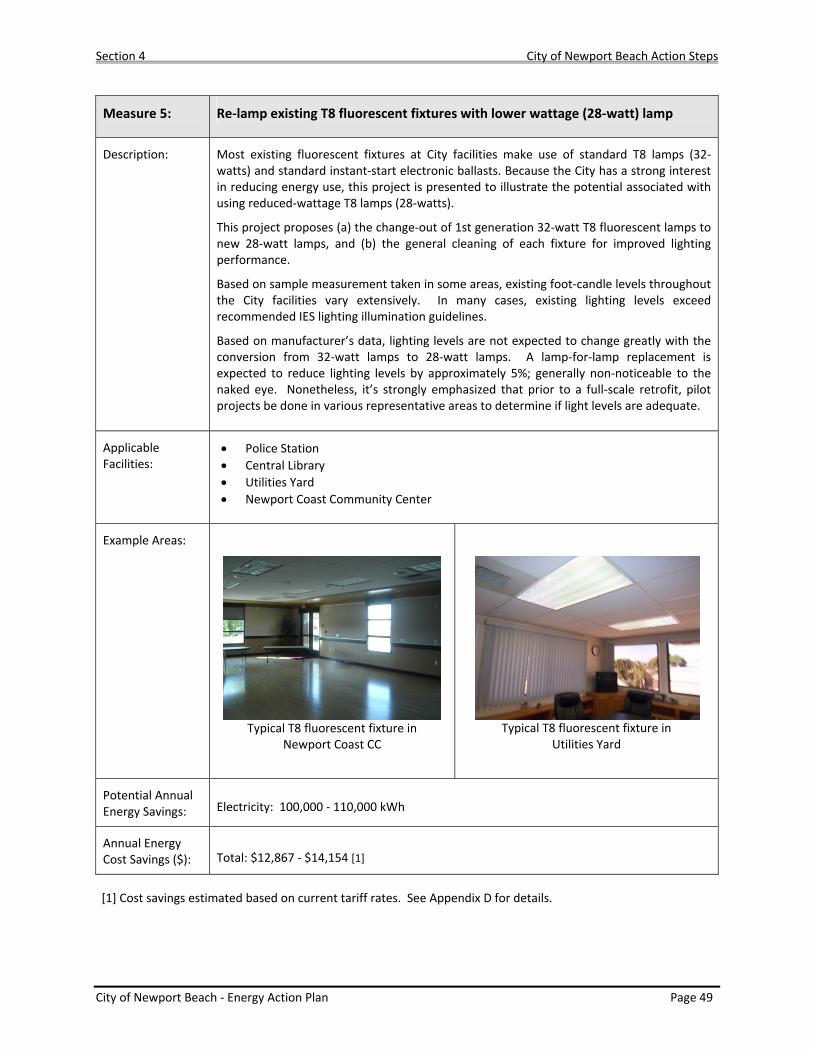
Measure 5: Re‐lamp existing T8 fluorescent fixtures with lower wattage (28‐watt) lamp
Description: Most existing fluorescent fixtures at City facilities make use of standard T8 lamps (32‐watts) and standard instant‐start electronic ballasts. Because the City has a strong interest in reducing energy use, this project is presented to illustrate the potential associated with using reduced‐wattage T8 lamps (28‐watts).
This project proposes (a) the change‐out of 1st generation 32‐watt T8 fluorescent lamps to new 28‐watt lamps, and (b) the general cleaning of each fixture for improved lighting performance.
Based on sample measurement taken in some areas, existing foot‐candle levels throughout the City facilities vary extensively. In many cases, existing lighting levels exceed recommended IES lighting illumination guidelines.
Based on manufacturer’s data, lighting levels are not expected to change greatly with the conversion from 32‐watt lamps to 28‐watt lamps. A lamp‐for‐lamp replacement is expected to reduce lighting levels by approximately 5%; generally non‐noticeable to the naked eye. Nonetheless, it’s strongly emphasized that prior to a full‐scale retrofit, pilot projects be done in various representative areas to determine if light levels are adequate.
Applicable Facilities:
• Police Station • Central Library • Utilities Yard • Newport Coast Community Center
Example Areas:
Typical T8 fluorescent fixture in
Newport Coast CC
Typical T8 fluorescent fixture in
Utilities Yard
Potential Annual Energy Savings: Electricity: 100,000 ‐ 110,000 kWh
Annual Energy Cost Savings ($):
Total: $12,867 ‐ $14,154 [1]
[1] Cost savings estimated based on current tariff rates. See Appendix D for details.
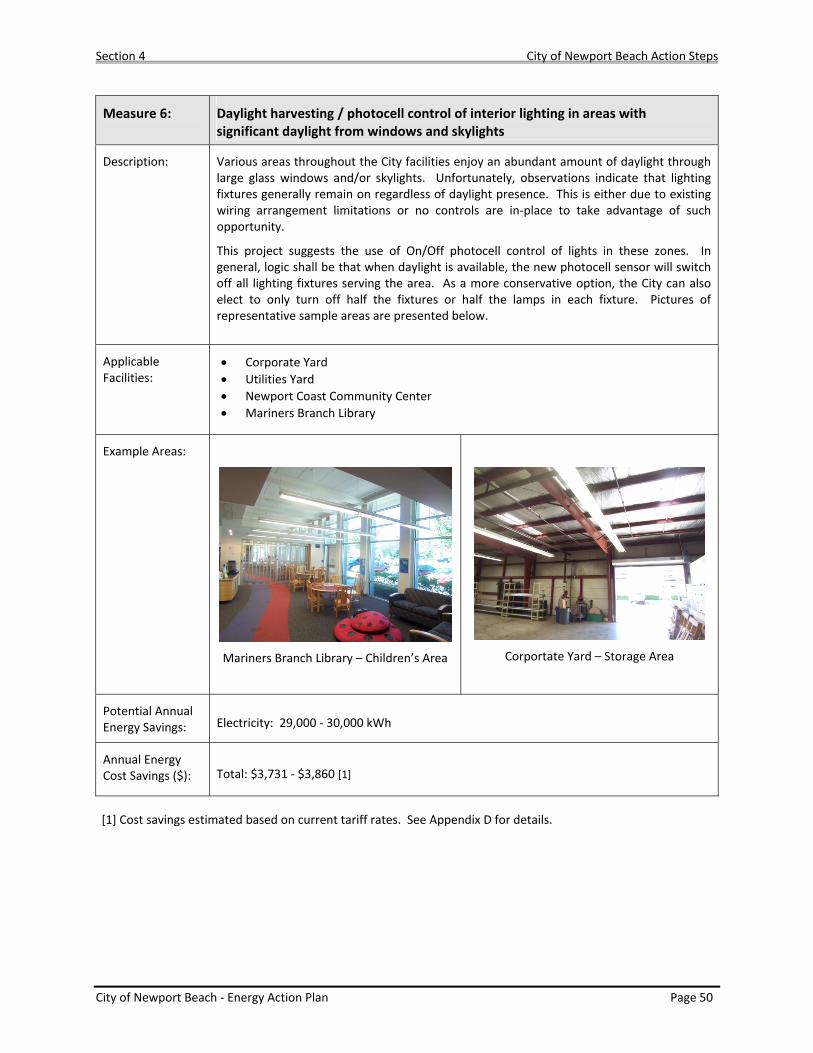
Section 4 City of Newport Beach Action Steps
City of Newport Beach ‐ Energy Action Plan Page 50
Measure 6: Daylight harvesting / photocell control of interior lighting in areas with significant daylight from windows and skylights
Description: Various areas throughout the City facilities enjoy an abundant amount of daylight through large glass windows and/or skylights. Unfortunately, observations indicate that lighting fixtures generally remain on regardless of daylight presence. This is either due to existing wiring arrangement limitations or no controls are in‐place to take advantage of such opportunity.
This project suggests the use of On/Off photocell control of lights in these zones. In general, logic shall be that when daylight is available, the new photocell sensor will switch off all lighting fixtures serving the area. As a more conservative option, the City can also elect to only turn off half the fixtures or half the lamps in each fixture. Pictures of representative sample areas are presented below.
Applicable Facilities:
• Corporate Yard • Utilities Yard • Newport Coast Community Center • Mariners Branch Library
Example Areas:
Mariners Branch Library – Children’s Area
Corportate Yard – Storage Area
Potential Annual Energy Savings: Electricity: 29,000 ‐ 30,000 kWh
Annual Energy Cost Savings ($):
Total: $3,731 ‐ $3,860 [1]
[1] Cost savings estimated based on current tariff rates. See Appendix D for details.
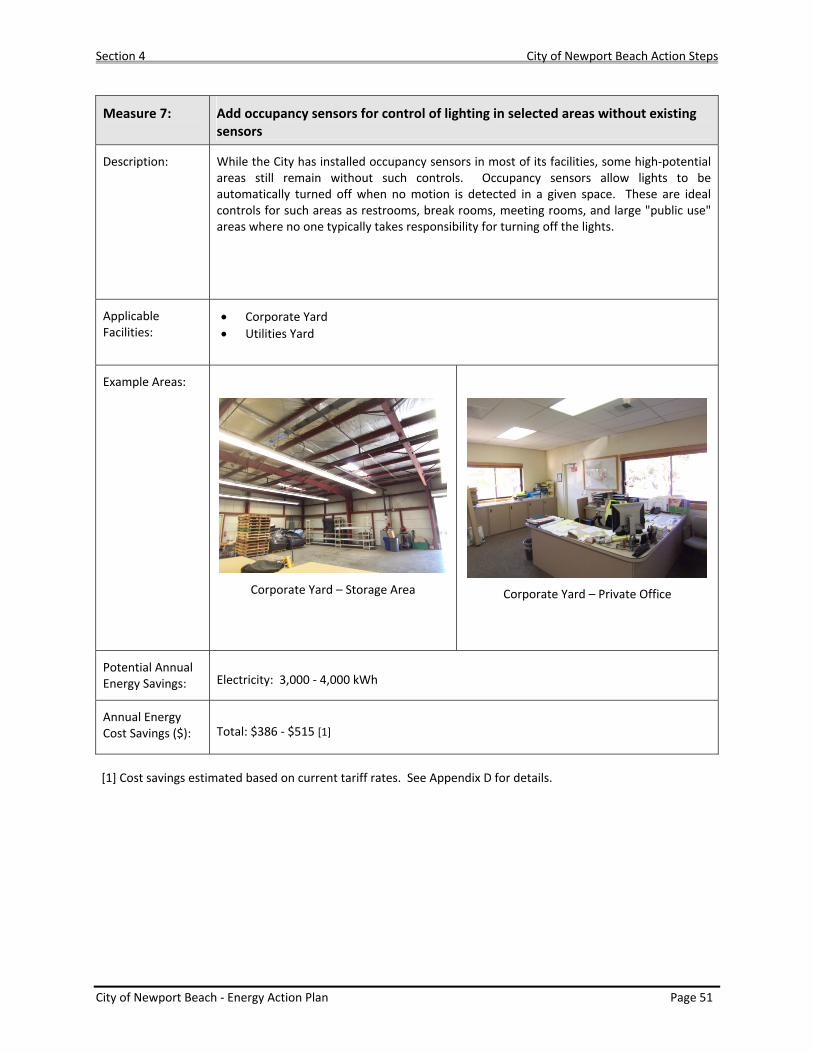
Section 4 City of Newport Beach Action Steps
City of Newport Beach ‐ Energy Action Plan Page 51
Measure 7: Add occupancy sensors for control of lighting in selected areas without existing sensors
Description: While the City has installed occupancy sensors in most of its facilities, some high‐potential areas still remain without such controls. Occupancy sensors allow lights to be automatically turned off when no motion is detected in a given space. These are ideal controls for such areas as restrooms, break rooms, meeting rooms, and large "public use" areas where no one typically takes responsibility for turning off the lights.
Applicable Facilities:
• Corporate Yard • Utilities Yard
Example Areas:
Corporate Yard – Storage Area
Corporate Yard – Private Office
Potential Annual Energy Savings: Electricity: 3,000 ‐ 4,000 kWh
Annual Energy Cost Savings ($):
Total: $386 ‐ $515 [1]
[1] Cost savings estimated based on current tariff rates. See Appendix D for details.
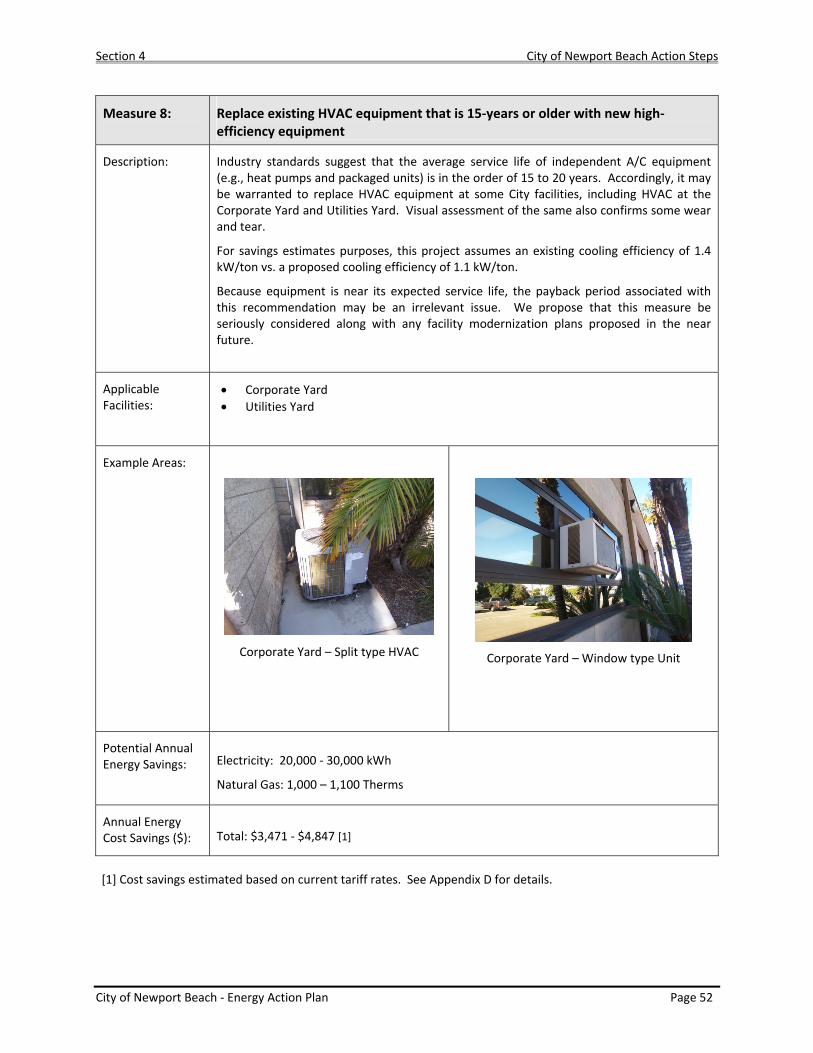
Section 4 City of Newport Beach Action Steps
City of Newport Beach ‐ Energy Action Plan Page 52
Measure 8: Replace existing HVAC equipment that is 15‐years or older with new high‐efficiency equipment
Description: Industry standards suggest that the average service life of independent A/C equipment (e.g., heat pumps and packaged units) is in the order of 15 to 20 years. Accordingly, it may be warranted to replace HVAC equipment at some City facilities, including HVAC at the Corporate Yard and Utilities Yard. Visual assessment of the same also confirms some wear and tear.
For savings estimates purposes, this project assumes an existing cooling efficiency of 1.4 kW/ton vs. a proposed cooling efficiency of 1.1 kW/ton.
Because equipment is near its expected service life, the payback period associated with this recommendation may be an irrelevant issue. We propose that this measure be seriously considered along with any facility modernization plans proposed in the near future.
Applicable Facilities:
• Corporate Yard • Utilities Yard
Example Areas:
Corporate Yard – Split type HVAC
Corporate Yard – Window type Unit
Potential Annual Energy Savings: Electricity: 20,000 ‐ 30,000 kWh
Natural Gas: 1,000 – 1,100 Therms
Annual Energy Cost Savings ($):
Total: $3,471 ‐ $4,847 [1]
[1] Cost savings estimated based on current tariff rates. See Appendix D for details.
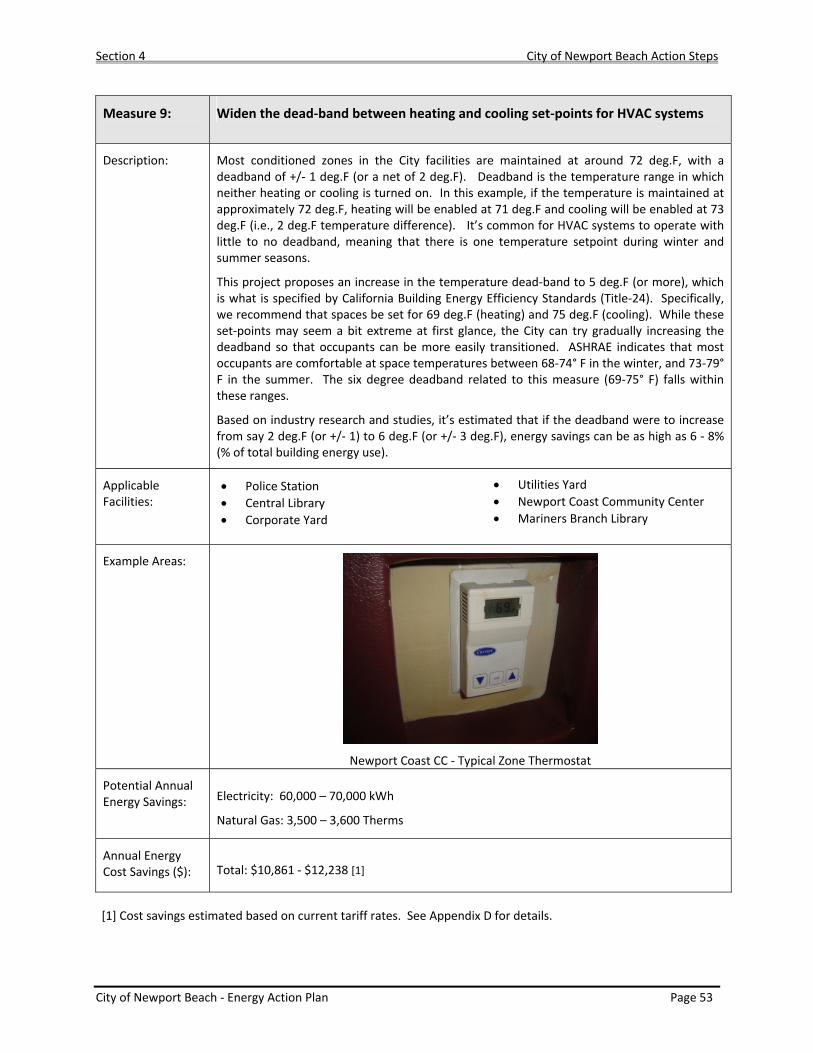
Section 4 City of Newport Beach Action Steps
City of Newport Beach ‐ Energy Action Plan Page 53
Measure 9: Widen the dead‐band between heating and cooling set‐points for HVAC systems
Description: Most conditioned zones in the City facilities are maintained at around 72 deg.F, with a deadband of +/‐ 1 deg.F (or a net of 2 deg.F). Deadband is the temperature range in which neither heating or cooling is turned on. In this example, if the temperature is maintained at approximately 72 deg.F, heating will be enabled at 71 deg.F and cooling will be enabled at 73 deg.F (i.e., 2 deg.F temperature difference). It’s common for HVAC systems to operate with little to no deadband, meaning that there is one temperature setpoint during winter and summer seasons.
This project proposes an increase in the temperature dead‐band to 5 deg.F (or more), which is what is specified by California Building Energy Efficiency Standards (Title‐24). Specifically, we recommend that spaces be set for 69 deg.F (heating) and 75 deg.F (cooling). While these set‐points may seem a bit extreme at first glance, the City can try gradually increasing the deadband so that occupants can be more easily transitioned. ASHRAE indicates that most occupants are comfortable at space temperatures between 68‐74° F in the winter, and 73‐79° F in the summer. The six degree deadband related to this measure (69‐75° F) falls within these ranges.
Based on industry research and studies, it’s estimated that if the deadband were to increase from say 2 deg.F (or +/‐ 1) to 6 deg.F (or +/‐ 3 deg.F), energy savings can be as high as 6 ‐ 8% (% of total building energy use).
Applicable Facilities:
• Police Station • Central Library • Corporate Yard
• Utilities Yard • Newport Coast Community Center • Mariners Branch Library
Example Areas:
Newport Coast CC ‐ Typical Zone Thermostat
Potential Annual Energy Savings: Electricity: 60,000 – 70,000 kWh
Natural Gas: 3,500 – 3,600 Therms
Annual Energy Cost Savings ($):
Total: $10,861 ‐ $12,238 [1]
[1] Cost savings estimated based on current tariff rates. See Appendix D for details.
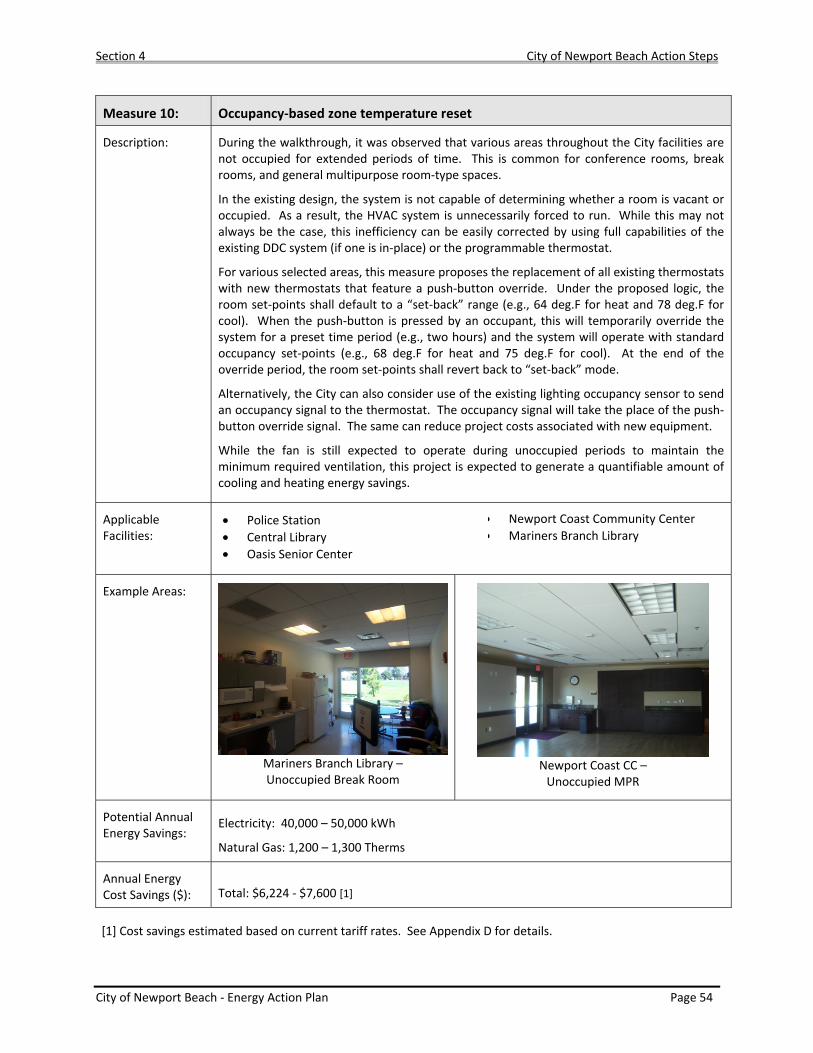
Section 4 City of Newport Beach Action Steps
City of Newport Beach ‐ Energy Action Plan Page 54
Measure 10: Occupancy‐based zone temperature reset
Description: During the walkthrough, it was observed that various areas throughout the City facilities are not occupied for extended periods of time. This is common for conference rooms, break rooms, and general multipurpose room‐type spaces.
In the existing design, the system is not capable of determining whether a room is vacant or occupied. As a result, the HVAC system is unnecessarily forced to run. While this may not always be the case, this inefficiency can be easily corrected by using full capabilities of the existing DDC system (if one is in‐place) or the programmable thermostat.
For various selected areas, this measure proposes the replacement of all existing thermostats with new thermostats that feature a push‐button override. Under the proposed logic, the room set‐points shall default to a “set‐back” range (e.g., 64 deg.F for heat and 78 deg.F for cool). When the push‐button is pressed by an occupant, this will temporarily override the system for a preset time period (e.g., two hours) and the system will operate with standard occupancy set‐points (e.g., 68 deg.F for heat and 75 deg.F for cool). At the end of the override period, the room set‐points shall revert back to “set‐back” mode.
Alternatively, the City can also consider use of the existing lighting occupancy sensor to send an occupancy signal to the thermostat. The occupancy signal will take the place of the push‐button override signal. The same can reduce project costs associated with new equipment.
While the fan is still expected to operate during unoccupied periods to maintain the minimum required ventilation, this project is expected to generate a quantifiable amount of cooling and heating energy savings.
Applicable Facilities:
• Police Station • Central Library • Oasis Senior Center
• Newport Coast Community Center • Mariners Branch Library
Example Areas:
Mariners Branch Library – Unoccupied Break Room
Newport Coast CC – Unoccupied MPR
Potential Annual Energy Savings:
Electricity: 40,000 – 50,000 kWh
Natural Gas: 1,200 – 1,300 Therms
Annual Energy Cost Savings ($):
Total: $6,224 ‐ $7,600 [1]
[1] Cost savings estimated based on current tariff rates. See Appendix D for details.
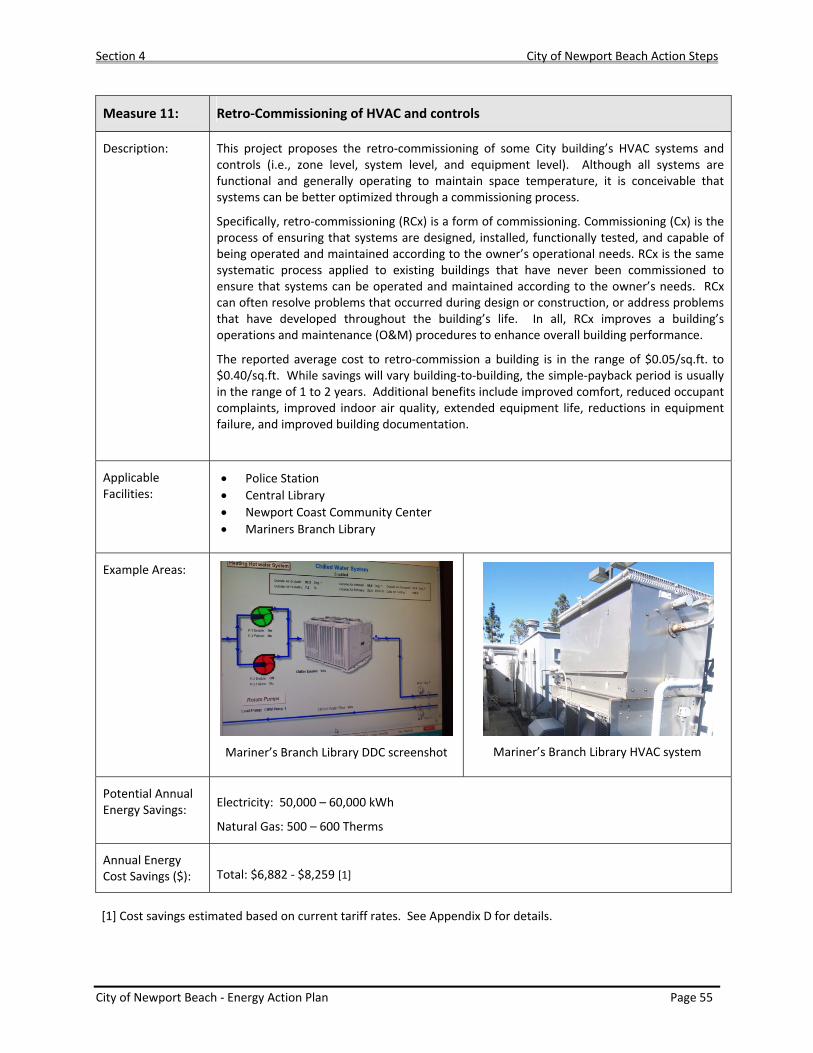
Section 4 City of Newport Beach Action Steps
City of Newport Beach ‐ Energy Action Plan Page 55
Measure 11: Retro‐Commissioning of HVAC and controls
Description: This project proposes the retro‐commissioning of some City building’s HVAC systems and controls (i.e., zone level, system level, and equipment level). Although all systems are functional and generally operating to maintain space temperature, it is conceivable that systems can be better optimized through a commissioning process.
Specifically, retro‐commissioning (RCx) is a form of commissioning. Commissioning (Cx) is the process of ensuring that systems are designed, installed, functionally tested, and capable of being operated and maintained according to the owner’s operational needs. RCx is the same systematic process applied to existing buildings that have never been commissioned to ensure that systems can be operated and maintained according to the owner’s needs. RCx can often resolve problems that occurred during design or construction, or address problems that have developed throughout the building’s life. In all, RCx improves a building’s operations and maintenance (O&M) procedures to enhance overall building performance.
The reported average cost to retro‐commission a building is in the range of $0.05/sq.ft. to $0.40/sq.ft. While savings will vary building‐to‐building, the simple‐payback period is usually in the range of 1 to 2 years. Additional benefits include improved comfort, reduced occupant complaints, improved indoor air quality, extended equipment life, reductions in equipment failure, and improved building documentation.
Applicable Facilities:
• Police Station • Central Library • Newport Coast Community Center • Mariners Branch Library
Example Areas:
Mariner’s Branch Library DDC screenshot
Mariner’s Branch Library HVAC system
Potential Annual Energy Savings: Electricity: 50,000 – 60,000 kWh
Natural Gas: 500 – 600 Therms
Annual Energy Cost Savings ($):
Total: $6,882 ‐ $8,259 [1]
[1] Cost savings estimated based on current tariff rates. See Appendix D for details.
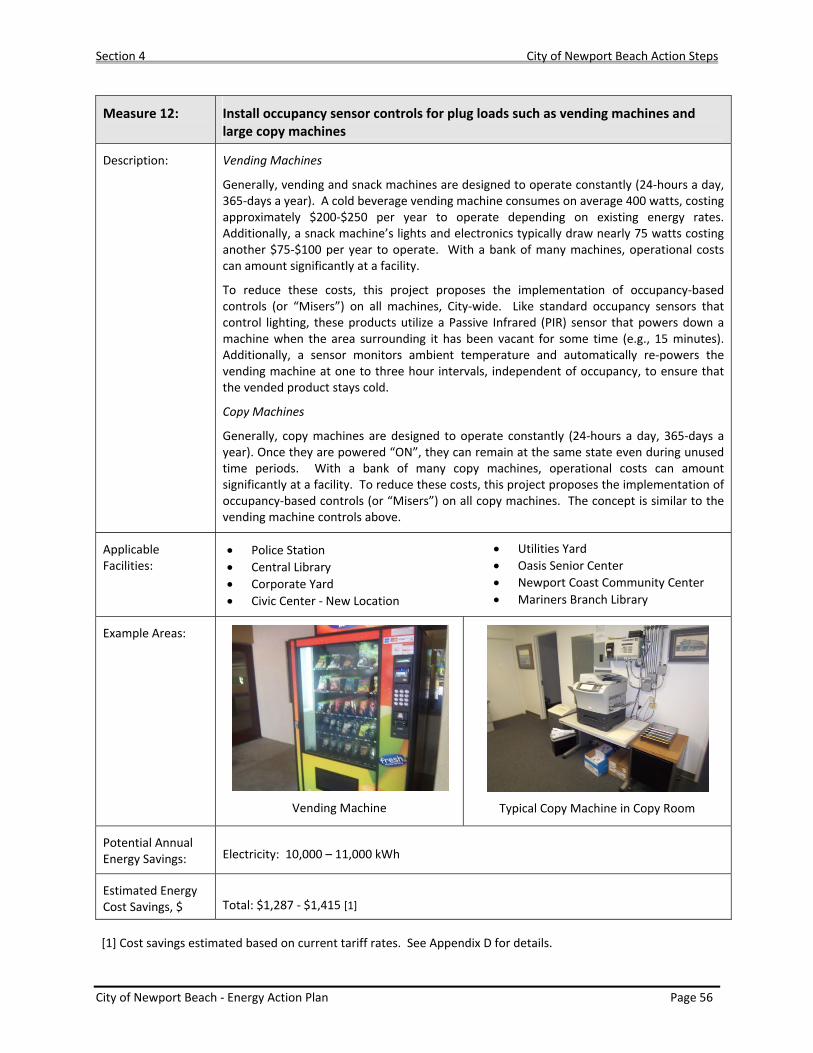
Section 4 City of Newport Beach Action Steps
City of Newport Beach ‐ Energy Action Plan Page 56
Measure 12: Install occupancy sensor controls for plug loads such as vending machines and large copy machines
Description: Vending Machines
Generally, vending and snack machines are designed to operate constantly (24‐hours a day, 365‐days a year). A cold beverage vending machine consumes on average 400 watts, costing approximately $200‐$250 per year to operate depending on existing energy rates. Additionally, a snack machine’s lights and electronics typically draw nearly 75 watts costing another $75‐$100 per year to operate. With a bank of many machines, operational costs can amount significantly at a facility.
To reduce these costs, this project proposes the implementation of occupancy‐based controls (or “Misers”) on all machines, City‐wide. Like standard occupancy sensors that control lighting, these products utilize a Passive Infrared (PIR) sensor that powers down a machine when the area surrounding it has been vacant for some time (e.g., 15 minutes). Additionally, a sensor monitors ambient temperature and automatically re‐powers the vending machine at one to three hour intervals, independent of occupancy, to ensure that the vended product stays cold.
Copy Machines
Generally, copy machines are designed to operate constantly (24‐hours a day, 365‐days a year). Once they are powered “ON”, they can remain at the same state even during unused time periods. With a bank of many copy machines, operational costs can amount significantly at a facility. To reduce these costs, this project proposes the implementation of occupancy‐based controls (or “Misers”) on all copy machines. The concept is similar to the vending machine controls above.
Applicable Facilities:
• Police Station • Central Library • Corporate Yard • Civic Center ‐ New Location
• Utilities Yard • Oasis Senior Center • Newport Coast Community Center • Mariners Branch Library
Example Areas:
Vending Machine
Typical Copy Machine in Copy Room
Potential Annual Energy Savings: Electricity: 10,000 – 11,000 kWh
Estimated Energy Cost Savings, $
Total: $1,287 ‐ $1,415 [1]
[1] Cost savings estimated based on current tariff rates. See Appendix D for details.
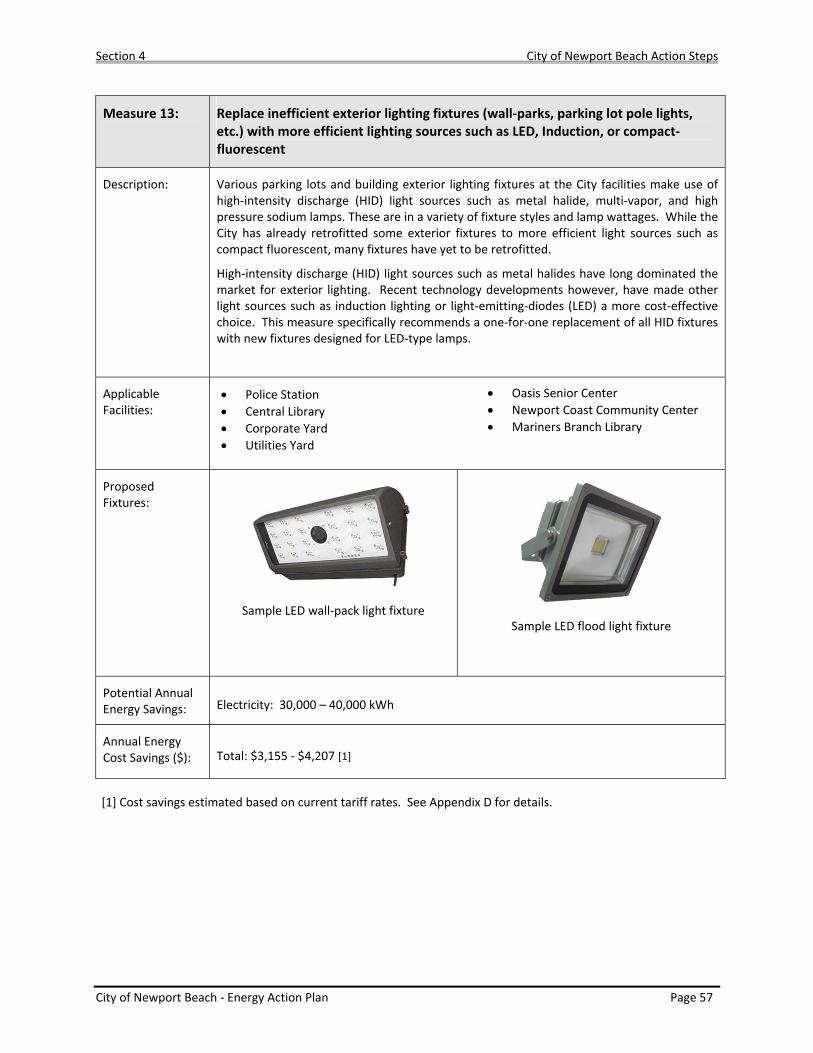
Section 4 City of Newport Beach Action Steps
City of Newport Beach ‐ Energy Action Plan Page 57
Measure 13: Replace inefficient exterior lighting fixtures (wall‐parks, parking lot pole lights, etc.) with more efficient lighting sources such as LED, Induction, or compact‐fluorescent
Description: Various parking lots and building exterior lighting fixtures at the City facilities make use of high‐intensity discharge (HID) light sources such as metal halide, multi‐vapor, and high pressure sodium lamps. These are in a variety of fixture styles and lamp wattages. While the City has already retrofitted some exterior fixtures to more efficient light sources such as compact fluorescent, many fixtures have yet to be retrofitted.
High‐intensity discharge (HID) light sources such as metal halides have long dominated the market for exterior lighting. Recent technology developments however, have made other light sources such as induction lighting or light‐emitting‐diodes (LED) a more cost‐effective choice. This measure specifically recommends a one‐for‐one replacement of all HID fixtures with new fixtures designed for LED‐type lamps.
Applicable Facilities:
• Police Station • Central Library • Corporate Yard • Utilities Yard
• Oasis Senior Center • Newport Coast Community Center • Mariners Branch Library
Proposed Fixtures:
Sample LED wall‐pack light fixture
Sample LED flood light fixture
Potential Annual Energy Savings: Electricity: 30,000 – 40,000 kWh
Annual Energy Cost Savings ($):
Total: $3,155 ‐ $4,207 [1]
[1] Cost savings estimated based on current tariff rates. See Appendix D for details.
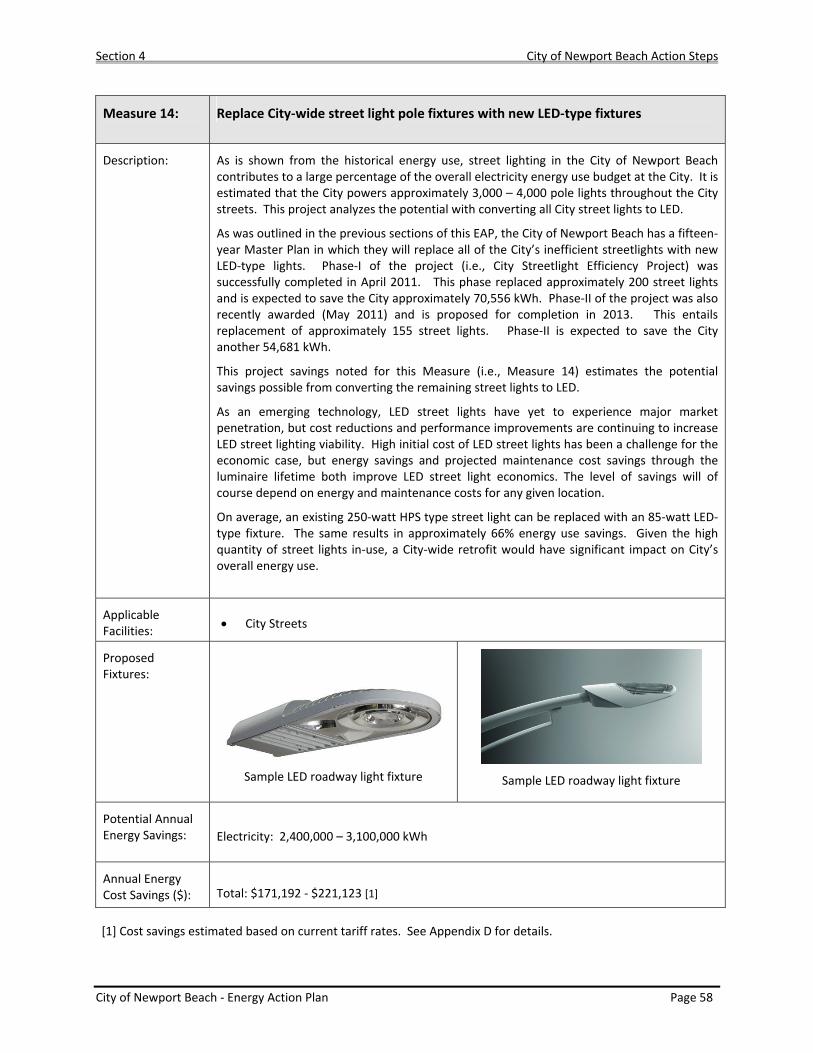
Section 4 City of Newport Beach Action Steps
City of Newport Beach ‐ Energy Action Plan Page 58
Measure 14: Replace City‐wide street light pole fixtures with new LED‐type fixtures
Description: As is shown from the historical energy use, street lighting in the City of Newport Beach contributes to a large percentage of the overall electricity energy use budget at the City. It is estimated that the City powers approximately 3,000 – 4,000 pole lights throughout the City streets. This project analyzes the potential with converting all City street lights to LED.
As was outlined in the previous sections of this EAP, the City of Newport Beach has a fifteen‐year Master Plan in which they will replace all of the City’s inefficient streetlights with new LED‐type lights. Phase‐I of the project (i.e., City Streetlight Efficiency Project) was successfully completed in April 2011. This phase replaced approximately 200 street lights and is expected to save the City approximately 70,556 kWh. Phase‐II of the project was also recently awarded (May 2011) and is proposed for completion in 2013. This entails replacement of approximately 155 street lights. Phase‐II is expected to save the City another 54,681 kWh.
This project savings noted for this Measure (i.e., Measure 14) estimates the potential savings possible from converting the remaining street lights to LED.
As an emerging technology, LED street lights have yet to experience major market penetration, but cost reductions and performance improvements are continuing to increase LED street lighting viability. High initial cost of LED street lights has been a challenge for the economic case, but energy savings and projected maintenance cost savings through the luminaire lifetime both improve LED street light economics. The level of savings will of course depend on energy and maintenance costs for any given location.
On average, an existing 250‐watt HPS type street light can be replaced with an 85‐watt LED‐type fixture. The same results in approximately 66% energy use savings. Given the high quantity of street lights in‐use, a City‐wide retrofit would have significant impact on City’s overall energy use.
Applicable Facilities: • City Streets
Proposed Fixtures:
Sample LED roadway light fixture
Sample LED roadway light fixture
Potential Annual Energy Savings: Electricity: 2,400,000 – 3,100,000 kWh
Annual Energy Cost Savings ($):
Total: $171,192 ‐ $221,123 [1]
[1] Cost savings estimated based on current tariff rates. See Appendix D for details.
Section 4 City of Newport Beach Action Steps
City of Newport Beach ‐ Energy Action Plan Page 59
B. Funding of Projects As is the case with most local governments today, project funding plays a critical role in the implementation of projects. In the last couple years, the economic recession has made it particularly difficult to approve energy conservation projects, regardless of how attractive the payback period may be. The following are various project funding mechanisms that the City should investigate and utilize (wherever applicable). Federal Government and State grants
Most energy efficiency grants are issued by individual state governments; a database of these can be found at http://www.grants.gov. However, grants for the largest amount of money are typically issued by the Federal Government; a full directory of available energy efficiency grants can be found at http://www.grants.gov. These grants are split between competitive grants, in which applicants compete with a number of other applicants for a limited pool of money, and formula grants, in which money is allocated according to a particular set of requirements that applicants must meet. Energy efficiency grants have become more common in recent years along with increased concerns about climate change and energy independence. The U.S. Department of Energy's Energy Efficiency and Conservation Block Grant program recently provided over $3.2 billion for a variety of energy efficiency programs, such as auditing and retrofitting residences and businesses to make them more energy efficient; the implementation of various energy conservation campaigns; and the deployment of energy efficient street lights and traffic signals. For information on Federal Government energy efficiency initiatives, check the Federal Government website: http://www.eere.energy.gov.
Local Utility Partnership Programs
City should look into leveraging financial and other resources from non‐city partners. Local utility partnerships can provide a substantial boost to the impact of and participation in outreach initiatives included in energy plans.
SCE’s On‐Bill Financing (OBF)
On‐Bill Financing is provided and operated by SCE, and allows eligible customers to make payments as part of a line item on their SCE bill. This program offers a zero‐interest loan for the installation(s) of qualified energy‐efficient equipment. Key Features:
• 0% interest loan • No fees on loan costs • Convenient loan repayment through your monthly SCE bill
Section 4 City of Newport Beach Action Steps
City of Newport Beach ‐ Energy Action Plan Page 60
For more information, see the link below:
http://www.sce.com/business/onbill/about‐on‐bill.htm
CEC’s Energy Efficiency Financing Program
The California Energy Commission's (CEC) Energy Efficiency Financing Program provides financing for cities, counties, public care institutions, public hospitals, public schools and colleges, and special districts through low‐interest loans for the installation of energy‐saving measures. Key Features
• Loans for energy projects must be repaid from energy cost savings within 15 years, including principal and interest (approximately 11 years simple payback). Simple payback is calculated by dividing the dollar amount of the loan by the anticipated annual energy cost savings.
• The interest rate is 1% and is fixed for the term of the loan.
For more information, see the link below:
http://www.energy.ca.gov/efficiency/financing/
Utility Rebates & Incentives
Several types of rebate and incentive programs exist for renewable energy and energy efficiency. The U.S. Department of Energy’s (DOE) Federal Energy Management Program categorizes these programs into the following:
• Public purpose programs administered by utilities, state agencies, or other third parties and paid for by utility ratepayers, typically through a non‐bypassable system benefits charge instituted as part of restructuring legislation or rules.
• Utility programs administered by local utilities and paid for by utility ratepayers through bundled rates.
• Programs sponsored by state agencies designed to promote energy efficiency and renewable energy, usually funded out of general tax revenues.
Beyond general rebate and incentives are demand response and load management programs. These programs provide incentives to curtail demand during peak energy usage periods in response to system reliability or market conditions. A complete list of programs offered by CA is available online at:
http://www1.eere.energy.gov/femp/financing/eip_ca.html
Section 4 City of Newport Beach Action Steps
City of Newport Beach ‐ Energy Action Plan Page 61
Qualified Energy Conservation Bonds (QECBs)
The Energy Improvement and Extension Act of 2008, enacted in October 2008, authorized the issuance of Qualified Energy Conservation Bonds (QECBs) that may be used by state, local and tribal governments to finance certain types of energy projects. QECBs are qualified tax credit bonds. Generally, the borrower who issues the bond pays back only the principal of the bond, and the bondholder receives federal tax credits in lieu of the traditional bond interest. The tax credit may be taken quarterly to offset the tax liability of the bondholder. The tax credit rate is set daily by the U.S. Treasury Department; however, energy conservation bondholders will receive only 70% of the full rate set by the Treasury Department. QECBs are not subject to a U.S. Department of Treasury application and approval process. Bond volume is instead allocated to each state based on the state's percentage of the U.S. population as of July 1, 2008. Each state is then required to allocate a portion of its allocation to "large local governments" within the state based on the local government's percentage of the state's population. The definition of "qualified energy conservation projects" is fairly broad and contains elements relating to energy efficiency capital expenditures in public buildings that reduce energy consumption by at least 20%; green community programs (including loans and grants to implement such programs); renewable energy production; various research and development applications; mass commuting facilities that reduce energy consumption; several types of energy related demonstration projects; and public energy efficiency education campaigns. For more information, see the link below:
http://www.dsireusa.org/incentives/incentive.cfm?Incentive_Code=US51F
Energy Efficiency Conservation Block Grant Program (EECBG)
Through formula and competitive grants, the Program empowers local communities to make strategic investments to meet the nation's long‐term goals for energy independence and leadership on climate change. Grants can be used for energy efficiency and conservation programs and projects communitywide, as well as renewable energy installations on government buildings. Activities eligible for use of funds include the following:
• Development of an energy efficiency and conservation strategy • Building energy audits and retrofits, including weatherization • Financial incentive programs for energy efficiency such as energy
savings performance contracting, on‐bill financing, and revolving loan funds
• Transportation programs to conserve energy and support
Section 4 City of Newport Beach Action Steps
City of Newport Beach ‐ Energy Action Plan Page 62
renewable fuel infrastructure • Building code development, implementation, and inspections • Installation of distributed energy technologies including combined
heat and power and district heating and cooling systems • Material conservation programs including source reduction,
recycling, and recycled content procurement programs • Reduction and capture of greenhouse gas emissions generated by
landfills or similar waste‐related sources • Installation of energy efficient traffic signals and street lighting • Installation of renewable energy technologies on government
buildings • Any other appropriate activity that meets the purposes of the
program and is approved by DOE For more information, see the link below:
http://www1.eere.energy.gov/wip/eecbg.html
Section 4 City of Newport Beach Action Steps
City of Newport Beach ‐ Energy Action Plan Page 63
C. Policies and Guidelines The City of Newport Beach and its City leaders understand the role they play in creating a sustainable environment not only for City staff but also for the entire community within. While this EAP is a step in the right direction, the City understands that it is effective planning and implementation of policies and guidelines that will have the largest influence on attaining a long‐term sustainable environment. Key objectives that the City shall consider in the implementation of new policies are as follows:
o Reduce energy use and carbon emissions at existing facilities o Identify and eliminate energy waste o Exceed energy efficiency standards in new construction facilities o Stay up‐to‐date with evolving energy efficiency technologies o Sustain an effective energy usage tracking mechanism
The following outlines various guidelines and policies that the City should encourage and consider as they move forward towards a sustainable future: • Assembly Bill 32: Be consistent with Assembly Bill 32 and the greenhouse gas
emission reduction goals. This EAP outlines the goals set‐forth in addition to various energy efficiency measures to help attain those goals.
• Federal and State Energy Efficiency Requirements:
Adhere to federal and state‐level energy efficiency requirements for both new and existing buildings. This will include compliance with the latest California building energy efficiency standards (Title 24), ASHRAE Standard 90.1 (Energy Standard for Buildings except Low‐Rise Residential Buildings), and the International Energy Conservation Code (IECC). Key enforcement procedures shall include the following:
» Review of plans » Review of products, materials, and equipment specifications » Review of tests, certification reports, and product listings » Review of supporting calculations » Inspection of the building and its systems during construction » Evaluation of materials substituted in the field » Inspection prior to occupancy
• Energy Efficiency in New Construction:
Incorporate a clearly defined set of energy efficiency requirements into the City’s Owner Project Requirements and Basis of Design Documents.
Section 4 City of Newport Beach Action Steps
City of Newport Beach ‐ Energy Action Plan Page 64
• Building Commissioning and Retro‐Commissioning:
The City understands the benefit that building commissioning (Cx) brings to the energy performance of new and existing buildings. When a building is initially commissioned it undergoes an intensive quality assurance process that begins during design and continues through construction, occupancy, and operations. Cx ensures that the new building operates initially as the owner intended and that building staff are prepared to operate and maintain its systems and equipment. Retro‐commissioning (RCx) is the application of the commissioning process to existing buildings. Depending and the age and condition of the systems, this RCx process often resolves problems that occurred during design or construction, or addresses problems that have developed throughout the building's life. For all future capital projects, the City intends to incorporate Cx into the project requirements. For all existing buildings, the City can develop an inventory of all buildings and identify those that can benefit from RCx. To the extent economically feasible and technically practicable, the City should plan on undergoing an RCx process in order of priority.
• Energy Benchmarking: Incorporate policies that will enable assigned staff to “benchmark” energy usage at City buildings and continually monitor and track the same.
• Environmentally Preferred Purchasing (EPP) Policy:
“Environmentally Preferred Products and Services” is defined as products and services that have a reduced effect on human health and the environment when compared with competing products that serve the same purpose. This comparison may consider raw materials acquisition, production, manufacturing, packaging, distribution, reuse, operation, maintenance, and/or disposal of the product.” 6 The main intent of an EPP policy is to reduce the negative environmental impact of products and services used by the City. Objectives of the policy are as follows: 7
» Conserve natural resources; » Minimize environmental impacts such as pollution and excessive use of water and energy;
» Eliminate or reduce toxics that create hazards to workers and the community;
» Support strong recycling markets; » Reduce materials that are sent to landfills ; » Increase the use and availability of environmentally preferable products that protect the environment;
» Identify environmentally preferable products and distribution systems;
6 Greening the Government through Waste Prevention, Recycling and Federal Acquisition, Executive Order 13101, Sep 14, 1998. 7 Environmentally Preferable Purchasing Model Policy, July, 2012, http://www.stopwaste.org/home/index.asp?page=439
Section 4 City of Newport Beach Action Steps
City of Newport Beach ‐ Energy Action Plan Page 65
By considering environmental impacts in public purchasing, an EPP policy will help reduce its negative impact on environment, lower pollution levels from its operations, protect public health, and improve the environmental quality of the Newport Beach community.
• Savings by Design (SBD): For all future new construction or major modernization projects, City should utilize the services provided by the Savings By Design (SBD) program wherever feasible and practical. SBD is California’s nonresidential new construction energy efficiency program, administered statewide and funded by Utility customers through the Public Purpose Programs surcharge applied to gas and electric services.
Savings By Design encourages energy‐efficient building design and construction practices, promoting the efficient use of energy by offering up‐front design assistance supported by financial incentives based on project performance. Projects participating in Savings By Design receive services including design assistance, Owners Incentives, Design Team Incentives, and Energy Design Resources. Services begin in the project design phase and continue through construction completion.
Design assistance can range from simple plan review and efficiency upgrade recommendations to complete computer simulation analysis comparing a number of alternative systems and integrated building design options. Financial incentives, to help offset increased design interaction and potential costs of construction, are available for projects that exceed thresholds established by the program. Participation in the program brings additional benefits, such as reduced long‐term operating costs, greater comfort, health and productivity for occupants, and conservation of natural resources and cleaner air due to avoided power generation.
• Support of Staff Training: Ongoing energy efficiency related training of staff is critical to the sustainability and success of the EAP. Department leaders should encourage staff to participate in training made available by various organizations like ICLEI – Local Governments for Sustainability, the Local Government Commission (LGC), and Southern California Edison (SCE). In particular, the City will leverage the free workshops offered by SCE to increase staff knowledge on various sustainability and energy efficiency topics. Areas of focus will include the following:
» Title‐24 and other Energy Efficiency Building Standards (i.e., CALGreen, ASHRAE 90.1, etc.)
» Current green building policies » LEED (Leadership in Energy and Environmental Design)
Section 4 City of Newport Beach Action Steps
City of Newport Beach ‐ Energy Action Plan Page 66
» Developing energy efficiency technologies » Building Energy Auditing tools and techniques
• LEED (Leadership in Energy and Environmental Design):
As shown from recent City construction projects (i.e., OASIS, Civic Center), the City understands the sustainability benefits from LEED. The City will continue to encourage LEED in new construction and major modernization projects wherever feasible. LEED is a voluntary third‐party certification program and the nationally accepted benchmark for the design, construction and operation of high performance green buildings. City participation in the LEED process demonstrates leadership, innovation, environmental stewardship and social responsibility. Green design categories that are addressed by LEED include sustainable sites, water efficiency, energy efficiency, materials, and indoor environmental quality.
Section 4 City of Newport Beach Action Steps
City of Newport Beach ‐ Energy Action Plan Page 67
D. Tracking Introduction The City of Newport Beach understands the importance of tracking the year‐to‐year energy use at its facilities and the progress it is making towards the EAP goals. Accordingly, it is critical that the City establishes a system that will help track energy use and expenditures for each energy‐using account. This tracking mechanism shall have capability to tell stakeholders and decision makers how recent energy action steps, or lack thereof, have impacted energy use. It is also equally important that staff is trained on what is outlined in this EAP and how the proposed energy efficiency measures are expected to change the energy use profiles observed. This EAP proposes that energy usage and expenditures be tracked and that City staff be continually trained on energy efficiency and advanced technologies that can be implemented. City officials will encourage staff to participate in energy efficiency training and workshops. These are many times offered for free by Southern California Edison (SCE) and Southern California Gas Company (SCG). Also, free webinars are typically available through Energy Star, California Energy Commission (CEC), and various others. Enterprise Energy Management Information System (EEMIS) The City is in the process of implementing an Enterprise Energy Management Information System (EEMIS) that will allow the City to easily monitor energy consumption and year‐to‐year reduction at all its facilities. Funding for the EEMIS is through SCE’s Flight #5.6 Grant (Local Government Strategic Plan Strategies Solicitation). An EEMIS includes many useful features as outlined below:
• Bill analysis; • Energy use analysis; • Electricity rate analysis; • Electric demand management; • Greenhouse gas reporting; • Reporting to identify the best and the worst performing facilities; • Collection of real‐time data from large electricity accounts allows the City to better manage
daily energy usage; • Energy usage forecasting allows the City to make informative decisions regarding load control
commands in response to California grid conditions and demand reduction goals; and • Identification of cost savings measures to shift power usage to non‐peak hours.
While the ultimate goal is to reduce the City’s overall energy use, it will be useful to track the progress of the various City departments as outlined in Section 2 of this EAP. Further, if energy use at (a) building
Section 4 City of Newport Beach Action Steps
City of Newport Beach ‐ Energy Action Plan Page 68
facilities, (b) pumping stations, and (c) street lighting are isolated, it will help give a clearer picture of the progress.
Impact of New Construction As is the case with any large organization, the City may in the future add (or remove) facilities based on current demand and economics. It will be important to make note of when these changes take place and how they will impact energy use. Section 2 of this EAP has established a “baseline” energy use with a defined set of City buildings and energy using accounts. Future comparisons against this “baseline” shall be done using the same set of parameters. If for example, a new building or a new lighted road is added, this will undoubtedly have an impact on overall City energy use. While it is also important to maintain and track energy‐efficiency in these new facilities, these accounts shall be analyzed separately. Energy use and goals outlined in this EAP can also be analyzed and tracked on a per square foot basis. For example, if average energy use index (EUI) is calculated for all facilities City‐wide, this will allow the City to track the progress of energy efficiency efforts, even if new City buildings are added over‐time. Understandably, this analysis strategy would only apply to those building facilities with a defined square footage. Service accounts like street lighting and pumping stations would have to be excluded and analyzed separately. EPA’s Portfolio Manager Another tracking mechanism that the City may consider using is the U.S. Environmental Protection Agency (EPA) Portfolio Manager, a free online tool that will provide an energy performance score of a specific building in relation to similar facilities in similar climates. The tool can help the City do the following:
• Track multiple energy and water meters; • Benchmark facilities relative to past performance; • View percent improvement in weather‐normalized source energy; • Monitor energy and water costs; • Verify building energy performance; and • Determine energy performance ratings.
This EAP proposes that the top five energy using City buildings (outlined in Section 2) be tracked using EPA’s Portfolio Manager. The main intent shall be to establish a benchmark score for the baseline year for comparison against future time periods.
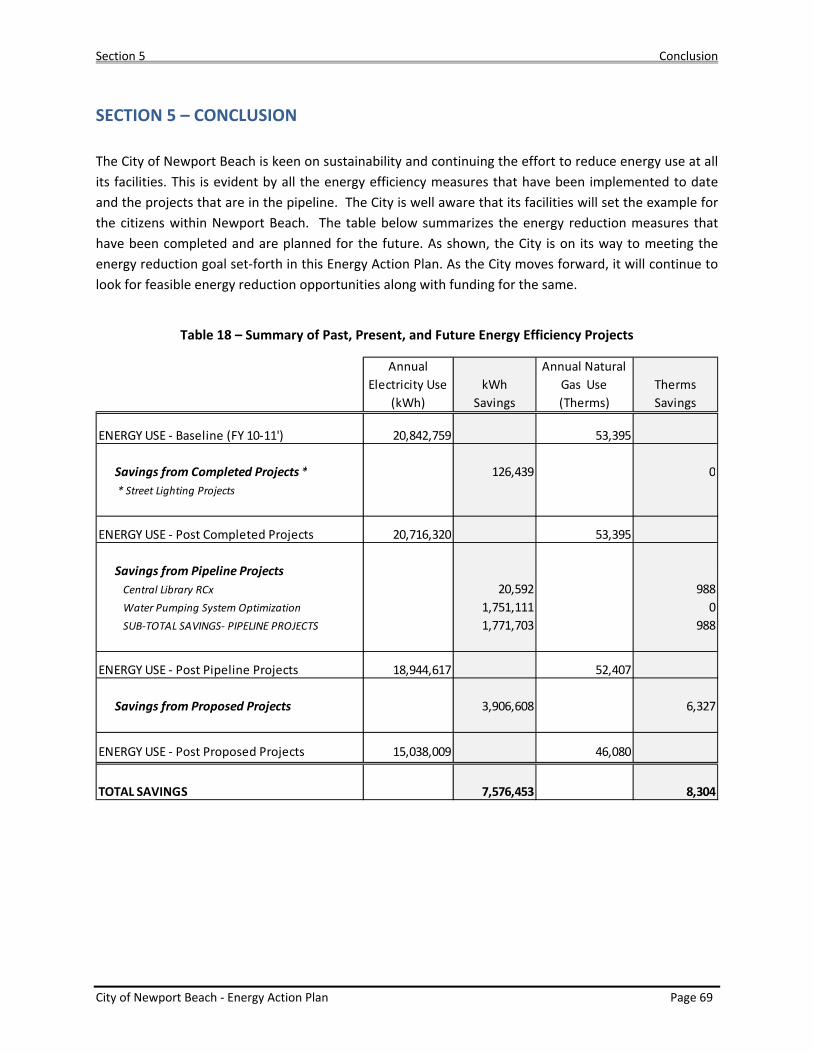
Section 5 Conclusion
City of Newport Beach ‐ Energy Action Plan Page 69
SECTION 5 – CONCLUSION The City of Newport Beach is keen on sustainability and continuing the effort to reduce energy use at all its facilities. This is evident by all the energy efficiency measures that have been implemented to date and the projects that are in the pipeline. The City is well aware that its facilities will set the example for the citizens within Newport Beach. The table below summarizes the energy reduction measures that have been completed and are planned for the future. As shown, the City is on its way to meeting the energy reduction goal set‐forth in this Energy Action Plan. As the City moves forward, it will continue to look for feasible energy reduction opportunities along with funding for the same.
Table 18 – Summary of Past, Present, and Future Energy Efficiency Projects
Annual Electricity Use
(kWh)kWh
Savings
Annual Natural Gas Use(Therms)
Therms Savings
ENERGY USE ‐ Baseline (FY 10‐11') 20,842,759 53,395
Savings from Completed Projects* 126,439 0 * Street Lighting Projects
ENERGY USE ‐ Post Completed Projects 20,716,320 53,395
Savings from Pipeline ProjectsCentral Library RCx 20,592 988Water Pumping System Optimization 1,751,111 0SUB‐TOTAL SAVINGS‐ PIPELINE PROJECTS 1,771,703 988
ENERGY USE ‐ Post Pipeline Projects 18,944,617 52,407
Savings from Proposed Projects 3,906,608 6,327
ENERGY USE ‐ Post Proposed Projects 15,038,009 46,080
TOTAL SAVINGS 7,576,453 8,304
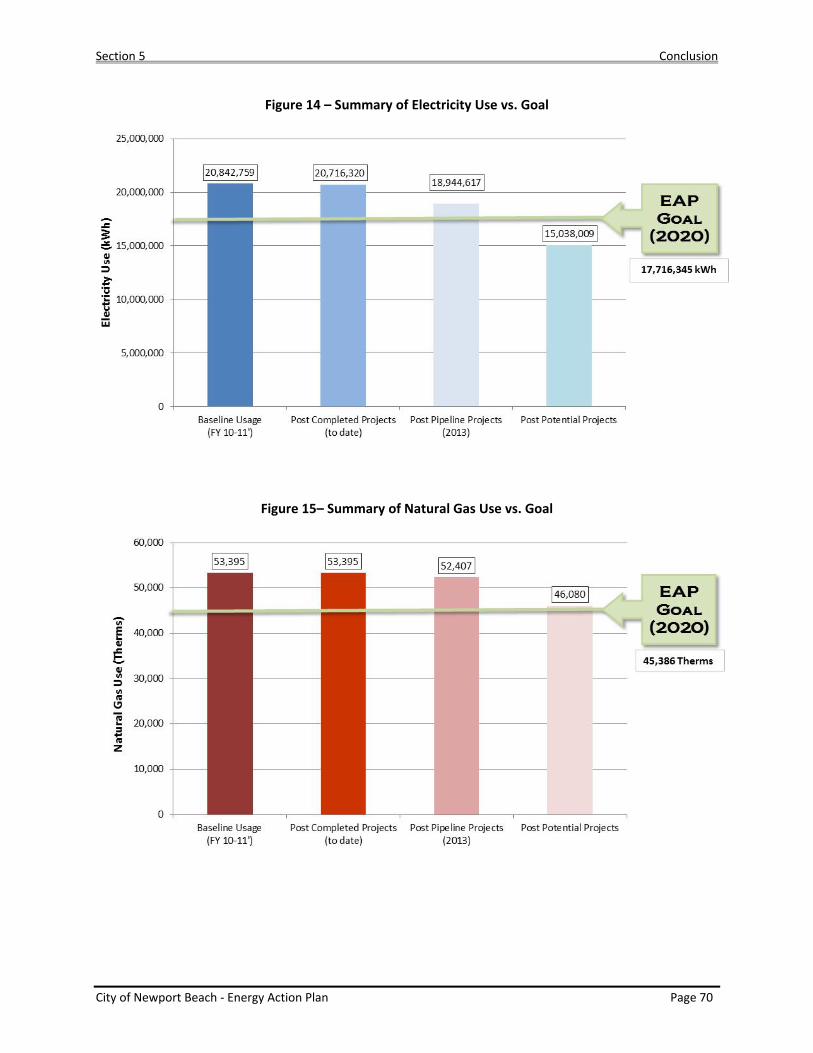
Section 5 Conclusion
City of Newport Beach ‐ Energy Action Plan Page 70
Figure 14 – Summary of Electricity Use vs. Goal
Figure 15– Summary of Natural Gas Use vs. Goal
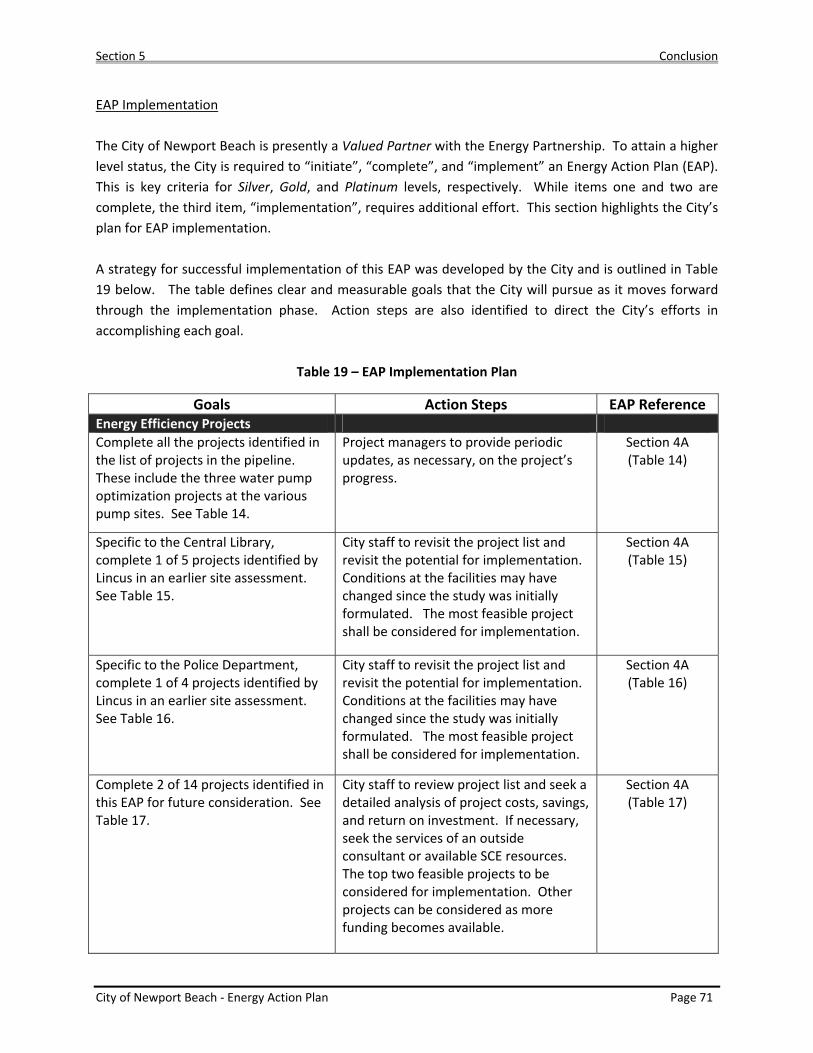
Section 5 Conclusion
City of Newport Beach ‐ Energy Action Plan Page 71
EAP Implementation The City of Newport Beach is presently a Valued Partner with the Energy Partnership. To attain a higher level status, the City is required to “initiate”, “complete”, and “implement” an Energy Action Plan (EAP). This is key criteria for Silver, Gold, and Platinum levels, respectively. While items one and two are complete, the third item, “implementation”, requires additional effort. This section highlights the City’s plan for EAP implementation. A strategy for successful implementation of this EAP was developed by the City and is outlined in Table 19 below. The table defines clear and measurable goals that the City will pursue as it moves forward through the implementation phase. Action steps are also identified to direct the City’s efforts in accomplishing each goal.
Table 19 – EAP Implementation Plan
Goals Action Steps EAP Reference Energy Efficiency Projects Complete all the projects identified in the list of projects in the pipeline. These include the three water pump optimization projects at the various pump sites. See Table 14.
Project managers to provide periodic updates, as necessary, on the project’s progress.
Section 4A (Table 14)
Specific to the Central Library, complete 1 of 5 projects identified by Lincus in an earlier site assessment. See Table 15.
City staff to revisit the project list and revisit the potential for implementation. Conditions at the facilities may have changed since the study was initially formulated. The most feasible project shall be considered for implementation.
Section 4A (Table 15)
Specific to the Police Department, complete 1 of 4 projects identified by Lincus in an earlier site assessment. See Table 16.
City staff to revisit the project list and revisit the potential for implementation. Conditions at the facilities may have changed since the study was initially formulated. The most feasible project shall be considered for implementation.
Section 4A (Table 16)
Complete 2 of 14 projects identified in this EAP for future consideration. See Table 17.
City staff to review project list and seek a detailed analysis of project costs, savings, and return on investment. If necessary, seek the services of an outside consultant or available SCE resources. The top two feasible projects to be considered for implementation. Other projects can be considered as more funding becomes available.
Section 4A (Table 17)
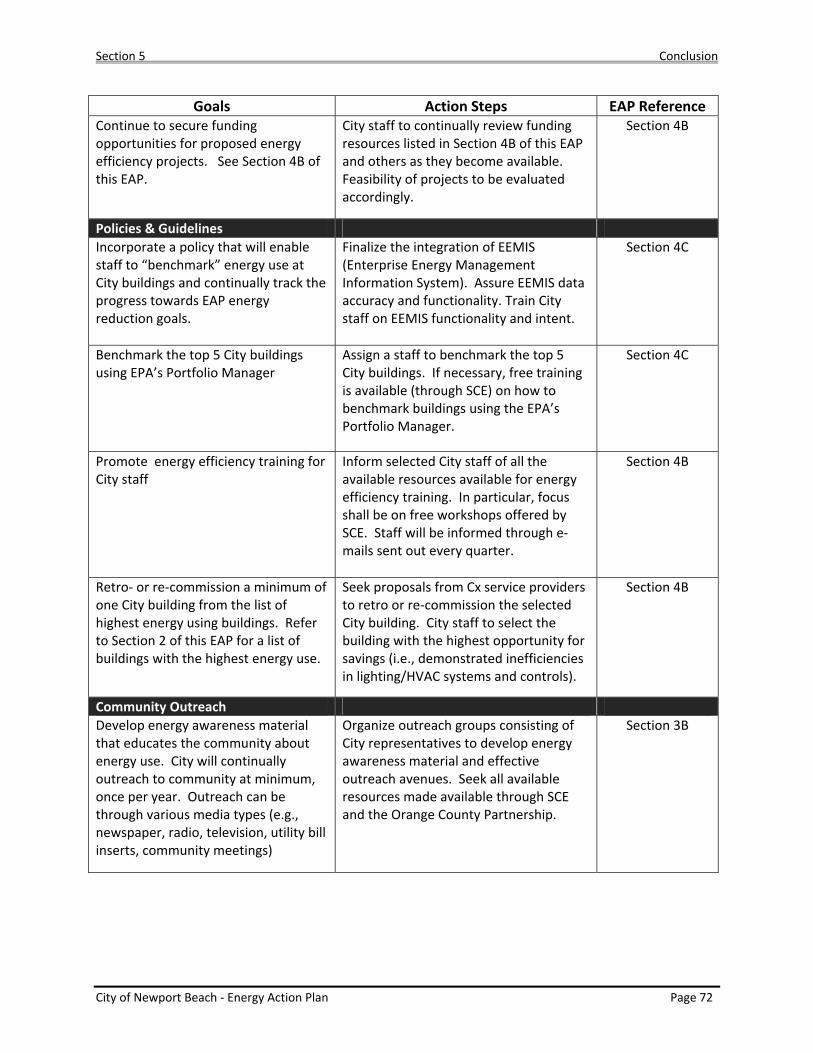
Section 5 Conclusion
City of Newport Beach ‐ Energy Action Plan Page 72
Goals Action Steps EAP Reference Continue to secure funding opportunities for proposed energy efficiency projects. See Section 4B of this EAP.
City staff to continually review funding resources listed in Section 4B of this EAP and others as they become available. Feasibility of projects to be evaluated accordingly.
Section 4B
Policies & Guidelines Incorporate a policy that will enable staff to “benchmark” energy use at City buildings and continually track the progress towards EAP energy reduction goals.
Finalize the integration of EEMIS (Enterprise Energy Management Information System). Assure EEMIS data accuracy and functionality. Train City staff on EEMIS functionality and intent.
Section 4C
Benchmark the top 5 City buildings using EPA’s Portfolio Manager
Assign a staff to benchmark the top 5 City buildings. If necessary, free training is available (through SCE) on how to benchmark buildings using the EPA’s Portfolio Manager.
Section 4C
Promote energy efficiency training for City staff
Inform selected City staff of all the available resources available for energy efficiency training. In particular, focus shall be on free workshops offered by SCE. Staff will be informed through e‐mails sent out every quarter.
Section 4B
Retro‐ or re‐commission a minimum of one City building from the list of highest energy using buildings. Refer to Section 2 of this EAP for a list of buildings with the highest energy use.
Seek proposals from Cx service providers to retro or re‐commission the selected City building. City staff to select the building with the highest opportunity for savings (i.e., demonstrated inefficiencies in lighting/HVAC systems and controls).
Section 4B
Community Outreach Develop energy awareness material that educates the community about energy use. City will continually outreach to community at minimum, once per year. Outreach can be through various media types (e.g., newspaper, radio, television, utility bill inserts, community meetings)
Organize outreach groups consisting of City representatives to develop energy awareness material and effective outreach avenues. Seek all available resources made available through SCE and the Orange County Partnership.
Section 3B

Section 5 Conclusion
City of Newport Beach ‐ Energy Action Plan Page 73
EAP Adoption
The success of any EAP is directly related to the degree of its implementation. The first step in this effort is to take the completed EAP through City Council and have it considered for adoption. Adoption by City Council will be a key starting point and provide valuable leverage for further EAP actions. The list below outlines various factors the City should consider in the decision process for EAP adoption and the implementation of actions recommended in the plan.
• Adoption of the EAP does not automatically deploy actions for implementation • The EAP is not binding on the City Council or the Community • Strategies will be implemented based on the needs and ability of the City and Community • Strategies should be financially feasible • Pursue actions, not simply based on thier emissions reduction potential, but on the collection of
benefits that it can provide to the City and Community • Pursuing low or no‐cost high‐priority recommendations will have the greatest likelihood of
success Integration of EAP With the intent of helping guide the City in achieving its energy efficiency goals, the City will consider implementation of the policies and projects outlined in this EAP, where possible, through the following planning mechanisms already in‐place:
• General Plan • City Ordinances • Capital Improvement Plans • City Engineering Designs • Other energy efficiency plans, regulations, and practices
The City plans to review all existing planning mechanisms in‐place and determine which are best suitable for implementation of the EAP’s long term policies. Recurring EAP Tasks For effective implementation, efforts will also be necessary to monitor and evaluate the progress of the plan. Evaluating the progress of the EAP is an ongoing process, and as such, the EAP should be treated as a working document that must adapt to changes. The City will need to systematically track energy use and reflect any changes in facilities and equipment. Energy use for each facility should be analyzed periodically to ensure that it is moving towards the target reduction goal. It will also be important to continually monitor funding opportunities that can be leveraged to implement the higher cost recommended actions.