city of mineola
TRANSCRIPT

City of MineolaSecond Quarter, FY 2020-2021
Financial Reports
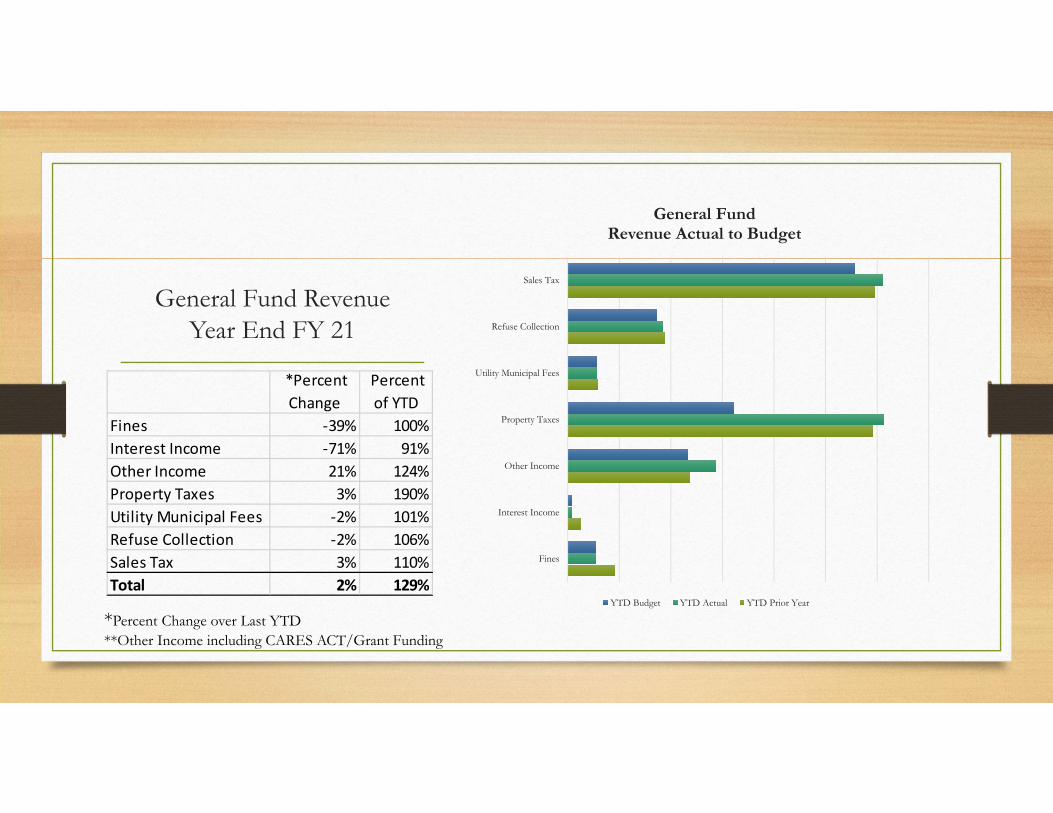
General Fund RevenueYear End FY 21
Fines
Interest Income
Other Income
Property Taxes
Utility Municipal Fees
Refuse Collection
Sales Tax
General FundRevenue Actual to Budget
YTD Budget YTD Actual YTD Prior Year
*Percent Change over Last YTD**Other Income including CARES ACT/Grant Funding
*Percent Change
Percent of YTD
Fines ‐39% 100%Interest Income ‐71% 91%Other Income 21% 124%Property Taxes 3% 190%Utility Municipal Fees ‐2% 101%Refuse Collection ‐2% 106%Sales Tax 3% 110%Total 2% 129%

General Fund RevenueYTD Budget $2,818,363.00
YTD Actual $3,640,005.87
Variance (+/-) $ 821,642.87
Fines3%
Interest Income0%
Other Income16%
Property Taxes34%
Utility Municipal Fees3%
Refuse Collection10%
Sales Tax34%
General Fund Total Revenue
YTD Prior Year YTD Actual YTD BudgetFines 182,928.93$ 112,013.42$ 112,500.00$ Interest Income 54,358.40$ 15,839.68$ 17,500.00$ Other Income 477,179.99$ 577,754.30$ 467,083.00$ Property Taxes 1,184,896.75$ 1,225,619.35$ 643,830.00$ Utility Municipal Fees 118,300.44$ 115,792.83$ 115,000.00$ Refuse Collection 377,436.93$ 370,519.26$ 349,000.00$ Sales Tax 1,190,659.05$ 1,222,467.03$ 1,113,450.00$ Total 3,585,760.49$ 3,640,005.87$ 2,818,363.00$

Sales Tax
• Sales Tax up 1.25% over Last YTD
• Budgeted 0% increase over Last Year
• YTD Actual $1,222,467.03
• YTD Budget $1,113,450.00
• Variance (+/-) + $16,933.55
0.00
50,000.00
100,000.00
150,000.00
200,000.00
250,000.00
300,000.00
October December February April June August
CITY OF MINEOLAMonthly Sales Tax Trend Analysis
FY 2016‐2017 FY 2017‐2018 FY 2018‐2019 FY 2019‐2020 FY 2020‐2021

Refuse Collection
$-
$100,000.00
$200,000.00
$300,000.00
$400,000.00
$500,000.00
$600,000.00
$700,000.00
$800,000.00
YE 2013 YE 2014 YE 2015 YE 2016 YE 2017 YE 2018 YE 2019 YE 2020 YTD 2021
Refuse Collection
Income Expense Net
Income Expense NetYE 2013 343,560.35$ 188,605.13$ 154,955.22$ YE 2014 336,356.79$ 200,220.72$ 136,136.07$ YE 2015 354,994.14$ 200,394.10$ 154,600.04$ YE 2016 385,958.92$ 200,836.34$ 185,122.58$ YE 2017 641,226.43$ 431,732.40$ 209,494.03$ YE 2018 699,136.92$ 486,011.13$ 213,125.79$ YE 2019 724,549.01$ 559,297.12$ 165,251.89$ YE 2020 740,906.27$ 493,036.48$ 247,869.79$ YTD 2021 370,519.26$ 263,597.23$ 106,922.03$

Hotel Motel Tax
• YTD Prior Year $47,545.50
• YTD Actual $34,055.40
• YTD Budget $30,713.00
• Variance (+/-) $ 6,761.53
$64,000.00
$66,000.00
$68,000.00
$70,000.00
$72,000.00
$74,000.00
$76,000.00
FY 2015-2016 FY 2016-2017 FY 2017-2018 FY 2018-2019 FY 2019-2020
Hotel Occupancy Tax Revenue
Revenue Budget

General Fund Expenditures
• YTD General Fund Expenditures at 95% of budget
• YTD Excess Revenue over Expenditures $908,744.91
$-
$100,000.00
$200,000.00
$300,000.00
$400,000.00
$500,000.00
$600,000.00
$700,000.00
$800,000.00
$900,000.00
$1,000,000.00
Police Fire Street Admin Comm Dev MunicipalCourt
Transfers(Sales Tax)
General FundExpense Actual to Budget
YTD Prior Year YTD Actual YTD Budget

General Fund Expenditures(YTD FY 21)
YTD Budget $2,885,863.00
YTD Actual $2,731,260.96
Variance (+/-) $ -154,602.04
Police33%
Fire9%
Street20%
Admin16%
Comm Dev4%
Municipal Court2%
Transfers (Sales Tax)16%
General Fund ExpendituresPer Department
YTD Prior Year YTD ActualPolice 754,708.77$ 895,095.25$ Fire 374,865.91$ 247,997.13$ Street 550,482.62$ 555,455.10$ Admin 322,298.22$ 440,728.40$ Comm Dev 166,238.74$ 115,472.54$ Municipal Court ‐$ 54,020.45$ Transfers (Sales Tax 446,673.96$ 422,492.09$ Total Expenditures 2,615,268.22$ 2,731,260.96$
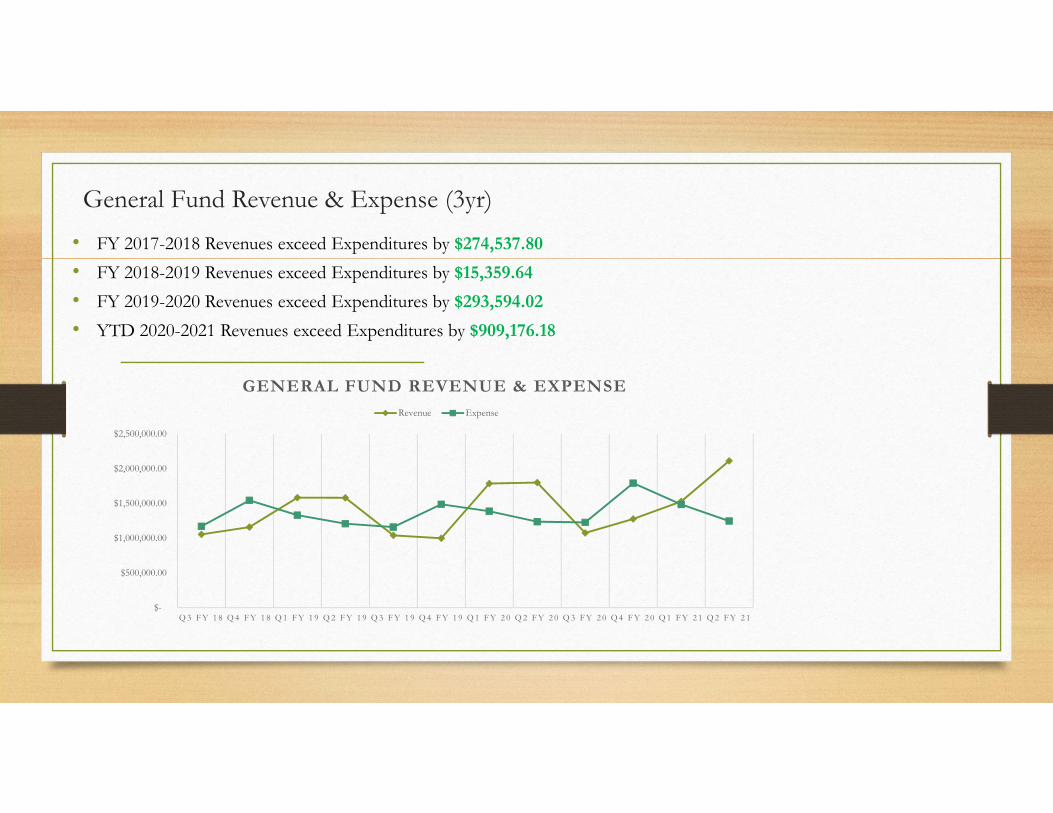
General Fund Revenue & Expense (3yr)• FY 2017-2018 Revenues exceed Expenditures by $274,537.80
• FY 2018-2019 Revenues exceed Expenditures by $15,359.64
• FY 2019-2020 Revenues exceed Expenditures by $293,594.02
• YTD 2020-2021 Revenues exceed Expenditures by $909,176.18
$-
$500,000.00
$1,000,000.00
$1,500,000.00
$2,000,000.00
$2,500,000.00
Q 3 F Y 1 8 Q 4 F Y 1 8 Q 1 F Y 1 9 Q 2 F Y 1 9 Q 3 F Y 1 9 Q 4 F Y 1 9 Q 1 F Y 2 0 Q 2 F Y 2 0 Q 3 F Y 2 0 Q 4 F Y 2 0 Q 1 F Y 2 1 Q 2 F Y 2 1
GENERAL FUND REVENUE & EXPENSE
Revenue Expense

General Fund Balance
Cash Account balances as of March for last five years
Only considering Operating Funds and Investment Account
$716,398.34 $872,928.20
$779,261.66 $925,835.46
$1,274,641.98
$229,345.36
$424,532.23 $583,967.79
$553,312.50
$590,824.98
FY 2016 -2017 FY 2017 -2018 FY 2018 -2019 FY 2019 -2020 FY 2020 -2021
GENERAL FUND OPERATING BALANCE
General Fund (Operating) Investment
General FundCash Balance
FY 2014‐2015 734,327.86$ FY 2015‐2016 809,715.97$ FY 2016‐2017 945,743.70$ FY 2017‐2018 1,297,460.43$ FY 2018‐2019 1,363,229.45$ FY 2019‐2020 1,479,147.96$ FY 2020-2021 1,865,466.96$

Water Fund Revenue
• Water Sales YTD at 91% of budget.
• Sewer Sales YTD at 100%
• Total Revenue for Water Fund 94%
*significant change in Other income due to YE audit adjusting entry in the transfer account
Water Fund Percent Change over LY
Percent of YTD Budget
Water Sales 2% 91%Sewer Sales 1% 100%Other Income* ‐22% 104%Total Percent Change 0% 94%
Water Sales
Sewer Sales
Other Income*
Water FundRevenue Actual to Budget
YTD Budget YTD Actual YTD Prior Year

Water Fund RevenueYTD Budget $1,344,637.00
YTD Actual $1,269,354.23
Variance (+/-) $ -75,282.77
YTD Actual YTD BudgetWater Sales 785,340.49$ 863,254.00$ Sewer Sales 435,224.48$ 434,328.00$ Other Income* 48,789.26$ 47,055.00$ Total Percent Change 1,269,354.23$ 1,344,637.00$
Water Sales62%
Sewer Sales34%
Other Income*4%
Water Fund Total Revenue

Water Fund Expenditures
• YTD Water Fund Expenditures at 80% of budget
• Total Excess Revenue Over Expenditures $45,980.34
$-
$100,000.00
$200,000.00
$300,000.00
$400,000.00
$500,000.00
$600,000.00
$700,000.00
Water Wastewater Transfers (Debt Svc)
Water Fund Expense Actual to Budget
YTD Prior Year YTD Actual YTD Budget

Water Fund Expenditures(2nd Quarter FY 21)
YTD Budget $1,344,637.00
YTD Actual $1,223,373.89
Variance (+/-) $121,263.11
YTD Actual YTD BudgetWater 519,461.84$ 649,895.00$ Wastewater 249,176.93$ 240,630.00$ Transfers (Debt Svc 454,735.12$ 454,112.00$ Total Expenditures 1,223,373.89$ 1,344,637.00$
Water43%
Wastewater20%
Transfers (Debt Svc)37%
Water Fund ExpendituresPer Department

Water Fund Revenue & Expense (3yr)• FY 2017-2018 Revenues exceed Expenditures by $459,159.77
• FY 2018-2019 Revenues exceeded Expenditures by $188,094.62
• FY 2019-2020 Revenues exceeded Expenditures by $214,606.26
• YTD 2020-2021 Revenues exceeded Expenditures by $45,980.34
$-
$100,000.00
$200,000.00
$300,000.00
$400,000.00
$500,000.00
$600,000.00
$700,000.00
$800,000.00
$900,000.00
Q 3 F Y 1 8 Q 4 F Y 1 8 Q 1 F Y 1 9 Q 2 F Y 1 9 Q 3 F Y 1 9 Q 4 F Y 1 9 Q 1 F Y 2 0 Q 2 F Y 2 0 Q 3 F Y 2 0 Q 4 F Y 2 0 Q 1 F Y 2 1 Q 2 F Y 2 1
WATER FUND REVENUE & EXPENSE
Revenue Expense

Water Fund Balance
History of Cash Account balances as of March
Cash BalanceFY 2014‐2015 170,949.96$ FY 2015‐2016 48,667.56$ FY 2016‐2017 267,664.07$ FY 2017‐2018 476,124.57$ FY 2018‐2019 937,880.77$ FY 2019‐2020 1,094,464.21$ FY 2020‐2021 1,251,650.84$
$115,781.42 $48,667.56
$267,664.07
$476,124.57 $566,652.26
$651,938.36
$55,168.54
$-
$-
$-
$371,228.51
$442,525.85
$-
$200,000.00
$400,000.00
$600,000.00
$800,000.00
$1,000,000.00
$1,200,000.00
FY 2014-2015 FY 2015-2016 FY 2016-2017 FY 2017-2018 FY 2018-2019 FY 2019-2020
WATER FUND OPERATING BALANCE
Water Fund Investment

Cash Balances
Total City Funds, including bond funds
Interest rates dropped significantly due to COVID-19, TexPool and
Money Markets both have a low rate of return.
$-
$10,000.00
$20,000.00
$30,000.00
$40,000.00
$50,000.00
$60,000.00
$70,000.00
$80,000.00
$-
$2,000,000.00
$4,000,000.00
$6,000,000.00
$8,000,000.00
$10,000,000.00
$12,000,000.00
FY17-18Q3
FY17-18Q4
FY18-19Q1
FY18-19Q2
FY18-19Q3
FY18-19Q4
FY19-20Q1
FY19-20Q2
FY19-20Q3
FY19-20Q4
FY20-21Q1
FY20-21Q2
Inte
rest
Ear
ned
Qua
rter E
ndin
g Ba
lance
Period
Total Portfolio BalancePer Quarter
Quarter End Portfolio Value Interest Earned Linear (Interest Earned)

Interest Rates
• The US Treasury Yield Curve has declined significantly due to COVID-19
• City funds are invested in Money Market accounts and TexPool
• The city did an RFQ for banking and City National Bank won the bid with the highest interest rate (0.20 minimum) and no service charges.
2.39 2.211.92 2
1.76 1.751.53 1.6 1.59 1.45
0.97
0.17 0.16 0.17 0.16 0.11 0.12 0.12 0.13 0.11 0.1 0.1 0.08 0.070
0.51
1.52
2.5
3
1 Year US Treasury Yield CurveAs Of the Last Day of the Month
0
0.5
1
1.5
2
2.5
3
Rate Comparisons
Bank Rate TexPool TexPool Prime

Total Debt Service
Total Outstanding Debt at the end of FY 2020-2021
$17,524,686.00
Water & Sewer $10,751,984.00
Sales Tax (MEDC) $ 3,999,426.00
I&S (Property Tax) $ 2,773,276.00
Final Payment 2037 $-
$200,000.00
$400,000.00
$600,000.00
$800,000.00
$1,000,000.00
$1,200,000.00
$1,400,000.00
$1,600,000.00
FY20-21
FY21-22
FY22-23
FY23-24
FY24-25
FY25-26
FY26-27
FY27-28
FY28-29
FY29-30
FY30-31
FY31-32
FY32-33
FY33-34
FY34-35
FY35-36
FY36-37
Debt Service Payments
Wtr & Swe Sales Tax I&S Tax

Total Debt Serviceper Repayment Source
FY 2021
The city refinanced bonds at the end of fiscal year 2019, reducing total debt service
of almost $141,000.
Wtr & Sewer63%
Sales Tax19%
I&S Tax18%
FY 2020-2021
Wtr & Sewer
Sales Tax
I&S Tax

FY 2020 & 2021 - Total CARES Act funding for City of Mineola in response to the COVID-19 Pandemic was $266,365.00. The City actually expended more than what the grant was for, spending $296,235.33. We wanted to make sure to turn in every eligible expense so that if some were denied, we would still be able to qualify for the entire grant amount. The city was reimbursed the full $266,365.00
CARES ACT
Expense Type
Requested (Actual $$ Spent) Reimbursed Difference
Public Health Expenses 5,749.03$ 4,319.37$ (1,429.66)$ Economic Support Expenses 17,163.19$ 1,404.54$ (15,758.65)$ Expenses to Improve Telework Capabilities 10,207.46$ 10,153.93$ (53.53)$ Medical Costs 150.00$ ‐$ (150.00)$ Other Public Health Compliance Expenses 8,981.52$ 8,986.18$ 4.66$ Other Reasonably Necessary Expenses 19,730.76$ 7,247.61$ (12,483.15)$ Payroll for Publich Health and Safety 234,253.37$ 234,253.37$ ‐$
296,235.33$ 266,365.00$ (29,870.33)$
$- $50,000.00 $100,000.00 $150,000.00 $200,000.00 $250,000.00
Public Health Expenses
Economic Support Expenses
Expenses to Improve Telework Capabilities
Medical Costs
Other Public Health Compliance Expenses
Other Reasonably Necessary Expenses
Payroll for Publich Health and Safety
Chart Title
Reimbursed Requested (Actual $$ Spent)
Economic Support payments included $10,000 to Mineola Community Bank in support of the Small Town Strong project and $5,000 to the Mineola Civic Center for operations. Additionally, the City supported local restaurants during the shut-down by ordering meals for employees every week. The State saw this as a reasonable Economic Support request and reimbursed those dollars (minus tax and tips).