city of mesa, arizona - asu digital repository · pdf filecity of mesa, arizona ... prepared...
TRANSCRIPT

For the Fiscal Year EndedJune 30, 2016
City of Mesa, ArizonaComprehensive Annual Financial Report

Mayor John GilesCouncilmember Dave Richins – District 1Councilmember Alex Finter – District 2Vice Mayor Dennis Kavanaugh – District 3Councilmember Christopher Glover – District 4Councilmember David Luna – District 5Councilmember Kevin Thompson – District 6
Chris Brady, City ManagerKari Kent, Deputy City ManagerJohn Pombier, Deputy City Manager
Prepared by: Financial Services Department P.O. Box 1466 Mesa, Arizona 85211-1466 (480) 644-2275www.mesaaz.gov

Citizens of Mesa
Mayor and City Council
City Clerk DeeAnn Mickelsen
City Court Matt Tafoya
City Attorney Jim Smith
CITY MANAGER Chris Brady
City Auditor Jennifer Ruttman
Advisory Boards and Committees
Assistant City Manager Kari Kent
Development Services Christine Zielonka
Energy Resources Frank McRae
Engineering Beth Huning
Parks, Recreation & Community Facilities
Marc Heirshberg
Transportation Lenny Hulme
Water Resources Dan Cleavenger
Transit Jodi Sorrell
Chief Innovation Officer Alex Deshuk
Communications Randy Thompson
Information Technology Diane Gardner
Office of Management and Budget
Candace Cannistraro
Business Services Ed Quedens
Regional Communications Broadband
Enterprise Resource Planning (ERP) Valerie McBrien
Arts & Culture Cindy Ornstein
Library Heather Wolf
Fleet Services Pete Scarafiotti
Assistant City Manager John Pombier
Fire & Medical Department Harry Beck
Human Resources Gary Manning
Police Department John Meza
Public Information & Communications
Steve Wright
Environmental Management & Sustainability Scott Bouchie
Business Technology Innovation
Deputy City Manager
Natalie Lewis
Falcon Field Corinne Nystrom
Community Services
Ruth Giese
Downtown Coordination, DMA
Economic Development Bill Jabjiniak
Deputy City Manager
Scott J. Butler
Chief Financial Officer
Michael Kennington
Financial Services Irma Ashworth
Regional Initiatives, Maricopa Association of
Governments
Grants
Mesa Counts on College Amy Trethaway
Mayor and City Council Support
U.S. Conference of Mayors/ National League of Cities
Federal and State Affairs

Introductory SectionComprehensive Annual Financial Report2016

TABLE OF CONTENTS
I
Exhibit Page SECTION I – INTRODUCTORY SECTION
Table of Contents I Letter of Transmittal V Certificate of Achievement for Excellence in Financial Reporting XI
SECTION II - FINANCIAL SECTION Independent Auditors’ Report 1 Management’s Discussion and Analysis 4 Basic Financial Statements
Government-wide Financial Statements
Statement of Net Position A-1 16 Statement of Activities A-2 17
Fund Financial Statements
Governmental Funds Financial Statements Balance Sheet A-3 19 Reconciliation of the Balance Sheet of Governmental Funds to the
Statement of Net Position A-4 20 Statement of Revenues, Expenditures and Changes in Fund Balances A-5 21 Reconciliation of the Statement of Revenues, Expenditures and
Changes in Fund Balances of Governmental Funds to the Statement of Activities A-6 22
Proprietary Funds Financial Statements
Statement of Net Position A-7 23 Statement of Revenues, Expenses and Changes in Net Position A-8 25 Statement of Cash Flows A-9 27
Fiduciary Funds Financial Statements
Statement of Fiduciary Assets and Liabilities A-10 29

TABLE OF CONTENTS (Continued)
II
Exhibit Page Notes to the Financial Statements
Note 1 – Summary of Significant Accounting Policies 30 Note 2 – Reconciliation of Governmental Fund Financial
Statements to Government-wide Financial Statements 41 Note 3 – Fund Balance 48 Note 4 – Pooled Cash and Investments 49 Note 5 – Accounts Receivable and Due from Other Governments 53 Note 6 – Interfund Receivables, Payables and Transfers 55 Note 7 – Capital Assets 56 Note 8 – Long-term Obligations 59 Note 9 – Refunded, Refinanced and Defeased Obligations 71 Note 10 – Self-Insurance Internal Service Fund 73 Note 11 – Commitments and Contingent Liabilities 74 Note 12 – Net Position 75 Note 13 – Enterprise Activities Operations Detail 76 Note 14 – Joint Ventures 76 Note 15 – Retirement and Pension Plans 79 Note 16 – Post-Employment Benefits 91
Required Supplementary Information
Schedule of the City’s Proportionate Share of Net Pension Liability
Cost-Sharing Pension Plan B-1 95 Schedule of Changes in the City’s Net Pension Liability and Related Ratios
Agent Pension Plans B-2 96 Schedule of City Pension Contributions B-3 98 Notes to Pension Plan Schedules 99 Schedule of Agent Other Post-Employment Benefits Plan’s
Funding Progress B-4 100 Schedule of Other Post-Employment Benefits Plan’s Funding Progress B-5 101 Budgetary Comparison Schedule – General Fund B-6 102 Notes to Budgetary Comparison Schedules 103

TABLE OF CONTENTS (Continued)
III
Exhibit Page Combining Statements
Non-Major Governmental Funds
Combining Balance Sheet C-1 104 Combining Statement of Revenues, Expenditures and Changes in
Fund Balances C-2 108 Internal Service Funds
Combining Statement of Net Position C-3 112 Combining Statement of Revenues, Expenses and Changes in Net Position C-4 113 Combining Statement of Cash Flows C-5 114
Agency Fund
Statement of Changes in Assets and Liabilities C-6 115 Supplemental Information
Budgetary Comparison Schedules – Other Non-major Funds
Budgetary Comparison Schedule – Community Facilities District
Special Revenue Fund D-1 116 Budgetary Comparison Schedule – Environmental Compliance D-2 117 Budgetary Comparison Schedule – Grants and Special Programs D-3 118 Budgetary Comparison Schedule – Highway User Revenue D-4 119 Budgetary Comparison Schedule – Mesa Housing Authority D-5 120 Budgetary Comparison Schedule – Quality of Life Sales Tax D-6 121 Budgetary Comparison Schedule – Street Sales Tax D-7 122 Budgetary Comparison Schedule – Community Facilities District
Capital Projects D-8 123 Budgetary Comparison Schedule – General Capital Projects D-9 124 Budgetary Comparison Schedule – Streets D-10 125

TABLE OF CONTENTS (Concluded)
IV
Exhibit Page SECTION III – STATISTICAL SECTION
Financial Trends
Net Position by Components – Last Ten Fiscal Years (Accrual Basis of Accounting) I 126
Changes in Net Position – Last Ten Fiscal Years (Accrual Basis of Accounting) II 128 Fund Balance, Governmental Funds – Last Ten Fiscal Years (Modified Accrual
Basis of Accounting) III 134 Changes in Fund Balance, Governmental Funds – Last Ten Fiscal Years
(Modified Accrual Basis of Accounting) IV 136 Revenue Capacity
Sales Tax Collections by Category – Last Ten Fiscal Years V 138 Direct and Overlapping Sales Tax Rates – Last Ten Fiscal Years VI 140
Debt Capacity
Ratios of Outstanding Debt by Type – Last Ten Fiscal Years VII 141 Ratios of General Bonded Debt Outstanding – Last Ten Fiscal Years VIII 143 Direct and Overlapping Governmental Activities Debt IX 144 Legal Debt Margin Information – Last Ten Fiscal Years X 145 Pledged-Revenue Coverage – Last Ten Fiscal Years XI 147
Demographic and Economic Information
Demographic and Economic Statistics – Last Ten Fiscal Years XII 149 Principal Employers – Current Year and Ten Years Ago XIII 150
Operating Information
Full-Time Equivalent City Government Employees by Function/Program – Last
Ten Fiscal Years XIV 151 Operating Indicators by Function/Program – Last Ten Fiscal Years XV 153 Capital Asset Statistics by Function/Program – Last Ten Fiscal Years XVI 155

V
Financial Services Department December 15, 2016 To the Citizens, Honorable Mayor, City Council and City Manager: The Comprehensive Annual Financial Report of the City of Mesa (the “City”) for the fiscal year ended June 30, 2016 is hereby submitted. Prepared by the Financial Services Department, this report consists of management’s representations concerning the finances of the City of Mesa. Consequently, management assumes full responsibility for the completeness and reliability of all of the information presented in this report. To provide a reasonable basis for making these representations, management of the City has established a comprehensive internal control framework that is designed both to protect the government’s assets from loss, theft, or misuse and to compile sufficient reliable information for the preparation of the City’s financial statements in conformity with accounting principles generally accepted in the United States of America. Because the cost of internal controls should not outweigh their benefits, the City’s comprehensive framework of internal controls has been designed to provide reasonable rather than absolute assurance that the financial statements will be free from material misstatement. As management, we assert that, to the best of our knowledge and belief, this financial report is complete and reliable in all material respects. The City’s financial statements have been audited by CliftonLarsonAllen, LLP, a firm of licensed certified public accountants. The goal of the independent audit was to provide reasonable assurance that the basic financial statements of the City for the fiscal year ended June 30, 2016, are free of material misstatement. The independent audit involved examining, on a test basis, evidence supporting the amounts and disclosures in the financial statements; assessing the accounting principles used and significant estimates made by management; and evaluating the overall financial statement presentation. The independent auditor concluded, based upon the audit that there was a reasonable basis for rendering an unmodified opinion that the City’s financial statements for the fiscal year ended June 30, 2016, are fairly presented in conformity with accounting principles generally accepted in the United States of America. The independent auditor’s report is presented as the first component of the financial section of this report. The independent audit of the financial statements of the City was part of a broader, federally mandated “Single Audit” designed to meet the special needs of federal grantor agencies. The standards governing Single Audit engagements require the independent auditor to report not only on the fair presentation of the financial statements, but also on the audited government’s internal controls and compliance with legal requirements, with special emphasis on internal controls and legal requirements involving the administration of federal awards. These reports are available in the City’s separately issued Single Audit Report.
Accounting principles generally accepted in the United States of America require that management provide a narrative introduction, overview, and analysis to accompany the basic financial statements in the form of Management’s Discussion and Analysis (MD&A) and should be read in
VI
conjunction with it. The City’s MD&A can be found immediately following the report of the independent auditors. Profile of the City The City was founded in 1878 and incorporated July 15, 1883 with an approximate population of 300 and an area of one square mile. Today, the City’s estimated population is 475,274 compared with the 2010 decennial census count of 439,041, within an incorporated area of approximately 141 square miles. Total land area encompasses 182 square miles. The City is the 38th largest city in the United States and is the third largest city in the State of Arizona. Mesa is located 16 miles east of Phoenix, the State Capitol. The City operates under a charter form of government with citizens electing a Mayor and six Councilmembers to set policy for the City. City Councilmembers are elected from districts and serve terms of four years, with three members being elected every two years. The Mayor is elected at-large every four years. The Mayor and Council are elected on a non-partisan basis, and the Vice Mayor is selected by the City Council. The Mayor and City Council are responsible for appointing the City Manager, City Attorney, City Auditor, City Clerk and the Presiding City Magistrate. The City Manager has full responsibility for carrying out City Council policies and administering City operations and is responsible for the hiring of City employees. Additionally, City employees are hired under merit system procedures as specified in the City Charter. An allocated staff of 3,798 full-time (equivalent) City employees working within twenty-eight different City departments undertakes the various functions of Mesa’s city government and its operation. The City provides a full range of municipal services, including police and fire protection, parks and recreation, library, transportation, health and certain social services and general administration; and, the City owns and operates enterprises including operations of electric, gas, water, wastewater, solid waste, airport and a golf course. The Mesa Art Center, which includes 212,755 square feet of performing arts, visual arts and art education facilities, is the largest comprehensive arts campus in the state. The Mesa Art Center was awarded the Venue Excellence Award by the International Association of Venue Managers. This prestigious award recognizes venues such as stadiums, convention centers, arenas, performing arts centers, and academic institutions that demonstrate excellence in the following four criteria: service to the community, team building/professional development, safety and security, and operational excellence. The annual budget serves as the foundation for the City’s financial planning and control. Historical data is analyzed during the creation of a multi-year financial forecast. The forecast provides a framework to assist Mesa’s elected officials and executive team make important decisions about the direction of the City. The City Council sets the City’s long-term strategic direction and provides staff with budget priorities for the upcoming fiscal year. A proposed budget is presented to the City Council for review and discussion in mid spring with the final adoption of the operating budget by resolution in late spring. The City of Mesa begins the fiscal year on July 1st.

VII
Legal control over the budget derives from State statutes that prohibit the City from exceeding its adopted budget in total, and from the resolution itself that sets the limit. The residents of Mesa approved a Home Rule exemption to the State of Arizona’s expenditure limitation requirement. The City can determine the budget level as long as the City can identify resources to cover the expenses. The budget appropriated by the City Council consists of all planned expenditures and the associated resources to cover them. While the State does not require trust fund expenditures to be appropriated, the City chooses to include them in order to fully represent City activity. Factors Affecting Financial Condition The information presented in the financial statements is perhaps best understood when it is considered from the broader perspective of the specific environment within which the City operates. Local Economy The City’s economic indicator for residential construction in fiscal year (FY) 15/16 is up 45% from FY 14/15. Commercial construction increased 16% in FY 15/16 over the previous year. During FY 15/16 the City issued 2,066 permits for new residential construction. This is 43% more than the previous fiscal year. The corresponding dollar valuation associated with all FY 15/16 permits increased approximately $280 million from the prior fiscal year. Analysis of the recent data indicates a continued increase in construction activity in both the residential and commercial sectors. Activity levels have been increasing for the past six years and may indicate some level of sustained recovery from the economic slowdown of the prior years. The increase in construction activity resulted in an associated increase in sales tax revenues. For the year ending June 30, 2016, retail sales tax was up 6.4% while overall sales tax revenues were up 4.4%. Tourism also increased as evidence by a 12.1% increase in the transient lodging (‘bed’) tax. Other financial resources followed the economy’s continuation of a slow and steady recovery. The City incorporated this in the preparation of the FY 16/17 budget. Conservative budget practices and willingness to respond to economic indicators continues to allow the City to maintain unrestricted fund balance reserve levels as established in the City’s financial policies. The FY 16/17 budget continues the City’s fiscally conservative approach and reinforces the City’s effort to invest in economic development, improve public safety and attract and retain excellent employees. All fund balances were maintained at or above the levels prescribed by financial policy and prudent practice. Major Initiatives During the year, various major accomplishments were realized. Some of these were:

VIII
• Mesa launched its open data portal in March to celebrate open data day. The portal makes it easier for citizens to access data, increases transparency and provides information about the progress Mesa is making towards addressing city-wide priorities. The City of Mesa as part of What Works Cities, an initiative of Bloomberg Philanthropies, has committed to using data and evidence based practices to improve the lives of Mesa residents. The open data portal plays an integral role in Mesa’s efforts by providing easy access to data the City is using to measure progress towards the Mayor and Council’s priorities.
• In March 2016, the site plans for the expansion of the A.T. Still University campus in Mesa were approved. The expansion would add a 122,000 square feet three-story academic building and parking garage to the 195,000 square feet incorporated in the four existing buildings.
• In April 2016, Santander Consumer USA held a grand opening and ribbon cutting ceremony at Centrica, a creative adaptive reuse project in Mesa’s Fiesta District. Santander Consumer USA, a full-service, technology-driven consumer finance company focuses on vehicle finance, third-party servicing and delivering superior service to more than 2.7 million customers across the full credit spectrum. They currently employ 188 people at its Mesa location and plan to employ more than 970 over three years. Santander Consumer USA, based in Dallas, is an established U.S consumer finance company opening its first office in Arizona, and is leasing the entire 117,000 square foot Centrica project. Centrica was transformed from a vacant retail center into single story Class A creative office space with more than 700 parking spots and redundant fiber optic backbone connectivity.
• In March 2016, Arizona-based Ensemble Real Estate Solutions & Investments purchased the 12-story, 276-room Phoenix Marriott Mesa hotel located in downtown Mesa. Ensemble will maintain the Marriott brand and will invest $13 million to renovate the property. Ensemble plans a “top to bottom” renovation to include all public spaces, guestrooms, food and beverage outlets and pre-function/function spaces. The majority of the renovations will be implemented during the summer of 2017 to position the property for the 2017 / 2018 peak season.
• In June 2016, H Mart, an upscale Asian-American supermarket chain, announced it will open its first Arizona store in the 63,000 square foot former Albertson’s building in Mesa. H Mart will invest more than $7 million in renovations in its flagship Arizona store and will employ approximately 100 people. The new store will stock more than 40,000 items featuring a wide variety of Asian, Hispanic and American foods and related products. The store will also include a pharmacy, cosmetics store, gift shop and an Asian food court with as many as seven restaurants and a Korean bakery.
• The Boeing Apache center continues to see brisk demand with the announcement of two major contracts. Boeing announced a $1.5 billion contract with the United States in April 2016 to remanufacture 117 AH-64D Apaches to the new, more capable AH-64E model. In June 2016, Boeing announced a $667 million contract to supply Qatar with 24 AH-64E Apache helicopters.

IX
• In June 2016, Dexcom, Inc., a leader in continuous glucose monitoring for patients with diabetes, announced that it will construct a new state of the art manufacturing facility in Mesa, Arizona for the company’s global manufacturing operations and is projected to create more than 500 jobs over the next several years. The company expects initial manufacturing operations in this facility to commence in the second quarter of 2017.
• In July 2016, Phoenix-Mesa Gateway Airport broke passenger records for three months in a row (108K in May, 127K in June, and 132K in July). Phoenix-Mesa Gateway Airport projects to have more than 1.4 million passengers this year. Also, the General Aviation Center at the airport is undergoing renovations, adding 3,900 square feet to its restaurant space with the addition of Barrio Brewing Company.
• In August 2016, LGE Design Build started construction on a new 33,000-square-foot distribution center for WireMasters, a distributor of wire cable and associated electrical components for cable harnesses serving the military, aerospace and defense industry. The new distribution center, expected to be complete in early 2017, will serve the southwestern United States.
• In the fall of 2016, Benedictine University (BenU) at Mesa began its fourth fall semester with a campus record 387 traditional undergraduate students. The University currently offers 10 intercollegiate sports. In January 2017, BenU at Mesa students will have access to single or double suites in the former, and recently converted, Alhambra Hotel. Amenities such as study areas, lounges, a café, kitchens, laundry and exercise rooms, an outdoor commons area, patio space and parking will be included.
• In September 2016, a grand opening ceremony was held for Southern Avenue Villas in Mesa’s Fiesta District, the first major apartment development in the District in more than 20 years. The complex has eight buildings that are three stories each. The development has several significant amenities such as a cabana for social gatherings; a large pool with a spa, shade canopy and tanning ledge; a spacious clubhouse with indoor basketball, fitness center, business center, game room and large clubroom; a sand volleyball court; and a dog park.
Awards and Acknowledgements The Government Finance Officers Association (GFOA) awarded a Certificate of Achievement for Excellence in Financial Reporting to the City for its comprehensive annual financial report for the fiscal year ended June 30, 2015. In order to be awarded a Certificate of Achievement, the City published an easily readable and efficiently organized comprehensive annual financial report. This report satisfied both accounting principles generally accepted in the United States of America and applicable legal requirements. A Certificate of Achievement is valid for a period of one year only. We believe that our current comprehensive annual financial report continues to meet the Certificate of Achievement Program’s requirements, and we are submitting it to the GFOA to determine its eligibility for another certificate.


Financial SectionComprehensive Annual Financial Report2016

CliftonLarsonAllen LLPCLAconnect.com
(1)
INDEPENDENT AUDITORS’ REPORT
The Honorable Mayor and Members of City CouncilCity of Mesa, Arizona
Report on the Financial Statements
We have audited the accompanying financial statements of the governmental activities, the business-type activities, each major fund, and the aggregate remaining fund information of the City of Mesa, Arizona (City) as of and for the year ended June 30, 2016, and the related notes to the financial statements, which collectively comprise the City’s basic financial statements as listed in the table of contents.
Management’s Responsibility for the Financial Statements
Management is responsible for the preparation and fair presentation of these financial statements in accordance with accounting principles generally accepted in the United States of America; this includes the design, implementation, and maintenance of internal control relevant to the preparation and fair presentation of financial statements that are free from material misstatement, whether due to fraud or error.
Auditors’ Responsibility
Our responsibility is to express opinions on these financial statements based on our audit. We conducted our audit in accordance with auditing standards generally accepted in the United States of America and the standards applicable to financial audits contained in Government Auditing Standards, issued by the Comptroller General of the United States. Those standards require that we plan and perform the audit to obtain reasonable assurance about whether the financial statements are free from material misstatement.
An audit involves performing procedures to obtain audit evidence about the amounts and disclosures in the financial statements. The procedures selected depend on the auditors’ judgment, including the assessment of the risks of material misstatement of the financial statements, whether due to fraud or error. In making those risk assessments, the auditor considers internal control relevant to the entity’s preparation and fair presentation of the financial statements in order to design audit procedures that are appropriate in the circumstances, but not for the purpose of expressing an opinion on the effectiveness of the entity’s internal control. Accordingly, we express no such opinion. An audit also includes evaluating the appropriateness of accounting policies used and the reasonableness of significant accounting estimates made by management, as well as evaluating the overall presentation of the financial statements.
We believe that the audit evidence we have obtained is sufficient and appropriate to provide a basis for our audit opinions.
The Honorable Mayor and Members of City CouncilCity of Mesa, Arizona
(2)
Opinions
In our opinion, the financial statements referred to above present fairly, in all material respects, the respective financial position of the governmental activities, the business-type activities, each major fund, and the aggregate remaining fund information of the City of Mesa, Arizona as of June 30, 2016, and the respective changes in financial position and, where applicable, cash flows thereof for the year then ended in accordance with accounting principles generally accepted in the United States of America.
Other Matters
Required Supplementary Information
Accounting principles generally accepted in the United States of America require that the management’s discussion and analysis, the Schedule of the City’s Proportionate Share of Net Pension Liability, Schedule of Changes in the City’s Net Pension Liability and Related Ratios, Schedule of City Pension Contributions, Schedule of Agent Other Post-Employment Benefits Plan’s Funding Progress, the Schedule of Other Post Employment Benefit Plan’s Funding Progress and the budgetary comparison information, as listed in the table of contents, be presented to supplement the basic financial statements. Such information, although not a part of the basic financial statements, is required by the Governmental Accounting Standards Board who considers it to be an essential part of financial reporting for placing the basic financial statements in an appropriate operational, economic, or historical context. We have applied certain limited procedures to the required supplementary information in accordance with auditing standards generally accepted in the United States of America, which consisted of inquiries of management about the methods of preparing the information and comparing the information for consistency with management’s responses to our inquiries, the basic financial statements, and other knowledge we obtained during our audit of the basic financial statements. We do not express an opinion or provide any assurance on the information because the limited procedures do not provide us with sufficient evidence to express an opinion or provide any assurance.
Supplementary and Other Information
Our audit was conducted for the purpose of forming opinions on the financial statements that collectively comprise the City of Mesa, Arizona’s basic financial statements. The combining and individual fund financial statements and schedules and the introductory and statistical sections arepresented for purposes of additional analysis and are not a required part of the basic financial statements.
The combining and individual fund financial statements and schedules are the responsibility of management and were derived from and relates directly to the underlying accounting and other records used to prepare the basic financial statements. Such information has been subjected to the auditing procedures applied in the audit of the basic financial statements and certain additional procedures, including comparing and reconciling such information directly to the underlying accounting and other records used to prepare the basic financial statements or to the basic financial statements themselves, and other additional procedures in accordance with auditing standards generally accepted in the United States of America. In our opinion, the combining and individual fund financial statements and schedules are fairly stated, in all material respects, in relation to the basic financial statements as a whole.
The introductory and statistical sections have not been subjected to the auditing procedures applied in the audit of the basic financial statements, and accordingly, we do not express an opinion or provide any assurance on it.

The Honorable Mayor and Members of City CouncilCity of Mesa, Arizona
(3)
Other Reporting Required by Government Auditing StandardsIn accordance with Government Auditing Standards, we have also issued our report dated December 15, 2016, on our consideration of the City of Mesa, Arizona’s internal control over financial reporting and on our tests of its compliance with certain provisions of laws, regulations, contracts, and grant agreements and other matters. The purpose of that report is to describe the scope of our testing of internal control over financial reporting and compliance and the result of that testing, and not to provide an opinion on internal control over financial reporting or on compliance. That report is an integral part of an audit performed in accordance with Government Auditing Standards in considering the City of Mesa, Arizona’s internal control over financial reporting and compliance.
aPhoenix, ArizonaDecember 15, 2016
4
MANAGEMENT’S DISCUSSION AND ANALYSIS As management of the City of Mesa, Arizona (the City), we offer this discussion and analysis of the financial activities of the City for the fiscal year ended June 30, 2016. This discussion and analysis is designed to 1) assist the reader in focusing on significant financial issues, 2) provide an overview of the City’s financial activities, 3) identify changes in the City’s financial position, 4) identify any material deviations from the financial plan (the approved annual budget), and 5) identify individual fund issues and concerns. The management’s discussion and analysis should be read in conjunction with the transmittal letter presented on pages V-X, as well as the financial statements beginning on page 16 and the accompanying notes to the financial statements. FINANCIAL HIGHLIGHTS The City’s net position at the end of the fiscal year was $890.5 million. The City’s total net position
increased by $16.2 million from $874.3 million in fiscal year 2015.
The City’s total revenues decreased by $21.9 million from $919.1 million to $897.2 million. The decrease is primarily from Capital Grants and Contributions, specifically related to developer contributions.
As of the end of fiscal year 2016, the City’s governmental funds reported a combined ending fund balance of $219 million, a $61.4 million decrease from the previous year. The decrease is primarily related to the $77.8 million pay-off of Highway Project Advancement Notes.
The City’s governmental fund balance is reported in one of five categories. Approximately 54.3% of the total fund balance amount, or $119 million, is designated by the City as committed, assigned, or unassigned. The remaining 45.7% or $100 million is designated as non-spendable or restricted.
The City’s total long-term liabilities increased by $67 million to $2.9 billion at June 30, 2016. Increase is related to new bond issuances, net of amounts refinanced and paid off; increase in post-employment benefit liabilities; and increase in pension liabilities.
OVERVIEW OF THE FINANCIAL STATEMENTS This management discussion and analysis serves as an introduction to the City’s basic financial statements. The City’s basic financial statements are comprised of three components: government-wide financial statements, fund financial statements, and notes to the financial statements. This report also contains other supplementary information in addition to the basic financial statements. Government-Wide Financial Statements The government-wide financial statements (pages 16-18) are designed to provide a broad overview of the City’s finances in a manner similar to private businesses. All the activities of the City, except fiduciary activities, are included in these statements. The statement of net position, Exhibit A-1, presents information on all the City’s assets, deferred outflows of resources, liabilities, and deferred inflows of resources with the difference being reported as net position. Over time increases and decreases in net position may serve as a useful indicator of whether the financial position of the City is improving or deteriorating. The statement of activities, Exhibit A-2, presents information showing how the City’s net position changed over the most recent fiscal year. All changes to net position are reported at the time that the underlying
5
event giving rise to the change occurs, regardless of the timing of the related cash flows. This is the accrual basis of accounting. Thus, revenues and expenses are reported in this statement for some items that will only result in cash flows in future fiscal periods. Both the Statement of Net Position and the Statement of Activities divide the functions of the City that are principally supported by taxes and intergovernmental revenues (Governmental Activities) from other functions that are intended to recover all or a significant portion of their cost through user fees and charges (Business-Type Activities): The governmental activities include the City’s basic services including general government
(administration), public safety, community environment and cultural-recreational. Taxes and general revenues generally support these activities.
The business-type activities include private sector type activities such as the City-owned electric,
gas, water, wastewater, and solid waste systems, as well as the City-owned airport, golf course, stadiums, convention center, and district cooling. These activities are primarily supported by user charges and fees.
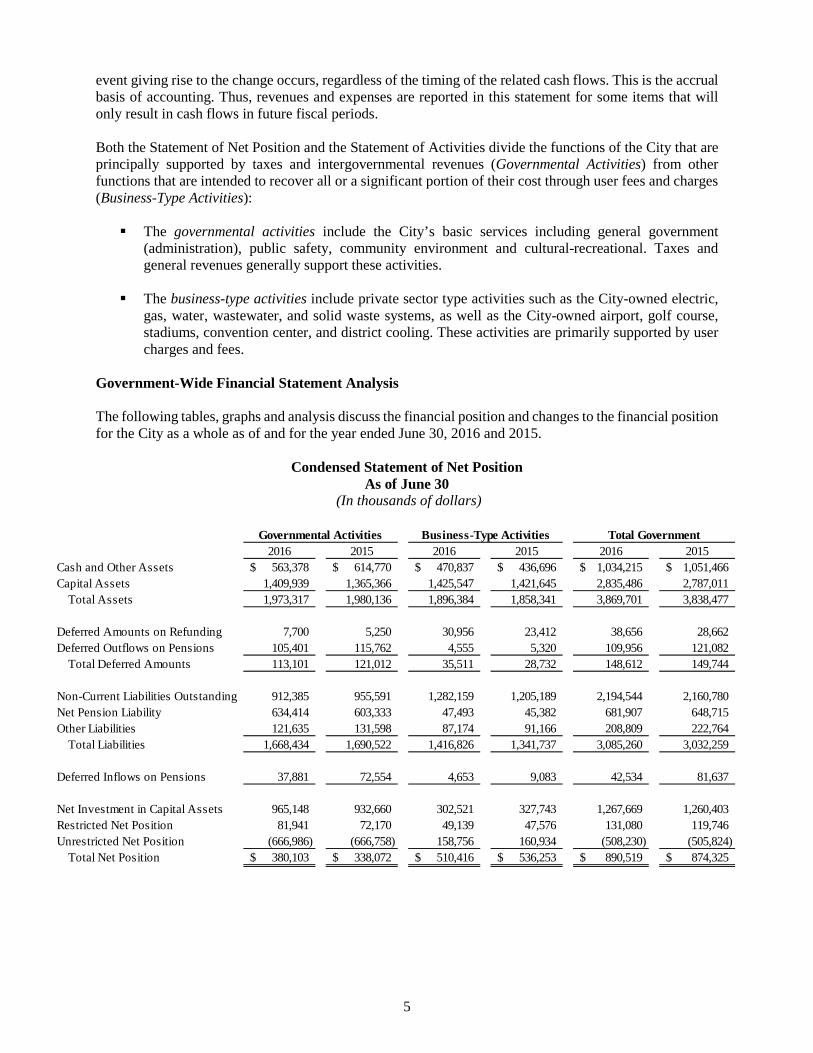
Government-Wide Financial Statement Analysis The following tables, graphs and analysis discuss the financial position and changes to the financial position for the City as a whole as of and for the year ended June 30, 2016 and 2015.
Condensed Statement of Net Position As of June 30
(In thousands of dollars)
2016 2015 2016 2015 2016 2015Cash and Other Assets 563,378$ 614,770$ 470,837$ 436,696$ 1,034,215$ 1,051,466$ Capital Assets 1,409,939 1,365,366 1,425,547 1,421,645 2,835,486 2,787,011
Total Assets 1,973,317 1,980,136 1,896,384 1,858,341 3,869,701 3,838,477
Deferred Amounts on Refunding 7,700 5,250 30,956 23,412 38,656 28,662 Deferred Outflows on Pensions 105,401 115,762 4,555 5,320 109,956 121,082
Total Deferred Amounts 113,101 121,012 35,511 28,732 148,612 149,744
Non-Current Liabilities Outstanding 912,385 955,591 1,282,159 1,205,189 2,194,544 2,160,780 Net Pension Liability 634,414 603,333 47,493 45,382 681,907 648,715 Other Liabilities 121,635 131,598 87,174 91,166 208,809 222,764
Total Liabilities 1,668,434 1,690,522 1,416,826 1,341,737 3,085,260 3,032,259
Deferred Inflows on Pensions 37,881 72,554 4,653 9,083 42,534 81,637
Net Investment in Capital Assets 965,148 932,660 302,521 327,743 1,267,669 1,260,403 Restricted Net Position 81,941 72,170 49,139 47,576 131,080 119,746 Unrestricted Net Position (666,986) (666,758) 158,756 160,934 (508,230) (505,824)
Total Net Position 380,103$ 338,072$ 510,416$ 536,253$ 890,519$ 874,325$
Governmental Activities Business-Type Activities Total Government
6
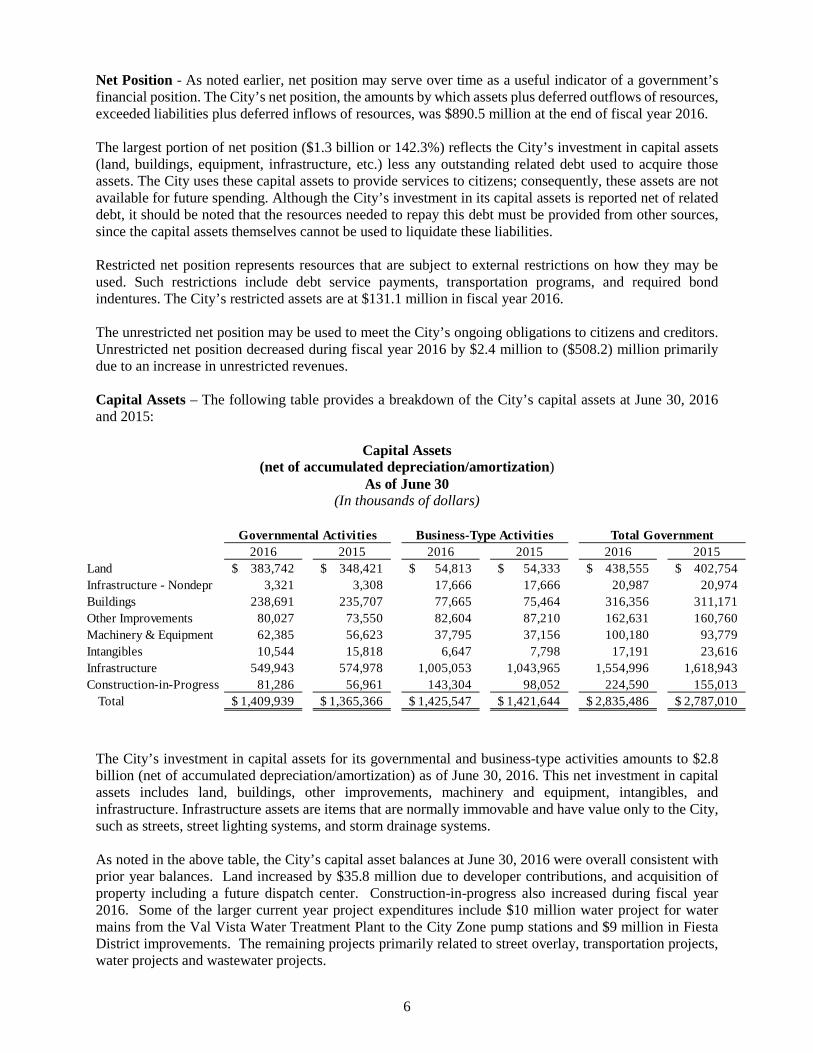
Net Position - As noted earlier, net position may serve over time as a useful indicator of a government’s financial position. The City’s net position, the amounts by which assets plus deferred outflows of resources, exceeded liabilities plus deferred inflows of resources, was $890.5 million at the end of fiscal year 2016. The largest portion of net position ($1.3 billion or 142.3%) reflects the City’s investment in capital assets (land, buildings, equipment, infrastructure, etc.) less any outstanding related debt used to acquire those assets. The City uses these capital assets to provide services to citizens; consequently, these assets are not available for future spending. Although the City’s investment in its capital assets is reported net of related debt, it should be noted that the resources needed to repay this debt must be provided from other sources, since the capital assets themselves cannot be used to liquidate these liabilities. Restricted net position represents resources that are subject to external restrictions on how they may be used. Such restrictions include debt service payments, transportation programs, and required bond indentures. The City’s restricted assets are at $131.1 million in fiscal year 2016. The unrestricted net position may be used to meet the City’s ongoing obligations to citizens and creditors. Unrestricted net position decreased during fiscal year 2016 by $2.4 million to ($508.2) million primarily due to an increase in unrestricted revenues. Capital Assets – The following table provides a breakdown of the City’s capital assets at June 30, 2016 and 2015:
Capital Assets (net of accumulated depreciation/amortization)
As of June 30 (In thousands of dollars)
2016 2015 2016 2015 2016 2015Land 383,742$ 348,421$ 54,813$ 54,333$ 438,555$ 402,754$ Infrastructure - Nondepr 3,321 3,308 17,666 17,666 20,987 20,974 Buildings 238,691 235,707 77,665 75,464 316,356 311,171 Other Improvements 80,027 73,550 82,604 87,210 162,631 160,760 Machinery & Equipment 62,385 56,623 37,795 37,156 100,180 93,779 Intangibles 10,544 15,818 6,647 7,798 17,191 23,616 Infrastructure 549,943 574,978 1,005,053 1,043,965 1,554,996 1,618,943 Construction-in-Progress 81,286 56,961 143,304 98,052 224,590 155,013
Total 1,409,939$ 1,365,366$ 1,425,547$ 1,421,644$ 2,835,486$ 2,787,010$
Total GovernmentGovernmental Activities Business-Type Activities
The City’s investment in capital assets for its governmental and business-type activities amounts to $2.8 billion (net of accumulated depreciation/amortization) as of June 30, 2016. This net investment in capital assets includes land, buildings, other improvements, machinery and equipment, intangibles, and infrastructure. Infrastructure assets are items that are normally immovable and have value only to the City, such as streets, street lighting systems, and storm drainage systems. As noted in the above table, the City’s capital asset balances at June 30, 2016 were overall consistent with prior year balances. Land increased by $35.8 million due to developer contributions, and acquisition of property including a future dispatch center. Construction-in-progress also increased during fiscal year 2016. Some of the larger current year project expenditures include $10 million water project for water mains from the Val Vista Water Treatment Plant to the City Zone pump stations and $9 million in Fiesta District improvements. The remaining projects primarily related to street overlay, transportation projects, water projects and wastewater projects.

7
Debt Administration – The following schedule shows the outstanding long-term debt of the City as of June 30, 2016 and 2015.
Outstanding Long-term Debt As of June 30
(In thousands of dollars)
2016 2015 2016 2015 2016 2015General Obligation Bonds 350,560$ 336,716$ 390$ 474$ 350,950$ 337,190$ Utility System Revenue Bonds - - 1,063,710 1,007,455 1,063,710 1,007,455 Highway User Revenue Fund Bonds 92,895 100,285 - - 92,895 100,285 Excise Tax Obligations - - 94,060 94,060 94,060 94,060 Special Assessment Bonds
with Governmental Commitment 2,085 2,830 - - 2,085 2,830 Community Facility District 19,315 10,974 - - 19,315 10,974 Notes Payable - 77,835 1,985 2,116 1,985 79,951
Total 464,855$ 528,640$ 1,160,145$ 1,104,105$ 1,625,000$ 1,632,745$
Governmental Activities Business-Type Activities Total Government
At the end of the current fiscal year, the City had total outstanding debt of $1.6 billion. Of this amount, $445 million comprises debt backed by the full faith and credit of the City and $1.2 billion represents bonds secured by specified revenue sources (i.e., Utility System Revenue and Highway User Revenue). An additional amount of $21.4 million are special assessment and community facility district bonds where the City is contingently liable in the event that the assessment revenues are insufficient to satisfy the debt payments. The City’s outstanding long-term debt (considering new borrowings, debt retirements, and refunding) decreased $7.7 million. The change in debt includes new borrowings during the fiscal year totaling $137 million, refundings of $181.3 million, principal payments of $133.3 million, and payments to refund bond escrow agent of $192.9 million. The City’s current bond ratings are as follows: Standard and Poor’s Moody’s Investors Corporation Service General Obligation Bonds AA- Aa2 Highway User Revenue Bonds AA A2 Utility Systems Revenue Bonds AA- Aa2 The Arizona Constitution provides that the general obligation bonded indebtedness of a city for general municipal purposes may not exceed 6 percent of the secondary assessed valuation of the taxable property in that city. In addition to the 6 percent limitation for general municipal purpose bonds, cities may issue general obligation bonds up to an additional 20 percent of the secondary assessed valuation for supplying such city with water, artificial light, or sewers, and for the acquisition and development of land for open space preserves, parks, playgrounds and recreational facilities, public safety, law enforcement, fire and emergency services facilities, and streets and transportation facilities. The City’s total debt margin available at June 30, 2016 was $164.4 million in the 6% capacity and $201.7 million in the 20% capacity. Additional information on the City’s long-term obligations can be found in Note 8 of the notes to the basic financial statements and also Table X in the Statistical Section.

8
Changes in Net Position The following table shows the revenues and expenses of the City for the fiscal years ended June 30, 2016 and 2015.
Changes in Net Position Year Ended June 30
(In thousands of dollars)
2016 2015 2016 2015 2016 2015Program Revenues:
Charges for Services 81,866$ 73,398$ 346,331$ 333,292$ 428,197$ 406,690$ Operating Grants & Contributions 26,361 26,418 267 157 26,628 26,575 Capital Grants & Contributions 35,925 75,907 16,929 18,107 52,854 94,014
General Revenues:Sales Taxes 151,826 146,337 - - 151,826 146,337 Property Taxes 33,825 33,241 - - 33,825 33,241 Occupancy Taxes 2,331 2,081 1,161 999 3,492 3,080 Unrestricted Intergovernmental 149,350 145,266 - - 149,350 145,266 Contributions 44,928 47,761 - - 44,928 47,761 Unrestricted Investment Income 2,210 1,786 3,020 1,141 5,230 2,927 Gain on Disposal of Capital Assets - - (6,145) 233 (6,145) 233 Miscellaneous 6,008 7,844 1,039 5,157 7,047 13,001
Total Revenues 534,630 560,039 362,602 359,086 897,232 919,125
Governmental Activities Expenses:General Government 96,860 102,396 - - 96,860 102,396 Public Safety 305,376 302,633 - - 305,376 302,633 Community Environment 117,120 101,531 - - 117,120 101,531 Cultural-Recreational 54,967 52,430 54,967 52,430 Interest on Long-Term Debt 20,424 23,939 - - 20,424 23,939
Business-Type Activities:Electric - - 27,647 28,495 27,647 28,495 Gas - - 31,549 32,104 31,549 32,104 Water - - 95,574 101,863 95,574 101,863 Wastewater - - 73,877 71,161 73,877 71,161 Solid Waste - - 36,586 36,979 36,586 36,979 Airport - - 4,865 2,863 4,865 2,863 Golf Course - - 2,575 2,210 2,575 2,210 Convention Center - - 4,252 3,715 4,252 3,715 Hohokam Stadium/Fitch Complex - - 2,913 1,200 2,913 1,200 Cubs Stadium - - 5,271 8,581 5,271 8,581 District Cooling - - 1,182 885 1,182 885 Interest on Long-Term Debt - - - 4,124 - 4,124
Total Expenses 594,747 582,929 286,291 294,180 881,038 877,109
Increase (Decrease) in Net Position Before Transfers (60,117) (22,890) 76,311 64,906 16,194 42,016
Transfers 102,148 94,427 (102,148) (94,427) - -
Change in Net Position 42,031 71,537 (25,837) (29,521) 16,194 42,016
Total Net Position 338,072 266,535 536,253 565,774 874,325 832,309
Net Position - Ending 380,103$ 338,072$ 510,416$ 536,253$ 890,519$ 874,325$
Governmental Activities Business-Type Activities Total Government
9
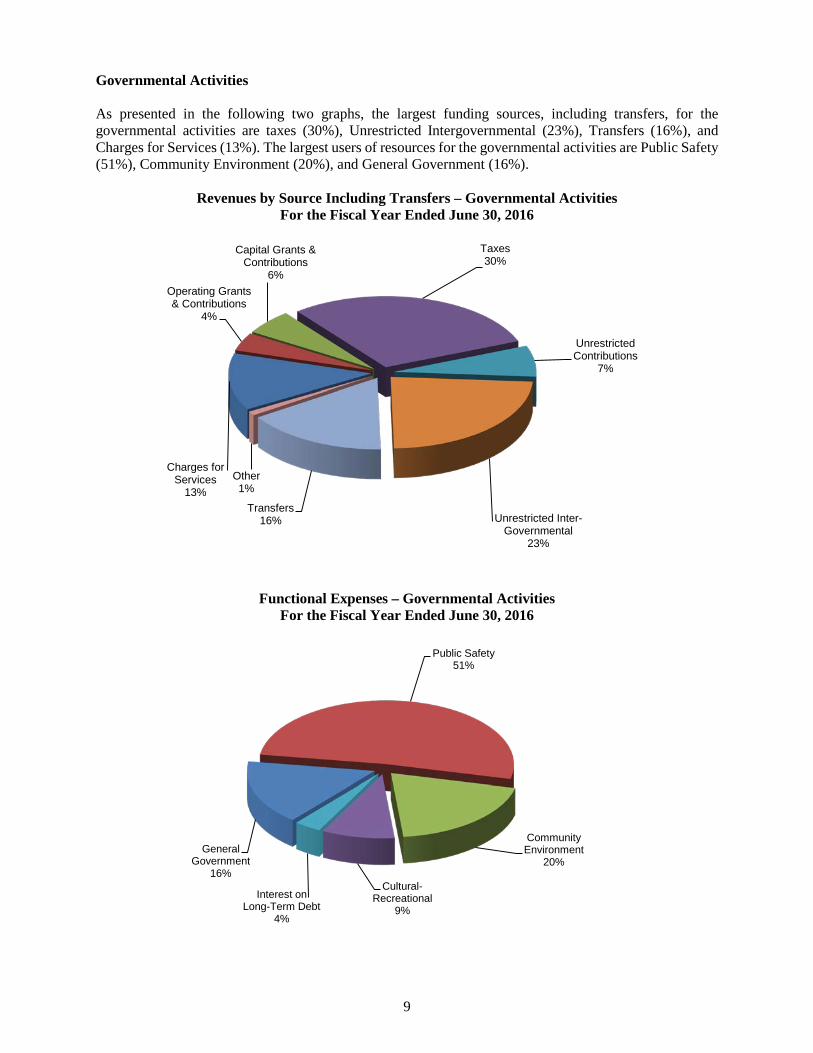
Governmental Activities As presented in the following two graphs, the largest funding sources, including transfers, for the governmental activities are taxes (30%), Unrestricted Intergovernmental (23%), Transfers (16%), and Charges for Services (13%). The largest users of resources for the governmental activities are Public Safety (51%), Community Environment (20%), and General Government (16%).
Revenues by Source Including Transfers – Governmental Activities For the Fiscal Year Ended June 30, 2016
Functional Expenses – Governmental Activities
For the Fiscal Year Ended June 30, 2016
Charges for Services
13%
Operating Grants & Contributions
4%
Capital Grants & Contributions
6%
Taxes30%
Unrestricted Contributions
7%
Unrestricted Inter-Governmental
23%
Transfers16%
Other1%
General Government
16%
Public Safety51%
Community Environment
20%
Cultural-Recreational
9%Interest on
Long-Term Debt4%

10
Governmental Activities Revenues For Fiscal Years 2016 and 2015
(In thousands of dollars)
Governmental Activities Functional Expenses For Fiscal Years 2016 and 2015
(In thousands of dollars)
$0
$20,000
$40,000
$60,000
$80,000
$100,000
$120,000
$140,000
$160,000
$180,000
$200,000
Program Revenues Taxes UnrestrictedIntergovernmental
Contributions Investment Miscellaneous
2016 2015
$0
$50,000
$100,000
$150,000
$200,000
$250,000
$300,000
$350,000
General Government Public Safety CommunityEnvironment
Cultural-Recreational Interest on Long-termDebt
2016 2015

11
The graphs on the previous page compare governmental activities revenues and expenses from fiscal year 2016 to fiscal year 2015. Total governmental activities revenues decreased $25.4 million from $560 million to $534.6 million. Total governmental expenses increased by $11.8 million from $582.9 million to $594.7 million.
Key factors in this change include:
Charges for services increased $8.5 million, sales taxes increased $5.5 million and Unrestricted Intergovernmental revenues increased $4.1 million. These increases are due to the continuing improvement in the local economy. However, there was a corresponding decrease in Capital Grants and Contributions of $40 million due to a decrease in developer contributions.
Increase in governmental expenditures is primarily related to capital outlay costs in the Community Facilities district, a blended component unit of the City.
Business-type Activities As presented in the following two graphs, the largest funding sources and users of resources for the business-type activities are Water, Wastewater, Solid Waste, Gas, and Electric.
Revenues by Source – Business-type Activities
-
20,000
40,000
60,000
80,000
100,000
120,000
140,000
Electric Gas Water Wastewater Solid Waste Other Programs
2016 2015

12
Functional Expenses – Business-Type Activities
Total business-type activities program and general revenues increased slightly by $3.5 million from $359.1 million to $362.6 million. The business-type activities total expenses decreased by $7.9 million from $294.2 million to $286.3 million. The largest decrease in expenses was in the water utility, and related to the joint venture activity.
Net (Expenses) Revenue – Business-Type Activities
-
10,000
20,000
30,000
40,000
50,000
60,000
Electric Gas Water Wastewater Solid Waste Other Programs
2016 2015
(10,000)
-
10,000
20,000
30,000
40,000
50,000
Electric Gas Water Wastewater Solid Waste Other Programs
2016 2015

13
Fund Financial Statements The fund financial statements are presented in Exhibits A-3 through A-10 beginning on page 19 of this report. A fund is a grouping of related accounts that is used to maintain control over resources that have been segregated for specific activities or objectives. The City uses fund accounting to ensure and demonstrate compliance with finance-related legal requirements as well as for managerial control to demonstrate fiduciary responsibility over the assets of the City. Traditional fund financial statements are presented for Governmental Funds (Exhibits A-3 through A-6), Proprietary Funds (Exhibits A-7 through A-9), and Fiduciary Funds (Exhibit A-10). Governmental funds – Governmental funds are used to account for essentially the same functions reported as governmental activities in the government-wide financial statements. However, unlike the government-wide financial statements, governmental fund financial statements focus on near-term inflows and outflows of spendable resources as well as on balances of spendable resources available at the end of the fiscal year. Such information is useful in evaluating the City’s near-term financing requirements. Since the governmental fund financial statements focus on near-term spendable resources, while the governmental activities on the government-wide financial statements have a longer-term focus, a reconciliation of the differences between the two is provided with the fund financial statements and also in Note 2 to the basic financial statements. Proprietary funds – The City maintains two different types of proprietary funds. Enterprise funds are used to report the same functions presented as business-type activities in the government-wide financial statements. Internal service funds are used to accumulate and allocate costs internally among the City’s various functions. The City uses internal service funds to account for its fleet support; materials and supplies; printing and graphics; property and public liability; workers’ compensation; and employee benefits self-insurance programs. Since the primary customers of the internal service funds are the governmental activities, the assets and liabilities of those funds are included in the governmental activities column of the government-wide statement of net position. The costs of internal service funds are allocated to the various user functions on the government-wide statement of activities. The proprietary fund financial statements are prepared on the same long-term focus as the government-wide financial statements. The enterprise funds provide the same information as the government-wide financial statements, only with more detail. The internal service funds are combined into a single column on the proprietary funds statements. Additional detail of the internal service funds can be found in the combining statements (Exhibits C-3 through C-5). Fiduciary funds – Fiduciary funds are used to account for resources held for the benefit of others outside the City government. Fiduciary funds are not reflected in the government-wide financial statements because the resources are not available to support the City’s programs. The fiduciary fund financial statement is prepared on the same basis as the government-wide and proprietary fund financial statements. Notes to the financial statements – The notes to the financial statements provide additional information that is essential to the full understanding of the data provided in the government-wide and fund financial statements and should be read with the financial statements. Other information – Governments have an option of including the budgetary comparisons statements for the General Fund as either part of the fund financial statements within the basic financial statements or as required supplementary information after the notes to the financial statements. The City has chosen to present the budgetary statements as required supplementary information beginning on page 102.

14
Fund Financial Statement Analysis As previously mentioned, the City uses fund accounting to ensure and demonstrate compliance with finance-related legal requirements. The following is a brief discussion of the financial highlights from the fund financial statements. Governmental Funds - The focus of the City’s governmental funds is to provide information on near-term inflows, outflows and balances of spendable resources. Such information is useful in assessing the City’s financing requirements. Unassigned fund balance may serve as a useful measure of a government’s net resources available for spending at the end of the fiscal year. The City’s governmental funds reported combined ending fund balance of $219 million, a $61.4 million decrease from the previous year. $95.9 million of this total amount is restricted, $28.8 million is committed, and $4.1 million in Nonspendable, thus the balances are not available for spending in the coming year. The decrease of $61.4 million in the governmental funds is primarily driven by the $77.8 million pay-off of the Highway Project Advancement Notes. Not considering the $77.8 million debt payment, the governmental funds had a $16.4 million increase in fund balance, primarily driven by General Fund activity. The General Fund is the chief operating fund of the City and accounts for many of the major functions of the government including general government, public safety, community environment and cultural-recreational. At the end of the current fiscal year, total fund balance of the General Fund was $94.8 million, while unassigned fund balance was $79.7 million. Total fund balance of the City’s General Fund increased by $16.9 million during the current fiscal year from $77.9 million to $94.8 million. This is primarily due to a decrease in transfers out in current year. Proprietary Funds - The City’s Enterprise Fund provides the same type of information as the government-wide financial statements, except in more detail. The total net position of the Enterprise Fund decreased by $25.9 million during the current fiscal year from $536.3 million to $510.4 million. The unrestricted net position of the Enterprise Fund amounted to $158.8 million. The decrease in current year is primarily related to transfers out to the General Fund. Budgetary Highlights The City’s annual budget is the legally adopted expenditure control document of the City. Budgetary comparison schedules are required for the General Fund and can be found in Exhibit B-6. This schedule compares the original adopted budget, the budget as amended throughout the year, and the actual expenditures prepared on a budgetary basis. Amendments to the adopted budget may occur throughout the year in a legally permissible manner (see Note 1.f. of the notes to the financial statements for more information on budget policies). No amendments increasing the City’s total adopted budget of $1.6 billion occurred during fiscal year 2016. General Fund revenues of $264.9 million, on a budgetary basis, were comparable to budgeted revenues of $270.2 million. Expenditures of $350 million were less than the budgeted expenditures of $383.1 million. Savings were primarily in general government and capital outlay.
15
ECONOMIC FACTORS In June 2016, the City Council approved a $1.7 billion budget, which is an increase of $60 million compared to prior year’s budget. The fiscal year 2017 budget includes $1.4 billion for operations and $258.6 million for scheduled bond capital improvements. The adopted fiscal year 2017 budget continues the City’s fiscally conservative approach to budget development, while still providing quality services to the citizens. Rather than simply surviving budget reductions, the City has reorganized and retooled to focus on community priorities and innovative approaches. The goal has been to help Mesa grow and prosper despite a challenging national, state, and local economy. REQUESTS FOR INFORMATION This financial report is designed to provide a general overview of the City of Mesa, Arizona’s finances for all those with an interest in the government’s finances. Questions concerning any of the information provided in this report or requests for additional financial information should be addressed to the City of Mesa Finance Director, P.O. Box 1466, Mesa, Arizona, 85211-1466.

Basic Financial SectionComprehensive Annual Financial Report2016

16
CITY OF MESA, ARIZONAEXHIBIT A-1STATEMENT OF NET POSITIONJUNE 30, 2016(in thousands)
Governmental Activities
Business-Type Activities Total
ASSETSPooled Cash and Investments 265,772$ 74,035$ 339,807$ Accounts Receivable, Net 23,734 26,291 50,025Accrued Interest Receivable 501 461 962Due from Other Governments 18,497 3,167 21,664Internal Balances (2,773) 2,773 -Inventory 5,897 - 5,897Prepaid Costs 3,444 1,732 5,176Deposits 827 45 872Restricted Assets:
Pooled Cash and Investments 10,900 115,149 126,049Cash with Fiscal Agent 37,579 40,390 77,969Cash with Trustee 8,761 61 8,822Accounts Receivable, Net 11,616 - 11,616Due from Other Governments 907 - 907Customer Deposits - 4,624 4,624Joint Venture Construction Deposits - 3,093 3,093
Investment in Joint Ventures 177,716 199,016 376,732Capital Assets, Not Being Depreciated 468,349 215,783 684,132Capital Assets, Being Depreciated, Net 941,590 1,209,764 2,151,354
Total Assets 1,973,317 1,896,384 3,869,701
DEFERRED OUTFLOWS OF RESOURCESDebt Refunding 7,700 30,956 38,656Pensions 105,401 4,555 109,956
Total Deferred Outflows of Resources 113,101 35,511 148,612
LIABILITIESAccounts Payable and Accrued Liabilities 26,044 5,874 31,918Claims Payable 38,448 - 38,448Customer and Defendant Deposits 6,916 - 6,916Compensated Absences 589 - 589Liabilities Payable from Restricted Assets 49,638 81,300 130,938Noncurrent Liabilities, Due Within One Year 35,487 25,775 61,262Noncurrent Liabilities, Due in More Than One Year 876,898 1,256,384 2,133,282Net Pension Liability 634,414 47,493 681,907
Total Liabilities 1,668,434 1,416,826 3,085,260
DEFERRED INFLOWS OF RESOURCESPensions 37,881 4,653 42,534
Total Deferred Inflows of Resources 37,881 4,653 42,534
NET POSITIONNet Investment in Capital Assets 965,148 302,521 1,267,669Restricted For:
Airport - 9,869 9,869Bond Indentures - 27,777 27,777Construction - 3,093 3,093Debt Service 24,822 8,390 33,212Public Safety 6,840 - 6,840Transportation Programs 47,818 - 47,818Other Programs 2,461 10 2,471
Unrestricted (666,986) 158,756 (508,230)Total Net Position 380,103$ 510,416$ 890,519$
Primary Government
The accompanying notes are an integral part of the financial statements.

17
CITY OF MESA, ARIZONAEXHIBIT A-2STATEMENT OF ACTIVITIESFOR THE FISCAL YEAR ENDED JUNE 30, 2016(in thousands)
Governmental Activities:General Government 96,860$ 9,278$ 493$ 6,167$ Public Safety 305,376 30,819 9,697 856 Community Environment 117,120 26,942 15,963 28,896 Cultural-Recreational 54,967 14,827 208 6 Interest on Long-Term Debt 20,424 - - -
Total Governmental Activities 594,747 81,866 26,361 35,925
Business-type Activities:Electric 27,647 32,254 8 281 Gas 31,549 38,962 4 915 Water 95,574 130,674 173 10,866 Wastewater 73,877 79,523 6 2,797 Solid Waste 36,586 55,354 74 - Airport 4,865 3,623 - 1,770 Golf Course 2,575 1,645 - - Convention Center 4,252 2,798 1 200 Hohokam Stadium/Fitch Complex 2,913 63 1 100 Cubs Stadium 5,271 201 - - District Cooling 1,182 1,234 - -
Total Business-type Activities 286,291 346,331 267 16,929
Total Government 881,038$ 428,197$ 26,628$ 52,854$
ExpensesFunctions/Programs:Charges for
Services
Capital Grants and
Contributions
Operating Grants and
Contributions
Program Revenues
Gain (Loss) on Sale of Capital Assets
Contributions Not Restricted to Specific Programs
General Revenues:Sales TaxesProperty TaxesOccupancy TaxesUnrestricted Intergovernmental Revenues
The notes to the financial statements are an integral part of this statement.
Investment Income
Miscellaneous Revenues (Expenses)Transfers
Total General Revenues and Transfers
Change in Net Position
Net Position - Ending
Net Position - Beginning

18
EXHIBIT A-2(Continued)
Governmental Activities *
Business-type Activities * Total
(80,922)$ -$ (80,922)$ (264,004) - (264,004) (45,319) - (45,319) (39,926) - (39,926) (20,424) - (20,424)
(450,595) - (450,595)
- 4,896 4,896 - 8,332 8,332 - 46,139 46,139 - 8,449 8,449 - 18,842 18,842 - 528 528 - (930) (930) - (1,253) (1,253) - (2,749) (2,749) - (5,070) (5,070) - 52 52 - 77,236 77,236
(450,595) 77,236 (373,359)
151,826 - 151,826 33,825 - 33,825 2,331 1,161 3,492
149,350 - 149,350 44,928 - 44,928 2,210 3,020 5,230
- (6,145) (6,145) 6,008 1,039 7,047
102,148 (102,148) - 492,626 (103,073) 389,553
42,031 (25,837) 16,194
338,072 536,253 874,325
380,103$ 510,416$ 890,519$
Net (Expense) Revenue and Changes in Net PositionPrimary Government
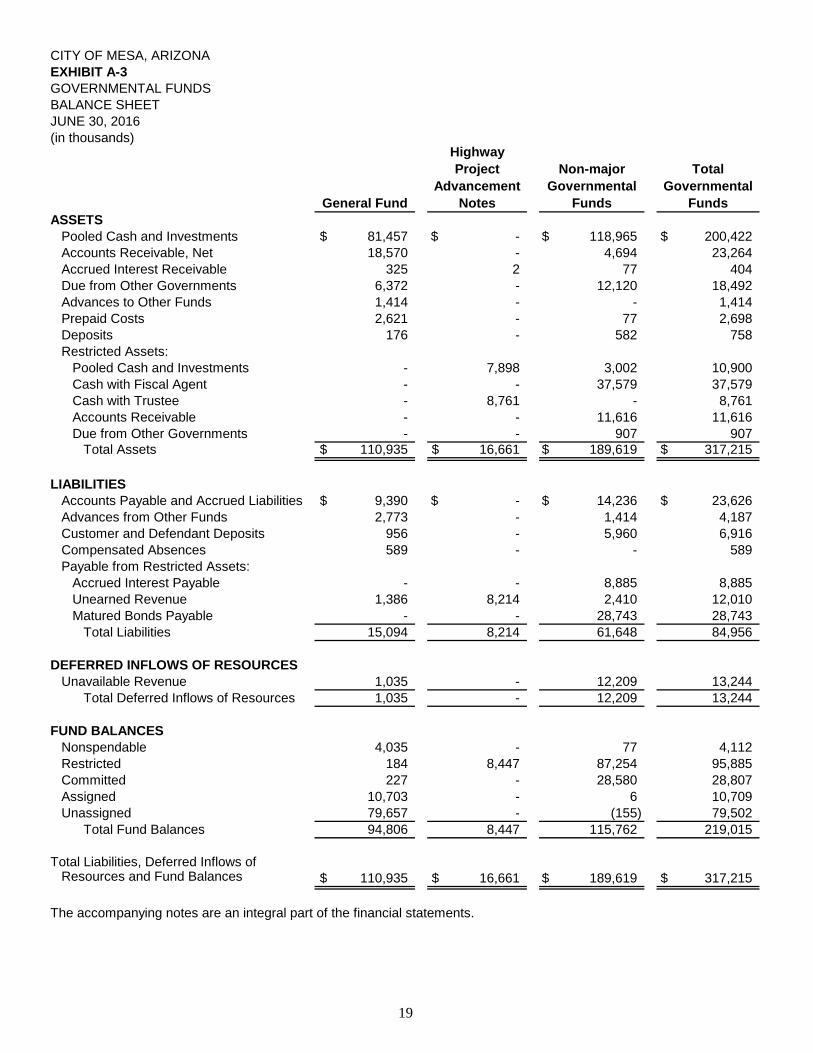
19
General Fund
Highway Project
Advancement Notes
Non-major Governmental
Funds
Total Governmental
FundsASSETS
Pooled Cash and Investments 81,457$ -$ 118,965$ 200,422$ Accounts Receivable, Net 18,570 - 4,694 23,264Accrued Interest Receivable 325 2 77 404Due from Other Governments 6,372 - 12,120 18,492Advances to Other Funds 1,414 - - 1,414Prepaid Costs 2,621 - 77 2,698Deposits 176 - 582 758Restricted Assets:
Pooled Cash and Investments - 7,898 3,002 10,900Cash with Fiscal Agent - - 37,579 37,579Cash with Trustee - 8,761 - 8,761Accounts Receivable - - 11,616 11,616Due from Other Governments - - 907 907
Total Assets 110,935$ 16,661$ 189,619$ 317,215$
LIABILITIESAccounts Payable and Accrued Liabilities 9,390$ -$ 14,236$ 23,626$ Advances from Other Funds 2,773 - 1,414 4,187Customer and Defendant Deposits 956 - 5,960 6,916Compensated Absences 589 - - 589Payable from Restricted Assets:
Accrued Interest Payable - - 8,885 8,885Unearned Revenue 1,386 8,214 2,410 12,010Matured Bonds Payable - - 28,743 28,743
Total Liabilities 15,094 8,214 61,648 84,956
DEFERRED INFLOWS OF RESOURCESUnavailable Revenue 1,035 - 12,209 13,244
Total Deferred Inflows of Resources 1,035 - 12,209 13,244
FUND BALANCESNonspendable 4,035 - 77 4,112Restricted 184 8,447 87,254 95,885Committed 227 - 28,580 28,807Assigned 10,703 - 6 10,709Unassigned 79,657 - (155) 79,502
Total Fund Balances 94,806 8,447 115,762 219,015
Total Liabilities, Deferred Inflows ofResources and Fund Balances 110,935$ 16,661$ 189,619$ 317,215$
The accompanying notes are an integral part of the financial statements.
(in thousands)
CITY OF MESA, ARIZONAEXHIBIT A-3GOVERNMENTAL FUNDSBALANCE SHEETJUNE 30, 2016
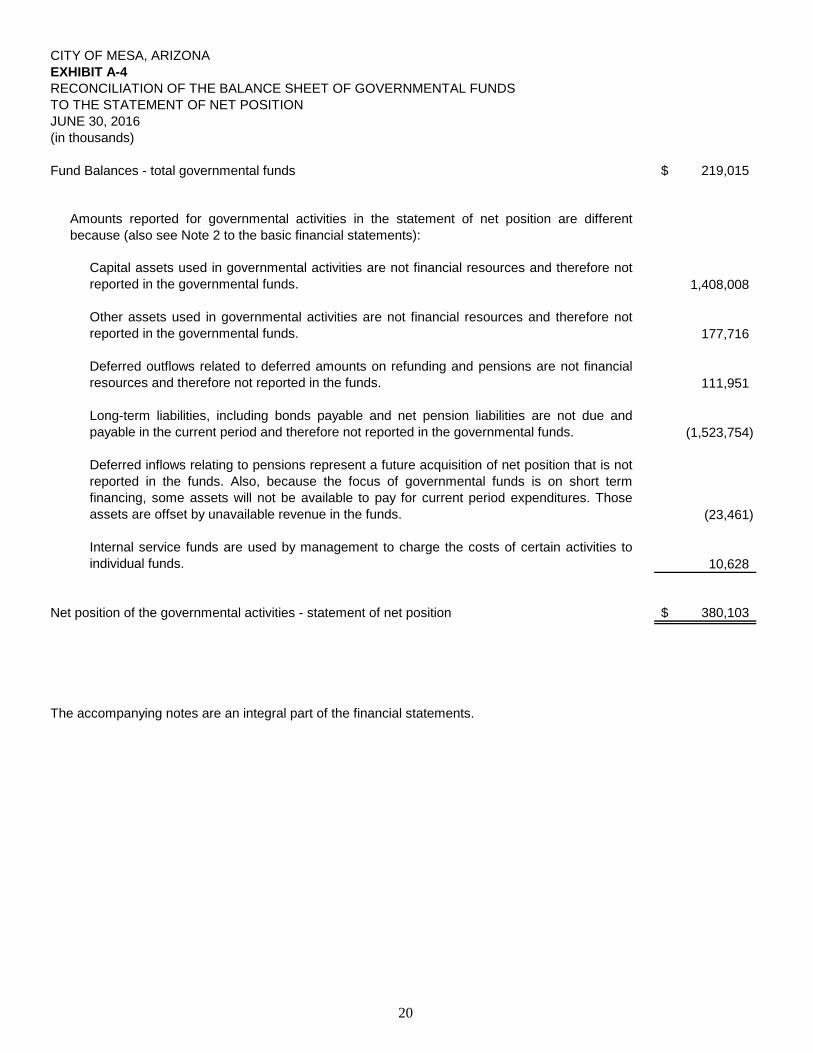
20
219,015$
Capital assets used in governmental activities are not financial resources and therefore notreported in the governmental funds. 1,408,008
Other assets used in governmental activities are not financial resources and therefore notreported in the governmental funds. 177,716
Deferred outflows related to deferred amounts on refunding and pensions are not financialresources and therefore not reported in the funds. 111,951
Long-term liabilities, including bonds payable and net pension liabilities are not due andpayable in the current period and therefore not reported in the governmental funds. (1,523,754)
Deferred inflows relating to pensions represent a future acquisition of net position that is notreported in the funds. Also, because the focus of governmental funds is on short termfinancing, some assets will not be available to pay for current period expenditures. Thoseassets are offset by unavailable revenue in the funds. (23,461)
Internal service funds are used by management to charge the costs of certain activities toindividual funds. 10,628
380,103$
The accompanying notes are an integral part of the financial statements.
CITY OF MESA, ARIZONAEXHIBIT A-4RECONCILIATION OF THE BALANCE SHEET OF GOVERNMENTAL FUNDS TO THE STATEMENT OF NET POSITIONJUNE 30, 2016(in thousands)
Fund Balances - total governmental funds
Net position of the governmental activities - statement of net position
Amounts reported for governmental activities in the statement of net position are differentbecause (also see Note 2 to the basic financial statements):

21
General Fund
Highway Project
Advancement Notes
Non-major Governmental
Funds
Total Governmental
FundsREVENUES
Sales Taxes 104,116$ -$ 47,710$ 151,826$ Property Taxes - - 34,765 34,765 Occupancy Taxes 40 - 2,291 2,331 Special Assessments - - 1,433 1,433 Licenses and Permits 17,580 - 5,674 23,254 Intergovernmental 118,775 8,143 64,442 191,360 Charges for Services 22,649 - 15,529 38,178 Fines and Forfeitures 8,795 - 2,254 11,049 Investment Income 416 46 1,021 1,483 Contributions 300 - 661 961 Miscellaneous Revenue 1,148 - 2,846 3,994
Total Revenues 273,819 8,189 178,626 460,634
EXPENDITURES Current:
General Government 71,651 - 7,797 79,448 Public Safety 223,733 - 30,795 254,528 Community Environment 13,723 - 51,836 65,559 Cultural-Recreational 36,516 - 7,135 43,651
Debt Service:Principal - 77,835 29,548 107,383 Interest on Bonds - - 18,581 18,581 Interest on Notes - 324 - 324 Service Charges - - 14 14 Cost of Issuance - - 1,505 1,505
Capital Outlay 4,580 - 87,204 91,784 Total Expenditures 350,203 78,159 234,415 662,777
Excess (Deficiency) of Revenues Over (Under) Expenditures (76,384) (69,970) (55,789) (202,143)
OTHER FINANCING SOURCES (USES)Transfers In 101,863 - 20,709 122,572 Transfers Out (8,618) - (15,680) (24,298) Face Amount of Bonds Issued - - 46,530 46,530 Premium on Issuance of Bonds (Net) - - 2,283 2,283 Issuance of Refunding Bonds - - 43,304 43,304 Payment to Refunding Bond Escrow Agent - - (49,693) (49,693)
Total Other Financing Sources (Uses) 93,245 - 47,453 140,698
Net Change in Fund Balances 16,861 (69,970) (8,336) (61,445)
Fund Balance - Beginning 77,945 78,417 124,098 280,460
Fund Balances - Ending 94,806$ 8,447$ 115,762$ 219,015$
FOR THE FISCAL YEAR ENDED JUNE 30, 2016(in thousands)
The accompanying notes are an integral part of the financial statements.
CITY OF MESA, ARIZONAEXHIBIT A-5GOVERNMENTAL FUNDSSTATEMENT OF REVENUES, EXPENDITURESAND CHANGES IN FUND BALANCES

22
(61,445)$
Revenues in the statement of activities that do not provide current financial resources are notreported in the governmental funds. 8,269
Some expenses reported in the statement of activities do not require the use of currentfinancial resources and therefore not reported as expenditures in governmental funds. (77,407)
Current-year pension contributions are reclassified to deferred outflows of resources andtherefore not reported as expenditures in governmental funds. 45,899
Governmental funds report capital outlays as expenditures. However, in the statement ofactivities, the costs of those assets are allocated over their estimated useful lives and reportedas depreciation expense. This is the amount by which capital outlay ($91,784) exceededdepreciation ($68,671) in the current period. 23,113
The net effect of miscellaneous transactions involving capital assets (e.g., donations, transfersand disposals) is to increase net position. 14,861
Change in equity in Joint Venture 24,659
The issuance of long-term debt (e.g., bonds and capital leases) provides current financialresources to governmental funds, while the repayment of principal of long-term debtconsumes financial resources of governmental funds. Neither transaction has any effect onnet position. 63,830
Governmental funds report the effect of premiums and deferred amounts related to refundingwhen the new debt is first issued, whereas these amounts are deferred and amortized in thestatement of activities. 7,218
Internal service funds are used by management to charge the costs of certain activities toindividual funds. The net revenue (expense) of certain internal service funds is reported withgovernmental activities. (6,966)
42,031$
FOR THE FISCAL YEAR ENDED JUNE 30, 2016
CITY OF MESA, ARIZONAEXHIBIT A-6RECONCILIATION OF THE STATEMENT OF REVENUES, EXPENDITURESAND CHANGES IN FUND BALANCES OF GOVERNMENTAL FUNDSTO THE STATEMENT OF ACTIVITIES
(in thousands)
Net change in fund balances - total governmental funds
The accompanying notes are an integral part of the financial statements.
Change in net position of the governmental activities - statement of activities
Amounts reported for governmental activities in the statement of activities are different because(also see Note 2 to the basic financial statements):
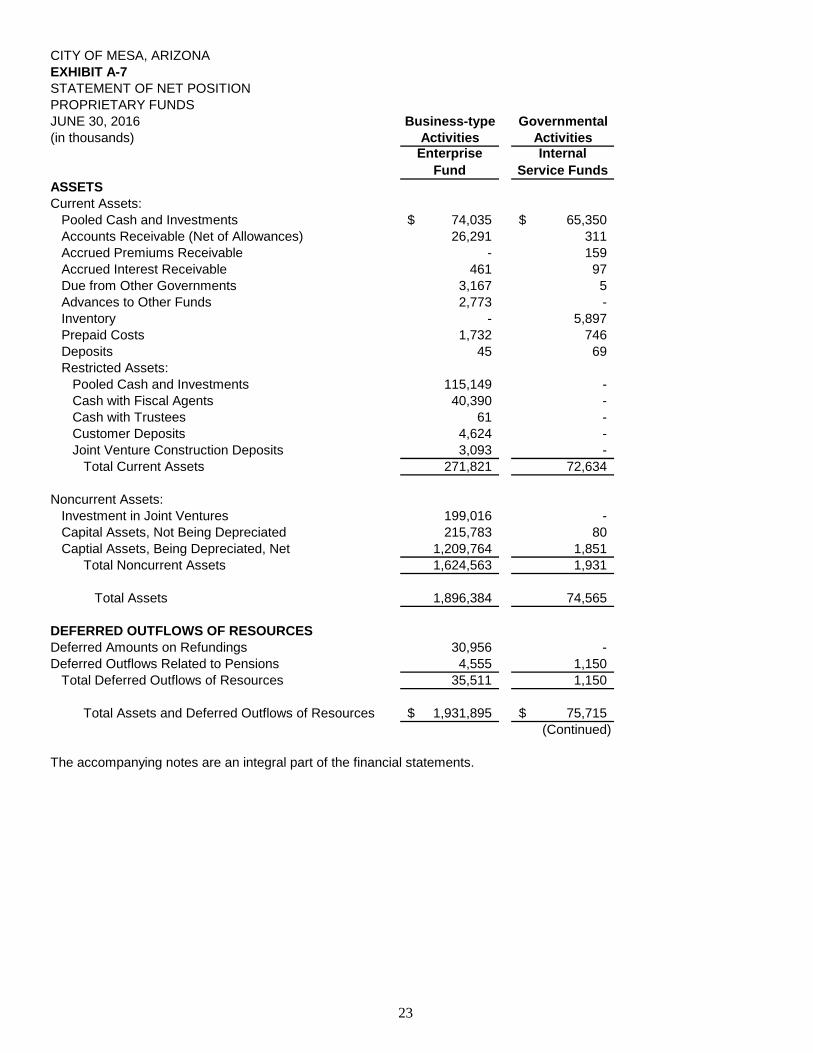
23
CITY OF MESA, ARIZONAEXHIBIT A-7STATEMENT OF NET POSITIONPROPRIETARY FUNDSJUNE 30, 2016 Business-type Governmental(in thousands) Activities Activities
Enterprise Fund
Internal Service Funds
ASSETSCurrent Assets:
Pooled Cash and Investments 74,035$ 65,350$ Accounts Receivable (Net of Allowances) 26,291 311 Accrued Premiums Receivable - 159 Accrued Interest Receivable 461 97 Due from Other Governments 3,167 5 Advances to Other Funds 2,773 - Inventory - 5,897 Prepaid Costs 1,732 746 Deposits 45 69 Restricted Assets:
Pooled Cash and Investments 115,149 - Cash with Fiscal Agents 40,390 - Cash with Trustees 61 - Customer Deposits 4,624 - Joint Venture Construction Deposits 3,093 -
Total Current Assets 271,821 72,634
Noncurrent Assets:Investment in Joint Ventures 199,016 - Capital Assets, Not Being Depreciated 215,783 80 Captial Assets, Being Depreciated, Net 1,209,764 1,851
Total Noncurrent Assets 1,624,563 1,931
Total Assets 1,896,384 74,565
DEFERRED OUTFLOWS OF RESOURCESDeferred Amounts on Refundings 30,956 - Deferred Outflows Related to Pensions 4,555 1,150
Total Deferred Outflows of Resources 35,511 1,150
Total Assets and Deferred Outflows of Resources 1,931,895$ 75,715$ (Continued)
The accompanying notes are an integral part of the financial statements.

24
CITY OF MESA, ARIZONAEXHIBIT A-7 (Continued)STATEMENT OF NET POSITIONPROPRIETARY FUNDSJUNE 30, 2016 Business-type Governmental(in thousands) Activities Activities
Enterprise Fund
Internal Service Funds
LIABILITIESCurrent Liabilities-Payable From Current Assets:
Accounts Payable and Accrued Liabilities 5,874$ 2,418$ Claims Payable - 38,448
Current Liabilities-Payable From Restricted Assets:Accounts Payable and Accrued Liabilities 10,947 - Interest Payable 23,520 - Unearned Revenue 158 - Matured Bonds Payable 16,870 - Customer Deposits and Prepayments 29,805 -
Current Portion of Long-Term Liabilities:Current Portion of Bonds Payable 25,148 - Current Portion of Notes Payable 134 - Current Portion of Compensated Absences 493 40
Total Current Liabilities 112,949 40,906
Long-Term Liabilities:Bonds Payable 1,133,012 - Notes Payable 1,851 - Unamortized Bond Premium 39,396 - Compensated Absences 3,618 617 Net Pension Liability 47,493 12,002 Post Employment Benefits 78,507 10,386
Total Long-Term Liabilities 1,303,877 23,005
Total Liabilities 1,416,826 63,911
DEFERRED INFLOWS OF RESOURCESDeferred Inflows Related to Pensions 4,653 1,176
Total Deferred Inflows of Resources 4,653 1,176
NET POSITIONNet Investment in Capital Assets 302,521 1,931 Restricted For:
Airport 9,869 - Bond Indentures 27,777 - Construction 3,093 - Debt Service 8,390 - Golf Course 10 -
Unrestricted 158,756 8,697 Total Net Position 510,416$ 10,628$
The accompanying notes are an integral part of the financial statements.
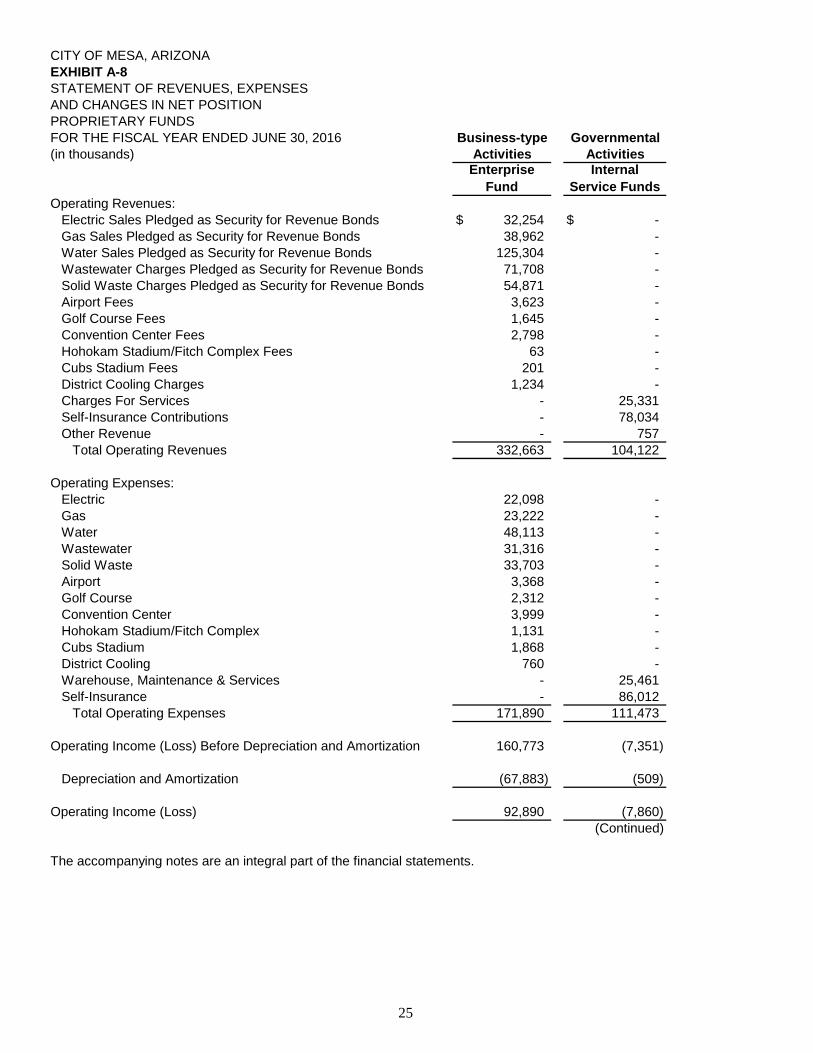
25
CITY OF MESA, ARIZONAEXHIBIT A-8STATEMENT OF REVENUES, EXPENSESAND CHANGES IN NET POSITIONPROPRIETARY FUNDSFOR THE FISCAL YEAR ENDED JUNE 30, 2016 Business-type Governmental(in thousands) Activities Activities
Enterprise Fund
Internal Service Funds
Operating Revenues:Electric Sales Pledged as Security for Revenue Bonds 32,254$ -$ Gas Sales Pledged as Security for Revenue Bonds 38,962 -Water Sales Pledged as Security for Revenue Bonds 125,304 -Wastewater Charges Pledged as Security for Revenue Bonds 71,708 -Solid Waste Charges Pledged as Security for Revenue Bonds 54,871 -Airport Fees 3,623 -Golf Course Fees 1,645 -Convention Center Fees 2,798 -Hohokam Stadium/Fitch Complex Fees 63 -Cubs Stadium Fees 201 -District Cooling Charges 1,234 -Charges For Services - 25,331Self-Insurance Contributions - 78,034Other Revenue - 757
Total Operating Revenues 332,663 104,122
Operating Expenses:Electric 22,098 -Gas 23,222 -Water 48,113 -Wastewater 31,316 -Solid Waste 33,703 -Airport 3,368 -Golf Course 2,312 -Convention Center 3,999 -Hohokam Stadium/Fitch Complex 1,131 -Cubs Stadium 1,868 -District Cooling 760 -Warehouse, Maintenance & Services - 25,461Self-Insurance - 86,012
Total Operating Expenses 171,890 111,473
Operating Income (Loss) Before Depreciation and Amortization 160,773 (7,351)
Depreciation and Amortization (67,883) (509)
Operating Income (Loss) 92,890 (7,860)
The accompanying notes are an integral part of the financial statements.
(Continued)

26
CITY OF MESA, ARIZONAEXHIBIT A-8 (Continued)STATEMENT OF REVENUES, EXPENSESAND CHANGES IN NET POSITIONPROPRIETARY FUNDSFOR THE FISCAL YEAR ENDED JUNE 30, 2016 Business-type Governmental(in thousands) Activities Activities
Enterprise Fund
Internal Service Funds
Nonoperating Revenues (Expenses):Investment Income Pledged as Security for Revenue Bonds 2,055 -Investment Income Unpledged 965 727Intergovernmental 267 -Interest Expense:
Bonds (44,786) -Notes Payable and Other Long-Term Obligations (15) -
Bond Administrative Costs (43) -Gain/(Loss) on Disposal of Capital Assets (10,019) -Net Loss from Joint Venture (4,228) -Utility Development Fees 13,668 -Bond Issuance Costs (1,502) -Occupancy Tax 1,161 -Miscellaneous Revenue 5,095 -
Total Nonoperating Revenues (Expenses) (37,382) 727
Income before Transfers and Capital Contributions 55,508 (7,133)
Capital Contributions 16,929 167Transfers In 3,051 -Transfers Out (101,325) -
Change in Net Position (25,837) (6,966)
Total Net Position - Beginning 536,253 17,594
Total Net Position - Ending 510,416$ 10,628$
The accompanying notes are an integral part of the financial statements.

27
CITY OF MESA, ARIZONAEXHIBIT A-9 STATEMENT OF CASH FLOWSPROPRIETARY FUNDS FOR THE FISCAL YEAR ENDED JUNE 30, 2016 Business-type Governmental(in thousands) Activities Activities
Enterprise FundInternal
Service FundsCash Flows From Operating Activities: Cash Received from Customers 337,692$ -$ Cash Received from Users - 104,789 Cash Payments to Suppliers (116,917) (97,971) Cash Payments to Employees (53,699) (12,166) Other Non-Operating Revenue 5,095 -
Net Cash Provided By (Used For) Operating Activities 172,171 (5,348)
Cash Flows From Noncapital Financing Activities: Intergovernmental 1,460 - Transient Occupancy Tax 1,161 - Investment in Joint Ventures 1 - Advances to Other Funds (2,773) - Transfers In from Other Funds 3,051 - Transfers Out to Other Funds (101,325) -
Net Cash Used For Noncapital Financing Activities (98,425) -
Cash Flows From Capital and Related Financing Activities: Proceeds from Bond Sales 248,719 - Acquisition and Construction of Capital Assets (67,044) (148) Principal Paid on Bonds, Leases and Notes Maturities (177,721) - Interest Paid on Bonds, Leases and Notes (59,933) - Developer Contributions and Capital Grants 19,278 -
Net Cash Used For Capital and Related Financing Activities (36,701) (148)
Cash Flows From Investing Activities: Interest Received on Investments 2,970 710
Net Cash Provided By Investing Activities 2,970 710
Net Change in Pooled Cash and Investments 40,015 (4,786)
Total Cash and Investments at Beginning of Year 189,620 70,136
Total Cash and Investments at End of Year 229,635$ 65,350$ (Continued)
The accompanying notes are an integral part of the financial statements.
28
CITY OF MESA, ARIZONAEXHIBIT A-9 (Continued)STATEMENT OF CASH FLOWSPROPRIETARY FUNDS FOR THE FISCAL YEAR ENDED JUNE 30, 2016 Business-type Governmental(in thousands) Activities Activities
Enterprise Fund
InternalService Funds
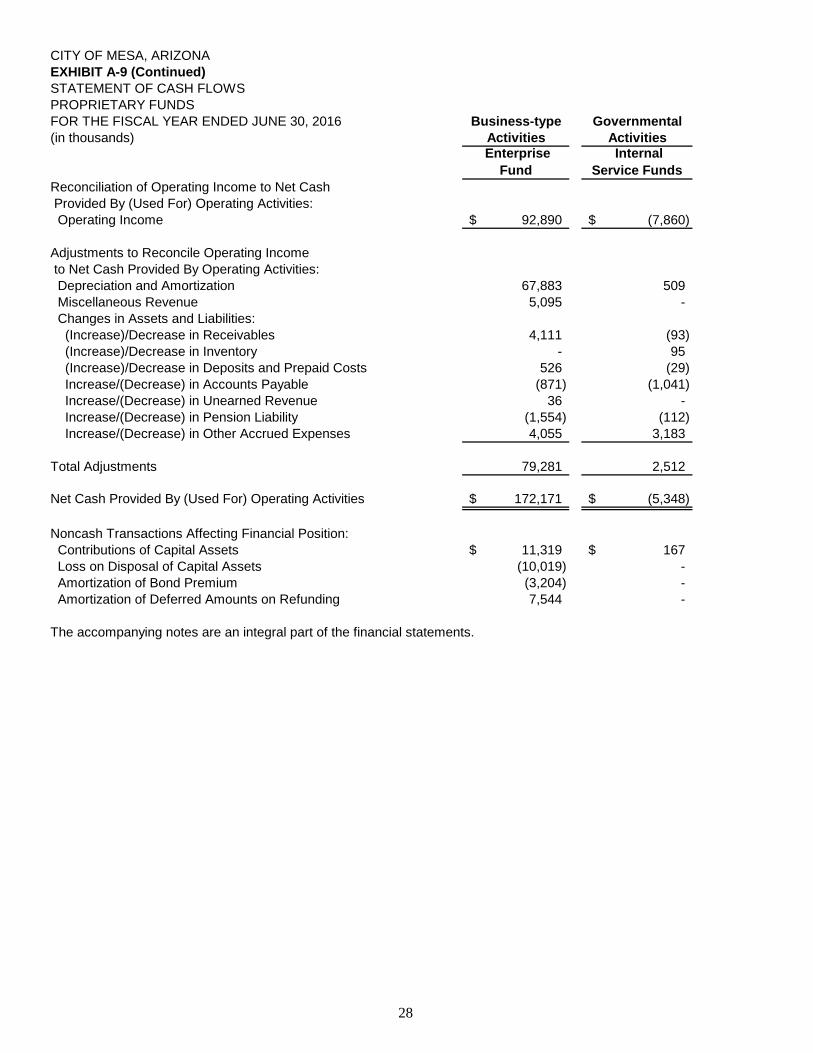
Reconciliation of Operating Income to Net Cash Provided By (Used For) Operating Activities: Operating Income 92,890$ (7,860)$
Adjustments to Reconcile Operating Income to Net Cash Provided By Operating Activities: Depreciation and Amortization 67,883 509 Miscellaneous Revenue 5,095 - Changes in Assets and Liabilities: (Increase)/Decrease in Receivables 4,111 (93) (Increase)/Decrease in Inventory - 95 (Increase)/Decrease in Deposits and Prepaid Costs 526 (29) Increase/(Decrease) in Accounts Payable (871) (1,041) Increase/(Decrease) in Unearned Revenue 36 - Increase/(Decrease) in Pension Liability (1,554) (112) Increase/(Decrease) in Other Accrued Expenses 4,055 3,183
Total Adjustments 79,281 2,512
Net Cash Provided By (Used For) Operating Activities 172,171$ (5,348)$
Noncash Transactions Affecting Financial Position: Contributions of Capital Assets 11,319$ 167$ Loss on Disposal of Capital Assets (10,019) - Amortization of Bond Premium (3,204) - Amortization of Deferred Amounts on Refunding 7,544 -
The accompanying notes are an integral part of the financial statements.

29
Payroll Agency
ASSETSPooled Cash and Investments 10,236$ Due from Others 6
Total Assets 10,242$
LIABILITIESAccounts Payable 1,335$ Accrued Payroll Payable 8,907
Total Liabilities 10,242$
The accompanying notes are an integral part of the financial statements.
(in thousands)
CITY OF MESA, ARIZONAEXHIBIT A-10
AGENCY FUNDSSTATEMENT OF FIDUCIARY ASSETS AND LIABILITIES
JUNE 30, 2016


CITY OF MESA, ARIZONA NOTES TO FINANCIAL STATEMENTS FOR THE FISCAL YEAR ENDED JUNE 30, 2016
30
The City of Mesa, Arizona, (the City) was incorporated July 15, 1883 with an approximate population of 300 and an area of one square mile. Today, the City’s estimated population is 475,274 within an area of approximately 141 square miles. The City’s charter was adopted August 18, 1967 providing for a Council-Manager form of government. The City provides a full range of municipal services including police and fire protection, parks and recreation, library, transportation, health and certain social services and general administration. In addition, the City owns and operates an enterprise whose activities include operations of electricity, gas, water, wastewater, and solid waste utilities, an airport, golf course, convention center, two stadiums and district cooling. 1. SUMMARY OF SIGNIFICANT ACCOUNTING POLICIES
The accompanying financial statements have been prepared in conformity with accounting principles generally accepted in the United States of America (“GAAP”) as applied to governmental units. The Governmental Accounting Standards Board (“GASB”) is the accepted standard-setting body for establishing governmental accounting and financial reporting principles. The City’s other significant accounting policies are described below: a. Reporting Entity
The accompanying financial statements include the City and its blended component unit, Community Facilities District, collectively referred to as “the financial reporting entity”. In accordance with GASB Statement No. 14, and as amended by GASB Statement No. 61, the component unit discussed below has been included in the City’s reporting entity because of the significance of its operational or financial relationship with the City. Community Facilities District (“District”) is a municipal corporation political subdivision of the State of Arizona that is organized to provide a vehicle for financing certain public infrastructure that is necessary for development of the land within the boundaries of the District. The City Council serves as the board of directors of the District and the City Manager of the City currently serves as the District Manager. Although it is legally separate from the City, the District is reported as if it is part of the primary government because the District’s governing body is substantively the same as the governing body of the City and management of the City has operational responsibility for the District. Separate financial statements for the District can be obtained from the City’s Finance Department, through Accounting Services at 20 E. Main Street, 3rd Floor, Mesa, Arizona 85211.
b. Jointly Governed Organizations Phoenix – Mesa Gateway Airport Authority (“PMGAA”) is a nonprofit corporation established and funded by the City, the City of Phoenix, the Towns of Gilbert and Queen Creek, and the Gila River Indian Community. The purpose of the entity is the redevelopment of Williams Air Force Base that was closed in September of 1993 to become PMGAA. The Board of Directors consists of the mayors for the respective municipalities and the governor of the tribal community. The City contributed $1.7 million to the PMGAA operating and capital budget during this fiscal year. Regional Public Transportation Authority (“RPTA”) is a voluntary association of local governments, including the cities of Mesa, Tempe, Scottsdale, Glendale, Phoenix and Maricopa County. Its purpose is to create a regional public transportation plan for Maricopa County. The Board of Directors consists of the mayors of those cities and a member of the County Board of Supervisors.

CITY OF MESA, ARIZONA NOTES TO FINANCIAL STATEMENTS FOR THE FISCAL YEAR ENDED JUNE 30, 2016
31 (Continued)
Arizona Municipal Water Users Association (“AMWUA”) is a nonprofit corporation established and funded by cities in Maricopa County for the development of an urban water policy and to represent the cities’ interests before the Arizona legislature. AMWUA performs certain accounting, administrative and support services for the cities who are jointly using a multi-city sanitary sewer system.
c. Basic Financial Statements Government-wide Financial Statements: The government-wide financial statements (the statement of net position and the statement of activities) report on the City as a whole, excluding fiduciary activities. Governmental activities, which normally are supported by taxes and intergovernmental revenues, are reported separately from business-type activities, which rely to a significant extent on fees and charges for services. The government-wide focus is more on the sustainability of the City as an entity and the change in aggregate financial position resulting from the activities of the fiscal period. For the most part, the effect of interfund activity has been removed from the government-wide financial statements. Net interfund activity and balances between governmental activities and business-type activities are shown in the government-wide financial statements. Certain charges between the Enterprise Fund’s utility systems and the various functional activities are not eliminated, as this would distort the direct costs and program revenues reported for the various functions concerned. The government-wide statement of net position reports all financial and capital resources of the City, excluding fiduciary funds. It is presented in a format of assets plus deferred outflows of resources less liabilities plus deferred inflows of resources equals net position, with the assets and liabilities shown in order of their relative liquidity. Net position is required to be presented in three components: net investment in capital assets, restricted and unrestricted. Net investment in capital assets is capital assets net of accumulated depreciation and reduced by outstanding balances of bonds, capital leases, notes or other borrowings that are attributable to the acquisition, construction, or improvement of those assets. Restricted net position are those with constraints placed on their use externally either imposed by creditors (such as bond covenants), grantors, contributors, laws or regulations of other governments or imposed by law through constitutional provisions or enabling legislation. Unrestricted net position are those not otherwise classified as restricted, and are shown as unrestricted. Generally, the City would first apply restricted resources when an expense is incurred for purposes for which both restricted and unrestricted net position is available. The government-wide statement of activities demonstrates the degree to which the direct expenses of the various functional activities and segments of the City are offset by program revenues. Direct expenses are those that are clearly identifiable with a specific functional activity (General Government, Public Safety, Cultural-Recreational, etc.) or segment. Expenses reported for the various functional activities or segments include indirect expenses, such as overhead costs. Interest on long-term debt is not allocated to the various functions in the governmental activities. Program revenues include charges to customers or applicants who directly benefit from goods, services or privileges provided by a given function or segment. Program revenues also include grants and contributions that are restricted to meeting the operational or capital requirements of a particular function or segment, including special assessments. Taxes and other items not properly included as program revenues are reported as general revenues. The general revenues support the net costs of the functions and segments not covered by program revenues.

CITY OF MESA, ARIZONA NOTES TO FINANCIAL STATEMENTS FOR THE FISCAL YEAR ENDED JUNE 30, 2016
32 (Continued)
Fund Financial Statements: The fund financial statements are, in substance, very similar to the financial statements presented in the previous model. Separate financial statements are provided for governmental funds, proprietary funds and fiduciary funds. However, the fiduciary funds are not included in the government-wide financial statements. The focus of the fund financial statements is on major funds, as defined by GASB Statement No. 34. Major individual governmental funds are reported as separate columns in the fund financial statements. The City has only one enterprise fund, which is reported as a major fund. Non-major governmental funds, as well as the internal service funds, are summarized into a single column on the fund financial statements and are detailed in combining statements included as supplementary information after the basic financial statements.
d. Measurement Focus, Basis of Accounting and Financial Statement Presentation Government-wide Financial Statements: The government-wide financial statements are reported using the economic resources measurement focus and the accrual basis of accounting. Revenues are recorded when earned and expenses are recorded when the liability is incurred, regardless of the timing of related cash flows. Grants and similar items are recognized as revenues as soon as all eligibility requirements imposed by the provider have been met. Governmental Fund Financial Statements: The governmental fund financial statements are reported using the current financial resources measurement focus and modified accrual basis of accounting. Revenues are recognized in the accounting period in which they become susceptible to accrual, i.e., measurable and available to finance the City’s operations. Available means collectible within the current period or soon enough thereafter to be used to pay liabilities of the current period. The City considers revenues to be available if they are collected within 60 days of the end of the current period. Principal revenue sources considered to be susceptible to accrual are City sales taxes, property taxes, intergovernmental revenues and interest on investments. In applying the susceptible to accrual concept to intergovernmental revenues pursuant to GASB Statement No. 33, receivables and revenues are recognized when all the applicable eligibility requirements, including time requirements, have been met. Resources transmitted before the eligibility requirements are met are reported as unearned revenue. Expenditure-driven grants are recognized as revenue when the qualifying expenditures have been incurred and all other grant requirements have been met. City sales taxes collected and held by merchants at year-end on behalf of the City are recognized as revenue. State shared revenues, including sales and income taxes, highway user and auto lieu taxes, and lottery distributions for transportation assistance, which are collected and held by the State at year-end, on behalf of the City, are also recognized as revenue. Special assessments are recognized as revenue only to the extent that individual installments are considered current assets. Annual installments not currently receivable are reflected as unavailable revenue. Licenses and permits, charges for services and miscellaneous revenues are recorded as revenue when received as cash because they are generally not available until actually received. Changes in the fair value of investments are recognized in revenue at the end of each year. Expenditures are generally recognized when the related fund liability is incurred, as under accrual accounting. An exception to this is interest on long-term debt which is recorded when due. Since the governmental fund financial statements are presented on a different measurement focus and basis of accounting than the government-wide financial statements, a reconciliation is

CITY OF MESA, ARIZONA NOTES TO FINANCIAL STATEMENTS FOR THE FISCAL YEAR ENDED JUNE 30, 2016
33 (Continued)
presented on the page following each governmental fund financial statement, which briefly explains the adjustments necessary to transform the fund-based financial statements into the governmental activities column of the government-wide financial statements. Additional reconciliations are also provided in Note 2. Proprietary Funds Financial Statements: The financial statements of the proprietary fund are reported using the economic resources measurement focus and accrual basis of accounting, similar to the government-wide financial statements described above. The proprietary fund financial statements distinguish operating revenues and expenses from non-operating items. Operating revenues and expenses generally result from providing services and producing and delivering goods in connection with a proprietary fund’s principal ongoing operations. All revenues and expenses not meeting this definition, such as investment income and interest expense are reported as non-operating revenues and expenses. Internal service funds of the City, which provide services primarily to the other funds of the City, are presented in summary form as part of the proprietary fund financial statements. Since the principal users of internal services are the City’s governmental activities, financial statements of the internal service funds are consolidated into the governmental activities column when presented at the government-wide level. The costs of these services are reflected in the appropriate functional activity on the government-wide statement of activities and the revenues and expenses within the internal service funds are eliminated from the government-wide financial statements to avoid any doubling up effect of these revenues and expenses. Fiduciary Funds Financial Statements: The City’s fiduciary fund is presented in the fund financial statements. The City’s fiduciary fund is an agency fund, which is custodial in nature and does not involve measurement of results of operations. The agency fund is accounted for on the accrual basis of accounting. Since by definition these assets are being held for the benefit of a third party and cannot be used to address activities or obligations of the City, these funds are not incorporated into the government-wide financial statements.
e. Fund Accounting The financial transactions of the City are recorded in individual funds. Each fund is accounted for by providing a separate set of self-balancing accounts that comprises its assets, liabilities, reserves, fund equity, revenues and expenditures/expenses. The various funds are reported by generic classification within the fund financial statements. GASB Statement No. 34 sets forth minimum criteria for the determination of major funds. The non-major funds are combined in a column in the fund financial statements and detailed in the combining section. The City reports the following major governmental funds:
The General Fund is the general operating fund of the City. It is used to account for all financial resources except those required to be accounted for in another fund. The Highway Project Advancement Notes Fund accumulates monies for payment of principal and interest requirements for the Highway Project Advancement Notes.

CITY OF MESA, ARIZONA NOTES TO FINANCIAL STATEMENTS FOR THE FISCAL YEAR ENDED JUNE 30, 2016
34 (Continued)
The City reports the following non-major governmental funds: Ten non-major Special Revenue Funds are used to account for specific revenues that are legally restricted to expenditures for specific purposes. Five non-major Capital Project Funds are used to account for the acquisition and construction of major capital facilities other than those financed by proprietary funds. Four non-major Debt Service Funds are used to account for the accumulation of resources for the payment of long-term obligation principal, interest and service charges.
The City reports the following major proprietary fund:
The Enterprise Fund has been established to account for all enterprise functions. This includes the City-owned electric, gas, water, wastewater and solid waste systems, as well as the City-owned airport, golf course, convention center, stadiums and district cooling.
Additionally, the City reports the following fund types:
The Internal Service Funds are used to account for operations that provide services to other departments of the government on a cost-reimbursement basis. These services include fleet support, materials and supply, printing and graphics, self-insurance for property and public liability, workers’ compensation and employee benefit programs. The Agency Fund is used to account for assets being held by the City as an agent in a temporary custodial capacity. The Payroll Agency Fund accounts for all payroll transactions.
f. Budgets and Budgetary Accounting
Each year the City Manager issues a budget calendar giving specific completion dates for various phases of the budget preparation process. The final adoption of the operating budget is by ordinance. Prior to June 1, the City Manager submits a proposed operating budget to the City Council for the fiscal year commencing the following July 1. The operating budget includes proposed expenditures and the means of financing them. Public hearings are conducted by the City to obtain citizen comments. Prior to June 30, the budget for the ensuing year is legally adopted through passage of an ordinance; these appropriations lapse at the end of each fiscal year. Legal control over the budget derives from State statutes that prohibit the City from exceeding its adopted budget in total and from the resolution itself that limits expenditures by fund and by departmental groupings. Transfers of sums within a specific fund or departmental group may be made upon City Manager approval. The legally adopted budget consists of all funds except the Agency Fund. Capital Projects are budgeted as one item and governmental debt service expenditures are budgeted in the Special Revenue Funds or Debt Service Fund. A budget schedule for the General Fund is presented in the

CITY OF MESA, ARIZONA NOTES TO FINANCIAL STATEMENTS FOR THE FISCAL YEAR ENDED JUNE 30, 2016
35 (Continued)
Required Supplementary Information Section, and the other funds are located in the Supplementary Information Section. On June 3, 1980, the voters of Arizona approved an expenditure limitation for all local governments. This limitation restricts the growth of expenditures to a percentage determined by population and inflation, with certain expenditures excluded from the limitation. The State Economic Estimates Commission determines and publishes, prior to April 1st of each year, the expenditure limitation for the following fiscal year for each governmental unit. Fiscal year 1979-80 is the base year for calculations. Budgets for all funds are adopted in accordance with the requirements of the Arizona Constitution, Arizona Revised Statutes and the Mesa City Charter. There are certain differences between the basis used for budgetary purposes and that used for reporting in accordance with generally accepted accounting principles. For additional detail, see the note to required supplementary information. Budgeted amounts are as originally adopted by the City Council on June 15, 2015.
g. Use of Estimates The preparation of financial statements in conformity with accounting principles generally accepted in the United States of America requires management to make a number of estimates and assumptions that affect the reported amounts of assets, deferred outflows of resources, liabilities, deferred inflows of resources and net position, the disclosure of contingent assets and liabilities at the date of the financial statements and reported amounts of revenues and expenses/expenditures during the reporting period. Actual results could differ from those estimates.
h. Pooled Cash and Investments The City maintains an invested pool that is available for use by all City funds. Each fund’s portion of this pool is reported on the financial statements as “pooled cash and investments”. Assets related to long-term investments of the invested pool are held by a single master custodian. In addition, certain cash deposits and short-term investments are held separately in State of Arizona Local Government Investment Pools (LGIP), and FDIC Insured Cash Sweep accounts with two local banks. The City considers all highly liquid investments with a maturity of three months or less when purchased to be cash equivalents. Investments are recorded at fair value in accordance with GASB Statement No. 72, Fair Value Measurement and Application. Accordingly, the change in fair value of investments is recognized as an increase or decrease to investment assets and investment income. Interest income from investments is recorded as revenue within the fund that made the investment, with the exception of the Capital Projects and Agency Funds. Income from investments within these funds is recorded in the General or Enterprise Fund based upon their general governmental or enterprise related function.
i. Inventories Inventories consist of expendable supplies held for consumption. The warehouse inventory is valued at the lower of average cost or market, while fleet support services inventory is valued at

CITY OF MESA, ARIZONA NOTES TO FINANCIAL STATEMENTS FOR THE FISCAL YEAR ENDED JUNE 30, 2016
36 (Continued)
cost on a first-in, first out (FIFO) basis. The cost of inventory is reported as an expenditure at the time individual items are consumed.
j. Capital Assets Capital assets, including infrastructure (streets, sidewalks, street lighting, storm drainage and other assets that are immovable and of value only to the City) are defined as assets with an initial cost of $5,000 or more and an estimated useful life of more than one year. Intangible assets for the City include goodwill, right of way, easements and computer software. The City has elected to capitalize software with an initial cost of $100,000 or more. All capital assets, whether owned by governmental activities or business-type activities, are required to be recorded and depreciated in the government-wide financial statements. Capital assets are recorded at cost or estimated historical cost if purchased or constructed. Contributions of assets are stated at fair market value based on appraisals or engineering estimates of value at the time of receipt. When assets are retired or sold, the costs of the assets and the related accumulated depreciation are eliminated from the accounts, and any resultant gain or loss is charged to income or expense. Depreciation has been provided using the straight-line method based on the estimated useful lives of the assets. Amortization of capital leased assets has been provided using the straight-line method based on the shorter of the lease period or estimated useful lives of the leased assets. The estimated useful lives are as follows:
Buildings 15-50 Years Other Improvements 5-50 Years Machinery and Equipment 3-30 Years Intangibles 6-15 Years Infrastructure 5-50 Years
Gain or loss is recognized when assets are retired from service or are otherwise disposed of. Capital assets transferred between funds are transferred at their net book value (cost less accumulated depreciation) or net realizable value, if lower, as of the date of the transfer.
k. Compensated Absences Vacation, compensatory time and sick leave benefits are accrued as liabilities as employees earn the benefits to the extent that they meet both of the following criteria: 1) the City’s obligation is attributable to employees’ services already rendered; and 2) it is probable that the City will compensate the employees for the benefits through paid time off or some other means, such as cash. For governmental funds a liability for vacation, compensatory time and sick leave are reported only if they have matured, for example, as a result of employee resignations and retirements. The entire amount of accumulated unpaid vested vacation pay, compensatory time and an estimated amount for sick leave related to the proprietary funds is included as a liability in the fund financial statements. The remaining long-term balances related to governmental activities are included in the government-wide financial statement.

CITY OF MESA, ARIZONA NOTES TO FINANCIAL STATEMENTS FOR THE FISCAL YEAR ENDED JUNE 30, 2016
37 (Continued)
l. Reserve for Loss and Loss Adjustment Expenses The Property and Public Liability, Workers’ Compensation and Employee Benefits Internal Service Funds establish claim liabilities based on actuarial estimates of the ultimate cost of claims (including future claim adjustment expenses) that have been reported but not settled, and of claims that have been incurred but not reported. Adjustments to claim liabilities are charged or credited to expenses in the periods in which they are made.
m. Long-Term Obligations In the government-wide financial statements and the proprietary fund financial statements, long-term debt and other long-term obligations are reported as liabilities in the applicable governmental activities, business-type activities, or proprietary fund statement of net position. Bond premiums and discounts are amortized over the life of the bonds using the straight-line method. Bonds payable are reported net of the applicable bond premium or discount. In the fund financial statements, governmental fund types recognize bond premiums and discounts during the current period. The face amount of debt issued is reported as other financing sources. Premiums received on debt issuances are reported as other financing sources while discounts on debt issuance are reported as other financing uses.
n. Pensions For purposes of measuring the net pension liability, deferred outflows of resources and deferred inflows of resources related to pensions, and pension expense, information about the fiduciary net position of the Arizona State Retirement System Defined Benefit Plan (ASRS) and Public Safety Personnel Retirement System (PSPRS) and additions to/deductions from ASRS and PSPRS’s fiduciary net position have been determined on the same basis as they are reported by ASRS and PSPRS. For this purpose, benefit payments (including refunds of employee contributions) are recognized when due and payable in accordance with the benefit terms. Investments are reported at fair value.
o. Fund Balance Policies In the fund financial statements, fund balance is reported in classifications that comprise a hierarchy based on the extent to which the City is bound to honor constraints on the specific purposes for which amounts in those funds can be spent. The classifications of fund balance are Nonspendable, Restricted, Committed, Assigned, and Unassigned. Nonspendable and Restricted fund balances represent restricted classifications and Committed, Assigned, and Unassigned represent unrestricted classifications. Nonspendable fund balance includes amounts that cannot be spent because either 1) it is not in a spendable form, such as inventory or prepaid items or 2) it is legally or contractually required to be maintained intact. Restricted fund balance has externally (outside the City) enforceable limitations imposed by creditors, grantors, contributors, laws and regulations of other governments, or laws through constitutional provisions or enabling legislation (changes in City Charter). Committed fund balance has self-imposed limitations imposed at the highest level of decision making authority, namely, Mayor and Council. Mayor and Council approval is required by resolution to commit resources or to rescind the commitment. Assigned fund balance represents limitations imposed by management. Assigned fund balance requests are submitted to the Chief Financial Officer for
CITY OF MESA, ARIZONA NOTES TO FINANCIAL STATEMENTS FOR THE FISCAL YEAR ENDED JUNE 30, 2016
38 (Continued)
approval/nonapproval. City Charter authorizes the City Manager or Designee the authority to perform all financial transactions. The City Manager has authorized the Chief Financial Officer this responsibility. Unassigned fund balance represents the residual net resources in excess of the other classifications. The General Fund is the only fund that can report a positive unassigned fund balance and any governmental fund can report a negative unassigned fund balance. When both restricted and unrestricted resources are available for specific expenditures, restricted resources are considered spent before unrestricted resources. Within unrestricted resources, committed and assigned are considered spent (if available) before unassigned amounts.
p. Statement of Cash Flows A statement of cash flows classifies cash receipts and payments according to whether they stem from operating, non-capital financing, capital and related financing, or investing activities. For purposes of the statements of cash flows, the City considers all highly liquid investments with a maturity of three months or less when purchased to be cash equivalents. This includes repurchase agreements and all monies in the State Treasurer’s Local Government Investment Pool since the City may deposit or withdraw cash at any time without prior notice or penalty.
q. Contingency Services The principal purpose of a contingency is to cover any unforeseen expenditures that may arise after the budget is adopted, and to cover expenditures resulting from prior year encumbrances. It is impossible to estimate revenues exactly or to determine in a prior year the exact expenditure of each program or activity for the ensuing year. Thus a contingency is essential for budgetary purposes. Any balance of a contingency appropriation not used during one fiscal year is available to help finance the following year’s budget. The contingency applications are reflected in the budget basis financial statements for the fiscal year ended June 30, 2016 and are made in accordance with State Statutes.
r. Property Taxes The City’s secondary property tax is levied each year on or before the third Monday in August based on the previous January 1 full cash value as determined by the Maricopa County Assessor. Levies are due and payable in two installments, on October 1 and March 1, and become delinquent after November 1 and after May 1, respectively. A lien attaches to the property on the first day of January preceding the assessment and levy of taxes. Delinquent amounts bear interest at the rate of 16 percent. Maricopa County, at no charge to the taxing entities, bills and collects all property taxes. Public auctions of properties which have delinquent real estate taxes are held in February. Secondary property taxes are levied to pay principal and interest on bonded indebtedness. The dollar amount of the secondary property tax is “unlimited” and the actual full cash value of property is used in determining the tax rate. In fiscal year 2015-2016, current property tax collections were $32,894,474 or 98.10% of the tax levy, and were recognized as revenue when received. At fiscal year end, the delinquent property tax is recorded as a receivable. Revenue is recognized for those payments expected to be collected within 60 days and the remaining balance is reported as unavailable revenue. The receivable at

CITY OF MESA, ARIZONA NOTES TO FINANCIAL STATEMENTS FOR THE FISCAL YEAR ENDED JUNE 30, 2016
39 (Continued)
June 30, 2016 was $907,249 of which $435,548 was recorded as revenue and $471,701 as unavailable revenue.
s. New Accounting Pronouncements GASB Statement No. 72, Fair Value Measurement and Application, addresses accounting and financial reporting issues related to fair value measurements. The City implemented this Statement in fiscal year 2016. See Note 4 for the current year effect of implementing GASB Statement No. 72. GASB Statement No. 73, Accounting and Financial Reporting for Pensions and Related Assets That Are Not within the Scope of GASB Statement 68, and Amendments to Certain Provisions of GASB Statements 67 and 68, improves the usefulness of information about pensions included in the financial reports of governments for making decisions and assessing accountability. The City has implemented this Statement in fiscal year 2016 with no impact. GASB Statement No. 74, Financial Reporting for Postemployment Benefit Plans Other Than Pension Plans, improves the usefulness of information about postemployment benefits other than pensions (other postemployment benefits or OPEB) included in the financial reports of governmental OPEB plans for making decisions and assessing accountability. This Statement replaces Statements No. 43, Financial Reporting for Postemployment Benefit Plans Other Than Pension Plans, as amended, and No. 57, OPEB Measurements by Agent Employers and Agent Multiple-Employer Plans. It also includes requirements for defined contribution OPEB plans that replace the requirements for those OPEB plans in Statement No. 25, Financial Reporting for Defined Benefit Pension Plans and Note Disclosures for Defined Contribution Plans, as amended, Statement 43, and Statement No. 50, Pension Disclosures. This Statement is effective for financial statements for fiscal years beginning after June 15, 2016. The City will implement this Statement in fiscal year 2017. GASB Statement No. 75, Accounting and Financial Reporting for Postemployment Benefits Other Than Pensions, improves accounting and financial reporting by governments for postemployment benefits other than pensions. It also improves information provided by governmental employers about financial support for OPEB that is provided by other entities. This Statement replaces the requirements of Statements No. 45, Accounting and Financial Reporting by Employers for Postemployment Benefits Other Than Pensions, as amended, and No. 57, OPEB Measurements by Agent Employers and Agent Multiple-Employer Plans, for OPEB. This Statement is effective for fiscal years beginning after June 15, 2017. The City will implement this Statement in fiscal year 2018. GASB Statement No. 76, The Hierarchy of Generally Accepted Accounting Principles for State and Local Governments, identifies the hierarchy of generally accepted accounting principles and the framework for selecting those principles reducing the GAAP hierarchy to two categories of authoritative GAAP. This Statement supersedes Statement No. 55, The Hierarchy of Generally Accepted Accounting Principles for State and Local Governments. The City has implemented this Statement in fiscal year 2016 with no impact. GASB Statement No. 77, Tax Abatement Disclosures, requires disclosure of tax abatement information about a reporting government’s own tax abatement agreements and those that are entered into by other governments and that reduce the reporting government’s tax revenues. The requirements of this Statement are effective for financial statements for periods beginning after December 15, 2015. The City will implement this Statement in fiscal year 2017.

CITY OF MESA, ARIZONA NOTES TO FINANCIAL STATEMENTS FOR THE FISCAL YEAR ENDED JUNE 30, 2016
40 (Continued)
GASB Statement No. 78, Pensions Provided through Certain Multiple-Employer Defined Benefit Pension Plans, amends Statement 68 to exclude pensions provided to employees of state or local governmental employers through a cost-sharing multiple-employer defined benefit pension plan that (1) is not a state or local governmental pension plan, (2) is used to provide defined benefit pensions both to employees of state or local governmental employers and to employees of employers that are not state or local governmental employers, and (3) has no predominant state or local governmental employer (either individually or collectively with other state or local governmental employers that provide pensions through the pension plan). The City is not a participant in this type of pension plan and therefore has early implemented this statement in fiscal year 2016 with no effect. GASB Statement No. 79, Certain External Investment Pools and Pool Participants, establishes criteria for an external investment pool to qualify for making the election to measure all of its investments at amortized cost for financial reporting purposes. This Statement also adds additional note disclosure requirements for governments that participate in those pools. The City has implemented this Statement in fiscal year 2016 with no impact. GASB Statement No. 80, Blending Requirements for Certain Component Unites – an amendment of GASB Statement No. 14, amends the blending requirements for certain component units. The requirements of this Statement are effective for reporting periods beginning after June 15, 2016. The City will implement this Statement in fiscal year 2017. GASB Statement No. 81, Irrevocable Split-Interest Agreements, provides recognition and measurement guidance for situations in which a government is a beneficiary of an irrevocable split-interest agreement. The requirements of this Statement are effective for financial statements for periods beginning after December 15, 2016, and should be applied retroactively. The City will implement this Statement in fiscal year 2017. GASB Statement No. 82, Pension Issues – An Amendment of GASB Statements No. 67, No. 68, and No. 73, addresses issues regarding (1) the presentation of payroll-related measures in required supplementary information, (2) the selection of assumptions and the treatment of deviations from the guidance in an Actuarial Standard of Practice for financial reporting purposes, and (3) the classification of payments made by employers to satisfy employee (plan member) contribution requirements. The City has early implemented this statement in fiscal year 2016 with no effect. Implementation Guide No. 2015-1, provides guidance that clarifies, explains, or elaborates on GASB Statements and Interpretations and supersedes all previously issued Implementation Guides, including the 2013-2014 Comprehensive Implementation Guide. The requirements of this Implementation Guide were implemented by the City in fiscal year 2016 with no effect. Implementation Guide No. 2016-1, Implementation Guidance Update – 2016, provides guidance that clarifies, explains or elaborates on GASB Statements and Interpretations and amends, removes, supersedes, or adds questions not originally contained in Implementation Guide No. 2015-1. The requirements of this Implementation Guide are effective for reporting periods beginning after June 15, 2016. The City will implement this Implementation Guide in fiscal year 2017. Although expected to be significant, the City has not fully determined the effects that implementation of Statements No. 74 and 75 will have on the City’s financial statements. The City has also not fully determined the effects that implementation of Statements No. 77 and 80, and the Implementation Guide No. 2016-1 will have on the City’s financial statements.

CITY OF MESA, ARIZONA NOTES TO FINANCIAL STATEMENTS FOR THE FISCAL YEAR ENDED JUNE 30, 2016
41 (Continued)
2. RECONCILIATION OF GOVERNMENTAL FUND FINANCIAL STATEMENTS TO GOVERNMENT-WIDE FINANCIAL STATEMENTS The governmental fund financial statements are presented on a current financial resources measurement focus and modified accrual accounting basis while the government-wide financial statements are prepared on a long-term economic resources measurement focus and accrual accounting basis. Reconciliations briefly explaining the adjustments necessary to transform the fund financial statements into the governmental activities column of the government-wide financial statements immediately follow each governmental fund financial statement.

CITY OF MESA, ARIZONA NOTES TO FINANCIAL STATEMENTS FOR THE FISCAL YEAR ENDED JUNE 30, 2016
42 (Continued)
Reconciliation of the Governmental Funds Balance Sheet to the government-wide Statement of Net Position (in thousands):
Total Long-term Internal Reclassifications Statement ofGovernmental Assets/ Service and Net Position
Funds Liabilities (1) Funds (2) Eliminations TotalAssets Pooled Cash and Investments 200,422$ -$ 65,350$ -$ 265,772$ Account and Misc Receivables, Net 23,264 - 470 - 23,734 Accrued Interest Receivable 404 - 97 - 501 Due from Other Governments 18,492 - 5 - 18,497 Advances to Other Funds 1,414 - - (4,187) (2,773) Inventory - - 5,897 - 5,897 Prepaid Costs 2,698 - 746 - 3,444 Deposits 758 - 69 - 827 Restricted Assets:
Pooled Cash and Investments 10,900 - - - 10,900 Cash with Fiscal Agent 37,579 - - - 37,579 Cash with Trustee 8,761 - - - 8,761 Accounts Receivable 11,616 - - - 11,616
Due from Other Governments 907 - - - 907 Investment in Joint Ventures - 177,716 - - 177,716 Capital Assets - 1,408,008 1,931 - 1,409,939
Total Assets 317,215 1,585,724 74,565 (4,187) 1,973,317
Deferred Outflows of ResourcesDeferred Amounts on Refunding - 7,700 - - 7,700 Pensions - 104,251 1,150 - 105,401
Total Deferred Outflows of Resources - 111,951 1,150 - 113,101
Total Assets and Deferred Outflowsof Resources 317,215$ 1,697,675$ 75,715$ (4,187)$ 2,086,418$
LiabilitiesAccounts Payable and Accrued Liabilities 23,626$ -$ 2,418$ -$ 26,044$ Claims Payable - - 38,448 - 38,448 Advances from Other Funds 4,187 - - (4,187) - Customer and Defendant Deposits 6,916 - - - 6,916 Compensated Absences 589 - - - 589 Restricted Bond Interest Payable 8,885 - - - 8,885 Restricted Unearned Revenue 12,010 - - - 12,010 Matured Bonds Payable 28,743 - - - 28,743 Pension - 622,412 12,002 - 634,414 Long-term Liabilities - 901,342 11,043 - 912,385
Total Liabilities 84,956 1,523,754 63,911 (4,187) 1,668,434
Deferred Inflows of ResourcesUnavailable Revenue 13,244 (13,244) - - - Pension - 36,705 1,176 - 37,881
Total Deferred Inflows of Resources 13,244 23,461 1,176 - 37,881
Fund Balance/Net PositionTotal Fund Balance/Net Position 219,015 150,460 10,628 - 380,103 Total Liabilities and Fund Balance/Net Position 317,215$ 1,697,675$ 75,715$ (4,187)$ 2,086,418$

CITY OF MESA, ARIZONA NOTES TO FINANCIAL STATEMENTS FOR THE FISCAL YEAR ENDED JUNE 30, 2016
43 (Continued)
(1) Investment in joint ventures that are to be used in governmental activities are also reported in the governmental funds as expenditures as constructed. These assets are included in the statement of net position for the City as a whole.
Investment in joint ventures 177,716$
When capital assets (land, buildings, equipment, etc.) that are to be used in governmental activities are purchased or constructed, the costs of those assets are reported as expenditures in governmental funds, and thus a reduction in fund balance. However, the statement of net position includes those capital assets among the assets of the City as a whole.
Costs of capital assets 2,284,019$ Accumulated depreciation (876,011) Total 1,408,008$
Deferred outflows consist of items that will consume net position in a future reporting period(s) and do not meet the definition of an asset. Deferred amounts on refunding result from the difference between the carrying value of refunded debt and its reacquisition price. The pension-related amounts result from differences between expected and actual experience, changes of assumptions or other inputs, the difference between projected and actual investment earnings, and contributions made to the pension plan from the employer subsequent to the measurement date of the net pension liability and before the end of the reporting period.
Deferred charge on refunding 7,700$ Pensions 104,251 Total 111,951$
Long-term liabilities applicable to the City’s governmental activities are not due and payable in the current period, and accordingly are not reported as fund liabilities in the governmental fund statement.
Bonds payable 464,855$ Compensated absences 26,788 Post-employment benefits 396,132 Unamortized bond premiums 13,567 Pension liability 622,412 Total 1,523,754$
Unavailable revenues shown on the governmental fund statements are not deferred on the statement of net position.
Unavailable property tax revenues 472$ Unavailable special assessment revenue 11,515 Receivables not yet collected 1,257 Total 13,244$

CITY OF MESA, ARIZONA NOTES TO FINANCIAL STATEMENTS FOR THE FISCAL YEAR ENDED JUNE 30, 2016
44 (Continued)
Deferred inflows relating to pensions represent a future acquisition of net position that is not reported in the funds.
Deferred Inflows – Pensions 36,705$
(2) Internal service funds are used by management to charge the costs of certain activities, such as fleet
support, materials and supplies, printing and graphics, and self-insurance, to the individual funds. The assets, liabilities, deferred inflows and deferred outflows of the internal service funds are included in the governmental activities in the statement of net position, but are not included on the governmental funds balance sheet.
Internal Service Funds total 10,628$

CITY OF MESA, ARIZONA NOTES TO FINANCIAL STATEMENTS FOR THE FISCAL YEAR ENDED JUNE 30, 2016
45 (Continued)
Reconciliation of the Governmental Funds Statement of Revenues, Expenditures and Changes in Fund Balance to the Government-wide Statement of Activities (in thousands):
Total Long-term Capital - Internal StatementGovernmental Revenues/ Related Service Long-term Eliminations of
Funds Expenses(1) Items(2) Funds(3) Debt (4) (5) ActivitiesRevenues and Other SourcesRevenues:
Sales Taxes 151,826$ -$ -$ -$ -$ -$ 151,826$ Property Taxes 34,765 (940) - - - - 33,825 Occupancy Taxes 2,331 - - - - - 2,331 Special Assessments 1,433 7,952 - - - - 9,385 Licenses and Permits 23,254 - - - - - 23,254 Intergovernmental 191,360 - - - - - 191,360 Charges for Services 38,178 - - - - - 38,178 Fines and Forfeitures 11,049 - - - - - 11,049 Investment Income 1,483 - - 727 - - 2,210 Contributions 961 - 44,935 19,308 - - 65,204 Miscellaneous 3,994 1,257 - 757 - - 6,008
Other Sources: Transfers In 122,572 - 4,040 - - (24,298) 102,314 Face Amount of Bonds Issued 89,834 - - - (89,834) - - Premiums on Issuance of Bonds 2,283 - - - (2,283) - - Total Revenue and Other Sources 675,323$ 8,269$ 48,975$ 20,792$ (92,117)$ (24,298)$ 636,944$
Expenditures/Expenses andOther Financing Uses
Expenditures/Expenses:Current: General Government 79,448$ 2,067$ 8,014$ 13,420$ (6,089)$ -$ 96,860$ Public Safety 254,528 27,389 11,463 11,996 - - 305,376 Community Environment 65,559 1,100 49,424 1,037 - - 117,120 Cultural-Recreational 43,651 952 9,059 1,305 - - 54,967 Debt Service: Principal 107,383 - - - (107,383) - - Interest on Bonds 18,581 - - - - - 18,581 Interest on Notes 324 - - - - - 324 Service Charge 14 - - - - - 14 Cost of Issuance 1,505 - - - - - 1,505 Capital Outlay 91,784 - (91,784) - - - -
Other Financing Uses:Transfers Out 24,298 - 166 - - (24,298) 166 Pmt to Ref Bond Escrow Agent 49,693 - - - (49,693) - -
Total Expenditures\Expenses & Other Financing Uses 736,768 31,508 (13,658) 27,758 (163,165) (24,298) 594,913
Net Change for the Year (61,445)$ (23,239)$ 62,633$ (6,966)$ 71,048$ -$ 42,031$
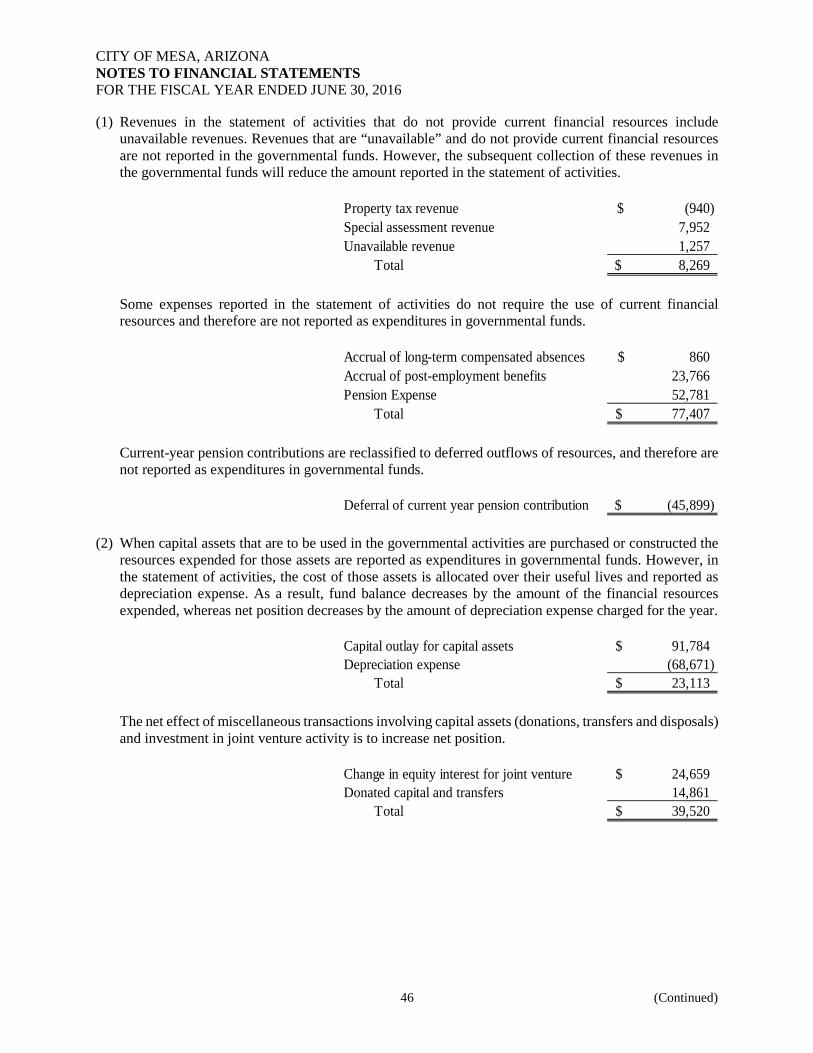
CITY OF MESA, ARIZONA NOTES TO FINANCIAL STATEMENTS FOR THE FISCAL YEAR ENDED JUNE 30, 2016
46 (Continued)
(1) Revenues in the statement of activities that do not provide current financial resources include unavailable revenues. Revenues that are “unavailable” and do not provide current financial resources are not reported in the governmental funds. However, the subsequent collection of these revenues in the governmental funds will reduce the amount reported in the statement of activities.
Property tax revenue (940)$ Special assessment revenue 7,952 Unavailable revenue 1,257 Total 8,269$
Some expenses reported in the statement of activities do not require the use of current financial resources and therefore are not reported as expenditures in governmental funds.
Accrual of long-term compensated absences 860$ Accrual of post-employment benefits 23,766 Pension Expense 52,781 Total 77,407$
Current-year pension contributions are reclassified to deferred outflows of resources, and therefore are not reported as expenditures in governmental funds.
Deferral of current year pension contribution (45,899)$
(2) When capital assets that are to be used in the governmental activities are purchased or constructed the
resources expended for those assets are reported as expenditures in governmental funds. However, in the statement of activities, the cost of those assets is allocated over their useful lives and reported as depreciation expense. As a result, fund balance decreases by the amount of the financial resources expended, whereas net position decreases by the amount of depreciation expense charged for the year.
Capital outlay for capital assets 91,784$ Depreciation expense (68,671) Total 23,113$
The net effect of miscellaneous transactions involving capital assets (donations, transfers and disposals) and investment in joint venture activity is to increase net position.
Change in equity interest for joint venture 24,659$ Donated capital and transfers 14,861 Total 39,520$

CITY OF MESA, ARIZONA NOTES TO FINANCIAL STATEMENTS FOR THE FISCAL YEAR ENDED JUNE 30, 2016
47 (Continued)
(3) Internal service funds are used by management to charge the costs of certain activities, such as fleet support, materials and supplies, printing and graphics, and self-insurance, to the individual funds. The adjustments for internal service funds “close” those funds by charging the additional amounts to participating governmental activities to completely cover the internal service funds’ costs for the year.
Revenue and other sources 20,792$ Expenditures and other uses (27,758) Change in net position (6,966)$
(4) Bond and note proceeds are reported as financing sources and the repayment of principal consumes
financial resources in the governmental funds. Neither transaction has any effect on the statement of activities.
New debt issued (including refunded debt):General Obligation bond proceeds (81,004)$ Community Facilities District Bonds (8,830) Principal repayments 107,383 Payment to refunded bond escrow accounts 46,281 Total 63,830$
Governmental funds report bond premiums and deferred amounts relating to refunding when first issued. In the statement of activities these amounts are amortized.
Amortization of deferred refunding amounts 3,412$ Amortization of bond premiums 7,051 Premiums on bonds (2,283) Deferred Amounts on refunding (962) Total 7,218$
(5) Interfund transfers between governmental activities, other than Internal Service Funds, are eliminated
in the consolidation of these activities for the statement of activities. The elimination is reflected as a reduction of transfers in and transfers out to eliminate the doubling up effect of these transactions within the governmental activities. Elimination of transfers to/from the Internal Service Funds is netted into the results of the Internal Service Funds in (3) above.
Transfers out (24,298)$ Transfers in 24,298 Total -$

CITY OF MESA, ARIZONA NOTES TO FINANCIAL STATEMENTS FOR THE FISCAL YEAR ENDED JUNE 30, 2016
48 (Continued)
3. FUND BALANCE As of June 30, 2016 the fund balance details by classification are listed below (in thousands):
HighwayProject Non-Major Total
General Advancement Governmental GovernmentalFund Balances: Fund Notes Funds FundsNonspendable:Prepaid Costs 2,621$ -$ 77$ 2,698$ Advances to Other Funds 1,414 - - 1,414
Nonspendable Sub-total 4,035 - 77 4,112
Restricted: Arts & Culture 184 - - 184 Capital Projects - - 25,931 25,931 Community Facility District - - 22 22 Court - - 1,279 1,279 Debt Service - 8,447 4,388 12,835 Fire - - 3,338 3,338 Housing - - 664 664 Library - - 313 313 Police - - 3,501 3,501 Transportation Programs - - 47,818 47,818
Restricted Sub-total 184 8,447 87,254 95,885
Committed To: Arts & Culture - - 1,129 1,129 Capital Projects - - 4,533 4,533 Cemetery 193 - 6,863 7,056 Debt Service - - 2,618 2,618 Development Services - - 995 995 Economic Development 34 - - 34 Environmental Compliance - - 9,494 9,494 Parks & Recreation - - 49 49 Vehicle Replacement - - 2,899 2,899 Committed To Sub-total 227 - 28,580 28,807
Assigned To: Development Services 27 - - 27 Economic Development 2,010 - - 2,010 General Government 5,023 - 6 5,029 Parks & Recreation 398 - - 398 Police 3,245 - - 3,245 Assigned To Sub-total 10,703 - 6 10,709
Unassigned 79,657 - (155) 79,502
Total Fund Balances 94,806$ 8,447$ 115,762$ 219,015$

CITY OF MESA, ARIZONA NOTES TO FINANCIAL STATEMENTS FOR THE FISCAL YEAR ENDED JUNE 30, 2016
49 (Continued)
The Mayor and Council has established a minimum fund balance policy for the General Fund of eight to ten percent of budgeted expenditures. The fund balance in the General Fund as of June 30, 2016 as reported in Exhibit B-6 is 13.4% of General Fund expenditures budgeted for fiscal year 2015-2016.
4. POOLED CASH AND INVESTMENTS Total Pooled City Cash and Investments at fair value are as follows (in thousands):
Cash on Hand 136$ Carrying Amount of City Deposits 47,371 Investment in Insured Cash Sweep Accounts 41,036 Investments in Local Govt Invest Pool 44,257 Cash with Trustee (1) 8,822 Cash with Fiscal Agent (2) 77,969 Long-Term Investments 343,292
Pooled Cash and Investments 562,883 Less: Cash in Agency Fund (10,236) Total City Pooled Cash and Investments 552,647$
(1) Represents bond and note proceeds held with trustee in compliance with bond/note agreements. Proceeds are invested in the Local Govt Investment Pool and are used by the City for authorized capital projects.(2) Represents cash sent by the City to fiscal agents on June 30, 2016 for debt service payments due to bondholders on July 1, 2016.
Deposits At year-end, the City’s cash totaled $47,506,310 which included $135,805 of petty cash. The carrying amount of the City’s deposits was $47,370,505 and the bank balance was $51,209,621. The difference of $3,839,116 represents outstanding checks and deposits in transit. Custodial Risk Cash deposits are subject to custodial risk. Custodial risk is the risk that in the event of bank failure, the city’s deposits may not be returned. To mitigate this risk, on July 1, 2014 Arizona House Bill 2619 Arizona Revised Statute (§35-1201 et. seq.) went into effect establishing a pooled collateral program for public deposits and creating a Statewide Collateral Pool Administrator (the “Administrator”) in the State Treasurer’s Office. The purpose of this Bill is to ensure that public deposits of governmental entities placed with participating banks are backed with collateral of 102% of the amount on deposit less applicable FDIC Deposit Insurance. The Administrator will monitor, audit and report on each bank’s compliance. Collateral under this program is pledged in the name of the Administrator and the City’s current bank is a participant in this program. The City’s cash balances on deposit as of June 30, 2016 are covered under House Bill 2619.

CITY OF MESA, ARIZONA NOTES TO FINANCIAL STATEMENTS FOR THE FISCAL YEAR ENDED JUNE 30, 2016
50 (Continued)
Investments The City’s Investment Policy is consistent with the City Charter which authorizes the investment of City funds in accordance with Arizona Revised Statute §35-313. These investments include obligations of the U.S. Treasury and U.S. agencies, certificates of deposit in eligible depositories, repurchase agreements, obligations of the State of Arizona or any of its counties or incorporated cities, towns or duly organized school districts, improvement districts in this state, State Treasurer’s Investment Pool, and investment grade corporate bonds, debentures, notes and other evidence of indebtedness issued or guaranteed by solvent U.S. corporations which are not in default as to principal or interest. Interest Rate Risk The City’s investment policy for limiting its exposure from rising interest rates complies with Arizona Revised Statute §35-323, which limits investments of public monies to maturities of five years or less. Credit Risk The City’s investment policy limits its purchase of investments to the top ratings issued by nationally recognized statistical ratings organizations such as Standard & Poor’s “S&P” and Moody’s Investors Service “Moody’s”. The City’s portfolio is primarily invested in securities issued by the U.S. Treasury and by U.S. Government Agency; Securities which are rated Aaa by Moody’s and AA+ by S&P. The City’s portfolio also invests in Corporate Notes rated “A” or better by Standard & Poor’s and participates in the State Treasurer’s Investment Pool (LGIP), which is overseen according to Arizona State Statute by the State Board of Deposit. Within the State Treasurer’s Investment Pools, the City participates in Investment Pools 7 and 700. Pool 7 is a short-term fund and Pool 700 is a medium-term fund; both funds invest only in products backed by the full faith and credit of the United States Government. The Pools carried weighted average credit ratings of AAA. The City also maintains short-term investments in FDIC Insured Cash Sweep Accounts held by two local banks. The City’s investment in their own Special Improvement District bonds have no credit rating. Fair Value of Investments The City measures and records its investments using fair value measurement guidelines established by generally accepted accounting principles. These guidelines recognize a three-tiered fair value hierarchy, as follows: • Level 1: Quoted prices for identical investments in active markets; • Level 2: Observable inputs other than quoted market prices; and, • Level 3: Unobservable inputs.
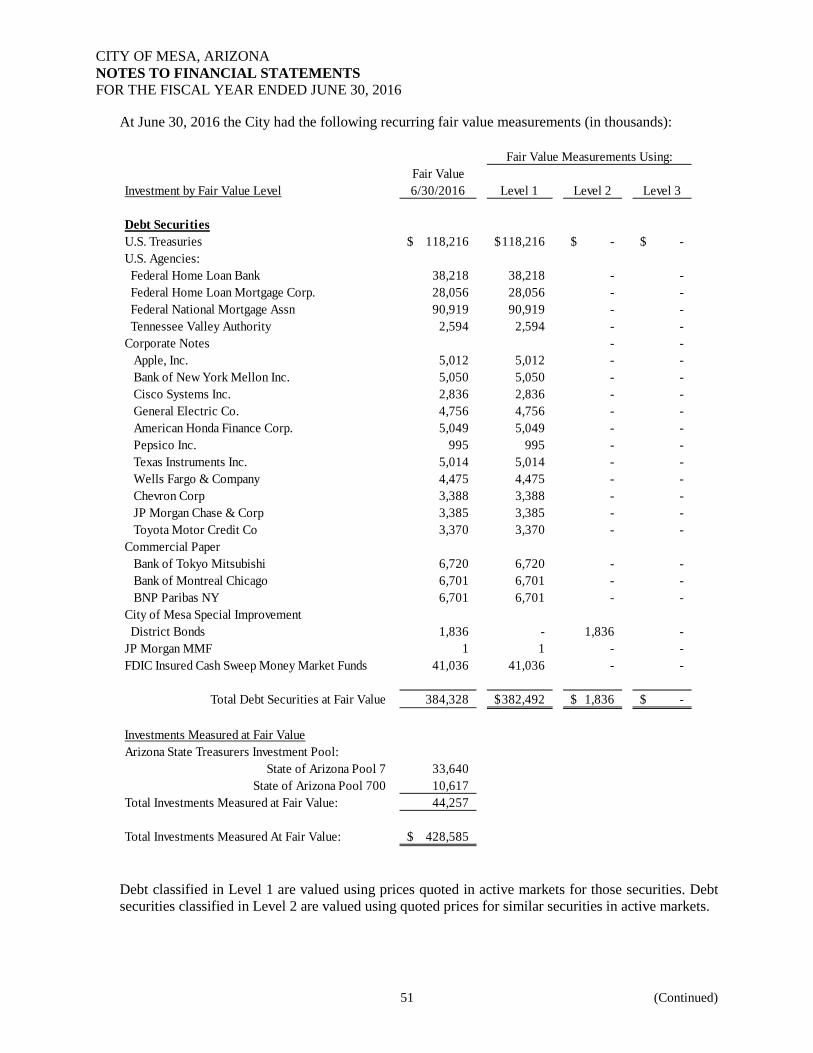
CITY OF MESA, ARIZONA NOTES TO FINANCIAL STATEMENTS FOR THE FISCAL YEAR ENDED JUNE 30, 2016
51 (Continued)
At June 30, 2016 the City had the following recurring fair value measurements (in thousands):
Investment by Fair Value LevelFair Value 6/30/2016 Level 1 Level 2 Level 3
Debt SecuritiesU.S. Treasuries 118,216$ 118,216$ -$ -$ U.S. Agencies: Federal Home Loan Bank 38,218 38,218 - - Federal Home Loan Mortgage Corp. 28,056 28,056 - - Federal National Mortgage Assn 90,919 90,919 - - Tennessee Valley Authority 2,594 2,594 - - Corporate Notes - - Apple, Inc. 5,012 5,012 - - Bank of New York Mellon Inc. 5,050 5,050 - - Cisco Systems Inc. 2,836 2,836 - - General Electric Co. 4,756 4,756 - - American Honda Finance Corp. 5,049 5,049 - - Pepsico Inc. 995 995 - - Texas Instruments Inc. 5,014 5,014 - - Wells Fargo & Company 4,475 4,475 - - Chevron Corp 3,388 3,388 - - JP Morgan Chase & Corp 3,385 3,385 - - Toyota Motor Credit Co 3,370 3,370 - - Commercial Paper Bank of Tokyo Mitsubishi 6,720 6,720 - - Bank of Montreal Chicago 6,701 6,701 - - BNP Paribas NY 6,701 6,701 - - City of Mesa Special Improvement District Bonds 1,836 - 1,836 - JP Morgan MMF 1 1 - - FDIC Insured Cash Sweep Money Market Funds 41,036 41,036 - -
Total Debt Securities at Fair Value 384,328 382,492$ 1,836$ -$
Investments Measured at Fair ValueArizona State Treasurers Investment Pool:
State of Arizona Pool 7 33,640 State of Arizona Pool 700 10,617
Total Investments Measured at Fair Value: 44,257
Total Investments Measured At Fair Value: 428,585$
Fair Value Measurements Using:
Debt classified in Level 1 are valued using prices quoted in active markets for those securities. Debt securities classified in Level 2 are valued using quoted prices for similar securities in active markets.

CITY OF MESA, ARIZONA NOTES TO FINANCIAL STATEMENTS FOR THE FISCAL YEAR ENDED JUNE 30, 2016
52 (Continued)
Investments valued using the net asset value (NAV) per share (or its equivalent) are City investments in Arizona State Treasurers Investment Pool (LGIP) and unlike more traditional investments, generally do not have readily obtainable market values. Investments valued at NAV utilized Net Asset Values as provided by State of Arizona Treasurer’s Office at June 30, 2016. The City’s investments at June 30, 2016 are as follows (in thousands):
Investment Type Fair Value Less Than 1 1-2 More than 2
Concentration of Credit Risk
%
U.S. Treasuries 118,216$ 7,332$ 43,729$ 67,155$ 34.44%U.S. Agencies: Federal Home Loan Bank 38,218 6,643 24,606 6,969 11.13% Federal Home Loan Mortgage Corp. 28,056 6,848 16,897 4,311 8.17% Federal National Mortgage Assn 90,919 15,393 15,554 59,972 26.48% Tennessee Valley Authority 2,594 2,594 - - 0.76%Corporate Notes Apple, Inc. 5,012 - 5,012 - 1.46% Bank of New York Mellon Inc. 5,050 - 5,050 * - 1.47% Cisco Systems Inc. 2,836 - 2,836 - 0.83% General Electric Co. 4,756 - 4,756 - 1.39% American Honda Finance Corp. 5,049 - 5,049 - 1.47% Pepsico Inc. 995 - 995 - 0.29% Texas Instruments Inc. 5,014 - 5,014 - 1.46% Wells Fargo & Company 4,475 - 4,475 - 1.30% Chevron Corp 3,388 - - 3,388 0.99% JP Morgan Chase & Corp 3,385 - - 3,385 ** 0.99% Toyota Motor Credit Co 3,370 - - 3,370 0.98%Commercial Paper Bank of Tokyo Mitsubishi 6,720 6,720 - - 1.96% Bank of Montreal Chicago 6,701 6,701 - - 1.95% BNP Paribas NY 6,701 6,701 - - 1.95%City of Mesa Special Improvement District Bonds 1,836 343 357 1,136 0.53%JP Morgan MMF 1 1 - - 0.00%Total 343,292$ 59,276$ 134,330$ 149,686$ 100.00%
Investment Maturities (in Years)
* $5,050 of these securities are callable on or after April 22, 2018** $3,385 of these securities are callable on or after February 22, 2019

CITY OF MESA, ARIZONA NOTES TO FINANCIAL STATEMENTS FOR THE FISCAL YEAR ENDED JUNE 30, 2016
53 (Continued)
5. ACCOUNTS RECEIVABLE AND DUE FROM OTHER GOVERNMENTS Accounts receivable are recorded in the various funds and displayed in the financial statements net of an allowance for uncollectible accounts as follows (in thousands):
Fund Receivables Allowance NetGovernmental Activities: General Fund: Taxes 11,771$ (2,038)$ 9,733$ Courts 5,917 - 5,917 Other Customers 6,434 (3,514) 2,920 Due from Other Governments: State Shared Revenues 5,932 - 5,932 Other 440 - 440 Non-Major Governmental Funds: Taxes 4,025 - 4,025 Other Customers 669 - 669 Restricted-Spec. Assessments 11,517 - 11,517 Restricted-Other 99 - 99 Restricted-Due from Other Governments 907 - 907 Due from Other Governments 12,120 - 12,120 Internal Service Funds Premiums 159 - 159 Other Customers 311 - 311 Due from Other Governments 5 - 5 Total Governmental Activities 60,306$ (5,552)$ 54,754$
Business-Type Activities: Utility Customers 26,736$ (747)$ 25,989$ Other Customers 2,985 (2,683) 302 Due from Other Governments 3,167 - 3,167 Total Business-type Activities 32,888$ (3,430)$ 29,458$

CITY OF MESA, ARIZONA NOTES TO FINANCIAL STATEMENTS FOR THE FISCAL YEAR ENDED JUNE 30, 2016
54 (Continued)
Governmental funds report unavailable revenue in connection with receivables for revenues that are not considered to be available to liquidate liabilities of the current period. Additionally, governmental funds record unearned revenue when resources have been received, but not yet earned. At the end of the current fiscal year, the various components of unavailable and unearned revenue reported in the governmental funds were as follows (in thousands):
HighwayProject
General Advancement Non-MajorUnearned Revenue Fund Notes FundsMesa Arts Center advanced ticket sales 1,239$ -$ 59$ Grants received prior to meeting all eligibility requirements - - 2,257 Amounts paid in advance 146 8,214 94
1,386$ 8,214$ 2,410$
General Non-MajorUnavailable Revenue Fund FundsReceivables not yet collected 1,035$ 222$ Delinquent Property Taxes - 472 Special Assessments not yet due - 11,515
1,035$ 12,209$
Unbilled Accounts Receivable Unbilled utility service receivables are recorded in the year in which the services are provided. At June 30, 2016, unbilled utility service receivables are recorded in the Enterprise Fund as follows (in thousands):
Electric 1,025$ Gas 782 Water 5,183 Wastewater 2,466 Solid Waste 1,941
11,397$
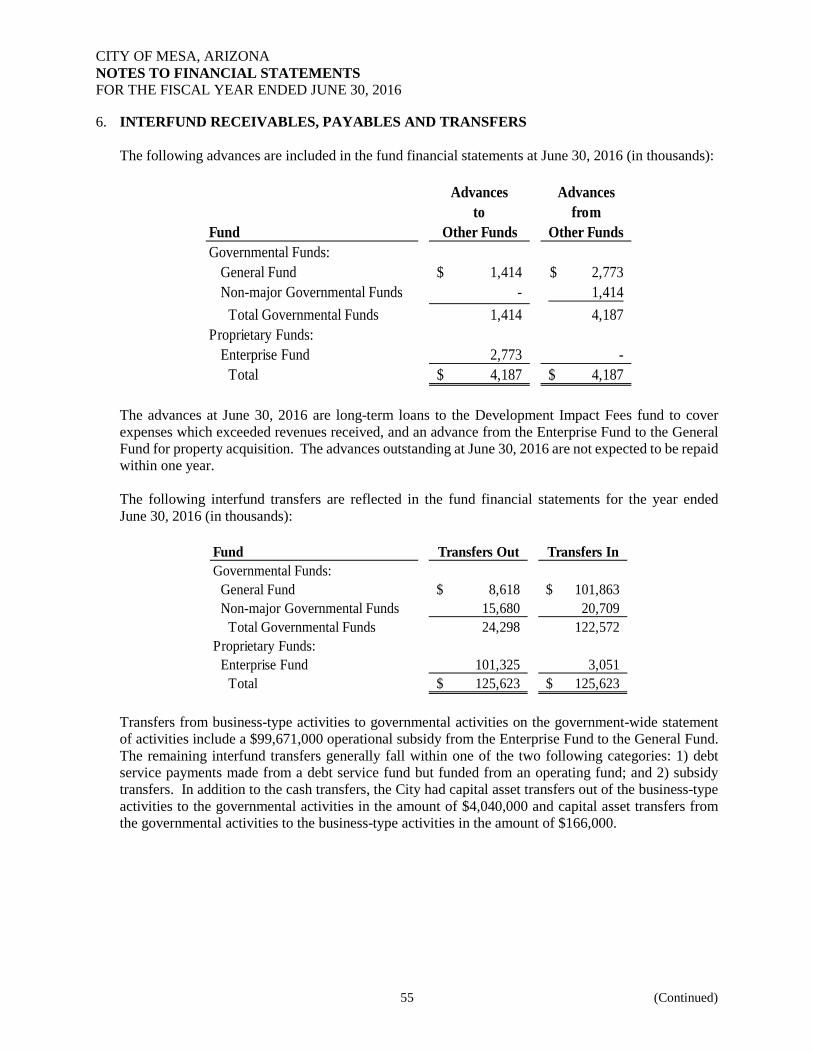
CITY OF MESA, ARIZONA NOTES TO FINANCIAL STATEMENTS FOR THE FISCAL YEAR ENDED JUNE 30, 2016
55 (Continued)
6. INTERFUND RECEIVABLES, PAYABLES AND TRANSFERS The following advances are included in the fund financial statements at June 30, 2016 (in thousands):
Advances Advancesto from
Fund Other Funds Other FundsGovernmental Funds:
General Fund 1,414$ 2,773$ Non-major Governmental Funds - 1,414 Total Governmental Funds 1,414 4,187 Proprietary Funds: Enterprise Fund 2,773 - Total 4,187$ 4,187$
The advances at June 30, 2016 are long-term loans to the Development Impact Fees fund to cover expenses which exceeded revenues received, and an advance from the Enterprise Fund to the General Fund for property acquisition. The advances outstanding at June 30, 2016 are not expected to be repaid within one year. The following interfund transfers are reflected in the fund financial statements for the year ended June 30, 2016 (in thousands):
Fund Transfers Out Transfers InGovernmental Funds: General Fund 8,618$ 101,863$ Non-major Governmental Funds 15,680 20,709 Total Governmental Funds 24,298 122,572 Proprietary Funds: Enterprise Fund 101,325 3,051 Total 125,623$ 125,623$
Transfers from business-type activities to governmental activities on the government-wide statement of activities include a $99,671,000 operational subsidy from the Enterprise Fund to the General Fund. The remaining interfund transfers generally fall within one of the two following categories: 1) debt service payments made from a debt service fund but funded from an operating fund; and 2) subsidy transfers. In addition to the cash transfers, the City had capital asset transfers out of the business-type activities to the governmental activities in the amount of $4,040,000 and capital asset transfers from the governmental activities to the business-type activities in the amount of $166,000.

CITY OF MESA, ARIZONA NOTES TO FINANCIAL STATEMENTS FOR THE FISCAL YEAR ENDED JUNE 30, 2016
56 (Continued)
7. CAPITAL ASSETS A summary of capital asset activity, for the government-wide financial statements, for the year ended June 30, 2016 follows (in thousands):
Balance BalanceJuly 1, 2015 Additions Retirements Transfers June 30, 2016
Governmental Activities:Non-depreciable Assets:
Land 348,421$ 35,322$ (1)$ -$ 383,742$ Infrastructure 3,308 13 - - 3,321 Construction-in-Progress 56,961 83,362 (58,871) (166) 81,286
Total Non-depreciable Assets 408,690 118,697 (58,872) (166) 468,349 Depreciable Assets:
Buildings 325,289 8,190 - 1,463 334,942 Other Improvements 171,521 12,543 (1,593) 2,225 184,696 Machinery & Equipment 182,070 16,814 (4,224) - 194,660 Intangibles 23,249 2 - - 23,251 Infrastructure 1,075,277 12,712 - 352 1,088,341
Total Depreciable Assets 1,777,406 50,261 (5,817) 4,040 1,825,890 Less Accumulated Depreciation for:
Buildings (89,582) (6,669) - - (96,251) Other Improvements (97,971) (8,127) 1,429 - (104,669) Machinery & Equipment (125,447) (11,009) 4,181 - (132,275) Intangibles (7,431) (5,276) - - (12,707) Infrastructure (500,299) (38,099) - - (538,398)
Total Accum. Depreciation (820,730) (69,180) 5,610 - (884,300) Total Depreciable Assets, net 956,676 (18,919) (207) 4,040 941,590 Governmental Activities
Capital Assets, net 1,365,366$ 99,778$ (59,079)$ 3,874$ 1,409,939$
Depreciation and Amortization expense was charged to governmental functions in the government-wide financial statements as follows (in thousands):
General Government 7,709$ Public Safety 11,319 Community Environment 40,698 Cultural-Recreational 8,945 Capital assets held by the City's Internal Service funds are charged
to the various functions based on their usage of assets 509 69,180$
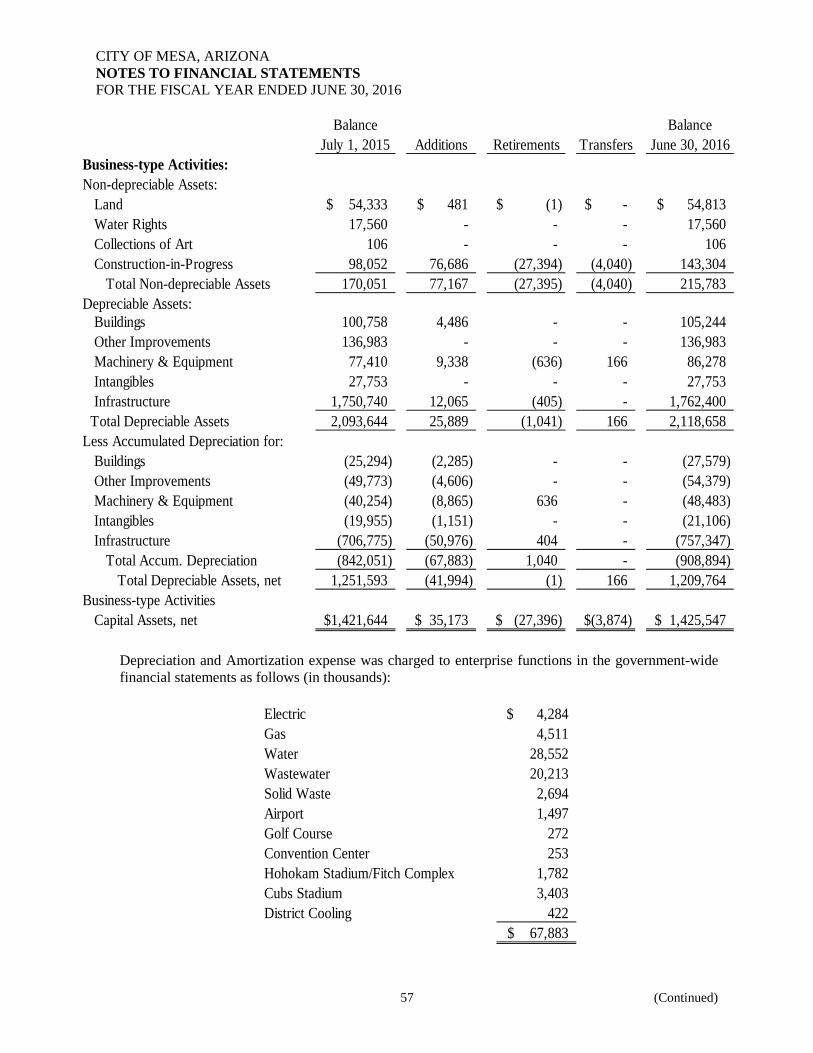
CITY OF MESA, ARIZONA NOTES TO FINANCIAL STATEMENTS FOR THE FISCAL YEAR ENDED JUNE 30, 2016
57 (Continued)
Balance BalanceJuly 1, 2015 Additions Retirements Transfers June 30, 2016
Business-type Activities:Non-depreciable Assets:
Land 54,333$ 481$ (1)$ -$ 54,813$ Water Rights 17,560 - - - 17,560 Collections of Art 106 - - - 106 Construction-in-Progress 98,052 76,686 (27,394) (4,040) 143,304
Total Non-depreciable Assets 170,051 77,167 (27,395) (4,040) 215,783 Depreciable Assets:
Buildings 100,758 4,486 - - 105,244 Other Improvements 136,983 - - - 136,983 Machinery & Equipment 77,410 9,338 (636) 166 86,278 Intangibles 27,753 - - - 27,753 Infrastructure 1,750,740 12,065 (405) - 1,762,400
Total Depreciable Assets 2,093,644 25,889 (1,041) 166 2,118,658 Less Accumulated Depreciation for:
Buildings (25,294) (2,285) - - (27,579) Other Improvements (49,773) (4,606) - - (54,379) Machinery & Equipment (40,254) (8,865) 636 - (48,483) Intangibles (19,955) (1,151) - - (21,106) Infrastructure (706,775) (50,976) 404 - (757,347)
Total Accum. Depreciation (842,051) (67,883) 1,040 - (908,894) Total Depreciable Assets, net 1,251,593 (41,994) (1) 166 1,209,764
Business-type ActivitiesCapital Assets, net 1,421,644$ 35,173$ (27,396)$ (3,874)$ 1,425,547$
Depreciation and Amortization expense was charged to enterprise functions in the government-wide financial statements as follows (in thousands):
Electric 4,284$ Gas 4,511 Water 28,552 Wastewater 20,213 Solid Waste 2,694 Airport 1,497 Golf Course 272 Convention Center 253 Hohokam Stadium/Fitch Complex 1,782 Cubs Stadium 3,403 District Cooling 422
67,883$

CITY OF MESA, ARIZONA NOTES TO FINANCIAL STATEMENTS FOR THE FISCAL YEAR ENDED JUNE 30, 2016
58 (Continued)
Construction in progress and related construction commitments are composed of the following (in thousands):
ConstructionGovernmental Activities in Progress Commitments
General Government 32,303$ 21,204$ Public Safety 978 278 Community Environment 45,203 26 Cultural-Recreational 2,722 77 Warehouse, Maintenance & Services 80 2 Total 81,286$ 21,587$
ConstructionBusiness-type Activities in Progress Commitments
Electric 5,821$ 594$ Gas 8,524 451 Water 79,637 17,053 Wastewater 26,811 4,947 Solid Waste 7,465 5,664 Airport 4,755 797 Golf Course 199 - Convention Center 1,071 63 Spring Training 9,021 194 District Cooling - 6 Total 143,304$ 29,769$
For the year ended June 30, 2016, the City capitalized net interest costs of $4,192,327. Total interest expense in the Business-type Activities Enterprise Fund before capitalization was $49,527,045.

CITY OF MESA, ARIZONA NOTES TO FINANCIAL STATEMENTS FOR THE FISCAL YEAR ENDED JUNE 30, 2016
59 (Continued)
8. LONG-TERM OBLIGATIONS a. Changes in Long-Term Obligations
The following is a summary of changes in long-term obligations (in thousands).
AmountsBeginning Ending Due WithinBalances Additions Reductions Balances One Year
Governmental Activities: Bonds Payable: General Obligation Bonds 336,716$ 81,005$ (67,161)$ 350,560$ 22,737$ Highway User Revenue Bonds 100,285 - (7,390) 92,895 7,900 Special Assessment Bonds with Governmental Commitment 2,830 - (745) 2,085 745 Community Facility District 10,974 8,830 (489) 19,315 511 Total Bonds Payable 450,805 89,835 (75,785) 464,855 31,893
Notes Payable 77,835 - (77,835) - - Unamortized Premiums 18,376 2,242 (7,051) 13,567 - Post Employment Benefits 382,000 39,935 (15,417) 406,518 - Compensated Absences 26,575 24,422 (23,552) 27,445 3,594 Governmental Activities Total 955,591$ 156,434$ (199,640)$ 912,385$ 35,487$
Business-type Activities: Bonds Payable: Revenue Bonds 1,007,455$ 228,535$ (172,280)$ 1,063,710$ 25,070$ General Obligation Bonds 474 105 (189) 390 78 Excise Tax Revenue Obligations 94,060 - - 94,060 - Total Bonds Payable 1,101,989 228,640 (172,469) 1,158,160 25,148
Notes Payable 2,116 - (131) 1,985 134 Unamortized Bond Premiums 22,521 20,079 (3,204) 39,396 - Post Employment Benefits 74,625 6,324 (2,442) 78,507 - Compensated Absences 3,938 3,721 (3,548) 4,111 493 Business-type Activities Total 1,205,189$ 258,764$ (181,794)$ 1,282,159$ 25,775$
Internal service funds predominantly serve the governmental funds. Accordingly, long-term liabilities for internal service funds are included as part of the above totals for governmental activities. At year-end, $11,043,000 of internal service funds post-employment benefits and compensated absences are included in the above amounts. For governmental activities, post-employment benefits and compensated absences are generally liquidated by the general fund.
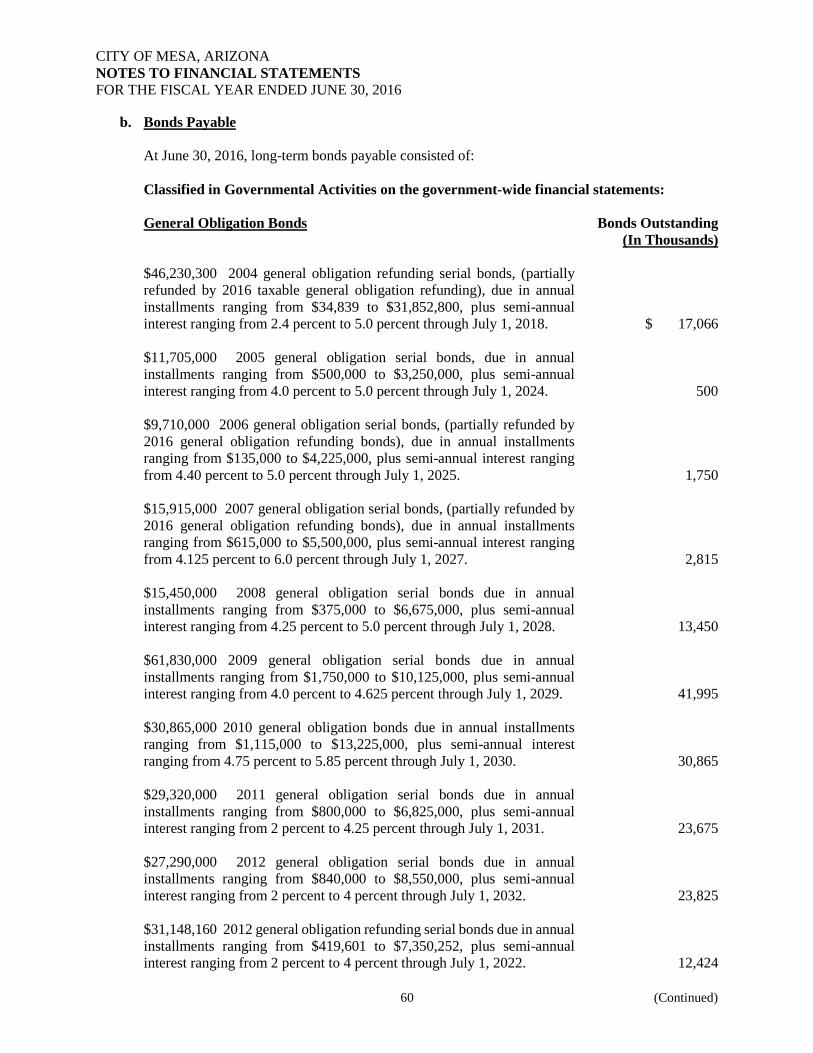
CITY OF MESA, ARIZONA NOTES TO FINANCIAL STATEMENTS FOR THE FISCAL YEAR ENDED JUNE 30, 2016
60 (Continued)
b. Bonds Payable At June 30, 2016, long-term bonds payable consisted of: Classified in Governmental Activities on the government-wide financial statements: General Obligation Bonds Bonds Outstanding (In Thousands) $46,230,300 2004 general obligation refunding serial bonds, (partially refunded by 2016 taxable general obligation refunding), due in annual installments ranging from $34,839 to $31,852,800, plus semi-annual interest ranging from 2.4 percent to 5.0 percent through July 1, 2018. $ 17,066 $11,705,000 2005 general obligation serial bonds, due in annual installments ranging from $500,000 to $3,250,000, plus semi-annual interest ranging from 4.0 percent to 5.0 percent through July 1, 2024. 500 $9,710,000 2006 general obligation serial bonds, (partially refunded by 2016 general obligation refunding bonds), due in annual installments ranging from $135,000 to $4,225,000, plus semi-annual interest ranging from 4.40 percent to 5.0 percent through July 1, 2025. 1,750 $15,915,000 2007 general obligation serial bonds, (partially refunded by 2016 general obligation refunding bonds), due in annual installments ranging from $615,000 to $5,500,000, plus semi-annual interest ranging from 4.125 percent to 6.0 percent through July 1, 2027. 2,815 $15,450,000 2008 general obligation serial bonds due in annual installments ranging from $375,000 to $6,675,000, plus semi-annual interest ranging from 4.25 percent to 5.0 percent through July 1, 2028. 13,450 $61,830,000 2009 general obligation serial bonds due in annual installments ranging from $1,750,000 to $10,125,000, plus semi-annual interest ranging from 4.0 percent to 4.625 percent through July 1, 2029. 41,995 $30,865,000 2010 general obligation bonds due in annual installments ranging from $1,115,000 to $13,225,000, plus semi-annual interest ranging from 4.75 percent to 5.85 percent through July 1, 2030. 30,865 $29,320,000 2011 general obligation serial bonds due in annual installments ranging from $800,000 to $6,825,000, plus semi-annual interest ranging from 2 percent to 4.25 percent through July 1, 2031. 23,675 $27,290,000 2012 general obligation serial bonds due in annual installments ranging from $840,000 to $8,550,000, plus semi-annual interest ranging from 2 percent to 4 percent through July 1, 2032. 23,825 $31,148,160 2012 general obligation refunding serial bonds due in annual installments ranging from $419,601 to $7,350,252, plus semi-annual interest ranging from 2 percent to 4 percent through July 1, 2022. 12,424
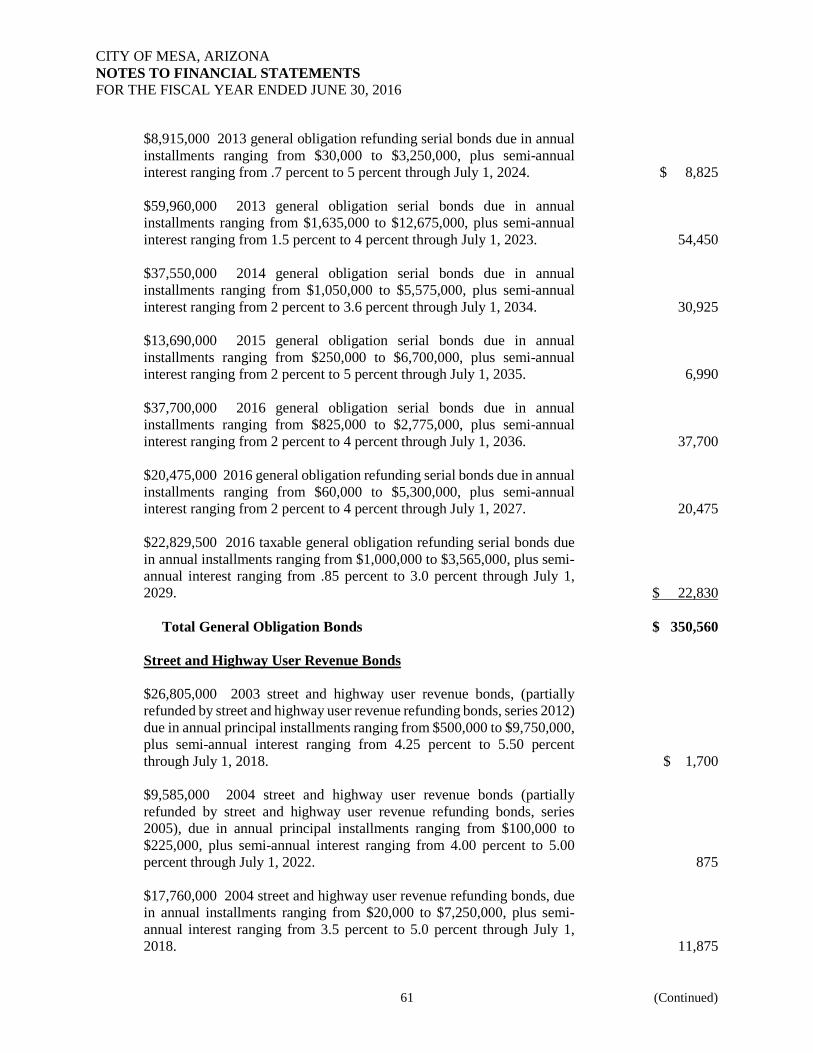
CITY OF MESA, ARIZONA NOTES TO FINANCIAL STATEMENTS FOR THE FISCAL YEAR ENDED JUNE 30, 2016
61 (Continued)
$8,915,000 2013 general obligation refunding serial bonds due in annual installments ranging from $30,000 to $3,250,000, plus semi-annual interest ranging from .7 percent to 5 percent through July 1, 2024. $ 8,825 $59,960,000 2013 general obligation serial bonds due in annual installments ranging from $1,635,000 to $12,675,000, plus semi-annual interest ranging from 1.5 percent to 4 percent through July 1, 2023. 54,450 $37,550,000 2014 general obligation serial bonds due in annual installments ranging from $1,050,000 to $5,575,000, plus semi-annual interest ranging from 2 percent to 3.6 percent through July 1, 2034. 30,925 $13,690,000 2015 general obligation serial bonds due in annual installments ranging from $250,000 to $6,700,000, plus semi-annual interest ranging from 2 percent to 5 percent through July 1, 2035. 6,990 $37,700,000 2016 general obligation serial bonds due in annual installments ranging from $825,000 to $2,775,000, plus semi-annual interest ranging from 2 percent to 4 percent through July 1, 2036. 37,700 $20,475,000 2016 general obligation refunding serial bonds due in annual installments ranging from $60,000 to $5,300,000, plus semi-annual interest ranging from 2 percent to 4 percent through July 1, 2027. 20,475 $22,829,500 2016 taxable general obligation refunding serial bonds due in annual installments ranging from $1,000,000 to $3,565,000, plus semi-annual interest ranging from .85 percent to 3.0 percent through July 1, 2029. $ 22,830 Total General Obligation Bonds $ 350,560 Street and Highway User Revenue Bonds $26,805,000 2003 street and highway user revenue bonds, (partially refunded by street and highway user revenue refunding bonds, series 2012) due in annual principal installments ranging from $500,000 to $9,750,000, plus semi-annual interest ranging from 4.25 percent to 5.50 percent through July 1, 2018. $ 1,700 $9,585,000 2004 street and highway user revenue bonds (partially refunded by street and highway user revenue refunding bonds, series 2005), due in annual principal installments ranging from $100,000 to $225,000, plus semi-annual interest ranging from 4.00 percent to 5.00 percent through July 1, 2022. 875 $17,760,000 2004 street and highway user revenue refunding bonds, due in annual installments ranging from $20,000 to $7,250,000, plus semi-annual interest ranging from 3.5 percent to 5.0 percent through July 1, 2018. 11,875

CITY OF MESA, ARIZONA NOTES TO FINANCIAL STATEMENTS FOR THE FISCAL YEAR ENDED JUNE 30, 2016
62 (Continued)
$23,800,000 2005 street and highway user revenue refunding bonds, due in annual principal installments ranging from $25,000 to $8,000,000, plus semi-annual interest ranging from 2.75 percent to 5.0 percent through July 1, 2023. $ 23,750 $10,225,000 2005 street and highway user revenue bonds, due in annual principal installments ranging from $50,000 to $8,500,000, plus semi-annual interest ranging from 4.0 percent to 5.0 percent through July 1, 2023. 975 $11,675,000 2006 street and highway user revenue bonds, due in annual installments ranging from $850,000 to $9,850,000, plus semi-annual interest ranging from 4.50 percent to 5.25 percent through July 1, 2024. 1,825 $10,675,000 2007 street and highway user revenue bonds, due in annual principal installments ranging from $1,000,000 to $3,900,000, plus semi-annual interest ranging from 4.25 percent to 5.0 percent through July 1, 2025. 3,000 $36,090,000 2012 street and highway user revenue refunding bonds, due in annual installments ranging from $665,000 to $9,700,000, plus semi-annual interest ranging from 3.0 percent to 5.0 percent through July 1, 2022. 22,840 $8,500,000 2013 street and highway user revenue refunding bonds, due in one installment of $8,500,000 plus semi-annual interest of 5 percent through July 1, 2024. 8,500 $17,555,000 2015 street and highway user revenue refunding bonds, due in annual installments ranging from $15,000 to $9,880,000 plus semi-annual interest of 3 to 5 percent through July 1, 2027. 17,555 Total Street and Highway User Revenue Bonds $ 92,895 Special Assessment Bonds (payable from special assessments levied on the benefited properties) $5,025,000 2005 special assessment district bonds, due in annual principal installments of $335,000, plus semi-annual interest of 5.80 percent, through January 1, 2021. $ 1,675 $4,091,840 2007 special assessment district bonds, due in annual principal installments ranging from $408,840 to $410,000, plus semi-annual interest of 5.0 percent, through January 1, 2017. 410 Total Special Assessment Bonds $ 2,085

CITY OF MESA, ARIZONA NOTES TO FINANCIAL STATEMENTS FOR THE FISCAL YEAR ENDED JUNE 30, 2016
63 (Continued)
Community Facilities District $2,712,000 2013 Eastmark Community Facilities District No. 1 (City of Mesa, Arizona) Assessment District No. 1 Special Assessment Revenue Bonds, due in annual principle installments ranging from $62,000 to $95,000, plus semi-annual interest ranging from 4.6 percent to 5.3 percent through July 1, 2038. $ 2,478 $3,250,000 2014 Eastmark Community Facilities District No. 1 (City of Mesa, Arizona) General Obligation Bonds, due in annual principle installments ranging from $65,000 to $225,000, plus semi-annual interest ranging from 4.8 percent to 5.3 percent through July 15, 2038. 3,105 $3,367,000 2014 Eastmark Community Facilities District No. 1 (City of Mesa, Arizona) Assessment District No. 2 Special Assessment Revenue Bonds, due in annual principle installments ranging from $85,000 to $225,000, plus semi-annual interest ranging from 2 percent to 5.375 percent through July 1, 2039. 3,195 $1,942,000 2015 Eastmark Community Facilities District No. 1 (City of Mesa, Arizona) Assessment District No. 3 Special Assessment Revenue Bonds, due in annual principle installments ranging from $52,000 to $135,000, plus semi-annual interest ranging from 2.3 percent to 5.2 percent through July 1, 2039. 1,929 $6,800,000 2016 Eastmark Community Facilities District No. 1 (City of Mesa, Arizona) General Obligation Bonds, due in annual principle installments ranging from $165,000 to $680,000, plus semi-annual interest ranging from 4 percent to 5 percent through July 15, 2039. 6,595 $970,000 2016 Eastmark Community Facilities District No. 1 (City of Mesa, Arizona) Assessment District No. 4 Special Assessment Revenue Bonds, due in annual principle installments ranging from $25,000 to $65,000, plus semi-annual interest ranging from 2.4 percent to 5 percent through July 1, 2040. 953 $1,060,000 2016 Eastmark Community Facilities District No. 1 (City of Mesa, Arizona) Assessment District No. 5 Special Assessment Revenue Bonds, due in annual principle installments ranging from $30,000 to $70,000, plus semi-annual interest ranging from 1.85 percent to 4.75 percent through July 1, 2040. 1,060 Total Community Facilities District Bonds $ 19,315 Total bonds payable recorded in governmental activities $ 464,855
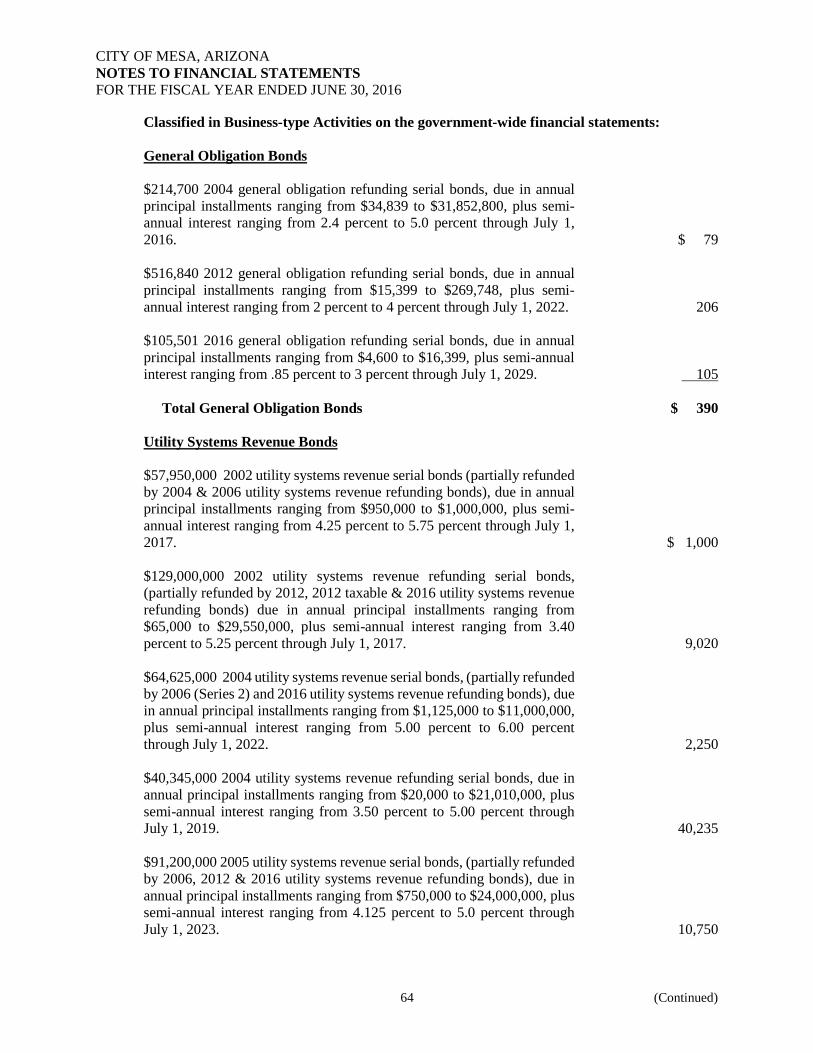
CITY OF MESA, ARIZONA NOTES TO FINANCIAL STATEMENTS FOR THE FISCAL YEAR ENDED JUNE 30, 2016
64 (Continued)
Classified in Business-type Activities on the government-wide financial statements: General Obligation Bonds $214,700 2004 general obligation refunding serial bonds, due in annual principal installments ranging from $34,839 to $31,852,800, plus semi-annual interest ranging from 2.4 percent to 5.0 percent through July 1, 2016. $ 79 $516,840 2012 general obligation refunding serial bonds, due in annual principal installments ranging from $15,399 to $269,748, plus semi-annual interest ranging from 2 percent to 4 percent through July 1, 2022. 206 $105,501 2016 general obligation refunding serial bonds, due in annual principal installments ranging from $4,600 to $16,399, plus semi-annual interest ranging from .85 percent to 3 percent through July 1, 2029. 105 Total General Obligation Bonds $ 390 Utility Systems Revenue Bonds $57,950,000 2002 utility systems revenue serial bonds (partially refunded by 2004 & 2006 utility systems revenue refunding bonds), due in annual principal installments ranging from $950,000 to $1,000,000, plus semi-annual interest ranging from 4.25 percent to 5.75 percent through July 1, 2017. $ 1,000 $129,000,000 2002 utility systems revenue refunding serial bonds, (partially refunded by 2012, 2012 taxable & 2016 utility systems revenue refunding bonds) due in annual principal installments ranging from $65,000 to $29,550,000, plus semi-annual interest ranging from 3.40 percent to 5.25 percent through July 1, 2017. 9,020 $64,625,000 2004 utility systems revenue serial bonds, (partially refunded by 2006 (Series 2) and 2016 utility systems revenue refunding bonds), due in annual principal installments ranging from $1,125,000 to $11,000,000, plus semi-annual interest ranging from 5.00 percent to 6.00 percent through July 1, 2022. 2,250 $40,345,000 2004 utility systems revenue refunding serial bonds, due in annual principal installments ranging from $20,000 to $21,010,000, plus semi-annual interest ranging from 3.50 percent to 5.00 percent through July 1, 2019. 40,235 $91,200,000 2005 utility systems revenue serial bonds, (partially refunded by 2006, 2012 & 2016 utility systems revenue refunding bonds), due in annual principal installments ranging from $750,000 to $24,000,000, plus semi-annual interest ranging from 4.125 percent to 5.0 percent through July 1, 2023. 10,750

CITY OF MESA, ARIZONA NOTES TO FINANCIAL STATEMENTS FOR THE FISCAL YEAR ENDED JUNE 30, 2016
65 (Continued)
$105,400,000 2006 utility systems revenue serial bonds, (partially refunded by 2006 (Series 2) & 2016 utility systems revenue refunding bonds), due in annual principal installments ranging from $8,650,000 to $36,750,000, plus semi-annual interest ranging from 4.375 percent to 5.0 percent through July 1, 2030. $ 17,650 $61,300,000 2006 utility systems revenue refunding serial bonds, due in annual principal installments ranging from $2,075,000 to $18,000,000, plus semi-annual interest ranging from 4.0 percent to 5.0 percent through July 1, 2021. 58,075 $127,260,000 2006 (Series 2) utility systems revenue refunding serial bonds, due in annual principal installments ranging from $50,000 to $25,845,000, plus semi-annual interest ranging from 4.0 percent to 5.25 percent through July 1, 2028. 126,700 $65,550,000 2007 utility systems revenue serial bonds, (partially refunded by 2016 utility systems revenue refunding bonds), due in annual principal installments ranging from $2,500,000 to $41,800,000, plus semi-annual interest ranging from 4.25 percent to 6.25 percent through July 1, 2031. 8,000 $52,875,000 2008 utility systems revenue serial bonds, (partially refunded by 2016 utility systems revenue refunding bonds), due in annual principal installments ranging from $700,000 to $44,675,000, plus semi-annual interest ranging from 4.875 percent to 5.25 percent through July 1, 2032. 6,100 $21,125,000 2008 utility systems revenue refunding serial bonds, due in annual principal installments ranging from $100,000 to $2,200,000, plus semi-annual interest ranging from 3.00 percent to 4.00 percent through July 1, 2018. 4,300 $59,900,000 2009 utility systems revenue serial bonds, due in annual principal installments ranging from $900,000 to $48,250,000, plus semi-annual interest ranging from 5.875 percent to 6.375 percent through July 1, 2033. 59,900 $50,380,000 2010 utility systems revenue serial bonds, due in one principal installment, plus semi-annual interest of 6.10 percent through July 1, 2034. 50,380 $53,950,000 2011 utility systems revenue serial bonds, due in one principal installment, plus semi-annual interest of 5.0 percent through July 1, 2035. 53,950 $67,300,000 2012 utility systems revenue serial bonds, due in one principal installment, plus semi-annual interest of 4.0 percent through July 1, 2036. 67,300

CITY OF MESA, ARIZONA NOTES TO FINANCIAL STATEMENTS FOR THE FISCAL YEAR ENDED JUNE 30, 2016
66 (Continued)
$31,580,000 2012 utility systems revenue refunding serial bonds, due in annual principal installments ranging from $7,440,000 to $9,150,000, plus semi-annual interest ranging from 4.0 percent to 4.826 percent through July 1, 2021. $ 22,430 $80,295,000 2012 taxable utility systems revenue refunding serial bonds, due in annual principal installments ranging from $3,225,000 to $9,150,000, plus semi-annual interest ranging from 3.269 percent to 5.048 percent through July 1, 2035. 80,295 $47,290,000 2013 utility systems revenue bonds, due in one principal installment, plus semi-annual interest of 4.0 percent through July 1, 2037. 47,290 $36,385,000 2014 utility systems revenue bonds, due in two principal installments of $20,000,000 and $16,385,000, plus semi-annual interest of 4.0 percent through July 1, 2038. 36,385 $102,945,000 2014 utility systems revenue refunding serial bonds, due in annual principal installments ranging from $475,000 to $22,955,000, plus semi-annual interest ranging from 2 percent to 4 percent through July 1, 2030. 102,945 $30,220,000 2015 utility systems revenue bonds, due in principal installments ranging from $1,000,000 to $2,375,000, plus semi-annual interest of 2 percent to 5 percent through July 1, 2039. 30,220 $90,500,000 2016 utility systems revenue serial bonds, due in annual principal installments ranging from $1,000,000 to $22,550,000, plus semi-annual interest ranging from 3 percent to 5 percent through July 1, 2040. 90,500 $138,035,000 2016 utility systems revenue refunding serial bonds, due in annual principal installments ranging from $3,375,000 to $44,890,000, plus semi-annual interest ranging from 4 percent to 5 percent through July 1, 2032. $ 138,035 Total Utility Systems Revenue Bonds $ 1,063,710 Excise Tax Revenue Obligations $94,060,000 2013 excise tax revenue obligation, due in annual principal installments ranging from $6,620,000 to $10,785,000, plus semi-annual interest of 5.0 percent through July 1, 2032. $ 94,060 Total bonds payable recorded in business-type activities $ 1,158,160

CITY OF MESA, ARIZONA NOTES TO FINANCIAL STATEMENTS FOR THE FISCAL YEAR ENDED JUNE 30, 2016
67 (Continued)
The following tables summarize the City’s debt service requirements to maturity for its long term bonds payable at June 30, 2016 (in thousands). The deferred amounts on refundings are not included.
Fiscal Year Principal Interest Total Fiscal Year Principal Interest Total2017 22,737$ 12,996$ 35,733$ 2017 7,900$ 4,473$ 12,373$ 2018 19,269 12,018 31,287 2018 8,375 4,080 12,455 2019 17,754 11,253 29,007 2019 8,715 3,663 12,378 2020 17,290 10,627 27,917 2020 9,155 3,243 12,398 2021 17,837 9,999 27,836 2021 9,645 2,796 12,441
2022-26 101,685 39,963 141,648 2022-26 45,200 6,568 51,768 2027-31 107,163 19,224 126,387 2027-31 3,905 156 4,061 2032-36 46,825 2,779 49,604 2032-36 - - -
TOTALS 350,560$ 118,859$ 469,419$ TOTALS 92,895$ 24,979$ 117,874$
Fiscal Year Principal Interest Total Fiscal Year Principal Interest Total2017 745$ 98$ 843$ 2017 511$ 910$ 1,421$ 2018 335 68 403 2018 527 895 1,422 2019 335 48 383 2019 544 878 1,422 2020 335 29 364 2020 557 858 1,415 2021 335 10 345 2021 582 837 1,419
2022-26 - - - 2022-26 3,320 3,801 7,121 2027-31 - - - 2027-31 4,148 2,961 7,109 2032-36 - - - 2032-36 5,306 1,813 7,119 2037-41 - - - 2037-41 3,820 399 4,219
TOTALS 2,085$ 253$ 2,338$ TOTALS 19,315$ 13,352$ 32,667$
General Obligation Bonds Highway User Revenue Bonds
Community Facilities District
Governmental Activities
Special Assessment Bonds

CITY OF MESA, ARIZONA NOTES TO FINANCIAL STATEMENTS FOR THE FISCAL YEAR ENDED JUNE 30, 2016
68 (Continued)
Fiscal Year Principal Interest Total Fiscal Year Principal Interest Total2017 78$ 13$ 91$ 2017 25,070$ 47,931$ 73,001$ 2018 76 11 87 2018 31,355 46,500 77,855 2019 46 7 53 2019 32,660 44,990 77,650 2020 40 6 46 2020 30,560 43,380 73,940 2021 43 5 48 2021 31,840 41,951 73,791
2022-26 75 10 85 2022-26 197,950 183,658 381,608 2027-31 32 1 33 2027-31 246,235 135,751 381,986 2032-36 - - - 2032-36 310,545 74,318 384,863 2037-41 - - - 2037-41 157,495 10,268 167,763
TOTALS 390$ 53$ 443$ TOTALS 1,063,710$ 628,747$ 1,692,457$
Business-type Activities
Revenue BondsGeneral Obligation Bonds
Fiscal Year Principal Interest Total2017 -$ 4,703$ 4,703$ 2018 - 4,703 4,703 2019 - 4,703 4,703 2020 - 4,703 4,703 2021 - 4,703 4,703
2022-26 36,585 20,035 56,620 2027-31 46,690 9,928 56,618
2032 10,785 539 11,324
TOTALS 94,060$ 54,017$ 148,077$
Excise Tax Revenue Obligations
Special Assessment Bonds The City acts as trustee for special assessment districts whereby it collects the assessments levied against owners of property within established districts and disburses the amounts collected to retire the bonds issued to finance the improvements. At June 30, 2016, the special assessments receivable, together with amounts paid in advance and interest to be received over the life of the assessment period, is adequate for the scheduled maturities of the bonds payable and the related interest. Improvement bonds are collateralized by properties within the districts. In the event of default by the property owner, the City may enforce an auction sale to satisfy the debt service requirements of the improvement bonds. The City is contingently liable on special assessment bonds to the extent that proceeds from auction sales are insufficient to retire outstanding bonds. Special assessment bonds payable with governmental commitment currently outstanding as of June 30, 2016 are $2,085,000. General Obligation Bonds The general obligation bonds are backed by the ultimate taxing power and general revenues of the City; however, $390,237 of these bonds at June 30, 2016 is carried as a liability of the Enterprise Fund to reflect the intention of retirement from resources of that fund.

CITY OF MESA, ARIZONA NOTES TO FINANCIAL STATEMENTS FOR THE FISCAL YEAR ENDED JUNE 30, 2016
69 (Continued)
All bonds, except Special Assessment Bonds, are callable by the City at various dates and at various premiums. The Arizona Constitution provides that the general obligation bonded indebtedness of a city for general municipal purposes may not exceed 6 percent of the secondary assessed valuation of the taxable property in that city. In addition to the 6 percent limitation for general municipal purpose bonds, cities may issue general obligation bonds up to an additional 20 percent of the secondary assessed valuation for supplying such city with water, artificial light or sewers, and for the acquisition and development of land for open space preserves, parks, playgrounds and recreation facilities, public safety, law enforcement, fire and emergency services facilities and streets and transportation facilities. The total debt margin available July 1, 2016 is (in thousands):
6% Bonds $ 164,428 20% Bonds 201,680 Total Available $ 366,108
City revenue bond indenture ordinances require that the net amount of revenues of the electric, gas, water, wastewater and solid waste systems (total revenues less operations and maintenance expenses) equal 120 percent of the principal and interest requirement in each fiscal year. The above covenant and all other bond covenants have been met.
c. Reserves for Bond Indentures Pursuant to the provisions of the Bond Resolution of the City of Mesa Utility System Revenue and Refunding bonds, Replacement and Reserve Funds are required to be established, into which a sum equal to 2 percent of the gross revenues – as determined on a modified accrual basis – must be deposited until a sum equal to two percent of all tangible assets of the Utility System is accumulated. As of June 30, 2016, the amount provided in the Replacement and Extension Funds equaled $25,293,503 which is in compliance with the bond provisions.
d. Notes Payable Governmental Activities The City issued $122,835,000 of Highway Project Advancement Notes (HPAN) to provide funds to the Arizona Department of Transportation (ADOT) for the acceleration of the right-of-way acquisition, design and construction of highway improvements to State Route 24 between State Route 202L and Ellsworth Road. The City entered into an intergovernmental agreement with ADOT and the Maricopa Association of Governments to advance the improvements to State Route 24. The agreement provides for repayment by ADOT to the City of the full amount of the City advance from monies available to ADOT for the project within a 60-month loan period. As of June 30, 2016, $122,835,000 has been repaid to the City by ADOT, and the City has paid $122,835,000 of HPAN notes. Business Type Activities The City has entered into a loan agreement with the State of Arizona Department of Transportation Aeronautics Division State Aviation Fund for the construction of T-Hangars at the airport. The interest rate on the notes is 6.02 percent.

CITY OF MESA, ARIZONA NOTES TO FINANCIAL STATEMENTS FOR THE FISCAL YEAR ENDED JUNE 30, 2016
70 (Continued)
The City entered into four separate loan agreements with the Water Infrastructure Finance Authority of Arizona. The purposes of the loans are to make improvements and upgrades to existing water and wastewater projects. The loans utilize funds from the United States Environmental Protection Agency pursuant to the federal American Reinvestment and Recovery Act of 2009. Subject to the City meeting the required specifications of the loan documents, two of the loans include a combined interest and fee rate subsidy and the two remaining loans include a principal forgiveness portion. Total principal (without principal forgiveness) is $3,486,902 and the loans have a 20-year repayment period. The total principal forgiveness is $626,000. Total interest over the 20 years with principal forgiveness and the combined interest and fee rate subsidy is $635,736. The following table reflects the annual requirements to amortize all notes outstanding as of June 30, 2016 (in thousands):
Interest Fiscal Year Principal & Fees Total
2017 134$ 44$ 178$ 2018 137 41 178 2019 140 38 178 2020 143 35 178 2021 146 31 177
2022-26 781 107 888 2027-29 504 22 526
TOTALS 1,985$ 318$ 2,303$
Business-type Activities
e. Short-term Debt
The City had no short-term debt activity for the fiscal year ended June 30, 2016.
f. Series 2012 Special Activity Revenue Bonds PMGAA issued $19,220,000 in special facility Revenue Bonds on February 29, 2012. The City has entered into a memorandum of understanding (MOU) with PMGAA and Able Engineering and Component Services for the development, construction and lease of an aircraft maintenance repair and overhaul facility at Phoenix-Mesa Gateway Airport. In general, the MOU addresses PMGAA issuing Special Facility Revenue Bonds, constructing the facility and leasing the facility to the City. The City, in turn, will sublease the facility to Able Engineering. The City pledged a portion of its excise taxes as security for payment of the base rent. The pledge of such excise taxes will be a junior lien subordinate to certain outstanding senior obligations. The bonds are payable from the future revenues from the City through 2038. During that time frame total principal and interest to be paid on the bonds will be $35,216,300. The bonds are not considered the debt of the City.
g. Pledged Revenues Utility System Revenue Bonds The City has pledged future utility customer revenues, net of specified operating expenses, to repay approximately $2.0 billion in utility system revenue bonds issued since 1997. Proceeds from the bonds provided financing for the construction of various utility related projects including new gas

CITY OF MESA, ARIZONA NOTES TO FINANCIAL STATEMENTS FOR THE FISCAL YEAR ENDED JUNE 30, 2016
71 (Continued)
pipelines and water and wastewater treatment plants. The bonds are payable solely from utility customer net revenues and are payable through 2040. Annual principal and interest payments on the bonds were 35.6 percent of net revenues. The total principal and interest remaining to be paid on the bonds is $1.7 billion. Principal and interest paid for the current year and total customer net revenues were $61,593,821 and $166,312,000, respectively. Highway User Revenue Bonds The City has pledged future Highway User Taxes Revenue to repay $230.5 million in highway user revenue bonds issued since 2002. Proceeds from the bonds provided financing for streets projects. The bonds are payable solely from the state shared Highway User Tax revenues and are payable through 2027. Annual principal and interest payments on the bonds were 37.9 percent of eligible revenues. The total principal and interest remaining to be paid on the bonds is $117,874,000. Principal and interest paid for the current year and total highway user tax revenues were $12,233,688 and $35,383,437, respectively. Special Assessment Bonds The special assessment revenues collected by the City are pledged to repay $9.1 million of special assessment bonds issued since 2005. Proceeds from the bonds are used to finance improvements that property owners have agreed to pay. In the event of default by the property owner, an auction sale may be enforced by the City. If collections and auction proceeds are not sufficient to retire outstanding bonds the City is contingently liable. These bonds are payable through 2021. Annual principal and interest payments on the bonds are expected to be covered 100% with collections from the property owners. The total principal and interest remaining to be paid on the bonds is $2,338,125. Principal and interest paid for the current year and total assessments collected were $882,615, and $790,082, respectively.
9. REFUNDED, REFINANCED AND DEFEASED OBLIGATIONS On March 17, 2016 the City defeased $9,000,000 of utility revenue bonds. On April 6, 2016, the City issued $138,035,000 of utility revenue bonds with an original issue premium of $19,395,105 to advance refund $146,480,000 of outstanding utility revenue bonds. The refunding bonds were issued with an interest rate ranging from 4.0 to 5.0 percent. Net proceeds in the amount of $157,081,973 (after payment of $207,544 in underwriters’ fees and deposit of $140,588 to the City’s bond fund) were provided to a refunding escrow agent to pay issuance costs of $400,000 for insurance premiums and other issuance costs with the remaining $156,681,973 used to provide cash and purchase United States Government securities. The cash and securities were deposited in an irrevocable trust to provide for all future debt service payments of the refunded bonds. As a result, the refunded bonds are considered to be defeased and the liability for those bonds has been removed from the debt of the City. The advanced refunding resulted in a difference between the reacquisition price and the net carrying amount of the old debt of $10,201,973. This difference, reported in the accompanying financial statements as a deduction from general obligation bonds payable, is being charged to operations through the year 2032 using the effective interest method. The purpose of the refunding was to take advantage of lower interest rates and restructure debt service payments to achieve a more level debt retirement schedule. The refunding will decrease debt service payments by $11,581,762 over the next 16 years producing an economic gain (difference between the present value of old and new debt service payments) of $13,583,987.

CITY OF MESA, ARIZONA NOTES TO FINANCIAL STATEMENTS FOR THE FISCAL YEAR ENDED JUNE 30, 2016
72 (Continued)
On April 6, 2016, the City issued $20,475,000 of general obligation bonds with an original issue premium of $1,128,271 to advance refund $20,475,000 of outstanding general obligation bonds. The refunding bonds were issued with an interest rate ranging from 2.0 to 4.0 percent. Net proceeds of $21,536,306 (after payment of $66,965 in underwriters’ fees) were provided to a refunding escrow agent to pay issuance costs of $187,326 for insurance premiums and other issuance costs with the remaining $21,348,980 used to provide cash and purchase United States Government securities. The cash and securities were deposited in an irrevocable trust to provide for all future debt service payments of the refunded bonds. As a result, the refunded bonds are considered to be defeased and the liability for those bonds has been removed from the debt of the City. The advanced refunding resulted in a difference between the reacquisition price and the net carrying amount of the old debt of $873,980. This difference, reported in the accompanying financial statements as a deduction from general obligation bonds payable, is being charged to operations through the year 2027 using the effective interest method. The purpose of the refunding was to take advantage of lower interest rates and restructure debt service payments to achieve a more level debt retirement schedule. The refunding will decrease debt service payments by $2,682,106 over the next 11 years producing an economic gain (difference between the present value of old and new debt service payments) of $2,371,379. On May 4, 2016, the City issued $22,935,000 of taxable general obligation bonds with an original issue premium of $133,437 and contributed cash in the amount of $5,666,755 to advance refund and defease $25,925,000 of outstanding general obligation bonds. The refunding bonds were issued with an interest rate ranging from 0.848 to 2.989 percent. Net proceeds in the amount of $28,659,932 (after payment of $71,696 in underwriters’ fees and deposit of $3,564 to the City’s bond fund) were provided to a refunding escrow agent to pay issuance costs of $185,000 for insurance premiums and other issuance costs with the remaining $28,474,931 used to provide cash and purchase United States Government securities. The cash and securities were deposited in an irrevocable trust to provide for all future debt service payments of the refunded bonds. As a result, the refunded bonds are considered to be defeased and the liability for those bonds has been removed from the debt of the City. The advanced refunding and defeasance resulted in a difference between the reacquisition price and the net carrying amount of the old debt of $2,549,332. This difference, reported in the accompanying financial statements as a deduction from general obligation bonds payable, is being charged to operations through the year 2029 using the effective interest method. The purpose of the refunding was to restructure debt service payments to achieve a more level debt retirement schedule. The refunding will increase debt service payments by $4,312,717 over the next 13 years producing an economic loss (difference between the present value of old and new debt service payments) of $1,159,105. Liabilities to be Paid from Assets Held in Escrow Liabilities to be paid from assets held in escrow include bonded debt of the City that has been provided for through an Advanced Refunding Bond Issue. Under an advanced refunding arrangement, refunding bonds are issued and the net proceeds, plus additional resources that may be required, are used to purchase securities issued or guaranteed by the United States Government. These securities are then deposited in an irrevocable trust under an escrow agreement which provides that all proceeds from the trust will be used to fund the principal and interest payments of the previously issued bonded debt being refunded. The trust deposits have been computed so that the securities in the trust, along with future cash flow generated by the securities, will be sufficient to service the previously issued bonds.

CITY OF MESA, ARIZONA NOTES TO FINANCIAL STATEMENTS FOR THE FISCAL YEAR ENDED JUNE 30, 2016
73 (Continued)
In accordance with GASB Statement No. 7, the refunded debt outstanding at June 30, 2016 as reflected below is not included in the City’s financial statements (in thousands). Utility System Revenue Bond Issue dated February 1, 2002 $ 15,200 Utility System Revenue Refunding Bond Issue dated February 1, 2002 7,000 Utility System Revenue Bond Issue dated February 1, 2003 4,000 General Obligation Bond Issue dated January 15, 2004 22,935 Utility System Revenue Bond Issue dated June 1, 2004 3,875 Utility System Revenue Bond Issue dated June 1, 2005 2,750 General Obligation Bond Issue dated June 1, 2006 7,375 General Obligation Bond Issue dated May 1, 2007 13,100 Utility System Revenue Bond Issue dated May 1, 2007 57,550 Street and Highway User Revenue Bond Issue dated May 1, 2007 7,675 Utility System Revenue Bond Issue dated May 29, 2008 46,775 Total Refunded Bonds Outstanding $ 188,235
10. SELF-INSURANCE INTERNAL SERVICE FUND The Property and Public Liability, Workers’ Compensation and Employee Benefits Internal Service Funds have been established to account for the costs of claims incurred by the City under self-insurance programs. The City is fully self-insured for all public liability risks, up to a maximum of $3,000,000 per occurrence, for the current policy year under the Property and Public Liability Insurance program. In addition, the City carries full property insurance with a $50,000 per occurrence deductible. Under the Workers’ Compensation Program, the City is subject to a maximum deductible of $1,000,000 liability per occurrence. In the Employee Benefits Fund, the City has excess insurance coverage when an individual’s claims exceed $225,000 per contract year. There were no changes in insurance coverage during this fiscal year for any of the three Self-Insurance Funds. The Workers’ Compensation Fund does not have a stop loss receivable at June 30, 2016. Over the past three fiscal years the Fund has received settlements in excess of insurance coverage of $189,911. The Fund has not received any settlements in excess of insurance coverage this past year. The Property and Public Liability Fund does not have a stop loss receivable at June 30, 2016, and the Fund has not received any settlements in excess of insurance coverage over the past three fiscal years. The Employee Benefits Fund does not have stop loss receivable at June 30, 2016. Over the past three fiscal years the Fund has received settlements in excess of insurance coverage of $4,519,450 with $2,023,119 received this current fiscal year.

CITY OF MESA, ARIZONA NOTES TO FINANCIAL STATEMENTS FOR THE FISCAL YEAR ENDED JUNE 30, 2016
74 (Continued)
The various funds of the City include, as expenditures, amounts contributed to each of the self-insurance funds during the fiscal year. The estimated liability for claims outstanding is determined by a yearly actuarial study in the Property and Public Liability Fund and the Workers Compensation Fund. The claims liability in the Employee Benefits Fund is generated by a third-party claims processing company. Changes in the balances of claims liabilities during the past two fiscal years are as follows (in thousands):
Workers' EmployeeCompensation Benefits Total
Unpaid Claims, 6/30/14 9,581$ 22,807$ 4,669$ 37,057$ Adjustments to Reserves-FY 14-15 679 3,976 54,894 59,549 Claim Payments-FY 14-15 (636) (3,118) (56,825) (60,579)
Unpaid Claims, 6/30/15 9,624 23,665 2,738 36,027
Adjustments to Reserves-FY 15-16 3,578 2,481 66,977 73,036 Claim Payments-FY 15-16 (603) (2,993) (67,019) (70,615)
Unpaid Claims, 6/30/16 12,599$ 23,153$ 2,696$ 38,448$
Property& PublicLiability
All unpaid claims are reported as current liabilities in the Statement of Net Position as the change in these amounts have already been expensed in the statement of activities.
11. COMMITMENTS AND CONTINGENT LIABILITIES a. Pending Litigation
The City is subject to a number of lawsuits, investigations, and other claims (some of which involve substantial amounts) that are incidental to the ordinary course of its operations, including those related to wrongful death and personal injury matters. Although the City Attorney does not currently possess sufficient information to reasonably estimate the amounts of the liabilities to be recorded upon the settlement of such claims and lawsuits, some claims could be significant to the City’s operations. While the ultimate resolution of such lawsuits, investigations, and claims cannot be determined at this time, in the opinion of City management, based on the advice of the City Attorney, the resolution of these matters will not have a material adverse effect on the City’s financial position.
b. Sick Leave Benefits Sick leave benefits provided for ordinary sick pay are not vested with the employee. Fifty percent of unused benefits are payable only upon retirement of an employee. In accordance with the criteria, sick leave paid within 60 days of the year-end has been recorded as a liability in the governmental fund financial statements. Long-term liabilities of governmental funds are not shown on the fund financial statements. In the government-wide financial statements as well as the proprietary fund

CITY OF MESA, ARIZONA NOTES TO FINANCIAL STATEMENTS FOR THE FISCAL YEAR ENDED JUNE 30, 2016
75 (Continued)
financial statements, an amount of estimated sick leave payable to employees has been expensed and the liability is shown in the appropriate funds. These amounts have been calculated based on the vested method. The total sick leave balance recorded as a liability at June 30, 2016, is $11,448,098.
12. NET POSITION a. Restricted Net Position
The government-wide statement of net position reports $131.1 million of restricted net position, of which $50.5 million is restricted by enabling legislation.
b. Designated Net Position The net position in the Employee Benefits Self Insurance Fund is designated for anticipated future losses and is a result of excess premiums charged to increase the fund balance specifically for this purpose.
c. Deficit Net Position The deficit in the Worker’s Compensation Self-Insurance Fund consists of prior years’ deficit where claims expenses exceeded revenues received. The City’s funding plan calls for yearly contributions from various funds to equal the years estimated claims and claim related expenses. Future claim liabilities are not considered in determining funding for each year. The deficit in the Warehouse, Maintenance and Services fund and Property and Public Liability Fund were a result of other post-employment benefit charges and pension expense.

CITY OF MESA, ARIZONA NOTES TO FINANCIAL STATEMENTS FOR THE FISCAL YEAR ENDED JUNE 30, 2016
76 (Continued)
13. ENTERPRISE ACTIVITIES OPERATIONS DETAIL The Enterprise Fund includes operations of electricity, gas, water, wastewater, solid waste, airport, golf course, convention center, stadiums and district cooling. Although the City’s Enterprise Fund does not meet the requirements for disclosing segment information, these services provided by the City are of such significance as to warrant certain additional disclosures. Operating revenue, expenses and operating income (loss) for the year ended June 30, 2016 for these services are as follows (in thousands):
FunctionsOperating Revenues
Depreciation and
Amortization Other
Operating Income (Loss)
Electric 32,254$ 4,284$ 22,098$ 5,872$ Gas 38,962 4,511 23,222 11,229 Water 125,304 28,552 48,113 48,639 Wastewater 71,708 20,213 31,316 20,179 Solid Waste 54,871 2,694 33,703 18,474 Airport 3,623 1,497 3,368 (1,242) Golf Course 1,645 272 2,312 (939) Convention Center 2,798 253 3,999 (1,454) Hohokam /Fitch Complex 63 1,782 1,131 (2,850) Cubs Stadium 201 3,403 1,868 (5,070) District Cooling 1,234 422 760 52 Total 332,663$ 67,883$ 171,890$ 92,890$
Operating Expenses
14. JOINT VENTURES The City currently participates in five joint ventures. The Greenfield Water Reclamation Plant and TOPAZ Regional Wireless Cooperative are managed by the City of Mesa, while the Subregional Operating Group, the Val Vista Water Treatment Plant, and Valley Metro Rail, Inc. are managed externally. The City's investment in these Joint Ventures as of June 30, 2016 is as follows (in thousands):
Governmental Activities
Business-Type Activities Total
Valley Metro Rail Inc. 172,723$ -$ 172,723$ TOPAZ Regional Wireless Cooperative 4,993 - 4,993 Subregional Operating Group - 85,862 85,862 Val Vista Water Treatment Plant - 56,042 56,042 Greenfield Water Reclamation Plant - 57,112 57,112 Joint Ventures Construction Deposits - 3,093 3,093
Total Investment in Joint Ventures 177,716$ 202,109$ 379,825$

CITY OF MESA, ARIZONA NOTES TO FINANCIAL STATEMENTS FOR THE FISCAL YEAR ENDED JUNE 30, 2016
77 (Continued)
Valley Metro Rail, Inc. “VMRI” The City currently participates in the Central Phoenix/East Valley Light Rail Transit (LRT) along with the cities of Phoenix, Tempe and Glendale. Valley Metro Rail, Inc. (VMRI) is the management agency that was incorporated to administer the joint agreement between the cities and has oversight responsibility for the planning, design, construction and operation of the system. The agreement provides voting rights for members of the representative cities, including passage of an annual budget. The City has ongoing financial responsibility as a result of the joint agreement including participation in the cost to construct and to operate the light rail project less any Federal reimbursements and operating fares. A total of $1,244,863,412 has been spent on this project through the fiscal year ended June 30, 2016, of which the City’s share and equity interest is $172,723,066. The City has received and accrued $59.7 million of funding from the Federal Transit Administration (FTA), Congestion Mitigation Air Quality (CMAQ) and Public Transit Funds (PTF) related to this project. In March 2010, the Mesa City Council approved a 3-mile extension of the LRT system and in August 2010, the Federal Transit Administration approved the alignment for project development as the next step toward federal funding. The extension begins at the eastern limits of VMRI’s existing light rail system (Sycamore) and extends east on Main Street to Mesa Drive. The entire extension is within the City of Mesa. There are four stations on Main Street including a station at Alma School Road, Country Club Drive, Center Street, and Mesa Drive. The extension opened on August 22, 2015. The total capital cost of $199.0 million was funded with a combination of federal and regional funds. In May 2011, the City entered into an agreement with VMRI for a developmental study to further extend the LRT system an additional two miles from Mesa Drive to Gilbert Road. Construction started fall of 2016. The extension is expected to open in late 2018. Separate financial statements for the activity can be obtained through Valley Metro Rail Inc. at 101 North First Avenue, Suite 1300, Phoenix, Arizona, 85003. TOPAZ Regional Wireless Cooperative The City of Mesa currently participates with the City of Apache Junction, Superstition Fire and Medical, the Town of Gilbert, the Town of Queen Creek and Rio Verde Fire District (the Parties) in an intergovernmental agreement to plan, design, construct, operate, maintain and finance the TOPAZ Regional Wireless Cooperative Network (TOPAZ). TOPAZ is a 700/800 MHz Network procured and built by the City of Mesa. The City acts as the lead agency and is responsible for the planning, budgeting, construction, operation and maintenance of the network. As lead agent, the City provides all management personnel and financing arrangements. The Parties participate in ownership of the network and are charged for operating and capital expenses based on six month rolling average of airtime. The City’s equity in the joint venture is $4,993,312 and is reflected in the governmental funds financial statements. Separate financial statements are not prepared.

CITY OF MESA, ARIZONA NOTES TO FINANCIAL STATEMENTS FOR THE FISCAL YEAR ENDED JUNE 30, 2016
78 (Continued)
Total investment in the joint venture as of June 30, 2016 is (in thousands):
City of Mesa 4,993$ Town of Gilbert 1,150 City of Apache Junction 101 Superstition Fire and Medical 411 Town of Queen Creek 69 Rio Verde Fire District 10 Fort McDowell -
Total Joint Venture 6,734$
Wastewater Subregional Operating Group The City participates with the cities of Phoenix, Glendale, Scottsdale and Tempe in the Subregional Operating Group (SROG). SROG was formed pursuant to the Joint Exercise of Powers Agreement (JEPA) in order to govern the construction, operation and maintenance of a multi-city sanitary sewer system (the “System”). The System includes the 91st Avenue Wastewater Treatment Plant, the Salt River Outfall Sewer, the Southern Avenue Interceptor and related transportation facilities. The City of Phoenix acts as the lead agency in SROG and is responsible for the planning, budgeting, construction, operation and maintenance of the plant in addition to providing all management personnel and financing arrangements. The various cities participate in ownership of the plant and are charged for operating expenses based on gallons of flow. The different agencies participate in each facility at varying rates depending on their needs at the time each facility was constructed. The City’s equity in the joint venture is $85,861,975 and is reflected in the proprietary funds financial statements. SROG has no bonded debt outstanding. Separate financial statements for the activity under the joint venture agreement can be obtained through the AMWUA office at 3003 N. Central Avenue, Suite 1550, Phoenix, Arizona, 85012. Greenfield Water Reclamation Project Construction of a joint water reclamation plant with the Towns of Gilbert and Queen Creek was completed on December 2, 2006. An expansion of the plant is expected to be completed in 2020. The City acts as the lead agency and is responsible for the planning, budgeting, construction, operation and maintenance of the plant. As lead agent, the City provides all management personnel and financing arrangements. Mesa, Gilbert and Queen Creek participate in ownership of the plant and are charged for operating expenses based on gallons of flow. The City’s equity in the joint venture is $57,112 and is reflected in the proprietary funds financial statements. Separate financial statements are not prepared. Total investment in the joint venture as of June 30, 2016 is (in thousands):
Mesa's Share 57,112$ Gilbert's Share 54,279 Queen Creek's Share 24,095
Total Joint Venture 135,486$

CITY OF MESA, ARIZONA NOTES TO FINANCIAL STATEMENTS FOR THE FISCAL YEAR ENDED JUNE 30, 2016
79 (Continued)
Water Val Vista Water Treatment Plant The City also participates with the City of Phoenix in the Val Vista Water Treatment Plant and Transmission Line. The City of Phoenix is responsible for the planning, budgeting, construction, operation and maintenance of the plant. As lead agency, Phoenix provides all management personnel and financing arrangements. Phoenix and Mesa participate in ownership of the plant and are charged for operating expenses based on gallons of water treated. The City’s investment in the joint venture is $56,041,918 and is reflected in the proprietary funds financial statements. The water treatment plant has no bonded debt outstanding. Separate financial statements for the activity can be obtained through the City of Phoenix, Finance Department, Financial Accounting and Reporting Division at 251 W. Washington Street, 9th Floor, Phoenix, Arizona, 85003.
15. RETIREMENT AND PENSION PLANS All benefitted employees of the City are covered by one of three pension systems. The Arizona State Retirement System is for the benefit of the employees of the state and certain other governmental jurisdictions. All benefited City employees, except sworn fire and police personnel and the Mayor and City Council Members, are included in the plan that is a multiple-employer cost-sharing defined benefit pension plan. All sworn fire and police personnel participate in the Public Safety Personnel Retirement System that is an agent multiple-employer plan. The Mayor and City Council Members contribute to the State’s Elected Officials Retirement Plan that is also a multiple-employer cost-sharing pension plan. The Elected Officials Retirement Plan is not described below because of its relative insignificance to the financial statements. At June 30, 2016, the City reported the following aggregate amounts related to pensions for all plans to which it contributes (in thousands):
Statement of Net Position and Statement of Activities
Governmental Activities
Business-Type Activities Total
Net Pension Liabilities 634,414$ 47,493$ 681,907$ Deferred Outflows of Resources 105,401 4,555 109,956 Deferred Inflows of Resources 37,881 4,653 42,534 Pension Expense 53,949 2,058 56,007
Arizona State Retirement System Defined Benefit Plan: a. Plan Description
All the City’s eligible benefitted general employees participate in the Arizona State Retirement System (“ASRS”), a multiple-employer, cost-sharing defined benefit pension plan. ASRS was established by the State of Arizona to provide pension benefits for employees of the state and employees of participating political subdivisions and school districts. ASRS is administered in accordance with Title 38, Chapter 5 of the Arizona Revised Statutes (“A.R.S.”). ASRS provides for retirement, disability, and death and survivor benefits. ASRS issues a publicly available financial report that includes financial statements and required supplementary information. The report may be obtained by writing to the Arizona State Retirement System, P.O. Box 33910, Phoenix, Arizona, 85067-3910 or by calling 1-800-621-3778.
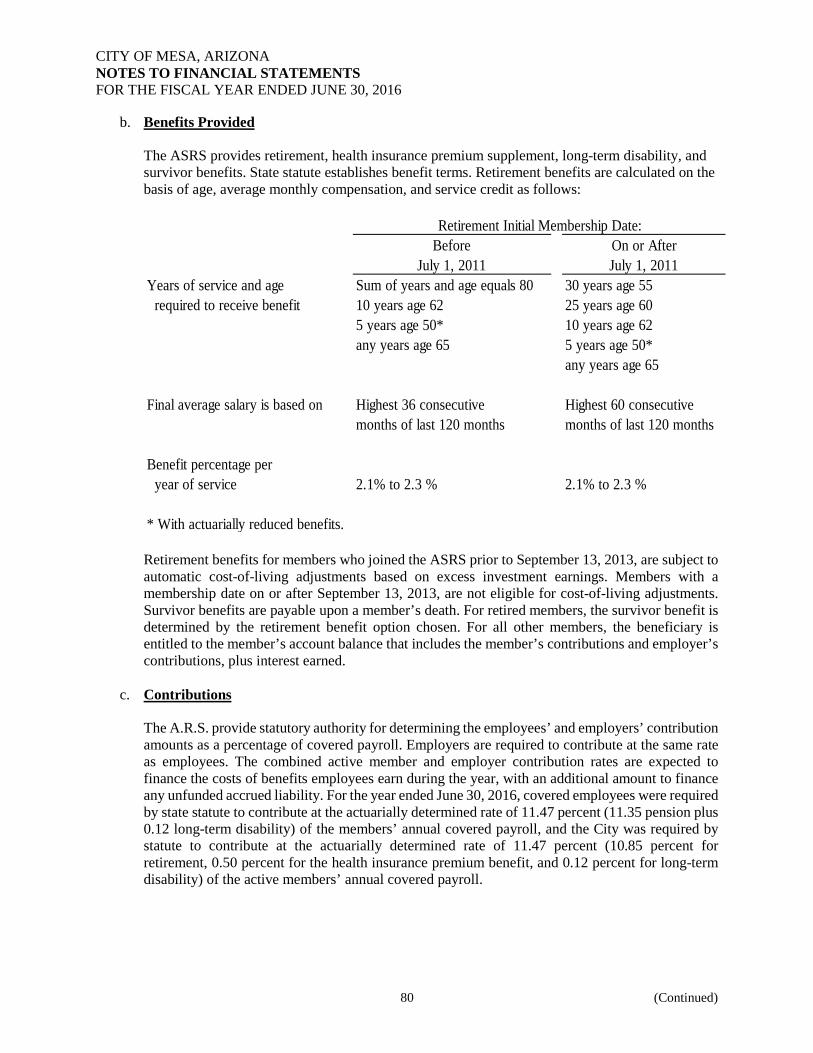
CITY OF MESA, ARIZONA NOTES TO FINANCIAL STATEMENTS FOR THE FISCAL YEAR ENDED JUNE 30, 2016
80 (Continued)
b. Benefits Provided The ASRS provides retirement, health insurance premium supplement, long-term disability, and survivor benefits. State statute establishes benefit terms. Retirement benefits are calculated on the basis of age, average monthly compensation, and service credit as follows:
BeforeJuly 1, 2011
On or AfterJuly 1, 2011
Years of service and age Sum of years and age equals 80 30 years age 55 required to receive benefit 10 years age 62 25 years age 60
5 years age 50* 10 years age 62any years age 65 5 years age 50*
any years age 65
Final average salary is based on Highest 36 consecutive Highest 60 consecutivemonths of last 120 months months of last 120 months
Benefit percentage per year of service 2.1% to 2.3 % 2.1% to 2.3 %
Retirement Initial Membership Date:
* With actuarially reduced benefits. Retirement benefits for members who joined the ASRS prior to September 13, 2013, are subject to automatic cost-of-living adjustments based on excess investment earnings. Members with a membership date on or after September 13, 2013, are not eligible for cost-of-living adjustments. Survivor benefits are payable upon a member’s death. For retired members, the survivor benefit is determined by the retirement benefit option chosen. For all other members, the beneficiary is entitled to the member’s account balance that includes the member’s contributions and employer’s contributions, plus interest earned.
c. Contributions The A.R.S. provide statutory authority for determining the employees’ and employers’ contribution amounts as a percentage of covered payroll. Employers are required to contribute at the same rate as employees. The combined active member and employer contribution rates are expected to finance the costs of benefits employees earn during the year, with an additional amount to finance any unfunded accrued liability. For the year ended June 30, 2016, covered employees were required by state statute to contribute at the actuarially determined rate of 11.47 percent (11.35 pension plus 0.12 long-term disability) of the members’ annual covered payroll, and the City was required by statute to contribute at the actuarially determined rate of 11.47 percent (10.85 percent for retirement, 0.50 percent for the health insurance premium benefit, and 0.12 percent for long-term disability) of the active members’ annual covered payroll.
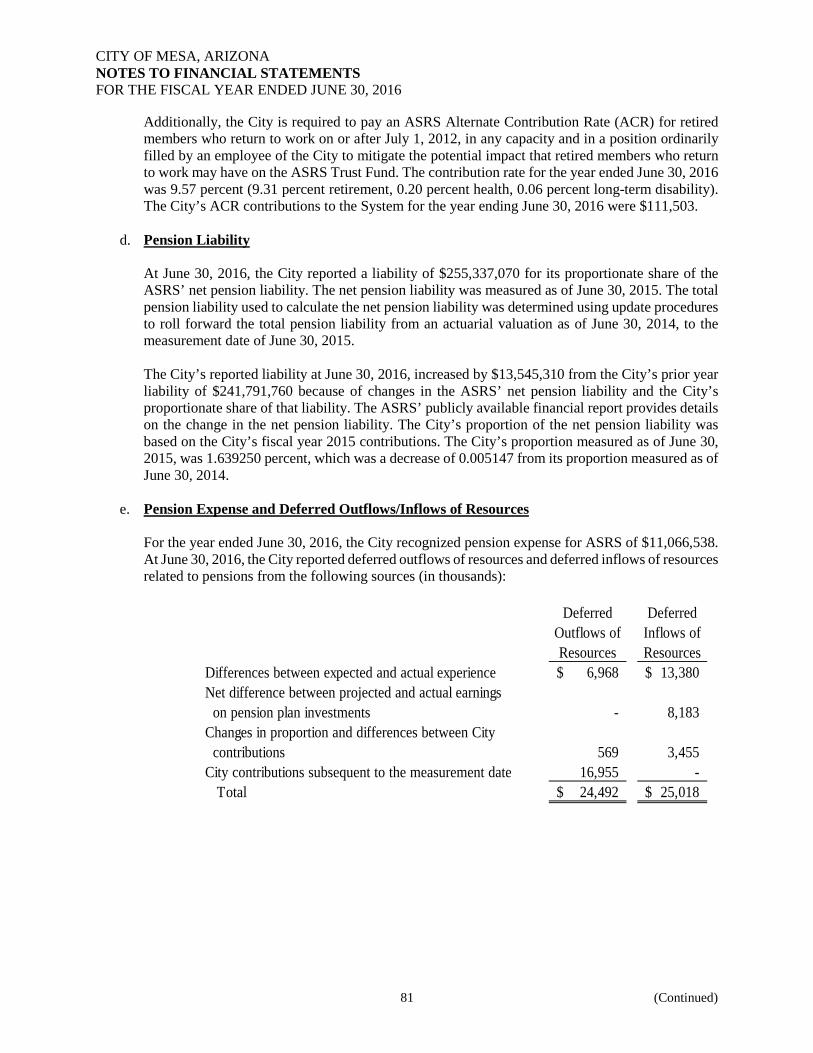
CITY OF MESA, ARIZONA NOTES TO FINANCIAL STATEMENTS FOR THE FISCAL YEAR ENDED JUNE 30, 2016
81 (Continued)
Additionally, the City is required to pay an ASRS Alternate Contribution Rate (ACR) for retired members who return to work on or after July 1, 2012, in any capacity and in a position ordinarily filled by an employee of the City to mitigate the potential impact that retired members who return to work may have on the ASRS Trust Fund. The contribution rate for the year ended June 30, 2016 was 9.57 percent (9.31 percent retirement, 0.20 percent health, 0.06 percent long-term disability). The City’s ACR contributions to the System for the year ending June 30, 2016 were $111,503.
d. Pension Liability At June 30, 2016, the City reported a liability of $255,337,070 for its proportionate share of the ASRS’ net pension liability. The net pension liability was measured as of June 30, 2015. The total pension liability used to calculate the net pension liability was determined using update procedures to roll forward the total pension liability from an actuarial valuation as of June 30, 2014, to the measurement date of June 30, 2015. The City’s reported liability at June 30, 2016, increased by $13,545,310 from the City’s prior year liability of $241,791,760 because of changes in the ASRS’ net pension liability and the City’s proportionate share of that liability. The ASRS’ publicly available financial report provides details on the change in the net pension liability. The City’s proportion of the net pension liability was based on the City’s fiscal year 2015 contributions. The City’s proportion measured as of June 30, 2015, was 1.639250 percent, which was a decrease of 0.005147 from its proportion measured as of June 30, 2014.
e. Pension Expense and Deferred Outflows/Inflows of Resources For the year ended June 30, 2016, the City recognized pension expense for ASRS of $11,066,538. At June 30, 2016, the City reported deferred outflows of resources and deferred inflows of resources related to pensions from the following sources (in thousands):
Deferred Outflows of Resources
Deferred Inflows of Resources
Differences between expected and actual experience 6,968$ 13,380$ Net difference between projected and actual earnings on pension plan investments - 8,183 Changes in proportion and differences between City contributions 569 3,455 City contributions subsequent to the measurement date 16,955 -
Total 24,492$ 25,018$

CITY OF MESA, ARIZONA NOTES TO FINANCIAL STATEMENTS FOR THE FISCAL YEAR ENDED JUNE 30, 2016
82 (Continued)
The $16,955,163 reported as deferred outflows of resources related to ASRS pensions resulting from City contributions subsequent to the measurement date will be recognized as a reduction of the net pension liability in the year ended June 30, 2017. Other amounts reported as deferred outflows of resources and deferred inflows of resources related to ASRS pensions will be recognized in pension expense as follows (in thousands):
2016 (7,818)$ 2017 (9,709) 2018 (5,861) 2019 5,907 2020 - Thereafter -
(17,481)$
Year Ended June 30,
f. Actuarial Assumptions
The significant actuarial assumptions used to measure the total pension liability are as follows:
Actuarial Valuation Date June 30, 2014Actuarial Roll Forward Date June 30, 2015Actuarial Cost Method Entry Age NormalInvestment Rate of Return 8%Projected Salary Increases 3 - 6.75%Inflation 3%Permanent Benefit Increase IncludedMortality Rates 1994 GAM Scale BB
Actuarial assumptions used in the June 30, 2014 valuation were based on the results of an actuarial study for the 5-year period ended June 30, 2013. The long-term expected rate of return on ASRS pension plan investments was determined to be 8.79 percent using a building block method in which best-estimate ranges of expected future real rates of return (expected returns, net of pension plan investment expense and inflation) are developed for each major asset class. These ranges are combined to produce the long-term expected rate of return by weighing the expected future real rates of return by the target asset allocation percentage and by adding expected inflation.

CITY OF MESA, ARIZONA NOTES TO FINANCIAL STATEMENTS FOR THE FISCAL YEAR ENDED JUNE 30, 2016
83 (Continued)
The target allocation and best estimates of arithmetic real rates of return for each major asset class are summarized in the following table:
Asset ClassTarget
AllocationLong-Term Expected Real Rate of Return
Equity 58% 3.94%Fixed Income 25% 0.93%Commodities 2% 0.08%Real Estate 10% 0.42%Multi-asset class 5% 0.17%
Total 100%
g. Discount Rate
The discount rate used to measure the ASRS total pension liability was 8 percent, which is less than the long-term expected rate of return of 8.79 percent. The projection of cash flows used to determine the discount rate assumed that contributions from participating employers will be made based on the actuarially determined rates based on the ASRS Board’s funding policy, which establishes the contractually required rate under Arizona statutes. Based on those assumptions, the pension plan’s fiduciary net position was projected to be available to make all projected future benefit payments of current plan members. Therefore, the long-term expected rate of return on pension plan investments was applied to all periods of projected benefit payments to determine the total pension liability.
h. Sensitivity of the City’s Proportionate Share of the ASRS Net Pension Liability to Changes in the Discount Rate The following table presents the City’s proportionate share of the net pension liability calculated using the discount rate of 8 percent, as well as what the City’s proportionate share of the net pension liability would be if it were calculated using a discount rate that is 1 percentage point lower (7 percent) or 1 percentage point higher (9 percent) than the current rate (in thousands):
1% DecreaseCurrent
Discount Rate 1% Increase7% 8% 9%
City's proportionate share of the net pension liability 334,579$ 255,337$ 201,031$
i. Pension Plan Fiduciary Net Position Detailed information about the pension plan’s fiduciary net position is available in the separately issued ASRS financial report.

CITY OF MESA, ARIZONA NOTES TO FINANCIAL STATEMENTS FOR THE FISCAL YEAR ENDED JUNE 30, 2016
84 (Continued)
Public Safety Personnel Retirement System: a. Plan Description
The City contributes to the Public Safety Personnel Retirement System (“PSPRS”), an agent multiple-employer public safety employee retirement system that acts as a common investment and administrative agent for the various sworn fire and police agencies within the state. All sworn fire and police personnel are eligible to participate in the plan. The plan provides retirement, disability benefits, and death benefits to plan members and beneficiaries. The PSPRS is jointly administered by the Fund Manager and 256 Local Boards and was established by Title 38, Chapter 5 Article 4 of the Arizona Revised Statutes. The PSPRS issues a publicly available financial report that includes financial statements and required supplementary information. This report may be obtained by writing to Public Safety Personnel Retirement System, 1020 East Missouri, Phoenix, Arizona, 85014 or by calling 602-255-5575.

CITY OF MESA, ARIZONA NOTES TO FINANCIAL STATEMENTS FOR THE FISCAL YEAR ENDED JUNE 30, 2016
85 (Continued)
b. Benefits Provided The PSPRS provides retirement, health insurance premium supplement, disability, and survivor benefits. State statute establishes benefits terms. Retirement, disability, and survivor benefits are calculated on the basis of age, average monthly compensation, and service credit as follows:
BeforeJanuary 1, 2012 On or after January 1, 2012
Retirement and DisabilityYears of service 20 years any age 25 years age of 52.5 and age required to receive benefit 15 years age 62
Final average salary is based on Highest 36 consecutive Highest 60 consecutive monthsmonths of last 20 years of last 20 years
Benefit percentage Normal Retirement 50% less 2.0% for each year of credited
service less than 20 years OR plus 2.0% to 2.5% for each year of credited service, not to exceed 80%
2.5% for each year of credited service not to exceed 80%
Accidental Disability Retirement
Catastrophic Disability Retirement
Ordinary Disability Retirement
Survivor Benefit Retired Members
Active Members
Initial Membership Date:
50% or normal retirement, whichever is greater
90% for the first 60 months then reduced to either 62.5% or normal retirement, whichever is greater
Normal retirement calculated with actual years of credited service or 20 years of credited service, whichever is greater, multiplied by years of credited service (not
to exceed 20 years) divided by 20
80% to 100% of accidental disability retirement benefit or 100% of average monthly compensation if death was the result of injuries received on the job
80% to 100% of retired member's pension benefit
Retirement and survivor benefits are subject to automatic cost-of-living adjustments based on excess investment earning. PSPRS also provides temporary disability benefits of 50 percent of the member’s compensation for up to 12 months.

CITY OF MESA, ARIZONA NOTES TO FINANCIAL STATEMENTS FOR THE FISCAL YEAR ENDED JUNE 30, 2016
86 (Continued)
c. Employees Covered by Benefit Terms At June 30, 2016, the following employees were covered by the agent pension plans’ benefit terms:
PSPRS PSPRSFirefighters Police
Inactive employees or beneficiaries currently receiving benefits 219 475 Inactive employees entitled to but not yet receiving benefits 56 129 Active employees 382 748
Total 657 1,352
d. Contributions
Benefit and contribution provisions are established by state law and may be amended only by the State of Arizona Legislature (A.R.S. Section 38-843). PSPRS members are required to contribute 11.65 percent of their annual covered salary. The City is required to contribute an actuarially determined rate expressed as a percent of covered salary and a distribution of the net earnings of the Fund. The City’s rates for the fiscal years ending June 30, 2016 were 34.40 percent (34.17 pension plus 0.23 health care), for fire personnel and 35.52 percent (34.58 pension plus 0.94 health care) for police members.
e. Annual Pension Contributions Fire personnel contributed $3,914,204 ($3,800,638 regular members plus $113,566 DROP members) and police personnel contributed $7,521,263 ($7,303,439 regular members plus $217,824 DROP members) during fiscal year 2015-2016. For 2016, the City’s annual pension cost of $11,223,876 ($11,146,750 pension, $77,126 health care) for fire and $22,267,577 ($21,673,738 pension, $593,839 health care) for police was equal to the City’s required and actual contributions for the pension cost including health care. The required contribution was determined as part of the June 30, 2014 actuarial valuation using an individual entry-age actuarial cost method. The City is also required to pay a PSPRS Alternate Contribution Rate (ACR) for retired members who return to work in any capacity and in a position ordinarily filled by an employee of the City, unless the retired member is required to participate in another state retirement system and the retired member returned to work before July 20, 2011. The ACR rate is equal to the portion of the total required contribution that is applied to the amortization of the unfunded actuarial accrued liability for the fiscal year beginning July 1, based on the actuarial calculation of the total required contribution for the preceding fiscal year ended on June 30. The contribution rate for the year ended June 30, 2016 was 28.62 percent for both fire and police. The City’s ACR contributions for the year ending June 30, 2016 were $49,968 for fire and $23,632 for police.
f. Pension Liability At June 30, 2016, the City reported net pension liabilities of $143,957,780 and $282,610,577 for fire and police, respectively. The net pension liabilities were measured as of June 30, 2015, and the total pension liability used to calculate the net pension liability was determined by an actuarial valuation as of that date.

CITY OF MESA, ARIZONA NOTES TO FINANCIAL STATEMENTS FOR THE FISCAL YEAR ENDED JUNE 30, 2016
87 (Continued)
g. Pension Expense and Deferred Outflows/Inflows of Resources For the year ended June 30, 2016, the City recognized pension expense of $14,385,864 and $30,683,253 for fire and police, respectively. At June 30, 2016, the City reported deferred outflows of resources and deferred inflows of resources related to pensions from the following sources (in thousands):
Fire
Deferred Outflows of Resources
Deferred Inflows of Resources
Differences between expected and actual experience -$ 8,072$ Changes in assumptions 16,673 - Net difference between projected and actual earnings on pension plan investments 484 - City contributions subsequent to the measurement date 11,197 - Total 28,354$ 8,072$
Police
Deferred Outflows of Resources
Deferred Inflows of Resources
Differences between expected and actual experience -$ 9,444$ Changes in assumptions 34,475 - Net difference between projected and actual earnings on pension plan investments 939 - City contributions subsequent to the measurement date 21,697 - Total 57,111$ 9,444$
The amounts reported as deferred outflows of resources related to pensions resulting from City contributions subsequent to the measurement date will be recognized as a reduction of the net pension liability (or an increase in the net pension asset) in the year ended June 30, 2016. Other amounts reported as deferred outflows of resources and deferred inflows of resources related to pensions will be recognized in pension expense as follows (in thousands):
Year Ending June 30, Fire Police2016 1,489$ 5,722$ 2017 1,489 5,722 2018 1,489 5,722 2019 3,111 8,450 2020 1,774 400 Thereafter (267) (46)
9,085$ 25,970$
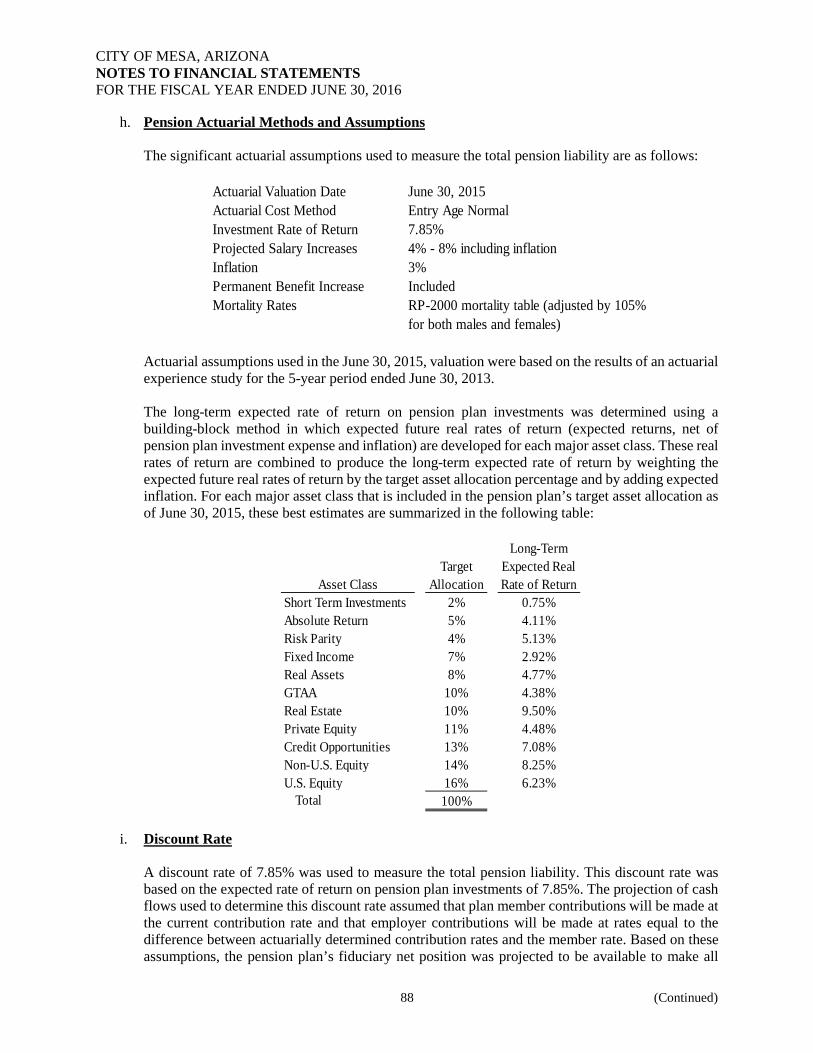
CITY OF MESA, ARIZONA NOTES TO FINANCIAL STATEMENTS FOR THE FISCAL YEAR ENDED JUNE 30, 2016
88 (Continued)
h. Pension Actuarial Methods and Assumptions The significant actuarial assumptions used to measure the total pension liability are as follows:
Actuarial Valuation Date June 30, 2015Actuarial Cost Method Entry Age NormalInvestment Rate of Return 7.85%Projected Salary Increases 4% - 8% including inflationInflation 3%Permanent Benefit Increase IncludedMortality Rates RP-2000 mortality table (adjusted by 105%
for both males and females)
Actuarial assumptions used in the June 30, 2015, valuation were based on the results of an actuarial experience study for the 5-year period ended June 30, 2013. The long-term expected rate of return on pension plan investments was determined using a building-block method in which expected future real rates of return (expected returns, net of pension plan investment expense and inflation) are developed for each major asset class. These real rates of return are combined to produce the long-term expected rate of return by weighting the expected future real rates of return by the target asset allocation percentage and by adding expected inflation. For each major asset class that is included in the pension plan’s target asset allocation as of June 30, 2015, these best estimates are summarized in the following table:
Asset ClassTarget
Allocation
Long-Term Expected Real Rate of Return
Short Term Investments 2% 0.75%Absolute Return 5% 4.11%Risk Parity 4% 5.13%Fixed Income 7% 2.92%Real Assets 8% 4.77%GTAA 10% 4.38%Real Estate 10% 9.50%Private Equity 11% 4.48%Credit Opportunities 13% 7.08%Non-U.S. Equity 14% 8.25%U.S. Equity 16% 6.23%
Total 100%
i. Discount Rate
A discount rate of 7.85% was used to measure the total pension liability. This discount rate was based on the expected rate of return on pension plan investments of 7.85%. The projection of cash flows used to determine this discount rate assumed that plan member contributions will be made at the current contribution rate and that employer contributions will be made at rates equal to the difference between actuarially determined contribution rates and the member rate. Based on these assumptions, the pension plan’s fiduciary net position was projected to be available to make all

CITY OF MESA, ARIZONA NOTES TO FINANCIAL STATEMENTS FOR THE FISCAL YEAR ENDED JUNE 30, 2016
89 (Continued)
projected future benefit payments of current plan members. Therefore, the long-term expected rate of return on pension plan investments was applied to all periods of projected benefit payments to determine the total pension liability.
j. Changes in the Agent Plans Net Pension Liability The following tables present changes in the City’s net pension liability for the PSPRS – Fire and Police pension plans as follows (in thousands):
FireTotal Pension
LiabilityPlan Fiduciary Net Position
Net Position Liability
Balance at June 30, 2015 299,681$ 161,964$ 137,717$ Changes for the Year:Service Cost 6,127 - 6,127 Interest on the Total Pension Liability 23,086 - 23,086 Changes of Benefit Terms - - - Differences Between Expected and Actual Experience in the Measurement of the Liability (3,518) - (3,518) Changes of Assumptions or Other Inputs - - - Contributions - Employer - 9,828 (9,828) Contributions - Employee - 3,847 (3,847) Net Investment Income - 5,878 (5,878) Benefit Payments, Including Refunds of Employee Contributions (17,323) (17,323) - Administrative Expenses - (144) 144 Other Changes - 45 (45)
Net Changes 8,372 2,131 6,241 Balances as of June 30, 2016 308,053$ 164,095$ 143,958$
PoliceTotal Pension
LiabilityPlan Fiduciary Net Position
Net Position Liability
Balance at June 30, 2015 542,745$ 274,946$ 267,799$ Changes for the Year:Service Cost 12,216 - 12,216 Interest on the Total Pension Liability 41,908 - 41,908 Changes of Benefit Terms - - - Differences Between Expected and Actual Experience in the Measurement of the Liability (2,173) - (2,173) Changes of Assumptions or Other Inputs - - - Contributions - Employer - 19,680 (19,680) Contributions - Employee - 7,613 (7,613) Net Investment Income - 10,065 (10,065) Benefit Payments, Including Refunds of Employee Contributions (29,998) (29,998) - Administrative Expenses - (246) 246 Other Changes - 28 (28)
Net Changes 21,953 7,142 14,811 Balances as of June 30, 2016 564,698$ 282,088$ 282,610$

CITY OF MESA, ARIZONA NOTES TO FINANCIAL STATEMENTS FOR THE FISCAL YEAR ENDED JUNE 30, 2016
90 (Continued)
k. Sensitivity of the City’s Net Pension Liability to Changes in the Discount Rate The following table presents the City’s net pension liabilities calculated using the discount rates noted above, as well as what the City’s net pension liability would be if it were calculated using a discount rate that is 1 percentage point lower or 1 percentage point higher than the current rate (in thousands):
1% Decrease
Current Discount
Rate 1% Increase6.85% 7.85% 8.85%
Fire Net Pension Liability 179,652$ 143,958$ 114,035$ Police Net Pension Liability 352,716 282,610 224,406
l. Annual Other Post-Employment Benefits Cost (Health Insurance Subsidy) For 2015 the City’s annual Other Post-Employment Benefits (OPEB) cost of $541,790 for fire and $1,187,849 for police was equal to the City’s required contributions. Funded Status and Funding Progress The funded status of the Health Insurance Subsidy plans as of June 30, 2015 (Latest actuarial date available) is as follows (in thousands):
Fire PoliceActuarial accrued liability (AAL) 7,702$ 17,283$ Actuarial value of plan assets 7,727 10,724 Unfunded actuarial accrued liability (UAAL) (25)$ 6,559$ Funded ratio (actuarial value of plan assets/AAL) 100% 62%Covered payroll (active plan members) 31,661$ 62,461$ UAAL as a percentage of covered payroll 0.00% 10.50%
The schedule of funding progress, presented as required supplementary information following the notes to the financial statements, presents multiyear trend information that shows whether the actuarial value of plan assets is increasing or decreasing over time relative to the actuarial accrued liabilities for benefits.

CITY OF MESA, ARIZONA NOTES TO FINANCIAL STATEMENTS FOR THE FISCAL YEAR ENDED JUNE 30, 2016
91 (Continued)
The City’s annual OPEB cost, the percentage of annual OPEB cost contributed to the plan, and the net OPEB obligation for 2015 and the two preceding years were as follows (in thousands):
Fire
Fiscal Year Annual Net OPEBEnding OPEB Cost Obligation2013 490$ -$ 2014 495 - 2015 542 -
Police
Fiscal Year Annual Net OPEBEnding OPEB Cost Obligation2013 1,105$ -$ 2014 1,083 - 2015 1,188 -
Percentage of
Percentage of
100%
Contributed100%
Annual OPEB CostContributed
100%
100%100%
100%
Annual OPEB Cost
16. POST-EMPLOYMENT BENEFITS
In addition to the pension benefits described in Note 15, the City provides post-retirement health care benefits to all eligible retirees in accordance with the compensation plan adopted by the City Council each fiscal year. These benefits include medical, dental and vision insurance programs and are the same as those offered to active employees. Retirees may select single or family coverage. As of June 30, 2016, approximately 1,825 former employees were eligible for these benefits. The cost of post-employment healthcare benefits, from an accrual accounting perspective, similar to the cost of pension benefits, should be associated with the periods in which the cost occurs, rather than in the future year when it will be paid. In implementing the requirements of GASB Statement No. 45, the City recognizes the cost of post-employment healthcare in the year the employee services are received, reports the accumulated liability from prior years, and provides information useful in assessing potential demands on the City’s future cash flows. Recognition of the liability accumulated from prior years will be amortized over 30 years, the first period commencing with the fiscal year ending June 30, 2008. The unfunded actuarial accrued annual required contribution for current retirees as well as current active members for fiscal year 2015-2016 was $28,400,907. A liability of $3,882,510 is accrued in the business-type activities financial statements; the remaining $24,518,397 has been accrued in the governmental activities column in the government-wide financial statements. Plan Description The City provides post-employment medical care (OPEB) for retired employees through a single-employer defined benefit medical plan. The plan provides medical benefits for eligible retirees, their spouses and dependents through the City’s self-insurance health insurance plan which covers both active and retired members. The benefits, benefit levels and contribution rates are determined annually

CITY OF MESA, ARIZONA NOTES TO FINANCIAL STATEMENTS FOR THE FISCAL YEAR ENDED JUNE 30, 2016
92 (Continued)
by the City’s Benefits Advisory Board and approved by the Mesa City Council. The plan is not accounted for as a trust fund, and an irrevocable trust has not been established to account for the plan. The plan does not issue a separate financial report. Benefits Provided The City provides post-employment medical care benefits to its retirees. To be eligible for benefits, an employee must qualify for retirement under one of the state retirement plans for public employees and be covered under the City’s medical plan during their active status. Employees must enroll in a City plan immediately after they retire or their eligibility for this benefit ceases. All medical care benefits are provided through the City’s self-insured health plan. The benefit levels are the same as those afforded to active employees. Upon a retiree’s death, the retiree’s dependents are no longer eligible for City coverage. As of July 1, 2015, Membership Consisted of:
Retirees and Beneficiaries Receiving Benefits 1,825 Active Employees 3,176
Total 5,001
Funding Policy The plan premium rates are determined annually by the Benefits Advisory Board and approved by the City Council. The City’s contribution to the retiree’s health insurance premium is determined by their length of service with the City and their original hire date. To receive maximum benefits an employee must meet the following: • Ten years of service for employees hired prior to January 1, 2001 • Fifteen years of service for employees hired at January 1, 2001 but before January 1, 2006. • Twenty years of service for employees hired on or after January 1, 2006. • As of January 1, 2009, new hires are no longer eligible for benefits. For fiscal year ended June 30, 2016, the City contributed $17,858,318 to the plan (approximately 70.4 percent of total premiums). Plan members receiving benefits contributed $7,510,361 or approximately 29.6 percent of total premiums. Annual OPEB Costs / Net OPEB Obligation The City’s annual other post-employment benefit (OPEB) cost is calculated based on the annual required contribution of the employer (ARC), an amount actuarially determined in accordance with the parameters of GASB Statement 45. The ARC represents a level of funding that, if paid on an ongoing basis, is projected to cover normal cost each year and to amortize any unfunded actuarial liabilities over a period not to exceed thirty years.

CITY OF MESA, ARIZONA NOTES TO FINANCIAL STATEMENTS FOR THE FISCAL YEAR ENDED JUNE 30, 2016
93 (Continued)
The City’s annual OPEB cost for the current year and the related information for the plan are as follows at June 30, 2016 (in thousands):
Annual Required Contribution 53,744$ Interest on Net OPEB Obligation 20,547 Adjusted to Annual Required Contribution (28,033) Annual OPEB Cost 46,258 Contributions Made (17,858) Increase in Net OPEB Obligation 28,400 Net OPEB Obligation – Beginning of year 456,625 Net OPEB Obligation – End of year 485,025$
The City’s annual OPEB cost, the percentage of annual OPEB cost contributed to the plan, and the net OPEB obligation for the three years ending June 30, 2014 through 2016 were as follows:
Fiscal Annual Percentage of NetYear OPEB Actual OPEB Cost OPEB
Ended Cost Contribution Contributed Obligation2014 49,962 16,011 32.0% 423,000 2015 50,750 17,125 33.7% 456,625 2016 46,258 17,858 38.6% 485,025
Funded Status and Funding Progress The funded status of the plan as of July 1, 2015 was as follows (in thousands): (Latest actuarial date available)
Actuarial Value of Plan Assets -$ Actuarial Accrued Liability 639,564 Unfunded actuarial accrued liability 639,564$ Funded ratio 0.0%Covered payroll 380,860$ Unfunded actuarial accrued liability
as a percentage of covered payroll 167.9%
The schedule of funding progress, presented as required supplementary information following the notes to the financial statements, presents multiyear trend information that shows whether the actuarial value of plan assets is increasing or decreasing over time relative to the actuarial accrued liabilities for benefits.

CITY OF MESA, ARIZONA NOTES TO FINANCIAL STATEMENTS FOR THE FISCAL YEAR ENDED JUNE 30, 2016
94 (Concluded)
Actuarial Methods and Assumptions Projections of benefits are based on the substantive plan (the plan understood by the employer and plan members) and include the type of benefits in force at the valuation date and the pattern of sharing benefits between the City and the plan members at that point. Actuarial calculations reflect a long-term perspective and employ methods and assumptions that are designed to reduce short-term volatility in actuarial accrued liabilities and the actuarial value of assets. Significant methods and assumptions used for this fiscal year valuation were as follows:
Valuation Date July 1, 2015 Actuarial Cost Method Entry age normal, level dollar amount Amortization method 30-year amortization open Remaining amortization period 30 years Asset Valuation Method N/A, no assets in trust Actuarial Assumptions: Discount rate 4.50% Health care cost trend rate: • Medical, Drugs 8.5% in 2013-2014, grading down by 0.5% each year
to an ultimate rate of 5.0% • Dental, Mental Health, Vision 5% • Retiree contribution increase Same as medical trend

Required Supplementary InformationComprehensive Annual Financial Report2016

95
2016 2015 2014 through(2015) (2014) 2006
City's Proportion of the Net Pension Liability 1.639250% 1.634103% InformationCity's Proportionate Share of the Net Pension Liability 255,337$ 241,792$ not available
City's Covered-Employee Payroll 151,154$ 147,402$ City's Proportionate Share of the Net Pension Liability
as a Percentage of its Covered-Employee Payroll 168.93% 164.04%Plan Fiduciary Net Position as a Percentage of the
Total Pension Liability 68.35% 69.49%
JUNE 30, 2016
CITY OF MESA, ARIZONA EXHIBIT B-1REQUIRED SUPPLEMENTARY INFORMATION SCHEDULE OF THE CITY'S PROPORTIONATE SHARE OF NET PENSION LIABILITYCOST-SHARING PENSION PLAN
See accompanying notes to pension plan schedules.
Arizona State Retirement System
(in thousands)
Reporting Fiscal Year(Measurement Date)

96
2016 2015 2014 through(2015) (2014) 2006
Total Pension Liability InformationService Cost 6,127$ 6,281$ not availableInterest on the Total Pension Liability 23,086 20,708 Changes of Benefit Terms - 4,044 Differences Between Expected and Actual Experience in the Measurement of the Pension Liability (3,518) (6,961) Changes of Assumptions or Other Inputs - 23,097 Benefit Payments, Including Refunds of Employee Contributions (17,323) (16,309)
Net Change in Total Pension Liability 8,372 30,860 Total Pension Liability - Beginning 299,681 268,821 Total Pension Liability - Ending (a) 308,053 299,681
Plan Fiduciary Net PositionContributions - Employer 9,828 9,157 Contributions - Employee 3,847 3,488 Net Investment Income 5,878 19,840 Benefit Payments, Including Refunds of Employee Contributions (17,323) (16,309) Administrative Expense (144) (160) Other Changes 45 (113)
Net Change in Plan Fiduciary Net Position 2,131 15,903 Plan Fiduciary Net Position - Beginning 161,964 146,061 Plan Fiduciary Net Position - Ending (b) 164,095 161,964
City's Net Pension Liability - Ending (a) - (b) 143,958$ 137,717$
Plan Fiduciary Net Position as a Percentage of the Total Pension Liability 53.27% 54.05%
Covered-Employee Payroll 31,661$ 30,782$
City's Net Pension Liability as a Percentage of Covered-Employee Payroll 454.69% 447.39%
Reporting Fiscal Year(Measurement Date)
CITY OF MESA, ARIZONA EXHIBIT B-2REQUIRED SUPPLEMENTARY INFORMATION SCHEDULE OF CHANGES IN THE CITY'S NET PENSION LIABILITY AND RELATED RATIOSAGENT PENSION PLANSJUNE 30, 2016(in thousands)
Public Safety Personnel Retirement System - Fire
See accompanying notes to pension plan schedules.

97
2016 2015 2014 through(2015) (2014) 2006
Total Pension Liability InformationService Cost 12,216$ 12,481$ not availableInterest on the Total Pension Liability 41,908 36,514 Changes of Benefit Terms - 8,728 Differences Between Expected and Actual Experience in the Measurement of the Pension Liability (2,173) (11,331) Changes of Assumptions or Other Inputs - 51,228 Benefit Payments, Including Refunds of Employee Contributions (29,998) (27,566)
Net Change in Total Pension Liability 21,953 70,054 Total Pension Liability - Beginning 542,745 472,691 Total Pension Liability - Ending (a) 564,698 542,745
Plan Fiduciary Net PositionContributions - Employer 19,680 17,443 Contributions - Employee 7,613 6,784 Net Investment Income 10,065 33,360 Benefit Payments, Including Refunds of Employee Contributions (29,998) (27,566) Administrative Expense (246) (269) Other Changes 28 288
Net Change in Plan Fiduciary Net Position 7,142 30,040 Plan Fiduciary Net Position - Beginning 274,946 244,906 Plan Fiduciary Net Position - Ending (b) 282,088 274,946
City's Net Pension Liability - Ending (a) - (b) 282,610$ 267,799$
Plan Fiduciary Net Position as a Percentage of the Total Pension Liability 49.95% 50.66%
Covered-Employee Payroll 62,461$ 59,688$
City's Net Pension Liability as a Percentage of Covered-Employee Payroll 452.46% 448.66%
See accompanying notes to pension plan schedules.
Reporting Fiscal Year(Measurement Date)
CITY OF MESA, ARIZONA EXHIBIT B-2 (concluded)REQUIRED SUPPLEMENTARY INFORMATION
Public Safety Personnel Retirement System - Police
AGENT PENSION PLANSJUNE 30, 2016(in thousands)
SCHEDULE OF CHANGES IN THE CITY'S NET PENSION LIABILITY AND RELATED RATIOS

98
2013 through2016 2015 2014 2006
Statutorily Required Contribution 16,955$ 16,146$ 15,750$ InformationCity's Contribution in Relation to the not available Statutorily Required Contribution 16,955 16,146 15,750 City's Contribution Deficiency (Excess) -$ -$ -$
City's Covered-Employee Payroll 155,868$ 151,154$ 147,402$ City's Contributions as a Percentage of Covered-Employee Payroll 10.88% 10.68% 10.68%
2013 through2016 2015 2014 2006
Actuarially Determined Contribution 11,197$ 9,827$ 9,157$ InformationCity's Contribution in Relation to the not available Actuarially Determined Contribution 11,197 9,827 9,157 City's Contribution Deficiency (Excess) -$ -$ -$
City's Covered-Employee Payroll 32,796$ 31,661$ 30,782$ City's Contributions as a Percentage of Covered-Employee Payroll 34.14% 31.04% 29.75%
2013 through2016 2015 2014 2006
Actuarially Determined Contribution 21,697$ 19,680$ 17,443$ InformationCity's Contribution in Relation to the not available Actuarially Determined Contribution 21,697 19,680 17,443 City's Contribution Deficiency (Excess) -$ -$ -$
City's Covered-Employee Payroll 62,760$ 62,461$ 59,688$ City's Contributions as a Percentage of Covered-Employee Payroll 34.57% 31.51% 29.22%
Reporting Fiscal Year
Reporting Fiscal Year
Reporting Fiscal Year
See accompanying notes to pension plan schedules.
Public Safety Personnel Retirement System - Police
Public Safety Personnel Retirement System - Fire
(in thousands)
Arizona State Retirement System
CITY OF MESA, ARIZONA EXHIBIT B-3REQUIRED SUPPLEMENTARY INFORMATION SCHEDULE OF CITY PENSION CONTRIBUTIONSJUNE 30, 2016

99
Actuarial Cost Method Entry age normalAmortization Method Level percent of payroll, closedRemaining Amortization Period 23 years for unfunded actuarial accrued liability, 20 years for excessAsset Valuation Method 7-year smoothed market value; 20% corridor
Actuarial Assumptions:Investment Rate of Return In the 2013 actuarial valuation, the investment rate of return was decreased from
8.0% to 7.85%Projected Salary Increases In the 2013 actuarial valuation, projected salary increases were decreased from 5.0%-
9.0% to 4.5%-8.5%Wage Growth In the 2013 actuarial valuation, wage growth was decreased from 5.0% to 4.5%Retirement Age Experience-based table of rates that is specific to the type of eligibility condition. Last
updated for the 2012 valuation pursuant to an experience study of the period July 1,2006-June 30, 2011.
Mortality RP-2000 mortality table (adjusted by 105% for both males and females)
Actuarial determined contribution rates for PSPRS are calculated as of June 30 two years prior to the end of the fiscalyear in which contributions are made. The actuarial methods and assumptions used to establish the contributionrequrements are as follows:
CITY OF MESA, ARIZONAREQUIRED SUPPLEMENTARY INFORMATION
JUNE 30, 2016(in thousands)
NOTES TO PENSION PLAN SCHEDULES

100
UAAL as aActuarial Actuarial Actuarial Unfunded Annual % ofValuation Value of Accrued AAL Funded Covered Covered
Date Assets Liability (AAL) (UAAL) Ratio Payroll PayrollJune 30, ( a ) ( b ) ( b - a ) ( a / b ) ( c ) (( b - a ) / c )
2013 -$ 7,331$ 7,331$ 0.0% 31,008$ 23.6%2014 7,364 7,578 214 97.2% 30,782 0.7%2015 7,727 7,702 (25) 100.3% 31,661 -0.1%
2013 -$ 15,823$ 15,823$ 0.0% 60,096$ 26.3%2014 10,193 16,585 6,392 61.5% 59,688 10.7%2015 10,724 17,283 6,559 62.0% 62,461 10.5%
Note:
Health Insurance Premium Benefit
Beginning in fiscal year 2014, PSPRS established separate funds for pension benefits andhealth insurance premium benefits. Previously, the plan recorded both pension and healthinsurance premium contributions in the same Pension Fund. During fiscal year 2014, the plantransferred prior-year health insurance premium benefit contributions that exceeded benefitpayments from each plan's Pension Fund to the new Health Insurance Fund.
Fire
Police
CITY OF MESA, ARIZONA EXHIBIT B-4REQUIRED SUPPLEMENTARY INFORMATION
JUNE 30, 2016(in thousands)
SCHEDULE OF AGENT OTHER POST-EMPLOYMENT BENEFITS PLAN'S FUNDING PROGRESS

101
UnfundedActuarial AAL as a
Actuarial Actuarial Accrued Annual PercentageValuation Value Liability Percent Unfunded Covered of Covered
Date of Assets (AAL) Funded AAL Payroll PayrollJuly 1, ( a ) ( b ) ( a / b ) ( b - a ) ( c ) (( b - a ) / c )2011 -$ 992,016$ 0.0% 992,016$ 330,113$ 300.5%2013 - 650,918 0.0% 650,918 360,860 180.4%2015 - 639,563 0.0% 639,563 380,860 167.9%
(in thousands)
CITY OF MESA, ARIZONA EXHIBIT B-5REQUIRED SUPPLEMENTARY INFORMATION SCHEDULE OF OTHER POST-EMPLOYMENT BENEFITS PLAN'S FUNDING PROGRESS FOR THE FISCAL YEAR ENDED JUNE 30, 2016

102
Original Final
Actual - Budgetary
BasisVariance with Final Budget
Revenues:Sales Taxes 101,807$ 101,807$ 95,334$ (6,473)$ Occupancy Taxes - - 40 40Licenses and Permits 16,489 16,489 17,580 1,091Intergovernmental 120,070 120,070 118,775 (1,295)Charges for Services 22,325 22,325 22,649 324Fines and Forfeitures 7,548 7,548 8,795 1,247Investment Income 146 146 235 89Contributions 312 312 300 (12)Miscellaneous Revenues 1,512 1,512 1,148 (364)
Total Revenues 270,209 270,209 264,856 (5,353)
Expenditures:Current:
General Government 90,978 89,100 71,457 17,643Public Safety 223,563 226,214 223,733 2,481Community Environment 14,704 15,146 13,723 1,423Cultural-Recreational 37,355 38,111 36,516 1,595
Capital Outlay 9,739 14,517 4,580 9,937Total Expenditures 376,339 383,088 350,009 33,079
Excess (Deficiency) of RevenuesOver (Under) Expenditures (106,130) (112,879) (85,153) 27,726
Other Financing Sources (Uses):Transfers In 121,789 121,789 101,863 (19,926)Transfers Out (27,751) (36,511) (8,618) 27,893
Total Other Financing Sources (Uses) 94,038 85,278 93,245 7,967
Net Change in Fund Balances (12,092) (27,601) 8,092 35,693
Fund Balance - Beginning 55,652 55,652 43,297 (12,355)
Fund Balance - Ending 43,560$ 28,051$ 51,389$ 23,338$
See accompanying note to budgetary comparison schedule.
(in thousands)Budgeted Amounts
CITY OF MESA, ARIZONAEXHIBIT B-6REQUIRED SUPPLEMENTARY INFORMATIONBUDGETARY COMPARISON SCHEDULEGENERAL FUNDFOR THE FISCAL YEAR ENDED JUNE 30, 2016

103
Net Change in Fund Balance-Budget Basis - Exhibit B-6 8,092$
Basis Differences: Compensated Absences (194) Sales Tax Accrual 8,782 Unrealized Gain on Investments 181
Net Change in Fund Balance-GAAP Basis - Exhibit A-5 16,861$
The financial statements for the City are prepared in accordance with generally accepted accountingprinciples – “GAAP basis”. Since Mesa, like most other Arizona cities, prepares its annual budget on amodified cash basis that differs from the “GAAP basis”, additional schedules of revenues and expendituresare presented for the General Fund to provide a meaningful comparison of actual results to budget on the“budget basis”.
Adjustments necessary to convert the results of operations of the General Fund for the year ended June 30,2016 on the “GAAP basis” to the “budget basis” as follows:
CITY OF MESA, ARIZONA
NOTES TO BUDGETARY COMPARISON SCHEDULESJUNE 30, 2016(in thousands)
REQUIRED SUPPLEMENTARY INFORMATION


Combining StatementsComprehensive Annual Financial Report2016

NON-MAJOR GOVERNMENTAL FUNDS
Special Revenue Funds Special Revenue Funds are used to account for specific revenues that are legally restricted to expenditure for particular purposes.
Cemetery is designed to provide an accumulation of monies from which the interest earnings will provide perpetual care of the Cemetery. Community Facilities District accounts for the operations of the Eastmark and other Community Facility Districts which are paid from special assessments levied against the benefited properties. Development Impact Fees is designed to provide a balance of monies to ensure that new development bears a proportionate share of the cost of improvements to the City’s parks, cultural facilities, libraries, fire facilities and equipment, police facilities and equipment, general government facilities and storm sewers. These funds are provided through the collection of development impact fees. Environmental Compliance accounts for expenditures that are a result of federal and state environmental requirements. Financing for this fund is derived from a monthly environmental compliance fee that is charged to each utility customer. Grants and Special Programs accounts for federal and state grant expenditures and other City programs. The principle financing source is federal and state grant revenues. Highway User Revenue accounts for capital projects and maintenance of the City’s streets and highways, as mandated by the Arizona Revised Statutes. Financing for this fund is provided by the state shared fuel taxes. Mesa Arts Center Restoration is designed to provide an accumulation of monies to be used to replace or refurbish the Mesa Arts Center facilities. These funds are provided through a fee on all ticketed events at the facility. Mesa Housing Authority accounts for expenditures of the City’s housing assistance programs that provide rent subsidy payments to private sector owners of dwelling units. Financing for this fund is derived from grants from the United States Department of Housing and Urban Development. Quality of Life Sales Tax accounts for expenditures of the voter-approved sales tax to improve the quality of life for Mesa residents. Street Sales Tax accounts for expenditures of the voter-approved sales tax that is used as the City match for the MAG Proposition 400 sales tax funds and also provides a local revenue source that is dedicated for street programs.

Capital Projects Funds Capital Projects Funds are used to account for the acquisition and construction of major capital facilities other than those financed by proprietary funds and special revenue funds.
Community Facilities District Capital Projects accounts for the costs of construction of drains, basins, channels and other storm sewer improvements and street improvements in the Eastmark and other Community Facilities Districts. General Capital Projects accounts for the costs of general City construction projects and for expenditures related to the acquisition of replacement vehicles for the City’s governmental funds. The funds are provided through transfers from the City’s General Fund Parks accounts for the costs of park facilities and improvements. Public Safety accounts for the cost of public safety facilities. Streets accounts for the cost of right-of-way acquisitions and street improvements.
Debt Service Funds These funds are established to account for the accumulation of resources for, and the payment of, principal and interest not serviced by the Enterprise Fund.
Community Facilities District Debt Service accumulates monies for the payment of Eastmark and other Community Facilities Districts Bonds that are issued to finance the costs of improvements which are to be paid from special assessments levied against the benefited properties. General Obligation Bonds accumulates monies for the payment of principal and interest requirements of the City’s General Obligation Bonds. Highway User Revenue Bonds accumulates monies for the payment of principal and interest requirements of the City’s Highway User Revenue Bonds. Special Assessment Bonds accumulates monies for the payment of the Special Assessment Bonds that are issued to finance the costs of improvements which are to be paid from special assessments levied against the benefited properties.


104
CITY OF MESA, ARIZONAEXHIBIT C-1NON-MAJOR GOVERNMENTAL FUNDSCOMBINING BALANCE SHEETJUNE 30, 2016(in thousands)
Cemetery
Community Facilities District
Development Impact Fees
Environmental Compliance
ASSETSPooled Cash and Investments 6,779$ 54$ 4,927$ 9,931$ Accounts Receivable, Net 73 62 - 7Accrued Interest Receivable 14 - 3 7Due from Other Governments - - - -Prepaid Costs - - - -Deposits - - - -Restricted Assets:
Pooled Cash and Investments - - - -Cash with Fiscal Agent - - - -Accounts Receivable - - - -Due from Other Governments - - - -
Total Assets 6,866$ 116$ 4,930$ 9,945$
LIABILITIESAccounts Payable and Accrued Liabilities -$ -$ -$ 446$ Advances from Other Funds - - 1,414 -Customer and Defendant Deposits - - - -Payable from Restricted Assets:
Accrued Interest Payable - - - -Unearned Revenue - 94 - -Matured Bonds Payable - - - -
Total Liabilities - 94 1,414 446
DEFERRED INFLOWS OF RESOURCESUnavailable Revenue 3 - - 5
Total Deferred Inflows of Resources 3 - - 5
FUND BALANCESNonspendable - - - -Restricted - 22 3,516 -Committed 6,863 - - 9,494Assigned - - - -Unassigned - - - -
Total Fund Balances 6,863 22 3,516 9,494
Total Liabilities, Deferred Inflows ofResources and Fund Balances 6,866$ 116$ 4,930$ 9,945$
Special Revenue Funds

105
Grants and
Special Programs
Highway User
Revenue
Mesa Arts Center
Restoration
Mesa Housing Authority
Quality of Life Sales Tax
Street Sales Tax
Total Special
Revenue Funds
5,161$ 11,916$ 1,344$ 1,489$ 802$ 41,252$ 83,655$ 92 - - 176 1,830 2,454 4,6942 2 3 - 1 44 76
3,617 3,250 - 1,360 - - 8,2275 - - - - 69 74- - - - - - -
- - - - - - -- - - - - - -- - - - - - -- - - - - - -
8,877$ 15,168$ 1,347$ 3,025$ 2,633$ 43,819$ 96,726$
1,716$ 1,119$ 35$ 619$ -$ 3,880$ 7,815$ - - - - - - 1,414- - - - - 5,960 5,960
- - - - - - -515 - 59 1,742 - - 2,410
- - - - - - -2,231 1,119 94 2,361 - 9,840 17,599
73 - - - - 141 22273 - - - - 141 222
5 - - - - 69 745,798 14,049 - 664 2,633 33,769 60,451
919 - 1,253 - - - 18,5296 - - - - - 6
(155) - - - - - (155)6,573 14,049 1,253 664 2,633 33,838 78,905
8,877$ 15,168$ 1,347$ 3,025$ 2,633$ 43,819$ 96,726$
Special Revenue Funds
EXHIBIT C-1(Continued)

106
CITY OF MESA, ARIZONAEXHIBIT C-1NON-MAJOR GOVERNMENTAL FUNDSCOMBINING BALANCE SHEETJUNE 30, 2016(in thousands)
Community Facilities District
General Capital
Projects ParksPublic Safety Streets
Total Capital
Projects Funds
ASSETSPooled Cash and Investments -$ 8,157$ 7,681$ 4,769$ 14,703$ 35,310$ Accounts Receivable, Net - - - - - -Accrued Interest Receivable - - - - - -Due from Other Governments - - - - 3,893 3,893Prepaid Costs - 3 - - - 3Deposits - - 148 - 434 582Restricted Assets:
Pooled Cash and Investments - - - - - -Cash with Fiscal Agent - - - - - -Accounts Receivable - - - - - -Due from Other Governments - - - - - -
Total Assets -$ 8,160$ 7,829$ 4,769$ 19,030$ 39,788$
LIABILITIESAccounts Payable and Accrued Liabilities -$ 724$ 928$ 2,017$ 2,752$ 6,421$ Advances from Other Funds - - - - - -Customer and Defendant Deposits - - - - - -Payable from Restricted Assets:
Accrued Interest Payable - - - - - -Unearned Revenue - - - - - -Matured Bonds Payable - - - - - -
Total Liabilities - 724 928 2,017 2,752 6,421
DEFERRED INFLOWS OF RESOURCESUnavailable Revenue - - - - - -
Total Deferred Inflows of Resources - - - - - -
FUND BALANCESNonspendable - 3 - - - 3Restricted - - 6,901 2,752 16,278 25,931Committed - 7,433 - - - 7,433Assigned - - - - - -Unassigned - - - - - -
Total Fund Balances - 7,436 6,901 2,752 16,278 33,367
Total Liabilities, Deferred Inflows ofResources and Fund Balances -$ 8,160$ 7,829$ 4,769$ 19,030$ 39,788$
Capital Projects Funds
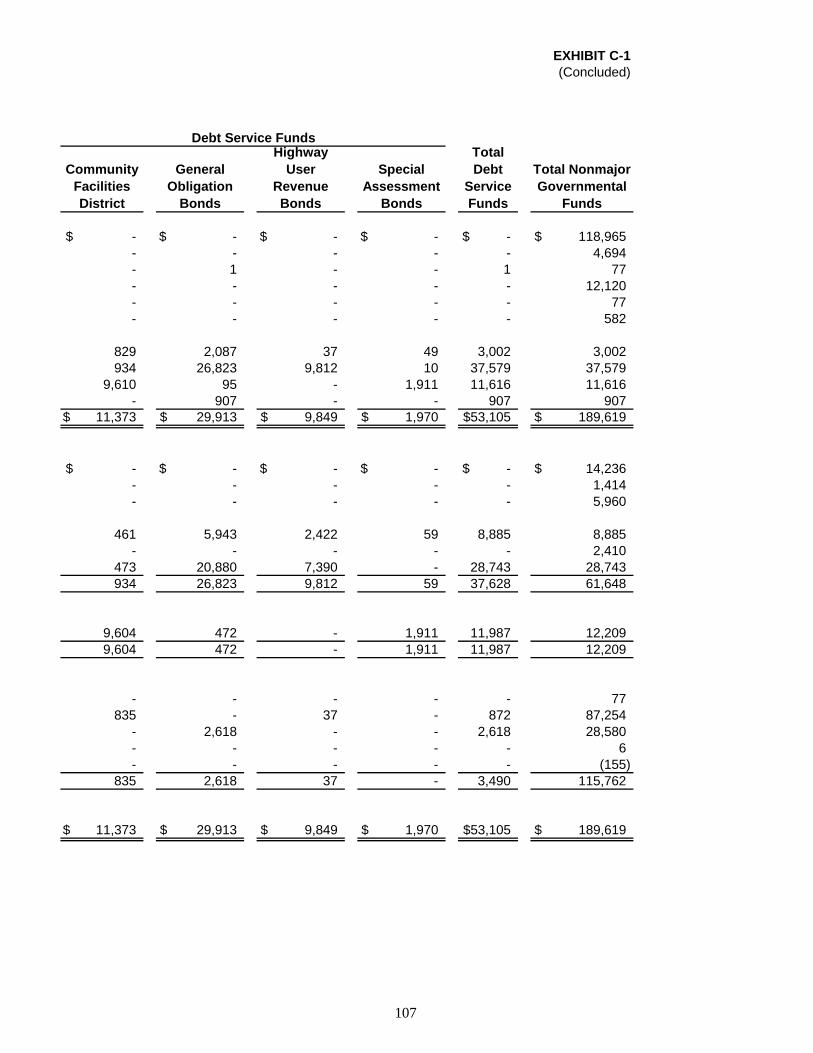
107
Community Facilities District
General Obligation
Bonds
Highway User
Revenue Bonds
Special Assessment
Bonds
Total Debt
Service Funds
Total Nonmajor Governmental
Funds
-$ -$ -$ -$ -$ 118,965$ - - - - - 4,694- 1 - - 1 77- - - - - 12,120- - - - - 77- - - - - 582
829 2,087 37 49 3,002 3,002934 26,823 9,812 10 37,579 37,579
9,610 95 - 1,911 11,616 11,616- 907 - - 907 907
11,373$ 29,913$ 9,849$ 1,970$ 53,105$ 189,619$
-$ -$ -$ -$ -$ 14,236$ - - - - - 1,414- - - - - 5,960
461 5,943 2,422 59 8,885 8,885- - - - - 2,410
473 20,880 7,390 - 28,743 28,743934 26,823 9,812 59 37,628 61,648
9,604 472 - 1,911 11,987 12,2099,604 472 - 1,911 11,987 12,209
- - - - - 77835 - 37 - 872 87,254
- 2,618 - - 2,618 28,580- - - - - 6- - - - - (155)
835 2,618 37 - 3,490 115,762
11,373$ 29,913$ 9,849$ 1,970$ 53,105$ 189,619$
EXHIBIT C-1(Concluded)
Debt Service Funds
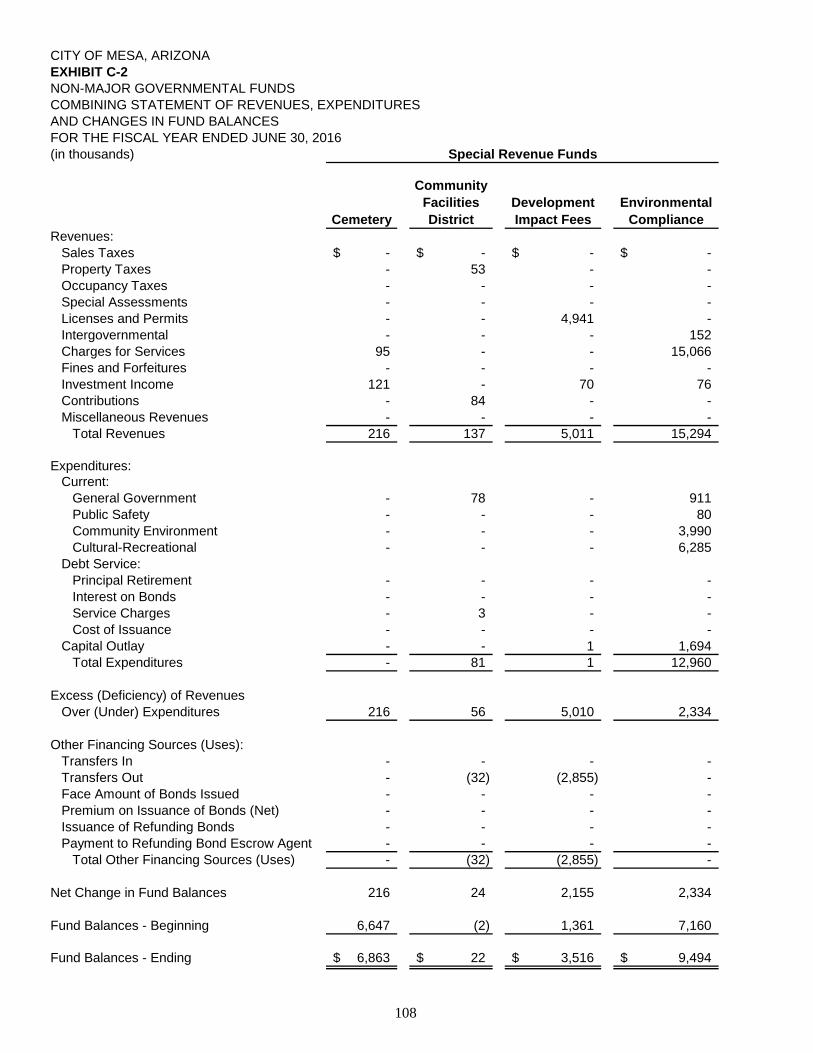
108
CITY OF MESA, ARIZONAEXHIBIT C-2NON-MAJOR GOVERNMENTAL FUNDSCOMBINING STATEMENT OF REVENUES, EXPENDITURESAND CHANGES IN FUND BALANCESFOR THE FISCAL YEAR ENDED JUNE 30, 2016(in thousands)
Cemetery
Community Facilities District
Development Impact Fees
Environmental Compliance
Revenues:Sales Taxes -$ -$ -$ -$ Property Taxes - 53 - - Occupancy Taxes - - - - Special Assessments - - - - Licenses and Permits - - 4,941 - Intergovernmental - - - 152 Charges for Services 95 - - 15,066 Fines and Forfeitures - - - - Investment Income 121 - 70 76 Contributions - 84 - - Miscellaneous Revenues - - - -
Total Revenues 216 137 5,011 15,294
Expenditures:Current:
General Government - 78 - 911 Public Safety - - - 80 Community Environment - - - 3,990 Cultural-Recreational - - - 6,285
Debt Service:Principal Retirement - - - - Interest on Bonds - - - - Service Charges - 3 - - Cost of Issuance - - - -
Capital Outlay - - 1 1,694 Total Expenditures - 81 1 12,960
Excess (Deficiency) of RevenuesOver (Under) Expenditures 216 56 5,010 2,334
Other Financing Sources (Uses):Transfers In - - - - Transfers Out - (32) (2,855) - Face Amount of Bonds Issued - - - - Premium on Issuance of Bonds (Net) - - - - Issuance of Refunding Bonds - - - - Payment to Refunding Bond Escrow Agent - - - -
Total Other Financing Sources (Uses) - (32) (2,855) -
Net Change in Fund Balances 216 24 2,155 2,334
Fund Balances - Beginning 6,647 (2) 1,361 7,160
Fund Balances - Ending 6,863$ 22$ 3,516$ 9,494$
Special Revenue Funds

109
Grants and
Special Programs
Highway User
Revenue
Mesa Arts Center
Restoration
Mesa Housing Authority
Quality of Life Sales Tax
Street Sales Tax
Total Special
Revenue Funds
-$ -$ -$ -$ 21,693$ 26,017$ 47,710$ - - - - - - 53
2,291 - - - - - 2,291 - - - - - - -
492 - - - 90 151 5,674 11,690 35,403 2 16,319 - 152 63,718
15 10 - 1 - 342 15,529 1,051 - 560 - - - 1,611
27 14 30 61 31 587 1,017 196 - - - - - 280
1,620 5 - - - 699 2,324 17,382 35,432 592 16,381 21,814 27,948 140,207
2,692 - - - - 4,116 7,797 7,845 - - 266 22,258 346 30,795
175 18,130 - 15,655 - 13,886 51,836 850 - - - - - 7,135
- - - - - - - - - - - - - - - - - - - - 3 - - - - - - -
5,821 1,097 538 357 - 14,611 24,119 17,383 19,227 538 16,278 22,258 32,959 121,685
(1) 16,205 54 103 (444) (5,011) 18,522
18 - - - - - 18 (538) (12,238) - - - - (15,663)
- - - - - - - - - - - - - - - - - - - - - - - - - - - -
(520) (12,238) - - - - (15,645)
(521) 3,967 54 103 (444) (5,011) 2,877
7,094 10,082 1,199 561 3,077 38,849 76,028
6,573$ 14,049$ 1,253$ 664$ 2,633$ 33,838$ 78,905$
EXHIBIT C-2(Continued)
Special Revenue Funds

110
(in thousands)
Community Facilities District
General Capital
Projects ParksPublic Safety Streets
Total Capital
Projects Funds
Revenues:Sales Taxes -$ -$ -$ -$ -$ -$ Property Taxes - - - - - - Occupancy Taxes - - - - - - Special Assessments - - - - - - Licenses and Permits - - - - - - Intergovernmental - - - - 165 165 Charges for Services - - - - - - Fines and Forfeitures - - - - - - Investment Income - - - - - - Contributions 217 - - - - 217 Miscellaneous Revenues - 522 - - - 522
Total Revenues 217 522 - - 165 904
Expenditures:Current:
General Government - - - - - - Public Safety - - - - - - Community Environment - - - - - - Cultural-Recreational - - - - - -
Debt Service:Principal Retirement 44 - - - - 44 Interest on Bonds - - - - - - Service Charges - - - - - - Cost of Issuance 626 - 27 288 120 1,061
Capital Outlay 8,210 9,026 4,335 27,967 13,547 63,085 Total Expenditures 8,880 9,026 4,362 28,255 13,667 64,190
Excess (Deficiency) of RevenuesOver (Under) Expenditures (8,663) (8,504) (4,362) (28,255) (13,502) (63,286)
Other Financing Sources (Uses):Transfers In - 5,456 - - - 5,456 Transfers Out (17) - - - - (17) Face Amount of Bonds Issued 8,685 - 2,310 24,950 10,440 46,385 Premium on Issuance of Bonds (Net) - - 63 676 283 1,022 Issuance of Refunding Bonds - - - - - - Payment to Refunding Bond Agent - - - - - -
Total Other Financing Sources (Uses) 8,668 5,456 2,373 25,626 10,723 52,846
Net Change in Fund Balances 5 (3,048) (1,989) (2,629) (2,779) (10,440)
Fund Balances - Beginning (5) 10,484 8,890 5,381 19,057 43,807
Fund Balances - Ending -$ 7,436$ 6,901$ 2,752$ 16,278$ 33,367$
CITY OF MESA, ARIZONAEXHIBIT C-2NON-MAJOR GOVERNMENTAL FUNDSCOMBINING STATEMENT OF REVENUES, EXPENDITURESAND CHANGES IN FUND BALANCESFOR THE FISCAL YEAR ENDED JUNE 30, 2016
Capital Projects Funds

111
Community Facilities District
General Obligation
Bonds
Highway User
Revenue Bonds
Special Assessment
Bonds
Total Debt Service Funds
Total Nonmajor Governmental
Funds
-$ -$ -$ -$ -$ 47,710$ 677 34,035 - - 34,712 34,765
- - - - - 2,291 643 - - 790 1,433 1,433
- - - - - 5,674 - 559 - - 559 64,442 - - - - - 15,529 - 643 - - 643 2,254 - 4 - - 4 1,021 - 164 - - 164 661 - - - - - 2,846
1,320 35,405 - 790 37,515 178,626
- - - - - 7,797 - - - - - 30,795 - - - - - 51,836 - - - - - 7,135
489 20,880 7,390 745 29,504 29,548 832 12,767 4,844 138 18,581 18,581
- 7 4 - 11 14 - 444 - - 444 1,505 - - - - - 87,204
1,321 34,098 12,238 883 48,540 234,415
(1) 1,307 (12,238) (93) (11,025) (55,789)
49 2,855 12,238 93 15,235 20,709 - - - - - (15,680)
145 - - - 145 46,530 - 1,261 - - 1,261 2,283 - 43,304 - - 43,304 43,304 - (49,693) - - (49,693) (49,693)
194 (2,273) 12,238 93 10,252 47,453
193 (966) - - (773) (8,336)
642 3,584 37 - 4,263 124,098
835$ 2,618$ 37$ -$ 3,490$ 115,762$
Debt Service Funds
EXHIBIT C-2(Concluded)

INTERNAL SERVICE FUNDS
Internal Service Funds are used to account for the financing of goods or services provided by one department or agency to other departments or agencies of the government and to other government units, on a cost reimbursement basis.
Warehouse, Maintenance and Services Fund was established to finance and account for services and commodities furnished by Fleet Support, Materials and Supply, and Printing and Graphics. Property and Public Liability Self-Insurance Fund was established to account for the cost of claims incurred by the City under a self-insurance program. Workers’ Compensation Self-Insurance Fund was established to account for the costs of maintaining a self-insurance program for industrial insurance at the City. Employee Benefit Self-Insurance Fund was established to account for the costs of maintaining the City’s self-insurance health program.

112
Warehouse, Maintenance and Services
Property and Public
Liability Self Insurance
Workers' Compensation Self Insurance
Employee Benefits
Self Insurance Total
ASSETSCurrent Assets:
Pooled Cash and Investments 737$ 9,643$ 8,614$ 46,356$ 65,350$ Accounts Receivable 288 - - 23 311 Accrued Premiums Receivable - - - 159 159 Accrued Interest Receivable - 15 8 74 97 Due from Other Governments 5 - - - 5 Inventory 5,897 - - - 5,897 Prepaid Costs 7 517 209 13 746 Deposits - - - 69 69
Total Current Assets 6,934 10,175 8,831 46,694 72,634
Noncurrent Assets:Capital Assets, Not Being Depreciated 66 - - 14 80 Captial Assets, Being Depreciated, Net 1,407 - - 444 1,851
Total Noncurrent Assets 1,473 - - 458 1,931
Total Assets 8,407 10,175 8,831 47,152 74,565
DEFERRED OUTFLOWS OF RESOURCESDeferred Outflows Related to Pensions 857 122 49 122 1,150
Total Deferred Outflows of Resources 857 122 49 122 1,150
Total Assets and DeferredOutflows of Resources 9,264 10,297 8,880 47,274 75,715
LIABILITIESCurrent Liabilities
Accounts Payable and Accrued Liabilities 573 30 33 1,782 2,418 Estimated Claims Incurred-Not Reported - 1,946 9,153 2,696 13,795 Estimated Claims Incurred and Pending - 10,653 14,000 - 24,653 Current Portion of Compensated Absences 40 - - - 40
Total Current Liabilities 613 12,629 23,186 4,478 40,906
Long-Term Liabilities Compensated Absences 617 - - - 617 Net Pension Liability 8,937 1,277 511 1,277 12,002 Post Employment Benefits 7,909 1,001 417 1,059 10,386
Total Long-Term Liabilities 17,463 2,278 928 2,336 23,005
Total Liabilities 18,076 14,907 24,114 6,814 63,911
DEFERRED INFLOWS OF RESOURCESDeferred Inflows Related to Pensions 876 125 50 125 1,176
Total Deferred Inflows of Resources 876 125 50 125 1,176
NET POSITION Net Investment in Capital Assets 1,473 - - 458 1,931 Unrestricted (11,161) (4,735) (15,284) 39,877 8,697
Total Net Position (9,688)$ (4,735)$ (15,284)$ 40,335$ 10,628$
(in thousands)
CITY OF MESA, ARIZONAEXHIBIT C-3INTERNAL SERVICE FUNDSCOMBINING STATEMENT OF NET POSITIONJUNE 30, 2016

113
(in thousands)
Warehouse, Maintenance and Services
Property and Public
Liability Self Insurance
Workers' Compensation Self Insurance
Employee Benefits
Self Insurance Total
Operating Revenues: Charges For Services:
Warehouse 6,472$ -$ -$ -$ 6,472$ Fleet Support Services 17,939 - - - 17,939Printing and Graphics 920 - - - 920
Self-Insurance Contributions:Employee - - - 14,287 14,287City - 2,892 4,210 52,453 59,555State Retirement System - - - 4,192 4,192
Other - - 213 544 757Total Operating Revenues 25,331 2,892 4,423 71,476 104,122
Operating Expenses: Warehouse 6,292 - - - 6,292Fleet Support Services 17,951 - - - 17,951Printing and Graphics 1,218 - - - 1,218Administrative Costs - 1,145 979 7,199 9,323Claims and Premiums Paid - 4,798 2,988 68,903 76,689
Total Operating Expenses 25,461 5,943 3,967 76,102 111,473
Operating Income (Loss) Before Depreciation (130) (3,051) 456 (4,626) (7,351)
Depreciation (315) - - (194) (509)
Operating Income (Loss) (445) (3,051) 456 (4,820) (7,860)
Nonoperating Revenues (Expense): Investment Income - 125 48 554 727
Total Nonoperating Revenues (Expenses) - 125 48 554 727
Income (Loss) Before Capital Contributions (445) (2,926) 504 (4,266) (7,133)
Capital Contributions 167 - - - 167Transfers In 2,953 - - - 2,953Transfers Out (670) (927) (374) (982) (2,953)
Change in Net Position 2,005 (3,853) 130 (5,248) (6,966)
Total Net Position - Beginning (11,693) (882) (15,414) 45,583 17,594
Total Net Position - Ending (9,688)$ (4,735)$ (15,284)$ 40,335$ 10,628$
AND CHANGES IN NET POSITIONFOR THE FISCAL YEAR ENDED JUNE 30, 2016
CITY OF MESA, ARIZONAEXHIBIT C-4INTERNAL SERVICE FUNDSCOMBINING STATEMENT OF REVENUES, EXPENSES

114
CITY OF MESA, ARIZONAEXHIBIT C-5INTERNAL SERVICE FUNDSCOMBINING STATEMENT OF CASH FLOWSFOR THE FISCAL YEAR ENDED JUNE 30, 2016(in thousands)
Warehouse, Maintenance and Services
Property and Public
Liability Self Insurance
Workers' Compensation Self Insurance
Employee Benefits
Self Insurance Total
Cash Flows from Operating Activities:Cash Received from Users 25,225$ 2,892$ 4,423$ 72,249$ 104,789$ Cash Payments to Suppliers (17,685) (1,061) (3,708) (75,517) (97,971) Cash Payments to Employees (9,891) (917) (431) (927) (12,166)
Net Cash Provided by (Used For)Operating Activities (2,351) 914 284 (4,195) (5,348)
Cash Flows From Noncapital Financing Activities: Operating Transfers-In From Other Funds 2,283 (927) (374) (982) -
Net Cash Provided By (Used For)Noncapital Financing Activities 2,283 (927) (374) (982) -
Cash Flows from Capital and RelatedFinancing Activities:
Acquisition and Construction of Capital Assets (17) - - (131) (148) Net Cash Provided By (Used For) Capital
and Related Financing Activities (17) - - (131) (148)
Cash Flows from Investing Activities:Interest Received on Investments - 123 46 541 710
Net Cash Provided by Investing Activities - 123 46 541 710
Net Change in Cash and Cash Equivalents (85) 110 (44) (4,767) (4,786)
Pooled Cash and Investments at Beginning of Year 822 9,533 8,658 51,123 70,136
Pooled Cash and Investments at End of Year 737$ 9,643$ 8,614$ 46,356$ 65,350$
Reconciliation of Operating Income (Loss)to Net Cash Provided by Operating Activities:
Operating Income (Loss) (445)$ (3,051)$ 456$ (4,820)$ (7,860)$
Adjustments to Reconcile Operating Income (Loss)to Net Cash Provided by Operating Activities: Depreciation 315 - - 194 509 Changes in Assets and Liabilities: (Increase)/Decrease in Receivables (106) - - 13 (93) (Increase)/Decrease in Inventory 95 - - - 95 (Increase)/Decrease in Deposits and Prepaid Costs - (21) 13 (21) (29) (Decrease)/Increase in Accounts Payable (416) 14 (75) (564) (1,041) (Decrease)/Increase in Pension Liability (79) (4) (15) (14) (112) (Decrease)/Increase in Other Accrued Expenses (1,715) 3,976 (95) 1,017 3,183
Total Adjustments (1,906) 3,965 (172) 625 2,512
Net Cash Provided by (Used for) Operating Activities (2,351)$ 914$ 284$ (4,195)$ (5,348)$
Noncash Transactions Affecting Financial Position:Contributions of Capital Assets 167$ -$ -$ -$ 167$

AGENCY FUND
The Agency Fund accounts for assets held by the City in a custodial capacity for the benefit of a third party and cannot be used to address activities or obligations of the City.
The Payroll Agency Fund accounts for all payroll transactions.

115
(in thousands)Balance Balance
July 1, 2015 Additions Deductions June 30, 2016PAYROLL AGENCY FUND
Assets: Pooled Cash and Investments 14,269$ 637,457$ 641,490$ 10,236$ Due from Others 2 58 54 6
Total Assets 14,271$ 637,515$ 641,544$ 10,242$
Liabilities: Accounts Payable 98$ 330,323$ 329,086$ 1,335$ Accrued Payroll Payable 14,173 413,486 418,752 8,907
Total Liabilities 14,271$ 743,809$ 747,838$ 10,242$
CITY OF MESA, ARIZONAEXHIBIT C-6
AGENCY FUNDSTATEMENT OF CHANGES IN ASSETS AND LIABILITIES
FOR THE FISCAL YEAR ENDED JUNE 30, 2016


Supplemental InformationComprehensive Annual Financial Report2016

116
Original Final ActualVariance with Final Budget
Revenues:Property Taxes 60$ 60$ 53$ (7)$ Contributions 88 88 84 (4)
Total Revenues 148 148 137 (11)
Expenditures:Current:
General Government 148 145 78 67Debt Service:
Service Charges - 3 3 -Total Expenditures 148 148 81 67
Excess (Deficiency) of RevenuesOver (Under) Expenditures - - 56 56
Other Financing Uses:Transfers Out - (36) (32) 4
Total Other Financing Uses - (36) (32) 4
Net Change in Fund Balances - (36) 24 60
Fund Balance - Beginning 51 51 (2) (53)
Fund Balance - Ending 51$ 15$ 22$ 7$
(in thousands)Budgeted Amounts
CITY OF MESA, ARIZONAEXHIBIT D-1SUPPLEMENTAL INFORMATIONBUDGETARY COMPARISON SCHEDULECOMMUNITY FACILITIES DISTRICT SPECIAL REVENUE FUNDFOR THE FISCAL YEAR ENDED JUNE 30, 2016

117
Original Final ActualVariance with Final Budget
Revenues:Intergovernmental -$ -$ 152$ 152$ Charges for Services 14,800 14,800 15,066 266Investment Income 2 2 76 74
Total Revenues 14,802 14,802 15,294 492
Expenditures:Current:
General Government 1,142 1,144 911 233Public Safety 2,010 82 80 2Community Environment 4,599 4,940 3,990 950Cultural-Recreational 6,356 6,359 6,285 74
Capital Outlay 2,941 4,881 1,694 3,187Total Expenditures 17,048 17,406 12,960 4,446
Excess (Deficiency) of RevenuesOver (Under) Expenditures (2,246) (2,604) 2,334 4,938
Net Change in Fund Balances (2,246) (2,604) 2,334 4,938
Fund Balances - Beginning 3,435 3,435 7,160 3,725
Fund Balance - Ending 1,189$ 831$ 9,494$ 8,663$
(in thousands)Budgeted Amounts
CITY OF MESA, ARIZONAEXHIBIT D-2SUPPLEMENTAL INFORMATIONBUDGETARY COMPARISON SCHEDULEENVIRONMENTAL COMPLIANCEFOR THE FISCAL YEAR ENDED JUNE 30, 2016

118
Original Final ActualVariance with Final Budget
Revenues:Occupancy Taxes 1,739$ 1,739$ 2,291$ 552$ Licenses and Permits - - 492 492Intergovernmental 23,421 23,421 11,690 (11,731)Charges for Services 64 64 15 (49)Fines and Forfeitures 1,095 1,095 1,051 (44)Investment Income - - 27 27Contributions 194 194 196 2Miscellaneous Revenues 2,246 2,246 1,620 (626)
Total Revenues 28,759 28,759 17,382 (11,377)
Expenditures:Current:
General Government 2,072 3,144 2,692 452Public Safety 13,667 13,523 7,845 5,678Community Environment 133 607 175 432Cultural-Recreational 1,013 1,182 850 332
Capital Outlay 13,862 14,617 5,821 8,796Total Expenditures 30,747 33,073 17,383 15,690
Excess (Deficiency) of RevenuesOver (Under) Expenditures (1,988) (4,314) (1) 4,313
Other Financing Sources (Uses):Transfers In - - 18 18Transfers Out - - (538) (538)
Total Other Financing Uses - - (520) (520)
Net Change in Fund Balances (1,988) (4,314) (521) 3,793
Fund Balances - Beginning 2,266 2,266 7,094 4,828
Fund Balance - Ending 278$ (2,048)$ 6,573$ 8,621$
Budgeted Amounts
CITY OF MESA, ARIZONAEXHIBIT D-3
GRANTS AND SPECIAL PROGRAMSBUDGETARY COMPARISON SCHEDULE
FOR THE FISCAL YEAR ENDED JUNE 30, 2016(in thousands)
SUPPLEMENTAL INFORMATION

119
Original Final ActualVariance with Final Budget
Revenues:Intergovernmental 34,281$ 34,281$ 35,403$ 1,122$ Charges for Services - - 10 10Investment Income - - 14 14Miscellaneous Revenues - - 5 5
Total Revenues 34,281 34,281 35,432 1,151
Expenditures:Current:
Community Environment 21,455 19,068 18,130 938Capital Outlay 591 2,760 1,097 1,663
Total Expenditures 22,046 21,828 19,227 2,601
Excess (Deficiency) of RevenuesOver (Under) Expenditures 12,235 12,453 16,205 3,752
Other Financing Uses:Transfers Out (12,235) (12,239) (12,238) 1
Total Other Financing Uses (12,235) (12,239) (12,238) 1
Net Change in Fund Balances - 214 3,967 3,753
Fund Balances - Beginning - - 10,082 10,082
Fund Balance - Ending -$ 214$ 14,049$ 13,835$
Budgeted Amounts
CITY OF MESA, ARIZONA
HIGHWAY USER REVENUEFOR THE FISCAL YEAR ENDED JUNE 30, 2016
EXHIBIT D-4
(in thousands)
SUPPLEMENTAL INFORMATIONBUDGETARY COMPARISON SCHEDULE
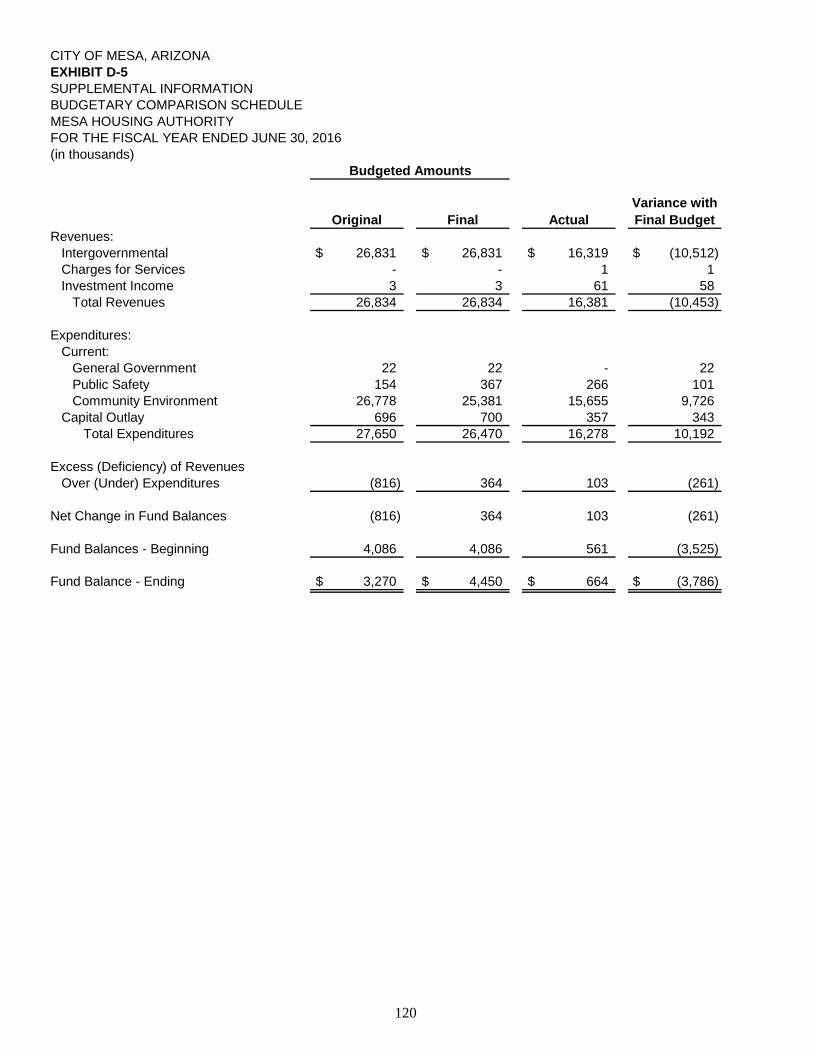
120
Original Final ActualVariance with Final Budget
Revenues:Intergovernmental 26,831$ 26,831$ 16,319$ (10,512)$ Charges for Services - - 1 1Investment Income 3 3 61 58
Total Revenues 26,834 26,834 16,381 (10,453)
Expenditures:Current:
General Government 22 22 - 22Public Safety 154 367 266 101Community Environment 26,778 25,381 15,655 9,726
Capital Outlay 696 700 357 343Total Expenditures 27,650 26,470 16,278 10,192
Excess (Deficiency) of RevenuesOver (Under) Expenditures (816) 364 103 (261)
Net Change in Fund Balances (816) 364 103 (261)
Fund Balances - Beginning 4,086 4,086 561 (3,525)
Fund Balance - Ending 3,270$ 4,450$ 664$ (3,786)$
(in thousands)Budgeted Amounts
CITY OF MESA, ARIZONAEXHIBIT D-5
MESA HOUSING AUTHORITYFOR THE FISCAL YEAR ENDED JUNE 30, 2016
SUPPLEMENTAL INFORMATIONBUDGETARY COMPARISON SCHEDULE

121
Original Final ActualVariance with Final Budget
Revenues:Sales Taxes 21,210$ 21,210$ 21,693$ 483$ Licenses and Permits - - 90 90Investment Income - - 31 31
Total Revenues 21,210 21,210 21,814 604
Expenditures:Current:
Public Safety 21,210 22,258 22,258 -Total Expenditures 21,210 22,258 22,258 -
Excess (Deficiency) of RevenuesOver (Under) Expenditures - (1,048) (444) 604
Net Change in Fund Balances - (1,048) (444) 604
Fund Balances - Beginning - - 3,077 3,077
Fund Balance - Ending -$ (1,048)$ 2,633$ 3,681$
Budgeted Amounts
CITY OF MESA, ARIZONAEXHIBIT D-6
QUALITY OF LIFE SALES TAXFOR THE FISCAL YEAR ENDED JUNE 30, 2016(in thousands)
SUPPLEMENTAL INFORMATIONBUDGETARY COMPARISON SCHEDULE

122
Original Final ActualVariance with Final Budget
Revenues:Sales Taxes 25,452$ 25,452$ 26,017$ 565$ Licenses and Permits 289 289 151 (138)Intergovernmental - - 152 152Charges for Services 130 130 342 212Fines and Forfeitures 206 206 - (206)Investment Income 71 71 587 516Miscellaneous Revenues 2 2 699 697
Total Revenues 26,150 26,150 27,948 1,798
Expenditures:Current:
General Government 3,011 3,271 4,116 (845)Public Safety 341 352 346 6Community Environment 17,782 17,300 13,886 3,414
Capital Outlay 20,039 21,795 14,611 7,184Total Expenditures 41,173 42,718 32,959 9,759
Excess (Deficiency) of RevenuesOver (Under) Expenditures (15,023) (16,568) (5,011) 11,557
Net Change in Fund Balances (15,023) (16,568) (5,011) 11,557
Fund Balances - Beginning 33,577 33,577 38,849 5,272
Fund Balance - Ending 18,554$ 17,009$ 33,838$ 16,829$
FOR THE FISCAL YEAR ENDED JUNE 30, 2016(in thousands)
Budgeted Amounts
CITY OF MESA, ARIZONAEXHIBIT D-7
STREET SALES TAX
SUPPLEMENTAL INFORMATIONBUDGETARY COMPARISON SCHEDULE
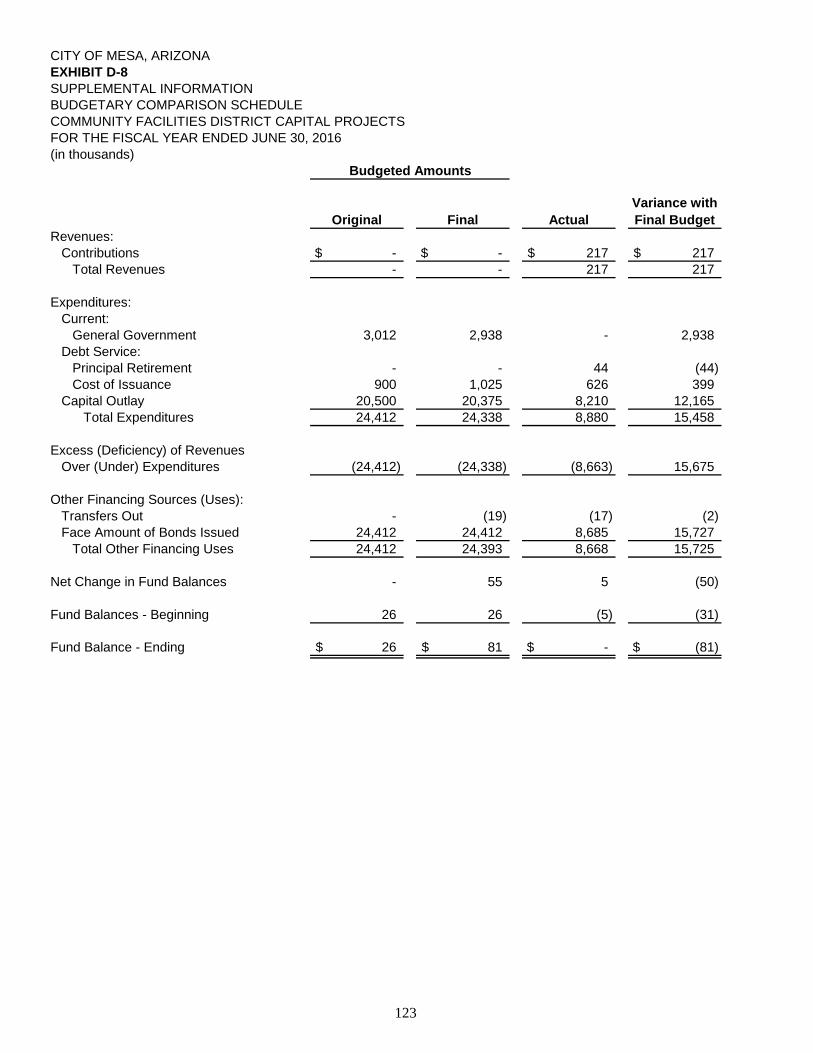
123
Original Final ActualVariance with Final Budget
Revenues:Contributions -$ -$ 217$ 217$
Total Revenues - - 217 217
Expenditures:Current:
General Government 3,012 2,938 - 2,938Debt Service:
Principal Retirement - - 44 (44)Cost of Issuance 900 1,025 626 399
Capital Outlay 20,500 20,375 8,210 12,165Total Expenditures 24,412 24,338 8,880 15,458
Excess (Deficiency) of RevenuesOver (Under) Expenditures (24,412) (24,338) (8,663) 15,675
Other Financing Sources (Uses):Transfers Out - (19) (17) (2)Face Amount of Bonds Issued 24,412 24,412 8,685 15,727
Total Other Financing Uses 24,412 24,393 8,668 15,725
Net Change in Fund Balances - 55 5 (50)
Fund Balances - Beginning 26 26 (5) (31)
Fund Balance - Ending 26$ 81$ -$ (81)$
(in thousands)Budgeted Amounts
CITY OF MESA, ARIZONAEXHIBIT D-8SUPPLEMENTAL INFORMATIONBUDGETARY COMPARISON SCHEDULECOMMUNITY FACILITIES DISTRICT CAPITAL PROJECTSFOR THE FISCAL YEAR ENDED JUNE 30, 2016

124
Original Final ActualVariance with Final Budget
Revenues:Miscellaneous Revenues 849$ 849$ 522$ (327)$
Total Revenues 849 849 522 (327)
Expenditures:Current:
General Government 705 697 - 697Cultural-Recreational 1,250 1,245 - 1,245
Capital Outlay 17,292 22,380 9,026 13,354Total Expenditures 19,247 24,322 9,026 15,296
Excess (Deficiency) of RevenuesOver (Under) Expenditures (18,398) (23,473) (8,504) 14,969
Other Financing Sources (Uses):Transfers In 8,259 8,259 5,456 2,803
Total Other Financing Uses 8,259 8,259 5,456 2,803
Net Change in Fund Balances (10,139) (15,214) (3,048) 12,166
Fund Balances - Beginning 11,329 11,329 10,484 (845)
Fund Balance - Ending 1,190$ (3,885)$ 7,436$ 11,321$
(in thousands)Budgeted Amounts
CITY OF MESA, ARIZONAEXHIBIT D-9SUPPLEMENTAL INFORMATIONBUDGETARY COMPARISON SCHEDULEGENERAL CAPITAL PROJECTSFOR THE FISCAL YEAR ENDED JUNE 30, 2016

125
Original Final ActualVariance with Final Budget
Revenues:Intergovernmental 19,126$ 19,126$ 165$ (18,961)$
Total Revenues 19,126 19,126 165 (18,961)
Expenditures:Debt Service:
Cost of Issuance - 135 120 15Capital Outlay 43,833 43,783 13,547 30,236
Total Expenditures 43,833 43,918 13,667 30,251
Excess (Deficiency) of RevenuesOver (Under) Expenditures (24,707) (24,792) (13,502) 11,290
Other Financing Sources (Uses):Face Amount of Bonds Issued 24,299 24,299 10,440 13,859Premium on Issuance of Bonds (Net) - - 283 (283)
Total Other Financing Uses 24,299 24,299 10,723 13,576
Net Change in Fund Balances (408) (493) (2,779) (2,286)
Fund Balances - Beginning 24,855 24,855 19,057 (5,798)
Fund Balance - Ending 24,447$ 24,362$ 16,278$ (8,084)$
(in thousands)Budgeted Amounts
CITY OF MESA, ARIZONAEXHIBIT D-10SUPPLEMENTAL INFORMATIONBUDGETARY COMPARISON SCHEDULESTREETSFOR THE FISCAL YEAR ENDED JUNE 30, 2016
Statistical SectionComprehensive Annual Financial Report2016
STATISTICAL SECTION
This part of the City of Mesa’s comprehensive annual financial report presents detailed information as a context for understanding what the information in the financial statements, note disclosures, and required supplementary information says about the City’s overall financial health. Contents Page Financial Trends 126 These schedules contain trend information to help the reader understand how the City’s financial performance and well-being have changed over time. Revenue Capacity 138 These schedules contain information to help readers assess the City’s most significant local revenue source, the sales tax. Debt Capacity 141 These schedules present information to help the reader assess the affordability of the City’s current level of outstanding debt and the City’s ability to issue additional debt in the future. Demographic and Economic Information 149 These schedules offer demographic and economic indicators to help the reader understand the environment within which the City’s financial activities take place. Operating Information 151 These schedules contain service and infrastructure data to help the reader understand how the information in the City’s financial report relates to the services the City provides and the activities it performs. Sources: Unless otherwise noted, the information in these schedules is derived from the comprehensive annual financial reports for the relevant year.

126
CITY OF MESA, ARIZONA TABLE INET POSITION BY COMPONENTSLAST TEN FISCAL YEARS(accrual basis of accounting)(in thousands)
2006-07 2007-08 2008-09 2009-10GOVERNMENTAL ACTIVITIES
Net Investment in Capital Assets 791,592$ 794,720$ 791,523$ 844,777$ Restricted 95,107 86,252 92,533 86,955 Unrestricted 128,548 125,128 91,363 3,651
Total Governmental Activities Net Position 1,015,247$ 1,006,100$ 975,419$ 935,383$
BUSINESS-TYPE ACTIVITIESNet Investment in Capital Assets 366,498$ 410,074$ 413,944$ 434,814$ Restricted 96,756 94,133 82,697 47,011 Unrestricted 308,375 308,216 278,892 271,706
Total Business-type Activities 771,629$ 812,423$ 775,533$ 753,531$
PRIMARY GOVERNMENTNet Investment in Capital Assets 1,158,090$ 1,204,794$ 1,205,467$ 1,279,591$ Restricted 191,863 180,385 175,230 133,966 Unrestricted 436,923 433,344 370,255 275,357
Total Primary Government 1,786,876$ 1,818,523$ 1,750,952$ 1,688,914$
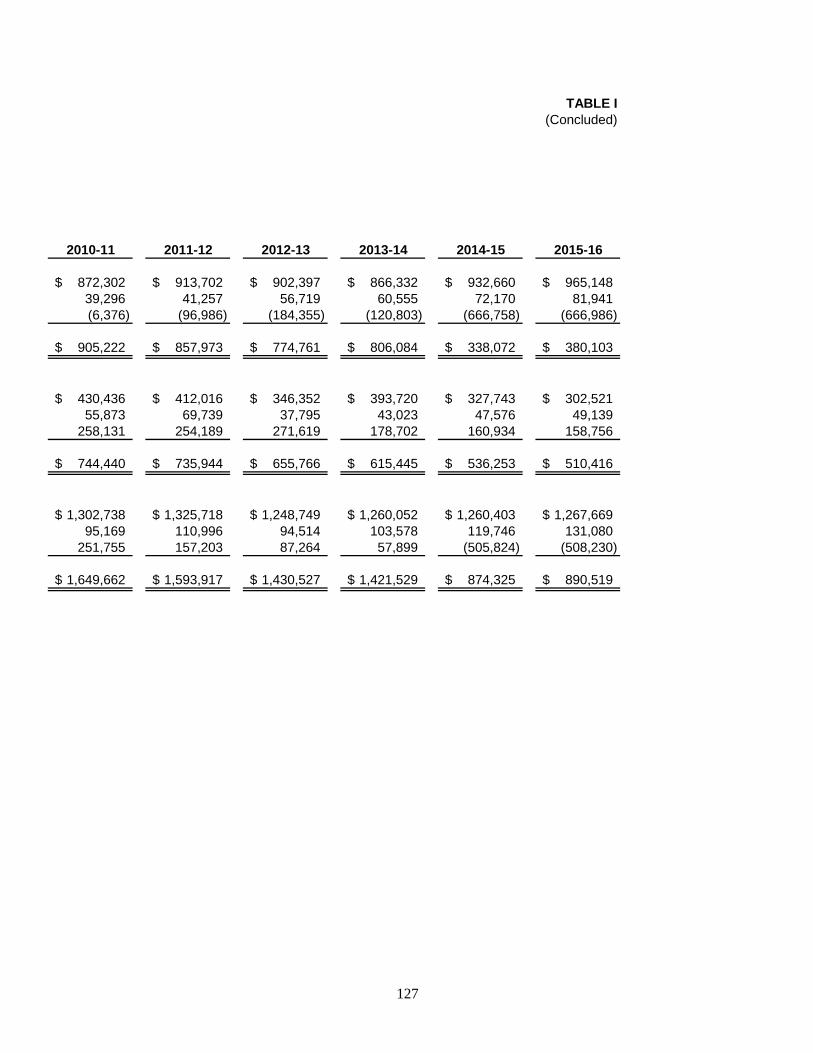
127
TABLE I(Concluded)
2010-11 2011-12 2012-13 2013-14 2014-15 2015-16
872,302$ 913,702$ 902,397$ 866,332$ 932,660$ 965,148$ 39,296 41,257 56,719 60,555 72,170 81,941 (6,376) (96,986) (184,355) (120,803) (666,758) (666,986)
905,222$ 857,973$ 774,761$ 806,084$ 338,072$ 380,103$
430,436$ 412,016$ 346,352$ 393,720$ 327,743$ 302,521$ 55,873 69,739 37,795 43,023 47,576 49,139
258,131 254,189 271,619 178,702 160,934 158,756
744,440$ 735,944$ 655,766$ 615,445$ 536,253$ 510,416$
1,302,738$ 1,325,718$ 1,248,749$ 1,260,052$ 1,260,403$ 1,267,669$ 95,169 110,996 94,514 103,578 119,746 131,080
251,755 157,203 87,264 57,899 (505,824) (508,230)
1,649,662$ 1,593,917$ 1,430,527$ 1,421,529$ 874,325$ 890,519$

128
CITY OF MESA, ARIZONATABLE IICHANGES IN NET POSITIONLAST TEN FISCAL YEARS(accrual basis of accounting)(in thousands)
EXPENSES 2006-07 2007-08 2008-09 2009-10
GOVERNMENTAL ACTIVITIES:General Government 48,201$ 63,633$ 54,226$ 54,863$ Public Safety 232,100 292,396 290,928 288,929 Community Environment 91,664 99,415 121,736 104,096 Cultural-Recreational 64,592 72,999 67,039 54,010 Interest on Long-term Debt 18,037 19,083 18,659 20,013
Total Governmental Activities Expenses 454,594 547,526 552,588 521,911
BUSINESS-TYPE ACTIVITIES:Electric 26,281 31,612 27,634 27,106 Gas 37,826 43,247 35,992 35,466 Water 59,965 59,225 68,956 80,915 Wastewater 60,603 61,293 80,349 70,228 Solid Waste 27,891 32,877 31,953 31,504 Airport 2,721 3,317 3,703 3,944 Golf Course 2,602 3,012 3,083 2,715 Convention Center 5,667 5,447 4,558 4,158 Hohokam Stadium/Fitch Complex - - - 7,408 Cubs Stadium - - - - District Cooling 1,090 769 976 1,000 Interest on Long-term Debt - - - -
Total Business-type Activities Expenses 224,646 240,799 257,204 264,444
Total Primary Government Expenses 679,240$ 788,325$ 809,792$ 786,355$
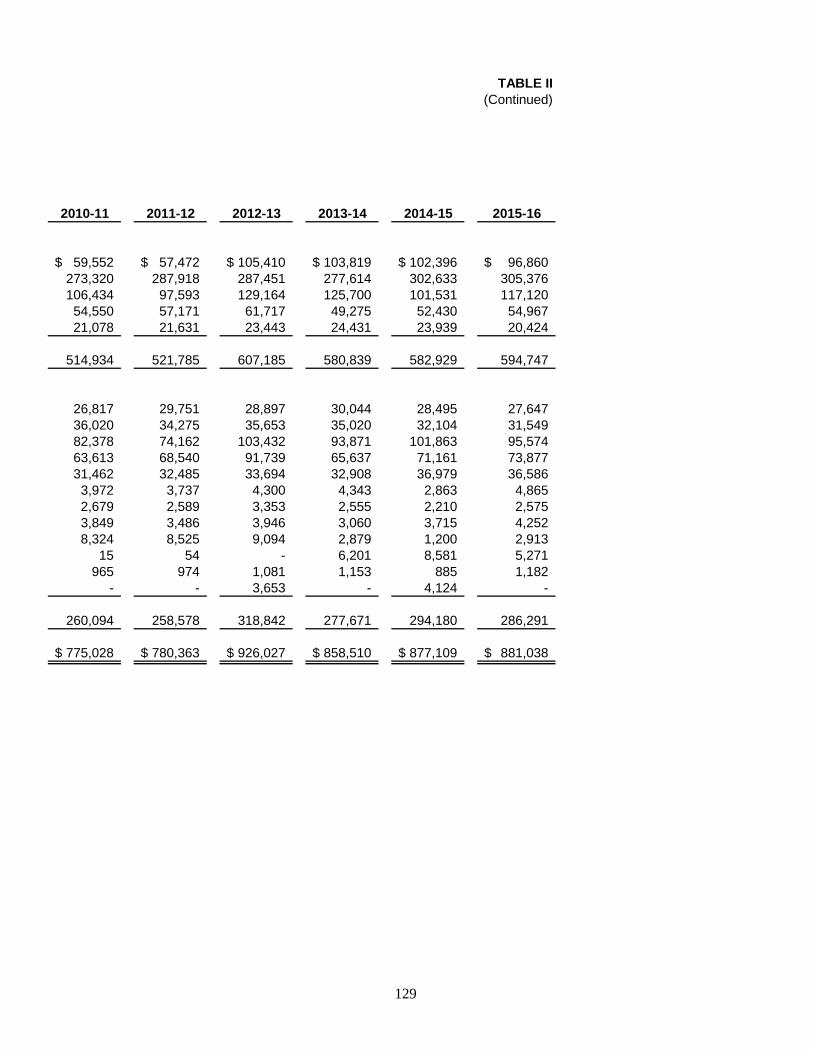
129
TABLE II(Continued)
2010-11 2011-12 2012-13 2013-14 2014-15 2015-16
59,552$ 57,472$ 105,410$ 103,819$ 102,396$ 96,860$ 273,320 287,918 287,451 277,614 302,633 305,376 106,434 97,593 129,164 125,700 101,531 117,120 54,550 57,171 61,717 49,275 52,430 54,967 21,078 21,631 23,443 24,431 23,939 20,424
514,934 521,785 607,185 580,839 582,929 594,747
26,817 29,751 28,897 30,044 28,495 27,647 36,020 34,275 35,653 35,020 32,104 31,549 82,378 74,162 103,432 93,871 101,863 95,574 63,613 68,540 91,739 65,637 71,161 73,877 31,462 32,485 33,694 32,908 36,979 36,586 3,972 3,737 4,300 4,343 2,863 4,865 2,679 2,589 3,353 2,555 2,210 2,575 3,849 3,486 3,946 3,060 3,715 4,252 8,324 8,525 9,094 2,879 1,200 2,913
15 54 - 6,201 8,581 5,271 965 974 1,081 1,153 885 1,182
- - 3,653 - 4,124 -
260,094 258,578 318,842 277,671 294,180 286,291
775,028$ 780,363$ 926,027$ 858,510$ 877,109$ 881,038$

130
CITY OF MESA, ARIZONATABLE II (Continued)CHANGES IN NET POSITIONLAST TEN FISCAL YEARS(accrual basis of accounting)(in thousands)
PROGRAM REVENUES 2006-07 2007-08 2008-09 2009-10
GOVERNMENTAL ACTIVITIES:Charges for services:
Licenses and Permits 20,128$ 23,342$ 13,426$ 11,824$ Charges for Services 22,039 23,703 24,740 20,419 Fines and Forfeitures 10,277 10,761 10,215 10,135 Other activities 433 324 78 9
Operating Grants and Contributions 74,498 63,787 63,055 72,812 Capital Grants and Contributions 44,858 21,916 35,436 30,343
Total Governmental Activities Program Revenues 172,233 143,833 146,950 145,542
BUSINESS-TYPE ACTIVITIES:Charges for services:
Electric 34,519 34,148 35,313 33,079 Gas 45,250 46,540 41,708 38,924 Water 92,007 97,559 95,995 98,806 Wastewater 55,398 53,951 54,720 57,699 Solid Waste 42,895 46,168 46,762 46,685 Airport 2,954 3,192 2,959 3,125 Golf Course 2,457 2,448 2,310 2,265 Convention Center 4,746 3,658 2,687 1,971 Hohokam Stadium/Fitch Complex - - - 5,837 Cubs Stadium - - - - District Cooling 193 229 834 984 Economic Investment - - - -
Operating Grants and Contributions 147 11 101 210 Capital Grants and Contributions 20,724 80,570 31,222 17,782
Total Business-type Activities Program Revenues 301,290 368,474 314,611 307,367
Total Primary Government Program Revenues 473,523$ 512,307$ 461,561$ 452,909$
NET (EXPENSE)/REVENUEGovernmental Activities (282,361)$ (403,693)$ (405,638)$ (376,369)$ Business-type Activities 76,644 127,675 57,407 42,923
Total Primary Government Net Expense (205,717)$ (276,018)$ (348,231)$ (333,446)$

131
TABLE II(Continued)
2010-11 2011-12 2012-13 2013-14 2014-15 2015-16
12,577$ 13,359$ 17,693$ 18,797$ 20,892$ 23,254$ 20,304 25,779 27,675 32,106 36,260 38,178 11,820 11,294 9,885 9,890 10,505 11,049
8 18 2,945 400 5,741 9,385 65,284 60,355 55,312 29,514 26,418 26,361 31,461 23,503 25,049 20,714 75,907 35,925
141,454 134,308 138,559 111,421 175,723 144,152
33,138 34,625 31,075 31,198 33,601 32,254 41,370 39,139 39,125 38,600 39,422 38,962
102,215 113,418 111,933 112,003 121,205 130,674 59,659 64,544 64,413 66,457 77,172 79,523 47,538 47,631 47,369 47,452 52,748 55,354 3,318 3,271 3,484 3,813 3,454 3,623 2,250 2,169 1,472 1,622 1,737 1,645 2,826 2,122 2,597 2,057 2,475 2,798 6,161 6,074 5,496 36 2 63
52 825 - 174 202 201 945 1,092 975 1,142 1,274 1,234
- - 148 - - - 25 2,126 9,401 9,056 157 267
10,774 15,814 7,997 17,331 18,107 16,929 310,271 332,850 325,485 330,941 351,556 363,527
451,725$ 467,158$ 464,044$ 442,362$ 527,279$ 507,679$
(373,480)$ (387,477)$ (468,626)$ (469,418)$ (407,206)$ (450,595)$ 50,177 74,272 6,643 53,270 57,376 77,236
(323,303)$ (313,205)$ (461,983)$ (416,148)$ (349,830)$ (373,359)$

132
CITY OF MESA, ARIZONATABLE II (Continued)CHANGES IN NET POSITIONLAST TEN FISCAL YEARS(accrual basis of accounting)(in thousands)
GENERAL REVENUES AND OTHER CHANGES IN NET POSITION 2006-07 2007-08 2008-09 2009-10
GOVERNMENTAL ACTIVITIES:Sales Taxes 155,817$ 147,763$ 126,520$ 121,557$ Property Taxes - - - 14,318 Occupancy Taxes 2,390 2,395 1,808 1,581 Unrestricted Intergovernmental Revenues 113,049 122,561 117,543 104,580 Contributions Not Restricted to Specific Programs 14,038 14,746 14,741 14,757 Investment Income 7,825 6,282 1,896 261 Miscellaneous 7,054 6,679 15,849 13,846 Transfers 61,440 94,121 96,599 65,433
Total Governmental Activities 361,613 394,547 374,956 336,333
BUSINESS-TYPE ACTIVITIES:Occupancy Taxes - - - - Investment Income 8,125 6,546 1,894 508 Gain (Loss) on Sale of Capital Assets - - - - Miscellaneous 429 694 407 - Transfers (61,440) (94,121) (96,599) (65,433)
Total Business-type Activities (52,886) (86,881) (94,298) (64,925)
Total Primary Government 308,727$ 307,666$ 280,658$ 271,408$
Change in Net PositionGovernmental Activities 79,252$ (9,146)$ (30,682)$ (40,036)$ Business-type Activities 23,758 40,794 (36,891) (22,002)
Total Primary Government 103,010$ 31,648$ (67,573)$ (62,038)$

133
TABLE II(Concluded)
2010-11 2011-12 2012-13 2013-14 2014-15 2015-16
121,046$ 126,644$ 137,280$ 140,567$ 146,337$ 151,826$ 14,244 14,234 14,354 22,549 33,241 33,825 2,148 2,019 1,903 1,919 2,081 2,331
92,613 86,103 104,462 135,075 145,266 149,350 15,610 17,171 49,569 88,646 47,761 44,928
617 1,503 1,692 966 1,786 2,210 7,060 8,939 7,424 5,550 7,844 6,008
83,334 83,615 83,615 109,520 94,427 102,148
336,672 340,228 400,299 504,792 478,743 492,626
- - 825 851 999 1,161 839 850 860 1,453 1,141 3,020
- - - 18,697 5,157 (6,145) - - - 288 233 1,039
(83,334) (83,615) (83,615) (109,520) (94,427) (102,148)
(82,495) (82,765) (81,930) (88,231) (86,897) (103,073)
254,177$ 257,463$ 318,369$ 416,561$ 391,846$ 389,553$
(36,808)$ (47,249)$ (68,327)$ 35,374$ 71,537$ 42,031$ (32,318) (8,493) (75,287) (34,961) (29,521) (25,837)
(69,126)$ (55,742)$ (143,614)$ 413$ 42,016$ 16,194$

134
CITY OF MESA, ARIZONATABLE IIIFUND BALANCE, GOVERNMENTAL FUNDSLAST TEN FISCAL YEARS(modified accrual basis of accounting)(in thousands)
2006-07 2007-08 2008-09 2009-10 2010-11GENERAL FUND
Reserved (1)(2) 77,177$ 84,886$ 51,862$ 4,048$ -$ Unreserved 57,030 50,283 74,711 92,187 - Nonspendable - - - - 405 Restricted - - - - 1,992 Committed - - - - 4,898 Assigned - - - - - Unassigned - - - - 93,875
Total General Fund 134,207$ 135,169$ 126,573$ 96,235$ 101,170$
ALL OTHER GOVERNMENTAL FUNDSReserved 5,885$ 8,643$ 17,013$ 53,674$ -$ Unreserved, Reported in:
Special Revenue Funds 24,627 24,922 24,816 31,871 - Capital Project Funds 17,568 11,143 28,442 15,724 -
Nonspendable - - - - 2,906 Restricted (3)(4) - - - - 112,538 Committed - - - - 19,166 Assigned - - - - - Unassigned - - - - -
Total All Other Governmental Funds 48,080$ 44,708$ 70,271$ 101,269$ 134,610$
(1) During fiscal Year 1998-99, a voter-approved 1/2 percent increase to sales tax was enacted. This additional tax is restricted to fund improvements to quality of life projects and is reported as reserved fund balance in the General Fund.(2) During FY 2006-07, a quarter percent portion of the sales tax increase described in (1) above to fund capital improvements to quality of life projects expired and was not renewed. Also during FY 2006-07, a voter-approved 1/2 percent increase to sales tax was enacted. This additional tax is restricted to fund street improvements and is reported as restricted fund balance in the General Fund.(3) Effective with fiscal year 2010-11 the fund balance related to the sales tax for street improvements was moved to the Special Revenue funds.(4) Effective with fiscal year 2011-12 the fund balance related to the sales tax for Quality of Life projects was moved to the Special Revenue funds.

135
TABLE III(Concluded)
2011-12 2012-13 2013-14 2014-15 2015-16
-$ -$ -$ -$ -$ - - - - -
754 1,724 2,956 3,490 4,035 2,012 284 188 184 184 4,992 1,185 1,484 126 227
- - - - 10,703 78,035 50,426 72,683 74,145 79,657
85,793$ 53,619$ 77,311$ 77,945$ 94,806$
-$ -$ -$ -$ -$
- - - - - - - - - -
84 55 23 138 77 211,279 243,831 190,609 172,316 95,701 16,360 23,005 21,379 30,092 28,580
- - - - 6 (1) (1,177) (675) (31) (155)
227,722$ 265,714$ 211,336$ 202,515$ 124,209$

136
CITY OF MESA, ARIZONATABLE IVCHANGES IN FUND BALANCE, GOVERNMENTAL FUNDSLAST TEN FISCAL YEARS(modified accrual basis of accounting)(in thousands)
2006-07 2007-08 2008-09 2009-10REVENUES
Sales Taxes (1)(2) 155,817$ 147,763$ 126,520$ 121,557$ Property Taxes - - - 13,886 Occupancy Taxes 2,390 2,395 1,808 1,581 Special Assessments 417 1,218 806 923 Licenses and Permits 20,128 23,342 13,426 11,824 Intergovernmental 190,826 193,585 191,085 190,731 Charges for Services 22,039 23,703 24,343 20,419 Fines and Forfeitures 10,277 10,761 10,215 10,135 Investment Income 6,463 5,178 2,018 191 Contributions - - - - Miscellaneous 6,366 6,422 14,755 13,675
Total Revenues 414,723 414,367 384,976 384,922
EXPENDITURESCurrent
General Government 40,662 48,112 36,507 40,113 Public Safety 210,542 233,507 230,864 216,026 Community Environment 65,314 66,616 72,647 72,081 Cultural-Recreational 54,711 57,765 53,171 40,150
Debt ServicePrincipal 8,358 25,871 36,906 34,846 Interest 18,151 19,230 18,845 21,186 Service Charges 57 58 28 9 Cost of Issuance - - - 539
Capital Outlay 77,475 77,309 77,899 82,530 Total Expenditures 475,270 528,468 526,867 507,480
Excess of Revenues Under Expenditures (60,547) (114,101) (141,891) (122,558)
OTHER FINANCING SOURCES (USES)Transfers In 99,901 147,478 155,697 149,437 Transfers Out (33,233) (53,960) (59,106) (66,654) Face Amount of Bonds Issued 30,682 15,450 61,830 30,865 Face Amount of Notes Issued - - - 45,000 Premium on Issuance of Bonds (Net) 573 195 437 402 Premium on Issuance of Notes - - - 869 Proceeds from Capital Leases 6,911 2,529 - - Issuance of Refunding Bonds - - - - Payment to Refunding Bond Agent - - - -
Total Other Financing Sources (Uses) 104,834 111,692 158,858 159,919
Net Change in Fund Balances 44,287$ (2,409)$ 16,967$ 37,361$
Debt Service as a percentage ofNoncapital Expenditures 6.68% 10.01% 12.42% 13.19%
(1) During fiscal year 1998-99, a voter approved one-half percent increase to sales tax was enacted. (2) During fiscal year 2006-07, a voter approved one-half percent increase to sales tax was enacted. In addition, a quarter percent portion of the sales tax described in (1) above expired and was not renewed by the voters.
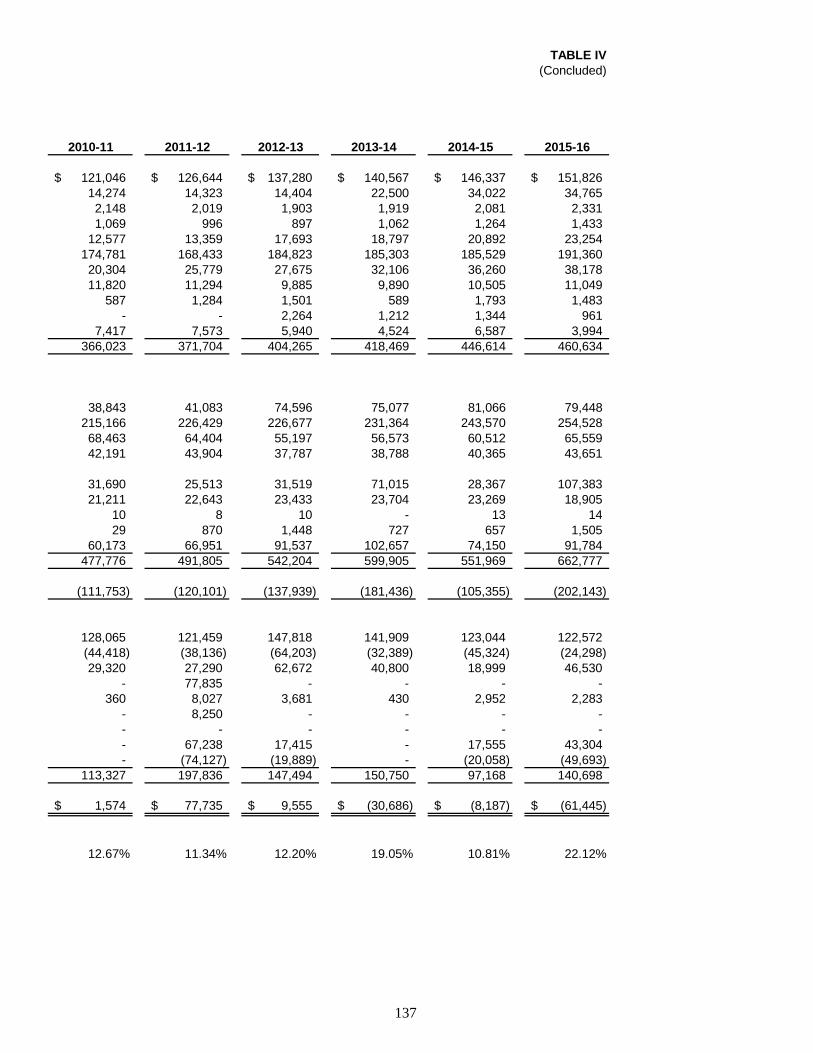
137
TABLE IV(Concluded)
2010-11 2011-12 2012-13 2013-14 2014-15 2015-16
121,046$ 126,644$ 137,280$ 140,567$ 146,337$ 151,826$ 14,274 14,323 14,404 22,500 34,022 34,765 2,148 2,019 1,903 1,919 2,081 2,331 1,069 996 897 1,062 1,264 1,433
12,577 13,359 17,693 18,797 20,892 23,254 174,781 168,433 184,823 185,303 185,529 191,360 20,304 25,779 27,675 32,106 36,260 38,178 11,820 11,294 9,885 9,890 10,505 11,049
587 1,284 1,501 589 1,793 1,483 - - 2,264 1,212 1,344 961
7,417 7,573 5,940 4,524 6,587 3,994 366,023 371,704 404,265 418,469 446,614 460,634
38,843 41,083 74,596 75,077 81,066 79,448 215,166 226,429 226,677 231,364 243,570 254,528 68,463 64,404 55,197 56,573 60,512 65,559 42,191 43,904 37,787 38,788 40,365 43,651
31,690 25,513 31,519 71,015 28,367 107,383 21,211 22,643 23,433 23,704 23,269 18,905
10 8 10 - 13 14 29 870 1,448 727 657 1,505
60,173 66,951 91,537 102,657 74,150 91,784 477,776 491,805 542,204 599,905 551,969 662,777
(111,753) (120,101) (137,939) (181,436) (105,355) (202,143)
128,065 121,459 147,818 141,909 123,044 122,572 (44,418) (38,136) (64,203) (32,389) (45,324) (24,298) 29,320 27,290 62,672 40,800 18,999 46,530
- 77,835 - - - - 360 8,027 3,681 430 2,952 2,283
- 8,250 - - - - - - - - - - - 67,238 17,415 - 17,555 43,304 - (74,127) (19,889) - (20,058) (49,693)
113,327 197,836 147,494 150,750 97,168 140,698
1,574$ 77,735$ 9,555$ (30,686)$ (8,187)$ (61,445)$
12.67% 11.34% 12.20% 19.05% 10.81% 22.12%

138
CITY OF MESA, ARIZONATABLE VSALES TAX COLLECTIONS BY CATEGORYLAST TEN FISCAL YEARS(in thousands)
2006-07 (1) 2007-08 2008-09 2009-10 2010-11 2011-12
Utilities 9,116$ 9,668$ 9,654$ 9,757$ 11,104$ 11,878$ Communications 3,939 4,312 3,749 3,809 4,456 4,483 Publishing 1,963 1,923 1,402 1,102 999 934 Printing & Advertising 478 375 280 175 342 336 Contracting 21,424 19,301 15,263 10,913 8,388 9,962 Retail Sales 85,015 77,308 63,230 63,469 60,266 62,191 Restaurants & Bars 11,726 12,039 10,956 10,948 11,165 11,864 Amusements 1,457 1,349 1,363 1,176 1,433 1,434 Rentals 20,534 21,369 20,514 20,123 22,219 22,968 Miscellaneous 165 119 107 84 674 595
Total 155,817$ 147,763$ 126,518$ 121,555$ 121,046$ 126,645$
City Direct Tax Rate 1.75% 1.75% 1.75% 1.75% 1.75% 1.75%
Note: Amounts shown include penalties and interest. Occupancy tax not included.
(1) During FY 2006-07, 1/4 percent of the 1/2 percent voter-approved sales tax increase that was enacted in August 1998 to fund capital improvements to quality of life projects expired and was not renewed. Also during FY 2006-07, a voter-approved 1/2 percent increase to sales tax was enacted and is restricted to fund street improvements.
Source: City of Mesa Tax & Licensing Division

139
TABLE V(Concluded)
2012-13 2013-14 2014-15 2015-16
12,549$ 12,344$ 13,111$ 13,251$ 4,651 4,230 4,796 4,229
866 830 747 688 434 455 461 428
12,402 13,794 14,103 14,623 66,789 69,276 71,996 76,160 12,577 12,972 13,708 14,240 1,432 1,469 1,542 1,561
24,847 24,374 25,102 25,578 732 823 771 1,068
137,279$ 140,567$ 146,337$ 151,826$
1.75% 1.75% 1.75% 1.75%

140
CITY OF MESA, ARIZONATABLE VIDIRECT AND OVERLAPPING SALES TAX RATESLAST TEN FISCAL YEARS
Fiscal Year
City Direct Rate
Maricopa County
State of Arizona
2006-07 1.75% 0.70% 5.60%2007-08 1.75% 0.70% 5.60%2008-09 1.75% 0.70% 5.60%2009-10 1.75% 0.70% 6.60% *2010-11 1.75% 0.70% 6.60%2011-12 1.75% 0.70% 6.60%2012-13 1.75% 0.70% 5.60%2013-14 1.75% 0.70% 5.60%2014-15 1.75% 0.70% 5.60%2015-16 1.75% 0.70% 5.60%
Source: City of Mesa Tax & Licensing Office*Note: The State of Arizona increased its tax to 6.60% effective 6/1/10 for a 3 year period


141
CITY OF MESA, ARIZONATABLE VIIRATIOS OF OUTSTANDING DEBT BY TYPELAST TEN FISCAL YEARS(in thousands)
2006-07 2007-08 2008-09 2009-10Governmental Activities
General Obligation Bonds 223,115$ 221,625$ 267,063$ 273,869$ Municipal Development Corporation Bonds 9,970 9,970 - - Highway User Revenue Bonds 142,460 142,290 140,265 134,545 Special Assessment Bonds 8,798 8,046 7,294 6,550 Community Facilities District - - - - Capital Leases 22,989 17,503 9,730 5,406 Notes Payable - - - 45,000
Business-type ActivitiesUtility System Revenue Bonds 723,185 767,445 817,530 857,435 General Obligation Bonds 3,290 3,290 2,957 2,691 Excise Tax Revenue Obligation Bonds - - - - Municipal Development Corporation Bonds 5,100 - - - Notes Payable 589 432 333 2,964 Capital Leases 2,869 1,541 158 -
Total Primary Government 1,142,365$ 1,172,142$ 1,245,330$ 1,328,460$
Percentage of Personal Income (1) 10.54% 10.68% 11.03% 11.49%
Per Capita (1) 2,483$ 2,529$ 2,677$ 2,843$
(1) Information on personal income and population is presented on Table XII.
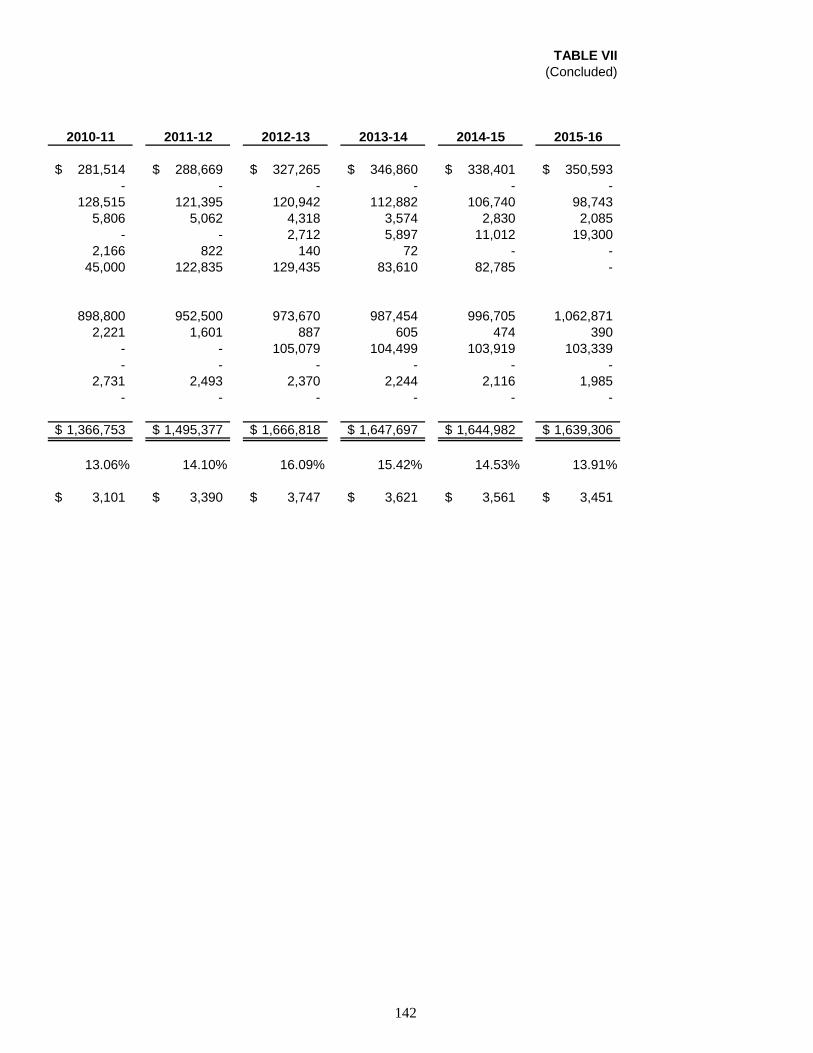
142
TABLE VII(Concluded)
2010-11 2011-12 2012-13 2013-14 2014-15 2015-16
281,514$ 288,669$ 327,265$ 346,860$ 338,401$ 350,593$ - - - - - -
128,515 121,395 120,942 112,882 106,740 98,743 5,806 5,062 4,318 3,574 2,830 2,085
- - 2,712 5,897 11,012 19,300 2,166 822 140 72 - -
45,000 122,835 129,435 83,610 82,785 -
898,800 952,500 973,670 987,454 996,705 1,062,871 2,221 1,601 887 605 474 390
- - 105,079 104,499 103,919 103,339 - - - - - -
2,731 2,493 2,370 2,244 2,116 1,985 - - - - - -
1,366,753$ 1,495,377$ 1,666,818$ 1,647,697$ 1,644,982$ 1,639,306$
13.06% 14.10% 16.09% 15.42% 14.53% 13.91%
3,101$ 3,390$ 3,747$ 3,621$ 3,561$ 3,451$

143
Less:Amounts Percentage Available of
Secondary General in Debt SecondaryAssessed Obligation Service Assessed Per
Year Value (1) Bonds Fund Total Value Capita (2)
2007 3,083,070$ 226,405$ -$ 226,405$ 7.34% 492$ 2008 4,114,527 224,915 - 224,915 5.47% 486 2009 4,793,082 259,895 - 259,895 5.42% 559 2010 4,749,617 276,560 - 276,560 5.82% 592 2011 4,094,037 283,735 134 283,601 6.93% 645 2012 3,164,277 290,270 1 290,269 9.17% 658 2013 2,770,422 328,152 138 328,014 11.84% 739 2014 2,559,634 347,465 372 347,093 13.56% 765 2015 2,821,173 338,875 3,584 335,291 11.88% 726 2016 2,757,913 350,983 2,618 348,365 12.63% 733
(1) Maricopa County Finance Department Assessor's Office.(2) Population figures are found on Table XII.
Source:
CITY OF MESA, ARIZONATABLE VIIIRATIOS OF GENERAL BONDED DEBT OUTSTANDINGLAST TEN FISCAL YEARS(in thousands)
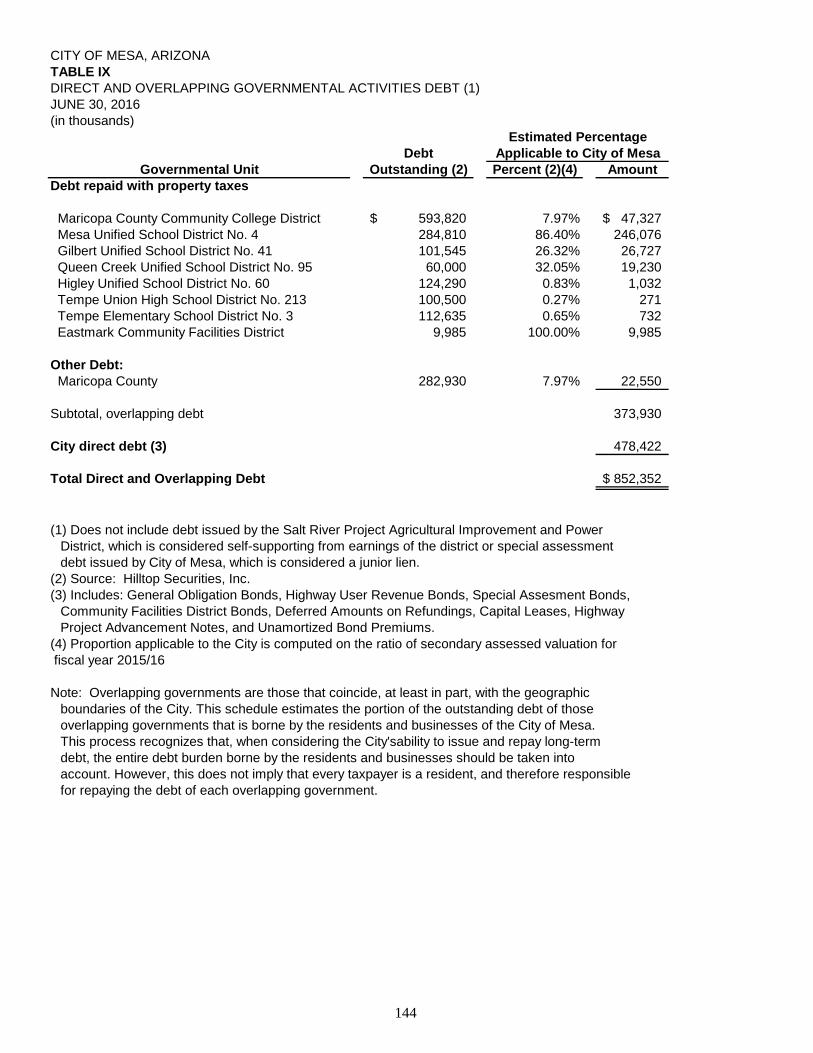
144
CITY OF MESA, ARIZONATABLE IXDIRECT AND OVERLAPPING GOVERNMENTAL ACTIVITIES DEBT (1)JUNE 30, 2016(in thousands)
DebtGovernmental Unit Outstanding (2) Percent (2)(4) Amount
Debt repaid with property taxes
Maricopa County Community College District 593,820$ 7.97% 47,327$ Mesa Unified School District No. 4 284,810 86.40% 246,076 Gilbert Unified School District No. 41 101,545 26.32% 26,727 Queen Creek Unified School District No. 95 60,000 32.05% 19,230 Higley Unified School District No. 60 124,290 0.83% 1,032 Tempe Union High School District No. 213 100,500 0.27% 271 Tempe Elementary School District No. 3 112,635 0.65% 732 Eastmark Community Facilities District 9,985 100.00% 9,985
Other Debt: Maricopa County 282,930 7.97% 22,550
Subtotal, overlapping debt 373,930
City direct debt (3) 478,422
Total Direct and Overlapping Debt 852,352$
(1) Does not include debt issued by the Salt River Project Agricultural Improvement and PowerDistrict, which is considered self-supporting from earnings of the district or special assessmentdebt issued by City of Mesa, which is considered a junior lien.
(2) Source: Hilltop Securities, Inc.(3) Includes: General Obligation Bonds, Highway User Revenue Bonds, Special Assesment Bonds,
Community Facilities District Bonds, Deferred Amounts on Refundings, Capital Leases, HighwayProject Advancement Notes, and Unamortized Bond Premiums.
(4) Proportion applicable to the City is computed on the ratio of secondary assessed valuation for fiscal year 2015/16
Note: Overlapping governments are those that coincide, at least in part, with the geographicboundaries of the City. This schedule estimates the portion of the outstanding debt of thoseoverlapping governments that is borne by the residents and businesses of the City of Mesa.This process recognizes that, when considering the City'sability to issue and repay long-termdebt, the entire debt burden borne by the residents and businesses should be taken intoaccount. However, this does not imply that every taxpayer is a resident, and therefore responsiblefor repaying the debt of each overlapping government.
Applicable to City of MesaEstimated Percentage

145
CITY OF MESA, ARIZONATABLE XLEGAL DEBT MARGIN INFORMATIONLAST TEN FISCAL YEARS(in thousands)
2006-07 2007-08 2008-09 2009-10 2010-116% LimitationLegal Debt Limitation Equal to
6% of Assessed Valuation 184,984$ 246,872$ 287,585$ 284,977$ 245,642$
Total Net Debt Applicable to 6% Limit 22,453 17,688 13,569 6,064 5,326
Margin Available for FutureGeneral Obligation Bond Issuesfor 6% Bonds 162,531$ 229,184$ 274,016$ 278,913$ 240,316$
Total Net Debt Applicable to the6% Limit as a Percentage of the 6% Legal Debt Limitation 12.14% 7.16% 4.72% 2.13% 2.17%
20% LimitationLegal Debt Limitation Equal to
20% of Assessed Valuation 616,614$ 922,905$ 958,616$ 949,923$ 818,807$
Total Net Debt Applicable to 20% Limit 203,952 207,227 246,326 270,496 278,409
Margin Available for FutureGeneral Obligation Bond Issuesfor 20% Bonds 412,662$ 715,678$ 712,290$ 679,427$ 540,398$
Total Net Debt Applicable to the20% Limit as a Percentage of the 20% Legal Debt Limitation 33.08% 22.45% 25.70% 28.48% 34.00%
Total Margin Available 575,193$ 944,862$ 986,306$ 958,340$ 780,714$
(1) Under Arizona law, cities can issue General Obligation Bonds for all purposes other than thoselisted in Note 2 below, up to an amount not exceeding 6 percent of assessed secondary valuation.
(2) Under Arizona law, cities can issue General Obligation Bonds for purposes of water, wastewater,artificial light, open space preserves, parks playgrounds and recreational facilities up to an amountnot exceeding 20 percent of assessed secondary valuation.
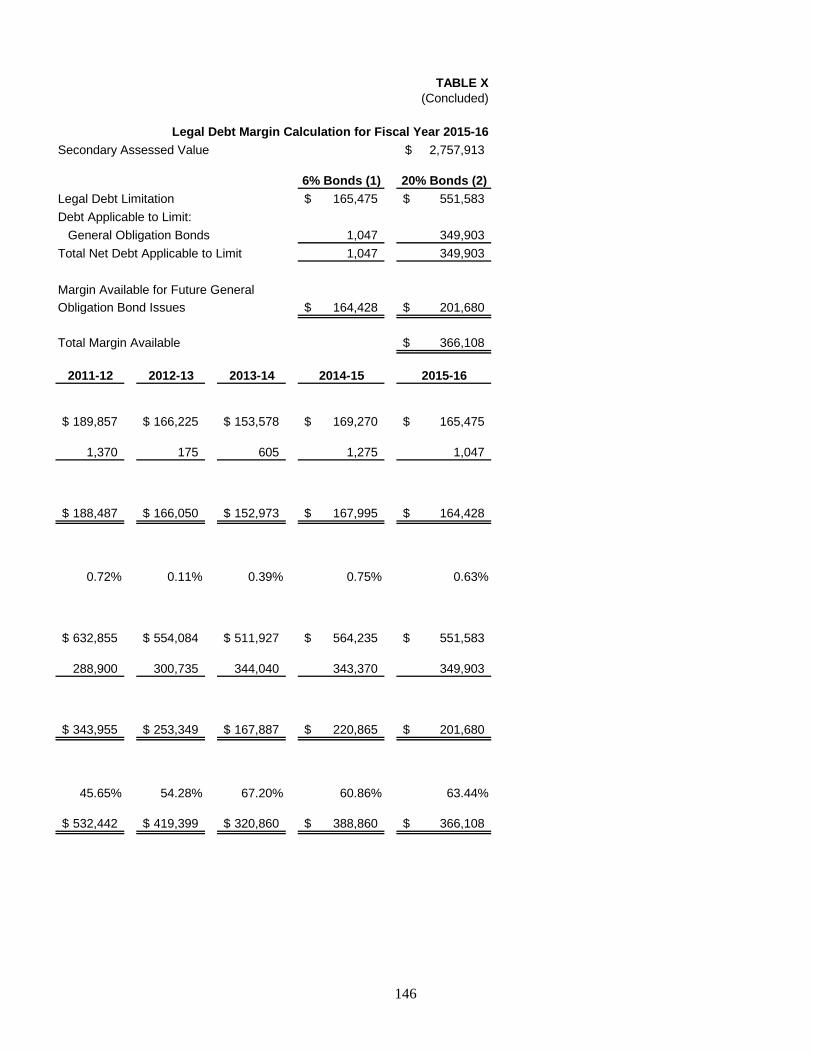
146
TABLE X(Concluded)
Legal Debt Margin Calculation for Fiscal Year 2015-16Secondary Assessed Value 2,757,913$
6% Bonds (1) 20% Bonds (2)Legal Debt Limitation 165,475$ 551,583$ Debt Applicable to Limit:
General Obligation Bonds 1,047 349,903 Total Net Debt Applicable to Limit 1,047 349,903
Margin Available for Future General Obligation Bond Issues 164,428$ 201,680$
Total Margin Available 366,108$
2011-12 2012-13 2013-14 2014-15 2015-16
189,857$ 166,225$ 153,578$ 169,270$ 165,475$
1,370 175 605 1,275 1,047
188,487$ 166,050$ 152,973$ 167,995$ 164,428$
0.72% 0.11% 0.39% 0.75% 0.63%
632,855$ 554,084$ 511,927$ 564,235$ 551,583$
288,900 300,735 344,040 343,370 349,903
343,955$ 253,349$ 167,887$ 220,865$ 201,680$
45.65% 54.28% 67.20% 60.86% 63.44%
532,442$ 419,399$ 320,860$ 388,860$ 366,108$

147
Net RevenueAvailable
Operating Operating for Debt CoverageRevenues (1) Expenses Service Principal Interest Ratio
2006-07 270,070$ 175,942$ 94,128$ 340$ 29,305$ 3.18 2007-08 278,366 196,130 82,236 7,960 34,658 1.93 2008-09 274,497 197,992 76,505 9,815 37,225 1.63 2009-10 275,193 194,159 81,034 10,475 40,380 1.59 2010-11 283,921 190,441 93,480 12,585 42,814 1.69 2011-12 299,356 180,296 119,060 21,365 43,465 1.84 2012-13 293,915 241,128 52,787 21,630 46,412 0.78 2013-14 295,710 203,187 92,523 22,550 51,927 1.24 2014-15 311,506 209,677 101,829 21,860 46,423 1.49 2015-16 323,099 218,706 104,393 25,800 44,794 1.48
HighwayUser Fund CoverageRevenues Principal Interest Ratio
2006-07 40,975$ 135$ 6,401$ 6.27 2007-08 38,512 170 6,828 5.50 2008-09 34,260 2,025 6,823 3.87 2009-10 31,791 5,720 6,691 2.56 2010-11 32,053 6,030 6,365 2.59 2011-12 27,825 3,290 5,563 3.14 2012-13 30,046 6,145 5,627 2.55 2013-14 30,923 6,945 5,472 2.49 2014-15 33,952 6,305 5,158 2.96 2015-16 35,383 7,390 4,844 2.89
(1) Includes electric, gas, water, wastewater and solid waste systems.(2) Excise tax revenues include city use and sales taxes, unrestricted license, fees and permits, fines and forfeitures, state-shared sales tax, state revenue sharing, and state shared vehicle license tax.
CITY OF MESA, ARIZONATABLE XIPLEDGED-REVENUE COVERAGELAST TEN FISCAL YEARS(in thousands)
Note: Details regarding the City's outstanding debt can be found in the notes to the financial statements.
Utility System Revenue Bonds
Highway User Revenue Fund Revenue Bonds
Debt Service
Debt Service

148
Special CommunityAssessment Coverage Facility District CoverageCollections Principal Interest Ratio Collections Principal Interest Ratio
851$ 343$ 357$ 1.21 -$ -$ -$ - 1,710 752 457 1.41 - - - - 1,202 752 417 1.03 - - - -
923 744 377 0.82 - - - - 1,088 744 337 1.01 - - - -
996 744 297 0.96 - - - - 897 744 257 0.90 - - 7 - 861 744 217 0.90 195 65 131 0.99 827 744 178 0.90 672 232 456 0.98 790 745 138 0.89 1,320 489 832 1.00
Excise ExciseTax Coverage Tax Coverage
Revenues (2) Principal Interest Ratio Revenues (2) Principal Interest Ratio
216,897$ 4,500$ 309$ 45$ -$ -$ -$ - 226,910 5,100 108 44 - - - - 203,198 9,970 17 20 - - - -
- - - - 208,547 - 449 464.30 - - - - 200,873 - 1,576 127.48 - - - - 199,949 - 4,312 46.37 - - - - 213,309 - 5,404 39.47 - - - - 221,355 - 4,790 46.21 - - - - 234,183 - 3,892 60.17 - - - - 242,020 77,835 324 3.10
TABLE XI (Concluded)
Debt ServiceDebt Service
Special Assessment Bonds Community Facility District Bonds
Debt Service Debt Service
Municipal Development Corporation Bonds Highway Project Advancement Notes

149
Personal Per CapitaIncome Personal Median Public School Unemployment
Year Population (1) (in thousands) Income (1) Age (1) Enrollment (2) Rate (3)
2007 460,155 10,840,792$ 23,559$ 32.9 74,128 2.9%2008 463,397 10,977,412 23,689 33.1 73,054 4.3%2009 465,272 11,288,895 24,263 33.3 70,297 8.0%2010 467,355 11,563,297 24,742 33.6 67,749 8.7%2011 440,677 10,465,197 23,748 32.6 66,144 9.0%2012 441,160 10,603,281 24,035 34.3 65,662 7.5%2013 444,856 10,361,141 23,291 34.4 64,892 7.2%2014 454,981 10,687,959 23,491 35.3 64,932 6.5%2015 462,376 11,321,276 24,485 35.5 64,532 5.4%2016 475,274 11,783,944 24,794 35.7 65,049 5.3%
Sources:(1)(2)(3)
in 2011 unemployment rate is not seasonally adjusted.
CITY OF MESA, ARIZONATABLE XIIDEMOGRAPHIC AND ECONOMIC STATISTICSLAST TEN FISCAL YEARS
2007-2010 Claritas, 2011-2013 SitesUSA, 2014-2016 ESRI Community AnalystArizona Department of Education AZ Dept of Economic Security. Data is Phoenix-Mesa-Scottsdale Metropolitan Area. Beginning

150
Employer Employees Rank
Percentage of Total City Employment Employees Rank
Percentage of Total City Employment
Banner Health Systems 9,573 1 6.11% 6,600 2 3.43%Mesa Public Schools 8,435 2 5.39% 10,000 1 5.19%Boeing 4,700 3 3.00% 4,600 3 2.39%City of Mesa 3,798 4 2.43% 3,851 4 2.00%Wal-Mart 2,541 5 1.62% 2,280 5 1.18%Gilbert Unified School District 1,229 6 0.78% - 0.00%Fry's Food Stores 1,128 7 0.72% 1,000 8 0.52%Drivetime Automotive Group 990 8 0.63% - 0.00%County of Maricopa 986 9 0.63% 1,300 6 0.67%Santander Consumer
Holdings USA 970 10 0.62% - 0.00%Home Depot - 0.00% 750 10 0.39%Empire Southwest Machinery - 0.00% 1,025 7 0.53%Bashas' - 0.00% 1,000 8 0.52%
Total 34,350 21.93% 32,406 16.83%
Source: City of Mesa Office of Economic Development
2016 2007
CITY OF MESA, ARIZONATABLE XIIIPRINCIPAL EMPLOYERSCURRENT YEAR AND NINE YEARS AGO

151
CITY OF MESA, ARIZONATABLE XIVFULL-TIME EQUIVALENT CITY GOVERNMENT EMPLOYEES BY FUNCTION/PROGRAMLAST TEN FISCAL YEARS
2006-07 2007-08 2008-09 2009-10Function/Program
General Government 979 966 838 835 Police 1,332 1,306 1,282 1,240 Fire 468 472 470 455 Community Environment 183 181 189 184 Cultural-Recreational 445 417 335 329 Energy Resources 125 132 140 122 Water Resources 177 166 213 232 Environmental Management & Sustainability 132 136 126 124 Airport 10 9 10 10
Total 3,851 3,785 3,603 3,531
Source: City of Mesa Office of Management and Budget and Human Resources

152
TABLE XIV(Concluded)
2010-11 2011-12 2012-13 2013-14 2014-15 2015-16
824 870 864 880 876 860 1,163 1,158 1,163 1,173 1,154 1,155
457 473 479 482 503 492 189 184 183 178 182 189 334 332 313 317 338 599 116 115 117 117 116 116 230 233 229 238 240 238 120 117 127 125 127 138
9 9 10 10 10 11
3,442 3,491 3,485 3,520 3,545 3,798
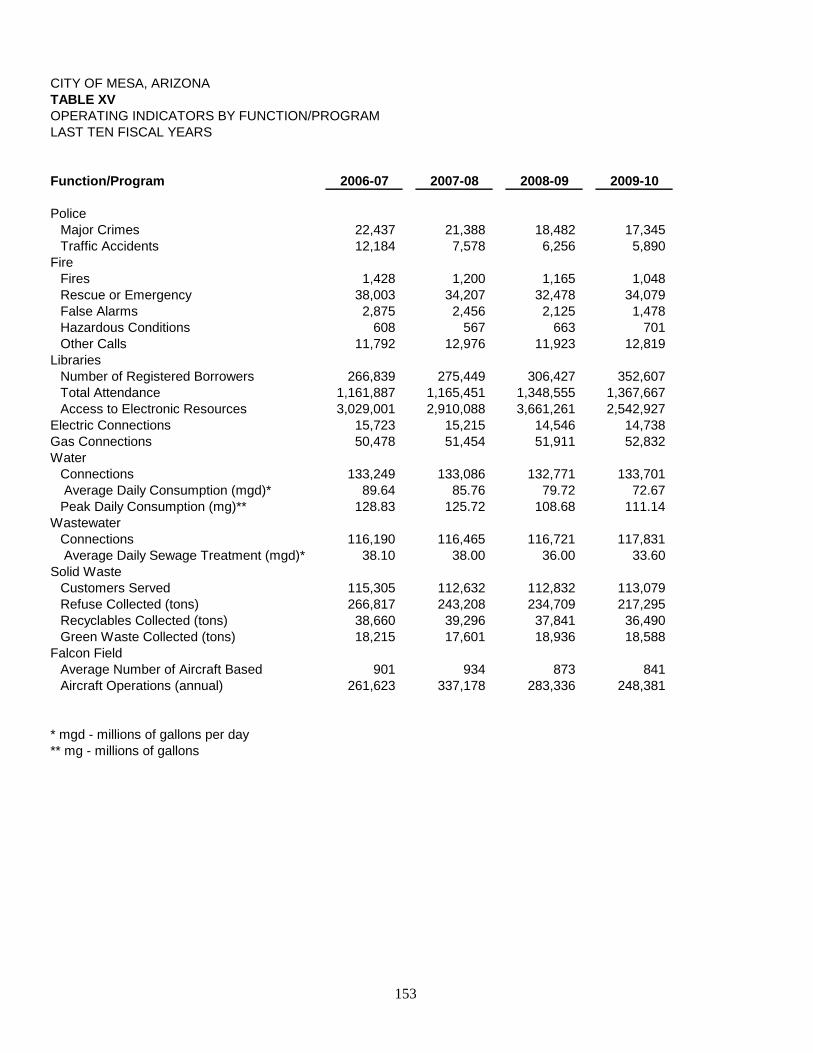
153
CITY OF MESA, ARIZONATABLE XVOPERATING INDICATORS BY FUNCTION/PROGRAMLAST TEN FISCAL YEARS
Function/Program 2006-07 2007-08 2008-09 2009-10
Police Major Crimes 22,437 21,388 18,482 17,345 Traffic Accidents 12,184 7,578 6,256 5,890
Fire Fires 1,428 1,200 1,165 1,048 Rescue or Emergency 38,003 34,207 32,478 34,079 False Alarms 2,875 2,456 2,125 1,478 Hazardous Conditions 608 567 663 701 Other Calls 11,792 12,976 11,923 12,819
LibrariesNumber of Registered Borrowers 266,839 275,449 306,427 352,607 Total Attendance 1,161,887 1,165,451 1,348,555 1,367,667 Access to Electronic Resources 3,029,001 2,910,088 3,661,261 2,542,927
Electric Connections 15,723 15,215 14,546 14,738 Gas Connections 50,478 51,454 51,911 52,832 Water
Connections 133,249 133,086 132,771 133,701 Average Daily Consumption (mgd)* 89.64 85.76 79.72 72.67 Peak Daily Consumption (mg)** 128.83 125.72 108.68 111.14
WastewaterConnections 116,190 116,465 116,721 117,831 Average Daily Sewage Treatment (mgd)* 38.10 38.00 36.00 33.60
Solid WasteCustomers Served 115,305 112,632 112,832 113,079 Refuse Collected (tons) 266,817 243,208 234,709 217,295 Recyclables Collected (tons) 38,660 39,296 37,841 36,490 Green Waste Collected (tons) 18,215 17,601 18,936 18,588
Falcon FieldAverage Number of Aircraft Based 901 934 873 841 Aircraft Operations (annual) 261,623 337,178 283,336 248,381
* mgd - millions of gallons per day** mg - millions of gallons

154
TABLE XV(Concluded)
2010-11 2011-12 2012-13 2013-14 2014-15 2015-16
16,623 16,740 16,149 14,561 14,795 13,208 5,952 6,047 6,186 6,107 6,622 6,968
981 1,012 929 1,075 1,083 1,053 38,788 42,925 43,416 44,885 45,832 49,743 1,478 1,292 1,255 1,176 1,106 1,083
478 446 454 477 534 507 11,840 11,192 11,803 9,403 8,964 10,613
220,812 142,943 166,492 196,020 125,336 122,810 1,095,196 1,143,718 1,178,137 1,166,560 1,166,131 1,157,394 1,691,966 1,566,775 1,515,299 1,541,323 1,549,150 1,345,977
15,064 15,841 13,815 16,460 16,703 16,854 53,434 55,828 55,544 58,011 59,214 60,383
134,072 135,138 136,640 137,910 139,560 141,824 76.23 81.60 81.03 80.85 79.55 78.55
114.30 122.30 115.68 117.13 113.45 116.62
118,413 119,615 120,953 122,623 124,142 126,359 33.70 33.40 33.60 33.10 33.30 34.60
115,811 118,949 119,142 121,674 122,552 127,517 223,217 209,116 215,463 217,745 233,754 236,849 35,486 34,443 34,616 34,629 35,541 35,499 19,149 17,882 19,878 18,854 21,151 20,602
789 749 700 729 702 663 221,910 222,650 190,605 276,731 241,848 270,702

155
CITY OF MESA, ARIZONATABLE XVICAPITAL ASSET STATISTICS BY FUNCTION/PROGRAMLAST TEN FISCAL YEARS
Function/Program 2006-07 2007-08 2008-09 2009-10
Police Stations Stations 4 4 4 4 Vehicular Patrol Units 351 368 330 289
Fire Stations 17 17 17 18 Libraries 3 3 3 3 Parks and Recreation
Developed Parks (acres) 1,184 1,180 1,180 1,154 Undeveloped Acres 1,251 1,251 1,251 1,078 Swimming Pools 12 12 12 12 Recreation Facilities 6 6 6 6
Community EnvironmentStreets (miles)
Paved 1,169 1,178 1,182 1,184 Unpaved 12 12 12 12
Storm Sewers (miles) 303 308 316 321 Gas Mains (miles) 1,147 1,202 1,223 1,243 Water
Mains (miles) 2,008 2,068 2,104 2,127 Storage Capacity (millions of gallons) 117 117 125 125
WastewaterMains (miles) 1,544 1,577 1,598 1,606 Treatment Capacity (millions of gallons per day) 60 60 60 60
Solid WasteCollection Trucks 68 70 69 69
Golf Courses 2 2 2 2

156
TABLE XVI(Concluded)
2010-11 2011-12 2012-13 2013-14 2014-15 2015-16
4 5 6 8 8 8 290 267 267 291 292 287 18 19 20 20 20 20 4 4 4 4 4 4
1,154 1,553 1,177 1,232 1,901 1,901 1,074 705 1,104 1,157 633 633
13 9 9 9 9 9 6 6 6 4 4 4
1,190 1,303 1,307 1,418 1,427 1,427 12 1 1 1 1 1
329 438 432 440 423 423 1,247 1,240 1,256 1,256 1,311 1,311
2,136 2,270 2,284 2,315 2,364 2,364 125 125 125 125 112 112
1,613 1,652 1,677 1,677 1,781 1,781 60 60 60 60 60 60
69 70 72 72 74 73 2 1 1 1 1 1


Financial Services DepartmentP.O. Box 1466 Mesa, Arizona, 85211-1466(480) 644-2275 www.mesaaz.gov