city of mequon
TRANSCRIPT
City of Mequon East Growth Corridor Market Study Prepared for the City of Mequon, Wisconsin September, 2013 Prepared by: Vierbicher


Table of Contents Chapter Title Page
Executive Summary i
1 Project Overview 1 Study Area and Assumptions
2 Demographic and Land Use Profile 6 Population and Demographic Trends Employment Dynamics Land Use Assessment Infrastructure and Transportation Assessment Growth Projections Competitive Position
3 Retail Market Analysis 18 Trade Area Delineation Supply and Demand Gap Analysis Competitive Position
4 Office and Industrial Market Analysis 24 Market Statistics Competitive Position
5 Residential Market Analysis 28 Residential Development Trends Apartment Vacancy, Rent and Absorption Trends
Competitive Position
6 Corridor Development Planning 32 Potential Development Uses
Projecting Future Market Demand
7 Future Development Planning 40 Land Use and Infrastructure Planning Development Timing and Phasing Potential Obstacles and Recommended Strategies
A. Appendix 54 Retail Supply and Demand Gap Report Initial Concept Scenarios Weighted Valuation Matrix

Maps: 0.1 Future Development Concept vii
1.0 Milwaukee Metropolitan Statistical Area 1 1.1 Mequon Location 1 1.2 Study Area and Landmarks 3 2.0 Improvement to Land Value for Mequon 9 2.1 Improvement to Land Value for Study Area 10 2.2 Known Brownfield Sites 11 2.3 Floodplain 13 2.4 Existing Infrastructure 15 3.0 Primary and Secondary Trade Areas 19 3.1 Trade Area Overlap 20 6.0 Location and Buildable Acreage of Likely Development Sites 35 7.0 Anticipated Development Timing Within Study Area 45
Tables: 0.1 Mequon Competitive Position i
1.0 Current Zoning/Land Use 1 2.0 Population by Age Group 6 2.1 Employment by Industry 7 2.2 Projected Occupational Growth 8 2.3 Known Remediation Sites 11 3.0 Supportable Local Retail Sectors 21 5.0 Single Family Development 28 5.1 Mequon Apartment Statistics 29 5.2 Fastest Growing Occupations, Wages and Residential Affordability 30 6.0 Competitive Position of Study Area by Use 32 6.1 Average Size and Acreage Required by Development Type 33 6.2 Historic Absorption Trends 37 6.3 Total Acreages Supported by Use 38 7.0 Anticipated Study Area Market Share by Property Type 43 7.1 Corridor Planning Next Steps 52
Charts: 0.1 Pace of Study Area Development iv
2.0 Historic Population Trends 6 2.1 Total Mequon Employment 7 2.2 Workforce Labor Shed 7 2.3 Large Development Site Pricing Comparison 17 3.0 Second Quarter 2013 Retail Vacancy 22 3.1 Asking Retail Rent 22 4.0 Percent Change in Retail Rental Rates 24 4.1 Total Vacant Retail Square Feet 24 4.2 2Q13 Class A Office Vacancy 24 5.0 Single Family Home Building Trends 28
2013 Mequon East Growth Corridor Market Analysis i
Executive Summary The City of Mequon has established a reputation as an executive housing market, unique local shopping destination, and professional business location with access to a skilled workforce. Mequon is familiar to visitors as the home of Concordia University of Wisconsin and as an Interstate exit for visitors to Lake Michigan parks and downtown Cedarburg. Although the study area (see map on page vi) has remained relatively undeveloped, there is significant potential for additional uses in the corridor over the next two decades. The presence of significant and growing vehicular traffic, large development sites and convenient regional access provide opportunities for future growth. Development has been delayed due to limited infrastructure and the presence of 5-acre residential zoning throughout the study area. Ongoing regional growth pressures and limited land availability along the Interstate have resulted in the expansion of non-sewered development uses such as churches and landscape businesses within the study area. Although these uses take advantage of current development opportunities, they limit future higher value growth within the corridor by subdividing larger tracts of land and diminishing the potential payback from future infrastructure extension. This study examines the local market potential for commercial and residential growth in the City and study area and provides recommendations for Mequon which will help support and encourage desired development patterns within the community. Competitive Position Summary The table on the following two pages contains demographic, economic and market indicators which compare Mequon’s local market with the larger Milwaukee Metropolitan Statistical Area (MSA). The percentage of the local economy represented by Mequon is referred to as its Market Share. The extent to which specific industries, populations or economic generators are present or absent in the local economy provides a high-level picture of local economic conditions. Five-year projections in key measures are indicated in the right hand column, where available. These projections provide a mechanism to compare Mequon’s economic trends with the greater metropolitan region. Table 0.1: Mequon Competitive Position
Indicator Mequon Milwaukee MSA (7 County)
Mequon Market Share
Mequon Trend/
Projection
Milwaukee MSA Trend/ Projection
General Indicators 2018 Projection
Population1 23,221 1,810,364 1.3% 0.68% 2.2%
Households1 8,675 676,107 1.3% 0.74% 1.4%
Youth Population1 (0-14)
4,692 404,677 1.2% -0.8% 0.03%
Senior Population1 (65+) 4,284 226,471 1.9% 11.0% 18.2%
New Single Family Housing Permits2 (2002-2012)
643 19,560 3.3% - -
New Multi Family Units Added3 (2000-2010)
62 13,270 0.5% - -

2013 Mequon East Growth Corridor Market Analysis ii
Footnotes & Comments: Mequon & Thiensville combined for all indicators excluding population, household, age and income. The two markets are indistinguishable at the commercial level.
1) Source: US Census, ESRI, SEWRPC 2) Source: MBA, City of Mequon 3) Source: City of Mequon, Colliers International, US Census (Metro Data for Census 4-County Metro) 4) Source: ESRI, GIS Planning 5) Source: ESRI, Historic Data Melinaphy 6) Source: Wisconsin DOT (average of all full interchange cross streets in MSA) 7) Source: REIS 8) Source: Community and Economic Statistics 9) Source: Jones Lang LaSalle 10) Source: Economic Census, EMSI, SEWRPC (Metro Forecast for 4 County WDA) 11) Source: Loopnet, Vierbicher
Table 0.1 Continued: Mequon Competitive Position
Indicator Mequon Milwaukee MSA (7 County)
Mequon Market Share
Mequon Trend/
Projection
Milwaukee MSA Trend/ Projection
Retail Indicators 2018 Projection
Median HH Income4 $88,515 $52,007 Above Market 2.55% 0.6%
Retail Sales Per Capita5 $8,670 $11,965 Below Market - -
Traffic Counts on Major Cross Street at Interstate Interchange (VPD)6
Mequon Rd: 34,000
Pioneer Rd: 8,600
Avg. I-94: 11,292 Avg. I-43N:
18,375 Avg. USH45:
26,060
- - -
Retail Asking Rent7 ($/SF NNN, Nonanchor) $16.00 $15.44 Above
Market - -
Office & Industrial Indicators 2018 Projection
Private Non-farm Companies8 1,458 49,954 2.9% - -
Daytime Employment8 18,990 939,223 2.0% 10.9% 8.3%
Office Square Footage & Vacancy9
938,100 24.6%
27,641,272 19.8% 3.4% - -
Office Asking Rents9 ($/SF NNN, Class A) $13.00 $19.85 Below
Market - -
Professional & Technical Employment10
3,982 164,741 2.4% 15.3% 8.2%
Manufacturing Employment10 2,851 200,618 1.4% 2.6% 5.4%
Warehouse Asking Rents11 ($/SF NNN, Class A)
$4.50 $4.47 At Market - -
2013 Mequon East Growth Corridor Market Analysis iii
Population and Demographics Mequon’s residential population comprises 1.3 percent of the MSA’s residents. This is down from a peak of 1.5 percent in 2000, and is projected to continue to decline as overall population growth in the MSA accelerates in the central and western communities. A side effect of Mequon’s surge in growth during the 1990s is an overall older population in the community. The youth population percentage is smaller than the regional ratio and declining, while the percentage of older adults is higher than average for the region and growing (the MSA is poised for a surge in aging residents as well). As evidenced by the strong single family permitting experienced in 2012, Mequon remains a desirable residential destination. The bulk of this new construction is focused on large lot executive homes and senior communities, which continues the existing demographic mix. In order to retain a greater share of younger residents, replace older housing stock, and attract younger families, a wider variety of residential options is needed. Mequon has not participated in the regional growth of the multi-family market, which is driven by increasing formation of new households, empty nester downsizing, and household relocation (including immigrants and relocating workers). Mequon’s 62 new multi-family units added during the past decade represent the construction of age-restricted adult communities. Additionally, there are 139 multifamily units which are permitted but not yet built in the City. Moving forward, single family demand is anticipated to come from several sectors. In addition to sustained demand for large lot executive home sites, the City will attract interest from additional sectors such as new employees, emerging young households and downsizing older households. Executive homes and new employee growth will create demand for traditional development models, while younger and older households pursuing homeownership traditionally favor smaller lots and/or homes with less upkeep. Currently, 40 percent of Mequon households under age 25 and over age 75 choose to rent versus own. Significant portions of relocating employees are also more likely to rent. To accommodate each of these groups, the City would need to add 69 new single family units per year and 132 multifamily units per year annually over the next two decades. Retail and Commerce Mequon’s median household income remains significantly above the average for the MSA. The City is projected to maintain this pattern over the next five years as many residents remain in peak earning years. Although the City’s high incomes and growing population are attractive to retailers, the increasing number of elderly households, especially those in full-service retirement communities, are a less attractive demographic than younger households whose incomes are likely to expand. Additionally, the retail marketplace has become much more competitive with the regional proliferation of big box and general merchandisers, rise of online sales, and shrinking market area for staple retailers. As a result, although retail space has continued to be added in the community, Mequon residents have far greater retail choice, and have increasingly opted to shop online and spend dollars outside of the community. More than any other land use, successful retail development is contingent on site specific factors such as visibility and access. At present, the section of Mequon Road near I-43 has the strongest traffic counts in the City with more than 34,000 vehicles per day. Small retailers will continue to be attracted to this interchange as northern commuting traffic continues to increase. Pressure to locate near this interchange could encourage redevelopment of properties in proximity to Mequon Road, pushing service or office uses further north along Port Washington, provided suitable space was available. The potential addition of an interchange at Highland Road, if it occurred within the next 20 years, could provide an additional high-traffic arterial adjacent to existing destination anchors; St. Mary’s Hospital and Concordia University of Wisconsin. The Pioneer Interchange, two miles north of Highland Road, has the potential to serve an entirely different regional market, accommodating larger scale entertainment, retail or hospitality uses not currently available in Mequon.
2013 Mequon East Growth Corridor Market Analysis iv
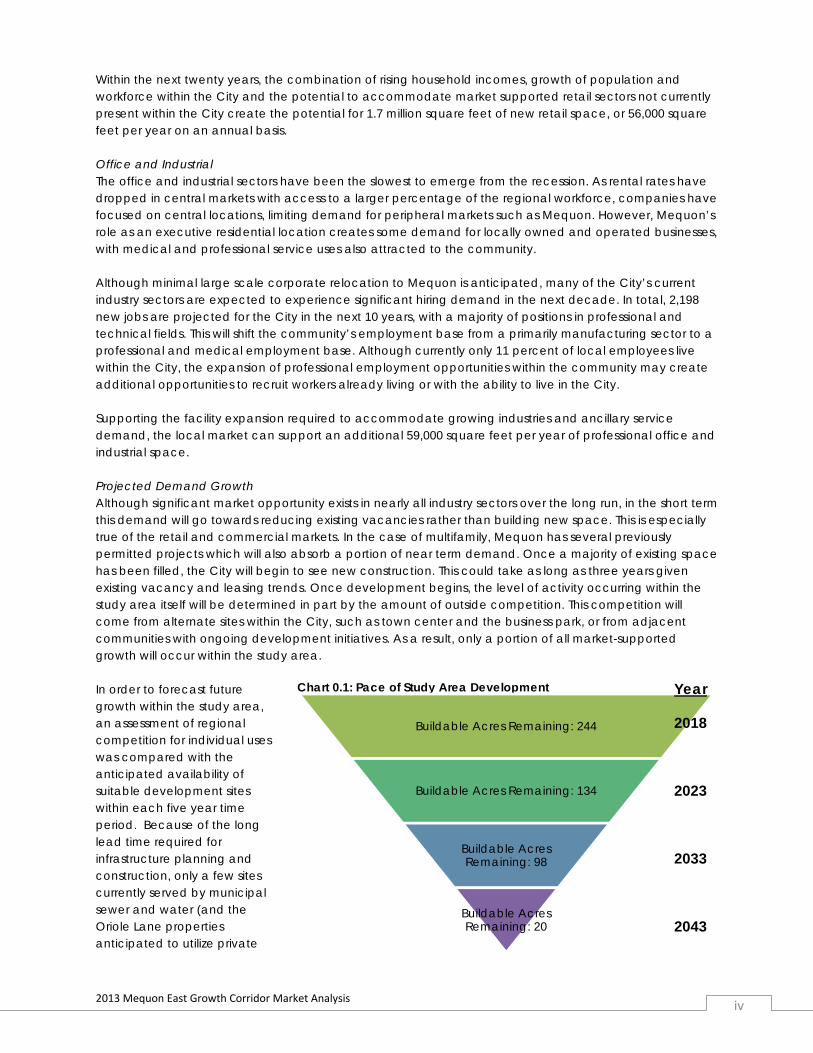
Within the next twenty years, the combination of rising household incomes, growth of population and workforce within the City and the potential to accommodate market supported retail sectors not currently present within the City create the potential for 1.7 million square feet of new retail space, or 56,000 square feet per year on an annual basis. Office and Industrial The office and industrial sectors have been the slowest to emerge from the recession. As rental rates have dropped in central markets with access to a larger percentage of the regional workforce, companies have focused on central locations, limiting demand for peripheral markets such as Mequon. However, Mequon’s role as an executive residential location creates some demand for locally owned and operated businesses, with medical and professional service uses also attracted to the community. Although minimal large scale corporate relocation to Mequon is anticipated, many of the City’s current industry sectors are expected to experience significant hiring demand in the next decade. In total, 2,198 new jobs are projected for the City in the next 10 years, with a majority of positions in professional and technical fields. This will shift the community’s employment base from a primarily manufacturing sector to a professional and medical employment base. Although currently only 11 percent of local employees live within the City, the expansion of professional employment opportunities within the community may create additional opportunities to recruit workers already living or with the ability to live in the City. Supporting the facility expansion required to accommodate growing industries and ancillary service demand, the local market can support an additional 59,000 square feet per year of professional office and industrial space. Projected Demand Growth Although significant market opportunity exists in nearly all industry sectors over the long run, in the short term this demand will go towards reducing existing vacancies rather than building new space. This is especially true of the retail and commercial markets. In the case of multifamily, Mequon has several previously permitted projects which will also absorb a portion of near term demand. Once a majority of existing space has been filled, the City will begin to see new construction. This could take as long as three years given existing vacancy and leasing trends. Once development begins, the level of activity occurring within the study area itself will be determined in part by the amount of outside competition. This competition will come from alternate sites within the City, such as town center and the business park, or from adjacent communities with ongoing development initiatives. As a result, only a portion of all market-supported growth will occur within the study area. In order to forecast future growth within the study area, an assessment of regional competition for individual uses was compared with the anticipated availability of suitable development sites within each five year time period. Because of the long lead time required for infrastructure planning and construction, only a few sites currently served by municipal sewer and water (and the Oriole Lane properties anticipated to utilize private
Chart 0.1: Pace of Study Area Development
Buildable Acres Remaining: 244
Buildable Acres Remaining: 134
Buildable Acres Remaining: 98
Buildable Acres Remaining: 20
Year
2018
2023
2033
2043

2013 Mequon East Growth Corridor Market Analysis v
systems) will be available for development in the next five years. This study assumes that infrastructure extension will occur prior to 2019, allowing for a greater range of development options within the study area in subsequent years. Chart 0.1 indicates the anticipated phasing of development within the study area under these assumptions. The anticipated time to full buildout is approximately 35 years. Future Development Planning Future development within the study area is constrained by the presence of significant wetland and environmental areas, which cover one-third percent of total land area. Additionally, several parcels include uses which represent greater investment in site improvements, are well utilized and unlikely to redevelop in the near future. These uses comprise one quarter of the buildable land area including Columbia St. Mary’s, Missing Links, churches and active businesses. Lastly, several smaller parcels include individually owned single family homes. Although these properties could be incorporated into larger developments, they are excluded from projections due to the limited ability to predict the timing of sales by private individuals with an emotional attachment to individual properties. The location of individual uses within the study area was determined through an assessment of parcel size, highway visibility, access to a regional customer base and proximity to natural areas or amenities. Land uses which can best utilize the unique assets offered at a particular site will pay the highest value for that particular location, making it the highest and best use of a site. Based on the results of this analysis and input from the Council, the development concept illustrated in Map 0.1 was selected (page vi). This concept illustrates environmental corridors (largely floodplain), anticipated retained uses and buildable acreage targeted for single family, mixed residential, office/flex and retail/hospitality/entertainment uses. Single family districts are anticipated to include one and two-family units at an overall ratio of one unit per acre, although cluster development may encourage smaller individual lots to maximize the potential for shared natural area amenities. Office/flex developments would include a mix of professional, technical, medical and research-oriented companies, including associated personal services such as daycare. Multifamily communities include traditional apartments and condominiums as well as age-restricted facilities. Increased density in these key locations will drive additional market for adjacent local retail nodes.
Examples of preferred development types representative of individual land use areas.
Single and two-family dwellings
Office/Flex developments
Locally serving retail
Multifamily communities
Hospitality and retail/entertainment

2013 Mequon East Growth Corridor Market Analysis vi
Retail/hospitality/entertainment areas located adjacent to I-43 interchanges at Pioneer and Highland Roads include businesses which require access to regional traffic, such as hotels, teen/family entertainment venues, and larger restaurants. Smaller internal retail nodes will accommodate demand from workers and residents in the corridor and elsewhere in the City. As shown, development within the corridor would create homes for 1,589 additional residents, 7,305 employees (retail and professional), and generate $26.5 million in additional consumer demand. The City’s share of the estimated $600 million in total investment is equivalent to $3.6 million in property taxes at 2013 mill rates.

2013 Mequon East Growth Corridor Market Analysis vii
Map 0.1: Future Development Concept
2013 Mequon East Growth Corridor Market Analysis viii
Recommendations During the course of the project, a number of potential challenges were identified which may affect the City’s ability to achieve its vision for the study area. These challenges were associated with mechanisms to ensure that future development maximizes development potential in the study area which meets the needs of the community, minimizes impact on existing commercial areas, and preserves natural environments and the City’s overall character. These challenges can be summarized as follows:
Encouraging desired uses in specific locations. Promoting small and local retail and service businesses. Mitigating high infrastructure costs associated with serving key parcels. Minimizing impact on existing Port Washington Road properties from commercial expansion. Discouraging further expansion of low value uses. Preserving open space amenities and environmentally sensitive areas.
Several of these concerns can be addressed through continued corridor planning initiatives which build on progress completed to date. Utilizing this and previous efforts in the development of a formal Corridor Plan will allow the City to influence not only the location and type of uses, but to set an overall vision for the corridor which goes beyond size and setback requirements. Corridor plans provide a mechanism to illustrate desired development character and relationships, including pedestrian and vehicular circulation, street design, architectural styles and building height and massing relationships for specific areas. One potential opportunity available within the corridor planning process is the potential to expand the City’s use of cluster or conservation zoning to include commercial development. Providing additional density incentives for buildable acres in the form of reduced setbacks, increased height or reduced open space requirements in exchange for investment in shared open space amenities can maximize the natural amenities present in the corridor, potentially creating a unique and marketable asset for the corridor. Developing a Corridor Plan will also allow the City to direct these efforts, while eliminating the need to add additional zoning districts. The City can act immediately to update Comprehensive Plan and zoning to reflect desired uses in the study area, enhancing these documents with additional information and guidance as part of a Corridor Plan. Other concerns associated with the timing and costs of development are closely linked to the ongoing infrastructure planning currently underway. Once larger municipal infrastructure planning is complete, the City will be able to make informed decisions regarding its role in infrastructure extension along Port Washington Road. At this point, the City can elect to support private development of infrastructure or to provide financial assistance with this endeavor. Ultimately, the perceived likelihood of infrastructure extension and potential for added value through increased density as a result of this expansion will influence the amount of private investment in the corridor over the long term. When setting infrastructure policy for the corridor, the City should define the level of contribution and expectation of private investment required to support the initiative. In the meantime, the City should open dialogue with the County and Wisconsin Department of Transportation to plan street infrastructure needs, which are not addressed in this study. As development occurs, the City will need to continually evaluate the needs of property owners and businesses elsewhere in the City. The evolution of a local economy, whether through increased competition from new development or changing space demands, may support assistance to property owners to update and enhance older properties to remain competitive and avoid the appearance of a declining market. Similarly, accommodating market-supported uses which may not be present or appropriate elsewhere in the community through infill and redevelopment will help diversify the local market and limit competition among existing commercial areas within the City. It is anticipated that the next phase of corridor planning will be completed within the next few years, allowing property owners within the study area the opportunity to develop their properties to the highest

2013 Mequon East Growth Corridor Market Analysis ix
and best use in a way that benefits the community as a whole. Ultimately, development of high visibility acreage within the study area has the potential to reinforce Mequon’s image in the region and provide a number of recreational and retail amenities desired by City residents and businesses.

2013 Mequon East Growth Corridor Market Analysis 10

2013 Mequon East Growth Corridor Market Analysis 1
Chapter 1: Project Overview The City of Mequon initiated this report for the purposes of exploring and evaluating market opportunities for development within the North Port Washington Road Corridor. The portion of this Road extending from Highland Road to East Pioneer Road is a largely undeveloped area within the City. However, its location adjacent to a major Interstate highway and proximity to Lake Michigan and various regional development centers create the potential for future development in the area. This market study and development feasibility assessment explores the size and nature of demand for various development types in the area. The purpose of this plan is to illustrate the size, nature and potential timing of development pressures to allow the City to better plan for, respond to and regulate the future of development in the corridor.
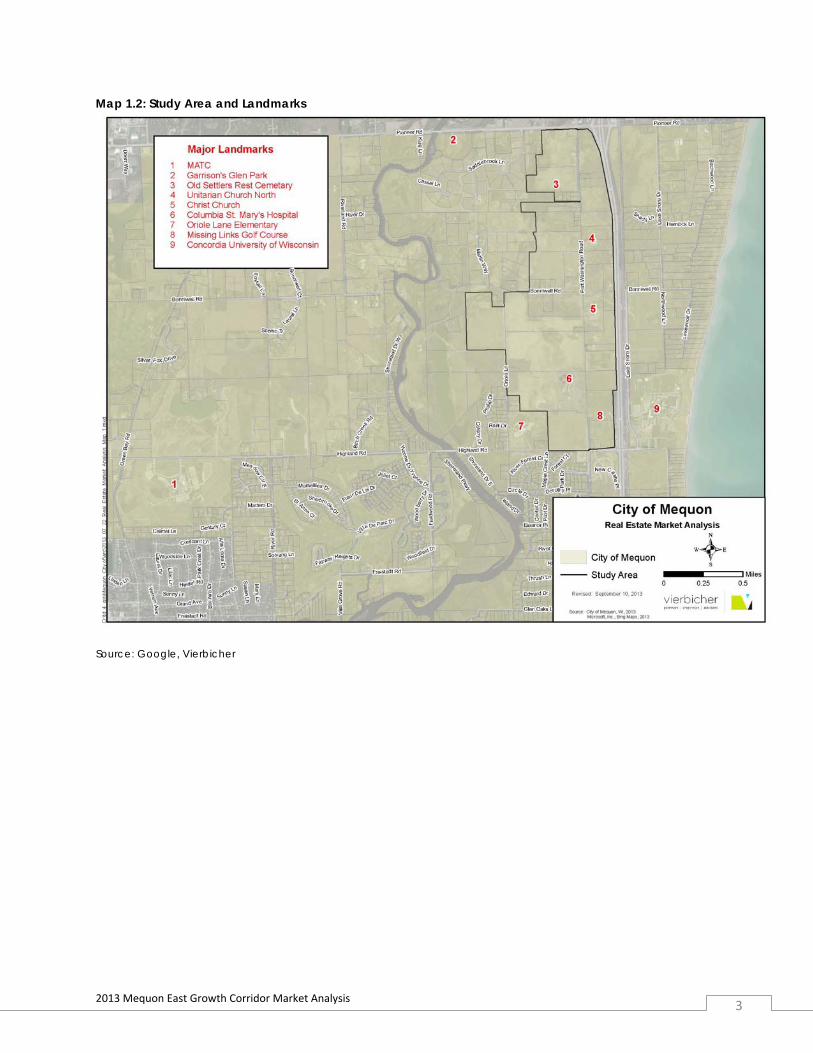
Study Area and Assumptions The study area included in this analysis includes a 2-mile frontage area along Interstate 43, as shown in Map 1.2 on page 3. The study area is 748 acres, and contains 57 parcels. The study area is located at the northern edge of the City of Mequon in Ozaukee County, also at the northern edge of the Milwaukee Metropolitan Statistical Area (MSA). Current land uses in the corridor include institutional, commercial and residential in the following breakdown: Table 1.0: Current Zoning/Land Use Land Use Acres 5-Acre Residential 413 Environmental Area 249 Institutional 46 1-5 Acre Residential 38 Office 2 Source: City of Mequon Within the residential land use category there are a number of parcels which are being used for a combination of residential and commercial uses, including agricultural, light industrial and service businesses. Institutional uses include Columbia St. Mary’s Hospital and several churches. Other uses included in the above which are unique to the Study area include the historic Old Settler’s Rest Cemetery, Missing Links Golf Course and several churches. Assumptions This report uses economic and market data from a variety of sources to assess local market conditions and economic drivers to determine Mequon’s competitive opportunities and challenges. Additionally, attempts were made to identify proposed or planned projects in or adjacent to Mequon which may substantially change local and regional consumer or workforce patterns. However, there is a possibility that additional
Map 1.0: Milwaukee Metropolitan Statistical Area
Map 1.1: Mequon Location
Source: US Census, Vierbicher

2013 Mequon East Growth Corridor Market Analysis 2
projects may arise during or after the analysis phase, and there also exists the potential for national or global economic factors to shift dramatically. For the purposes of this analysis, the following assumptions were made:
1) The United States will not enter into a double-dip recession or experience any significant downward adjustment in consumer spending patterns or attitude.
2) No major malls, shopping centers, or large scale mixed-use centers, other than those identified in this report, will be constructed in the Trade Area. Any such development would require a recalculation of supply and demand gap information to determine local market impact.
3) Gasoline prices will not exceed $5 per gallon in the next decade. If this occurs, shopping and workforce patterns may shift significantly.
4) Property owners in the study area will make properties available at market-supportable rates in line with property assessments and market sale comparables, aside from any known issues identified in this report.
5) No significant changes are made to floodplain delineations or to requirements for construction in or adjacent to floodplain areas.
2013 Mequon East Growth Corridor Market Analysis 3
Map 1.2: Study Area and Landmarks
Source: Google, Vierbicher


2013 Mequon East Growth Corridor Market Analysis 5
2013 Mequon East Growth Corridor Market Analysis 6
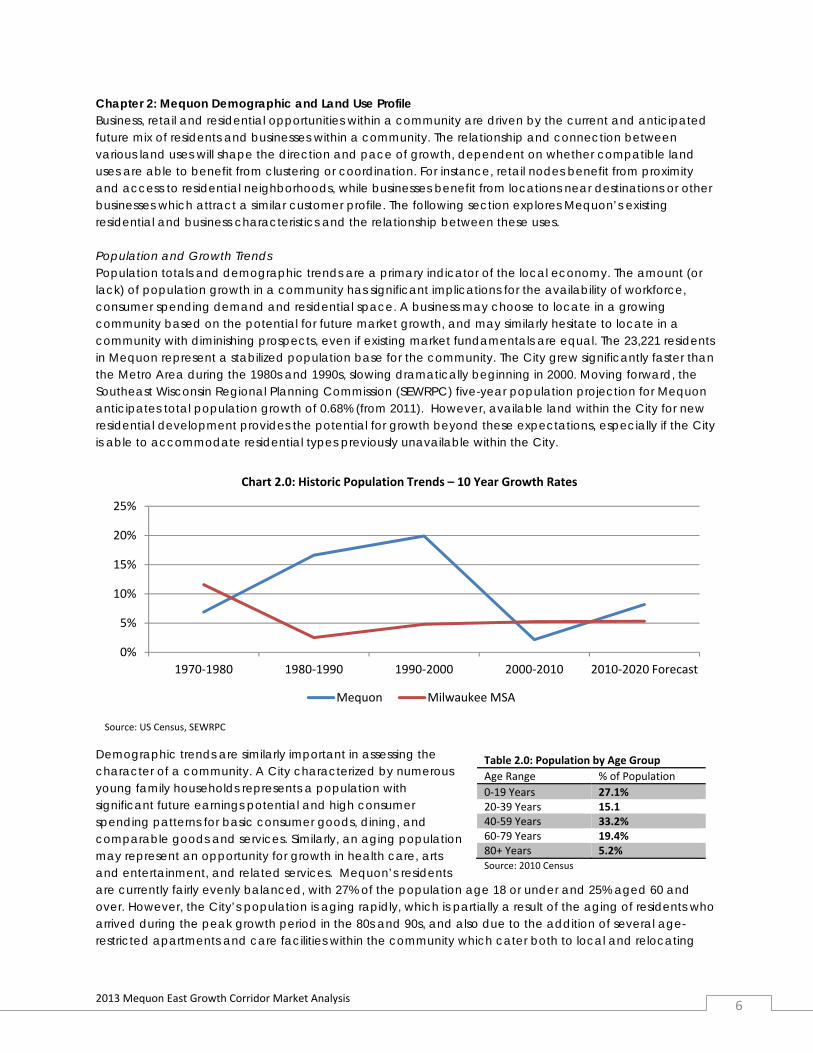
Chapter 2: Mequon Demographic and Land Use Profile Business, retail and residential opportunities within a community are driven by the current and anticipated future mix of residents and businesses within a community. The relationship and connection between various land uses will shape the direction and pace of growth, dependent on whether compatible land uses are able to benefit from clustering or coordination. For instance, retail nodes benefit from proximity and access to residential neighborhoods, while businesses benefit from locations near destinations or other businesses which attract a similar customer profile. The following section explores Mequon’s existing residential and business characteristics and the relationship between these uses. Population and Growth Trends Population totals and demographic trends are a primary indicator of the local economy. The amount (or lack) of population growth in a community has significant implications for the availability of workforce, consumer spending demand and residential space. A business may choose to locate in a growing community based on the potential for future market growth, and may similarly hesitate to locate in a community with diminishing prospects, even if existing market fundamentals are equal. The 23,221 residents in Mequon represent a stabilized population base for the community. The City grew significantly faster than the Metro Area during the 1980s and 1990s, slowing dramatically beginning in 2000. Moving forward, the Southeast Wisconsin Regional Planning Commission (SEWRPC) five-year population projection for Mequon anticipates total population growth of 0.68% (from 2011). However, available land within the City for new residential development provides the potential for growth beyond these expectations, especially if the City is able to accommodate residential types previously unavailable within the City.
Demographic trends are similarly important in assessing the character of a community. A City characterized by numerous young family households represents a population with significant future earnings potential and high consumer spending patterns for basic consumer goods, dining, and comparable goods and services. Similarly, an aging population may represent an opportunity for growth in health care, arts and entertainment, and related services. Mequon’s residents are currently fairly evenly balanced, with 27% of the population age 18 or under and 25% aged 60 and over. However, the City’s population is aging rapidly, which is partially a result of the aging of residents who arrived during the peak growth period in the 80s and 90s, and also due to the addition of several age-restricted apartments and care facilities within the community which cater both to local and relocating
Source: US Census, SEWRPC
0%
5%
10%
15%
20%
25%
1970‐1980 1980‐1990 1990‐2000 2000‐2010 2010‐2020 Forecast
Chart 2.0: Historic Population Trends – 10 Year Growth Rates
Mequon Milwaukee MSA
Table 2.0: Population by Age Group
Age Range % of Population
0‐19 Years 27.1% 20‐39 Years 15.1 40‐59 Years 33.2% 60‐79 Years 19.4% 80+ Years 5.2% Source: 2010 Census

2013 Mequon East Growth Corridor Market Analysis 7
older adults. The increase of older adults relative to younger families will significantly influence the type of housing needed in the City. Similarly, increasing the retention of 20-39 year old households at greater rates than in the past may require expanded residential options. Employment and Workforce In contrast to the local population, Mequon’s daytime employment base has grown significantly since 2000. During this period the City expanded its industrial park offerings, while simultaneous growth occurred in the retail and service sector. Based on the existing industry mix in the City, the local population of daytime employees is anticipated to increase by 10.9% in the next five years (EMSI). However, this growth is anticipated to create an overall shift in the composition of employees, with greater growth expected in the professional and services sector as opposed to the existing manufacturing base. The fastest growing industries are expected to be Health Care and Professional and Technical Employment. Table 2.1: Employment by Industry
Mequon Milwaukee MSA
Projected Employment
Growth (2020) Agriculture 0.4% 0.4% -0.6% Construction 2.1% 3.9% 33.3% Manufacturing 17.1% 12.6% -0.6% Wholesale Trade 5.8% 4.1% 6.5% Retail Trade 7.5% 15.8% 12.3% Professional Services 62.6% 49.7% 22.8% Government 1.5% 10.0% 8.4% Other 2.9% 3.5% 13.6% Source: EMSI In order for local businesses to achieve the projected level of growth they must be able to attract sufficient workers to fill available positions. Currently, Mequon is a net importer of workers, with only 10.7% of residents working within the community. The labor shed, or geographic region from which Mequon’s employers recruit a majority of their employees, is largely linear in nature, predominantly comprised of residents living along the I-43 corridor extending from Greenfield to the south to Port Washington to the north, as indicated in the graphic at right. In addition to influencing the need for various types of commercial space, the makeup of the employment base presents opportunities to attract new residents. The table below indicates the fastest growing occupations which are represented within Mequon’s base of companies. Based on the City’s current median home value of $342,800, only individuals hired as ambulatory health care professionals could afford to purchase a home in the City. Several other categories of workers would be able to rent units within the City, but an additional 100 new units would need to be added by 2020 to
2002 2007 2013 2018 (Forecast) Source: Census LED, EMSI
0
5,000
10,000
15,000
20,000
25,000
Chart 2.1: Total Mequon Daytime Employment
Chart 2.2: Workforce Labor Shed Distance and direction of commute for
workers employed in Mequon. Gradients
represent 25% of workforce)
Source: Census CES 2011
Greenfield
Port
Washington
Waukesha

2013 Mequon East Growth Corridor Market Analysis 8
accommodate these individuals (assuming that present trends continue and 11 percent of the local workforce lives within the City). Table 2.2: Projected Occupational Growth Occupation New Positions by 2020 Average Annual Earnings
Ambulatory Health Care 592 $77,467 Professional Services 329 $66,076 Insurance Carriers 251 $61,898 Education 230 $26,440 Chemical Manufacturing 229 $63,265 Hospitals 141 $63,374 Administrative 134 $33,029 Restaurant 96 $14,366 Nursing 80 $28,634 Retail Sales 63 $20,046 Paper Manufacturing 53 $56,039 Source: EMSI Land Use Assessment Despite proximity to the Interstate and lakeshore, 748-acre study area is largely undeveloped, and has historically been used primarily for agricultural purposes and rural residential home sites. However, several significant institutions and popular destinations are located within or in close proximity to the study area. More recently, a number of properties have been purchased by entities looking to pursue conditional uses allowed in the area, including churches, independent contracting businesses and other large-scale, low-impact uses. One-third of the study area is taken up by Ulao Creek and its associated floodplain area. One measure of economic health from a real estate perspective is the ratio of improvement to land value. Land which is fully utilized supports improvements which are at least equal to the value of the land, with a desired improvement to land ratio of at least 2:1. The higher the ratio, the more intensive the development on the subject parcels. The City of Mequon as a whole is characterized by pockets of higher intensity uses interspersed with lower density rural or natural areas. This pattern of development is shown in Map 2.0, where purple and reddish nodes along southern Port Washington Road, in the industrial park and select residential neighborhoods (Burning Bush, Canterbury, Ridgeview) represent clusters of highly utilized properties of varying types.

2013 Mequon East Growth Corridor Market Analysis 9
Map 2.0: Improvement to Land Value in Mequon
Source: City of Mequon, Assessor In contrast to this City-wide pattern, map 2.1 illustrates the improvement to land value within the study area. This area is characterized by low-density uses, with only three parcels having improvement ratios greater than 2.0 and an additional eight parcels having ratios between 1.5 and 2.0. A majority of these parcels are either residential parcels of one acre or less or split lots with a home and a business. The hospital falls within the 1.5-2.0 ratio. Although the presence of environmental corridors and floodplain within the study area influences utilization of some properties, the bulk of land in the corridor is underutilized from an economic standpoint.

2013 Mequon East Growth Corridor Market Analysis 10
Map 2.1: Improvement to Land Value in Study Area
Source: City of Mequon, Assessor

2013 Mequon East Growth Corridor Market Analysis 11
Past uses can also influence development potential in an area, especially when it comes to environmental contamination. “Brownfield” is a term used to describe sites which have known or perceived issues associated with environmental contamination. The presence of brownfield sites may delay development of parcels based on real or perceived environmental issues. Map 2.2 shows the sites which have been identified by the DNR as having current or previous contamination associated with activities conducted on site. This map is not comprehensive, and includes only known cases of contamination. However, the absence of open contamination cases is an advantage for development in the study area. Table 2.3: Known Remediation Sites Site Type of Contamination Status Richard Fix Property Petroleum Leak Area Capped St. Mary’s Ambulance Garage Gas Leak Remediated and Closed Oriole Lane Elementary School Leaking Storage Tank Remediated and Closed Map 2.2: Known Brownfield Sites in Study Area
Key 1) Richard Fix Property 2) St. Mary’s Ambulance Garage 3) Oriole Lane Elementary School
Floodplain
Study Area
Source: Wisconsin DNR
1
2
3

2013 Mequon East Growth Corridor Market Analysis 12
An additional component of land use assessment is the presence of environmentally sensitive areas. Ulao Creek flows just west of the study area, and portions of several parcels are included within its 100-year floodplain. Map 2.3 shows this floodplain. In total, 276 acres within the study area are located within the floodplain. Limitations placed on developments in or adjacent to floodplains will be a significant consideration in analyzing development scenarios. Locating adjacent to floodplain areas requires additional time and cost associated with permitting and insurance. Additionally, sensitive uses such as advanced manufacturing or data centers will not locate on these parcels. As an example, the absence of adjacent floodplain areas is one of the criteria associated with industrial site certification through the Wisconsin Economic Development Corporation, included at the recommendation of site selection consultants.
Current Land Uses

2013 Mequon East Growth Corridor Market Analysis 13
Map 2.3: Floodplain
Source: FEMA

2013 Mequon East Growth Corridor Market Analysis 14
Infrastructure and Transportation Assessment The presence of suitable infrastructure and transportation systems in an area is essential for future development. Although there are some uses with minimal water or sewer needs which would consider locations not served by municipal utilities, the additional acreage required to accommodate on site sanitary systems ultimately produces far less investment per acre and makes future redevelopment more costly. Property owners wishing to develop in areas where infrastructure is not in place must weigh the cost of extending infrastructure versus the size of the anticipated development. Providing adequate incentives to connect to infrastructure (i.e. through the ability to develop at higher densities) will ultimately encourage more sustainable development patterns and mitigate the development of lower value interim uses which may present challenges for future redevelopment. This issue is addressed in further detail in Chapter 7. Water and Sanitary Sewer Infrastructure Discussions with City engineering staff identified several water and sewer infrastructure improvements which will be necessary in order to extend service further into the study area. These investments include installation of an additional sanitary sewer lift station and upsizing of current sewer capacity. These investments are in addition to the linear costs of extending sewer and water within the right of way and associated road reconstruction. Because of these large up front expenditures, the cost to extend utilities to Bonniwell Road does not offer substantial cost savings over the cost to service the entire study area. Based on information from preliminary engineering studies, the total cost to extend Port Washington Road utilities from the current terminus at Columbia St. Mary’s to the Pioneer Road intersection is estimated to be $8 million. A portion of the cost of the initial utility expansion is associated with ‘upsizing’, or investing in future capacity upgrades beyond what would be required for near term development. The portion of total cost which can be attributed to the cost of upsizing, based on similar recent project budgets, is assumed to be roughly one-third the cost of utility extension (excluding up front activities), or just less than $2 million. One common strategy used to efficiently plan for utility expansion is to coordinate utility work with street construction, as a large portion of the cost associated with extension is the need to completely reconstruct all or a portion of the road in order to install utilities. While Port Washington Road is a County Road, there are presently no plans at the County level to conduct street improvements in the area during the study period. This means that the cost of any utility extension will need to be completely born by the utility district, the City of Mequon, and property owners or developers in order to occur in the next decade and perhaps longer. Various development scenarios are explored in Chapter 7.

2013 Mequon East Growth Corridor Market Analysis 15
Map 2.4: Existing Infrastructure
Source: City of Mequon

2013 Mequon East Growth Corridor Market Analysis 16
Transportation The major transportation corridor in the study area, Port Washington Road (County Highway W) has a rural cross section of one travel lane in each direction. Turn lanes and/or passing lanes are present at the intersections with Highland and Pioneer Roads and are adjacent to major destinations including the hospital and Christ Church. 2010 traffic count data from the Department of Transportation counted average daily vehicle traffic of 7,900 cars per day on Port Washington south of Pioneer, a decrease from the 9,800 cars per day traveling Port Washington Road south of Highland Road. Pioneer Road carries 8,600 vehicles per day on the north side of the study area, 84 percent of which access Interstate 43. Highland Road, which does not offer Interstate access, but provides direct access to both the hospital and Concordia University of Wisconsin from the south, carries 6,100 vehicles per day west of Port Washington Road, and only 2,200 vehicles per day passing under Interstate 43. Bonniwell Road, which represents the only other east-west street in the study area, was not counted in 2010, but carried 770 cars per day in 2004 at last count. Many parcels in the study area are visible from Interstate 43, which carries 56,400 vehicles per day past the study area. The DOT is currently exploring an expansion of Instate 43 passing through the corridor (from Silver Spring Drive to Grafton Road) from 4 travel lanes to 6 travel lanes. Also being evaluated is the potential to add an interchange at Highland Road, which was recommended in the SEWRPC Regional Transportation Plan. No changes have been proposed to the Pioneer interchange as part of this project. Project maps clearly show that current morning commuter congestion begins after the Pioneer Road interchange with congestion steadily increasing as the Interstate approaches Milwaukee. Projections for 2040 indicate that the Highland to Pioneer section of 43 would experience a level of service of E during morning and afternoon peak periods if no improvements are implemented, based on DOT traffic models. As part of the project, DOT is currently evaluating alternatives, and anticipates a public hearing in February of 2014 in advance of the Environmental Impact Statement (EIS) process. The final design will be refined through the end of 2015, although construction of any new improvements would not begin until at least 2019. The final recommendation, along with a reasonable anticipation of construction timing, will likely influence both the demand for individual land uses as well as the potential for property speculation. If an Interchange at Highland is included in the plan, the presence of hospital and university anchors will present an attractive location for retailers. Similarly, the anticipation of a future interchange and associated higher property values may cause property owners in the southern portion of the study area to postpone development in anticipation of selling for a higher price when an interchange is imminent. Strategies for addressing these and other potential externalities are discussed in Chapter 7. In addition to automobile transportation, the location and availability of public transportation can influence business decisions. This is especially true of businesses that rely on lower wage workers, students, or older workers who may have limited access to private transportation. Mequon is included in the Milwaukee County Transit System, with commuter bus service to Milwaukee and Port Washington via the Ozaukee County Express (route 143). Mequon stops include Mequon Road at Port Washington, Venture Court at Port Washington, West Glen Oaks Lane at Port Washington, Columbia St. Mary’s Hospital and Pioneer Road. The route has two morning and two evening trips southbound each weekday and three outbound and eight return trips in the northbound direction. A second bus route (42U) provides school year service linking the North MATC Campus, Concordia University of Wisconsin and downtown Milwaukee. Despite these connections, there are several Mequon employers which choose to provide private bus transportation for their workforce in order to obtain sufficient qualified workers.
2013 Mequon East Growth Corridor Market Analysis 17
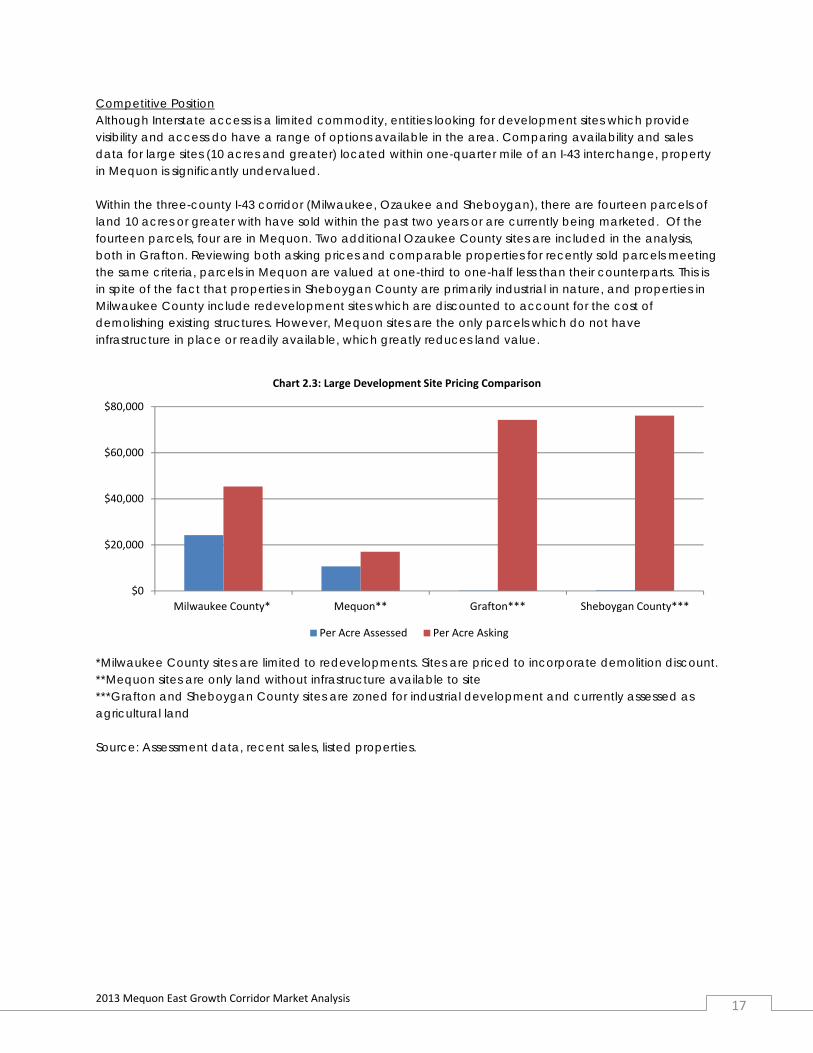
Competitive Position Although Interstate access is a limited commodity, entities looking for development sites which provide visibility and access do have a range of options available in the area. Comparing availability and sales data for large sites (10 acres and greater) located within one-quarter mile of an I-43 interchange, property in Mequon is significantly undervalued. Within the three-county I-43 corridor (Milwaukee, Ozaukee and Sheboygan), there are fourteen parcels of land 10 acres or greater with have sold within the past two years or are currently being marketed. Of the fourteen parcels, four are in Mequon. Two additional Ozaukee County sites are included in the analysis, both in Grafton. Reviewing both asking prices and comparable properties for recently sold parcels meeting the same criteria, parcels in Mequon are valued at one-third to one-half less than their counterparts. This is in spite of the fact that properties in Sheboygan County are primarily industrial in nature, and properties in Milwaukee County include redevelopment sites which are discounted to account for the cost of demolishing existing structures. However, Mequon sites are the only parcels which do not have infrastructure in place or readily available, which greatly reduces land value.
*Milwaukee County sites are limited to redevelopments. Sites are priced to incorporate demolition discount. **Mequon sites are only land without infrastructure available to site ***Grafton and Sheboygan County sites are zoned for industrial development and currently assessed as agricultural land Source: Assessment data, recent sales, listed properties.
$0
$20,000
$40,000
$60,000
$80,000
Milwaukee County* Mequon** Grafton*** Sheboygan County***
Chart 2.3: Large Development Site Pricing Comparison
Per Acre Assessed Per Acre Asking

2013 Mequon East Growth Corridor Market Analysis 18
Chapter 3: Retail Market Analysis For retail businesses, the area from which businesses attract a majority of their customers is referred to as a trade area. This section explores the size and nature of the trade area for businesses in the study area and identifies the market demand for specific goods and services within this area. Trade Area Delineation The trade area analysis conducted for the City of Mequon in 2006 identified a 10-minute drive as the primary trade area for local retail markets. Interviews with local businesses and retail brokers familiar with the market have confirmed that this trade area would be appropriate for future businesses within the study area. Examples of locally-oriented businesses include grocery, dry cleaners, cafes and other businesses which require frequent trips and convenient location to residential areas. Secondary and tertiary trade areas illustrate areas from which regional businesses can expect to draw customers. Regionally focused businesses such as destination restaurants, theaters and specialty shops will draw people from greater distances. Map 3.0 depicts the primary and secondary trade areas for the Pioneer Road interchange. Because of the Mequon Road interchange, which already has a complement of retail uses, retailers locating in the study area may end up competing with existing businesses. Map 3.1 illustrates the amount by which retailers in the study area may compete with retailers at Mequon Road. Although there is significant overlap in geographic area, the primary trade area for businesses in the study area includes a significant amount of undeveloped or sparsely developed land. This presents a near-term limitation on the amount of supportable retail square footage, but also indicates future opportunity to locate retail convenient to residential growth areas. From a local retail perspective, the 4 miles between Mequon and Pioneer Roads is substantial, and would not pose a competitive disadvantage, especially given drive times between the two locations. However, the development of a retail cluster at Highland Road could result either in loss of market share for Mequon Road retailers, or the potential relocation of retailers from existing centers with limited visibility or access to newer locations at Highland Road with access to a largely similar customer base. Currently, the tenant mix at the Mequon Road interchange differs significantly from the mix at the Washington Street interchange in Grafton, minimizing competition between the two retail nodes. Depending on the type of uses allowed in the study area, retail which develops prior to significant population density could have a short term negative impact on vacancies of older properties in the Port Washington corridor. Strategies for mitigating potential conflicts between land uses at various interchanges are discussed in Chapter 7.

2013 Mequon East Growth Corridor Market Analysis 19
Map 3.0: Primary and Secondary Trade Areas
Source: ESRI
Intersection of Port Washington Road and Pioneer Road

2013 Mequon East Growth Corridor Market Analysis 20
Map 3.1: Trade Area Overlap
Source: ESRI
Intersection of Port Washington Road and Pioneer Road
Intersection of Port Washington Road and Mequon Road

2013 Mequon East Growth Corridor Market Analysis 21
Supply and Demand Gap Analysis A comparison between 2006 and 2013 retail spending indicates significant growth in the local consumer market and a marked shift in the patterns of local shoppers. Overall consumer demand for retail goods and services increased Citywide by 28.4 percent from 2002 through 2013. This is nearly twice the rate of population growth, reflecting the significant rise in income and home equity during the period. New retail development kept pace with population growth, adding nearly 100,000 square feet of retail space to the market (excluding retail included in mixed-use developments). However, the surplus consumer demand when largely unaddressed in the local market, as capture of consumer spending actually decreased from 85.7 percent of demand in 2002 to 57.0 percent of demand in 2013. Although 58 percent capture of resident spending is fairly typically for a suburban community, it does illustrate today’s increasingly competitive retail landscape. This gap is partially due to an increase in online sales, as 7.7 percent of Mequon spending was done through non-store retailers such as online services. However, 14.5 percent of spending was lost to general merchandisers outside of the community (Target and Wal-Mart are included in this category). Several of these retailers were added at the Washington Street exit in Grafton during the interim period. Mequon’s zoning does not allow large format retailers in the City. One notable item is the significant public desire for local retail and service businesses, which is supported not only by stated preferences but also by spending patterns. The 2013 community survey conducted by the University of Wisconsin-Milwaukee found that 75.7 percent of respondents indicated favorable support for community retailers in Mequon. There are also robust local sales identified in traditional small and local business categories such as florists, gift stores and specialty food shops. Despite the strong support, businesses within these categories more than satisfy the existing demand for this type of goods among the local market, and must rely on a significant amount of outside traffic for further sales gains(20 percent of florist and gift shop sales come from outside the community). In order to attract additional specialty retailers, the City either needs to increase the amount of local demand (by increasing the population base), or attract additional destination/anchor businesses which will expand the supply of outside dollars available to businesses in the community. Excluding general merchandisers, department stores and other power center retailers such as electronics and building supply which are not desired retail types within the City based on their large average footprint, there are a number of retail sectors which have unmet local demand by City of Mequon residents. Those categories with sufficient demand to support an additional retailer at present levels are included in Table 3.0. The full supply and demand report is provided in the appendix. Table 3.0: Supportable Local Retail Sectors Retail Category Unmet Local Spending Demand Grocery $24.6 million Gas Stations $14.9 million Limited Service Restaurants $10.8 million Clothing $9.7 million Sporting Goods $3.7 million Health and Personal Care $3.5 million Within each of these sectors there are a variety of business models which determine the amount of sales per establishment which would need to be captured. For instance, the average grocery store in the United States conducts $15.6 million in annual sales in an average of 15,000 square feet of space, according to the National Grocers Association. However, an upscale or specialty grocer such as Whole Foods averages more than twice this number of sales, which would require a store to capture significant regional spending to locate within the community. Similar ratios exist for clothing ($1.9 million per store nationally versus $3.5 million per store for national brands).

2013 Mequon East Growth Corridor Market Analysis 22
Some retail opportunities in Mequon may be limited unless substantial residential development precedes retail development. Based on existing consumer spending patterns, it would take 2,000 additional residents to support one new 10,000 square foot retail center. Because of high local incomes and strong consumer spending, this is a much more favorable ratio than national averages which calculate that each 10,000 new residents provide sufficient retail demand to support 15,000 square feet of basic retail (such as gas stations or grocery stores). Specialty retailers require a larger customer base because they are able to attract a smaller percentage of the population. A ratio of 25,000 residents per 15,000 square feet of specialty shops is appropriate to attract specialty retailers (such as coffee shops). One limitation of Mequon’s rural residential character is the limited ability of retailers to locate in close proximity to large residential populations. Vacancy, Rent and Absorption Trends Significant retail vacancy remains in nearly every submarket in the wake of the recession. Markets toward the edge of the metro area are witnessing the highest vacancies, as retail centers and businesses predicated on continued residential development have scaled back. Chart 3.0 shows the retail vacancy rate in the Milwaukee Metro and the North Suburban submarket, of which Mequon is a part. Within Mequon, there is just shy of 125,000 square feet of retail space being marketed as available according to the Costar group. This represents 10.4 percent of the total 1.3 million square feet of retail space in the City. It is likely that the actual vacancy rate is marginally higher, as some local owners will choose to market vacant space through window signs or online. Five percent vacancy is generally considered an equilibrium point where additional supply is warranted. Development of new retail square feet will be largely limited to owner occupied structures until current vacancy drops significantly. Although vacancy rates are higher in the North Suburban market than elsewhere in the metro area, rental rates are fairly competitive on a per square foot basis, averaging just over $15.00 per square foot triple net (excluding utilities, insurance and common area fees). Rates are slightly higher for newer properties in the North Suburban submarket, but this is at least partially due to a greater supply of smaller spaces which charge more on a per square foot basis. Based on historic trends, Mequon has absorbed an average of 7,000 square feet of retail space per year. This figure is used as the basis for future retail projections, expanding slightly to account for projected residential growth. The City could also choose to promote shopping locally, or provide for additional retail categories to locate in the community which are not currently accommodated. Either of these decisions would increase the annual retail absorption potential for the City.
Source: REIS
Source: REIS
10%
11%
12%
13%
14%
15%
16%
17%
18%
North Suburban Milwaukee Metro
Chart 3.0: Second Quarter 2013 Retail Vacancy
$0.00
$5.00
$10.00
$15.00
$20.00
$25.00
North Suburban Milwaukee Metro
Chart 3.1: Asking Retail Rent (PSF, NNN)
Overall Asking Rent Built Since 2000

2013 Mequon East Growth Corridor Market Analysis 23
Competitive Position Although Mequon’s retail vacancy is still relatively high, the zoning code’s restriction on the square footage of commercial buildings has eliminated the abundance of large format vacancies found in many suburban markets. Mequon’s consumer base and large discretionary market make it an attractive retail destination. Projects such as the Outpost Natural Foods Cooperative and Metro Market illustrate the strong local market, while Mequon Road developments such as Starbucks, Panera and various banking and financial projects demonstrate the appeal of high traffic counts found at Interstate exists, especially significant in a community where a majority of residents commute into Milwaukee daily. Overall, Mequon’s competitive position is strongest for high-end regional retailers, specialty retail and entertainment and hospitality. Regional retailers and entertainment venues (i.e. movie theaters, music venues) will require sites with convenient Interstate access, while specialty shops and hospitality will be equally successful adjacent to major drivers such as the hospital and Concordia University of Wisconsin, or as part of employment centers or mixed-use residential projects. In addition to the presence of nearby power center developments in Grafton, the City lacks the dramatic growth projections to attract significant large format retail. This minimizes the potential for the City to capture surplus unmet demand in department store, general merchandise and electronics categories. Other categories identified in the retail demand study with current demand to support additional businesses include grocery, gas stations, limited service restaurants and clothing. However, Mequon’s current zoning regulations exclude the community from attracting most non-specialty grocery stores, which generally seek to construct new locations that are larger than 40,000 square feet. Grocery stores are the most common anchor to local shopping centers, and can be a boon to local businesses that locate nearby due to the large number of trips they attract. From a policy perspective, strategically distinguishing development types at various I-43 interchanges will be an important consideration for the City. Long term, facilitating updates to and redevelopment of 1970s era retail structures will be essential to retaining and enhancing the vitality in older parts of the community. Many of these centers no longer meet the needs of modern retailers and have slowly transitioned to professional and service establishments. As many of these structures were built prior to Mequon’s current design guidelines, some are starting to appear dated, especially as newer construction occurs elsewhere in the community. Fostering reinvestment in these areas of the community through targeted programs such as the recently introduced business loan fund can help retain businesses in existing space.

2013 Mequon East Growth Corridor Market Analysis 24
Chapter 4: Office and Industrial Market Analysis Individual office and industrial market sectors have varied site selection requirements based on unique site selection needs such as utility infrastructure, raw materials and transportation networks. However, despite these variations in business models, they are closely linked in their overall need for locations with adequate workforce and access to a regional customer base. Mequon’s location toward the edge of the metropolitan area limits the City’s ability to achieve a competitive advantage from a workforce perspective – the surrounding labor shed is significantly less dense than locations in closer proximity to Milwaukee County. This is especially true for companies requiring blue collar staff, as Mequon and many adjacent communities do not have sufficient available housing or access to transit for this type of workforce. As a result, industrial uses considering Mequon much more closely resemble the office-based industries. These companies appreciate access to a highly educated workforce, coordination with large local employers such as Columbia St. Mary’s or Rockwell Automation, access to students or staff at local institutes of higher education and/or proximity to executive housing. For this reason, the two industry sectors are discussed together in this report. Market Statistics As professional and technical companies tend to have greater flexibility in space requirements than manufacturing or distribution companies, office and flex space demand has been slow to recover following the recession. Whereas manufacturers require set square footage in order to expand machinery or material storage, professional businesses can make do with smaller cubicles or telework arrangements in the short term. Flex space is a commonly used term which refers to buildings which have a large office space component but which also provide dedicated loading, warehousing or light assembly space. Companies requiring flex space are commonly found in the research, testing and product development sectors. Vacancy rates for newer office space built since 2000 is still greater than 20 percent for the metro area as a whole. This high vacancy rate is partially due to the high rental rates required by these types of facilities, and also due to the reluctance of companies to commit to larger facilities until the economic outlook becomes more certain. Metro-wide, companies will need to pay an average of $6 per square foot more for new space, requiring a significant commitment to expansion and future profitability. Although average rental rates are finally beginning to recover, as shown in Chart 4.0, many landlords are still faced with remaining terms at low rates signed within the last 3-5 years.
Source: REIS
‐2.0%
0.0%
2.0%
4.0%
2008 2009 2010 2011 2012
Chart 4.0: Percent Change in Office Rental Rates
North Suburban
Milwaukee Metro
461
2,012
Chart 4.1: 2Q13 Total Vacant Office Square Feet (Thousand SF)
North Shore
Other MKE Submarkets
47
1,766
Chart 4.2: 2Q13 Class A Office Vacancy (Thousand SF)
North Shore
Other MKE Submarkets
2013 Mequon East Growth Corridor Market Analysis 25
Despite signs of recovery, constructed activity remains extremely limited. Only five new office buildings have been built since 2010. Newly constructed facilities have been focused on medical users but have included both single and multi-tenant structures. The typical size of these new buildings ranged from 7,500 square feet to 60,000 square feet, with larger facilities in the industrial parks. Although larger facilities are still being built, the average per employee square footage continues to shrink, averaging 185 square feet per person in 2012 (Costar). New construction activity is slightly better for flex type buildings, which are often built for a specific user. Flex users can often justify the cost of new construction in order to improve function and efficiency of operations in a new space. The industrial market as a whole is strong and growing, with year-end 2012 industrial vacancy at 6.6 percent with more than 425,000 square feet absorbed during the previous year (Cassidy Turley Barry). Flex properties, the most sluggish industrial sector, are still experiencing a relatively low vacancy rate of 7.1 percent for multi-tenant spaces (excluding previously discussed owner occupied buildings). The North Shore submarket (which includes Mequon) has the highest vacancy of any industrial submarket, at 13.8 percent. This is partially due to a larger quantity of dated industrial space, but also due to reduced price competition over the past several years for locations closer to major transportation routes or workforce population. Stakeholder outreach indicates that Mequon’s office and flex markets typically perform as a localized market rather than as a submarket within the larger metropolitan marketplace. This means that companies considering a location in Mequon are typically not considering a significant amount of other destinations, but rather have a specific attachment to the region. This is a positive factor for the City’s office market, resulting in less competition for tenants and creating a more stable market. The City has developed small clusters in the area of medical specialties and a growing reputation for electronics and equipment manufacturing. One significant element of future demand is the overall age of existing office space in the City. Although there are some examples of newer structures, such as the Irgens and Concord projects, 14 percent of office space was built prior to 1970, and 47 percent was built prior to 1980. As company space needs evolve to include elements such as flexible work space, fiber optic connectivity and other demands, older spaces will be less competitive. Accommodating new facilities to provide a range of function and image options for companies with a desire to locate in Mequon will be important in retaining existing businesses as well as accommodating companies with close ties to the community. Several stakeholders mentioned Mequon’s practice of limiting office developments to 20,000 square feet. While none of them identified this as a factor limiting growth in the past, several did identify a number of local companies which could be precluded from staying in the area in the future if current growth rates continue. Although undoubtedly the City would wish to retain these companies and would ultimately work with them to find a solution, it is also possible that companies may make a decision based on advice from real estate agents or others without consulting the City. Revising this ordinance to allow for this type of flexibility might encourage such companies to explore opportunities in Mequon in more detail. Additionally, brokers interviewed identified an increasing focus by businesses on retaining and attracting younger workers, especially in industries with high upcoming retirement expectations. This has shifted site selection focus to areas closer to downtown, especially on the office side. This has been a trend nationally for some time, but as Milwaukee tends to lag national trends, construction of new downtown office buildings is just beginning. Competitive Position The presence of a well-off older population coupled with access to two hospital centers within close proximity creates opportunities for spinoff office demand. Medical industry trends point towards increased utilization of off-site office space to increase hospital efficiencies. Additionally, some hospitals opt not to perform certain procedures due to cost or philosophical reasons. Both of these scenarios create demand for proximate medical facilities to existing hospitals. Universities are also common drivers of demand for office space, either as flexible satellite space for growing professional development activities, for

2013 Mequon East Growth Corridor Market Analysis 26
companies which target student workers, or research or policy affiliates which benefit from adjacency to a university. On the industrial and flex side, Mequon has a number of well established companies which provide the potential for vendors and suppliers to seek out adjacent locations. However, the availability of high quality industrial land that is well-suited for flex users elsewhere in the City will limit the potential for this use within the study area. Industrial companies which would opt for more expensive lots in the study area versus these existing parks are largely limited to companies which either benefit from increased marketing and visibility, or for which time to market is critical. For smaller firms, the residence of top executives is always a consideration when exploring location options. This is especially true of technology, research and other industries which may require time sensitive activities. Mequon’s reputation as an executive housing destination can support some growth through this type of affiliated business activity, provided suitable space is available. Despite its reputation as a locally-based market, the existing business mix alone provides a strong base for future growth. Looking only at industries with an existing presence in the City, projected employment growth in typical office and industrial sectors is projected to create 1,954 new jobs in the City through 2018. These jobs are more heavily slanted toward the office side, with 62.6 percent of the growth coming from this sector, with only 17.1 percent of new jobs added in industrial type occupations (many industrial sectors in the City are anticipated to contract during this period). This growth alone is sufficient to accommodate nearly 400,000 square feet of office space by the end of the decade.
Mequon Office and Industrial Properties

2013 Mequon East Growth Corridor Market Analysis 27

2013 Mequon East Growth Corridor Market Analysis 28
Chapter 5: Residential Market Analysis The residential market analysis includes an assessment of both single and multifamily units. While Mequon has historically seen strong demand from individuals seeking large lot single family homes and, more recently, senior communities, the combination of large parcels, few adjacent neighbors and convenient access to transportation, natural and retail amenities create the potential for additional types of development within the study area. Single Family Residential Development Trends Residential development has only just begun to emerge from the recession. The first new developments to enter the market in significant quantity have been apartment homes and senior communities. These projects have benefitted from a perfect storm of favorable demographic trends, below-replacement cost existing housing stock and more stringent financing. However, single family sales and permitting are also up year over year since 2011, although activity is still only one-third of historic annual averages. According to the Metropolitan Builders Association, sales of existing homes were up 5 percent in 2012, while sales of new homes were up 16.2 percent. With foreclosure activity peaking in third quarter of 2012, buildings are starting to gain confidence in the market. Table 5.0 indicates Mequon’s level of home building activity. Its ranking on most home building measures places it in the middle of the pack in terms of activity, and at about 13 percent of all metro activity, which is in keeping with its share of regional population. Overall, the Interstate 94 corridor has seen twice as much development as North Shore Communities. Homes in Mequon continue to be larger and more valuable than metro averages, although significant high end and large lot development is now occurring in towns as opposed to incorporated areas. Table 5.0: Single Family Development Residential Trend 2013 Mequon Statistics Rank within MSA New Single Family Home Starts 18 8 New SF Average Square Feet 3,550 7 New SF Average Value $372,667 11 Source: Metropolitan Builders Association
0.0%
0.5%
1.0%
1.5%
2.0%
2.5%
3.0%
3.5%
4.0%
4.5%
0
500
1,000
1,500
2,000
2,500
3,000
3,500
2002 2003 2004 2005 2006 2007 2008 2009 2010 2011 2012 2013 YTD
Mequon Percent of new Perm
its
New Single fam
ily Perm
its
Chart 5.0: Single Family Home Building Trends
Mequon Milwaukee Metro Mequon Share of New Homes

2013 Mequon East Growth Corridor Market Analysis 29
Apartment Market Trends On a regional level, many have expressed concern about overbuilding in the multifamily market as a result of the dramatic increase in supply, especially in the rental apartment and assisted living property types. The 1.4 million apartment units reportedly in the approval process nationally (according to the National Multi Housing Council) in January of 2013 is certainly a significant jolt to supply. However, in the Milwaukee Metropolitan Area, as with many other larger markets, this new influx of properties is making up for smaller than average multifamily construction rates since 2000. Historically, the metro market has expanded/replaced 10-15 percent of multifamily units each decade. This trend has declined significantly since 2000, with only seven percent growth after 2000. The 1980s and 1990s also experienced multifamily construction on the lower end of historic averages during a period of significant single family growth. In many ways, this upsurge in development is the market’s way of playing catch-up for lack of past production. An additional point in favor of the new surge of multifamily growth is the generally strong and stable apartment market fundamentals in the region. With only a 3.2 percent vacancy rate, Milwaukee is second behind only Pittsburgh as the tightest apartment market nationally out of 275 markets tracked by REIS, a leading commercial market analysis firm. This, coupled with demographic shifts favoring renters over the next 20 years, such as increasing populations of young people, older retirees, and immigrant households bodes well for developers in the multifamily market. Mequon has limited history with multifamily development, with 2,212 total multifamily units within the City. Of these only 35 percent are traditional rental apartment units and only 44 percent of units are in developments that contain more than 4 units. The community also has a number of senior apartments or continuum of care facilities, which are better able to work with Mequon’s zoning as a result of their need to incorporate community facilities or medical space to offset per unit land area requirements. This limited supply of traditional apartments creates a premium for existing units. Chart 5.1 provides a comparison of Mequon’s apartment market. Competitive Position As demographic profiles of the renting population shift, places like Mequon are able to cater to a new type of apartment dweller. National Apartment Association reports indicate that 20 percent of the households now entering the rental market earn more than $75,000 per year. An additional consideration for Mequon is the potential impact of multifamily units on the ability to accommodate employment and retail growth within the City. Both employers and retailers rely on the proximity of workforce and customer base to make location decisions, and the ability to accommodate and/or project future growth based on these measures is important. From a business perspective, sectors which rely on recruitment of workers from outside of the metropolitan area will be most affected by the presence of quality apartment housing. Atlas Vanlines surveys have indicated a shift toward rental versus purchase for the first several years after employment transfer. Similarly,
Table 5.1: Mequon Apartment Statistics Mequon North Shore
Submarket Milwaukee MSA
Average Per Unit Rent
$1,081 $875 $875
Average Rent/SF (1 bed)
$0.99 $0.96 $0.99
Avg. Rent 2000 and Newer
N/A $825 $1,292
Rental Rate Growth (3 year annualized)
N/A 1.8% 1.0%
Avg. Vacancy 0.8% 4.6% 3.7%
Avg. Vacancy 2000 and Newer
N/A 3.1% 16.3%
Source: REIS, Vierbicher

2013 Mequon East Growth Corridor Market Analysis 30
healthcare and other shift workers value the ability to live in proximity to their place of employment to minimize commuting during nighttime hours. A comparison of the largest employment growth sectors for Mequon and the average annual earnings of these positions indicate that only health care workers could afford to purchase a median value home in Mequon. Several other occupations would be able to afford the City’s average rent, if adequate units were available. Table 5.2 indicates the wage and local affordability for the fastest-growth occupational sectors. Table 5.2: Fastest Growing Occupations, Wages and Residential Affordability Occupation New Positions
Supported by 2020 in Mequon
Local Average Annual Earnings
Monthly Rent or Mortgage Payment Possible
Local Affordability
Ambulatory Health Care
592 $77,467 $1,614 Yes
Professional Services
329 $66,076 $1,377 Rental
Insurance Carriers 251 $61,898 $1,290 Rental Education 230 $26,440 $551 No Chemical Manufacturing
229 $63,265 $1,318 Rental
Hospitals 141 $63,374 $1,341 Rental Administrative 134 $33,029 $688 No Restaurant 96 $14,366 $299 No Nursing 80 $28,634 $597 No Retail Sales 63 $20,046 $418 No Paper Manufacturing
53 $56,039 $1,167 Rental
Source: EMSI, National Association of Realtors Assumptions: Mequon median value home of $342,800 at 5% interest rate for 30 years. Households pay 30% of income for housing. From a retail perspective, accommodating multifamily provides a more effective means to increase the spending power of the local population. In its simplest terms, if 2,000 new residents are required to support and additional retail development, achieving this level of growth could take 800 acres of 1-acre single family development, or one 30-40 acre multifamily or mixed residential community.
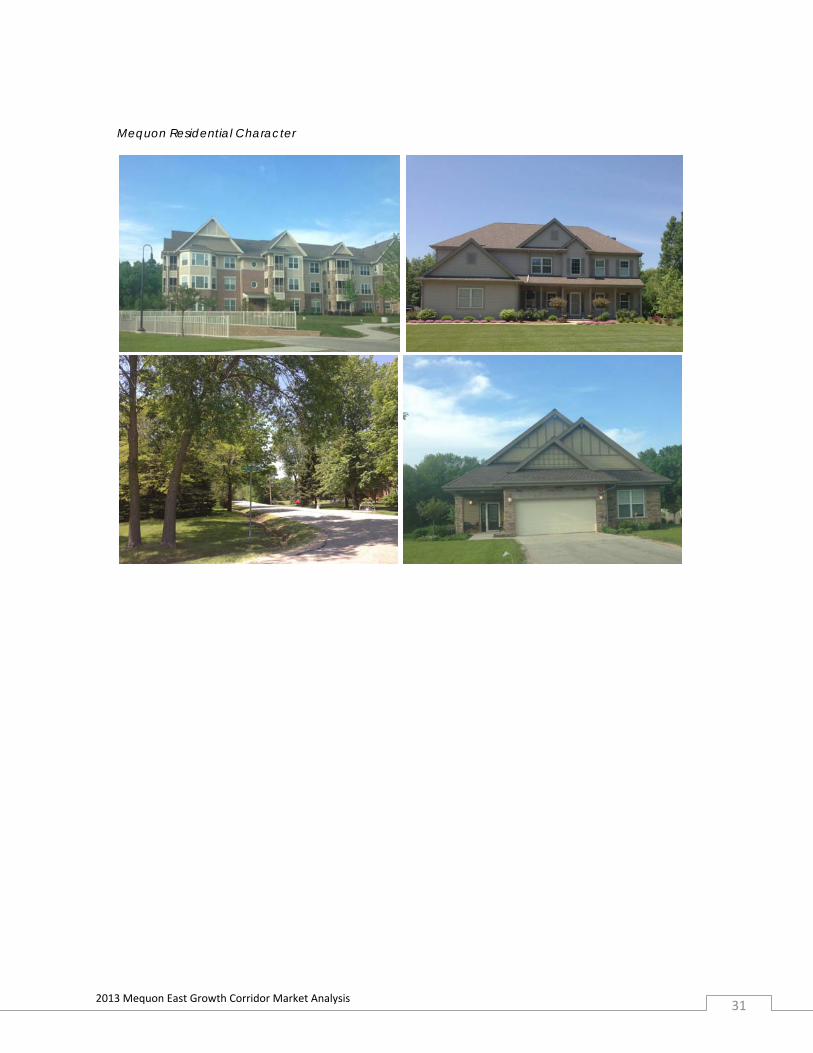
2013 Mequon East Growth Corridor Market Analysis 31
Mequon Residential Character

2013 Mequon East Growth Corridor Market Analysis 32
Chapter 6: Corridor Development Planning The market analysis information provided in chapters 3-5 provides a background for generating market-supported uses and square footage which could be accommodated within the City as a whole over the next five, ten and twenty years. However, not all of these uses either can be accommodated or are suitable for location within the study area. Additionally, the demand for various uses will occur at different points in time. This chapter explores the relationship between transportation, land use, infrastructure and market demands to indicate the anticipated nature and timing of development within the study area. Potential Development Uses The first step in assigning uses to individual areas within the study area is to assess the competitive position of the study area relative to other areas in the City or region. It is anticipated that some uses will be more attracted to or well-suited for the specific combination of amenities and assets within the study area, while other uses would be better suited to Town Center, the Mequon Business Park, or existing developments in nearby communities. Table 6.0 illustrates the relative competitiveness of properties within the study area for a variety of potentially supported market uses. Table 6.0: Competitive Position of Study Area by Use
Example Tenants Location Drivers Competitive Position of Study Area
Destination Entertainment/Retail
Full Service Restaurant, Theaters, Music Venues, Sporting Establishments
Trade Area Competition, Visibility, Traffic Counts
Strong – ability to differentiate from Grafton, Cedarburg and Existing Port Washington, improved access compared to Bayshore
Local/Neighborhood Retail
Grocery Shop, Café, Coffee Shop, Personal Services
Population Density, Consumer Spending Demand
Moderate – limited surrounding residential density. Potential to cluster around entertainment venue or hospitality, or following sufficient residential development.
Hospitality/Lodging Full Service Hotel, Boutique Hotel, Extended Stay Hotel
Market Competition, Visitor Traffic, Educational Institutions
Strong – limited market competition, presence of several demand generators, highway access.
Manufacturing Fabrication, Assembly, Distribution with more than 5 trucks per day
Workforce Availability, Transportation Access, Raw Materials, Vendors, Suppliers
Limited – production workforce access is limited. Significant competition for comparable access.
Office/Flex Medical, Technology, Finance, Insurance, Professional Services
Workforce Availability, Image, Customer Access
Strong – Technically skilled workforce, high visibility and image location.
Mixed-Use Multi-Family Senior Communities, Apartments, Condominiums, Duplex, Townhomes
Proximity to Employment Centers, Amenities
Moderate – Quality of Life amenities, natural areas strong. Strongest for family and empty nester populations.

2013 Mequon East Growth Corridor Market Analysis 33
The study area is a strong contender relative to other market options for uses in the destination entertainment, hospitality and office/flex sectors. Additional demand for local/neighborhood retail is also likely, provided that sufficient employment and residential base is developed prior to or in tandem with these types of spaces. Multifamily demand is currently strong for family or empty nester populations which would be most attracted to natural amenities. Demand is also strong for multifamily that accommodates the local workforce, however, current zoning makes construction of such units cost-prohibitive when compared to some nearby communities. Young professionals are being targeted by developments in the Town Center area in the near term, but could be an option for the study area as retail and entertainment options are added. In addition to determining which development types would be most attracted to and likely to succeed at a location within the study area, this study also considers the average development size required for each use. Developers and users typically prefer to provide a cluster of a particular use or several complementary uses as part of a development. Creating a concentrated pool of similar uses together helps to create a common experience, minimizes conflicts with adjacent uses, and can also create efficiencies by maximizing infrastructure investment and accommodating future growth requirements. An example of this clustering can be an office park which attracts a pool of local employees in specialized fields, provides individual companies with greater on site space flexibility (ability to expand and contract among several properties in the same location), and can accommodate multiple related tenants. Similarly, retailers benefit from a location in proximity to shops and services with a similar client base in order to achieve additional visibility and allow customers to combine trips and create a destination. Although there are multiple larger parcels or combinations of parcels potentially available for development within the study area, there are also a number of uses which are unlikely to be redeveloped within the time frame explored in this study. Additionally, the significant acreage dedicated to environmental corridors constrains development in certain areas. Table 6.1 uses construction industry trends to explore the average building size and development size for uses explored in this report. Average construction costs and development valuations are also indicated in the table, and will be used to estimate the potential impact of proposed development in the next section. Based on this information, it was determined that smaller parcels are unlikely to accommodate destination retail, manufacturing or office uses. This means, for instance, that the 7 developable acres available along the west side of Port Washington Road north of the hospital is likely to accommodate locally-oriented service or retail development, or potentially a small multifamily project. Similarly, there are few if any parcels which are suitably sized for a traditional manufacturing park. Those areas which are adequately sized lack the depth for internal truck circulation, requiring each business to provide direct access to Port Washington Road. This is undesirable for both businesses and the City, and would result in traffic congestion and increased truck idling. Table 6.1: Average Size and Acreage Required by Development Type
Use Average Building Square Feet
Acreage Required (per tenant)
Typical Development Size (cluster)
Total Construction Cost Per Square Foot
Median Development Value
Destination Entertainment/Retail
110,000 13-18 acres 30-80 acres $115-$158 $30 million
Local/Neighborhood Retail 5,000 1-3 acres 3-10 acres $199-$277 $2 million Hospitality/Lodging 65,000 3-5 acres varies $196-$272 $5 million Manufacturing 30,000 2-15 acres 15-100+ acres $118-$164 $35 million Office/Flex 20,000 2 acres 10-50 acres $195-274 $15 million Mixed-Use Multi-Family 35,000 2 acres 5-10 acres $148-$206 $20 million Assumptions: 2013 construction, mid-range finishes, Mequon market and Milwaukee MSA, 2-4 story maximum with surface parking Source: RS Means

2013 Mequon East Growth Corridor Market Analysis 34
A final consideration to development phasing is the identification of parcels which are unlikely to be redeveloped. These parcels include uses with high costs of relocation (such as a hospital or golf course), small sites which would not be essential to obtain to facilitate development (small residential lots) and parcels which are comprised largely of floodplain areas and owned by individual residents. Although any of these parcels could certainly be redeveloped within the next 20 years, any activity will be driven more by property owner interests rather than by market forces. These parcels, along with floodplain areas which will remain undeveloped are shown on Map 6.0.

2013 Mequon East Growth Corridor Market Analysis 35
Map 6.0: Location and Buildable Acreage of Likely Development Sites
Boundary of contiguous buildable acreage. Totals equal buildable acreage for each contiguous development area. Source: City of Mequon, Vierbicher
32 Acres
39 Acres
7 Acres
22
Acres
101
Acres
13
Acres
40
Acres
12
Acres
64
Acres
60
Acres

2013 Mequon East Growth Corridor Market Analysis 36
Projecting Future Market Demand Predicting future land uses and patterns requires a number of assumptions to be made. In the case of Mequon, all assumptions were based on the community’s stated desire to retain its existing character. To that end, all supply and demand variables remain constant in the future. These assumptions include the following:
57 percent of local consumer demand will be retained within the community. 89 percent of local residents will continue to commute elsewhere for employment, with 11 percent
of residents working locally. Current demographic trends will continue, with only 3 percent of middle aged individuals and 28
percent of younger (under 35) and older (aver 75) choosing to rent versus own. Mequon will continue to provide high end residential options for both single and multifamily
developments. Existing zoning requirements such as setbacks, open space requirements and minimum/maximum
square footage requirements remain in place. If the City opts in the future to pursue programs or strategies to promote working locally, shopping locally or to encourage residential developments targeting additional groups such as young professionals or families, the result in nearly all cases would be accelerated demand for development beyond what is projected here. Absorption Projections Absorption projections were developed for each land use individually. Projections are based on historic construction and absorption in the marketplace, projected employment growth, projected population growth and demographic changes. Within the study area, the impact of anticipated development was also evaluated to determine what additional demand for retail space could be supported through the addition of a local employment and residential node. 20-year demand projections for each use are provided in the following section, broken down by individual demand factors. It is important to remember that these totals are market supported totals only, and may not represent a desirable level of development for the City. Strategies for promoting desired development are discussed in Chapter 7.
Retail Components of retail demand include the following:
Consumer Demand Growth – Continues at Historic Average of 2.6 percent annually resulting in 30,385 new square feet of retail space per year
490,000 square feet of surplus demand currently exists within the submarket in locally attainable sectors. This square footage can be accommodated over the 20 years if suitable retail development is encouraged.
Demand from new residential development in the City (at historic annual pace) and within study area equal to 11,000 square feet of new retail space per year.
Additionally, 91,000 square feet of current vacancy will need to be absorbed in the submarket in order for significant new development activity to take place. This total has been subtracted from projections for the first five years.
Office/Flex Components of office demand include the following:
Historic annual new construction of 31,000 square feet per year. Expansion of office/flex space to accommodate projected 5-year growth projections,
which is equivalent to 27,000 square feet per year of new office/flex space.

2013 Mequon East Growth Corridor Market Analysis 37
Space expansion to accommodate growth in local workforce, where 11 percent of local workforce is employed within the community at industry standard 200 square feet per employee. Equivalent to15,500 square feet per year.
16,000 square feet of office space is currently planned within the City. This total has been subtracted from demand for the next five years. Single Family The pace of single family housing development in the City has been fairly consistent over the past few decades. Because of the limited land area available for new higher density residential subdivisions at this time, 69 annual housing starts are assumed for the City as a whole, which is comparable to trends over the past decade. Multifamily Components of future multifamily demand include the following:
Units to accommodate projected workforce growth, retaining 11 percent residency of workforce, and excluding those who can afford to purchase a home within the community. Equivalent of 6 units per year.
Units to accommodate growing senior population, retaining existing City ratio of 40 percent of households over aged 75 renting. 46 units per year in first five years and peaking at 15 years with 110 units per year.
179 units are currently permitted within the City. This number of units has been subtracted from demand for the next five years.
It is important to note that although the total potential development figures seem high when viewed from a 20-year perspective, the rate of growth proposed under this scenario is roughly equivalent to historic development patterns within the community, as indicated in Table 6.2. Table 6.2: Historic Absorption Trends 20-year Average Annual
Construction Market Supported Average
Annual Construction Retail 10,000 sq. ft. 56,000 sq. ft.* Office/Flex 31,200 sq. ft. 59,000 sq. ft.** Single Family 65 units 69 units Multifamily 35 units*** 132 units *Demand exceeds previous supply due to increased regional demand supported at two additional interchange developments. **Demand growth in office/flex is highest in later years. ***Current permitting of 179 units is roughly equivalent to 60 units per year In order to create a final development scenario, square footages are converted into acreages. Acreage conversions use Mequon’s current zoning code to determine the total building size and lot coverage allowed for each land use. For instance, Mequon’s business districts (B-1 through B-3) require 40 percent open space for each development. They also allow a 30 percent floor area ratio and maximum of 20,000-40,000 square feet per building, with slightly higher densities allowed as conditional uses. Under these regulations, and accounting for parking requirements, a one-acre lot could accommodate a 13,000 square foot building. Although the City has demonstrated a willingness to work with developers of desired projects to adjust current ratios, stated standards were applied to this concept. Retail regulations are similar to office district regulations. Multifamily districts assumed an average unit size of 1,476 square feet, which accounts for the City’s minimum unit square footages (900 square feet for one bedroom-1,300 square feet for 3 bedroom) and a ratio of common area per unit. Thirty percent lot coverage was also assumed for multifamily parcels. Single family districts assume a 1-acre lot size.

2013 Mequon East Growth Corridor Market Analysis 38
Table 6.3: Total Acreages Supported by Use (10 and 20-Year Demand Represents Cumulative Figures) 5-Year Demand 10-Year Demand 20-Year Demand Retail 11 36 86 Office/Flex 20 41 90 Single Family 346 656 1,276 Multifamily 30 90 297 Source: Vierbicher, City of Mequon Zoning

2013 Mequon East Growth Corridor Market Analysis 39

2013 Mequon East Growth Corridor Market Analysis 40
Chapter 7: Future Development Concept Three initial concept plans were developed as part of the planning process. The concept plans depicted realistic visions for what could be developed within the corridor in the future. The plans were evaluated based on their ability to meet financial and community objectives. From these initial concepts, which are provided in the appendix, a preferred plan was generated which reflects the scenario that can be accommodated by the market and achieves the greatest net benefit for the City. A weighted ranking matrix was used to help understand the comparative value of different scenarios. Weighting factors included less tangible items such as alignment with public desires, promoting natural amenities, and accommodating locally supported retailers as well as financial costs and fiscal benefits. This weighted matrix is also provided in the appendix. At present, properties within the study area are not zoned for commercial uses, do not have access to municipal utilities to support higher density development, and are largely planned for five-acre residential development in the City’s Future Land Use Map. This situation has led to the current underdeveloped nature of the corridor. However, as development has continued elsewhere in the I-43 corridor, including significant development in Grafton, there will be continued pressure to increase the utility of properties in the study area. Under the current conditions, this will occur as a gradual increase in low-density and low-impact uses (such as churches and contractors). This continued growth could ultimately comprise a majority of developable land within the study area. Although this development would not require any activity or investment on the part of the City, it does not produce the greatest return from this potentially high value area within the City. This chapter discusses components of the preferred development scenario, identifies potential challenges associated with successfully encouraging development patterns in line with this scenario, and identifies potential strategies for addressing and mitigating these challenges.
Land Use and Infrastructure Planning The City of Mequon has multiple mechanisms to encourage and shape growth in the corridor. Three of the most significant tools are the City’s Comprehensive Plan, infrastructure planning (including transportation and utilities), and zoning. These tools offer opportunities to influence, regulate and impact the nature and pace of development in the corridor. Several commonly used techniques for employing these tools are described below.
Comprehensive Plan The City of Mequon participated in a cooperative Comprehensive Planning effort with the Southeastern Wisconsin Regional Planning Commission (SEWRPC) and 13 other local governments in Ozaukee County. A Land Use Plan was created as part of the process. Under Wisconsin State Statutes, the City’s land division and zoning activities must be consistent with the Comprehensive Plan. The City will need to amend the Comprehensive Plan’s Future Land Use Map to reflect the preferred land development scenario contained within this document. Some edits to the Plan text may also be needed to accommodate future land uses described in this Plan. For example, this document designates areas for “mixed residential” development, which may include multifamily, duplex, and single family. There are no equivalent designations in the Comprehensive Plan.
Incorporation of the land use portion of this plan into the City’s Comprehensive Plan will strengthen the City’s ability to implement the recommendations in this document.
Infrastructure Planning Availability of infrastructure is a critical component in development decision-making by property owners. The presence of sewer and water infrastructure makes the underlying land more valuable and significantly impacts the type and density of development which can occur on adjacent property. The City of Mequon has historically required developers to contribute the cost of extending initial infrastructure and received repayment from adjacent property owners as development occurs. This model is fairly effective in situations where infrastructure planning is straightforward, but is complicated in the Port Washington corridor by the

2013 Mequon East Growth Corridor Market Analysis 41
scale of expansion required and number of parcels with limited connection potential in some sections (i.e. DNR land, churches). Additionally, the City is currently in the process of planning to address City-wide infrastructure issues associated with sanitary sewer capacity which will likely require additional off-site improvements prior to, or simultaneously with, infrastructure extension along Port Washington Road. The total cost of extension and anticipation of municipal cooperation and/or assistance will need to be fairly certain if developers are expected to provide the upfront initiative for infrastructure investment. Additionally, they are unlikely to pay the full cost of improvements that will benefit other properties without having a reimbursement agreement in place. As the City studies infrastructure options for the study area, it should also consider the need for and timing of longer-term initiatives, such as the extension of utilities under I-43, which could influence municipal preferences for future infrastructure capacity and location.
An additional concern for the City is the impact that a lack of infrastructure in the corridor may have on development trends. It has already become clear that entities view the corridor as desirable from a commercial perspective, and as growth extends north along I-43 this demand will become more acute. If no plans for infrastructure extension are in place, property owners may choose to pursue lower value development in the near term rather than continuing to hold out for utility service. The spread of this lower value development will ultimately limit the future development potential of the corridor and make it harder for the private sector to support any meaningful portion of infrastructure extension costs as part of individual projects by limiting the number of future users available to repay the initial investment.
Using the annual absorption projections from Chapter 6, it is estimated that it would take 50 years to extend service fully within the study area on a strictly incremental basis. The presence of significant chunks of environmental corridors and parcels with limited development potential in the center of the corridor are significant limitations to service expansion.
For the purposes of this planning exercise, the Council has elected to model development planning assuming that infrastructure extension along the entire length of Port Washington Road to Pioneer Road is completed within a 5-10 year timeframe. This extension effectively serves the entire corridor with sewer and water infrastructure. The only exception to this is the roughly 76 acres of buildable land located west of the environmental corridor and alongside Oriole Lane. It has been determined to be cost prohibitive to serve these sites with municipal utilities at densities acceptable to nearby residents. However, 1-acre lots on private systems are acceptable, and are assumed to be the highest value use available for this area.
In order to determine the magnitude of demand required to reasonably support the cost of infrastructure extension, two different scenarios were considered, as described below.
Scenario 1: Tax Increment Finance
Under this scenario, the City of Mequon would assist a private developer in extending water and sewer service along the length of Port Washington Road at a total cost of $8 million. The City would establish a mixed-use Tax Increment District (TID) which encompasses the corridor. The City could then either choose to borrow the money at a low interest rate to fund utility extension, or to execute a developer agreement under which the developer pays for utility extension and is repaid over time for the investment with a portion of the increased property tax resulting from the development. By creating a TID, the City is able to capture all of the property tax dollars from the new development for a period of time and use this increased revenue to pay for the necessary infrastructure without which the development could not occur.
In order for a TID to be a realistic option, the project creating the need for the expenditure would need to generate sufficient property value to cover the cost of infrastructure within a reasonable period (assumed to be 13 years in this scenario). Using Mequon’s current mill rate and the average value of recently developed representative retail and office properties, it would require $53 million
2013 Mequon East Growth Corridor Market Analysis 42
in assessed value from new development, equivalent to 35 acres of retail development or 70 acres of office/flex development as part of the initial development to generate sufficient increment to justify the expense. Note that the developer-led model which repays the developer over time for the cost of infrastructure extension would expose the City to less risk, but would also significant reduce the amount of surplus increment from the project available to fund other projects within the corridor (such as an interchange).
Scenario 2: Build & Contribute or Property Assessment
As with the TID scenario, the second scenario is the result of a partnership between the City and a developer, with either party serving as the initial funder of the infrastructure extension. The scenario assumes that a developer will take the lead in extending infrastructure within the corridor, paying one-third of the initial cost of extension as part of the initial development planning. It is assumed that the City will incur the cost of other improvements and upsizing of pipes to accommodate future capacity needs in the corridor, which is estimated to represent an additional one-third of the total project cost. The remaining cost would be borrowed by the City, Utility or developer and repaid by remaining land owners as they elect to develop and connect to the existing system. Under this model, using representative development values as a basis for comparison, a developer would need to generate $68 million in new development value, equivalent to 55 acres of retail development or 110 acres of office development. Remaining property owners would then be required to pay between $18,000 and $20,000 per buildable acre in order to develop using municipal infrastructure in the future. The higher end of the range represents the cost of repayment under a build-contribute model to account for the developer’s higher cost of borrowing.
The City can elect to pursue a combination of the above scenarios, although the portion of the project paid for using TID funding must be separate from costs recovered through assessments. The most likely method would be to pay for extraordinary costs (such as lift stations) with TID funds, and then use an assessment to pay for the more typical cost of extension of basic infrastructure. However, under state statues, TID funds cannot be used to offset user fees that are otherwise required for projects. It is also important to note that under both of these scenarios, the ability to create higher density development at the Pioneer Road Interchange would significantly reduce the acreage required to justify utility extension, and would increase the incentive for private developers to pursue this mechanism, once infrastructure planning is complete.
Interchange Planning Many factors point to the likelihood of a future interchange at Highland Road, although the timing of construction will depend on a number of cost and scheduling variables. The presence of this interchange, if it occurs within the next 10 years, creates an opportunity for development of a significant retail and commercial node at the Highland Road intersection, especially given the presence of Concordia University of Wisconsin and St. Mary’s Hospital. The presence of these institutions significantly enhances the retail and destination visitor market at this intersection, making it desirable for hotels, restaurants and regional retailers. Without this interchange, these uses will focus on Pioneer Road as the only viable alternative. Knowledge about future DOT plans will allow potential tenants to plan for a location at whichever interchange is best suited to their business. This knowledge will also assist the City in planning for the impact on Port Washington Road. If the interchange is not added at Highland Road, traffic patterns at the Mequon Road and Port Washington Road intersection are expected to cause a decrease in the level of service at the Mequon Road interchange, impacting its function as a convenience retail node. Similarly, if the interchange is added, retail uses currently located elsewhere on the Port Washington Corridor may seek to relocate to newer or more visible space which also provides access to a greater regional market. In either case, existing developments on Port Washington Road may experience temporary vacancies. Supporting these property owners and encouraging property renovations to improve the functionality of properties or attract a new set of tenants may be required to help properties transition to new uses.
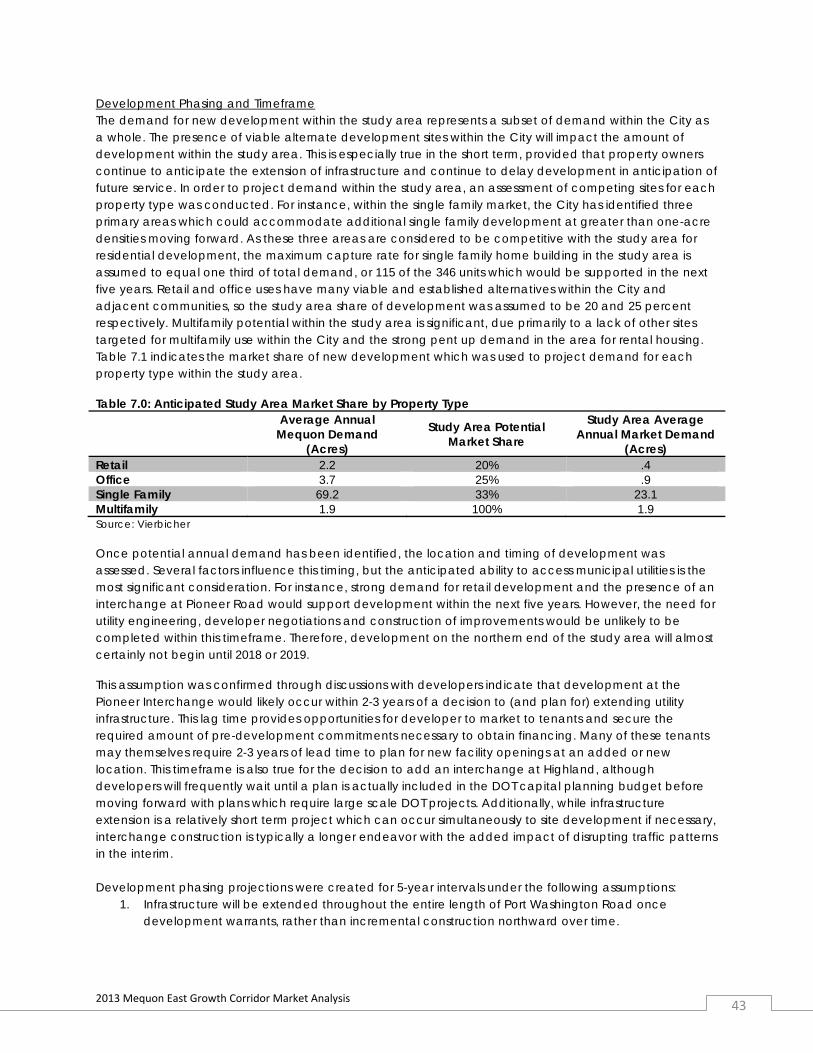
2013 Mequon East Growth Corridor Market Analysis 43
Development Phasing and Timeframe The demand for new development within the study area represents a subset of demand within the City as a whole. The presence of viable alternate development sites within the City will impact the amount of development within the study area. This is especially true in the short term, provided that property owners continue to anticipate the extension of infrastructure and continue to delay development in anticipation of future service. In order to project demand within the study area, an assessment of competing sites for each property type was conducted. For instance, within the single family market, the City has identified three primary areas which could accommodate additional single family development at greater than one-acre densities moving forward. As these three areas are considered to be competitive with the study area for residential development, the maximum capture rate for single family home building in the study area is assumed to equal one third of total demand, or 115 of the 346 units which would be supported in the next five years. Retail and office uses have many viable and established alternatives within the City and adjacent communities, so the study area share of development was assumed to be 20 and 25 percent respectively. Multifamily potential within the study area is significant, due primarily to a lack of other sites targeted for multifamily use within the City and the strong pent up demand in the area for rental housing. Table 7.1 indicates the market share of new development which was used to project demand for each property type within the study area.
Table 7.0: Anticipated Study Area Market Share by Property Type Average Annual
Mequon Demand (Acres)
Study Area Potential Market Share
Study Area Average Annual Market Demand
(Acres) Retail 2.2 20% .4 Office 3.7 25% .9 Single Family 69.2 33% 23.1 Multifamily 1.9 100% 1.9 Source: Vierbicher
Once potential annual demand has been identified, the location and timing of development was assessed. Several factors influence this timing, but the anticipated ability to access municipal utilities is the most significant consideration. For instance, strong demand for retail development and the presence of an interchange at Pioneer Road would support development within the next five years. However, the need for utility engineering, developer negotiations and construction of improvements would be unlikely to be completed within this timeframe. Therefore, development on the northern end of the study area will almost certainly not begin until 2018 or 2019.
This assumption was confirmed through discussions with developers indicate that development at the Pioneer Interchange would likely occur within 2-3 years of a decision to (and plan for) extending utility infrastructure. This lag time provides opportunities for developer to market to tenants and secure the required amount of pre-development commitments necessary to obtain financing. Many of these tenants may themselves require 2-3 years of lead time to plan for new facility openings at an added or new location. This timeframe is also true for the decision to add an interchange at Highland, although developers will frequently wait until a plan is actually included in the DOT capital planning budget before moving forward with plans which require large scale DOT projects. Additionally, while infrastructure extension is a relatively short term project which can occur simultaneously to site development if necessary, interchange construction is typically a longer endeavor with the added impact of disrupting traffic patterns in the interim. Development phasing projections were created for 5-year intervals under the following assumptions:
1. Infrastructure will be extended throughout the entire length of Port Washington Road once development warrants, rather than incremental construction northward over time.

2013 Mequon East Growth Corridor Market Analysis 44
2. Development of currently un-served properties will occur 2-3 years after infrastructure planning is complete.
3. An interchange will be added at Highland Road 15-20 years in the future. 4. Development will occur based on marketability and risk associated with development sites in the
following manner: a. Undeveloped parcels with highest market potential and existing utility infrastructure, b. Undeveloped parcels with lesser visibility parcels with existing utility infrastructure, c. Undeveloped parcels with highest market potential following utility extension, d. Undeveloped parcels with lesser visibility or access following utility extension, e. Parcels with extremely limited visibility/access and/or sites requiring redevelopment.
5. Parcels in non-served areas remain largely undeveloped until infrastructure extension occurs. Map 7.0 shows the most likely development phasing within the study area under these assumptions. Under this scenario there are 98 acres of developable land (excluding existing retained uses) which would remain undeveloped at the end of 20 years. This number would shrink to approximately 20 acres within 30 years, with full buildout anticipated in approximately 35 years (by 2050). Note that acreages shown represent total development size and relatively location, but may not correlate to current parcel boundaries.

2013 Mequon East Growth Corridor Market Analysis 45
Map 7.0: Anticipated Development Timing Within Study Area

2013 Mequon East Growth Corridor Market Analysis 46
Potential Obstacles and Recommended Strategies As with any long range planning exercise, there are a number of potential challenges which will be faced by the City in successfully implementing the desired vision for the corridor. Some of these challenges may be associated with market conditions and timing of development, some with conflicts between property owner desires and municipal interests, and still others as the result of the City’s desire to guide economic forces. Many of these obstacles can be removed or mitigated through early stage planning. This section is devoted to outlining some of the potential challenges which have been identified through this process, and recommending potential strategies which the City can employ to successfully address these issues. Several recommended strategies have the potential to address multiple challenges within the corridor, while others may have more limited effect or be best suited for long-term implementation. A timeline is provided at the end of this chapter which indicates the sequence and timing of various recommendations over the next three years. Challenge #1: Supporting desired land uses through municipal zoning code and regulatory policy Overview: Permitted land uses within the corridor will need to be redefined from the existing 5-acre residential designation. Identifying and defining preferred uses for individual parcels will represent a significant first step in shaping future development planning. Strategies:
The most basic strategy associated with land use regulation is to update the City’s Comprehensive Plan and land use map to reflect desired land uses within the study area. By identifying the desired type and location of uses, the City will make it easier for property owners to move forward with development. The City’s existing zoning districts are adequate to implement the land use map edits proposed for the Comprehensive Plan. Some minor modifications to streamline the City’s code and reduce complexities may be necessary for some districts to fully implement this document. Additional guidance for development within the study area can be provided within a specific Corridor Plan.
Allow higher-density multifamily development. Current zoning regulations make it difficult to achieve the density needed to offset development costs and result in lower property values that do not generate sufficient property tax revenues to justify infrastructure extension. For example, the minimum unit size limits the number of smaller studio or one bedroom units which can be included within a development. These units are the most profitable on a per square foot basis for apartment owners, and accommodating higher value smaller units can actually facilitate higher image but lower profit penthouse type units.
o Increasing density could be achieved through a combination of lowering greenspace requirements, increasing the maximum floor area ratio, decreasing parking requirements, increasing height limits, and decreasing setbacks.
Allow taller buildings in the B-2 district if hotels are a desired land use. Many hotels look to develop at four stories, which is not allowed by Mequon’s code. Additionally, accommodating taller structures adjacent to the Interstate may also help to buffer highway noise from adjacent uses.
o Other regulations, such as the 40% open space ratio and Floor Area Ratio (FAR), could also be modified to use hotel development as an anchor for additional smaller retail space. Hotels can serve as a reliable source of customer traffic, and can also benefit from a location with adjacent walkable dining and entertainment.

2013 Mequon East Growth Corridor Market Analysis 47
Many national hotel chains look to develop at four stories, even in suburban highway-oriented locations. This Hilton Garden Inn in Middleton, WI is located close to a highway interchange and adjacent to a retail/restaurant area (top of the photo), with a strong pedestrian connection between hotel and retail. Regional stormwater management allows for higher density, which results in higher property values (the 2.6 acre site is assessed at $8.6 million).
The recently built Elmore Marketplace in Davenport, Iowa, uses a hotel to anchor a smaller retail development to generate retail traffic.
Challenge #2: Promote small and local retail and service businesses and accommodate market supported uses within the study area. Overview: Mequon residents have indicated strong support for small and local retailers over large national chains. There are significant opportunities to add market-supported retail uses within the study area. However, smaller retailers prefer locations adjacent to major traffic generators to increase exposure and foot traffic. Strategies:
Allow larger retail stores via conditional use permits to anchor retail developments. Larger stores, especially grocery stores, are often necessary as anchors to a community shopping center and are desired by local businesses to attract customers. Hotels can also serve as anchors for retail

2013 Mequon East Growth Corridor Market Analysis 48
developments (see Challenge #1). The community could still ensure a high level of site and building design via the CUP process.
Accommodate higher density residential or commercial development to create a concentration of users within an immediate trade area. Employees and residents located within walking distance of retail amenities are more than twice as likely to patronize these establishments. Using cluster zoning strategies (discussed in Challenge #6) or allowing apartment or office/flex development adjacent and connected to smaller retail clusters can boost the spending potential of residents or workers and increase the potential to support small business growth. Fully taking advantage of interaction between higher-density residential and nearby commercial will require a commitment to pedestrian-friendly design and interconnectivity of sites on the part of the developers and the City.
Challenge #3: Infrastructure costs are too great for developer-led project. Overview: Mequon has historically relied on privately funded developments to fund infrastructure expansion. However, limited near term demand for infrastructure in the southern portion of the study area and the presence of significant non-users (such as the DNR) in the central corridor significantly increase the cost of expansion to parcels with near term development potential. Strategies:
In order for a private developer to be able to support a majority (or all) of the cost of infrastructure expansion, they will need to be relatively certain that the City will support the project, as development planning on such a large scale requires significant up-front costs. Having a policy in place which indicates the conditions under which the City would support or financially assist with infrastructure expansion is a critical factor in property owner decision making. Additionally, under a developer-financed infrastructure scenario, the proposed development will need to financially support the sizeable cost of infrastructure, with an investment value of at least $75 million in value within a relatively short timeframe. The developer would need to repay infrastructure loans for the infrastructure extension, and would need to be fairly certain that additional development would occur in subsequent years to assist in repaying these loans. In order for this type of development to move forward, the City would need to accommodate suitably high density development to support this level of investment as part of a single development project. This would most typically be associated with large institutional or retail/entertainment developments, which tend to produce the highest investment value per acre. Expanding the City’s transfer of development rights policy to increase allowable density in certain areas could also make this level of investment possible with alternate development types.
Alternatively, the City could consider creation of a tax increment district to offset some infrastructure costs. The City can recoup expenditures on infrastructure much faster when a TID is in place. This strategy should be used if a suitably sized development (or series of developments) is likely to occur within a relatively short time frame (i.e. five years). Regardless of whether or not a TID is created, the City should expend funds on infrastructure only when sufficient development justifies the expenditures.
The City or utility could also participate in infrastructure extension by funding the initial cost of infrastructure extension through borrowing. The City’s lower interest rate would reduce the total project cost, and therefore the level of private investment necessary to support the infrastructure project. Under this model, the City/utility could assess property owners who benefit from infrastructure installation for their proportional benefit. Properties that do not develop as part of the infrastructure expansion can have deferred assessments. The City may consider excluding tax-
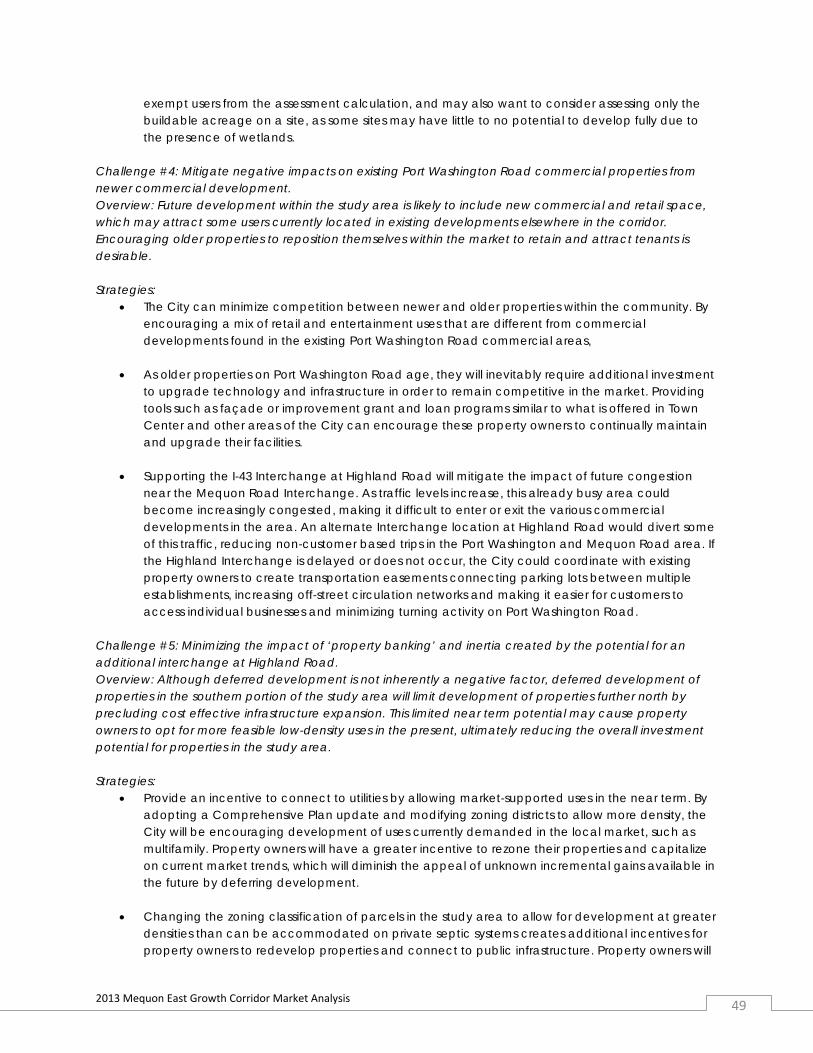
2013 Mequon East Growth Corridor Market Analysis 49
exempt users from the assessment calculation, and may also want to consider assessing only the buildable acreage on a site, as some sites may have little to no potential to develop fully due to the presence of wetlands.
Challenge #4: Mitigate negative impacts on existing Port Washington Road commercial properties from newer commercial development. Overview: Future development within the study area is likely to include new commercial and retail space, which may attract some users currently located in existing developments elsewhere in the corridor. Encouraging older properties to reposition themselves within the market to retain and attract tenants is desirable. Strategies:
The City can minimize competition between newer and older properties within the community. By encouraging a mix of retail and entertainment uses that are different from commercial developments found in the existing Port Washington Road commercial areas,
As older properties on Port Washington Road age, they will inevitably require additional investment to upgrade technology and infrastructure in order to remain competitive in the market. Providing tools such as façade or improvement grant and loan programs similar to what is offered in Town Center and other areas of the City can encourage these property owners to continually maintain and upgrade their facilities.
Supporting the I-43 Interchange at Highland Road will mitigate the impact of future congestion
near the Mequon Road Interchange. As traffic levels increase, this already busy area could become increasingly congested, making it difficult to enter or exit the various commercial developments in the area. An alternate Interchange location at Highland Road would divert some of this traffic, reducing non-customer based trips in the Port Washington and Mequon Road area. If the Highland Interchange is delayed or does not occur, the City could coordinate with existing property owners to create transportation easements connecting parking lots between multiple establishments, increasing off-street circulation networks and making it easier for customers to access individual businesses and minimizing turning activity on Port Washington Road.
Challenge #5: Minimizing the impact of ‘property banking’ and inertia created by the potential for an additional interchange at Highland Road. Overview: Although deferred development is not inherently a negative factor, deferred development of properties in the southern portion of the study area will limit development of properties further north by precluding cost effective infrastructure expansion. This limited near term potential may cause property owners to opt for more feasible low-density uses in the present, ultimately reducing the overall investment potential for properties in the study area. Strategies:
Provide an incentive to connect to utilities by allowing market-supported uses in the near term. By adopting a Comprehensive Plan update and modifying zoning districts to allow more density, the City will be encouraging development of uses currently demanded in the local market, such as multifamily. Property owners will have a greater incentive to rezone their properties and capitalize on current market trends, which will diminish the appeal of unknown incremental gains available in the future by deferring development.
Changing the zoning classification of parcels in the study area to allow for development at greater
densities than can be accommodated on private septic systems creates additional incentives for property owners to redevelop properties and connect to public infrastructure. Property owners will

2013 Mequon East Growth Corridor Market Analysis 50
naturally seek the highest value for their property, and increasing the incremental return available as a result of redevelopment can encourage property owners to consider redevelopment earlier than would be expected if the pool of likely purchasers was limited to low-density user groups.
Proactively expanding infrastructure within the study area will increase the development options available to properties throughout the study area in the near term, decreasing the likelihood that property owners will attract low density uses as properties are transferred. In place infrastructure will also reduce the up-front investment otherwise required to pursue development on smaller parcels.
Challenge #6: Preserve open space and natural areas within the corridor to increase access to natural amenities and enhance the City’s open space network. Overview: The natural area along Ulao Creek presents a significant open space opportunity within the study area. Although current City zoning requires a significant open space requirement, providing privately owned open space on a per-parcel basis, such as lawns and buffer strips, does not maximize the value of this area to the community. Strategies:
Create a conservation subdivision ordinance which accommodates cluster development. While the City is already familiar with this style of development for residential uses, there is no section of the land division ordinance that provides a process and requirements for conservation subdivisions. The ordinance simply states that the City may require developers to use the PUD process for a cluster subdivision if it is preferable to traditional platting. If the City wants to preserve open space in the area it should have an approval process that lays out specific requirements and creates a predictable process, which makes the desired type of development easier than less desired types of development. Having regulations and a process for conservation developments lends more surety to the development process than requiring PUDs for each separate development, especially if multiple owner-occupied properties are anticipated (as in an office park).
Allow for common open space to offset lower individual lot open space requirements. A system of common open space that preserves desirable landscape features can lead to higher property values than simply requiring 40 percent open space on each lot. A connected open space system also reduces fragmentation of habitat. This strategy goes hand-in-hand with development of a conservation subdivision ordinance. Additionally, promoting an active recreation and park space system adjacent to commercial developments can help set Mequon apart as a professional destination and attract companies who place corporate value environmental preservation and healthy lifestyles.
Although ultimately the City will seek to acquire and dedicate park space within the study area, it will be more cost effective to pursue easements and dedicate park space as properties begin to develop. If an adopted park and open space plan is in place for the study area, developers can be encouraged to dedicate trail networks, park space or shared storm water management areas to the City in exchange for higher density development and/or in lieu of park fees. The City can then pursue strategic acquisition of easements or parcels which provide the best connections between and access to these larger regional networks.
Promote shared stormwater detention throughout the corridor to utilize natural features and preserve water quality and natural areas within the study area. Shared stormwater systems can be designed to create a more natural riparian system, providing suitable wildlife habitat. Shared stormwater areas can also qualify as open space under cluster development plans, further increasing the quality of environmental corridors accessible to the public.
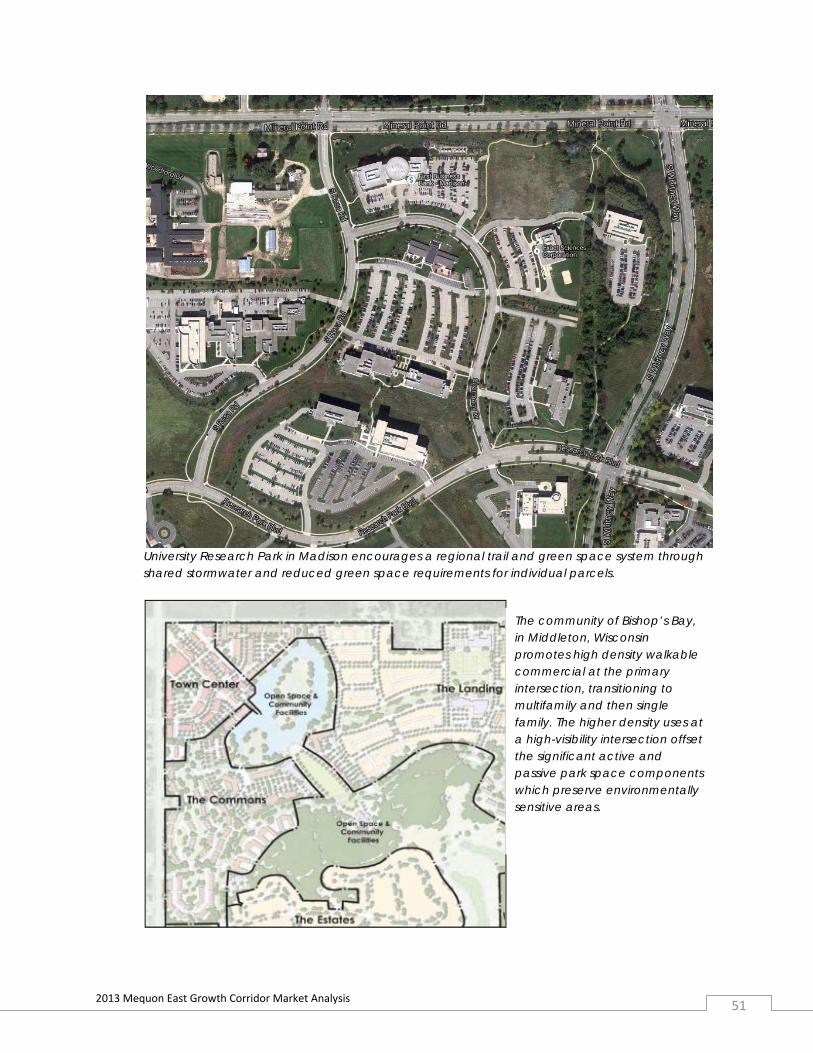
2013 Mequon East Growth Corridor Market Analysis 51
University Research Park in Madison encourages a regional trail and green space system through shared stormwater and reduced green space requirements for individual parcels.
The community of Bishop’s Bay, in Middleton, Wisconsin promotes high density walkable commercial at the primary intersection, transitioning to multifamily and then single family. The higher density uses at a high-visibility intersection offset the significant active and passive park space components which preserve environmentally sensitive areas.

2013 Mequon East Growth Corridor Market Analysis 52
Next Steps The recommendations provided in this chapter identify a number of activities which need to be undertaken by the City to continue the process of development planning for the East Growth Area. In addition to this study, the City has several engineering initiatives which are currently underway, and which will provide further information to inform the decision process. These studies are anticipated to be completed by the end of the year. Additionally, the state Department of Transportation will have finalized its preferred improvement plan for the I-43 corridor adjacent to the study area in early 2014. This decision will also shape the nature and timing of development within the study area. Although existing initiatives will provide critical pieces of information necessary for the City’s capital planning, it is also important that the City maintain the sense of progress and momentum that have been created by the various east corridor growth initiatives to date. There are numerous property owners interested in pursuing future development within the study area that are looking for guidance from the City in order to formalize their plans. Continued efforts by the City to provide consistent and reasonable timelines for various planning efforts with the involvement of these stakeholders will reassure investors that the City is serious about making improvements to the area that will result in better development prospects for both landowners and the City. Table 7.1 summarizes the sequence of steps which are necessary to continue to make progress in the area over the next three years. Depending on the results of engineering studies and capital planning implications, this process may occur over a shorter timeframe, but conservative estimates are used to allow the City to remain on track in the event of currently unknown elements. Projections developed within the study assumed that infrastructure expansion could occur by the end of 2018. This timeframe provides a reasonable level of assurance that development can move forward simultaneously with infrastructure planning without causing property owners to miss opportunities associated with a recovering economy. Table 7.1: Study Area Planning Next Steps 2013 2014 2015 2016 Complete engineering study to identify costs and preferred strategy for utility extension x
Identify funding for downstream improvements necessary to support infrastructure expansion within the City. x
Work with DOT to formalize plan for future I-43 Interchange locations, layouts and funding. x x
Amend Comprehensive Plan to adopt revised land use plan as identified in this study. x
Review and amend zoning ordinance and subdivision ordinance as necessary to accommodate desired uses, achieve preferred development, and make zoning/subdivision ordinances consistent with the Comprehensive Plan. - Zoning changes for properties with infrastructure in place or which
are not anticipated to be served in the future should occur in the near term.
x
Create work group to coordinate transportation and infrastructure planning activities in the study area. Include County, State and City staff and property owners, and potentially the City of Grafton.
- Identify timing and nature of planned capital investments to maximize efficient infrastructure investment, including planning for long-term municipal infrastructure objectives.
x x

2013 Mequon East Growth Corridor Market Analysis 53
Evaluate options and consider adopting municipal policy regarding contribution to infrastructure extension along Port Washington Road.
- Work with property owners/developers to identify feasible level of investment required to facilitate financially responsible infrastructure investment.
x
Conduct traffic study on Port Washington to determine impact of preferred development and identify need for and timing of enhancements
x
Complete & Adopt Corridor Plan based on work done to date. Incorporate information on location, size and aesthetics of preferred development.
- Include preferred design, massing, cross sections and public open space amenities for individual geographies within the study area.
- Consider integrating stormwater management into the corridor plan to allow for potential regional stormwater management solutions (rather than site-by-site).
x x
Pursue municipal acquisition of easements or park space within identified public open space corridors as development occurs. x x
Pursue infrastructure extension payment agreements with property owners along corridor. x x
Private development negotiations and activity. x

2013 Mequon East Growth Corridor Market Analysis 54
Appendix Retail Supply and Demand Gap Analysis Initial Concept Scenarios Weighted Valuation Matrix

NAICS Number of
44- 20444-45 164
722 40NAICS Number of
441 10
4411 44412 24413 4442 6
4421 24422 44431 7444 12
4441 74442 5445 10
4451 64452 44453 0
446,4461 13447 4471 9Gasoline Stations $44 506 667 $29 532 975 $14 973 692 20 2
Beer, Wine & Liquor Stores $3,191,952 $0 $3,191,952 100.0Health & Personal Care Stores $35,145,639 $31,694,123 $3,451,516 5.2
Grocery Stores $58,029,279 $33,454,816 $24,574,463 26.9 Specialty Food Stores $1,346,097 $408,530 $937,567 53.4
Lawn & Garden Equip & Supply Stores $2,263,444 $2,739,882 -$476,438 -9.5Food & Beverage Stores $62,567,327 $33,863,346 $28,703,981 29.8
Bldg Materials, Garden Equip. & Supply Stores $15,938,675 $4,727,056 $11,211,618 54.3 Bldg Material & Supplies Dealers $13,675,230 $1,987,174 $11,688,056 74.6
Home Furnishings Stores $3,336,791 $7,612,233 -$4,275,442 -39.0Electronics & Appliance Stores $12,875,391 $1,677,203 $11,198,188 76.9
Furniture & Home Furnishings Stores $8,554,162 $9,314,489 -$760,326 -4.3 Furniture Stores $5,217,372 $1,702,256 $3,515,116 50.8
Other Motor Vehicle Dealers $5,520,711 $7,381,522 -$1,860,811 -14.4 Auto Parts, Accessories & Tire Stores $5,563,983 $622,168 $4,941,815 79.9
Motor Vehicle & Parts Dealers $73,817,313 $56,395,692 $17,421,621 13.4 Automobile Dealers $62,732,619 $48,392,002 $14,340,617 12.9
Demand Supply Retail Gap Leakage/SurpluIndustry Group (Retail Potential) (Retail Sales) Factor
Total Retail Trade $388,425,052 $189,930,056 $198,494,995 34.3Total Food & Drink $43,111,716 $41,620,928 $1,490,788 1.8
Industry Summary (Retail Potential) (Retail Sales) FactorTotal Retail Trade and Food & Drink $431,536,768 $231,550,985 $199,985,783 30.2
2012 Population 26,7062012 Households 10,1702012 Median Disposable Income $64,7562012 Per Capita Income $42,135
Demand Supply Retail Gap Leakage/Surplu
Area: 48.18 Square Miles
Summary Demographics
Retail MarketPlace ProfilePolygon_2
447,4471 9448 29
4481 184482 34483 8451 20
4511 154512 5452 0
4521 04529 0453 40
4531 74532 104533 44539 19454 8
4541 04542 04543 8722 40
7221 157222 127223 57224 8
©2013 Esri www.esri.com/ba 800-447-9778 Page 1 of 2
Source: Esri and Dun & Bradstreet. Copyright 2012 Dun & Bradstreet, Inc. All rights reserved.
June 17, 2013Made with Esri Business Analyst
Drinking Places - Alcoholic Beverages $2,924,805 $3,584,165 -$659,360 -10.1Data Note: Supply (retail sales) estimates sales to consumers by establishments. Sales to businesses are excluded. Demand (retail potential) estimates the expected amount spent by consumers at retail establishments. Supply and demand estimates are in current dollars. The Leakage/Surplus Factor presents a snapshot of retail opportunity. This is a measure of the relationship between supply and demand that ranges from +100 (total leakage) to -100 (total surplus). A positive value represents 'leakage' of retail opportunity outside the trade area. A negative value represents a surplus of retail sales, a market where customers are drawn in from outside the trade area. The Retail Gap represents the difference between Retail Potential and Retail Sales. Esri uses the North American Industry Classification System (NAICS) to classify businesses by their primary type of economic activity. Retail establishments are classified into 27 industry groups in the Retail Trade sector, as well as four industry groups within the Food Services & Drinking Establishments subsector. For more information on the Retail MarketPlace data, please view the methodology statement at http://www.esri.com/library/whitepapers/pdfs/esri-data-retail-marketplace.pdf.
Limited-Service Eating Places $21,605,734 $10,836,822 $10,768,912 33.2 Special Food Services $1,901,364 $9,154,628 -$7,253,264 -65.6
Food Services & Drinking Places $43,111,716 $41,620,928 $1,490,788 1.8 Full-Service Restaurants $16,679,812 $18,045,313 -$1,365,501 -3.9
Vending Machine Operators $1,557,945 $0 $1,557,945 100.0 Direct Selling Establishments $4,621,246 $2,083,070 $2,538,176 37.9
Nonstore Retailers $33,416,950 $2,083,070 $31,333,880 88.3 Electronic Shopping & Mail-Order Houses $27,237,760 $0 $27,237,760 100.0
Used Merchandise Stores $1,491,558 $264,941 $1,226,617 69.8 Other Miscellaneous Store Retailers $3,490,507 $1,896,227 $1,594,280 29.6
Florists $525,532 $1,017,668 -$492,136 -31.9 Office Supplies, Stationery & Gift Stores $2,772,381 $3,112,141 -$339,760 -5.8
Other General Merchandise Stores $30,863,826 $0 $30,863,826 100.0Miscellaneous Store Retailers $8,279,978 $6,290,977 $1,989,001 13.7
General Merchandise Stores $62,381,300 $0 $62,381,300 100.0 Department Stores Excluding Leased Depts. $31,517,474 $0 $31,517,474 100.0
Sporting Goods/Hobby/Musical Instr Stores $6,942,508 $3,261,170 $3,681,338 36.1 Book, Periodical & Music Stores $2,121,303 $989,621 $1,131,682 36.4
Jewelry, Luggage & Leather Goods Stores $3,763,384 $3,207,196 $556,188 8.0Sporting Goods, Hobby, Book & Music Stores $9,063,811 $4,250,791 $4,813,021 36.1
Clothing Stores $14,511,161 $4,789,837 $9,721,324 50.4 Shoe Stores $3,603,294 $2,103,302 $1,499,992 26.3
Gasoline Stations $44,506,667 $29,532,975 $14,973,692 20.2Clothing & Clothing Accessories Stores $21,877,838 $10,100,335 $11,777,504 36.8

2013 Mequon East Growth Corridor Market Analysis 56
Initial Concept Scenario Summary (Maps on Following Pages) Scenario 1: Pioneer Interchange Use Acres Retail/Hospitality/Entertainment 68 Commercial (Office/Flex) 91 Multifamily 43 Single Family 112 Assumptions:
Highland Interchange is not built/funded within study period. Features:
Includes multiple local retail nodes. Greatest near-term development potential.
Scenario 2: Highland Interchange Use Acres Retail/Hospitality/Entertainment 123 Commercial (Office/Flex) 138 Multifamily 91 Single Family 76 Assumptions:
Highland Interchange is announced and included in long range capital funding plan within 5 years.
Features:
Maximizes retail and commercial potential. Leverages and supports growth of existing institutions. Greatest economic potential.
Scenario 3: Continuation of Historic Development Patterns Use Acres Retail/Hospitality/Entertainment 62 Commercial (Office/Flex) 92 Multifamily 51 Single Family 155 Assumptions:
Highland Interchange is not built/funded during study period. Features:
Maximizes professional employment. Maximizes commercial use of Interstate visibility and identity. Accommodates greatest number of single family homes. Retains/extends existing development patterns. Requires longest time period to full buildout.