city of manhattan, kansas - home - kansas department of
TRANSCRIPT
CITY OF MANHATTAN, KANSAS
Comprehensive Annual Financial Report
Year Ended December 31, 2012
Prepared by:
Department of Finance
CITY OF MANHATTAN, KANSAS
COMPREHENSIVE ANNUAL FINANCIAL REPORT
YEAR ENDED DECEMBER 31, 2012
TABLE OF CONTENTS
INTRODUCTORY SECTION PAGE
Letter of Transmittal ............................................................................................................................ 1
GFOA Certificate of Achievement for Excellence in Financial Reporting ....................................... 13
Organizational Chart ......................................................................................................................... 14
List of Principal Officials .................................................................................................................. 15
FINANCIAL SECTION
Independent Auditor’s Report ........................................................................................................... 17
Management’s Discussion and Analysis ........................................................................................... 21
Basic Financial Statements: Government-wide Financial Statements: Statement of Net Position ........................................................................................................ 35 Statement of Activities ............................................................................................................ 40
Fund Financial Statements: Balance Sheet - Governmental Funds...................................................................................... 42 Reconciliation of the Balance Sheet to the Statement of Net Position -
Governmental Funds ........................................................................................................... 44 Statement of Revenues, Expenditures, and Changes in Fund Balances - Governmental Funds ............................................................................ 46 Reconciliation of the Statement of Revenues, Expenditures, and Changes in Fund Balances of Governmental Funds to the Statement of Activities .......................... 48 Statement of Revenues, Expenditures and Changes in Fund Balances - Budget and Actual (Non-GAAP Budgetary Basis) - General Fund ...................................................... 50 Statement of Revenues, Expenditures and Changes in Fund Balances - Budget and Actual (Non-GAAP Budgetary Basis) - Riley County Police Department Fund ............... 52 Statement of Net Position - Proprietary Funds ........................................................................ 54 Statement of Revenues, Expenses, and Changes in Net Position – Proprietary Funds................................................................................................................ 58 Statement of Cash Flows - Proprietary Funds ......................................................................... 60 Statement of Fiduciary Net Position - Fiduciary Funds .......................................................... 62 Statement of Changes in Fiduciary Net Position - Fiduciary Funds ........................................ 63
Notes to the Financial Statements ..................................................................................................... 65
TABLE OF CONTENTS (continued) PAGE
Other Supplementary Information: Nonmajor Governmental Funds ................................................................................................... 103 Combining and Individual Fund Statements and Schedules: Combining Balance Sheet – Nonmajor Governmental Funds ............................................... 110 Combining Statement of Revenues, Expenditures and Changes in Fund Balances – Nonmajor Governmental Funds ........................................................ 122
Budgetary Schedules: Schedule of Revenues, Expenditures and Changes in Fund Balances - Budget and Actual (Non-GAAP Budgetary Basis): Debt Service Fund ............................... 139 Schedules of Revenues, Expenditures and Changes in Fund Balances - Budget and Actual (Non-GAAP Budgetary Basis): Nonmajor Governmental Funds .......... 140 Internal Service Funds ................................................................................................................. 155 Combining Statement of Net Position - Internal Service Funds ............................................... 156 Combining Statement of Revenues, Expenses and Changes in Net Position - Internal Service Funds ................................................................................ 158 Combining Statement of Cash Flows - Internal Service Funds ................................................ 160 STATISTICAL SECTION Statistical Section ............................................................................................................................ 163 Financial Trends:
Net Position by Component ......................................................................................................... 164 Changes in Net Position ............................................................................................................... 166 Fund Balances of Governmental Funds ....................................................................................... 170 Changes in Fund Balances of Governmental Funds .................................................................... 172
Revenue Capacity: Tax Revenues by Source, Governmental Activities ..................................................................... 174 Assessed and Estimated Actual Value of Taxable Property ........................................................ 176 City Mill Rates ............................................................................................................................. 178 Direct and Overlapping Property Tax Rates ................................................................................ 179 Principal Property Taxpayers ....................................................................................................... 180 Property Tax Levies and Collections ........................................................................................... 181 Taxable Sales by Category ........................................................................................................... 182 Direct and Overlapping Sales Tax Rates...................................................................................... 184 Sales Tax Revenue Payers by Industry ........................................................................................ 185 Debt Capacity: Ratios of Outstanding Debt by Type ............................................................................................ 186 Ratios of General Bonded Debt Outstanding ............................................................................... 188 Direct and Overlapping Governmental Activities Debt ............................................................... 189 Legal Debt Margin Information ................................................................................................... 190 Pledged Revenue Coverage .......................................................................................................... 192 Demographic and Economic Information: Demographic and Economic Statistics and Personal Income. ..................................................... 193 Principal Employers ..................................................................................................................... 194 Operating Information: City Government Employees by Function ................................................................................... 195 Operating Indicators by Function ................................................................................................. 196 Capital Asset Statistics by Function ............................................................................................. 197
TABLE OF CONTENTS (continued) PAGE
SINGLE AUDIT SECTION Report on Internal Control Over Financial Reporting and on Compliance and Other Matters Based on an Audit of Financial Statements Performed in Accordance with Government Auditing Standards ....................................................................................... 199
Report on Compliance with Requirements That Could Have a Direct and Material Effect on Each Major Program and on Internal Control Over Compliance in Accordance with OMB Circular A-133 ........................................................................................................ 201 Schedule of Expenditures of Federal Awards - For the Year Ended December 31, 2012 ................ 203 Notes to Schedule of Expenditures of Federal Awards .................................................................... 204 Schedule of Findings and Questioned Costs ..................................................................................... 205 Summary Schedule of Prior Audit Findings ..................................................................................... 206
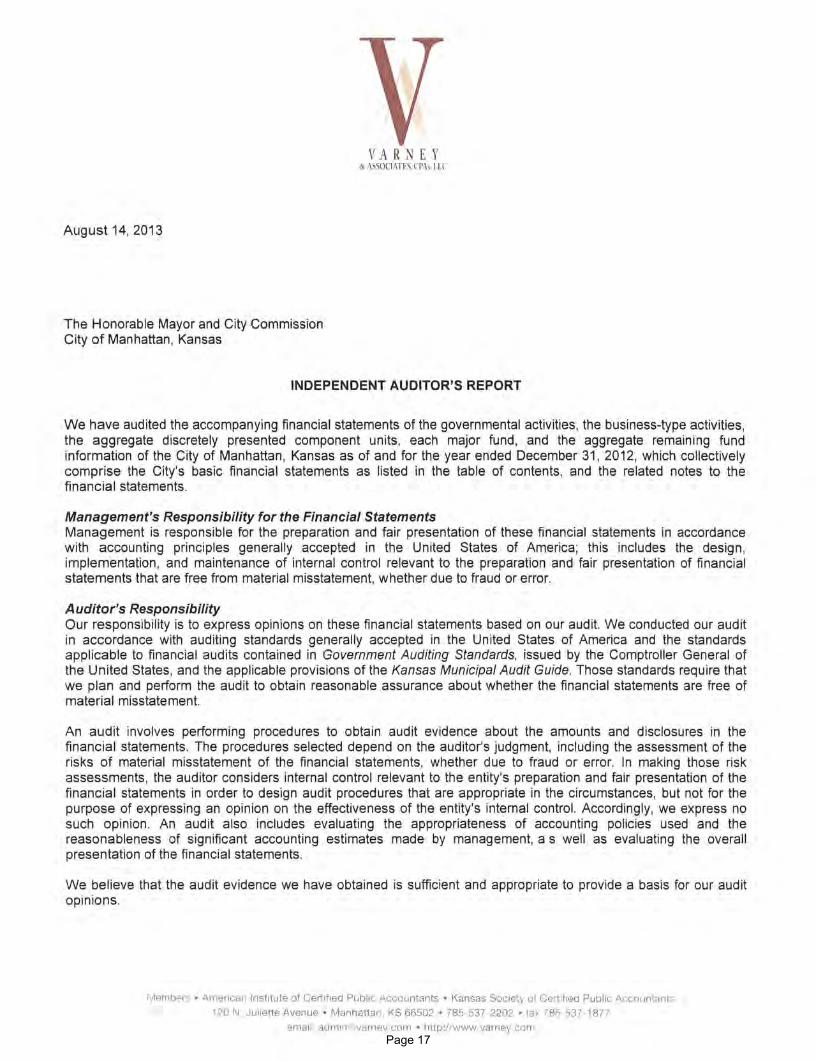
August 30, 2013 Honorable Mayor, City Commissioners, and Manhattan Citizens City of Manhattan, Kansas RE: 2012 Comprehensive Annual Financial Report Dear Honorable Mayor, Members of the City Commission, and Manhattan Citizens: We are pleased to submit the Comprehensive Annual Financial Report of the City of Manhattan, Kansas (the City) for the fiscal year ended December 31, 2012. This report was prepared by the City’s Finance Department and Auditor, Varney & Associates, CPAs, LLC. Responsibility for both the accuracy of the presented data and the completeness and fairness of the presentation, including all disclosures, rests with the management of the City. To provide a reasonable basis for making these representations, management of the City has established a comprehensive internal control framework that is designed both to protect the City’s assets from loss, theft, or misuse and to compile sufficient reliable information in conformity with accounting principles generally accepted in the United States of America (GAAP). Because the cost of internal control should not outweigh the benefits, the City’s comprehensive framework of internal controls has been designed to provide reasonable rather than absolute assurance that the financial statements will be free from material misstatements. To the best of our knowledge, this financial report is complete and reliable in all material respects. The City’s financial statements have been audited by Varney & Associates, CPAs, LLC, an independent firm of licensed certified public accountants. The goal of the independent audit was to provide reasonable assurance that the financial statements of the City for the fiscal year ended December 31, 2012, are free of material misstatement. The independent audit involved examining, on a test basis, evidence supporting the amounts and disclosures in the financial statements; assessing the accounting principles used and significant estimates made by management; and evaluating the overall financial statement presentation. The independent auditor concluded, based upon the audit, that there was a reasonable basis for rendering unqualified opinions that the City’s financial statements for the fiscal year ended December 31, 2012, are presented fairly in conformity with GAAP. The independent auditor’s report is presented as the first component of the financial section of this report. The independent audit of the financial statements of the City was part of a broader, federally mandated “Single Audit” designed to meet the special needs of the federal
Page 1
grantor agencies. The standards governing Single Audit engagements require the independent auditor to report not only on the fair presentation of the financial statements, but also on the audited government’s internal controls and compliance with legal requirements, with special emphasis on internal controls and legal requirements involving administration of federal awards. These reports are included in the Single Audit Section of the Comprehensive Annual Financial Report. GAAP require that management provide a narrative introduction, overview, and analysis to accompany the basic financial statements in the form of Management’s Discussion and Analysis (MD&A). This letter of transmittal is designed to complement MD&A and should be read in conjunction with it. The City of Manhattan’s MD&A can be found immediately following the report of the independent auditors. Profile of the City of Manhattan The City of Manhattan was chartered in 1857 and is a city of the first class. The City operates under a Commission-Manager form of government. The City Commission consists of five members. Elections are held every other year in odd-numbered years. Three City Commission positions are chosen at each election. The two highest vote recipients receive four-year terms while the third highest vote recipient receives a two-year term. The City Manager is appointed by the Commission and is charged with the efficient and effective administration of the City. The City is in Pottawatomie and Riley Counties, and is located at the confluence of the Blue and Kansas Rivers in Northeast Kansas approximately 116 miles west of Kansas City (56 miles west of Topeka, the Kansas State Capital). The City encompasses approximately 18 square miles and has a current estimated population of 56,069 persons (includes Kansas State University which was annexed on July 3, 1994). The City provides a full range of services including fire protection, construction and maintenance of streets, storm drainage facilities and other infrastructure, comprehensive parks and recreational activities, cemetery, zoo and cultural events, planning, zoning, code enforcement, engineering, airport operations, and general administrative services. The water, wastewater, and storm water management utilities operate as enterprise funds of the City. The City is also financially accountable for a legally separate public library and a legally separate housing authority, both of which are reported separately within the City’s financial statements. Additional information on these legally separate entities can be found on Note 1.A. in the notes to the financial statements. The City is also legally responsible for 80% of the operational budget for the Riley County Police Department, a City/Riley County consolidated law enforcement agency. This legally separate entity does not meet the criteria for inclusion as a component unit in the City’s financial statements. Expenditures are authorized in the annual appropriated budget approved by the City Commission, as required by state statute. Activities of the General Fund, Special
Page 2
Revenue Funds, Debt Service Fund, and Enterprise Funds are included in the annual appropriated budget. A six-year Capital Improvement Plan is also adopted by the City Commission, and the first year of that plan is included in the City Budget. Expenditures cannot exceed the budgeted amount for each fund. Budgetary control is maintained through the use of an encumbrance system. As purchase orders are issued, corresponding amounts of appropriations are reserved, by the use of encumbrances for later payment, so that appropriations may not be overspent. Kansas statutes also require unencumbered cash be on hand before an obligation can be incurred. Budget-to-actual comparisons are provided in this report for each individual governmental fund for which an appropriated budget has been adopted. For the General Fund and the Riley County Police Department Fund these comparisons are presented as part of the basic financial statements. For the remaining governmental funds, these comparisons are presented in the governmental fund subsection of this report. Factors Affecting Financial Condition The information presented in the financial statements is perhaps best understood when it is considered from the broader perspective of the specific environment within which the City of Manhattan operates. Municipal Services and Utilities The City owns and operates its own water, wastewater, and storm water management utility systems. Westar Energy and Kansas Gas Service supply electricity and natural gas to the City. Telephone and cable television services are provided by AT&T and Cox Communications, Inc., under franchise agreements with the City. The City’s fire department provides continuous full-time fire protection to the City. The City's police protection is provided by the Riley County Police Department. The ambulance service is provided by Riley County. Transportation Facilities Riley County is traversed by Interstate 70, U.S. Highway No. 24, and Kansas Highways No. 113, No.18, and No.177, all leading to Manhattan, Kansas. Seven motor freight lines serve the City. Rail service is provided by Union Pacific Railroad. In addition, air transportation services via regional jet are provided to and from Dallas/Fort Worth and Chicago by American Eagle Airlines. The area is also served by an aircraft charter service and four taxi companies. Public transportation is also provided to Manhattan, Riley County, and Pottawatomie County by the Flint Hills Area Transportation Agency, a non-profit regional transit entity. Kansas State University Kansas State University, formerly Kansas State Agricultural College, has 150 years of distinguished service as one of the leading examples of the successful system of land-
Page 3
grant universities developed throughout the United States. Its campus contains over 668 acres and beyond the campus are more than 4,000 acres of university land used for experimental work in agriculture. Kansas State University is fully accredited by the North Central Accrediting Association and by various professional accrediting agencies. The University had an enrollment of 24,378 in the fall of 2012. Kansas State University ranks first nationally among state universities in its total of Rhodes, Marshall, Truman, Goldwater, and Udall scholars since 1986. The University offers many cultural, recreational, educational, and NCAA Division 1, Big XII athletic attractions. Military-Activity - Fort Riley Founded in 1853, Fort Riley is a military installation 8 miles west of Manhattan. Originally known as Camp Center, Fort Riley is a permanent post and has long been one of the nation's largest military installations. Today, Fort Riley is widely recognized as the Army’s premier division-level installation covering approximately 101,000 acres with a military strength of approximately 19,468 soldiers and 26,415 family members. In addition to the military personnel at Fort Riley, approximately 7,470 civilians work at the installation. Furthermore, 3,591 military retirees live in the Flint Hills Region and obtain retirement services from Fort Riley. This number is anticipated to grow with the ongoing construction of a new $400 million modern hospital and other medical/dental services facilities. Over the past five years, military construction appropriations and construction has approached $2 billion on post. The Fort's utilization changed in 2006, with the return of the 1st Infantry Division to Fort Riley. Since that time, units assigned to Fort Riley have supported Operation Enduring Freedom, Operation Iraqi Freedom, and transitioning to Operation New Dawn. From 2006 to 2009, the Fort Riley Training Mission provided pre-deployment training for an array of Military Transition Teams (MiTTs) deploying as advisors to Foreign Security Forces. Since 2003, Fort Riley has deployed nearly 80,237 soldiers to Iraq, Afghanistan and the Horn of Africa. During the first decade of the new century, Fort Riley has witnessed a large physical transformation. From modernization of the airfield to new barracks, housing, training and work areas, the changes to the installation have postured Fort Riley and the Central Flint Hills Region for the future. During Fort Riley's service to the nation, many legendary and historic characters have been intertwined with the Fort's history. Some of the more famous were Buffalo Bill Cody, Wild Bill Hickock, George Armstrong Custer, and the famous 7th Cavalry of the early frontier days; Civil War heroes J.E.B. Stuart and Phillip St. George Cook; General "Blackjack" Pershing of World War I; Generals Wainwright, Patton, and Terry Allen of World War II; and Major General Thomas Rhame of the Persian Gulf War. Impact of Fort Riley The following is the Economic Impact Summary for Fort Riley for the year ended September 30, 2012 (most recent federal fiscal year available):
Page 4
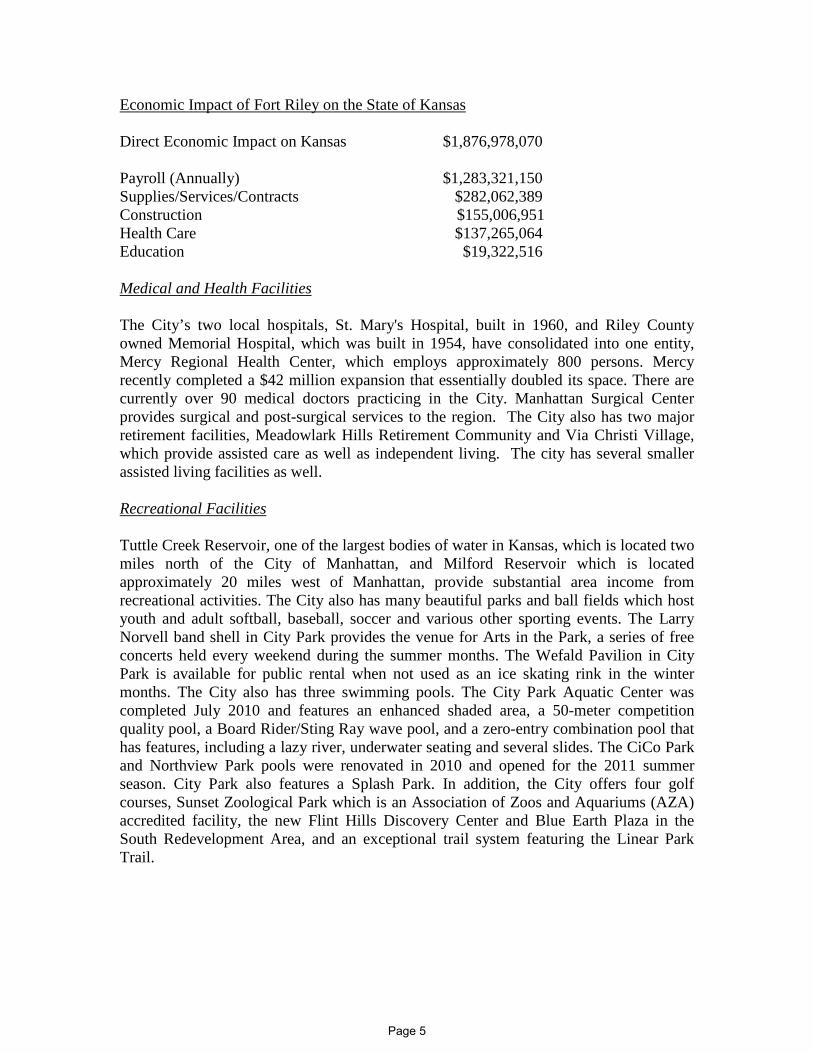
Economic Impact of Fort Riley on the State of Kansas Direct Economic Impact on Kansas $1,876,978,070 Payroll (Annually) $1,283,321,150 Supplies/Services/Contracts $282,062,389 Construction $155,006,951 Health Care $137,265,064 Education $19,322,516 Medical and Health Facilities The City’s two local hospitals, St. Mary's Hospital, built in 1960, and Riley County owned Memorial Hospital, which was built in 1954, have consolidated into one entity, Mercy Regional Health Center, which employs approximately 800 persons. Mercy recently completed a $42 million expansion that essentially doubled its space. There are currently over 90 medical doctors practicing in the City. Manhattan Surgical Center provides surgical and post-surgical services to the region. The City also has two major retirement facilities, Meadowlark Hills Retirement Community and Via Christi Village, which provide assisted care as well as independent living. The city has several smaller assisted living facilities as well. Recreational Facilities Tuttle Creek Reservoir, one of the largest bodies of water in Kansas, which is located two miles north of the City of Manhattan, and Milford Reservoir which is located approximately 20 miles west of Manhattan, provide substantial area income from recreational activities. The City also has many beautiful parks and ball fields which host youth and adult softball, baseball, soccer and various other sporting events. The Larry Norvell band shell in City Park provides the venue for Arts in the Park, a series of free concerts held every weekend during the summer months. The Wefald Pavilion in City Park is available for public rental when not used as an ice skating rink in the winter months. The City also has three swimming pools. The City Park Aquatic Center was completed July 2010 and features an enhanced shaded area, a 50-meter competition quality pool, a Board Rider/Sting Ray wave pool, and a zero-entry combination pool that has features, including a lazy river, underwater seating and several slides. The CiCo Park and Northview Park pools were renovated in 2010 and opened for the 2011 summer season. City Park also features a Splash Park. In addition, the City offers four golf courses, Sunset Zoological Park which is an Association of Zoos and Aquariums (AZA) accredited facility, the new Flint Hills Discovery Center and Blue Earth Plaza in the South Redevelopment Area, and an exceptional trail system featuring the Linear Park Trail.
Page 5
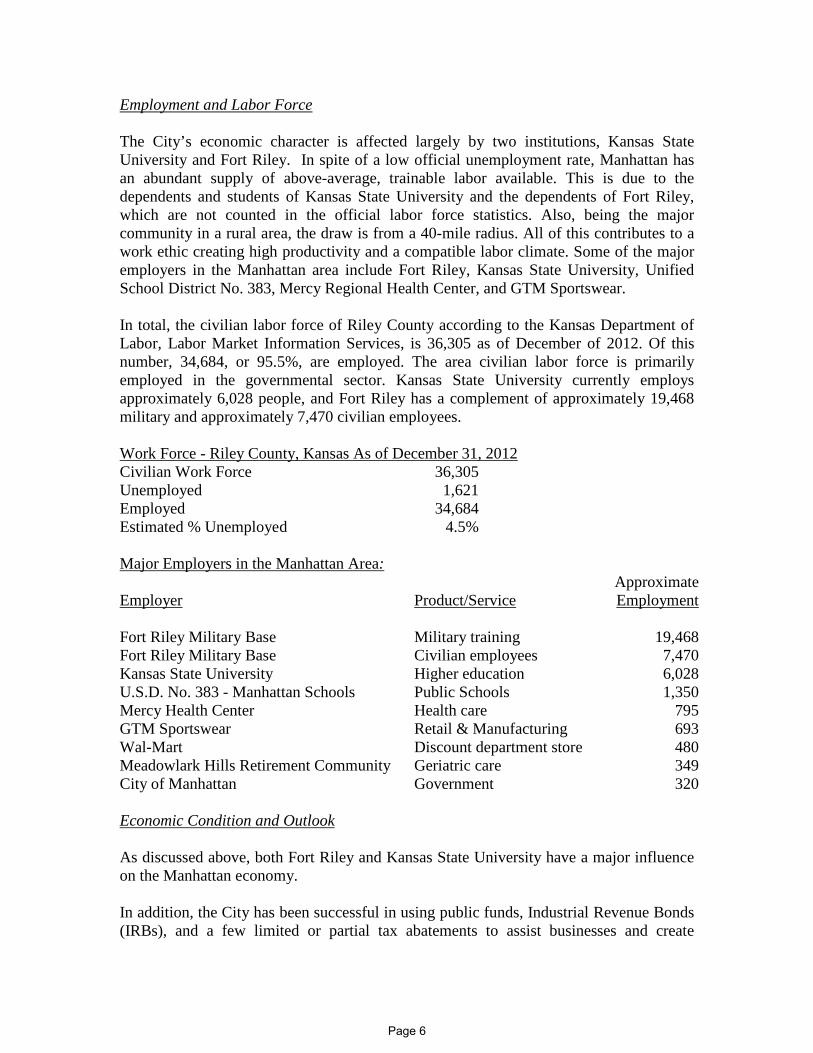
Employment and Labor Force The City’s economic character is affected largely by two institutions, Kansas State University and Fort Riley. In spite of a low official unemployment rate, Manhattan has an abundant supply of above-average, trainable labor available. This is due to the dependents and students of Kansas State University and the dependents of Fort Riley, which are not counted in the official labor force statistics. Also, being the major community in a rural area, the draw is from a 40-mile radius. All of this contributes to a work ethic creating high productivity and a compatible labor climate. Some of the major employers in the Manhattan area include Fort Riley, Kansas State University, Unified School District No. 383, Mercy Regional Health Center, and GTM Sportswear. In total, the civilian labor force of Riley County according to the Kansas Department of Labor, Labor Market Information Services, is 36,305 as of December of 2012. Of this number, 34,684, or 95.5%, are employed. The area civilian labor force is primarily employed in the governmental sector. Kansas State University currently employs approximately 6,028 people, and Fort Riley has a complement of approximately 19,468 military and approximately 7,470 civilian employees. Work Force - Riley County, Kansas As of December 31, 2012 Civilian Work Force 36,305 Unemployed 1,621 Employed 34,684 Estimated % Unemployed 4.5% Major Employers in the Manhattan Area: Approximate Employer Product/Service Employment Fort Riley Military Base Military training 19,468 Fort Riley Military Base Civilian employees 7,470 Kansas State University Higher education 6,028 U.S.D. No. 383 - Manhattan Schools Public Schools 1,350 Mercy Health Center Health care 795 GTM Sportswear Retail & Manufacturing 693 Wal-Mart Discount department store 480 Meadowlark Hills Retirement Community Geriatric care 349 City of Manhattan Government 320 Economic Condition and Outlook As discussed above, both Fort Riley and Kansas State University have a major influence on the Manhattan economy. In addition, the City has been successful in using public funds, Industrial Revenue Bonds (IRBs), and a few limited or partial tax abatements to assist businesses and create
Page 6
economic development opportunities. In 2012, residents voted to renew the Riley County one-half cent sales tax. The City of Manhattan will use those dollars to fund traditional economic development proposals, infrastructure projects, and property tax relief. Some of the most recent economic success stories include: • CivicPlus. In May 2012, the City Commission approved an economic development
agreement with CivicPlus, a local company specializing in cost-effective website solutions to enhance community engagement for public sector clients. CivicPlus is projecting nearly 40% growth in 2013 and plans to add 250 new high wage jobs over the next ten years. In May 2013, the City issued IRBs in an amount not to exceed $15 million to finance a new five-story 50,000 square-foot office/commercial facility in downtown Manhattan. The incentive package includes a $750,000 forgivable loan and partial tax abatement. CivicPlus held a groundbreaking ceremony in early 2013, started demolition work in May of 2013, and is currently under construction. They have also renovated a significant amount of existing downtown space.
• National Bio and Agro-Defense Facility (NBAF). The United States Department of
Homeland Security’s Science and Technology Directorate has selected a site adjacent to Kansas State University (KSU) for a state-of-the-art, high security laboratory facility to study foreign animal and zoonotic diseases that may impact livestock. There is currently no laboratory facility in the United States with the capabilities for BSL-4 research on large livestock. The facility design began in 2009 and site work began in 2010 with utility relocation. A Central Utility Plant (CUP) groundbreaking was held in May of 2013 for the NBAF and is currently under construction. NBAF will replace the current and aging facilities at the Plum Island Animal Disease Center (PIADC) in New York. Kansas’ national leadership in animal health research and industry has made it the preferred location for the federal scientific laboratory that will accelerate animal disease research to protect the American food supply and agricultural economy. The total project estimate now exceeds $1 billion. Related to this, in 2009, the United States Department of Agriculture (USDA) Arthropod-Borne Animal Diseases Research Unit was successfully recruited from Laramie, Wyoming. This team occupies renovated space in the current USDA research facility, and periodically leases space in K-State’s state-of-the-art BSL 3-3Ag Biosecurity Research Institute. K-State recently demolished the old feed mill which was located on the NBAF site and constructed a new, modern Feed Technology Innovation Center.
• KSU Institute for Commercialization (KSU-IC). Once known as the National Institute
for Strategic Technology Acquisition and Commercialization (NISTAC), KSU-IC has made significant contributions toward the development of new technical business in the Manhattan area. In addition, KSU-IC is poised to be very successful with commercialization of University technologies and spin offs and maintains an impressive patent portfolio. KSU-IC occupies and leases the City’s 30,000 square-foot, $7 million Innovation Center in the K-State Research Park, where the focus is on creating bioscience ventures and university partnerships. In 2011, the City completed build out of 5,000 square feet of unfinished pilot space that created three new laboratories in the Center. The Kansas Bioscience Authority provided $1 million in grant funds to match the City’s local contribution of $425,000 from the Economic Development Fund. KSU-IC is also a founding member of Knowledge Based Economic Development (KBED), which was created to establish and actively support a thriving entrepreneurial environment to attract, grow, and retain knowledge-based businesses.
Page 7
• Flint Hills Beverage. Flint Hills Beverage is a distributor for Anheuser-Busch
products throughout the region. In 2005, the City issued IRBs in the amount of $2.8 million to finance the construction and equipping of a 40,000 square-foot manufacturing facility in the City’s Corporate Technology Park. In July 2012, the company exercised its option to purchase Lot 21A in the Corporate Technology Park to accommodate future expansions, and the company broke ground on a 17,000 square-foot expansion in 2012. The sale proceeds were returned to the City’s Industrial Promotion Fund.
• Florence Corporation of Kansas. This company produces mailbox products for central distribution. Since 2003, the company has made capital investments totaling over $21 million in a 200,000 square-foot manufacturing facility in the Corporate Technology Park. The company continues to focus on new products that complement existing products to increase sales.
• Manko Window Systems. Manko Window Systems, a commercial-grade window
manufacturer, has completed several expansions of its Manhattan facility. The most recent expansion will allow for the addition of a blast-resistant and hurricane-resistant window line. In 2005, the City issued IRBs in the amount of $2.5 million to finance building additions, including 45,000 square feet of additional manufacturing space and 10,000 square feet of new office space, as well as over $1 million in new equipment.
• Mercy Regional Health Center. The Mercy Regional Health Center Board has
completed a major expansion and new addition to its facility, providing approximately double the space. The City, through the Manhattan Economic Development Fund, provided $1 million to the expansion of the Health Center, in addition to issuing IRBs in the amount of $38 million. The construction of the expanded space was completed in 2003 and the renovation of the old hospital wing was recently completed.
• Meadowlark Hills Retirement Community. In 2007, the Meadowlark Hills
Retirement Community began a multi-million dollar four-phase expansion of its facilities. The City has committed to issuing up to $55 million in IRBs to refinance existing debt and to finance the latest expansion, and has provided an additional $750,000 in incentives in the form of conventional and forgivable loans.
• GTM Sportswear. Located in the Pottawatomie County portion of the City, GTM
Sportswear (GTM) sells custom embroidered and screen-printed sportswear and related goods. GTM is in the process of enlarging its current manufacturing facility in several phases over the next ten years to an ultimate footprint of approximately 200,000 square feet. The City has committed to issuing up to $28 million in IRBs for GTM and also providing incentives in the form of $800,000 in forgivable loans and approximately $2.4 million in tax abatements.
Manhattan has experienced steady growth during the past few years although growth has moderated somewhat with the recent economic downturn. In 2012, the value of the property tax base grew about 2.9%. Total sales tax revenues in 2012 were $26,653,421, which represents a 2.0% decrease from 2011. The population has grown 8.5% from five years ago. On July 3, 1994, the City annexed Kansas State University. This annexation of students living on campus added approximately 4,200 individuals to the City’s population. The 2012 estimated population for Manhattan is 56,069 persons.
Page 8
The Kansas State University athletic program had a very successful season. The Football, Basketball, and Baseball teams received Big 12 Championship honors for the 2012-2013 season. Major improvements were completed in 2012 and 2013 at the athletic complexes. A new $90 million West Stadium Center for K-State football was dedicated in August 2013. This facility also includes a cafeteria/training table for all KSU student athletes. In addition new basketball practice/team facilities and new rowing and tennis facilities were also dedicated. Current Major Initiatives/Planned Activities In 2013, the City plans to continue or initiate many projects which will further improve and expand the City’s infrastructure and facilitate the maintenance and growth of the City. The City has increased its focus on building up reserves not only to help facilitate anticipated growth, but also to help mitigate the impact of any potential revenue shortfalls. Below is a listing of recent accomplishments. • Downtown Redevelopment. The Downtown Redevelopment project consists of
two distinct areas: the North Project Area and the South Project Area. The North Project Area, developed by Dial Realty of Omaha, Nebraska, is known as Manhattan Market Place and features approximately 250,000 square feet of commercial property and 220,000 square feet of residential property, with the addition of approximately 200 living units. Private investment is expected to be $57 million. In December 2009, the City issued the 2009 TIF Bonds to finance approximately $17.8 million in land acquisition and site preparation associated with the North Project Area. In December 2010, the City issued the 2010 TDD Bonds to finance approximately $5.6 million to fund several infrastructure projects within the North Project Area. The South Project Area features a City-owned and operated 35,000 square-foot Flint Hills Discovery Center which opened in April 2012, enhancing tourism locally and statewide, as well as a new privately owned 30,000 square-foot Conference Center and 135-room Hilton Garden Inn hotel. A public 440-stall parking structure is also connected to the Conference Center.
This new entertainment area also features Blue Earth Plaza, a robust public park with a fountain, river, splash component synchronized with music and light shows as well as a central shade gathering area. Two additional hotels and a mixed use building bordering the periphery have been approved. The Candlewood Suites hotel opened in March 2013, the Holiday Inn Express is anticipated to start construction prior to November of 2013, and the mixed-use building currently under construction is expected to be complete in December of 2013. A four-story residential structure with 32 living units has also been approved for construction. Total private investment by Dial Realty, HCW, and McCullough Development for the South project is approximately $36 million, with the City contributing an additional $31 million. Of this $31 million, $9.5 million will be used to pay for the Conference Center, $7.2 million for the Discovery Center exhibits, $3.2 million for the parking garage, and approximately $11.1 million for site preparation and
Page 9
infrastructure improvements. In 2006, the City received approval for $50 million in Sales Tax and Revenue (STAR) Bonds for the South Project Downtown Redevelopment. The City issued the 2009-1 STAR Bonds and the 2009-2 STAR Bonds in December 2009, with the 2009-2 STAR Bonds being issued as Build America Bonds under the American Recovery and Reinvestment Act of 2009. STAR Bonds will be utilized for land acquisition, Discovery Center construction, Blue Earth Plaza, and infrastructure costs.
• Airport. American Eagle Airlines provides three (3) daily regional jet flights to and from Dallas/Fort Worth and Manhattan and two (2) daily non-stop service flights to and from Chicago O’Hare International Airport. The airport continues on a track of significant growth, with a major terminal and parking lot expansions planned with Phase I of the terminal building to start construction in November 2013 at a cost of $9.8 million. The City also recently announced new twice weekly service with Allegiant Airlines to Phoenix. The airport recently added additional General Aviation aircraft parking and plans to complete a security and wildlife fence around the airport perimeter in 2013.
• Community Development. In 2012, the Community Development Department
administered grants totaling approximately $633,000 for projects to improve the Senior Center, repair park facilities, address homelessness issues, make energy efficiency improvements at City buildings, and update the City’s Emergency Response Plan.
• Public Works. McCall Road improvements upgraded the corridor from a rural three-lane section roadway to an urban five-lane roadway, and an upgraded intersection was also completed at US-24 and McCall Road at a cost of $4.0 million with 20% contributed by adjacent property owners. The most significant infrastructure improvement taking place in the City is the K-18 improvement project from the City of Ogden to the City of Manhattan. This $96 million project will be partially financed by funds from the American Recovery and Reinvestment Act of 2009 as well as the State of Kansas T-Works program. The K-18 project will include an interchange, four bridges, and a four-lane freeway over a two-mile stretch, and is needed to support the significant population and economic growth that will occur between Fort Riley and the City of Manhattan. The project will be constructed in three phases. Construction for Phase one began in June 2010 and was completed in the fall of 2012. Construction for Phases two and three began in the summer of 2011 and is expected to be completed in the fall of 2013. The improvements will include an interchange directly serving the airport and surrounding area, and the City has agreed to contribute $1.5 million toward this project.
• Utilities. Due to existing and expected growth in the City, the Water and
Wastewater Treatment Plants began major expansions in 2010 at costs of $16 million and $23 million, respectively. The expansion of the Water Treatment Plant was completed in December 2012, increasing the plant capacity from 20-30 million gallons per day. Progress at the Wastewater Treatment Plant’s expansion project allowed the majority of the improvements to go online. The plant capacity went from 8.7 million gallons a day to 11 million gallons per day. In addition, the bionutrient removal (BNR) processes have been initiated. Low-interest loans from the Kansas Department of Health and Environment financed these expansions, and
Page 10
utility rate increases may be necessary over the next several years in order to meet the debt service requirements of these loans.
• Parks and Recreation. In 2009, City voters approved an increase in the City’s sales
tax rate from 1.00% to 1.25%. The additional 0.25% is dedicated to the payment of debt service on debt issued to finance the construction of the new City Park Aquatic Center, renovations and improvements to the CiCo Park and Northview Park pools, and construction of a new Nature Education Center at the Sunset Zoo. Construction on the City Park Aquatic Center began in 2009 and was completed in July of 2010. The CiCo Park pool was completed in June 2011, and the Northview pool opened to the public on July 4, 2011. All three pools were opened in May for the 2012 swim season, which was the first year all three pools were in continuous operations since 2007. The Sunset Zoo Nature Exploration Center held its grand opening on June 2, 2012.
• Fire Department. Construction was completed on two new fire stations in the
summer of 2012. The southwest fire station is a relocation of the fire station on Anderson Avenue to Amherst Avenue, and the northwest fire station is an entirely new station located on Vanesta Drive. In 2012, fire dispatching was consolidated and is now done from the 911 dispatchers at the Riley County Police Department. The City also narrowbanded all radios to comply with new FCC regulations.
Financial Policies The City has focused on adopting policies which provide ongoing guidance in the administration of City financial decisions. The following policies are considered most relevant to this report:
• Capital Improvements Program (CIP). This policy establishes a process for a six-year CIP which shall set priorities and provide for the scheduling of capital improvements, major purchases of equipment and major studies or surveys. The first year of the CIP is considered in the development of the annual operating budget. The CIP is adopted by resolution approved by the City Commission after a public hearing has been conducted for the purpose of soliciting community comments on the proposed CIP.
• Investment Policy. This policy establishes that, giving due regard to the safety
and risk of investments, all available funds shall be invested in conformance with legal and administrative guidelines and, to the maximum extent possible, at the highest rates obtainable at the time of investment. Annually, the City is granted expanded investment powers by the state’s Pooled Money Investment Board (PMIB) and is one of only eight municipal entities in Kansas holding this designation.
• Long-term Obligation Financing Policy. This policy establishes a management committee to oversee the issuance of City debt and restricts total annual debt issuances to a predetermined amount unless approved by the City Commission. This restriction was waived in 2010, as it was determined that the issuance of debt in 2010 for various projects related to Downtown Redevelopment was vital to the
Page 11
overall success of the City’s efforts to revitalize the downtown corridor. This policy also establishes benchmarks for the rapid payback of general obligation debt and present value savings to be achieved when refunding existing debt.
Awards and Acknowledgments The Government Finance Officers Association (GFOA) awarded a Certificate of Achievement for Excellence in Financial Reporting to the City of Manhattan for its Comprehensive Annual Financial Report (CAFR) for the fiscal year ended December 31, 2011. This was the 15th consecutive year that the City has received this prestigious award. In order to be awarded a Certificate of Achievement, the City published an easily readable and efficiently organized CAFR. This report satisfied both GAAP and applicable legal requirements. A Certificate of Achievement is valid for a period of one year only. We believe that our current CAFR continues to meet the Certificate of Achievement Program’s requirements and we are submitting it to the GFOA to determine its eligibility for another certificate. In addition, the City also received the GFOA’s Distinguished Budget Presentation Award for its budget document for fiscal year 2013. In order to qualify for the Distinguished Budget Presentation Award, the City’s budget document was judged to be proficient in several categories, including as a policy document, a financial plan, an operations guide, and a communication device. Preparation of this report would not have been possible without the professional, efficient, and dedicated services of the staff of the Finance Department. Credit should also be given to the City Commission and the City Manager’s Office for providing the direction and support necessary to maintain the highest standards of professionalism in conducting the financial operations of the City. Thanks should also be extended to Varney & Associates, CPAs, LLC, for the cooperation and professional assistance provided during the audit of the City’s 2012 financial records. Respectfully submitted,
Ron R. Fehr Bernie Hayen City Manager Director of Finance
Page 12
Page 13
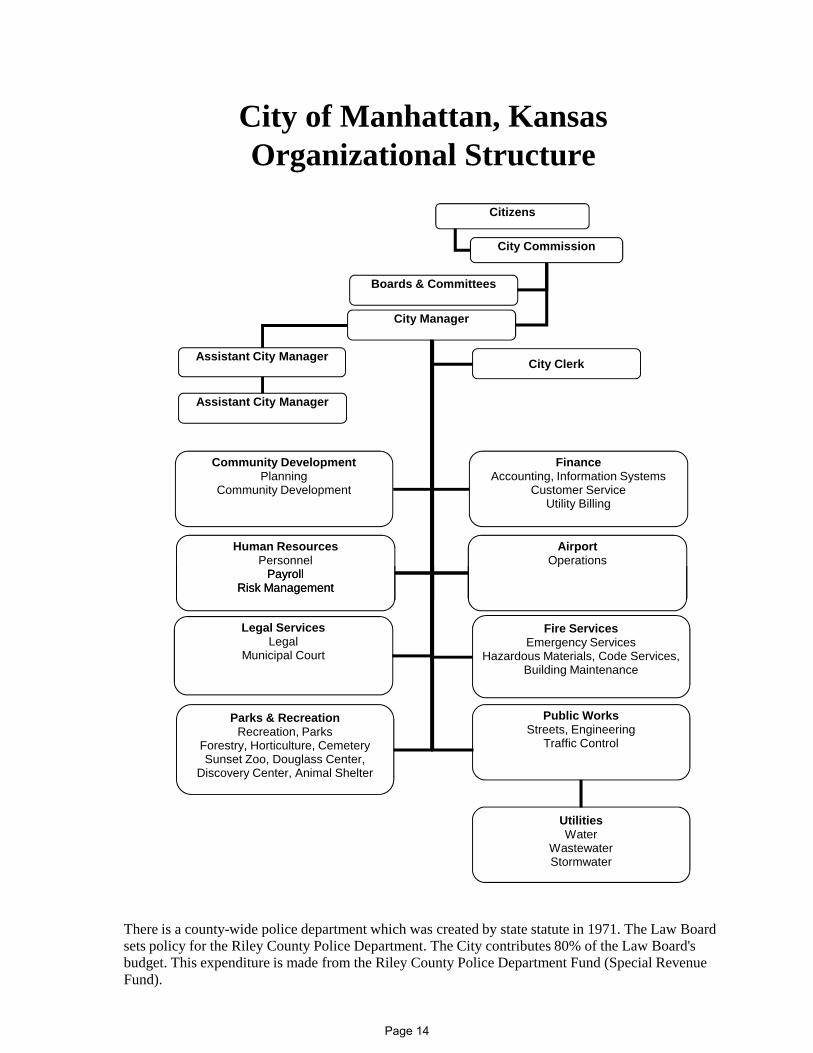
City of Manhattan, KansasOrganizational Structure
Citizens
City Commission
Boards & Committees
City Manager
Assistant City Manager
Assistant City Manager
AirportOperations
Human ResourcesPersonnel
PayrollRisk Management
FinanceAccounting, Information Systems
Customer ServiceUtility Billing
Community DevelopmentPlanning
Community Development
City Clerk
There is a county-wide police department which was created by state statute in 1971. The Law Board sets policy for the Riley County Police Department. The City contributes 80% of the Law Board's budget. This expenditure is made from the Riley County Police Department Fund (Special Revenue Fund).
Public WorksStreets, Engineering
Traffic Control
Legal ServicesLegal
Municipal Court
pPayroll
Risk Management
Parks & RecreationRecreation, Parks
Forestry, Horticulture, CemeterySunset Zoo, Douglass Center,
Discovery Center, Animal Shelter
Fire ServicesEmergency Services
Hazardous Materials, Code Services, Building Maintenance
UtilitiesWater
WastewaterStormwater
Page 14
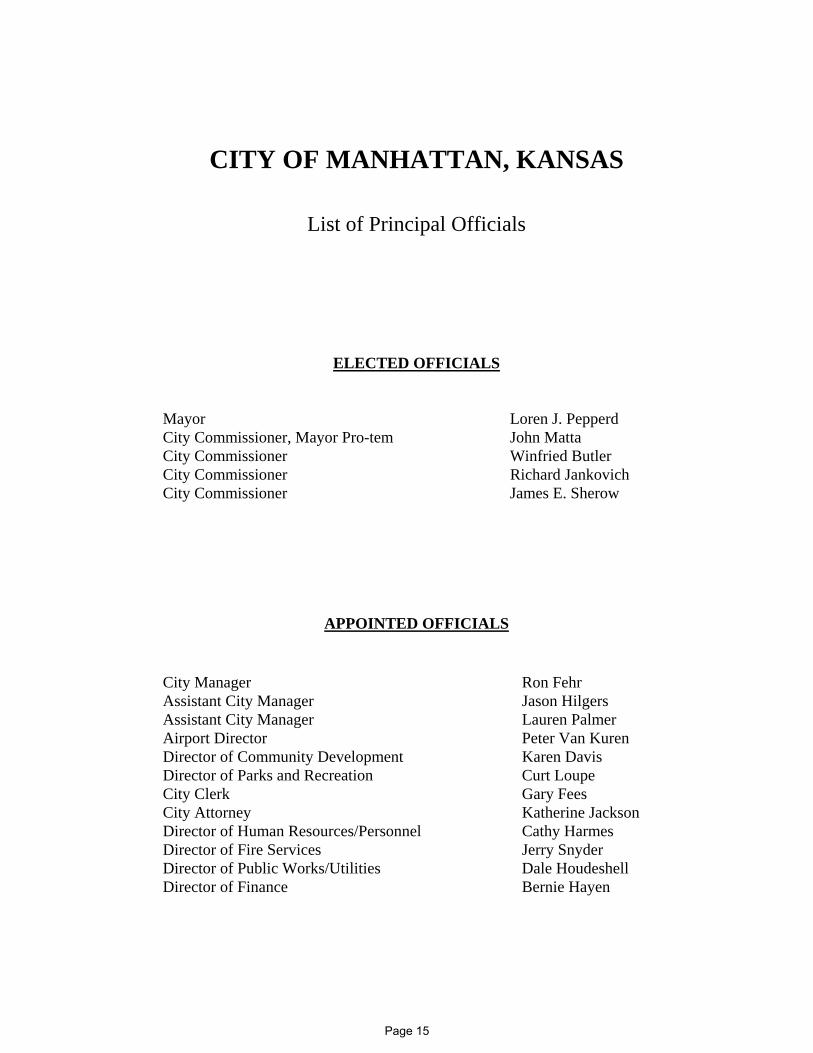
CITY OF MANHATTAN, KANSAS
List of Principal Officials
ELECTED OFFICIALS
Mayor Loren J. Pepperd City Commissioner, Mayor Pro-tem John Matta City Commissioner Winfried Butler City Commissioner Richard Jankovich City Commissioner James E. Sherow
APPOINTED OFFICIALS
City Manager Ron Fehr Assistant City Manager Jason Hilgers Assistant City Manager Lauren Palmer Airport Director Peter Van Kuren Director of Community Development Karen Davis Director of Parks and Recreation Curt Loupe City Clerk Gary Fees City Attorney Katherine Jackson Director of Human Resources/Personnel Cathy Harmes Director of Fire Services Jerry Snyder Director of Public Works/Utilities Dale Houdeshell Director of Finance Bernie Hayen
Page 15

THIS PAGE INTENTIONALLY LEFT BLANK
Page 16
Page 17
Page 18
Page 19

THIS PAGE INTENTIONALLY LEFT BLANK
Page 20
Management’s Discussion and Analysis
This section of the City of Manhattan’s annual financial report presents our discussion and analysis of the City’s financial performance during the year that ended on December 31, 2012. Please read it in conjunction with the transmittal letter at the front of this report and the City’s financial statements, which follow this section, for a well-rounded picture of the City’s financial condition. Financial Highlights
• The assets of the City of Manhattan exceeded its liabilities at the close of 2012 by $203,794,739. Of this amount, $6,537,323 may be used to meet the City’s ongoing obligations.
• The City’s total net position increased by $8,998,369 over the course of this year’s operations. The net position of our governmental activities increased by $6,028,831 (5.6 percent) and the net position of our business-type activities increased by $2,969,538 (3.4 percent).
• As of the end of 2012, the City of Manhattan’s governmental funds reported combined ending fund balances of $48,978,426, an increase of $8,017,045 in comparison with the prior year. Approximately 31.2 percent of this total amount, $15,301,195 is assigned for purchases on order and subsequent year budget appropriations while less than 0.1 percent, $39,152 is considered unassigned and available for spending at the City’s discretion.
• At the end of 2012, the assigned fund balance for the general fund was $2,645,765, or 11.4 percent of total general fund expenditures. The unassigned fund balance for the general fund was $39,152, or 0.2 percent of total general fund expenditures.
• The City’s total debt increased by $7,124,692 during 2012. Much of this increase resulted from draws made on the state revolving loans to finance expansions and upgrades to the water treatment and wastewater treatment plants. General obligation bonds outstanding increased by nearly $8,850,000 in 2012. Bonds in the amount of $19,245,000 were issued in 2012, while $10,395,000 were retired. Several special assessment projects that were in progress at the end of 2011 were completed and bonded in 2012. In addition, several large city-at-large capital projects, including two new fire stations, the Sunset Zoo Education Center, K-177 and 3rd Street intersection improvements, and the design of improvements for West Anderson Ave., were bonded in 2012. There was a decrease of $4,120,000 in temporary notes outstanding at the end of 2012 as compared to 2011 due to several large city-at-large capital projects bonding. Temp notes were issued for several special assessment projects, stormwater improvements at Hartford Road & Tecumseh-Quivera, and the airport terminal design.
Overview of the Financial Statements This discussion and analysis are intended to serve as an introduction to the City of Manhattan’s basic financial statements. The City of Manhattan’s basic financial statements comprise three components: 1) government-wide financial statements, 2) fund financial statements, and 3) notes to the financial statements. This report also contains other supplementary information in addition to the basic financial statements themselves. Government-wide financial statements. The government-wide financial statements are designed to provide readers with a broad overview of the City of Manhattan’s finances, in a manner similar to private-sector businesses.
Page 21
The statement of net position presents information on all of the City of Manhattan’s assets and liabilities, with the difference between the two reported as net position. Over time, increases or decreases in net position may serve as a useful indicator of whether the financial position of the City of Manhattan is improving or deteriorating. The statement of activities presents information showing how the City’s net position changed during the most recent fiscal year. All changes in net position are reported as soon as the underlying event giving rise to the change occurs, regardless of the timing of related cash flows. Thus, revenues and expenses are reported in this statement for some items that will only result in cash flows in future fiscal periods (e.g. uncollected taxes and earned but unused compensated absences). Both of the government-wide financial statements distinguish functions of the City of Manhattan that are principally supported by taxes and intergovernmental revenues from other functions that are intended to recover all or a significant portion of their costs through user fees and charges. The governmental activities of the City of Manhattan include general government, public safety, public works, urban development and housing, and culture and recreation. The business-type activities of the City of Manhattan include water, wastewater, and storm water management. The government-wide financial statements include not only the City of Manhattan itself (known as the primary government), but also the legally separate library and housing authority for which the City is financially accountable. Financial information for these component units is reported separately from the financial information presented for the primary government itself in the government-wide financial statements. Separately issued audited financial statements for the Manhattan Public Library may be obtained at 629 Poyntz Avenue, Manhattan, KS 66502. Separately issued audited financial statements for the Manhattan Housing Authority may be obtained at 300 North 5th, Manhattan, KS 66502. Fund financial statements. A fund is a grouping of related accounts that is used to maintain control over resources that have been segregated for specific activities or objectives. The City of Manhattan, like other state and local governments, uses fund accounting to ensure and demonstrate compliance with finance-related legal requirements. All of the funds of the City of Manhattan can be divided into three categories: governmental funds, proprietary funds, and fiduciary funds. Governmental funds. Governmental funds are used to account for essentially the same functions reported as governmental activities in the government-wide financial statements. However, unlike the government-wide financial statements, governmental fund financial statements focus on near-term inflows and outflows of spendable resources, as well as on balances of spendable resources available at the end of the fiscal year. Such information may be useful in evaluating a government’s near-term financing requirements. Because the focus of the governmental funds is narrower than that of the government-wide financial statements, it is useful to compare the information presented for governmental funds with similar information presented for governmental activities in the government-wide financial statements. By doing so, readers may better understand the long-term impact of the government’s near-term financing decisions. Both the governmental fund balance sheet and the governmental fund statement of revenues, expenditures, and changes in fund balances provide a reconciliation to facilitate this comparison between governmental funds and governmental activities. The City of Manhattan maintains 84 individual governmental funds. Information is presented separately in the governmental fund balance sheet and in the governmental fund statement of revenues, expenditures, and changes in fund balances for the general fund, Riley County Police
Page 22
Department fund, debt service fund, and capital projects fund, all of which are considered to be major funds. Data from the other 80 governmental funds are combined into a single aggregated presentation. Individual fund data for each of these nonmajor governmental funds is provided in the form of combining statements elsewhere in this report. The City of Manhattan adopts an annual appropriated budget for its general fund and the Riley County Police Department fund. Budgetary comparison statements have been provided for these funds to demonstrate compliance with budget. Proprietary funds. The City of Manhattan maintains two different types of proprietary funds. Enterprise funds are used to report the same functions presented as business-type activities in the government-wide financial statements. The City of Manhattan uses enterprise funds to account for its water, wastewater, and storm water management operations. Internal service funds are an accounting device used to accumulate and allocate costs internally among the City of Manhattan’s various functions. The City of Manhattan uses internal service funds to account for its motor pool services, its health care program, its workers’ compensation program, and its photocopy services. Because these four services predominately benefit governmental rather than business-type functions, they have been included within the governmental activities in the government-wide financial statements. Proprietary funds provide the same type of information as the government-wide financial statements, only in more detail. The proprietary fund financial statements provide separate information for the water, wastewater, and storm water management operations. Only the water and wastewater operations are considered to be major funds. Individual fund data for the internal service funds is provided in the form of combining statements elsewhere in this report. Fiduciary funds. Fiduciary funds are used to account for resources held for the benefit of parties outside the government. Fiduciary funds are not reflected in the government-wide financial statements because the resources of those funds are not available to support the City of Manhattan’s own programs. The accounting used for fiduciary funds is much like that used for proprietary funds. Notes to the financial statements. The notes provide additional information that is essential to a full understanding of the data provided in the government-wide and fund financial statements. Other Information. In addition to the financial statements and the notes described above, the combining statements for nonmajor governmental funds and internal service funds are presented as other supplementary information immediately following the notes. Government-wide Financial Analysis. As noted earlier, net position may serve over time as a useful indicator of a government’s financial position. In the case of the City of Manhattan, assets exceeded liabilities by $203,794,739 at the close of 2012. A large portion of the City of Manhattan’s net position (39.1 percent) reflects its investment in capital assets (e.g. land, buildings, machinery, infrastructure, and equipment), less any related debt used to acquire those assets that is still outstanding. The City of Manhattan uses these capital assets to provide services to citizens; consequently, these assets are not available for future spending. Although the City of Manhattan’s investment in its capital assets is reported net of related debt, it should be noted that the resources needed to repay this debt must be provided from other sources, since the capital assets themselves cannot be used to liquidate these liabilities.
Page 23
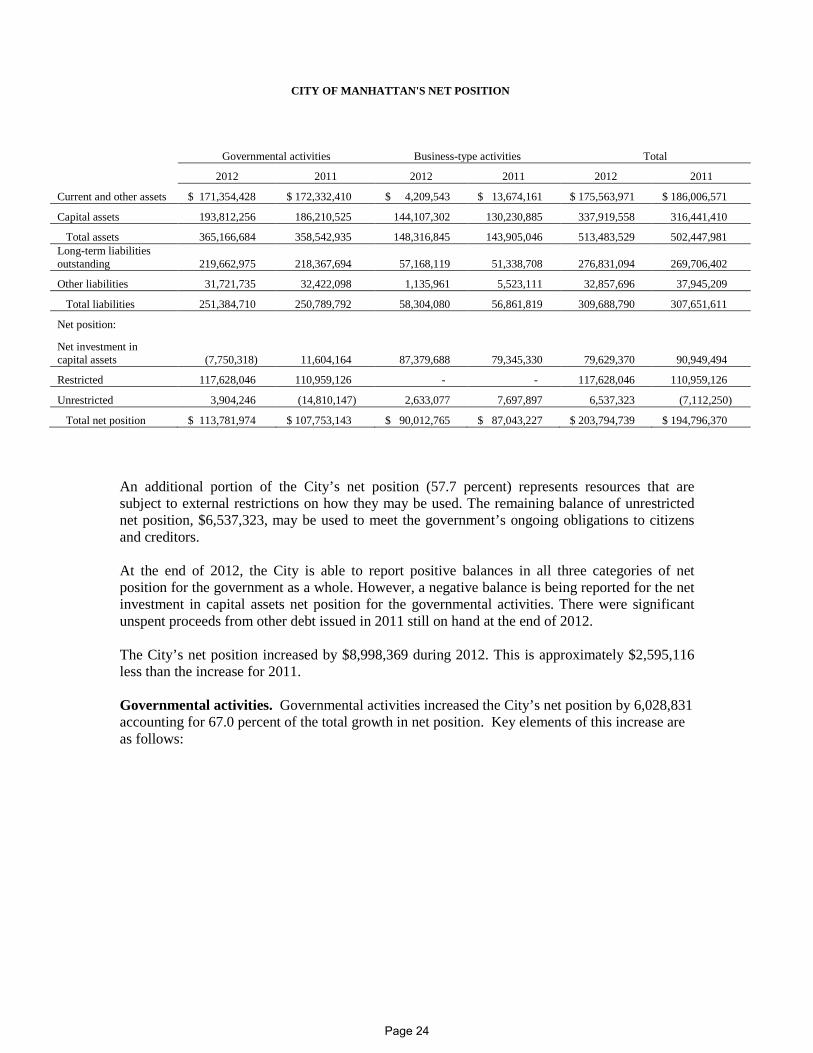
CITY OF MANHATTAN'S NET POSITION
Governmental activities Business-type activities Total
2012 2011 2012 2011 2012 2011
Current and other assets $ 171,354,428 $ 172,332,410 $ 4,209,543 $ 13,674,161 $ 175,563,971 $ 186,006,571
Capital assets 193,812,256 186,210,525 144,107,302 130,230,885 337,919,558 316,441,410
Total assets 365,166,684 358,542,935 148,316,845 143,905,046 513,483,529 502,447,981 Long-term liabilities outstanding 219,662,975 218,367,694 57,168,119 51,338,708 276,831,094 269,706,402
Other liabilities 31,721,735 32,422,098 1,135,961 5,523,111 32,857,696 37,945,209
Total liabilities 251,384,710 250,789,792 58,304,080 56,861,819 309,688,790 307,651,611
Net position:
Net investment in capital assets (7,750,318) 11,604,164 87,379,688 79,345,330 79,629,370 90,949,494
Restricted 117,628,046 110,959,126 - - 117,628,046 110,959,126
Unrestricted 3,904,246 (14,810,147) 2,633,077 7,697,897 6,537,323 (7,112,250)
Total net position $ 113,781,974 $ 107,753,143 $ 90,012,765 $ 87,043,227 $ 203,794,739 $ 194,796,370 An additional portion of the City’s net position (57.7 percent) represents resources that are subject to external restrictions on how they may be used. The remaining balance of unrestricted net position, $6,537,323, may be used to meet the government’s ongoing obligations to citizens and creditors. At the end of 2012, the City is able to report positive balances in all three categories of net position for the government as a whole. However, a negative balance is being reported for the net investment in capital assets net position for the governmental activities. There were significant unspent proceeds from other debt issued in 2011 still on hand at the end of 2012. The City’s net position increased by $8,998,369 during 2012. This is approximately $2,595,116 less than the increase for 2011. Governmental activities. Governmental activities increased the City’s net position by 6,028,831 accounting for 67.0 percent of the total growth in net position. Key elements of this increase are as follows:
Page 24
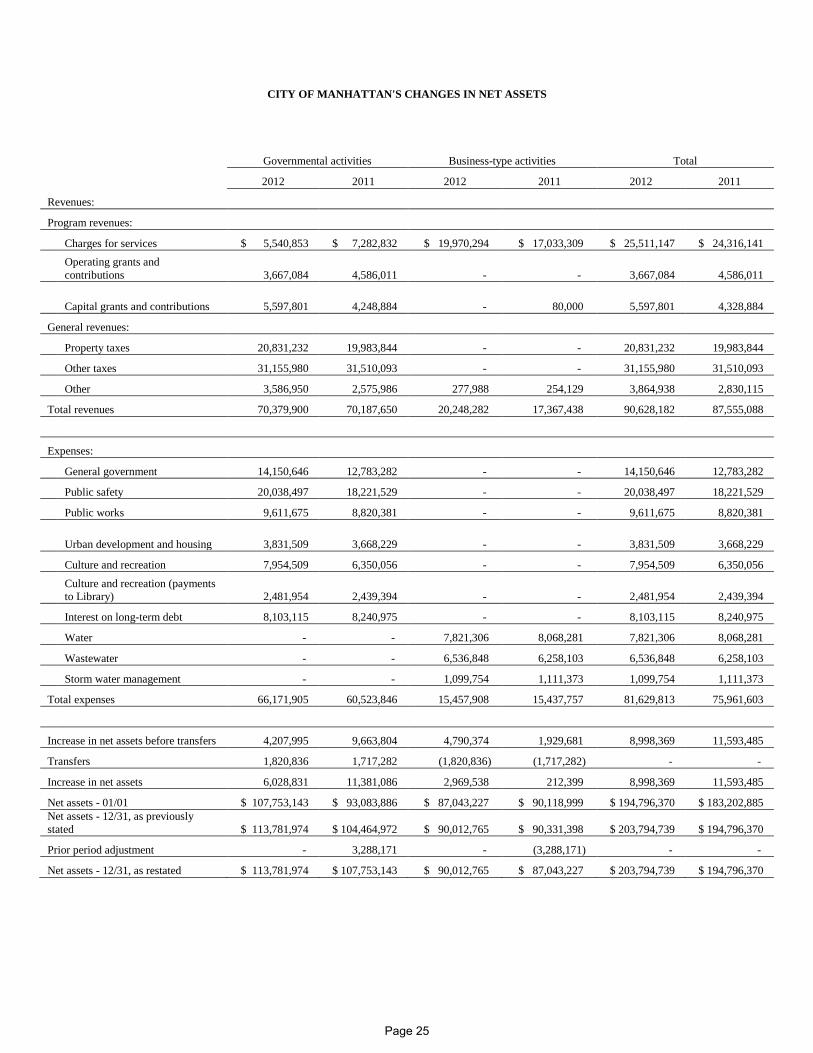
CITY OF MANHATTAN'S CHANGES IN NET ASSETS
Governmental activities Business-type activities Total
2012 2011 2012 2011 2012 2011
Revenues:
Program revenues:
Charges for services $ 5,540,853 $ 7,282,832 $ 19,970,294 $ 17,033,309 $ 25,511,147 $ 24,316,141
Operating grants and contributions 3,667,084 4,586,011 - - 3,667,084 4,586,011
Capital grants and contributions 5,597,801 4,248,884 - 80,000 5,597,801 4,328,884
General revenues:
Property taxes 20,831,232 19,983,844 - - 20,831,232 19,983,844
Other taxes 31,155,980 31,510,093 - - 31,155,980 31,510,093
Other 3,586,950 2,575,986 277,988 254,129 3,864,938 2,830,115
Total revenues 70,379,900 70,187,650 20,248,282 17,367,438 90,628,182 87,555,088
Expenses:
General government 14,150,646 12,783,282 - - 14,150,646 12,783,282
Public safety 20,038,497 18,221,529 - - 20,038,497 18,221,529
Public works 9,611,675 8,820,381 - - 9,611,675 8,820,381
Urban development and housing 3,831,509 3,668,229 - - 3,831,509 3,668,229
Culture and recreation 7,954,509 6,350,056 - - 7,954,509 6,350,056
Culture and recreation (payments to Library) 2,481,954 2,439,394 - - 2,481,954 2,439,394
Interest on long-term debt 8,103,115 8,240,975 - - 8,103,115 8,240,975
Water - - 7,821,306 8,068,281 7,821,306 8,068,281
Wastewater - - 6,536,848 6,258,103 6,536,848 6,258,103
Storm water management - - 1,099,754 1,111,373 1,099,754 1,111,373
Total expenses 66,171,905 60,523,846 15,457,908 15,437,757 81,629,813 75,961,603
Increase in net assets before transfers 4,207,995 9,663,804 4,790,374 1,929,681 8,998,369 11,593,485
Transfers 1,820,836 1,717,282 (1,820,836) (1,717,282) - -
Increase in net assets 6,028,831 11,381,086 2,969,538 212,399 8,998,369 11,593,485
Net assets - 01/01 $ 107,753,143 $ 93,083,886 $ 87,043,227 $ 90,118,999 $ 194,796,370 $ 183,202,885 Net assets - 12/31, as previously stated $ 113,781,974 $ 104,464,972 $ 90,012,765 $ 90,331,398 $ 203,794,739 $ 194,796,370
Prior period adjustment - 3,288,171 - (3,288,171) - -
Net assets - 12/31, as restated $ 113,781,974 $ 107,753,143 $ 90,012,765 $ 87,043,227 $ 203,794,739 $ 194,796,370
Page 25
• Capital grants for governmental activities increased by $1,348,917 from 2011 to 2012. Some of this increase is due to an increase in grant revenues received from the Federal Aviation in 2012 as compared to 2011 for improvements to the general aviation apron, runway 3-21, and the design of the terminal expansion.
• Operating grants and contributions decreased by $918,927 from 2011 to 2012. Over 70% of this decrease can be attributed to a decline in operating grants and contributions for urban housing and development. The remaining decrease reflects the normal fluctuation in several of the City’s grant funds.
• Charges for services for governmental activities decreased by $1,741,979 from 2011 to 2012. The reclassification of payment in lieu of taxes, franchise fees, and admin fees as interfund transfers decreased charges for services by $2,111,348. This decrease was partially offset by increases by the opening of the new Flint Hills Discovery Center and other increases in the culture and recreation function.
• Property taxes increased by $847,388 from 2011 to 2012. The increase in taxes levied in 2012 is lower than the increase between 2010 and 2011 ($2,424,445).
• Other taxes decreased by $354,113 during 2012. Sales tax revenues decreased for the downtown TIF district by approximately $528,000. This decrease was partially offset by increases in transient guest tax, franchise fees and other sales tax revenues.
• Other general revenues increased by $1,010,964 from 2011 to 2012. Over half of this increase is attributable to unrestricted investment earnings. Other increases are primarily related to unrestricted grants and contributions in capital projects.
Total expenses increased by $5,648,059 from 2011 to 2012. Expenses for the general government public safety, public works, urban development and housing, culture and recreation, all increased and interest on long-term debt decreased by $137,860. The general government function increased expenses by $1,367,364 (10.7 percent) from 2011 to 2012. Some of these additional expenses are related to the restructuring of the legal services division. Previously clerical duties were contracted, office space was rented from a local firm, and most office supplies were part of the contract agreement (not directly purchased). In 2012, the legal services division was moved in to City Hall. This change required a remodeling project of part of City Hall, the hire of an additional staff position, the purchase of new office equipment, and an increase in office supplies. The airport had several capital equipment purchases, improvements to the long term parking lot, and project designs that occurred in 2012. Other significant increases include escalating health insurance premiums and payroll tax expenses. Expenses for the culture and recreation function increased by $1,604,453 (25.3 percent) from 2011 to 2012. Much of the increase can be attributed to the opening of the new Flint Hills Discovery Center. Expenses for public safety increased $1,816,968 (10 percent) as a result of adding 12 new firefighters in May of 2012 and the construction of two new fire stations. The public works function increased by $791,294 (9.0 percent) from 2011 to 2012. This increase is primarily related to the construction of a new traffic maintenance facility.
Page 26
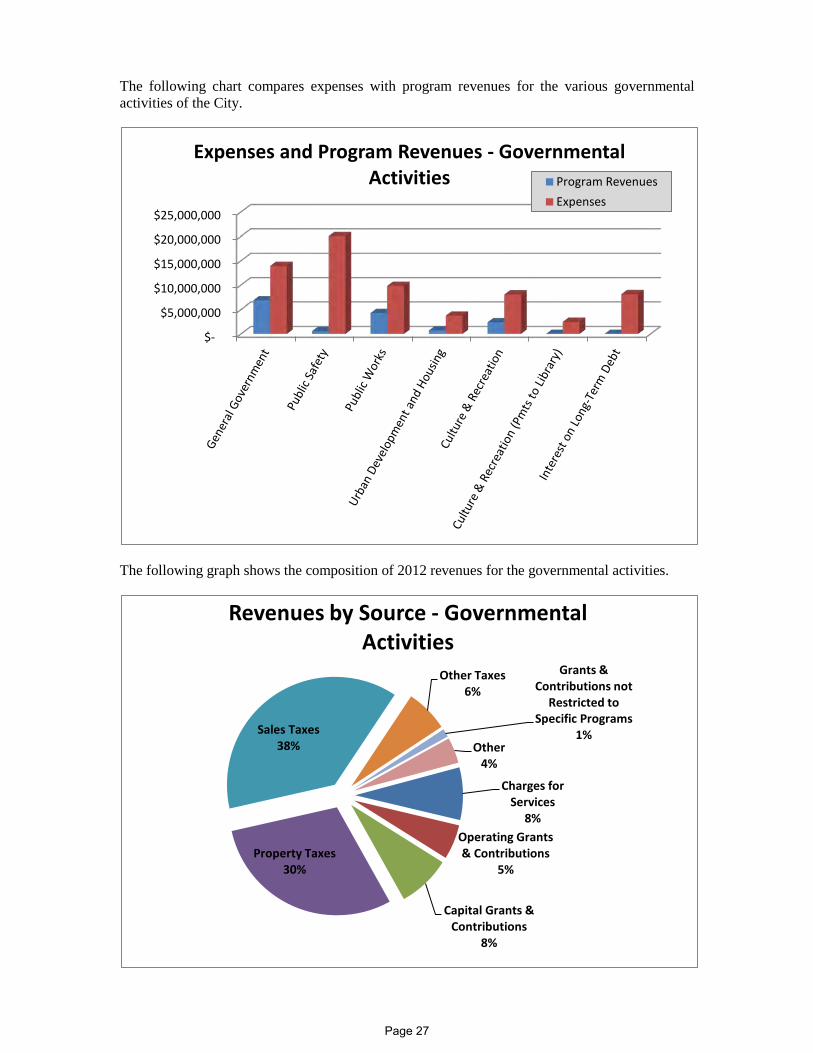
The following chart compares expenses with program revenues for the various governmental activities of the City.
The following graph shows the composition of 2012 revenues for the governmental activities.
$-
$5,000,000
$10,000,000
$15,000,000
$20,000,000
$25,000,000
Expenses and Program Revenues - Governmental Activities Program Revenues
Expenses
Charges for Services
8% Operating Grants & Contributions
5%
Capital Grants & Contributions
8%
Property Taxes 30%
Sales Taxes 38%
Other Taxes 6%
Grants & Contributions not
Restricted to Specific Programs
1% Other
4%
Revenues by Source - Governmental Activities
Page 27
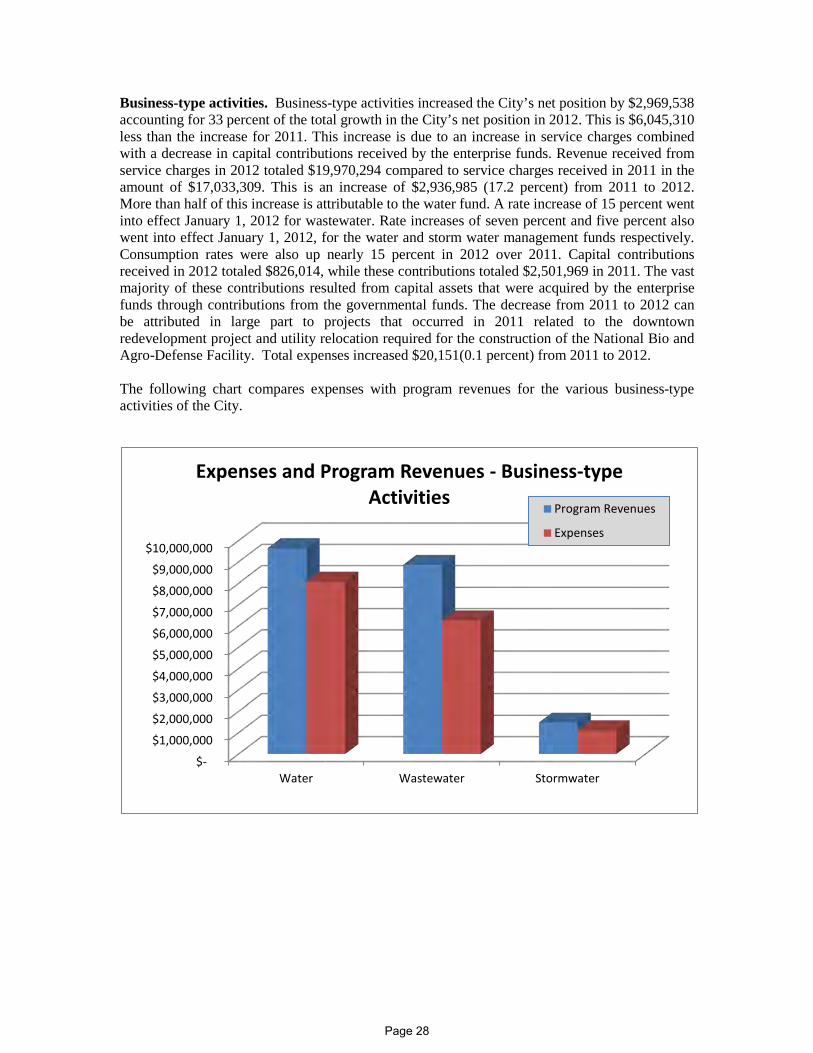
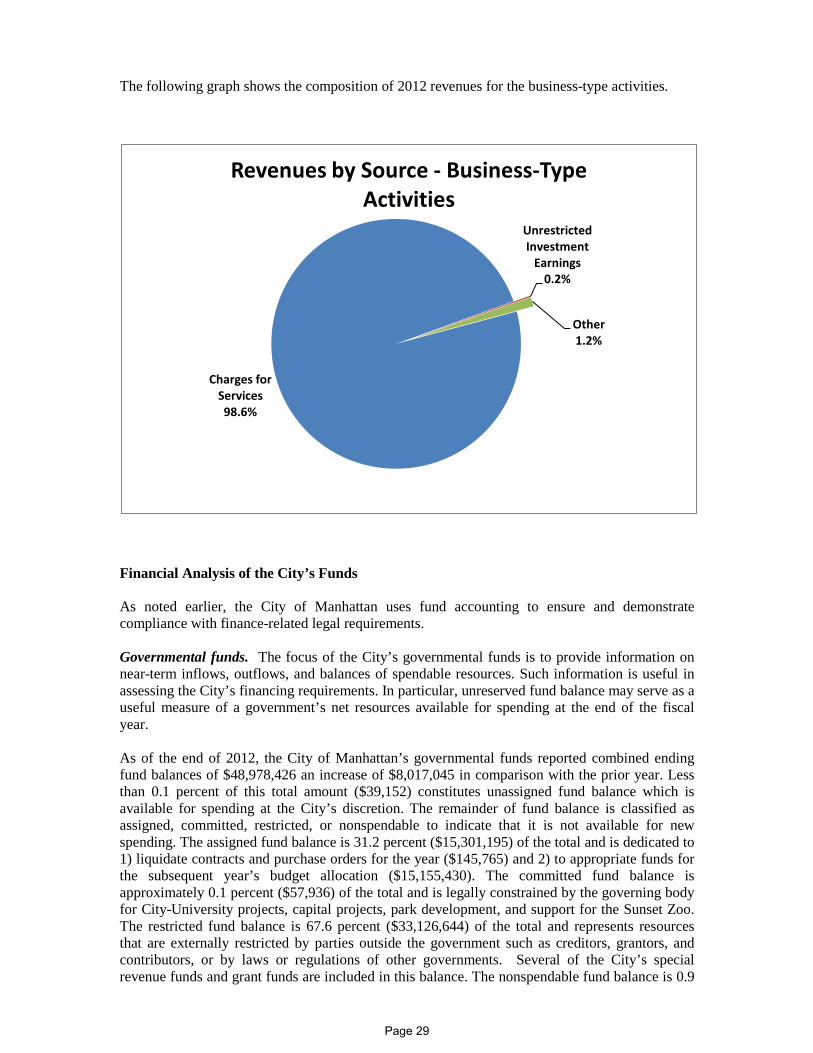
Business-type activities. Business-type activities increased the City’s net position by $2,969,538 accounting for 33 percent of the total growth in the City’s net position in 2012. This is $6,045,310 less than the increase for 2011. This increase is due to an increase in service charges combined with a decrease in capital contributions received by the enterprise funds. Revenue received from service charges in 2012 totaled $19,970,294 compared to service charges received in 2011 in the amount of $17,033,309. This is an increase of $2,936,985 (17.2 percent) from 2011 to 2012. More than half of this increase is attributable to the water fund. A rate increase of 15 percent went into effect January 1, 2012 for wastewater. Rate increases of seven percent and five percent also went into effect January 1, 2012, for the water and storm water management funds respectively. Consumption rates were also up nearly 15 percent in 2012 over 2011. Capital contributions received in 2012 totaled $826,014, while these contributions totaled $2,501,969 in 2011. The vast majority of these contributions resulted from capital assets that were acquired by the enterprise funds through contributions from the governmental funds. The decrease from 2011 to 2012 can be attributed in large part to projects that occurred in 2011 related to the downtown redevelopment project and utility relocation required for the construction of the National Bio and Agro-Defense Facility. Total expenses increased $20,151(0.1 percent) from 2011 to 2012. The following chart compares expenses with program revenues for the various business-type activities of the City.
$-
$1,000,000
$2,000,000
$3,000,000
$4,000,000
$5,000,000
$6,000,000
$7,000,000
$8,000,000
$9,000,000
$10,000,000
Water Wastewater Stormwater
Expenses and Program Revenues - Business-type Activities
Program Revenues
Expenses
Page 28
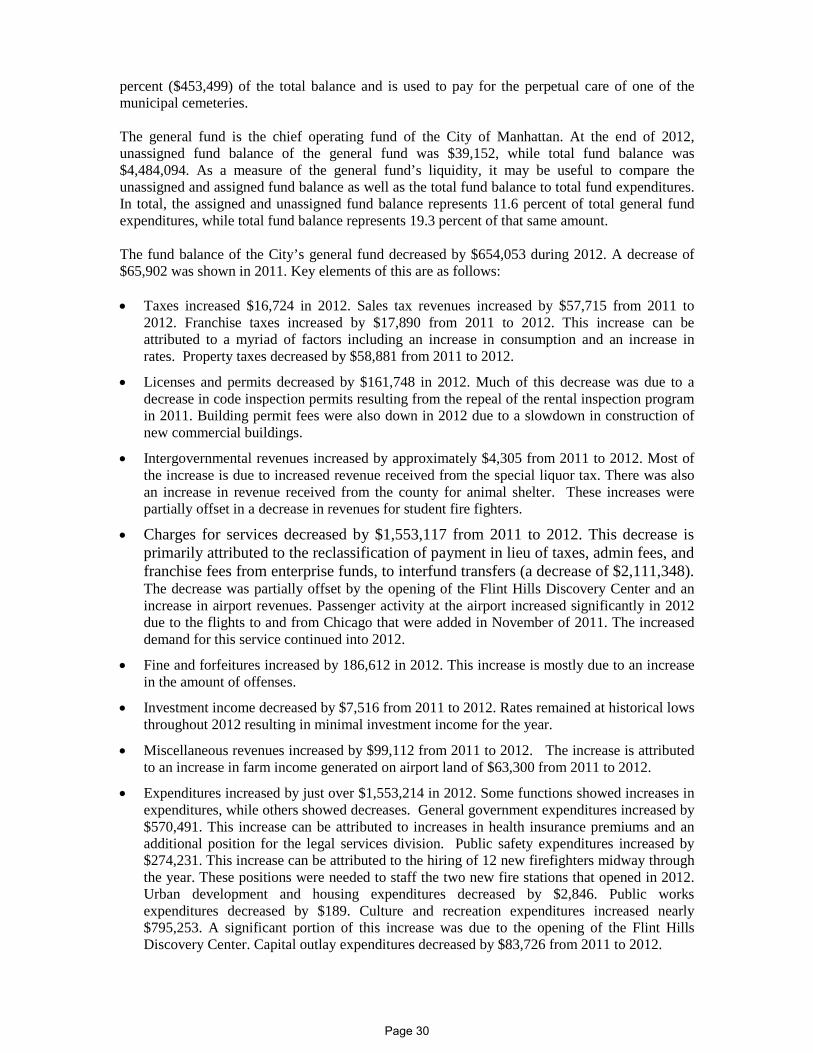
The following graph shows the composition of 2012 revenues for the business-type activities.
Financial Analysis of the City’s Funds As noted earlier, the City of Manhattan uses fund accounting to ensure and demonstrate compliance with finance-related legal requirements. Governmental funds. The focus of the City’s governmental funds is to provide information on near-term inflows, outflows, and balances of spendable resources. Such information is useful in assessing the City’s financing requirements. In particular, unreserved fund balance may serve as a useful measure of a government’s net resources available for spending at the end of the fiscal year. As of the end of 2012, the City of Manhattan’s governmental funds reported combined ending fund balances of $48,978,426 an increase of $8,017,045 in comparison with the prior year. Less than 0.1 percent of this total amount ($39,152) constitutes unassigned fund balance which is available for spending at the City’s discretion. The remainder of fund balance is classified as assigned, committed, restricted, or nonspendable to indicate that it is not available for new spending. The assigned fund balance is 31.2 percent ($15,301,195) of the total and is dedicated to 1) liquidate contracts and purchase orders for the year ($145,765) and 2) to appropriate funds for the subsequent year’s budget allocation ($15,155,430). The committed fund balance is approximately 0.1 percent ($57,936) of the total and is legally constrained by the governing body for City-University projects, capital projects, park development, and support for the Sunset Zoo. The restricted fund balance is 67.6 percent ($33,126,644) of the total and represents resources that are externally restricted by parties outside the government such as creditors, grantors, and contributors, or by laws or regulations of other governments. Several of the City’s special revenue funds and grant funds are included in this balance. The nonspendable fund balance is 0.9
Charges for Services 98.6%
Unrestricted Investment
Earnings 0.2%
Other 1.2%
Revenues by Source - Business-Type Activities
Page 29
percent ($453,499) of the total balance and is used to pay for the perpetual care of one of the municipal cemeteries. The general fund is the chief operating fund of the City of Manhattan. At the end of 2012, unassigned fund balance of the general fund was $39,152, while total fund balance was $4,484,094. As a measure of the general fund’s liquidity, it may be useful to compare the unassigned and assigned fund balance as well as the total fund balance to total fund expenditures. In total, the assigned and unassigned fund balance represents 11.6 percent of total general fund expenditures, while total fund balance represents 19.3 percent of that same amount. The fund balance of the City’s general fund decreased by $654,053 during 2012. A decrease of $65,902 was shown in 2011. Key elements of this are as follows: • Taxes increased $16,724 in 2012. Sales tax revenues increased by $57,715 from 2011 to
2012. Franchise taxes increased by $17,890 from 2011 to 2012. This increase can be attributed to a myriad of factors including an increase in consumption and an increase in rates. Property taxes decreased by $58,881 from 2011 to 2012.
• Licenses and permits decreased by $161,748 in 2012. Much of this decrease was due to a decrease in code inspection permits resulting from the repeal of the rental inspection program in 2011. Building permit fees were also down in 2012 due to a slowdown in construction of new commercial buildings.
• Intergovernmental revenues increased by approximately $4,305 from 2011 to 2012. Most of the increase is due to increased revenue received from the special liquor tax. There was also an increase in revenue received from the county for animal shelter. These increases were partially offset in a decrease in revenues for student fire fighters.
• Charges for services decreased by $1,553,117 from 2011 to 2012. This decrease is primarily attributed to the reclassification of payment in lieu of taxes, admin fees, and franchise fees from enterprise funds, to interfund transfers (a decrease of $2,111,348). The decrease was partially offset by the opening of the Flint Hills Discovery Center and an increase in airport revenues. Passenger activity at the airport increased significantly in 2012 due to the flights to and from Chicago that were added in November of 2011. The increased demand for this service continued into 2012.
• Fine and forfeitures increased by 186,612 in 2012. This increase is mostly due to an increase in the amount of offenses.
• Investment income decreased by $7,516 from 2011 to 2012. Rates remained at historical lows throughout 2012 resulting in minimal investment income for the year.
• Miscellaneous revenues increased by $99,112 from 2011 to 2012. The increase is attributed to an increase in farm income generated on airport land of $63,300 from 2011 to 2012.
• Expenditures increased by just over $1,553,214 in 2012. Some functions showed increases in expenditures, while others showed decreases. General government expenditures increased by $570,491. This increase can be attributed to increases in health insurance premiums and an additional position for the legal services division. Public safety expenditures increased by $274,231. This increase can be attributed to the hiring of 12 new firefighters midway through the year. These positions were needed to staff the two new fire stations that opened in 2012. Urban development and housing expenditures decreased by $2,846. Public works expenditures decreased by $189. Culture and recreation expenditures increased nearly $795,253. A significant portion of this increase was due to the opening of the Flint Hills Discovery Center. Capital outlay expenditures decreased by $83,726 from 2011 to 2012.
Page 30
• Transfers in increased $2,360,925 from 2011 to 2012. This increase is primarily attributed to the reclassification of payment in lieu of taxes, admin fees, and franchise fees from enterprise funds, to interfund transfers (an increase of $2,111,348).
The Riley County Police Department fund provides for expenditures made to the Riley County Police Department (RCPD). Police protection is provided to the City by the RCPD under a statutory arrangement whereby the City is responsible for 80 percent of the RCPD’s budget. This fund has a total fund balance of $228,355, of which $178,355 is restricted and $50,000 is assigned for the subsequent year’s budget appropriations. The debt service fund has a total fund balance of $14,677,973. The net increase in fund balance during the current year was $6,625,073. Debt service expenditures outpaced revenues by $1,459,679. However, this deficit was offset by transfers in made from other funds. The deficit of revenues over debt service expenditures in 2012 was $3,702,275 lower than in 2011. The capital projects fund is used to account for the acquisition and construction of major facilities which are financed predominately through the issuance of general obligation bonds. This fund has a total fund balance of $4,539,473, all of which is restricted. This fund balance decreased by $2,043,642 during the current year, following a decrease of $11,490,740 in 2011. Nearly $12,300,000 in unspent debt proceeds, mostly from the Taxable STAR Bonds-Series 2009-2 issued to finance eligible facilities and infrastructure costs within the south project area of the downtown redevelopment project, were still on hand at the end of 2011. This amount had declined to approximately $1,500,000 at the end of 2012, as eligible expenditures were made. The temporary notes payable liability decreased by $895,000 from 2011 to 2012. This represents temporary notes maturing in the upcoming year for which the legal steps and ability to consummate refinancing have not been met. The City typically issues general obligation bonds in June and December of each year. Proprietary funds. The City’s proprietary funds provide the same type of information found in the government-wide financial statements, but in more detail. Unrestricted net position of the water fund at the end of 2012 amounted to $3,501,039; the wastewater fund amounted to ($437,031) and the storm water management fund amounted to ($430,031). The total growth (reduction) in net position for each fund was $1,312,172, $1,196,593, and $460,773, respectively. A key element of these changes is as follows: • Capital contributions are typically a significant revenue source for all of the enterprise funds.
Capital contributions result primarily from the fact that a large portion of the infrastructure assets for these funds are financed from the proceeds of general obligation bonds which are repaid from governmental funds rather than these enterprise funds. Some capital assets are also donated by outside parties. During the current year, total capital contributions were $816,713, $0 and $9,301, respectively, as compared to $1,522,168, $806,449 and $173,352 in 2011. The overall decrease from 2011 to 2012 was $1,675,955.
Other factors concerning the finances of these funds have already been addressed in the discussion of the City’s business-type activities.
Page 31
General Fund Budgetary Highlights Revenues exceeded budgetary estimates in all categories with the exception of investment income. Investment income has declined dramatically since 2007, and while the 2012 budget figure was lowered in comparison to previous years, the magnitude of the decline was not anticipated. The most significant variance from budget was in taxes, which exceeded the budgeted amount by approximately $387,000. The majority of this increase stemmed from increased sales taxes over 2011 due to the turnaround of the local economy. Charges for services exceeded budget by $162,943. Part of this variance can be attributed to an increase in airport revenues. The Flint Hills Discovery Center opened in 2012 and the budgeted revenues were based on conservative estimates; actual revenues exceeded those estimates. The remainder of the increase can be attributed to an increase in pool admission revenues. Fines and forfeitures surpassed budget by $216,065 due to a change in the fine structure and an increase in the number of offenses. Total expenditures were less than budgetary estimates by $884,919 or 3.8 percent of total budgeted expenditures. Capital Asset and Debt Administration Capital assets. The City of Manhattan’s investment in capital assets for its governmental and business-type activities as of December 31, 2012, amounts to $337,919,558 (net of accumulated depreciation). This investment in capital assets includes land, buildings, improvements, vehicles, machinery and equipment, park and pool facilities, streets, storm sewers, bridges, and water and sewer lines. The total increase in the City’s investment in capital assets was 6.8 percent (a 4.1 percent increase for governmental activities and a 10.7 percent increase for business-type activities). Major capital asset events during 2012 included the following: • The traffic maintenance facility started completed construction in 2012 at a cost of nearly
$700,000.
• The construction of two new fire stations continued into 2012. Construction progress on the fire stations had reached nearly $5.2 million by the end of 2012.
• The Northend Park and Streetscape project was completed in 2012 at a cost of over $840,000.
• The Tecumseh-Quivera Stormwater Improvements Project continued into 2012. Construction in progress totaled over $2 million.
• Construction of the Sunset Zoo Education Center was completed in 2012 with a cost of over $4.5 million.
• Construction of the Flint Hills Discovery Center, including the museum exhibits, continued in 2012. Construction in progress had reached nearly $23.4 million at the end of 2012.
• Construction on the expansions and upgrades to the water treatment and wastewater treatment plants continued during 2012. Construction in progress on the water treatment plant had reached more than $17.7 million at the end of 2012. Construction in progress on the wastewater treatment plant had reached more than $27.1 million at the end of 2012.
Page 32
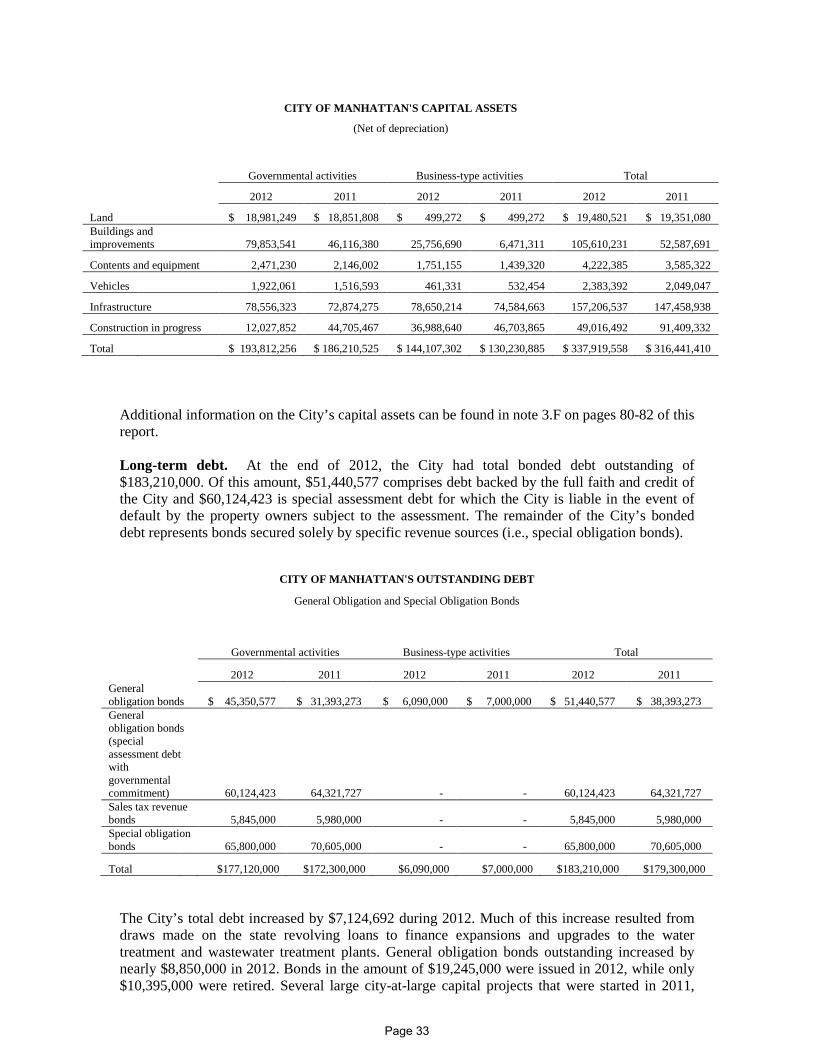
CITY OF MANHATTAN'S CAPITAL ASSETS
(Net of depreciation)
Governmental activities Business-type activities Total
2012 2011 2012 2011 2012 2011
Land $ 18,981,249 $ 18,851,808 $ 499,272 $ 499,272 $ 19,480,521 $ 19,351,080 Buildings and improvements 79,853,541 46,116,380 25,756,690 6,471,311 105,610,231 52,587,691
Contents and equipment 2,471,230 2,146,002 1,751,155 1,439,320 4,222,385 3,585,322
Vehicles 1,922,061 1,516,593 461,331 532,454 2,383,392 2,049,047
Infrastructure 78,556,323 72,874,275 78,650,214 74,584,663 157,206,537 147,458,938
Construction in progress 12,027,852 44,705,467 36,988,640 46,703,865 49,016,492 91,409,332
Total $ 193,812,256 $ 186,210,525 $ 144,107,302 $ 130,230,885 $ 337,919,558 $ 316,441,410 Additional information on the City’s capital assets can be found in note 3.F on pages 80-82 of this report. Long-term debt. At the end of 2012, the City had total bonded debt outstanding of $183,210,000. Of this amount, $51,440,577 comprises debt backed by the full faith and credit of the City and $60,124,423 is special assessment debt for which the City is liable in the event of default by the property owners subject to the assessment. The remainder of the City’s bonded debt represents bonds secured solely by specific revenue sources (i.e., special obligation bonds).
The City’s total debt increased by $7,124,692 during 2012. Much of this increase resulted from draws made on the state revolving loans to finance expansions and upgrades to the water treatment and wastewater treatment plants. General obligation bonds outstanding increased by nearly $8,850,000 in 2012. Bonds in the amount of $19,245,000 were issued in 2012, while only $10,395,000 were retired. Several large city-at-large capital projects that were started in 2011,
CITY OF MANHATTAN'S OUTSTANDING DEBT
General Obligation and Special Obligation Bonds
Governmental activities Business-type activities Total
2012 2011 2012 2011 2012 2011
General obligation bonds $ 45,350,577 $ 31,393,273 $ 6,090,000 $ 7,000,000 $ 51,440,577 $ 38,393,273 General obligation bonds (special assessment debt with governmental commitment) 60,124,423 64,321,727 - - 60,124,423 64,321,727 Sales tax revenue bonds 5,845,000 5,980,000 - - 5,845,000 5,980,000 Special obligation bonds 65,800,000 70,605,000 - - 65,800,000 70,605,000
Total $177,120,000 $172,300,000 $6,090,000 $7,000,000 $183,210,000 $179,300,000
Page 33
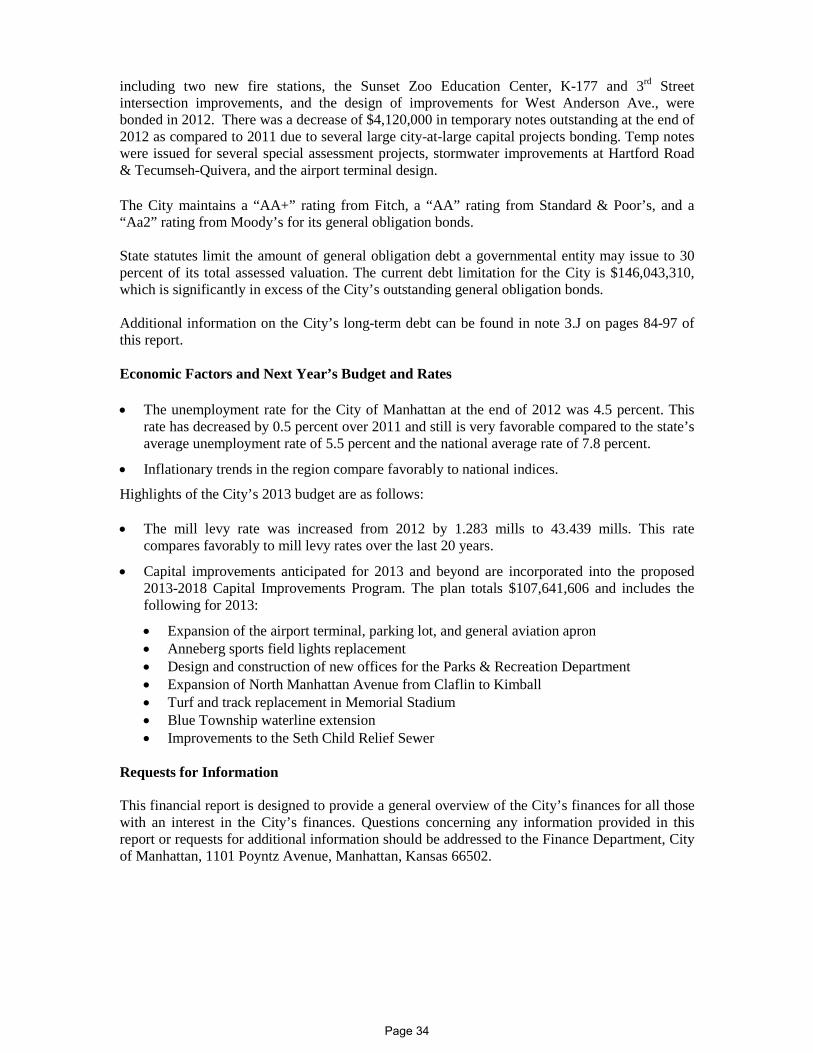
including two new fire stations, the Sunset Zoo Education Center, K-177 and 3rd Street intersection improvements, and the design of improvements for West Anderson Ave., were bonded in 2012. There was a decrease of $4,120,000 in temporary notes outstanding at the end of 2012 as compared to 2011 due to several large city-at-large capital projects bonding. Temp notes were issued for several special assessment projects, stormwater improvements at Hartford Road & Tecumseh-Quivera, and the airport terminal design. The City maintains a “AA+” rating from Fitch, a “AA” rating from Standard & Poor’s, and a “Aa2” rating from Moody’s for its general obligation bonds. State statutes limit the amount of general obligation debt a governmental entity may issue to 30 percent of its total assessed valuation. The current debt limitation for the City is $146,043,310, which is significantly in excess of the City’s outstanding general obligation bonds. Additional information on the City’s long-term debt can be found in note 3.J on pages 84-97 of this report. Economic Factors and Next Year’s Budget and Rates • The unemployment rate for the City of Manhattan at the end of 2012 was 4.5 percent. This
rate has decreased by 0.5 percent over 2011 and still is very favorable compared to the state’s average unemployment rate of 5.5 percent and the national average rate of 7.8 percent.
• Inflationary trends in the region compare favorably to national indices.
Highlights of the City’s 2013 budget are as follows: • The mill levy rate was increased from 2012 by 1.283 mills to 43.439 mills. This rate
compares favorably to mill levy rates over the last 20 years.
• Capital improvements anticipated for 2013 and beyond are incorporated into the proposed 2013-2018 Capital Improvements Program. The plan totals $107,641,606 and includes the following for 2013:
• Expansion of the airport terminal, parking lot, and general aviation apron • Anneberg sports field lights replacement • Design and construction of new offices for the Parks & Recreation Department • Expansion of North Manhattan Avenue from Claflin to Kimball • Turf and track replacement in Memorial Stadium • Blue Township waterline extension • Improvements to the Seth Child Relief Sewer
Requests for Information This financial report is designed to provide a general overview of the City’s finances for all those with an interest in the City’s finances. Questions concerning any information provided in this report or requests for additional information should be addressed to the Finance Department, City of Manhattan, 1101 Poyntz Avenue, Manhattan, Kansas 66502.
Page 34

THIS PAGE INTENTIONALLY LEFT BLANK
Page 35
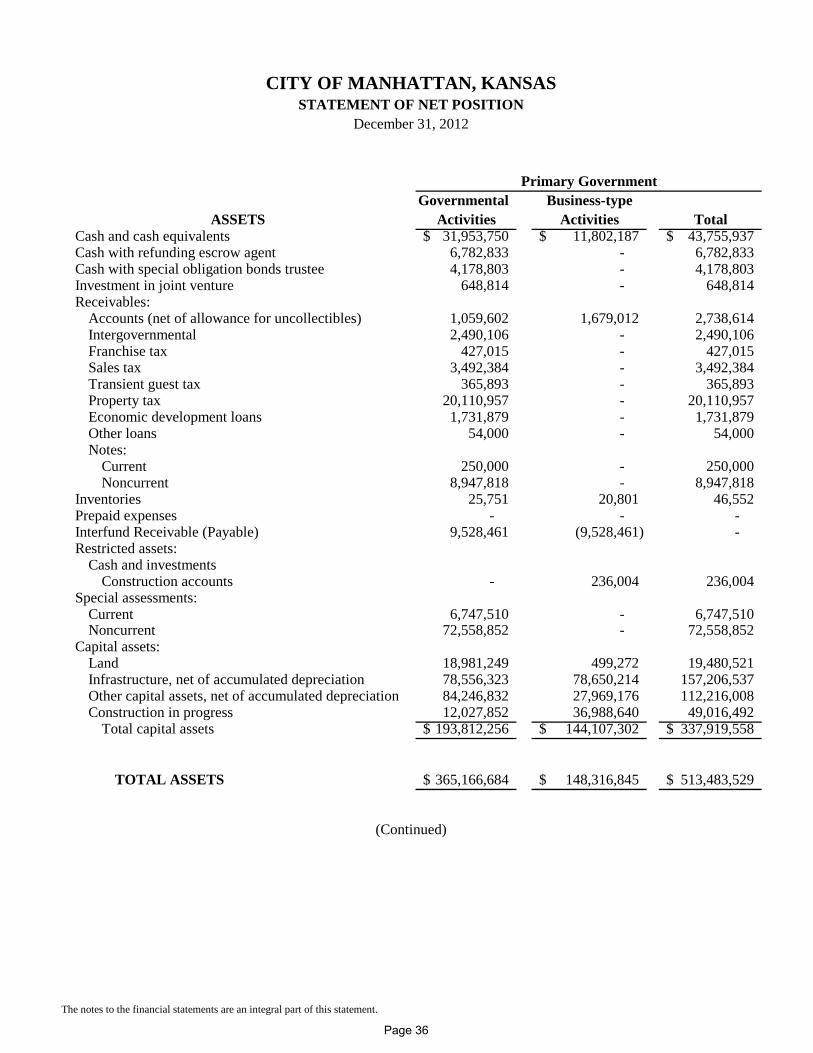
CITY OF MANHATTAN, KANSASSTATEMENT OF NET POSITION
December 31, 2012
Governmental Business-typeASSETS Activities Activities Total
Cash and cash equivalents 31,953,750$ 11,802,187$ 43,755,937$ Cash with refunding escrow agent 6,782,833 - 6,782,833 Cash with special obligation bonds trustee 4,178,803 - 4,178,803 Investment in joint venture 648,814 - 648,814 Receivables:
Accounts (net of allowance for uncollectibles) 1,059,602 1,679,012 2,738,614 Intergovernmental 2,490,106 - 2,490,106 Franchise tax 427,015 - 427,015 Sales tax 3,492,384 - 3,492,384 Transient guest tax 365,893 - 365,893 Property tax 20,110,957 - 20,110,957 Economic development loans 1,731,879 - 1,731,879 Other loans 54,000 - 54,000 Notes:
Current 250,000 - 250,000 Noncurrent 8,947,818 - 8,947,818
Inventories 25,751 20,801 46,552 Prepaid expenses - - - Interfund Receivable (Payable) 9,528,461 (9,528,461) - Restricted assets:
Cash and investments Construction accounts - 236,004 236,004
Special assessments:Current 6,747,510 - 6,747,510 Noncurrent 72,558,852 - 72,558,852
Capital assets:Land 18,981,249 499,272 19,480,521 Infrastructure, net of accumulated depreciation 78,556,323 78,650,214 157,206,537 Other capital assets, net of accumulated depreciation 84,246,832 27,969,176 112,216,008 Construction in progress 12,027,852 36,988,640 49,016,492
Total capital assets 193,812,256$ 144,107,302$ 337,919,558$
TOTAL ASSETS 365,166,684$ 148,316,845$ 513,483,529$
(Continued)
The notes to the financial statements are an integral part of this statement.
Primary Government
Page 36
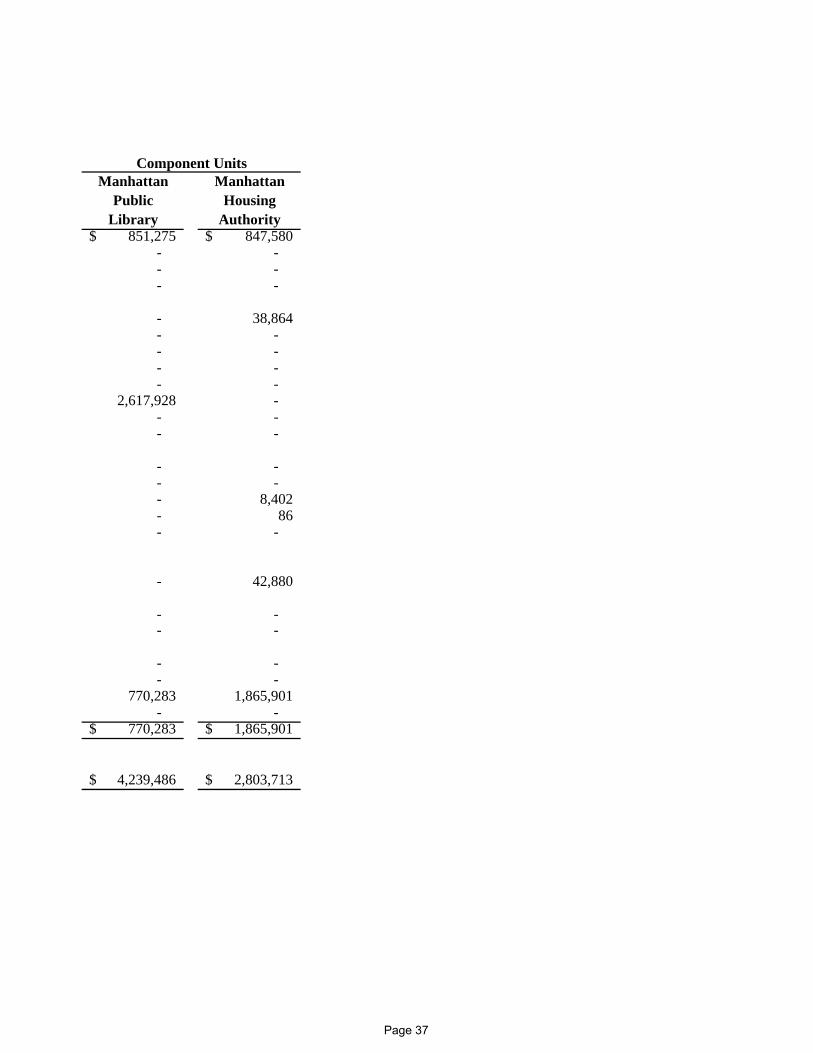
Manhattan ManhattanPublic Housing
Library Authority851,275$ 847,580$
- - - - - -
- 38,864 - - - - - - - -
2,617,928 - - - - -
- - - - - 8,402 - 86 - -
- 42,880
- - - -
- - - -
770,283 1,865,901 - -
770,283$ 1,865,901$
4,239,486$ 2,803,713$
Component Units
Page 37
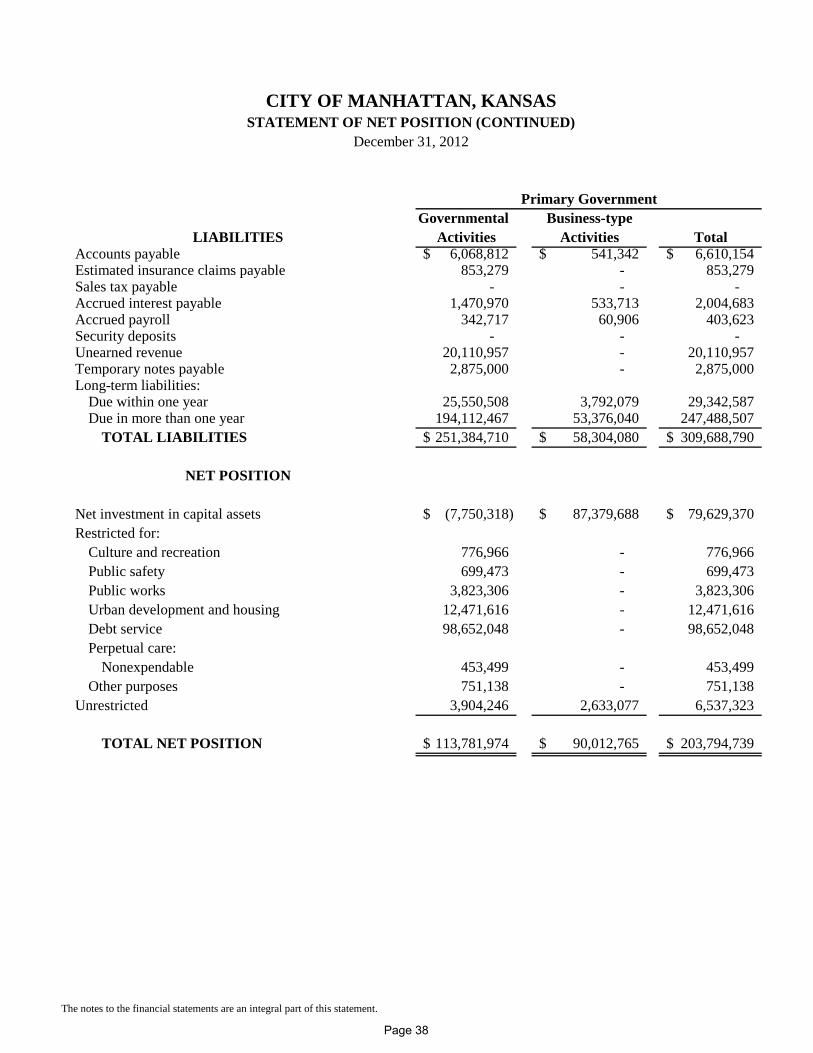
CITY OF MANHATTAN, KANSASSTATEMENT OF NET POSITION (CONTINUED)
December 31, 2012
Governmental Business-typeLIABILITIES Activities Activities Total
Accounts payable 6,068,812$ 541,342$ 6,610,154$ Estimated insurance claims payable 853,279 - 853,279 Sales tax payable - - - Accrued interest payable 1,470,970 533,713 2,004,683 Accrued payroll 342,717 60,906 403,623 Security deposits - - - Unearned revenue 20,110,957 - 20,110,957 Temporary notes payable 2,875,000 - 2,875,000 Long-term liabilities:
Due within one year 25,550,508 3,792,079 29,342,587 Due in more than one year 194,112,467 53,376,040 247,488,507
TOTAL LIABILITIES 251,384,710$ 58,304,080$ 309,688,790$
Net investment in capital assets (7,750,318)$ 87,379,688$ 79,629,370$ Restricted for:
Culture and recreation 776,966 - 776,966 Public safety 699,473 - 699,473 Public works 3,823,306 - 3,823,306 Urban development and housing 12,471,616 - 12,471,616 Debt service 98,652,048 - 98,652,048 Perpetual care:
Nonexpendable 453,499 - 453,499 Other purposes 751,138 - 751,138
Unrestricted 3,904,246 2,633,077 6,537,323
TOTAL NET POSITION 113,781,974$ 90,012,765$ 203,794,739$
The notes to the financial statements are an integral part of this statement.
NET POSITION
Primary Government
Page 38
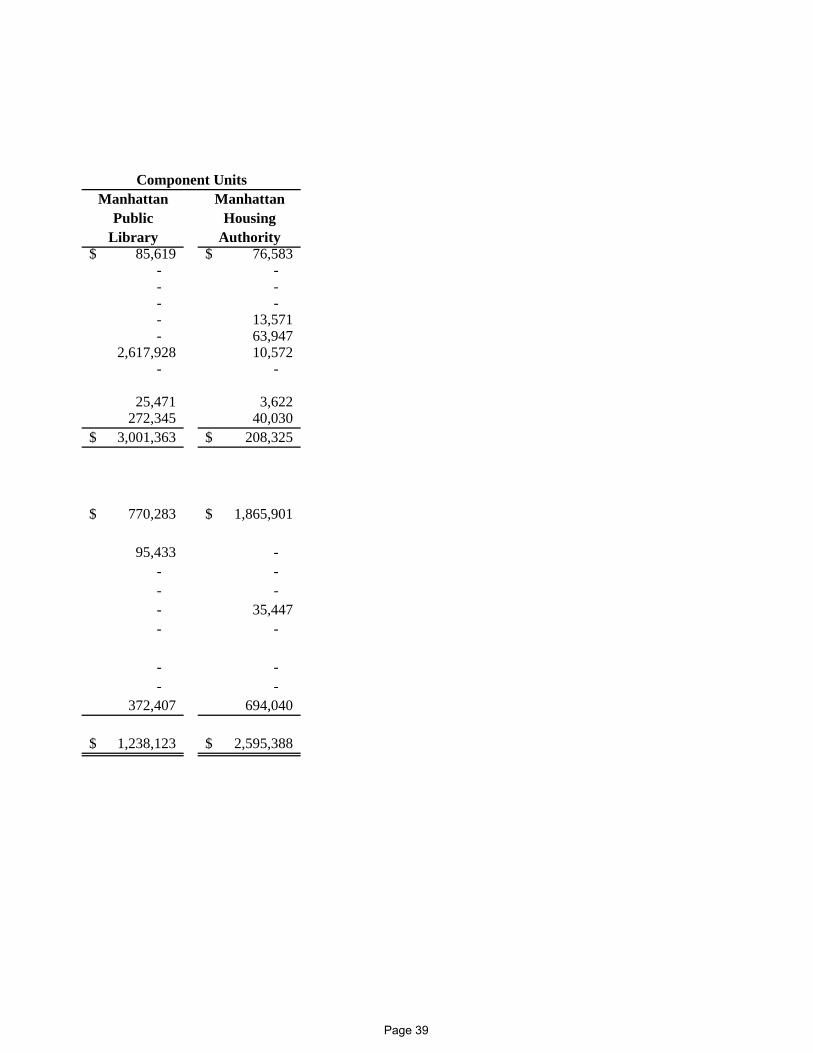
Manhattan ManhattanPublic Housing
Library Authority85,619$ 76,583$
- - - - - - - 13,571 - 63,947
2,617,928 10,572 - -
25,471 3,622 272,345 40,030
3,001,363$ 208,325$
770,283$ 1,865,901$
95,433 - - - - - - 35,447 - -
- - - -
372,407 694,040
1,238,123$ 2,595,388$
Component Units
Page 39
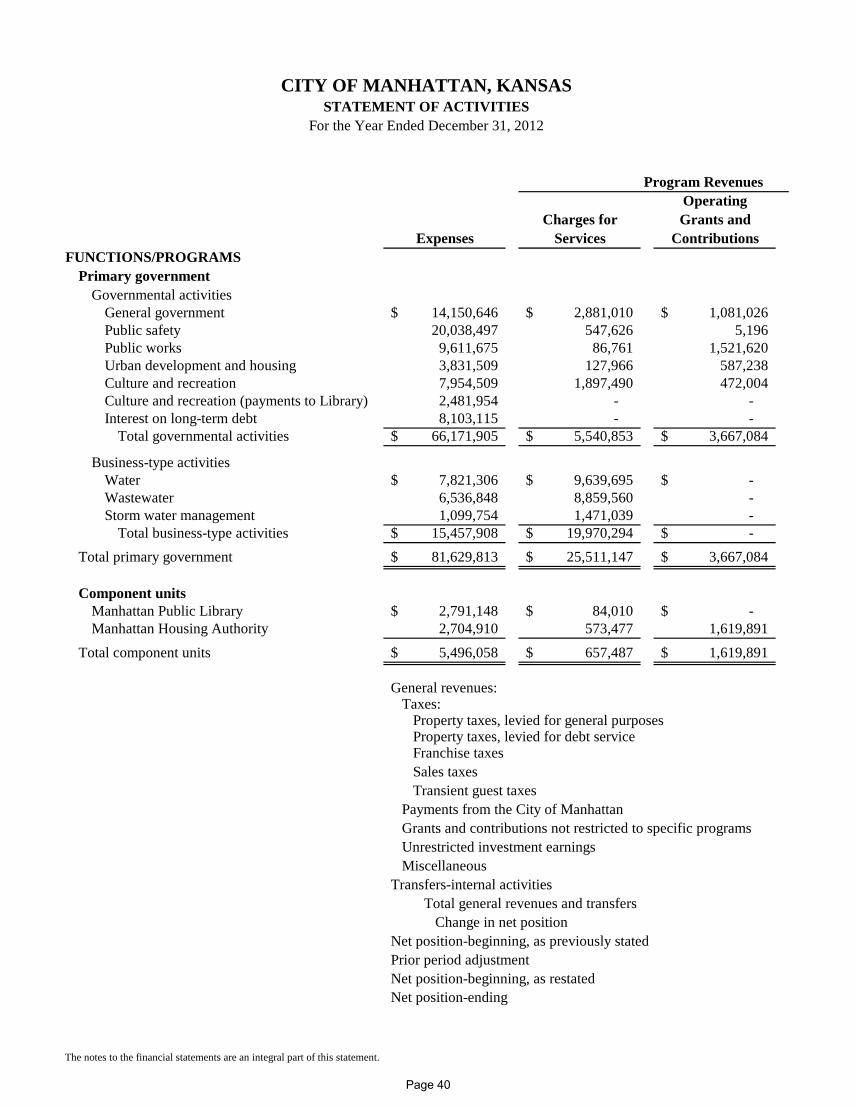
CITY OF MANHATTAN, KANSASSTATEMENT OF ACTIVITIES
For the Year Ended December 31, 2012
OperatingCharges for Grants and
Expenses Services ContributionsFUNCTIONS/PROGRAMS
Primary governmentGovernmental activities
General government 14,150,646$ 2,881,010$ 1,081,026$ Public safety 20,038,497 547,626 5,196 Public works 9,611,675 86,761 1,521,620 Urban development and housing 3,831,509 127,966 587,238 Culture and recreation 7,954,509 1,897,490 472,004 Culture and recreation (payments to Library) 2,481,954 - - Interest on long-term debt 8,103,115 - -
Total governmental activities 66,171,905$ 5,540,853$ 3,667,084$
Business-type activitiesWater 7,821,306$ 9,639,695$ -$ Wastewater 6,536,848 8,859,560 - Storm water management 1,099,754 1,471,039 -
Total business-type activities 15,457,908$ 19,970,294$ -$ Total primary government 81,629,813$ 25,511,147$ 3,667,084$
Component unitsManhattan Public Library 2,791,148$ 84,010$ -$ Manhattan Housing Authority 2,704,910 573,477 1,619,891
Total component units 5,496,058$ 657,487$ 1,619,891$
General revenues: Taxes: Property taxes, levied for general purposes Property taxes, levied for debt service Franchise taxes Sales taxes Transient guest taxes Payments from the City of Manhattan Grants and contributions not restricted to specific programs Unrestricted investment earnings MiscellaneousTransfers-internal activities Total general revenues and transfers Change in net positionNet position-beginning, as previously statedPrior period adjustmentNet position-beginning, as restatedNet position-ending
The notes to the financial statements are an integral part of this statement.
Program Revenues
Page 40
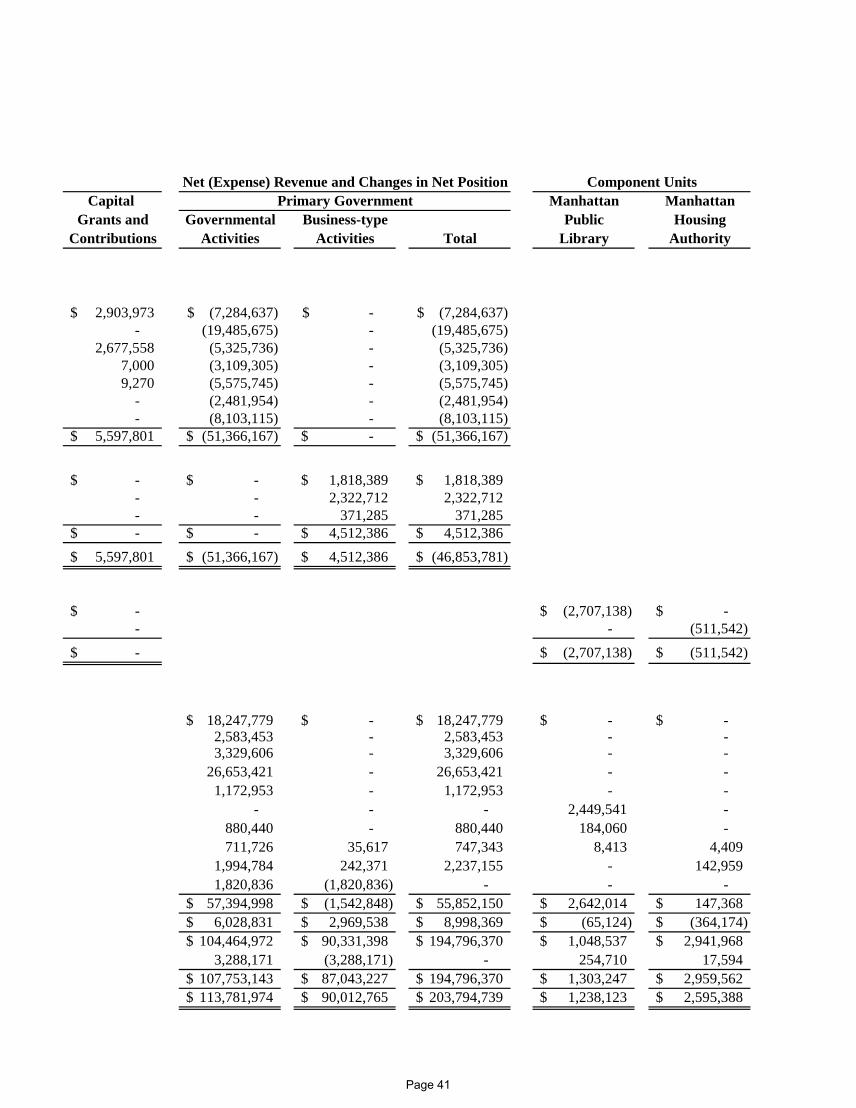
Capital Manhattan ManhattanGrants and Governmental Business-type Public Housing
Contributions Activities Activities Total Library Authority
2,903,973$ (7,284,637)$ -$ (7,284,637)$ - (19,485,675) - (19,485,675)
2,677,558 (5,325,736) - (5,325,736) 7,000 (3,109,305) - (3,109,305) 9,270 (5,575,745) - (5,575,745)
- (2,481,954) - (2,481,954) - (8,103,115) - (8,103,115)
5,597,801$ (51,366,167)$ -$ (51,366,167)$
-$ -$ 1,818,389$ 1,818,389$ - - 2,322,712 2,322,712 - - 371,285 371,285 -$ -$ 4,512,386$ 4,512,386$
5,597,801$ (51,366,167)$ 4,512,386$ (46,853,781)$
-$ (2,707,138)$ -$ - - (511,542)
-$ (2,707,138)$ (511,542)$
18,247,779$ -$ 18,247,779$ -$ -$ 2,583,453 - 2,583,453 - - 3,329,606 - 3,329,606 - -
26,653,421 - 26,653,421 - - 1,172,953 - 1,172,953 - -
- - - 2,449,541 - 880,440 - 880,440 184,060 - 711,726 35,617 747,343 8,413 4,409
1,994,784 242,371 2,237,155 - 142,959 1,820,836 (1,820,836) - - -
57,394,998$ (1,542,848)$ 55,852,150$ 2,642,014$ 147,368$ 6,028,831$ 2,969,538$ 8,998,369$ (65,124)$ (364,174)$
104,464,972$ 90,331,398$ 194,796,370$ 1,048,537$ 2,941,968$ 3,288,171 (3,288,171) - 254,710 17,594
107,753,143$ 87,043,227$ 194,796,370$ 1,303,247$ 2,959,562$ 113,781,974$ 90,012,765$ 203,794,739$ 1,238,123$ 2,595,388$
Component Units Primary Government
Net (Expense) Revenue and Changes in Net Position
Page 41
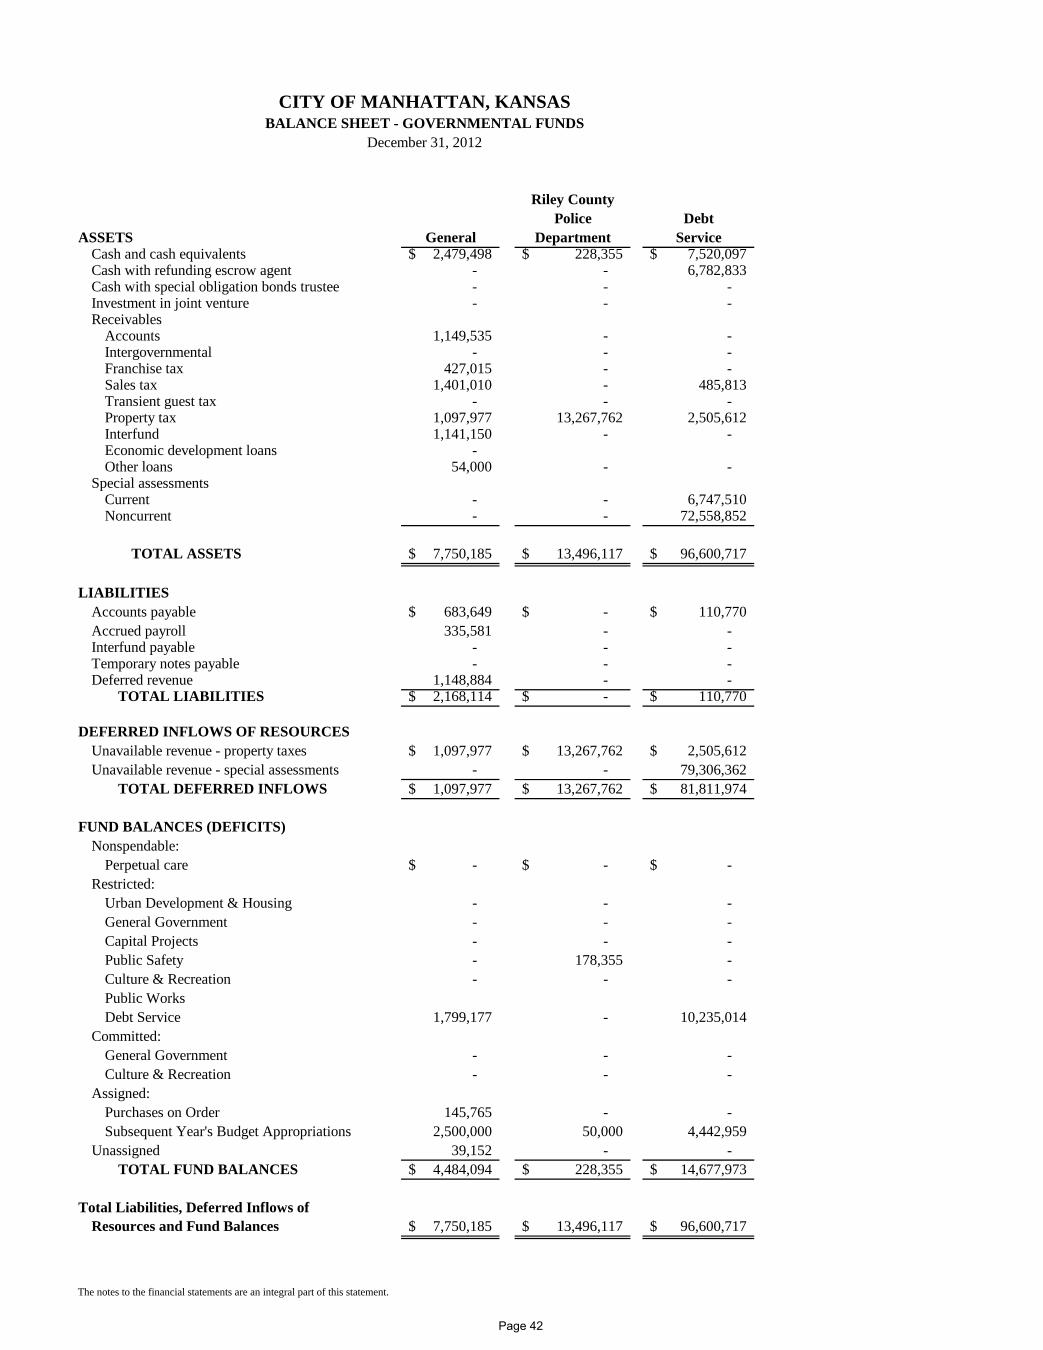
CITY OF MANHATTAN, KANSASBALANCE SHEET - GOVERNMENTAL FUNDS
December 31, 2012
Riley CountyPolice Debt
ASSETS General Department ServiceCash and cash equivalents 2,479,498$ 228,355$ 7,520,097$ Cash with refunding escrow agent - - 6,782,833 Cash with special obligation bonds trustee - - - Investment in joint venture - - - Receivables
Accounts 1,149,535 - - Intergovernmental - - - Franchise tax 427,015 - - Sales tax 1,401,010 - 485,813 Transient guest tax - - - Property tax 1,097,977 13,267,762 2,505,612 Interfund 1,141,150 - - Economic development loans - Other loans 54,000 - -
Special assessmentsCurrent - - 6,747,510 Noncurrent - - 72,558,852
TOTAL ASSETS 7,750,185$ 13,496,117$ 96,600,717$
LIABILITIESAccounts payable 683,649$ -$ 110,770$ Accrued payroll 335,581 - - Interfund payable - - - Temporary notes payable - - - Deferred revenue 1,148,884 - -
TOTAL LIABILITIES 2,168,114$ -$ 110,770$
DEFERRED INFLOWS OF RESOURCESUnavailable revenue - property taxes 1,097,977$ 13,267,762$ 2,505,612$ Unavailable revenue - special assessments - - 79,306,362
TOTAL DEFERRED INFLOWS 1,097,977$ 13,267,762$ 81,811,974$
FUND BALANCES (DEFICITS)Nonspendable:
Perpetual care -$ -$ -$ Restricted:
Urban Development & Housing - - - General Government - - - Capital Projects - - - Public Safety - 178,355 - Culture & Recreation - - - Public WorksDebt Service 1,799,177 - 10,235,014
Committed:General Government - - - Culture & Recreation - - -
Assigned:Purchases on Order 145,765 - - Subsequent Year's Budget Appropriations 2,500,000 50,000 4,442,959
Unassigned 39,152 - - TOTAL FUND BALANCES 4,484,094$ 228,355$ 14,677,973$
Total Liabilities, Deferred Inflows of Resources and Fund Balances 7,750,185$ 13,496,117$ 96,600,717$
The notes to the financial statements are an integral part of this statement.
Page 42
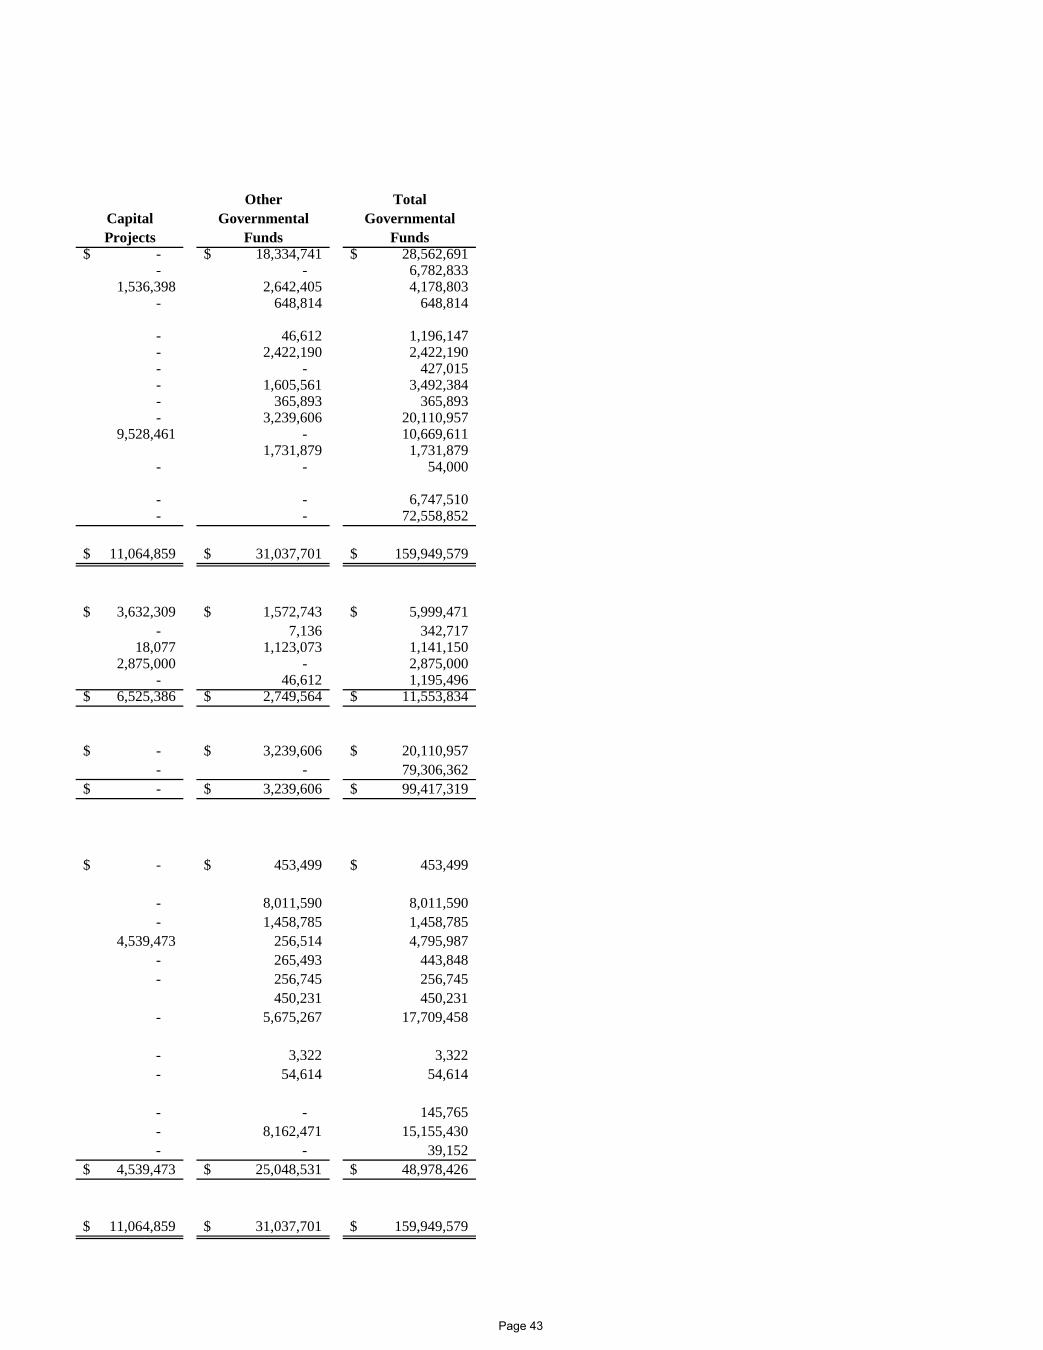
Other TotalCapital Governmental GovernmentalProjects Funds Funds
-$ 18,334,741$ 28,562,691$ - - 6,782,833
1,536,398 2,642,405 4,178,803 - 648,814 648,814
- 46,612 1,196,147 - 2,422,190 2,422,190 - - 427,015 - 1,605,561 3,492,384 - 365,893 365,893 - 3,239,606 20,110,957
9,528,461 - 10,669,611 1,731,879 1,731,879
- - 54,000
- - 6,747,510 - - 72,558,852
11,064,859$ 31,037,701$ 159,949,579$
3,632,309$ 1,572,743$ 5,999,471$ - 7,136 342,717
18,077 1,123,073 1,141,150 2,875,000 - 2,875,000
- 46,612 1,195,496 6,525,386$ 2,749,564$ 11,553,834$
-$ 3,239,606$ 20,110,957$ - - 79,306,362 -$ 3,239,606$ 99,417,319$
-$ 453,499$ 453,499$
- 8,011,590 8,011,590 - 1,458,785 1,458,785
4,539,473 256,514 4,795,987 - 265,493 443,848 - 256,745 256,745
450,231 450,231 - 5,675,267 17,709,458
- 3,322 3,322 - 54,614 54,614
- - 145,765 - 8,162,471 15,155,430 - - 39,152
4,539,473$ 25,048,531$ 48,978,426$
11,064,859$ 31,037,701$ 159,949,579$
Page 43
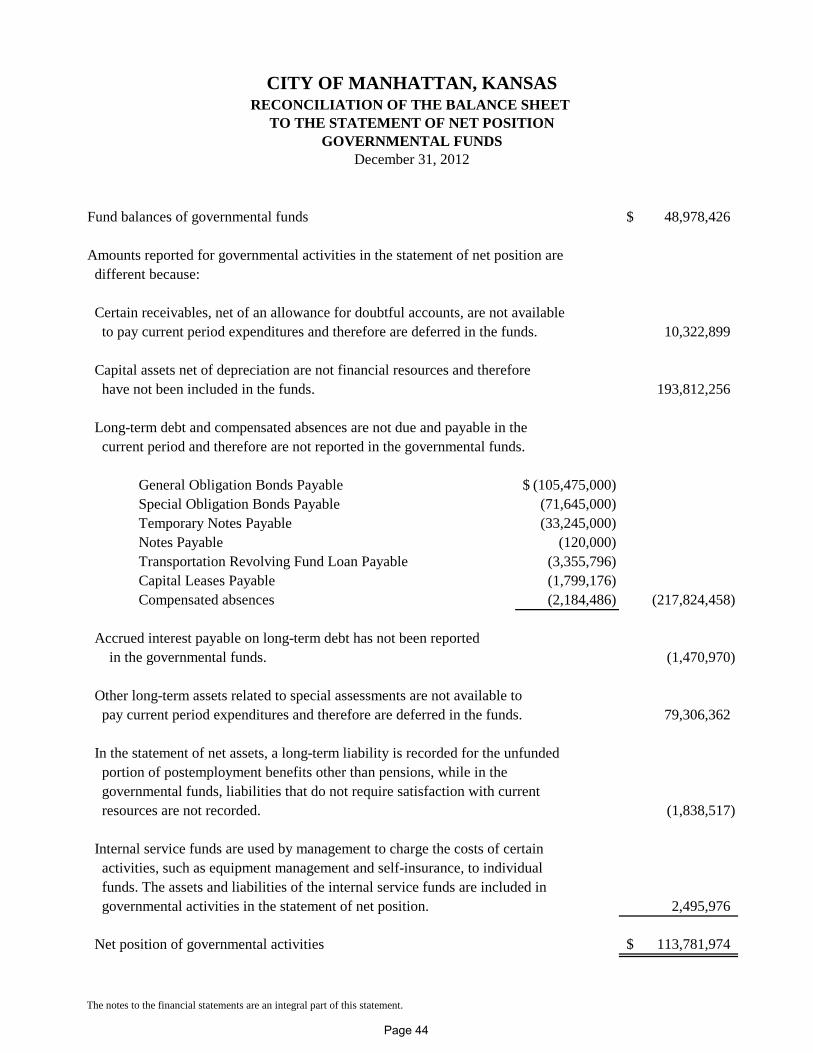
Fund balances of governmental funds 48,978,426$
Amounts reported for governmental activities in the statement of net position are different because:
Certain receivables, net of an allowance for doubtful accounts, are not available to pay current period expenditures and therefore are deferred in the funds. 10,322,899
Capital assets net of depreciation are not financial resources and therefore have not been included in the funds. 193,812,256
Long-term debt and compensated absences are not due and payable in the current period and therefore are not reported in the governmental funds.
General Obligation Bonds Payable (105,475,000)$ Special Obligation Bonds Payable (71,645,000) Temporary Notes Payable (33,245,000) Notes Payable (120,000) Transportation Revolving Fund Loan Payable (3,355,796) Capital Leases Payable (1,799,176) Compensated absences (2,184,486) (217,824,458)
Accrued interest payable on long-term debt has not been reported in the governmental funds. (1,470,970)
Other long-term assets related to special assessments are not available to pay current period expenditures and therefore are deferred in the funds. 79,306,362
In the statement of net assets, a long-term liability is recorded for the unfunded portion of postemployment benefits other than pensions, while in the governmental funds, liabilities that do not require satisfaction with current resources are not recorded. (1,838,517)
Internal service funds are used by management to charge the costs of certain activities, such as equipment management and self-insurance, to individual funds. The assets and liabilities of the internal service funds are included in governmental activities in the statement of net position. 2,495,976
Net position of governmental activities 113,781,974$
The notes to the financial statements are an integral part of this statement.
December 31, 2012
CITY OF MANHATTAN, KANSAS
GOVERNMENTAL FUNDS
RECONCILIATION OF THE BALANCE SHEET TO THE STATEMENT OF NET POSITION
Page 44

THIS PAGE INTENTIONALLY LEFT BLANK
Page 45
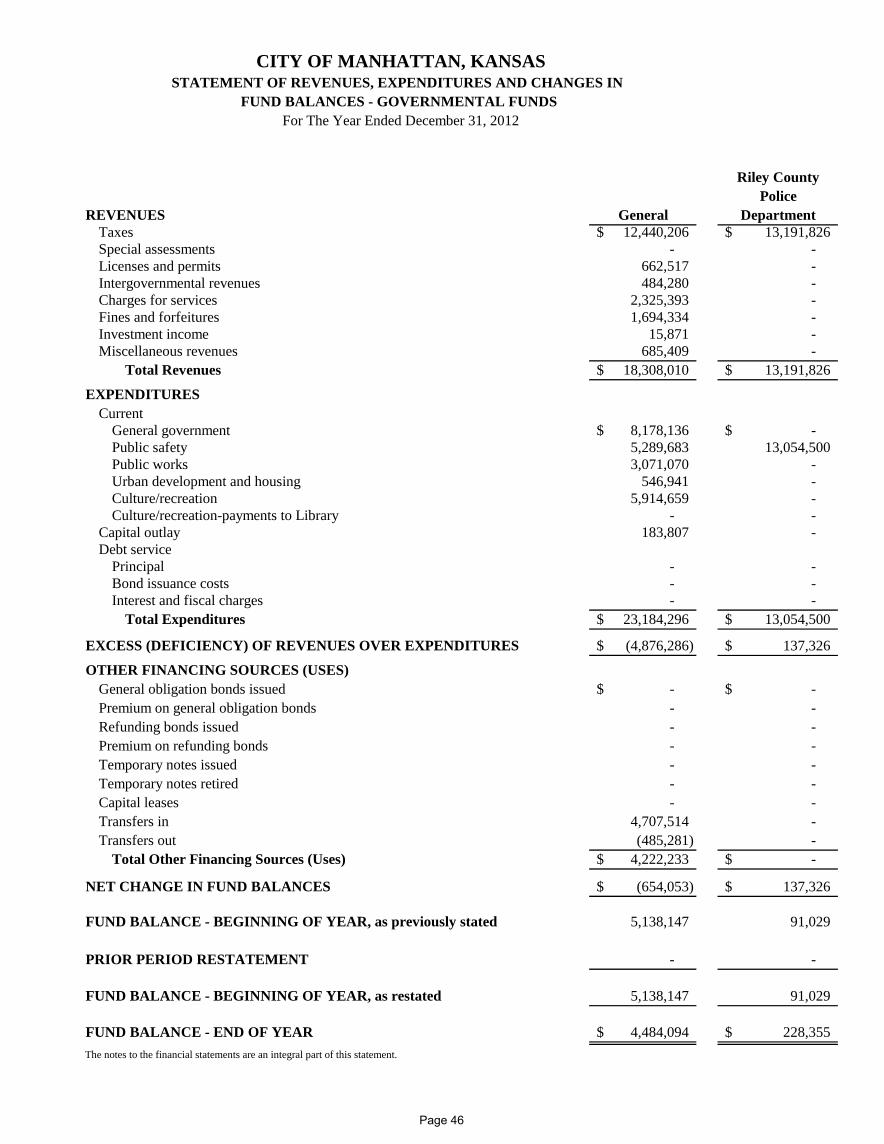
CITY OF MANHATTAN, KANSASSTATEMENT OF REVENUES, EXPENDITURES AND CHANGES IN
FUND BALANCES - GOVERNMENTAL FUNDS For The Year Ended December 31, 2012
Riley CountyPolice
REVENUES General DepartmentTaxes 12,440,206$ 13,191,826$ Special assessments - - Licenses and permits 662,517 - Intergovernmental revenues 484,280 - Charges for services 2,325,393 - Fines and forfeitures 1,694,334 - Investment income 15,871 - Miscellaneous revenues 685,409 -
Total Revenues 18,308,010$ 13,191,826$
EXPENDITURESCurrent
General government 8,178,136$ -$ Public safety 5,289,683 13,054,500 Public works 3,071,070 - Urban development and housing 546,941 - Culture/recreation 5,914,659 - Culture/recreation-payments to Library - -
Capital outlay 183,807 - Debt service
Principal - - Bond issuance costs - - Interest and fiscal charges - -
Total Expenditures 23,184,296$ 13,054,500$
EXCESS (DEFICIENCY) OF REVENUES OVER EXPENDITURES (4,876,286)$ 137,326$
OTHER FINANCING SOURCES (USES)General obligation bonds issued -$ -$ Premium on general obligation bonds - - Refunding bonds issued - - Premium on refunding bonds - - Temporary notes issued - - Temporary notes retired - - Capital leases - - Transfers in 4,707,514 - Transfers out (485,281) -
Total Other Financing Sources (Uses) 4,222,233$ -$
NET CHANGE IN FUND BALANCES (654,053)$ 137,326$
FUND BALANCE - BEGINNING OF YEAR, as previously stated 5,138,147 91,029
PRIOR PERIOD RESTATEMENT - -
FUND BALANCE - BEGINNING OF YEAR, as restated 5,138,147 91,029
FUND BALANCE - END OF YEAR 4,484,094$ 228,355$ The notes to the financial statements are an integral part of this statement.
Page 46
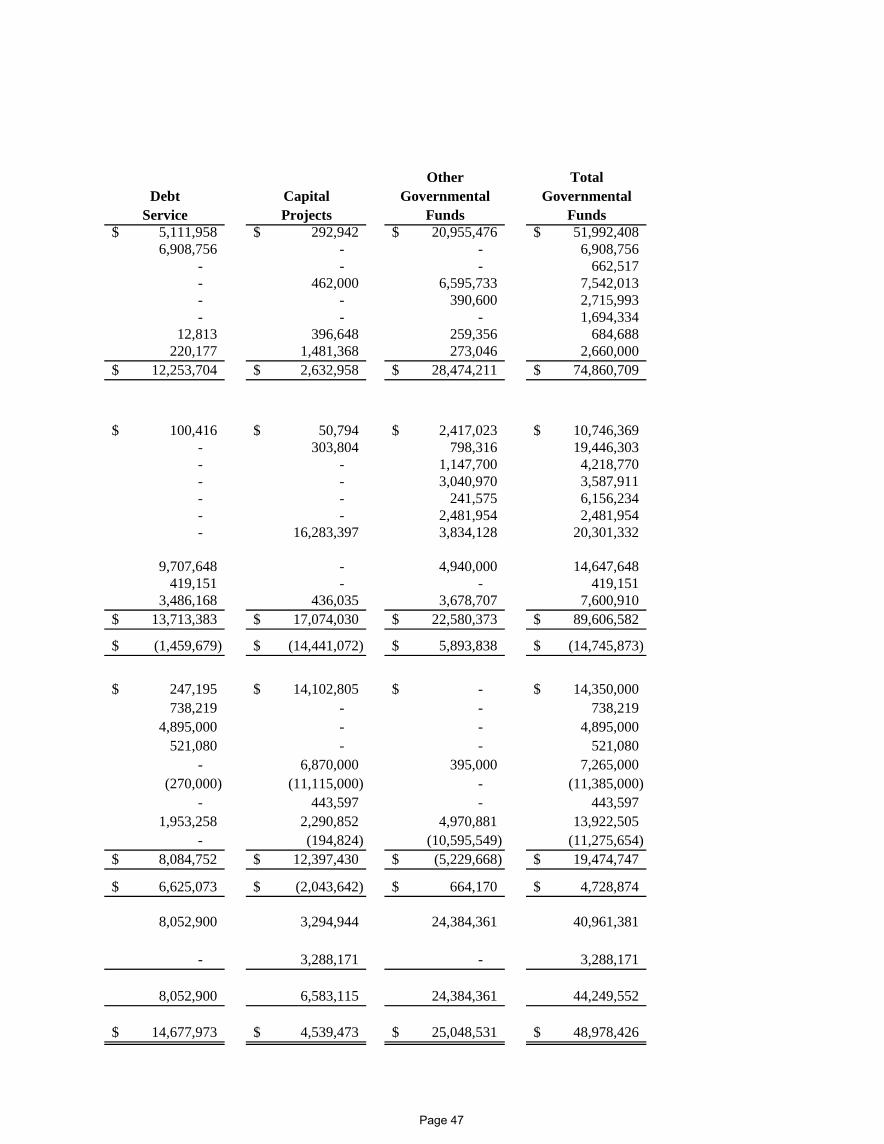
Other TotalDebt Capital Governmental Governmental
Service Projects Funds Funds5,111,958$ 292,942$ 20,955,476$ 51,992,408$ 6,908,756 - - 6,908,756
- - - 662,517 - 462,000 6,595,733 7,542,013 - - 390,600 2,715,993 - - - 1,694,334
12,813 396,648 259,356 684,688 220,177 1,481,368 273,046 2,660,000
12,253,704$ 2,632,958$ 28,474,211$ 74,860,709$
100,416$ 50,794$ 2,417,023$ 10,746,369$ - 303,804 798,316 19,446,303 - - 1,147,700 4,218,770 - - 3,040,970 3,587,911 - - 241,575 6,156,234 - - 2,481,954 2,481,954 - 16,283,397 3,834,128 20,301,332
9,707,648 - 4,940,000 14,647,648 419,151 - - 419,151
3,486,168 436,035 3,678,707 7,600,910 13,713,383$ 17,074,030$ 22,580,373$ 89,606,582$
(1,459,679)$ (14,441,072)$ 5,893,838$ (14,745,873)$
247,195$ 14,102,805$ -$ 14,350,000$ 738,219 - - 738,219
4,895,000 - - 4,895,000 521,080 - - 521,080
- 6,870,000 395,000 7,265,000 (270,000) (11,115,000) - (11,385,000)
- 443,597 - 443,597 1,953,258 2,290,852 4,970,881 13,922,505
- (194,824) (10,595,549) (11,275,654) 8,084,752$ 12,397,430$ (5,229,668)$ 19,474,747$
6,625,073$ (2,043,642)$ 664,170$ 4,728,874$
8,052,900 3,294,944 24,384,361 40,961,381
- 3,288,171 - 3,288,171
8,052,900 6,583,115 24,384,361 44,249,552
14,677,973$ 4,539,473$ 25,048,531$ 48,978,426$
Page 47
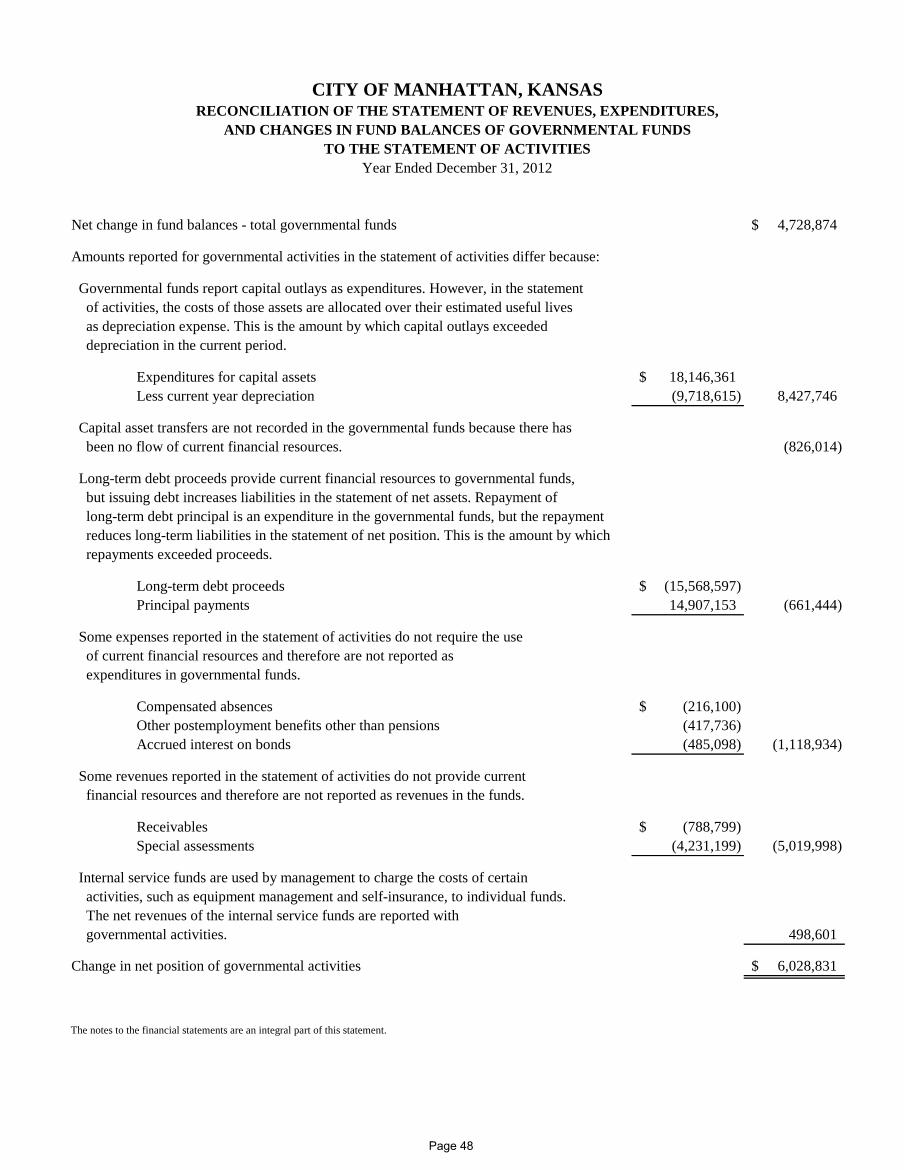
Net change in fund balances - total governmental funds 4,728,874$
Amounts reported for governmental activities in the statement of activities differ because:
Governmental funds report capital outlays as expenditures. However, in the statement of activities, the costs of those assets are allocated over their estimated useful lives as depreciation expense. This is the amount by which capital outlays exceeded depreciation in the current period.
Expenditures for capital assets 18,146,361$ Less current year depreciation (9,718,615) 8,427,746
Capital asset transfers are not recorded in the governmental funds because there has been no flow of current financial resources. (826,014)
Long-term debt proceeds provide current financial resources to governmental funds, but issuing debt increases liabilities in the statement of net assets. Repayment of long-term debt principal is an expenditure in the governmental funds, but the repayment reduces long-term liabilities in the statement of net position. This is the amount by which repayments exceeded proceeds.
Long-term debt proceeds (15,568,597)$ Principal payments 14,907,153 (661,444)
Some expenses reported in the statement of activities do not require the use of current financial resources and therefore are not reported as expenditures in governmental funds.
Compensated absences (216,100)$ Other postemployment benefits other than pensions (417,736) Accrued interest on bonds (485,098) (1,118,934)
Some revenues reported in the statement of activities do not provide current financial resources and therefore are not reported as revenues in the funds.
Receivables (788,799)$ Special assessments (4,231,199) (5,019,998)
Internal service funds are used by management to charge the costs of certain activities, such as equipment management and self-insurance, to individual funds. The net revenues of the internal service funds are reported with governmental activities. 498,601
Change in net position of governmental activities 6,028,831$
The notes to the financial statements are an integral part of this statement.
TO THE STATEMENT OF ACTIVITIESYear Ended December 31, 2012
CITY OF MANHATTAN, KANSASRECONCILIATION OF THE STATEMENT OF REVENUES, EXPENDITURES,
AND CHANGES IN FUND BALANCES OF GOVERNMENTAL FUNDS
Page 48

THIS PAGE INTENTIONALLY LEFT BLANK
Page 49
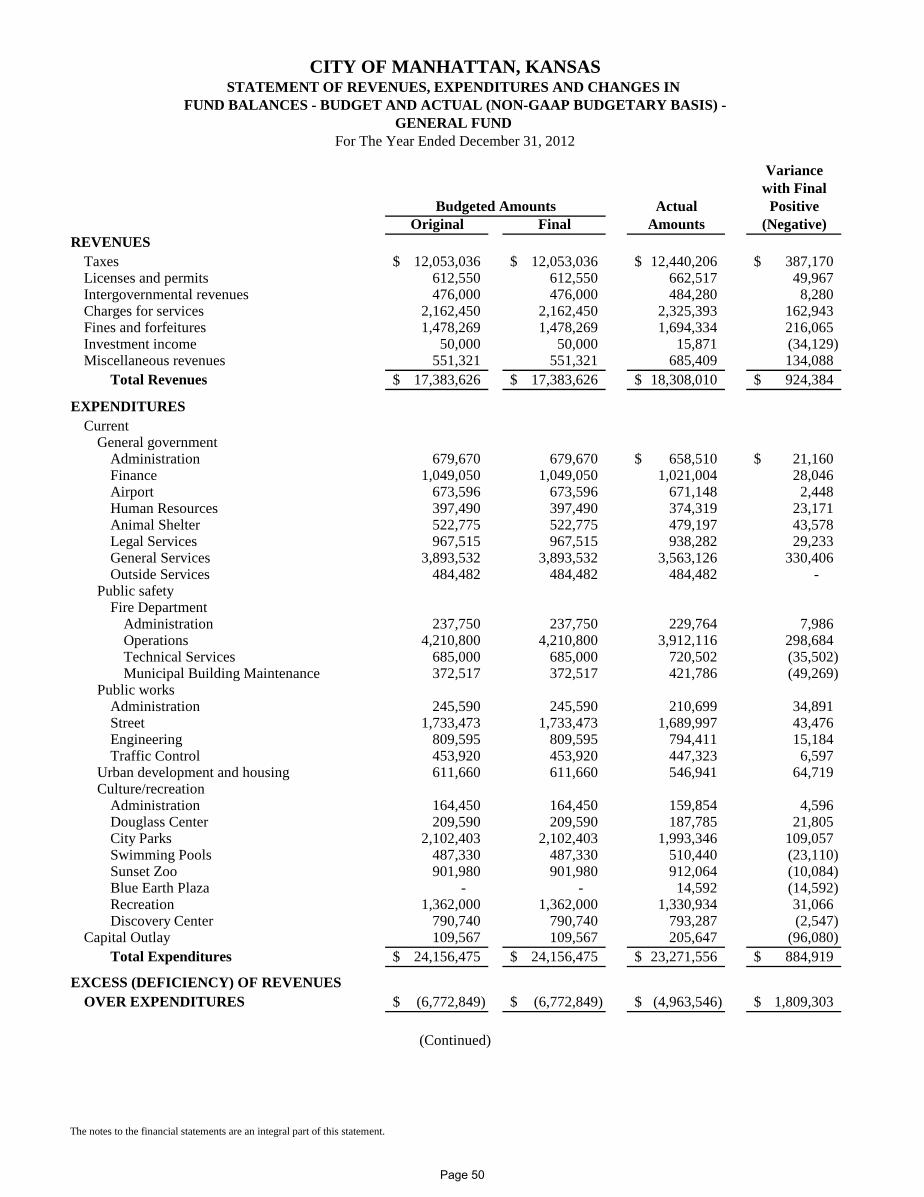
CITY OF MANHATTAN, KANSASSTATEMENT OF REVENUES, EXPENDITURES AND CHANGES IN
FUND BALANCES - BUDGET AND ACTUAL (NON-GAAP BUDGETARY BASIS) -GENERAL FUND
For The Year Ended December 31, 2012
Variancewith Final
Actual PositiveOriginal Final Amounts (Negative)
REVENUESTaxes 12,053,036$ 12,053,036$ 12,440,206$ 387,170$ Licenses and permits 612,550 612,550 662,517 49,967 Intergovernmental revenues 476,000 476,000 484,280 8,280 Charges for services 2,162,450 2,162,450 2,325,393 162,943 Fines and forfeitures 1,478,269 1,478,269 1,694,334 216,065 Investment income 50,000 50,000 15,871 (34,129) Miscellaneous revenues 551,321 551,321 685,409 134,088
Total Revenues 17,383,626$ 17,383,626$ 18,308,010$ 924,384$
EXPENDITURESCurrent
General governmentAdministration 679,670 679,670 658,510$ 21,160$ Finance 1,049,050 1,049,050 1,021,004 28,046 Airport 673,596 673,596 671,148 2,448 Human Resources 397,490 397,490 374,319 23,171 Animal Shelter 522,775 522,775 479,197 43,578 Legal Services 967,515 967,515 938,282 29,233 General Services 3,893,532 3,893,532 3,563,126 330,406 Outside Services 484,482 484,482 484,482 -
Public safetyFire Department
Administration 237,750 237,750 229,764 7,986 Operations 4,210,800 4,210,800 3,912,116 298,684 Technical Services 685,000 685,000 720,502 (35,502) Municipal Building Maintenance 372,517 372,517 421,786 (49,269)
Public worksAdministration 245,590 245,590 210,699 34,891 Street 1,733,473 1,733,473 1,689,997 43,476 Engineering 809,595 809,595 794,411 15,184 Traffic Control 453,920 453,920 447,323 6,597
Urban development and housing 611,660 611,660 546,941 64,719 Culture/recreation
Administration 164,450 164,450 159,854 4,596 Douglass Center 209,590 209,590 187,785 21,805 City Parks 2,102,403 2,102,403 1,993,346 109,057 Swimming Pools 487,330 487,330 510,440 (23,110) Sunset Zoo 901,980 901,980 912,064 (10,084) Blue Earth Plaza - - 14,592 (14,592) Recreation 1,362,000 1,362,000 1,330,934 31,066 Discovery Center 790,740 790,740 793,287 (2,547)
Capital Outlay 109,567 109,567 205,647 (96,080) Total Expenditures 24,156,475$ 24,156,475$ 23,271,556$ 884,919$
EXCESS (DEFICIENCY) OF REVENUES OVER EXPENDITURES (6,772,849)$ (6,772,849)$ (4,963,546)$ 1,809,303$
The notes to the financial statements are an integral part of this statement.
Budgeted Amounts
(Continued)
Page 50
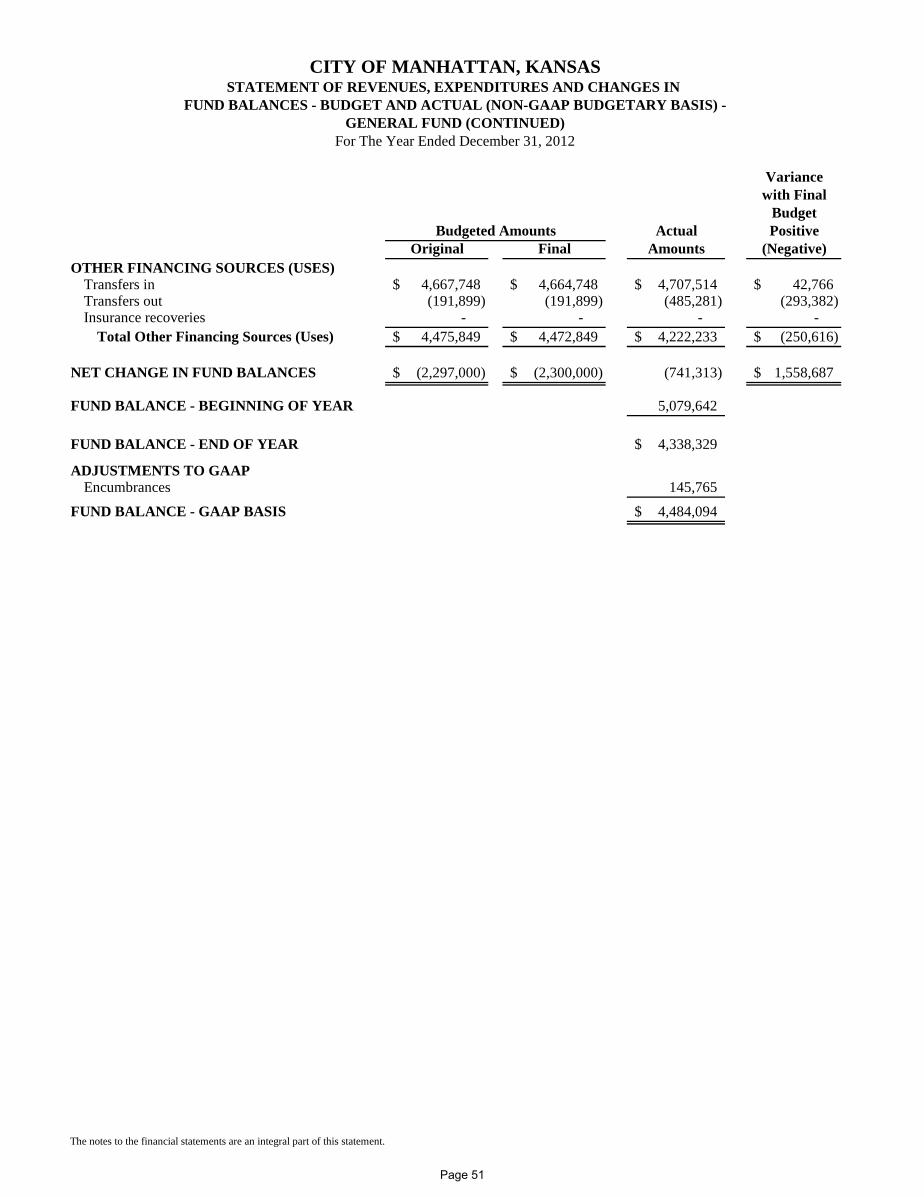
CITY OF MANHATTAN, KANSASSTATEMENT OF REVENUES, EXPENDITURES AND CHANGES IN
FUND BALANCES - BUDGET AND ACTUAL (NON-GAAP BUDGETARY BASIS) -GENERAL FUND (CONTINUED)
For The Year Ended December 31, 2012
Variancewith Final
BudgetActual Positive
Original Final Amounts (Negative)OTHER FINANCING SOURCES (USES)
Transfers in 4,667,748$ 4,664,748$ 4,707,514$ 42,766$ Transfers out (191,899) (191,899) (485,281) (293,382) Insurance recoveries - - - -
Total Other Financing Sources (Uses) 4,475,849$ 4,472,849$ 4,222,233$ (250,616)$
NET CHANGE IN FUND BALANCES (2,297,000)$ (2,300,000)$ (741,313) 1,558,687$
FUND BALANCE - BEGINNING OF YEAR 5,079,642
FUND BALANCE - END OF YEAR 4,338,329$
ADJUSTMENTS TO GAAPEncumbrances 145,765
FUND BALANCE - GAAP BASIS 4,484,094$
The notes to the financial statements are an integral part of this statement.
Budgeted Amounts
Page 51
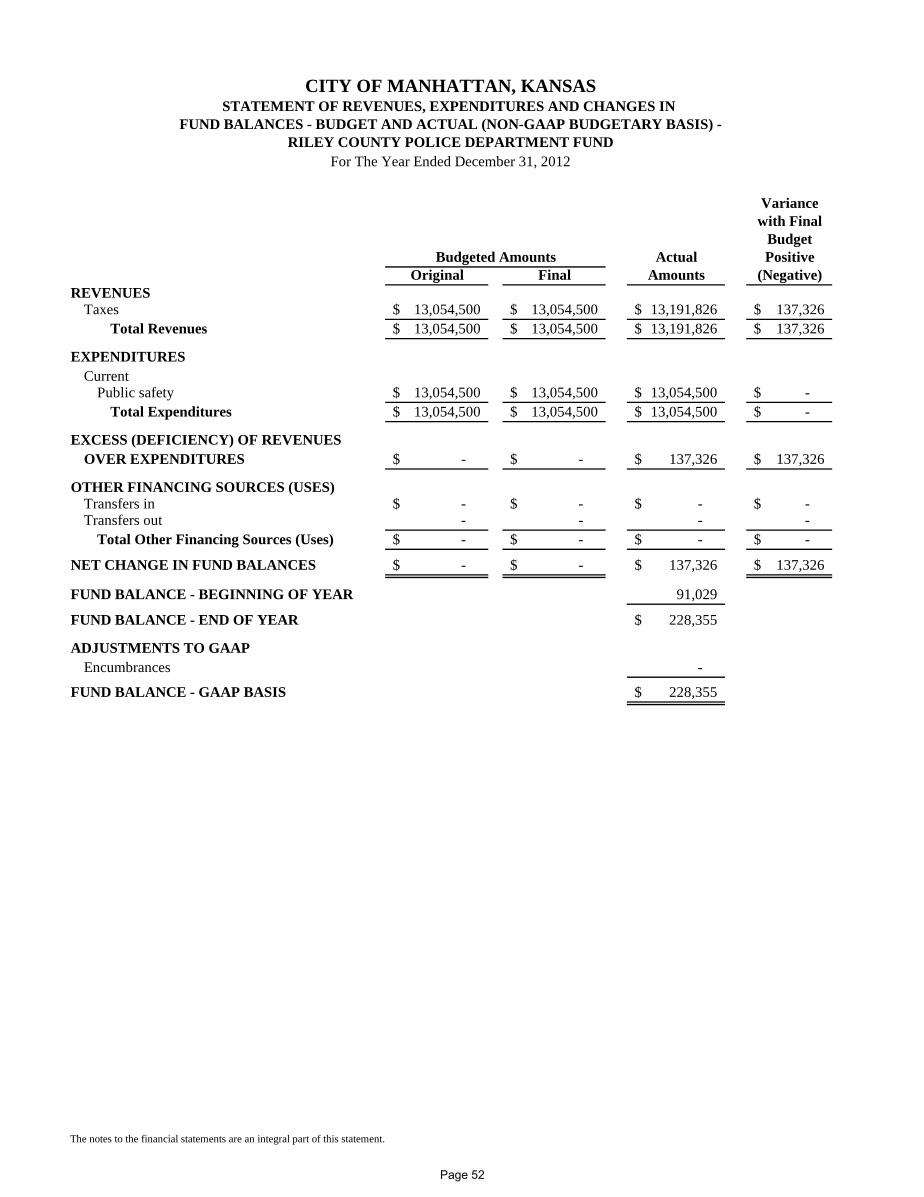
CITY OF MANHATTAN, KANSASSTATEMENT OF REVENUES, EXPENDITURES AND CHANGES IN
FUND BALANCES - BUDGET AND ACTUAL (NON-GAAP BUDGETARY BASIS) -RILEY COUNTY POLICE DEPARTMENT FUND
For The Year Ended December 31, 2012
Variancewith Final
BudgetActual Positive
Original Final Amounts (Negative)REVENUES
Taxes 13,054,500$ 13,054,500$ 13,191,826$ 137,326$ Total Revenues 13,054,500$ 13,054,500$ 13,191,826$ 137,326$
EXPENDITURESCurrent
Public safety 13,054,500$ 13,054,500$ 13,054,500$ -$ Total Expenditures 13,054,500$ 13,054,500$ 13,054,500$ -$
EXCESS (DEFICIENCY) OF REVENUES OVER EXPENDITURES -$ -$ 137,326$ 137,326$
OTHER FINANCING SOURCES (USES)Transfers in -$ -$ -$ -$ Transfers out - - - -
Total Other Financing Sources (Uses) -$ -$ -$ -$
NET CHANGE IN FUND BALANCES -$ -$ 137,326$ 137,326$
FUND BALANCE - BEGINNING OF YEAR 91,029
FUND BALANCE - END OF YEAR 228,355$
ADJUSTMENTS TO GAAPEncumbrances -
FUND BALANCE - GAAP BASIS 228,355$
The notes to the financial statements are an integral part of this statement.
Budgeted Amounts
Page 52

THIS PAGE INTENTIONALLY LEFT BLANK
Page 53
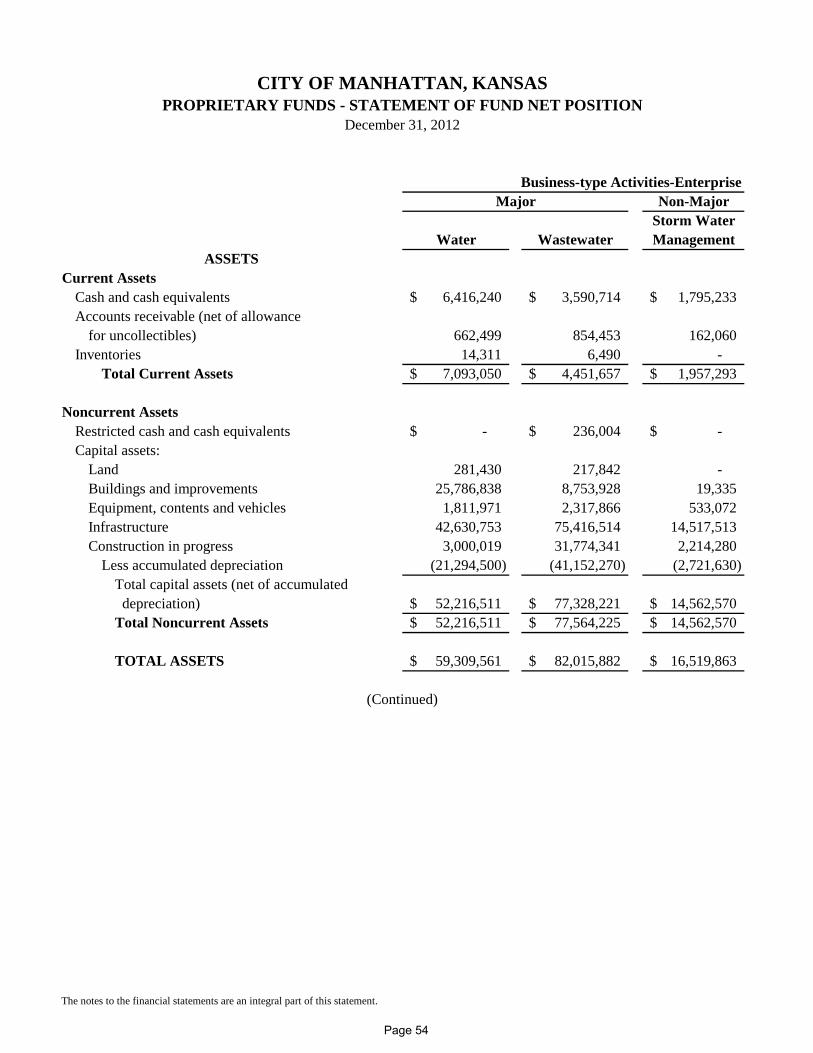
CITY OF MANHATTAN, KANSASPROPRIETARY FUNDS - STATEMENT OF FUND NET POSITION
December 31, 2012
Business-type Activities-EnterpriseNon-Major
Storm WaterWater Wastewater Management
ASSETSCurrent Assets
Cash and cash equivalents 6,416,240$ 3,590,714$ 1,795,233$ Accounts receivable (net of allowance
for uncollectibles) 662,499 854,453 162,060 Inventories 14,311 6,490 -
Total Current Assets 7,093,050$ 4,451,657$ 1,957,293$
Noncurrent AssetsRestricted cash and cash equivalents -$ 236,004$ -$ Capital assets:
Land 281,430 217,842 - Buildings and improvements 25,786,838 8,753,928 19,335 Equipment, contents and vehicles 1,811,971 2,317,866 533,072 Infrastructure 42,630,753 75,416,514 14,517,513 Construction in progress 3,000,019 31,774,341 2,214,280
Less accumulated depreciation (21,294,500) (41,152,270) (2,721,630) Total capital assets (net of accumulated depreciation) 52,216,511$ 77,328,221$ 14,562,570$ Total Noncurrent Assets 52,216,511$ 77,564,225$ 14,562,570$
TOTAL ASSETS 59,309,561$ 82,015,882$ 16,519,863$
(Continued)
The notes to the financial statements are an integral part of this statement.
Major
Page 54
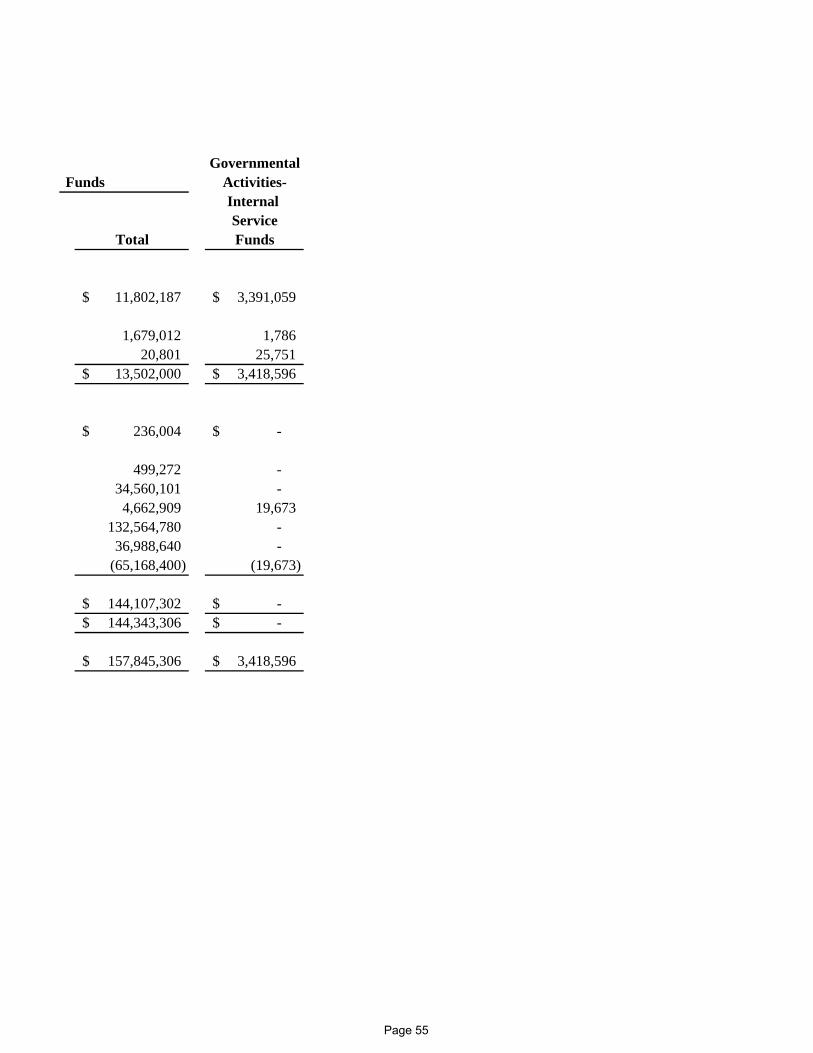
Governmental Funds Activities-
Internal Service
Total Funds
11,802,187$ 3,391,059$
1,679,012 1,786 20,801 25,751
13,502,000$ 3,418,596$
236,004$ -$
499,272 - 34,560,101 -
4,662,909 19,673 132,564,780 -
36,988,640 - (65,168,400) (19,673)
144,107,302$ -$ 144,343,306$ -$
157,845,306$ 3,418,596$
Page 55
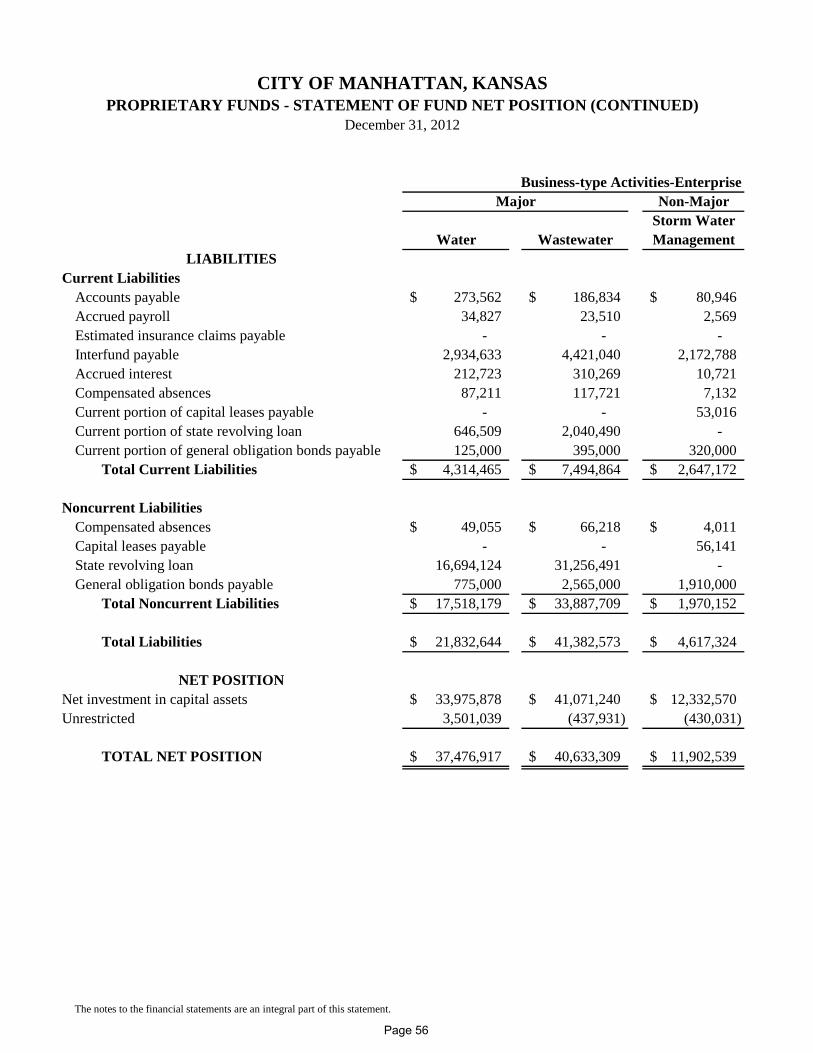
CITY OF MANHATTAN, KANSASPROPRIETARY FUNDS - STATEMENT OF FUND NET POSITION (CONTINUED)
December 31, 2012
Business-type Activities-EnterpriseNon-Major
Storm WaterWater Wastewater Management
LIABILITIESCurrent Liabilities
Accounts payable 273,562$ 186,834$ 80,946$ Accrued payroll 34,827 23,510 2,569 Estimated insurance claims payable - - - Interfund payable 2,934,633 4,421,040 2,172,788 Accrued interest 212,723 310,269 10,721 Compensated absences 87,211 117,721 7,132 Current portion of capital leases payable - - 53,016 Current portion of state revolving loan 646,509 2,040,490 - Current portion of general obligation bonds payable 125,000 395,000 320,000
Total Current Liabilities 4,314,465$ 7,494,864$ 2,647,172$
Noncurrent LiabilitiesCompensated absences 49,055$ 66,218$ 4,011$ Capital leases payable - - 56,141 State revolving loan 16,694,124 31,256,491 - General obligation bonds payable 775,000 2,565,000 1,910,000
Total Noncurrent Liabilities 17,518,179$ 33,887,709$ 1,970,152$
Total Liabilities 21,832,644$ 41,382,573$ 4,617,324$
Net investment in capital assets 33,975,878$ 41,071,240$ 12,332,570$ Unrestricted 3,501,039 (437,931) (430,031)
TOTAL NET POSITION 37,476,917$ 40,633,309$ 11,902,539$
The notes to the financial statements are an integral part of this statement.
NET POSITION
Major
Page 56
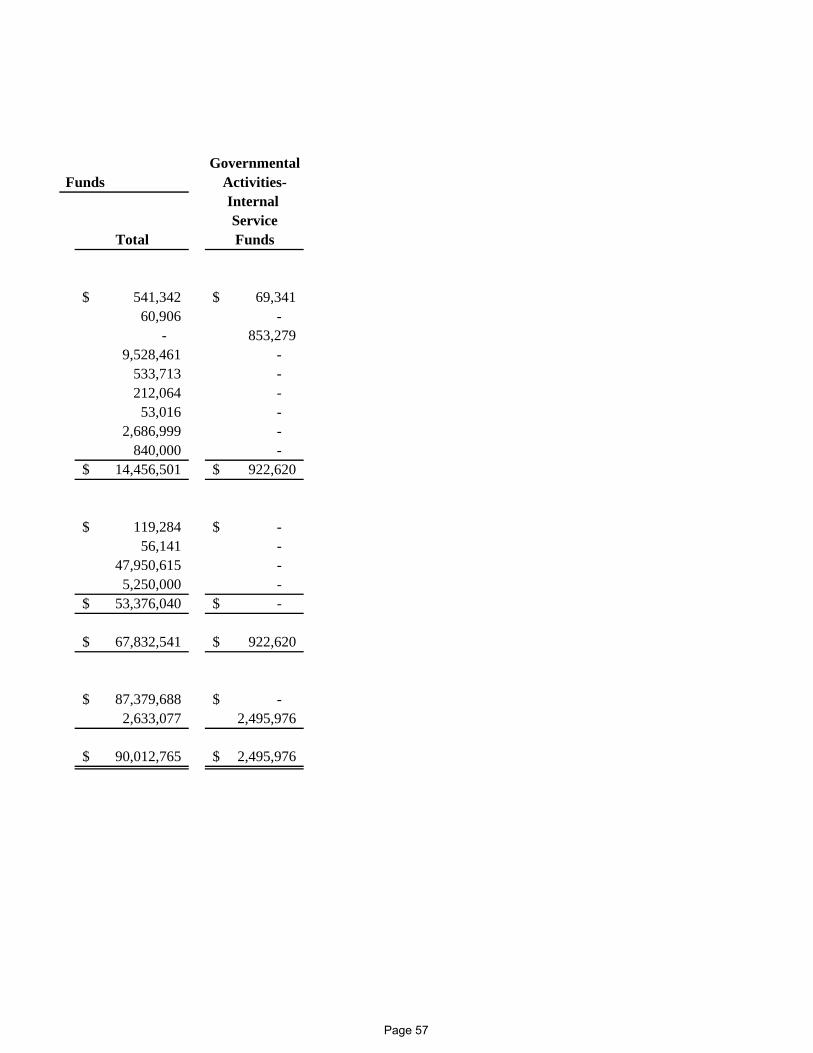
Governmental Funds Activities-
Internal Service
Total Funds
541,342$ 69,341$ 60,906 -
- 853,279 9,528,461 -
533,713 - 212,064 -
53,016 - 2,686,999 -
840,000 - 14,456,501$ 922,620$
119,284$ -$ 56,141 -
47,950,615 - 5,250,000 -
53,376,040$ -$
67,832,541$ 922,620$
87,379,688$ -$ 2,633,077 2,495,976
90,012,765$ 2,495,976$
Page 57
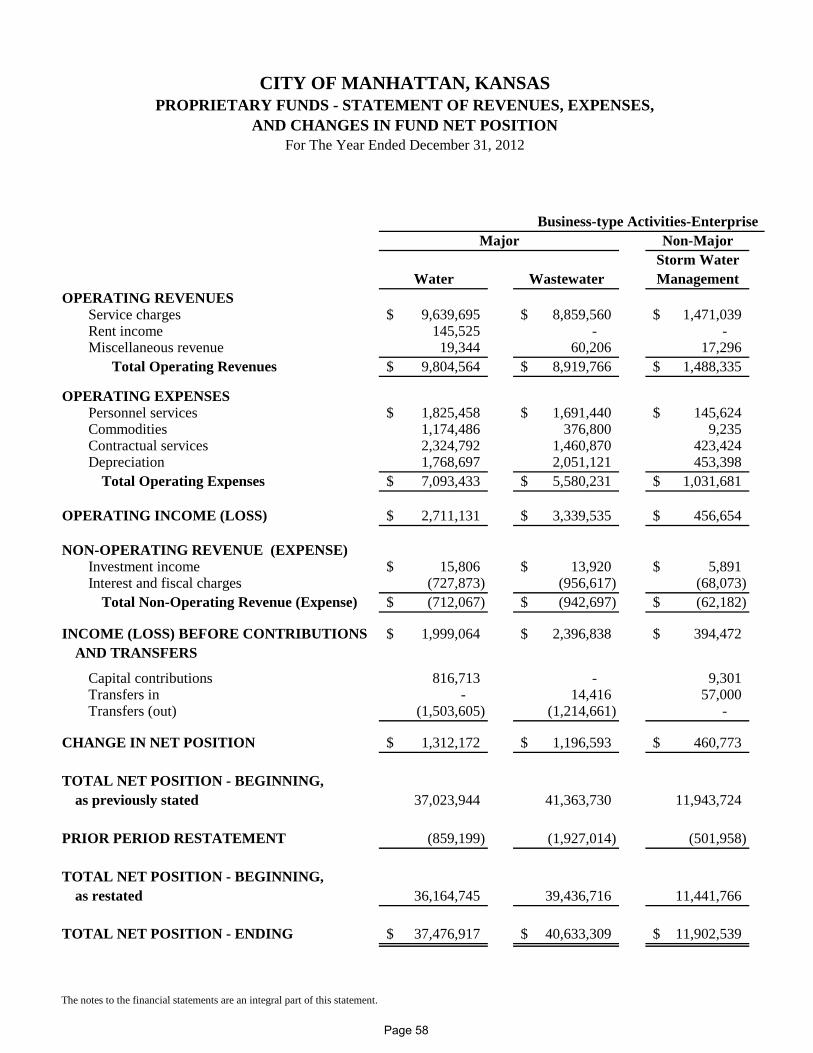
Business-type Activities-Enterprise Non-Major
Storm WaterWater Wastewater Management
OPERATING REVENUESService charges 9,639,695$ 8,859,560$ 1,471,039$ Rent income 145,525 - - Miscellaneous revenue 19,344 60,206 17,296
Total Operating Revenues 9,804,564$ 8,919,766$ 1,488,335$
OPERATING EXPENSESPersonnel services 1,825,458$ 1,691,440$ 145,624$ Commodities 1,174,486 376,800 9,235 Contractual services 2,324,792 1,460,870 423,424 Depreciation 1,768,697 2,051,121 453,398
Total Operating Expenses 7,093,433$ 5,580,231$ 1,031,681$
OPERATING INCOME (LOSS) 2,711,131$ 3,339,535$ 456,654$
NON-OPERATING REVENUE (EXPENSE)Investment income 15,806$ 13,920$ 5,891$ Interest and fiscal charges (727,873) (956,617) (68,073)
Total Non-Operating Revenue (Expense) (712,067)$ (942,697)$ (62,182)$
INCOME (LOSS) BEFORE CONTRIBUTIONS 1,999,064$ 2,396,838$ 394,472$ AND TRANSFERS
Capital contributions 816,713 - 9,301 Transfers in - 14,416 57,000 Transfers (out) (1,503,605) (1,214,661) -
CHANGE IN NET POSITION 1,312,172$ 1,196,593$ 460,773$
TOTAL NET POSITION - BEGINNING, as previously stated 37,023,944 41,363,730 11,943,724
PRIOR PERIOD RESTATEMENT (859,199) (1,927,014) (501,958)
TOTAL NET POSITION - BEGINNING, as restated 36,164,745 39,436,716 11,441,766
TOTAL NET POSITION - ENDING 37,476,917$ 40,633,309$ 11,902,539$
The notes to the financial statements are an integral part of this statement.
Major
CITY OF MANHATTAN, KANSASPROPRIETARY FUNDS - STATEMENT OF REVENUES, EXPENSES,
AND CHANGES IN FUND NET POSITIONFor The Year Ended December 31, 2012
Page 58
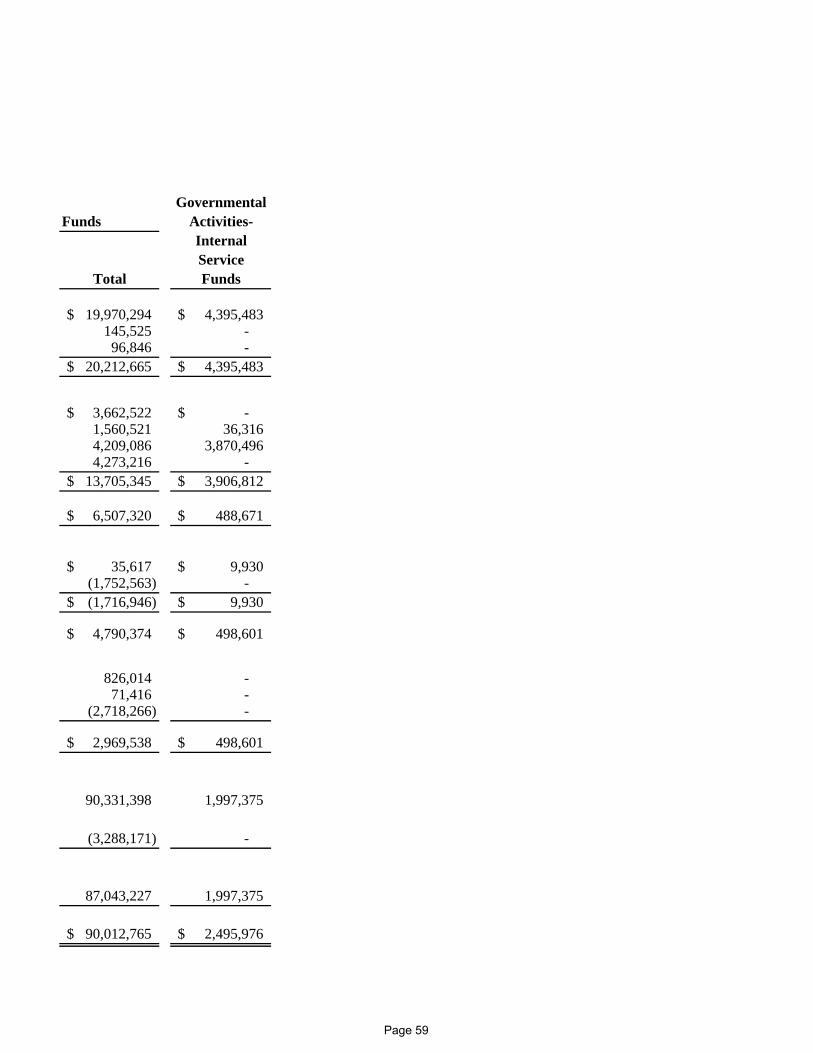
GovernmentalFunds Activities-
InternalService
Total Funds
19,970,294$ 4,395,483$ 145,525 - 96,846 -
20,212,665$ 4,395,483$
3,662,522$ -$ 1,560,521 36,316 4,209,086 3,870,496 4,273,216 -
13,705,345$ 3,906,812$
6,507,320$ 488,671$
35,617$ 9,930$ (1,752,563) - (1,716,946)$ 9,930$
4,790,374$ 498,601$
826,014 - 71,416 -
(2,718,266) -
2,969,538$ 498,601$
90,331,398 1,997,375
(3,288,171) -
87,043,227 1,997,375
90,012,765$ 2,495,976$
Page 59
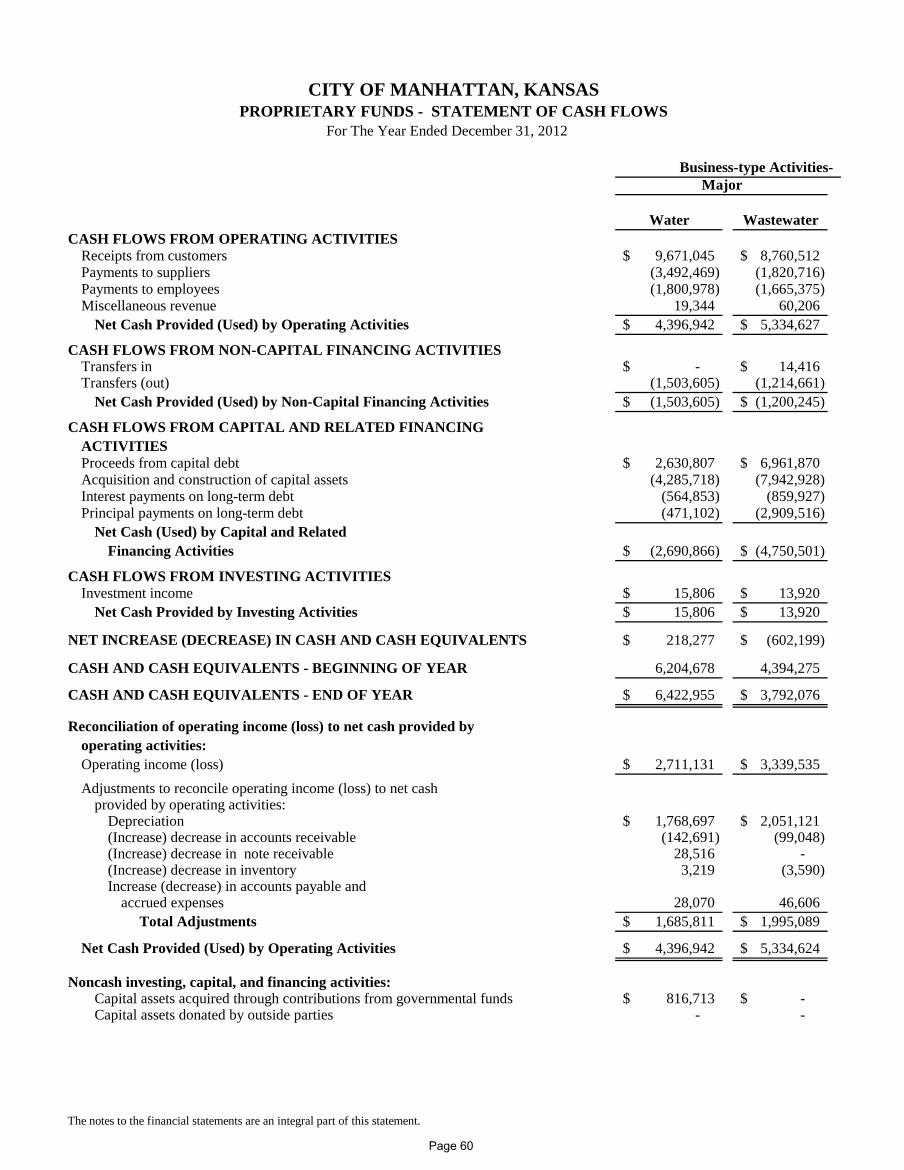
Business-type Activities-
Water WastewaterCASH FLOWS FROM OPERATING ACTIVITIES
Receipts from customers 9,671,045$ 8,760,512$ Payments to suppliers (3,492,469) (1,820,716) Payments to employees (1,800,978) (1,665,375) Miscellaneous revenue 19,344 60,206
Net Cash Provided (Used) by Operating Activities 4,396,942$ 5,334,627$
CASH FLOWS FROM NON-CAPITAL FINANCING ACTIVITIESTransfers in -$ 14,416$ Transfers (out) (1,503,605) (1,214,661)
Net Cash Provided (Used) by Non-Capital Financing Activities (1,503,605)$ (1,200,245)$
CASH FLOWS FROM CAPITAL AND RELATED FINANCINGACTIVITIESProceeds from capital debt 2,630,807$ 6,961,870$ Acquisition and construction of capital assets (4,285,718) (7,942,928) Interest payments on long-term debt (564,853) (859,927) Principal payments on long-term debt (471,102) (2,909,516)
Net Cash (Used) by Capital and RelatedFinancing Activities (2,690,866)$ (4,750,501)$
CASH FLOWS FROM INVESTING ACTIVITIESInvestment income 15,806$ 13,920$
Net Cash Provided by Investing Activities 15,806$ 13,920$
NET INCREASE (DECREASE) IN CASH AND CASH EQUIVALENTS 218,277$ (602,199)$
CASH AND CASH EQUIVALENTS - BEGINNING OF YEAR 6,204,678 4,394,275
CASH AND CASH EQUIVALENTS - END OF YEAR 6,422,955$ 3,792,076$
Reconciliation of operating income (loss) to net cash provided byoperating activities:Operating income (loss) 2,711,131$ 3,339,535$ Adjustments to reconcile operating income (loss) to net cash
provided by operating activities:Depreciation 1,768,697$ 2,051,121$ (Increase) decrease in accounts receivable (142,691) (99,048) (Increase) decrease in note receivable 28,516 - (Increase) decrease in inventory 3,219 (3,590) Increase (decrease) in accounts payable and
accrued expenses 28,070 46,606 Total Adjustments 1,685,811$ 1,995,089$
Net Cash Provided (Used) by Operating Activities 4,396,942$ 5,334,624$
Noncash investing, capital, and financing activities:Capital assets acquired through contributions from governmental funds 816,713$ -$ Capital assets donated by outside parties - -
The notes to the financial statements are an integral part of this statement.
CITY OF MANHATTAN, KANSASPROPRIETARY FUNDS - STATEMENT OF CASH FLOWS
For The Year Ended December 31, 2012
Major
Page 60
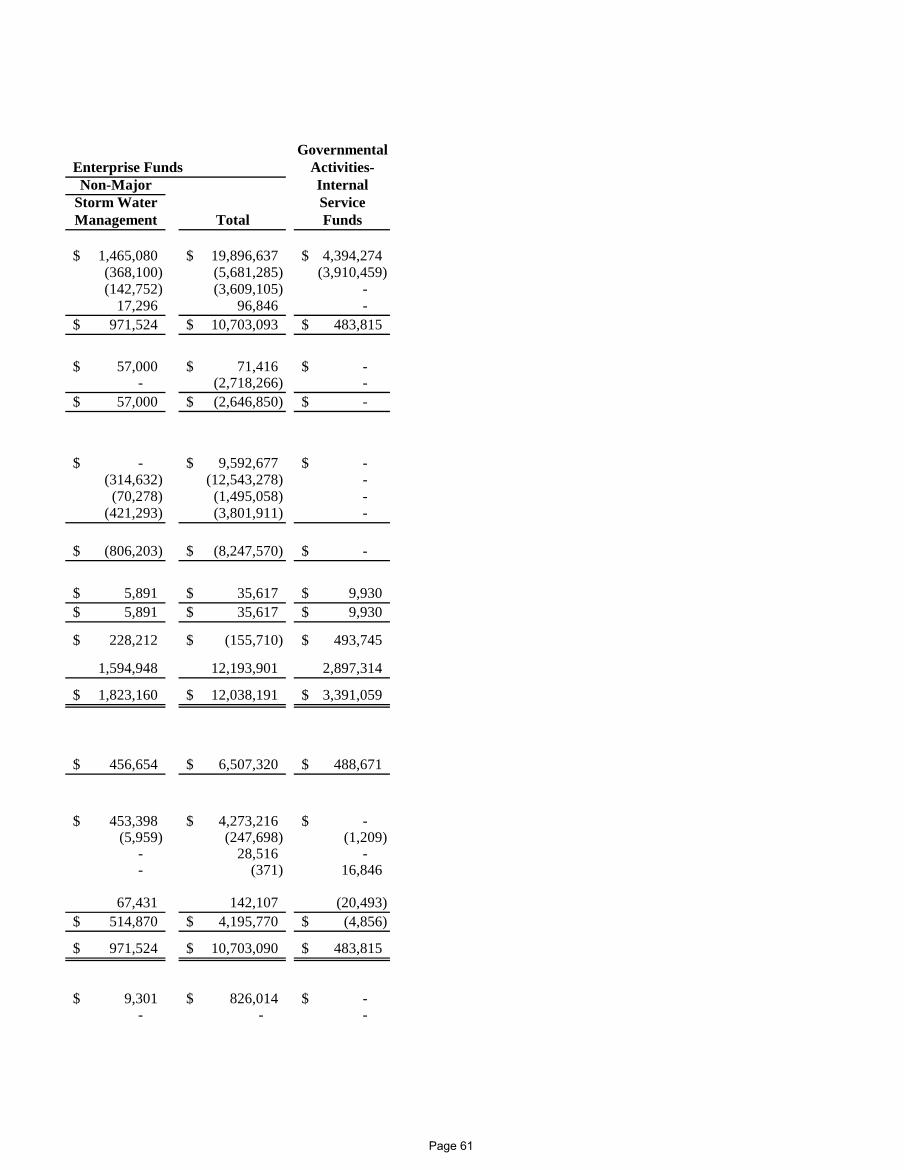
GovernmentalEnterprise Funds Activities-Non-Major Internal
Storm Water ServiceManagement Total Funds
1,465,080$ 19,896,637$ 4,394,274$ (368,100) (5,681,285) (3,910,459) (142,752) (3,609,105) -
17,296 96,846 - 971,524$ 10,703,093$ 483,815$
57,000$ 71,416$ -$ - (2,718,266) -
57,000$ (2,646,850)$ -$
-$ 9,592,677$ -$ (314,632) (12,543,278) -
(70,278) (1,495,058) - (421,293) (3,801,911) -
(806,203)$ (8,247,570)$ -$
5,891$ 35,617$ 9,930$ 5,891$ 35,617$ 9,930$
228,212$ (155,710)$ 493,745$
1,594,948 12,193,901 2,897,314
1,823,160$ 12,038,191$ 3,391,059$
456,654$ 6,507,320$ 488,671$
453,398$ 4,273,216$ -$ (5,959) (247,698) (1,209)
- 28,516 - - (371) 16,846
67,431 142,107 (20,493) 514,870$ 4,195,770$ (4,856)$
971,524$ 10,703,090$ 483,815$
9,301$ 826,014$ -$ - - -
Page 61
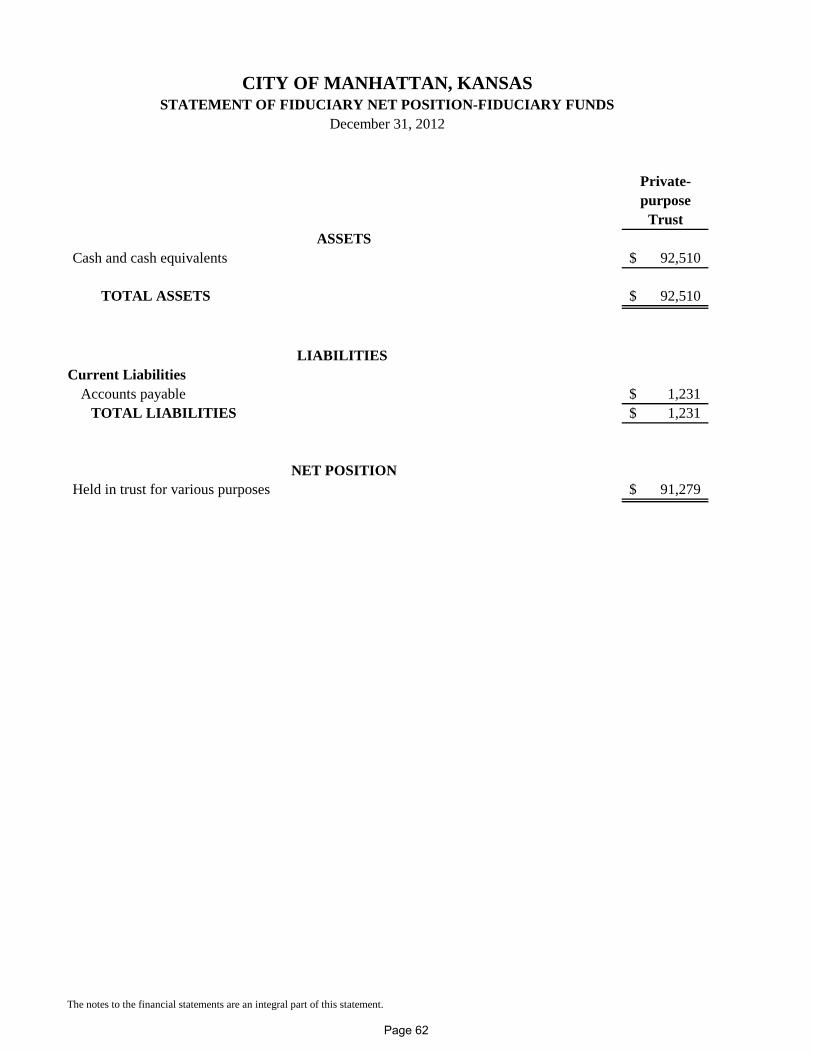
CITY OF MANHATTAN, KANSASSTATEMENT OF FIDUCIARY NET POSITION-FIDUCIARY FUNDS
December 31, 2012
Private-purpose
TrustASSETS
Cash and cash equivalents 92,510$
TOTAL ASSETS 92,510$
LIABILITIES Current Liabilities
Accounts payable 1,231$ TOTAL LIABILITIES 1,231$
Held in trust for various purposes 91,279$
The notes to the financial statements are an integral part of this statement.
NET POSITION
Page 62
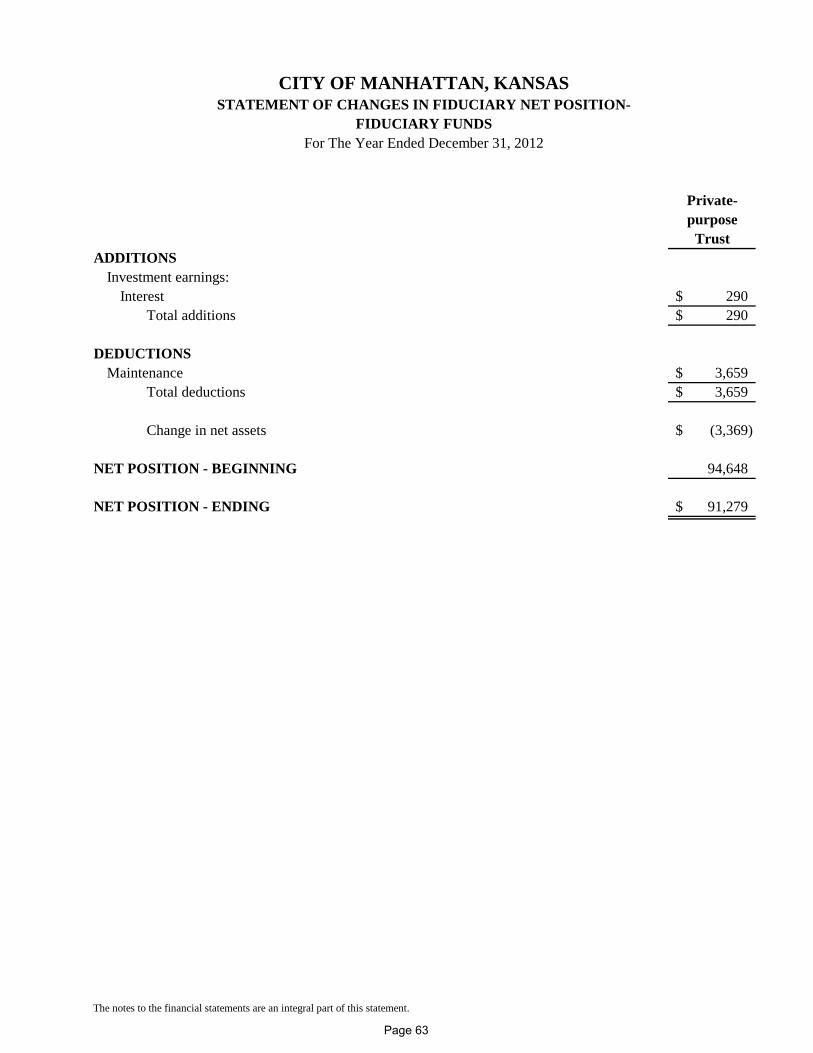
Private-purpose
TrustADDITIONS
Investment earnings:Interest 290$
Total additions 290$
DEDUCTIONSMaintenance 3,659$
Total deductions 3,659$
Change in net assets (3,369)$
NET POSITION - BEGINNING 94,648
NET POSITION - ENDING 91,279$
The notes to the financial statements are an integral part of this statement.
CITY OF MANHATTAN, KANSASSTATEMENT OF CHANGES IN FIDUCIARY NET POSITION-
FIDUCIARY FUNDSFor The Year Ended December 31, 2012
Page 63

THIS PAGE INTENTIONALLY LEFT BLANK
Page 64
CITY OF MANHATTAN, KANSAS NOTES TO THE FINANCIAL STATEMENTS
December 31, 2012 Note 1: Summary of Significant Accounting Policies:
The City of Manhattan, Kansas was chartered May 30, 1857 under the first session of the legislature of the Kansas Territory. The City operates under a Commission-Manager form of government. The accounting policies of the City of Manhattan, Kansas relating to the funds included in the accompanying combined financial statements conform to accounting principles generally accepted in the United States of America (U.S. GAAP) as applicable to state and local governments. U.S. GAAP for local governments include those principles prescribed by the Governmental Accounting Standards Board (GASB) and by the Financial Accounting Standards Board (FASB) (when applicable). The more significant policies of the City are described below.
A. Financial Reporting Entity
The City’s combined financial statements include the accounts of all City operations. The criteria for including organizations as component units within the City’s reporting entity, as set forth in section 2100 of GASB’s Codification of Governmental Accounting and Financial Reporting Standards, include whether:
• the organization is legally separate (can sue and be sued in their own name) • the City holds the corporate powers of the organization • the City appoints a voting majority of the organization’s board • the City is able to impose its will on the organization • the organization has the potential to impose a financial benefit/burden on the City • there is fiscal dependency by the organization on the City
Based on the aforementioned criteria, the City of Manhattan has two discretely presented component units. Each discretely presented component unit is reported in a separate column in the government-wide financial statements to emphasize that it is legally separate from the City. Manhattan Public Library The City of Manhattan Library Board is appointed by the City Commission and oversees the operations of the Library. Acquisition or disposition of real property by the board must be approved by the City. The issuance of bonds must also be approved by the City. Manhattan Housing Authority Effective January 1, 2001, the City of Manhattan Housing Authority became a separate entity and agent of the City. The City of Manhattan Housing Authority consists of seven (7) commissioners appointed by the Mayor of the City with the consent of the City Commission and oversees the operations of the Housing Authority. The issuance of bonds must be approved by the City. Complete financial statements for each of the component units may be obtained at the entity’s administrative offices.
Page 65
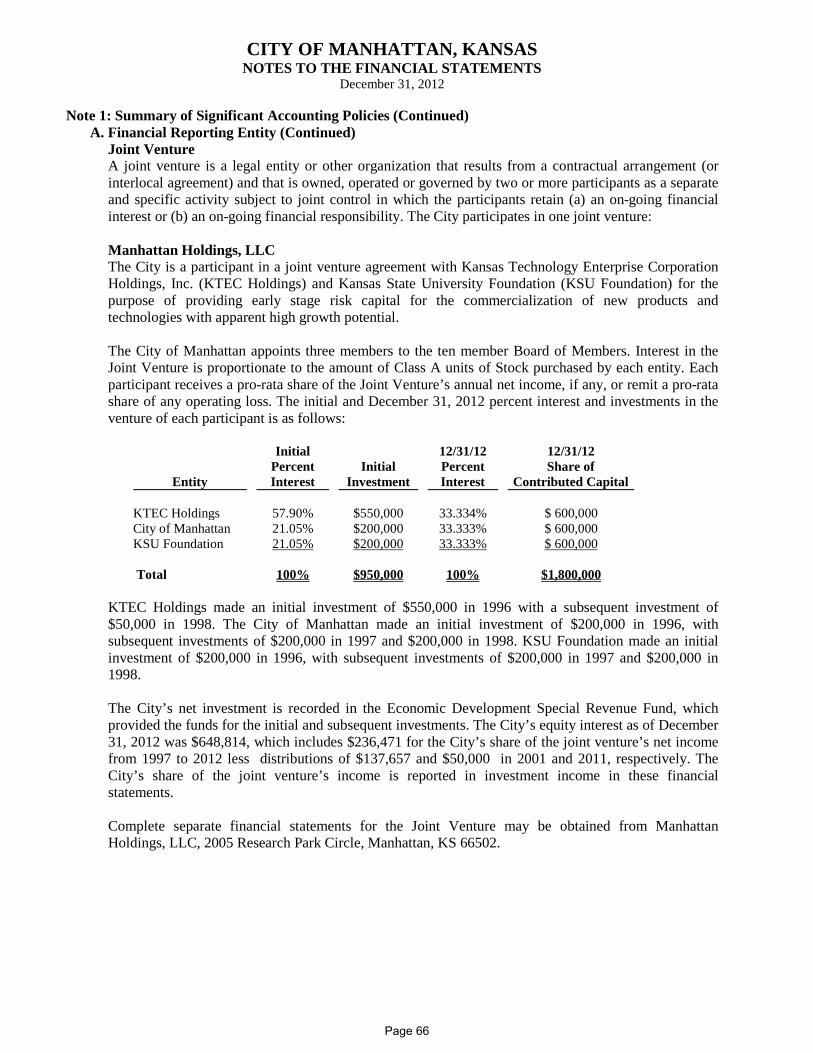
CITY OF MANHATTAN, KANSAS NOTES TO THE FINANCIAL STATEMENTS
December 31, 2012
Note 1: Summary of Significant Accounting Policies (Continued) A. Financial Reporting Entity (Continued)
Joint Venture A joint venture is a legal entity or other organization that results from a contractual arrangement (or interlocal agreement) and that is owned, operated or governed by two or more participants as a separate and specific activity subject to joint control in which the participants retain (a) an on-going financial interest or (b) an on-going financial responsibility. The City participates in one joint venture: Manhattan Holdings, LLC The City is a participant in a joint venture agreement with Kansas Technology Enterprise Corporation Holdings, Inc. (KTEC Holdings) and Kansas State University Foundation (KSU Foundation) for the purpose of providing early stage risk capital for the commercialization of new products and technologies with apparent high growth potential. The City of Manhattan appoints three members to the ten member Board of Members. Interest in the Joint Venture is proportionate to the amount of Class A units of Stock purchased by each entity. Each participant receives a pro-rata share of the Joint Venture’s annual net income, if any, or remit a pro-rata share of any operating loss. The initial and December 31, 2012 percent interest and investments in the venture of each participant is as follows:
Entity
Initial Percent Interest
Initial
Investment
12/31/12 Percent Interest
12/31/12 Share of
Contributed Capital KTEC Holdings 57.90% $550,000 33.334% $ 600,000 City of Manhattan 21.05% $200,000 33.333% $ 600,000 KSU Foundation 21.05% $200,000 33.333% $ 600,000 Total 100% $950,000 100% $1,800,000
KTEC Holdings made an initial investment of $550,000 in 1996 with a subsequent investment of $50,000 in 1998. The City of Manhattan made an initial investment of $200,000 in 1996, with subsequent investments of $200,000 in 1997 and $200,000 in 1998. KSU Foundation made an initial investment of $200,000 in 1996, with subsequent investments of $200,000 in 1997 and $200,000 in 1998.
The City’s net investment is recorded in the Economic Development Special Revenue Fund, which provided the funds for the initial and subsequent investments. The City’s equity interest as of December 31, 2012 was $648,814, which includes $236,471 for the City’s share of the joint venture’s net income from 1997 to 2012 less distributions of $137,657 and $50,000 in 2001 and 2011, respectively. The City’s share of the joint venture’s income is reported in investment income in these financial statements. Complete separate financial statements for the Joint Venture may be obtained from Manhattan Holdings, LLC, 2005 Research Park Circle, Manhattan, KS 66502.
Page 66
CITY OF MANHATTAN, KANSAS NOTES TO THE FINANCIAL STATEMENTS
December 31, 2012
Note 1: Summary of Significant Accounting Policies (Continued) B. Government-wide and Fund Financial Statements
The government-wide financial statements (i.e., the statement of net position and the statement of activities) report information on all of the nonfiduciary activities of the City and its component units. Governmental activities, which normally are supported by taxes and intergovernmental revenues, are reported separately from business-type activities, which rely to a significant extent on fees and charges for support. Likewise, the primary government is reported separately from certain legally separate component units for which the primary government is financially accountable. The statement of activities demonstrates the degree to which the direct expenses of a given function or segment are offset by program revenues. Direct expenses are those that are clearly identifiable with a specific function or segment. Program revenues include 1) charges to customers or applicants who purchase, use, or directly benefit from goods, services, or privileges provided by a given function or segment and 2) grants and contributions that are restricted to meeting the operational or capital requirements of a particular function or segment. Taxes and other items not properly included among program revenues are reported instead as general revenues. Separate financial statements are provided for governmental funds, proprietary funds, and fiduciary funds, even though the latter are excluded from the government-wide financial statements. Major individual governmental funds and major individual enterprise funds are reported as separate columns in the fund financial statements.
C. Measurement Focus, Basis of Accounting, and Financial Statement Presentation The government-wide financial statements are reported using the economic resources measurement focus and the accrual basis of accounting, as are the proprietary fund and fiduciary fund financial statements. Revenues are recorded when earned and expenses are recorded when a liability is incurred, regardless of the timing of related cash flows. Property taxes are recognized as revenues in the year for which they are levied. Grants and similar items are recognized as revenue as soon as all eligibility requirements imposed by the provider have been met.
Governmental fund financial statements are reported using the current financial resources measurement focus and the modified accrual basis of accounting. Revenues are recognized as soon as they are both measurable and available. Revenues are considered to be available when they are collectible within the current period or soon enough thereafter to pay liabilities of the current period (within 60 days of year-end). Most expenditures, including capital outlays, are recorded when a liability is incurred. However, principal and interest on general long-term debt which have not matured are recognized when paid. Sales taxes, franchise taxes, licenses, interest, and certain state and federal grants and entitlements associated with the current fiscal year are all considered to be susceptible to accrual and so have been recognized as revenues of the current fiscal year. Property taxes and special assessments, though measurable, are not available to finance current period obligations, as they are legally required to fund the expenditures of the upcoming fiscal year. Therefore, property tax and special assessment receivables are recorded and deferred until they become available.
Page 67
CITY OF MANHATTAN, KANSAS NOTES TO THE FINANCIAL STATEMENTS
December 31, 2012
Note 1: Summary of Significant Accounting Policies (Continued) C. Measurement Focus, Basis of Accounting, and Financial Statement Presentation (Continued)
The City reports the following major governmental funds: General Fund - The General Fund is the general operating fund of the City. It is used to account for all financial resources except those required to be accounted for in another fund. Riley County Police Department Fund – The Riley County Police Department Fund is a special revenue fund used to account for ad valorem property tax revenue received by the City to fund expenditures made to the Riley County Police Department for police protection. Debt Service Fund – The Debt Service Fund accounts for the resources accumulated and payments made for principal and interest on long-term general obligation debt of the governmental funds. Capital Projects Fund – The Capital Projects Fund accounts for the financing and acquisition and construction of various citywide improvements.
The City reports the following major proprietary funds: Water Fund – The Water Fund is used to account for revenues and expenditures related to the operation and maintenance of the water system operated within the City. Wastewater Fund – The Wastewater Fund is used to account for revenues and expenditures related to the operation and maintenance of the wastewater system operated within the City. Additionally, the City reports the following fund types: Internal service funds account for motor pool and photocopy services provided to other departments or agencies of the City, or to other governments, on a cost reimbursement basis. These funds also account for the City’s partially self-funded health care and workers’ compensation programs. Private-purpose trust funds are used to account for bequests received from individual citizens, the interest income from which is used for the upkeep of lots designated by the donor and also for flowers for these lots each Memorial Day at Sunset Cemetery. Private-purpose trust funds are also used to account for revenue received from the sale of bricks for the Mall Plaza. Maintenance costs are paid from the interest earned. Permanent funds are used to account for the perpetual care endowment of Sunrise Cemetery. Private-sector standards of accounting and financial reporting, issued prior to December 1, 1989, generally are followed in both the government-wide and proprietary fund financial statements to the extent that those standards do not conflict with or contradict guidance of the Governmental Accounting Standards Board. Governments also have the option of following subsequent private-sector guidance for their business-type activities and enterprise funds, subject to this same limitation. The City has elected not to follow subsequent private-sector guidance.
Page 68
CITY OF MANHATTAN, KANSAS NOTES TO THE FINANCIAL STATEMENTS
December 31, 2012
Note 1: Summary of Significant Accounting Policies (Continued) C. Measurement Focus, Basis of Accounting, and Financial Statement Presentation (Continued)
As a general rule, the effect of interfund activity has been eliminated from the government-wide financial statements. Exceptions to this general rule are payments-in-lieu of taxes and other charges between the City’s water, wastewater, and storm water management functions and various other functions of the government. Elimination of these charges would distort the direct costs and program revenues reported for the various functions concerned. Amounts reported as program revenues include 1) charges to customers or applicants for goods, services, or privileges provided 2) operating grants and contributions, and 3) capital grants and contributions, including special assessments. Internally dedicated resources are reported as general revenues rather than as program revenues. Likewise, general revenues include all taxes. Proprietary funds distinguish operating revenues and expenses from nonoperating items. Operating revenues and expenses generally result from providing services and delivering goods in connection with a proprietary fund’s principal ongoing operations. The principal operating revenues of all of the City’s proprietary funds are charges to customers for sales and services. The City’s water utility also recognizes as operating revenue the portion of tap fees intended to recover the cost of connecting new customers to the system. Operating expenses for the proprietary funds include the cost of sales and services, administrative expenses, and depreciation on capital assets. All revenues and expenses not meeting this definition are reported as nonoperating revenues and expenses. When both restricted and unrestricted resources are available for use, it is the City’s policy to use restricted resources first, then unrestricted resources as they are needed.
D. Assets, Liabilities, and Net Position Cash, Cash Equivalents and Investments The City’s cash and cash equivalents are considered to be cash on hand; demand deposits, including all certificates of deposit; and short-term investments with original maturities of three months or less from the date of acquisition.
In accordance with the City's formal investment policy adopted by the governing body, the City may pool idle cash from all funds for the purpose of increasing income through temporary investment activities. Cash and investments of the individual funds are combined to form a pool which is managed by the Director of Finance. Each fund’s equity in the pool is included in “cash and cash equivalents” in the financial statements. These pooled investments consist primarily of operating accounts, nonnegotiable certificates of deposit and money market investments, such as U.S. Treasury and Agency obligations. As provided for in GASB Statement No. 31, the nonnegotiable certificates of deposit are recorded at cost, as they are not affected by market rate changes. GASB Statement No. 31 also provides that governmental entities may report all other investments at fair value or they may elect to report certain money market investments at amortized cost. The City has elected to report all other investments at fair value. Fair value was determined using the bid price of each security as reported in the Wall Street Journal. There were no material changes in fair value and therefore no investment gain or loss was recorded. Investment earnings are allocated to the funds required to accumulate earnings based upon their average daily equity balances.
Page 69
CITY OF MANHATTAN, KANSAS NOTES TO THE FINANCIAL STATEMENTS
December 31, 2012
Note 1: Summary of Significant Accounting Policies (Continued) D. Assets, Liabilities, and Net Position (Continued)
Cash, Cash Equivalents and Investments (Continued) If a fund is not required to account for its own earnings by law or regulation, the earnings are allocated to the General Fund. For the fiscal year ended December 31, 2012, investment earnings allocated to the various funds were $108,702.
Receivables and Payables Advances between funds, as reported in the fund financial statements, are offset by a fund balance reserve account in applicable governmental funds to indicate that they are not available for appropriation and are not expendable available financial resources. All trade receivables are shown net of an allowance for uncollectibles. Trade accounts receivable are considered uncollectible in varying percentages based on the specific type of receivable and its age. However, the majority are considered uncollectible in the percentages below based on the following criteria:
Up to one year old 25% More than one and up to two years old 65% More than two and up to four years old 85% More than four and up to five years old 95% More than five years old 100%
No allowance for uncollectibles has been established for property taxes receivable, as the actual delinquency rate on property taxes has historically been very low.
Inventories Inventories which benefit future periods, other than those recorded in the proprietary fund types, are recorded as expenditures during the year of purchase. For the proprietary fund types, inventories are stated at the lower of cost or market, cost being determined by the first-in, first-out method. Capital Assets Capital assets, which include property, plant, equipment and infrastructure assets (streets, drainage systems and similar items) are reported in the applicable governmental or business-type activities columns in the government-wide financial statements. Capital assets are defined by the government as assets with an initial individual cost of more than $5,000 and an estimated useful life in excess of one year. Such assets are recorded at historical cost or estimated historical cost if purchased or constructed. Donated capital assets are recorded at estimated fair market value at the date of donation. The costs of normal maintenance and repairs that do not add to the value of the asset or materially extend asset lives are not capitalized. Major outlays for capital assets and improvements are capitalized as projects are constructed.
Page 70
CITY OF MANHATTAN, KANSAS NOTES TO THE FINANCIAL STATEMENTS
December 31, 2012
Note 1: Summary of Significant Accounting Policies (Continued) D. Assets, Liabilities, and Net Position (Continued)
Capital Assets (Continued) Interest incurred during the construction phase of capital assets of business-type activities is included as part of the capitalized value of the assets constructed. Capital assets are depreciated using the straight-line method over the following estimated useful lives:
Buildings 45 years Improvements other than buildings 20 years Vehicles 10 years Machinery 10-15 years Office equipment 7-10 years Treatment plants 40 years Water and sewer mains 40 years Streets 20 years Storm drainage systems 40 years
Vacation and Sick Pay The City’s policy regarding vacation pay permits employees to accumulate vacation leave not to exceed two (2) times their annual rate (maximum hours depending on the rate are 192, 264, 312, 384 or 432) unless approved by the City Manager, as of December 31 of each year. The accumulated vacation is governed by agreements with the International Association of Fire Fighters (IAFF) for union employees, and the City’s Personnel Rules and Regulations for non-union employees. Policy prohibits payment for vacation time in lieu of time off. At December 31, 2012, the City estimates the accumulated unpaid vacation amount to be $1,133,453 for governmental funds and $194,358 for proprietary funds. There is no limit to the amount of sick leave that may be accumulated. However, there are limits to the amount of accumulated sick leave that will be paid on the date of employment termination. Shift employees who belong to the IAFF with from one to nineteen years of service with the City will receive payment for 1/3 of accumulated sick leave up to a maximum of 480 hours. Shift employees who belong to the IAFF with twenty or more years of service with the City will receive payment for 1/2 of accumulated sick leave up to a maximum of 720 hours. Other City employees with from one to nineteen years of service with the City will receive payment for 1/3 of accumulated sick pay up to a maximum of 320 hours. Other City employees with twenty or more years of service with the City will receive payment for 1/2 of accumulated sick pay up to a maximum of 480 hours. At December 31, 2012, the City estimates the accumulated unpaid sick pay amount to be $1,051,033 for governmental funds and $136,991 for proprietary funds. These amounts include only accumulated sick leave that would be paid on the date of employment termination.
The total liability for compensated absences for vacation and sick leave for governmental funds is $2,184,486. This liability is recorded in the governmental activities column of the government-wide financial statements but not the governmental fund financial statements. The total liability for compensated absences for vacation and sick leave for proprietary funds is $331,349. This liability is recorded in both the business-type activities column of the government-wide financial statements and the proprietary fund financial statements.
Page 71
CITY OF MANHATTAN, KANSAS NOTES TO THE FINANCIAL STATEMENTS
December 31, 2012
Note 1: Summary of Significant Accounting Policies (Continued) D. Assets, Liabilities, and Net Position (Continued)
Long-term Liabilities The accounting treatment of long-term debt depends on whether the debt relates to governmental fund operations or proprietary fund operations and whether it is being reported in the government-wide or fund financial statements. All long-term debt to be repaid from governmental resources is reported as liabilities in the government-wide statements. This long-term debt consists primarily of bonds and notes payable and accrued compensated absences. Long-term debt for governmental funds is not reported as liabilities in the governmental fund financial statements. The debt proceeds are reported as other financing sources and principal payments are reported as expenditures. The long-term debt and other long-term obligations of the proprietary fund types are recorded as liabilities in both the proprietary fund statements and the government-wide statements. Special Assessments Kansas Statutes require projects financed in part by special assessments to be financed through the issuance of general obligation bonds which are secured by the full faith and credit of the City. Special assessments received prior to the issuance of bonds are recorded as revenue in the appropriate project. Special assessments received after the issuance of bonds are recorded as revenue in the Debt Service Fund. Accordingly, special assessments receivable are accounted for within the Debt Service Fund. Special assessments may be levied over various periods, but are generally levied over 20 years. The annual installments are due and payable with the annual ad valorem property taxes. Special assessments receivable are offset with a corresponding amount of deferred revenue in the governmental fund financial statements, but not in the government-wide financial statements. Special assessments in the amount of $488,420 were delinquent at December 31, 2012. Fund Balance The City of Manhattan elected to implement GASB 54, Fund Balance Reporting and Governmental Fund Type Definitions, in calendar year 2011. Through various City ordinances and resolutions approved by the City Commission, in addition to policies set by the City Manager, the Finance Director assigns fund balances across all budgeted and non-budgeted funds of the City for any given fiscal year. In the governmental fund financial statements, fund balances are classified as follows: • Non-Spendable: amounts legally or contractually required to be maintained or not in spendable form, such
as inventory or prepaid times. Such constraint is binding until the legal requirement is repealed or the amounts become spendable.
• Restricted: amounts with externally imposed constraints, such as those mandated by creditors, grantors and contributors, or laws and regulations. Such constraint is binding unless modified or rescinded by the applicable external body, law or regulations.
• Committed: amounts with a purpose formally imposed by resolution by the Governing Body of the City, binding unless modified or rescinded by the Governing Body.
• Assigned: amounts constrained by the express intent of the Governing Body, City Manager or designee. Encumbrances shall be considered as assigned, unless they specifically meet the requirements to be committed or restricted.
• Unassigned: all amounts not included in other fund balance classifications. The General Fund is the only fund that would report a positive amount in unassigned fund balances.
In circumstances when an expenditure is made for a purpose which amounts are available in multiple fund balance classifications, fund balance is depleted in the order of restricted, committed, assigned and unassigned.
Page 72
CITY OF MANHATTAN, KANSAS NOTES TO THE FINANCIAL STATEMENTS
December 31, 2012
Note 1: Summary of Significant Accounting Policies (Continued) D. Assets, Liabilities, and Net Position (Continued)
Net Position In the government-wide statements, equity is shown as net position and classified into three components:
1. Net investment in capital assets – consisting of capital assets including restricted capital assets, net of accumulated depreciation and reduced by the outstanding balances of any bonds, mortgages, notes, or other borrowings that are attributable to the acquisition, construction, or improvement of those assets.
2. Restricted for – consisting of net assets with constraints placed on their use either by (1) external groups such as creditors, grantors, contributors, or laws or regulations of other governments; or (2) law through constitutional provision or enabling legislation.
3. Unrestricted – all other net assets that do not meet the definition of “restricted” or “invested in capital assets, net of related debt.”
In the fund financial statements, governmental funds report reservations of fund balance for amounts that are not available for appropriation or are legally restricted by outside parties for use for a specific purpose. Interfund Receivable/Liability As previously discussed, the City pools cash from all funds. From time to time, a fund will overdraw its share of pooled cash. The overdrawn amount is reported as a liability in the overdrawn fund. An interfund receivable is reported in the General Fund or another fund as determined by management. Interfund Transfers Permanent reallocations of resources between funds of the reporting entity are classified as interfund transfers. For the purpose of the statement of activities, all interfund transfers between individual governmental funds have been eliminated. Estimates The preparation of financial statements in conformity with U.S. GAAP requires management to make estimates and assumptions that affect certain reported amounts and disclosures. Accordingly, actual results may differ from those estimates. Pending Governmental Accounting Standards Board Statements At December 31, 2012, the Governmental Accounting Standards Board (GASB) had issued several statements not yet implemented by the City. The statements that might impact the City are as follows: GASB Statement No. 61, “The Financial Reporting Entity: Omnibus”, was issued in November 2010. This statement modifies certain requirements for inclusion of component units in the financial statements when the component unit was included based on the fiscal dependency requirement. The new statement clarifies the manner in which a government’s management determines a component unit should be included, even if the financial accountability criterion is not met. This statement also amends the criteria for reporting component units as if they were part of the primary government (that is, blending) when the component unit is blended based on the “substantively in the same governing body” criterion. New criteria also are added to require blending of component units whose total debt outstanding is expected to be repaid entirely or almost entirely with resources of the primary government. The provisions of this statement are effective for periods beginning after June 15, 2012.
Page 73
CITY OF MANHATTAN, KANSAS NOTES TO THE FINANCIAL STATEMENTS
December 31, 2012
Note 1: Summary of Significant Accounting Policies (Continued) D. Assets, Liabilities, and Net Position (Continued)
Pending Governmental Accounting Standards Board Statements (Continued) GASB Statement No. 65, "Items Previously Reported as Assets and Liabilities", was issued April 2, 2012. This statement clarifies the appropriate reporting of deferred outflows of resources and deferred inflows of resources to ensure consistency in financial reporting. The provisions of this statement are effective for periods beginning after December 15, 2012. GASB Statement No. 66, "Technical Corrections-2012", was issued April 2, 2012. This statement amends Statement No. 10, Accounting and Financial Reporting for Risk Financing and Related Insurance Issues, by removing the provision that limits fund-based reporting of a state and local government's risk financing activities to the general fund and the internal service fund types. This statement also amends Statement No. 62, "Codification of Accounting and Financial Reporting Guidance Contained in Pre-November 30, 1989 FASB and AICPA pronouncements, by modifying the specific guidance on accounting for various items. The provisions of this statement are effective for periods beginning after December 15, 2012. GASB Statement No. 67, "Financial Reporting for Pension Plans", was issued June 25, 2012. This statement revises and establishes new financial reporting requirements for most governments that provide their employees with pension benefits. The provisions of this statement are effective for periods beginning after June 15, 2013. GASB Statement No. 68, "Accounting and Financial Reporting for Pensions", was issued June 25, 2012. This statement establishes the methodology to be used by governments to value and report the liability associated with their participation in a defined benefit pension plan. The provisions of this statement are effective for periods beginning after June 15, 2014. GASB Statement No. 69, “Government Combinations and Disposals of Government Operations”, was issued January 2013. This Statement requires disclosures to be made about government combinations and disposals of government operations to enable financial statement users to evaluate the nature and financial effects of those transactions. The requirements of this Statement are effective for government combinations and disposals of government operations occurring in financial reporting periods beginning after December 15, 2013. GASB Statement No. 70, “Accounting and Financial Reporting for Nonexchange Financial Guarantees”, was issued April 2013. This Statement specifies the information required to be disclosed by governments that extend nonexchange financial guarantees. In addition, this Statement requires new information to be disclosed by governments that receive nonexchange financial guarantees. The provisions of this Statement are effective for reporting periods beginning after June 15, 2013.
Note 2: Stewardship, Compliance, and Accountability A. Budgets and Budgetary Accounting
Kansas statutes require that an annual operating budget be legally adopted for the General Fund, Special Revenue Funds (unless specifically exempted by statute), the Debt Service Fund and all Enterprise Funds.
The City Manager is authorized to transfer budgeted amounts between departments within any fund; however, any revisions that alter the total expenditures of any funds must be approved by the City Commission. The legal level of control is at the fund level basis.
Formal budgetary integration is employed as a management control device during the year for the General Fund, Budgeted Special Revenue Funds, Enterprise Funds, and Budgeted Debt Service Funds.
Page 74
CITY OF MANHATTAN, KANSAS NOTES TO THE FINANCIAL STATEMENTS
December 31, 2012
Note 2: Stewardship, Compliance, and Accountability (continued) A. Budgets and Budgetary Accounting (continued)
Budgets for the General, Budgeted Special Revenue, and Budgeted Debt Service Funds are adopted on a basis consistent with U.S. GAAP except that encumbrances are included in expenditures. Budgetary comparisons for the General, Special Revenue, and Debt Service Funds in this report are on this non-GAAP budgetary basis. Budgeted amounts are as originally adopted or amended by the City Commission.
The statutes allow for the governing body to increase the originally adopted budget for previously unbudgeted increases in revenue other than ad valorem property taxes. To do this, a notice of public hearing to amend the budget must be published in the local newspaper. At least ten days after publication the hearing may be held and the governing body may amend the budget at that time. The funds below were included as budgeted special revenue funds and have legally adopted annual budgets: Aggieville Business Improvement District Library City/University Projects Library Employee Benefit Contribution Capital Improvement Reserve Park Development Downtown Business Improvement District Riley County Police Department Economic Development Sales Tax Employee Benefit Contribution Special Alcohol Programs
Fire Equipment Reserve Special Parks and Recreation Fire Pension KP&F Special Street and Highway General Improvement Special Sunset Zoo Industrial Promotion Tourism and Convention Promotion The following debt service funds also have legally adopted annual budgets: Debt Service Downtown Redevelopment Senior Lien TIF Bonds The following enterprise funds also have legally adopted annual budgets: Water Wastewater Storm Water Management Encumbrance accounting, under which purchase orders, contracts, and other commitments for the expenditure of monies are recorded in order to reserve that portion of the applicable appropriation, is employed as an extension of formal budgetary integration in the General Fund, Special Revenue Funds, Debt Service Fund, and Capital Projects Fund. Encumbrances outstanding at year-end are reported as reservations of fund balances in the governmental fund statements since they do not constitute expenditures or liabilities, except in budgetary comparisons shown. All unencumbered appropriations lapse at year-end.
Page 75
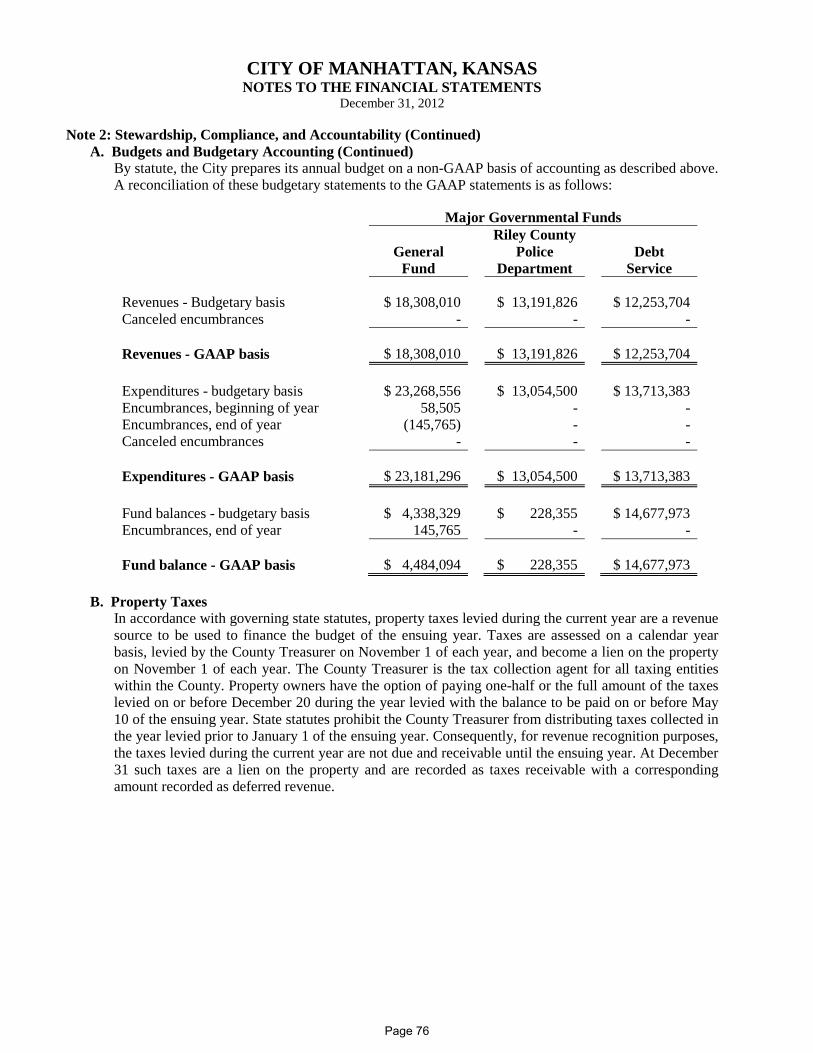
CITY OF MANHATTAN, KANSAS NOTES TO THE FINANCIAL STATEMENTS
December 31, 2012
Note 2: Stewardship, Compliance, and Accountability (Continued) A. Budgets and Budgetary Accounting (Continued)
By statute, the City prepares its annual budget on a non-GAAP basis of accounting as described above. A reconciliation of these budgetary statements to the GAAP statements is as follows:
Major Governmental Funds
Riley County
General
Police
Debt
Fund
Department
Service
Revenues - Budgetary basis $ 18,308,010
$ 13,191,826
$ 12,253,704 Canceled encumbrances -
-
-
Revenues - GAAP basis $ 18,308,010
$ 13,191,826
$ 12,253,704
Expenditures - budgetary basis $ 23,268,556
$ 13,054,500
$ 13,713,383 Encumbrances, beginning of year 58,505
-
-
Encumbrances, end of year (145,765)
-
- Canceled encumbrances -
-
-
Expenditures - GAAP basis $ 23,181,296
$ 13,054,500
$ 13,713,383
Fund balances - budgetary basis $ 4,338,329
$ 228,355
$ 14,677,973 Encumbrances, end of year 145,765
-
-
Fund balance - GAAP basis $ 4,484,094
$ 228,355
$ 14,677,973
B. Property Taxes In accordance with governing state statutes, property taxes levied during the current year are a revenue source to be used to finance the budget of the ensuing year. Taxes are assessed on a calendar year basis, levied by the County Treasurer on November 1 of each year, and become a lien on the property on November 1 of each year. The County Treasurer is the tax collection agent for all taxing entities within the County. Property owners have the option of paying one-half or the full amount of the taxes levied on or before December 20 during the year levied with the balance to be paid on or before May 10 of the ensuing year. State statutes prohibit the County Treasurer from distributing taxes collected in the year levied prior to January 1 of the ensuing year. Consequently, for revenue recognition purposes, the taxes levied during the current year are not due and receivable until the ensuing year. At December 31 such taxes are a lien on the property and are recorded as taxes receivable with a corresponding amount recorded as deferred revenue.
Page 76
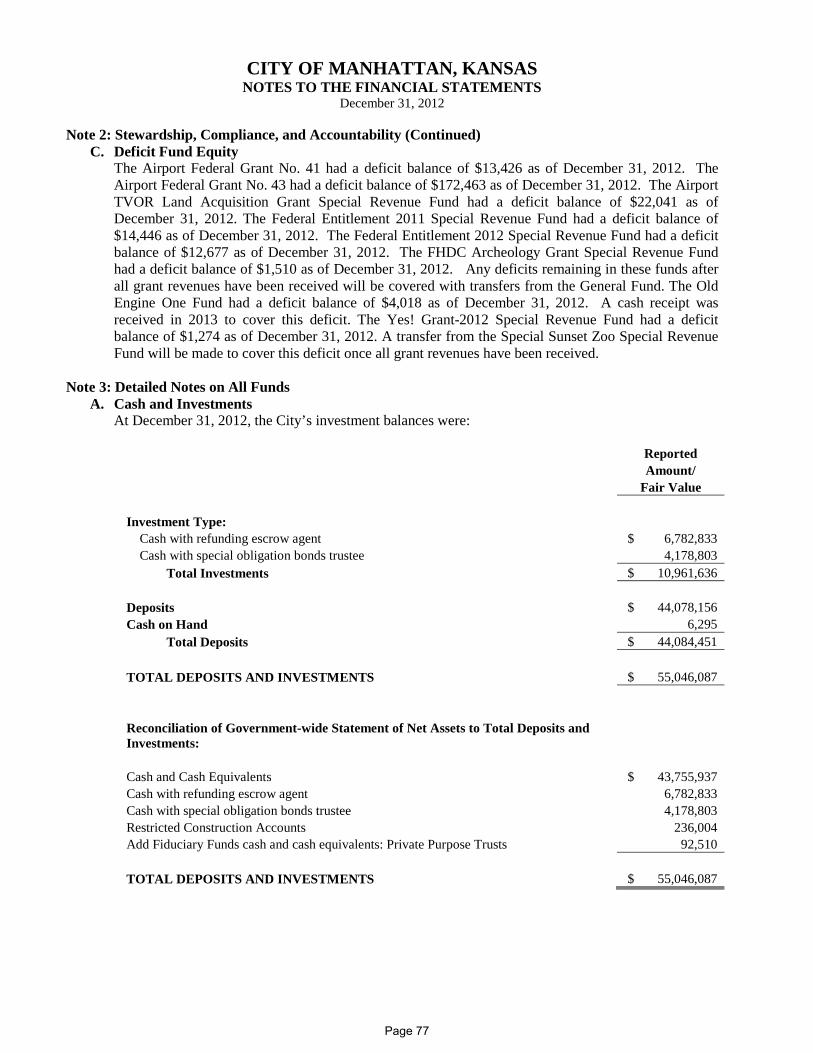
CITY OF MANHATTAN, KANSAS NOTES TO THE FINANCIAL STATEMENTS
December 31, 2012
Note 2: Stewardship, Compliance, and Accountability (Continued) C. Deficit Fund Equity
The Airport Federal Grant No. 41 had a deficit balance of $13,426 as of December 31, 2012. The Airport Federal Grant No. 43 had a deficit balance of $172,463 as of December 31, 2012. The Airport TVOR Land Acquisition Grant Special Revenue Fund had a deficit balance of $22,041 as of December 31, 2012. The Federal Entitlement 2011 Special Revenue Fund had a deficit balance of $14,446 as of December 31, 2012. The Federal Entitlement 2012 Special Revenue Fund had a deficit balance of $12,677 as of December 31, 2012. The FHDC Archeology Grant Special Revenue Fund had a deficit balance of $1,510 as of December 31, 2012. Any deficits remaining in these funds after all grant revenues have been received will be covered with transfers from the General Fund. The Old Engine One Fund had a deficit balance of $4,018 as of December 31, 2012. A cash receipt was received in 2013 to cover this deficit. The Yes! Grant-2012 Special Revenue Fund had a deficit balance of $1,274 as of December 31, 2012. A transfer from the Special Sunset Zoo Special Revenue Fund will be made to cover this deficit once all grant revenues have been received.
Note 3: Detailed Notes on All Funds
A. Cash and Investments At December 31, 2012, the City’s investment balances were:
Reported
Amount/
Fair Value
Investment Type: Cash with refunding escrow agent $ 6,782,833
Cash with special obligation bonds trustee 4,178,803 Total Investments $ 10,961,636
Deposits $ 44,078,156 Cash on Hand 6,295
Total Deposits $ 44,084,451
TOTAL DEPOSITS AND INVESTMENTS $ 55,046,087
Reconciliation of Government-wide Statement of Net Assets to Total Deposits and Investments:
Cash and Cash Equivalents $ 43,755,937 Cash with refunding escrow agent 6,782,833 Cash with special obligation bonds trustee 4,178,803 Restricted Construction Accounts 236,004 Add Fiduciary Funds cash and cash equivalents: Private Purpose Trusts 92,510
TOTAL DEPOSITS AND INVESTMENTS $ 55,046,087
Page 77
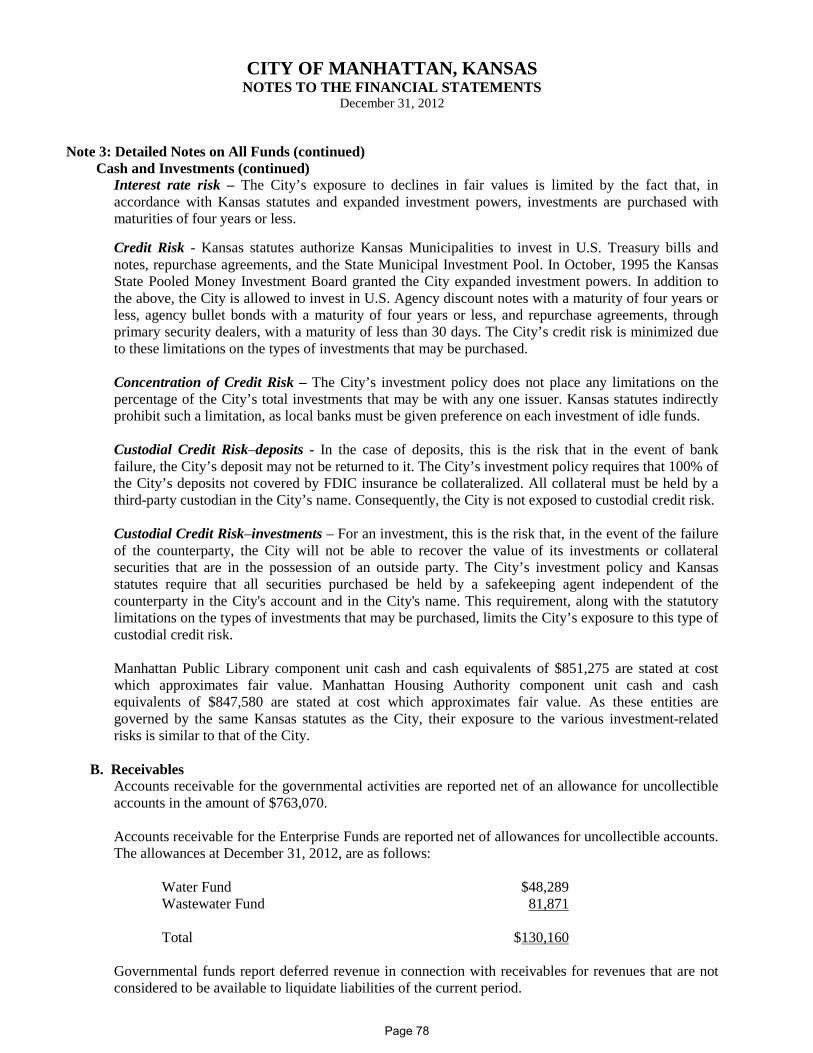
CITY OF MANHATTAN, KANSAS NOTES TO THE FINANCIAL STATEMENTS
December 31, 2012
Note 3: Detailed Notes on All Funds (continued)
Cash and Investments (continued) Interest rate risk – The City’s exposure to declines in fair values is limited by the fact that, in accordance with Kansas statutes and expanded investment powers, investments are purchased with maturities of four years or less.
Credit Risk - Kansas statutes authorize Kansas Municipalities to invest in U.S. Treasury bills and notes, repurchase agreements, and the State Municipal Investment Pool. In October, 1995 the Kansas State Pooled Money Investment Board granted the City expanded investment powers. In addition to the above, the City is allowed to invest in U.S. Agency discount notes with a maturity of four years or less, agency bullet bonds with a maturity of four years or less, and repurchase agreements, through primary security dealers, with a maturity of less than 30 days. The City’s credit risk is minimized due to these limitations on the types of investments that may be purchased. Concentration of Credit Risk – The City’s investment policy does not place any limitations on the percentage of the City’s total investments that may be with any one issuer. Kansas statutes indirectly prohibit such a limitation, as local banks must be given preference on each investment of idle funds.
Custodial Credit Risk–deposits - In the case of deposits, this is the risk that in the event of bank failure, the City’s deposit may not be returned to it. The City’s investment policy requires that 100% of the City’s deposits not covered by FDIC insurance be collateralized. All collateral must be held by a third-party custodian in the City’s name. Consequently, the City is not exposed to custodial credit risk.
Custodial Credit Risk–investments – For an investment, this is the risk that, in the event of the failure of the counterparty, the City will not be able to recover the value of its investments or collateral securities that are in the possession of an outside party. The City’s investment policy and Kansas statutes require that all securities purchased be held by a safekeeping agent independent of the counterparty in the City's account and in the City's name. This requirement, along with the statutory limitations on the types of investments that may be purchased, limits the City’s exposure to this type of custodial credit risk. Manhattan Public Library component unit cash and cash equivalents of $851,275 are stated at cost which approximates fair value. Manhattan Housing Authority component unit cash and cash equivalents of $847,580 are stated at cost which approximates fair value. As these entities are governed by the same Kansas statutes as the City, their exposure to the various investment-related risks is similar to that of the City.
B. Receivables
Accounts receivable for the governmental activities are reported net of an allowance for uncollectible accounts in the amount of $763,070. Accounts receivable for the Enterprise Funds are reported net of allowances for uncollectible accounts. The allowances at December 31, 2012, are as follows:
Water Fund $48,289 Wastewater Fund 81,871 Total $130,160
Governmental funds report deferred revenue in connection with receivables for revenues that are not considered to be available to liquidate liabilities of the current period.
Page 78
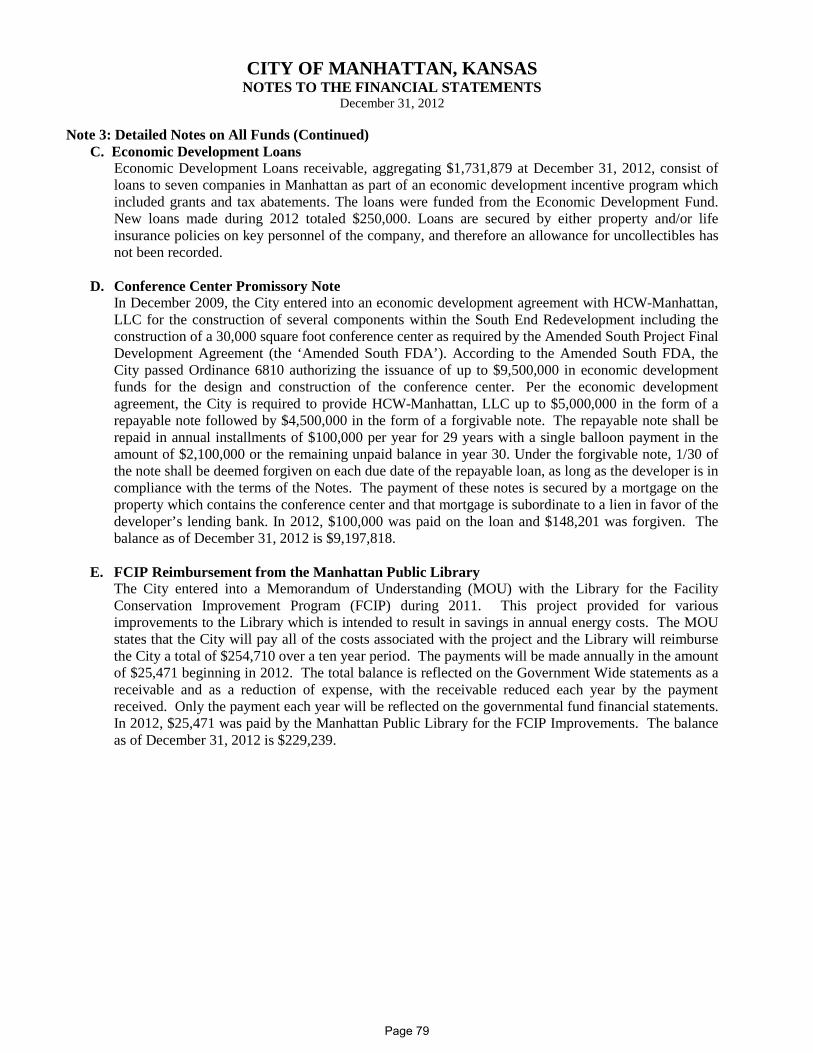
CITY OF MANHATTAN, KANSAS NOTES TO THE FINANCIAL STATEMENTS
December 31, 2012
Note 3: Detailed Notes on All Funds (Continued) C. Economic Development Loans
Economic Development Loans receivable, aggregating $1,731,879 at December 31, 2012, consist of loans to seven companies in Manhattan as part of an economic development incentive program which included grants and tax abatements. The loans were funded from the Economic Development Fund. New loans made during 2012 totaled $250,000. Loans are secured by either property and/or life insurance policies on key personnel of the company, and therefore an allowance for uncollectibles has not been recorded.
D. Conference Center Promissory Note
In December 2009, the City entered into an economic development agreement with HCW-Manhattan, LLC for the construction of several components within the South End Redevelopment including the construction of a 30,000 square foot conference center as required by the Amended South Project Final Development Agreement (the ‘Amended South FDA’). According to the Amended South FDA, the City passed Ordinance 6810 authorizing the issuance of up to $9,500,000 in economic development funds for the design and construction of the conference center. Per the economic development agreement, the City is required to provide HCW-Manhattan, LLC up to $5,000,000 in the form of a repayable note followed by $4,500,000 in the form of a forgivable note. The repayable note shall be repaid in annual installments of $100,000 per year for 29 years with a single balloon payment in the amount of $2,100,000 or the remaining unpaid balance in year 30. Under the forgivable note, 1/30 of the note shall be deemed forgiven on each due date of the repayable loan, as long as the developer is in compliance with the terms of the Notes. The payment of these notes is secured by a mortgage on the property which contains the conference center and that mortgage is subordinate to a lien in favor of the developer’s lending bank. In 2012, $100,000 was paid on the loan and $148,201 was forgiven. The balance as of December 31, 2012 is $9,197,818.
E. FCIP Reimbursement from the Manhattan Public Library The City entered into a Memorandum of Understanding (MOU) with the Library for the Facility Conservation Improvement Program (FCIP) during 2011. This project provided for various improvements to the Library which is intended to result in savings in annual energy costs. The MOU states that the City will pay all of the costs associated with the project and the Library will reimburse the City a total of $254,710 over a ten year period. The payments will be made annually in the amount of $25,471 beginning in 2012. The total balance is reflected on the Government Wide statements as a receivable and as a reduction of expense, with the receivable reduced each year by the payment received. Only the payment each year will be reflected on the governmental fund financial statements. In 2012, $25,471 was paid by the Manhattan Public Library for the FCIP Improvements. The balance as of December 31, 2012 is $229,239.
Page 79
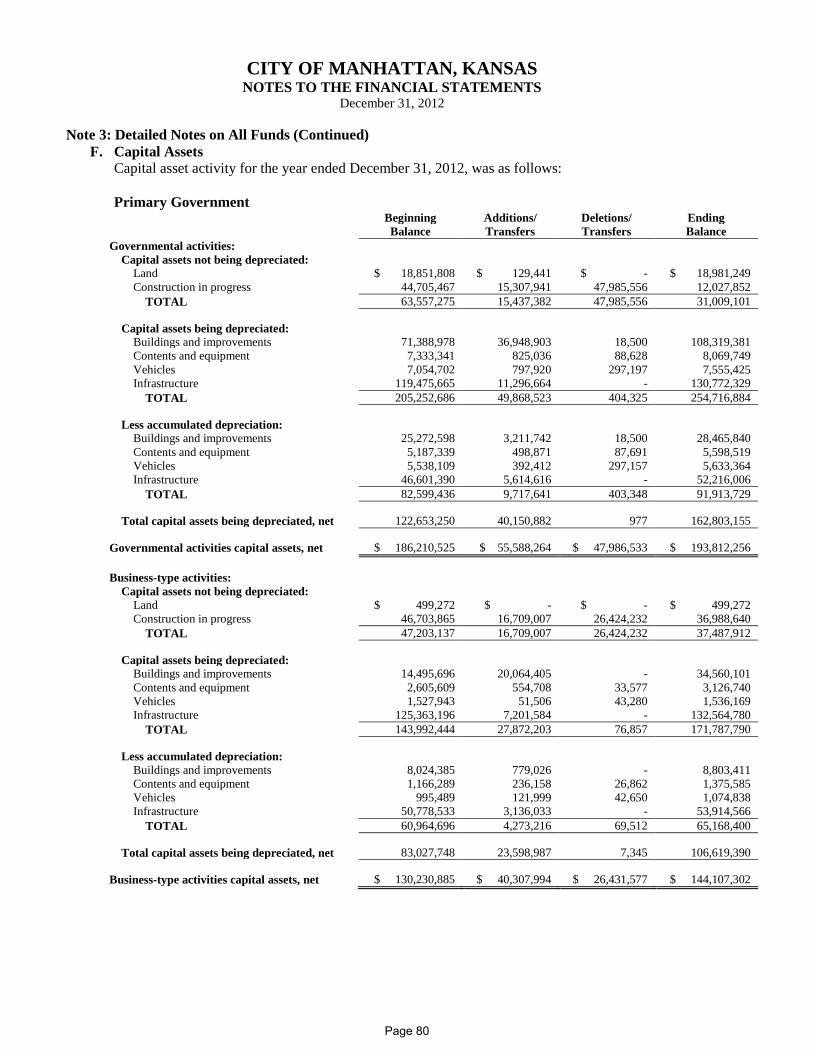
CITY OF MANHATTAN, KANSAS NOTES TO THE FINANCIAL STATEMENTS
December 31, 2012
Note 3: Detailed Notes on All Funds (Continued) F. Capital Assets
Capital asset activity for the year ended December 31, 2012, was as follows: Primary Government
Beginning Additions/ Deletions/ Ending
Balance Transfers Transfers Balance
Governmental activities: Capital assets not being depreciated: Land $ 18,851,808 $ 129,441 $ - $ 18,981,249
Construction in progress 44,705,467 15,307,941 47,985,556 12,027,852 TOTAL 63,557,275 15,437,382 47,985,556 31,009,101
Capital assets being depreciated: Buildings and improvements 71,388,978 36,948,903 18,500 108,319,381
Contents and equipment 7,333,341 825,036 88,628 8,069,749 Vehicles 7,054,702 797,920 297,197 7,555,425 Infrastructure 119,475,665 11,296,664 - 130,772,329
TOTAL 205,252,686 49,868,523 404,325 254,716,884
Less accumulated depreciation: Buildings and improvements 25,272,598 3,211,742 18,500 28,465,840
Contents and equipment 5,187,339 498,871 87,691 5,598,519 Vehicles 5,538,109 392,412 297,157 5,633,364 Infrastructure 46,601,390 5,614,616 - 52,216,006
TOTAL 82,599,436 9,717,641 403,348 91,913,729
Total capital assets being depreciated, net 122,653,250 40,150,882 977 162,803,155
Governmental activities capital assets, net $ 186,210,525 $ 55,588,264 $ 47,986,533 $ 193,812,256
Business-type activities: Capital assets not being depreciated: Land $ 499,272 $ - $ - $ 499,272
Construction in progress 46,703,865 16,709,007 26,424,232 36,988,640 TOTAL 47,203,137 16,709,007 26,424,232 37,487,912
Capital assets being depreciated: Buildings and improvements 14,495,696 20,064,405 - 34,560,101
Contents and equipment 2,605,609 554,708 33,577 3,126,740 Vehicles 1,527,943 51,506 43,280 1,536,169 Infrastructure 125,363,196 7,201,584 - 132,564,780
TOTAL 143,992,444 27,872,203 76,857 171,787,790
Less accumulated depreciation: Buildings and improvements 8,024,385 779,026 - 8,803,411
Contents and equipment 1,166,289 236,158 26,862 1,375,585 Vehicles 995,489 121,999 42,650 1,074,838 Infrastructure 50,778,533 3,136,033 - 53,914,566
TOTAL 60,964,696 4,273,216 69,512 65,168,400
Total capital assets being depreciated, net 83,027,748 23,598,987 7,345 106,619,390
Business-type activities capital assets, net $ 130,230,885 $ 40,307,994 $ 26,431,577 $ 144,107,302
Page 80
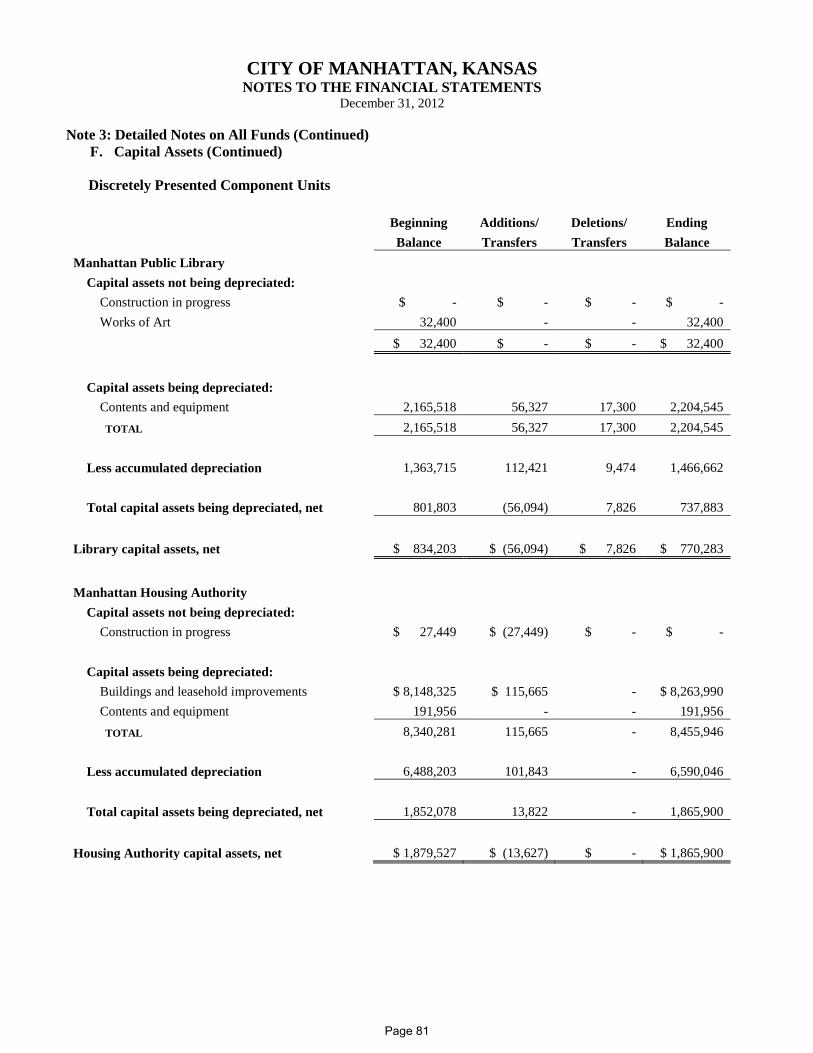
CITY OF MANHATTAN, KANSAS NOTES TO THE FINANCIAL STATEMENTS
December 31, 2012
Note 3: Detailed Notes on All Funds (Continued) F. Capital Assets (Continued)
Discretely Presented Component Units
Beginning Additions/ Deletions/ Ending
Balance Transfers Transfers Balance
Manhattan Public Library Capital assets not being depreciated: Construction in progress $ - $ - $ - $ -
Works of Art 32,400 - - 32,400
$ 32,400 $ - $ - $ 32,400
Capital assets being depreciated: Contents and equipment 2,165,518 56,327 17,300 2,204,545
TOTAL 2,165,518 56,327 17,300 2,204,545
Less accumulated depreciation 1,363,715 112,421 9,474 1,466,662
Total capital assets being depreciated, net 801,803 (56,094) 7,826 737,883
Library capital assets, net $ 834,203 $ (56,094) $ 7,826 $ 770,283
Manhattan Housing Authority Capital assets not being depreciated: Construction in progress $ 27,449 $ (27,449) $ - $ -
Capital assets being depreciated: Buildings and leasehold improvements $ 8,148,325 $ 115,665 - $ 8,263,990
Contents and equipment 191,956 - - 191,956 TOTAL 8,340,281 115,665 - 8,455,946
Less accumulated depreciation 6,488,203 101,843 - 6,590,046
Total capital assets being depreciated, net 1,852,078 13,822 - 1,865,900
Housing Authority capital assets, net $ 1,879,527 $ (13,627) $ - $ 1,865,900
Page 81
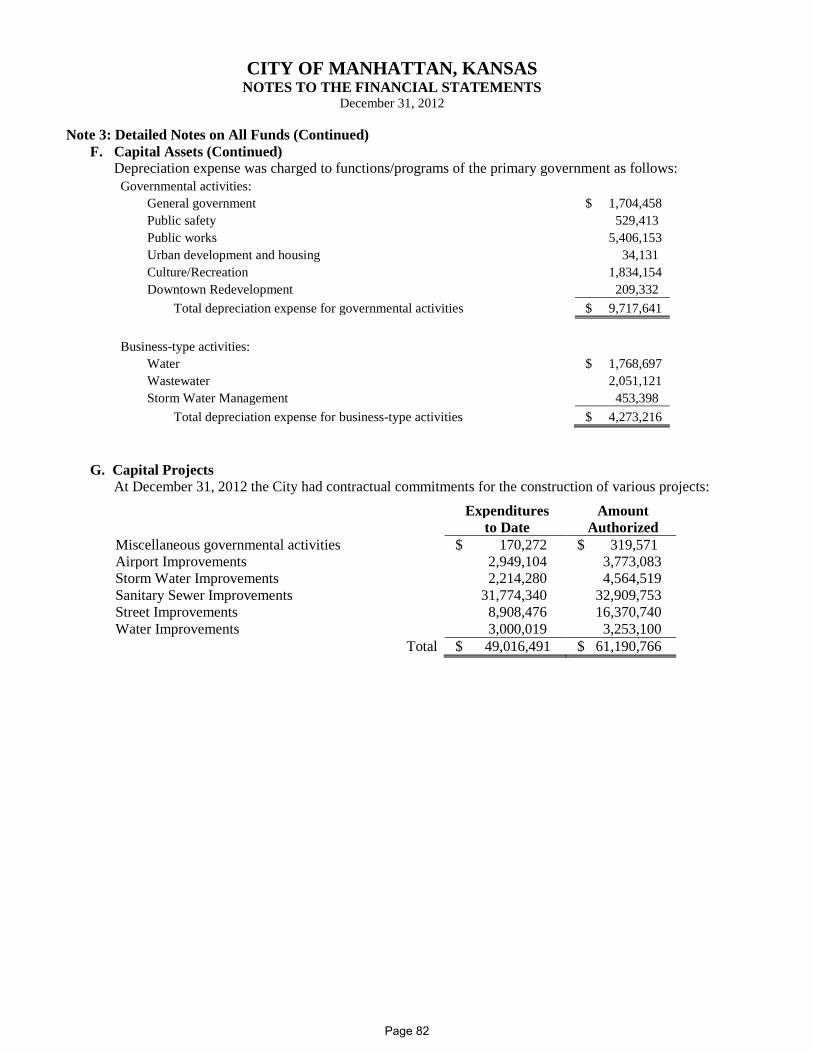
CITY OF MANHATTAN, KANSAS NOTES TO THE FINANCIAL STATEMENTS
December 31, 2012
Note 3: Detailed Notes on All Funds (Continued) F. Capital Assets (Continued)
Depreciation expense was charged to functions/programs of the primary government as follows: Governmental activities:
General government
$ 1,704,458 Public safety
529,413
Public works
5,406,153 Urban development and housing
34,131
Culture/Recreation
1,834,154 Downtown Redevelopment
209,332
Total depreciation expense for governmental activities
$ 9,717,641
Business-type activities: Water
$ 1,768,697
Wastewater
2,051,121 Storm Water Management
453,398
Total depreciation expense for business-type activities
$ 4,273,216
G. Capital Projects
At December 31, 2012 the City had contractual commitments for the construction of various projects:
Expenditures Amount
to Date Authorized
Miscellaneous governmental activities $ 170,272 $ 319,571 Airport Improvements 2,949,104 3,773,083 Storm Water Improvements 2,214,280 4,564,519 Sanitary Sewer Improvements 31,774,340 32,909,753 Street Improvements 8,908,476 16,370,740 Water Improvements 3,000,019 3,253,100
Total $ 49,016,491 $ 61,190,766
Page 82
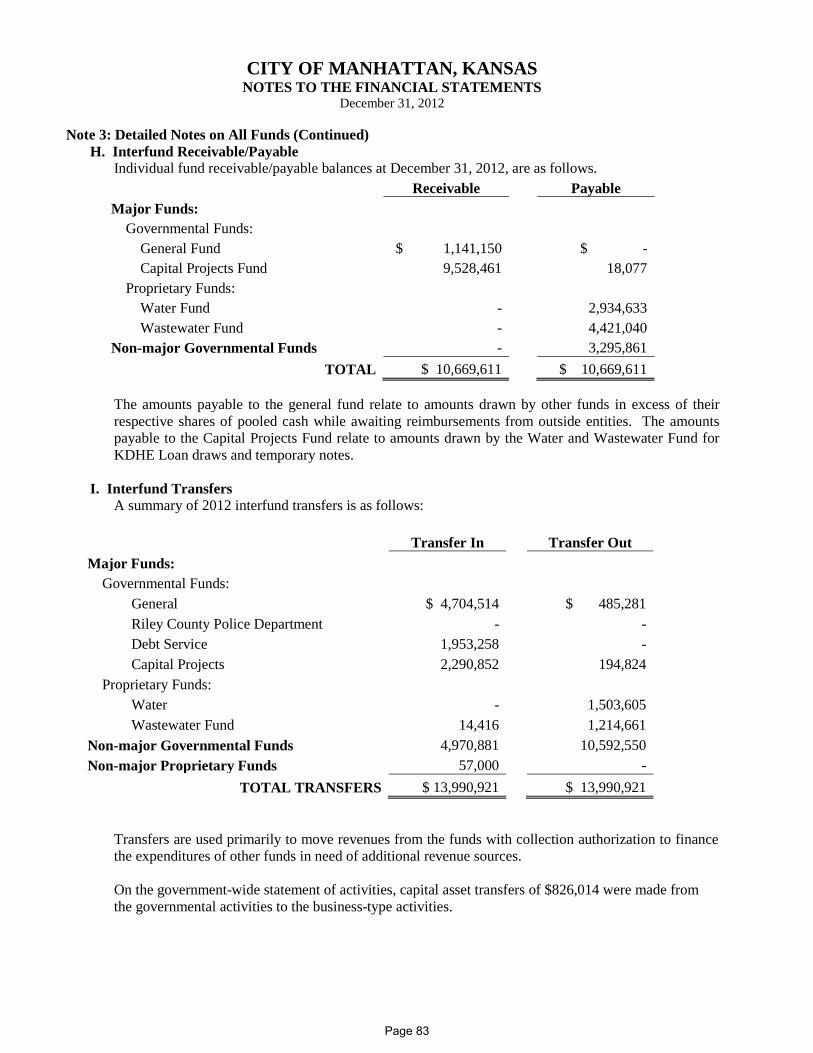
CITY OF MANHATTAN, KANSAS NOTES TO THE FINANCIAL STATEMENTS
December 31, 2012
Note 3: Detailed Notes on All Funds (Continued) H. Interfund Receivable/Payable
Individual fund receivable/payable balances at December 31, 2012, are as follows.
Receivable
Payable
Major Funds: Governmental Funds:
General Fund $ 1,141,150
$ - Capital Projects Fund 9,528,461
18,077
Proprietary Funds: Water Fund -
2,934,633
Wastewater Fund -
4,421,040 Non-major Governmental Funds -
3,295,861
TOTAL $ 10,669,611
$ 10,669,611
The amounts payable to the general fund relate to amounts drawn by other funds in excess of their respective shares of pooled cash while awaiting reimbursements from outside entities. The amounts payable to the Capital Projects Fund relate to amounts drawn by the Water and Wastewater Fund for KDHE Loan draws and temporary notes.
I. Interfund Transfers
A summary of 2012 interfund transfers is as follows:
Transfer In
Transfer Out
Major Funds: Governmental Funds:
General $ 4,704,514
$ 485,281 Riley County Police Department -
-
Debt Service 1,953,258
- Capital Projects 2,290,852
194,824
Proprietary Funds: Water -
1,503,605
Wastewater Fund 14,416
1,214,661 Non-major Governmental Funds 4,970,881
10,592,550
Non-major Proprietary Funds 57,000
- TOTAL TRANSFERS $ 13,990,921
$ 13,990,921
Transfers are used primarily to move revenues from the funds with collection authorization to finance the expenditures of other funds in need of additional revenue sources. On the government-wide statement of activities, capital asset transfers of $826,014 were made from
the governmental activities to the business-type activities.
Page 83
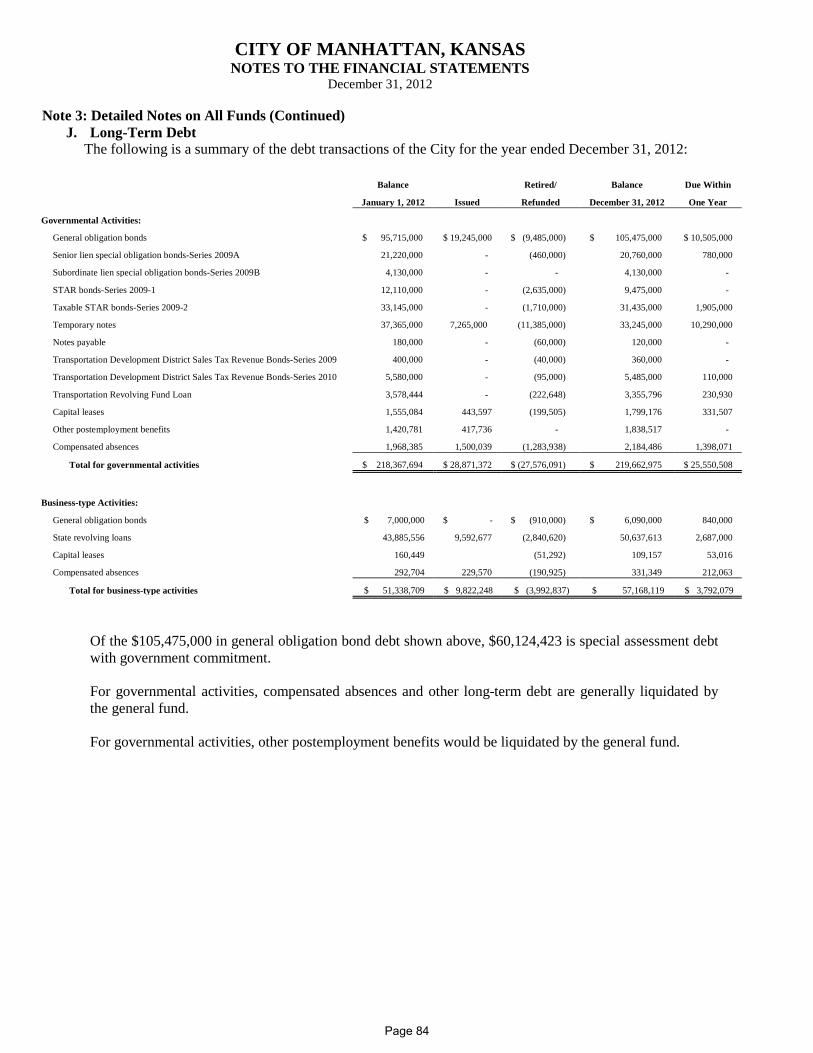
CITY OF MANHATTAN, KANSAS NOTES TO THE FINANCIAL STATEMENTS
December 31, 2012
Note 3: Detailed Notes on All Funds (Continued) J. Long-Term Debt
The following is a summary of the debt transactions of the City for the year ended December 31, 2012:
Balance
Retired/ Balance Due Within
January 1, 2012 Issued Refunded December 31, 2012 One Year
Governmental Activities:
General obligation bonds $ 95,715,000 $ 19,245,000 $ (9,485,000) $ 105,475,000 $ 10,505,000
Senior lien special obligation bonds-Series 2009A 21,220,000 - (460,000) 20,760,000 780,000
Subordinate lien special obligation bonds-Series 2009B 4,130,000 - - 4,130,000 -
STAR bonds-Series 2009-1 12,110,000 - (2,635,000) 9,475,000 -
Taxable STAR bonds-Series 2009-2 33,145,000 - (1,710,000) 31,435,000 1,905,000
Temporary notes 37,365,000 7,265,000 (11,385,000) 33,245,000 10,290,000
Notes payable 180,000 - (60,000) 120,000 -
Transportation Development District Sales Tax Revenue Bonds-Series 2009 400,000 - (40,000) 360,000 -
Transportation Development District Sales Tax Revenue Bonds-Series 2010 5,580,000 - (95,000) 5,485,000 110,000
Transportation Revolving Fund Loan 3,578,444 - (222,648) 3,355,796 230,930
Capital leases 1,555,084 443,597 (199,505) 1,799,176 331,507
Other postemployment benefits 1,420,781 417,736 - 1,838,517 -
Compensated absences 1,968,385 1,500,039 (1,283,938) 2,184,486 1,398,071
Total for governmental activities $ 218,367,694 $ 28,871,372 $ (27,576,091) $ 219,662,975 $ 25,550,508
Business-type Activities:
General obligation bonds $ 7,000,000 $ - $ (910,000) $ 6,090,000 840,000
State revolving loans 43,885,556 9,592,677 (2,840,620) 50,637,613 2,687,000
Capital leases 160,449
(51,292) 109,157 53,016
Compensated absences 292,704 229,570 (190,925) 331,349 212,063
Total for business-type activities $ 51,338,709 $ 9,822,248 $ (3,992,837) $ 57,168,119 $ 3,792,079
Of the $105,475,000 in general obligation bond debt shown above, $60,124,423 is special assessment debt with government commitment. For governmental activities, compensated absences and other long-term debt are generally liquidated by the general fund.
For governmental activities, other postemployment benefits would be liquidated by the general fund.
Page 84
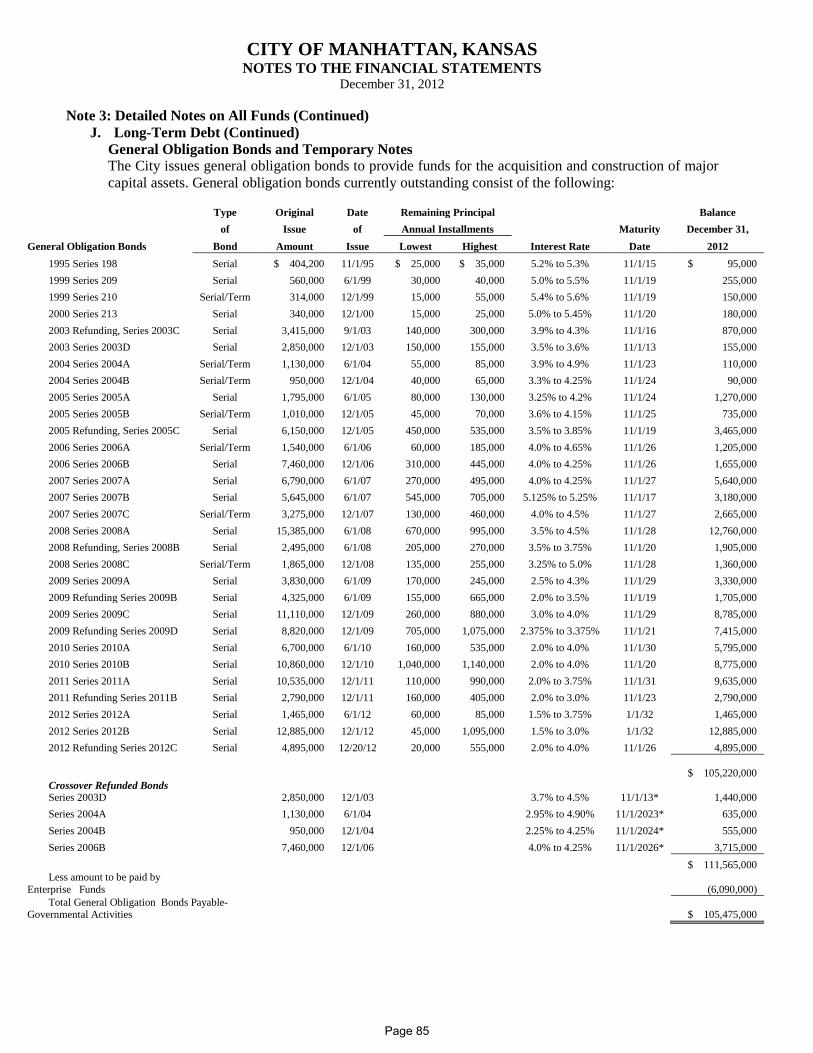
CITY OF MANHATTAN, KANSAS NOTES TO THE FINANCIAL STATEMENTS
December 31, 2012
Note 3: Detailed Notes on All Funds (Continued) J. Long-Term Debt (Continued)
General Obligation Bonds and Temporary Notes The City issues general obligation bonds to provide funds for the acquisition and construction of major capital assets. General obligation bonds currently outstanding consist of the following:
Type Original Date Remaining Principal
Balance
of Issue of Annual Installments
Maturity December 31,
General Obligation Bonds Bond Amount Issue Lowest Highest Interest Rate Date 2012 1995 Series 198 Serial $ 404,200 11/1/95 $ 25,000 $ 35,000 5.2% to 5.3% 11/1/15 $ 95,000 1999 Series 209 Serial 560,000 6/1/99 30,000 40,000 5.0% to 5.5% 11/1/19 255,000 1999 Series 210 Serial/Term 314,000 12/1/99 15,000 55,000 5.4% to 5.6% 11/1/19 150,000 2000 Series 213 Serial 340,000 12/1/00 15,000 25,000 5.0% to 5.45% 11/1/20 180,000 2003 Refunding, Series 2003C Serial 3,415,000 9/1/03 140,000 300,000 3.9% to 4.3% 11/1/16 870,000 2003 Series 2003D Serial 2,850,000 12/1/03 150,000 155,000 3.5% to 3.6% 11/1/13 155,000 2004 Series 2004A Serial/Term 1,130,000 6/1/04 55,000 85,000 3.9% to 4.9% 11/1/23 110,000 2004 Series 2004B Serial/Term 950,000 12/1/04 40,000 65,000 3.3% to 4.25% 11/1/24 90,000 2005 Series 2005A Serial 1,795,000 6/1/05 80,000 130,000 3.25% to 4.2% 11/1/24 1,270,000 2005 Series 2005B Serial/Term 1,010,000 12/1/05 45,000 70,000 3.6% to 4.15% 11/1/25 735,000 2005 Refunding, Series 2005C Serial 6,150,000 12/1/05 450,000 535,000 3.5% to 3.85% 11/1/19 3,465,000 2006 Series 2006A Serial/Term 1,540,000 6/1/06 60,000 185,000 4.0% to 4.65% 11/1/26 1,205,000 2006 Series 2006B Serial 7,460,000 12/1/06 310,000 445,000 4.0% to 4.25% 11/1/26 1,655,000 2007 Series 2007A Serial 6,790,000 6/1/07 270,000 495,000 4.0% to 4.25% 11/1/27 5,640,000 2007 Series 2007B Serial 5,645,000 6/1/07 545,000 705,000 5.125% to 5.25% 11/1/17 3,180,000 2007 Series 2007C Serial/Term 3,275,000 12/1/07 130,000 460,000 4.0% to 4.5% 11/1/27 2,665,000 2008 Series 2008A Serial 15,385,000 6/1/08 670,000 995,000 3.5% to 4.5% 11/1/28 12,760,000 2008 Refunding, Series 2008B Serial 2,495,000 6/1/08 205,000 270,000 3.5% to 3.75% 11/1/20 1,905,000 2008 Series 2008C Serial/Term 1,865,000 12/1/08 135,000 255,000 3.25% to 5.0% 11/1/28 1,360,000 2009 Series 2009A Serial 3,830,000 6/1/09 170,000 245,000 2.5% to 4.3% 11/1/29 3,330,000 2009 Refunding Series 2009B Serial 4,325,000 6/1/09 155,000 665,000 2.0% to 3.5% 11/1/19 1,705,000 2009 Series 2009C Serial 11,110,000 12/1/09 260,000 880,000 3.0% to 4.0% 11/1/29 8,785,000 2009 Refunding Series 2009D Serial 8,820,000 12/1/09 705,000 1,075,000 2.375% to 3.375% 11/1/21 7,415,000 2010 Series 2010A Serial 6,700,000 6/1/10 160,000 535,000 2.0% to 4.0% 11/1/30 5,795,000 2010 Series 2010B Serial 10,860,000 12/1/10 1,040,000 1,140,000 2.0% to 4.0% 11/1/20 8,775,000 2011 Series 2011A Serial 10,535,000 12/1/11 110,000 990,000 2.0% to 3.75% 11/1/31 9,635,000 2011 Refunding Series 2011B Serial 2,790,000 12/1/11 160,000 405,000 2.0% to 3.0% 11/1/23 2,790,000 2012 Series 2012A Serial 1,465,000 6/1/12 60,000 85,000 1.5% to 3.75% 1/1/32 1,465,000 2012 Series 2012B Serial 12,885,000 12/1/12 45,000 1,095,000 1.5% to 3.0% 1/1/32 12,885,000 2012 Refunding Series 2012C Serial 4,895,000 12/20/12 20,000 555,000 2.0% to 4.0% 11/1/26 4,895,000
$ 105,220,000
Crossover Refunded Bonds Series 2003D
2,850,000 12/1/03
3.7% to 4.5% 11/1/13* 1,440,000
Series 2004A
1,130,000 6/1/04
2.95% to 4.90% 11/1/2023* 635,000 Series 2004B
950,000 12/1/04
2.25% to 4.25% 11/1/2024* 555,000
Series 2006B
7,460,000 12/1/06
4.0% to 4.25% 11/1/2026* 3,715,000
$ 111,565,000
Less amount to be paid by Enterprise Funds
(6,090,000)
Total General Obligation Bonds Payable-Governmental Activities
$ 105,475,000
Page 85
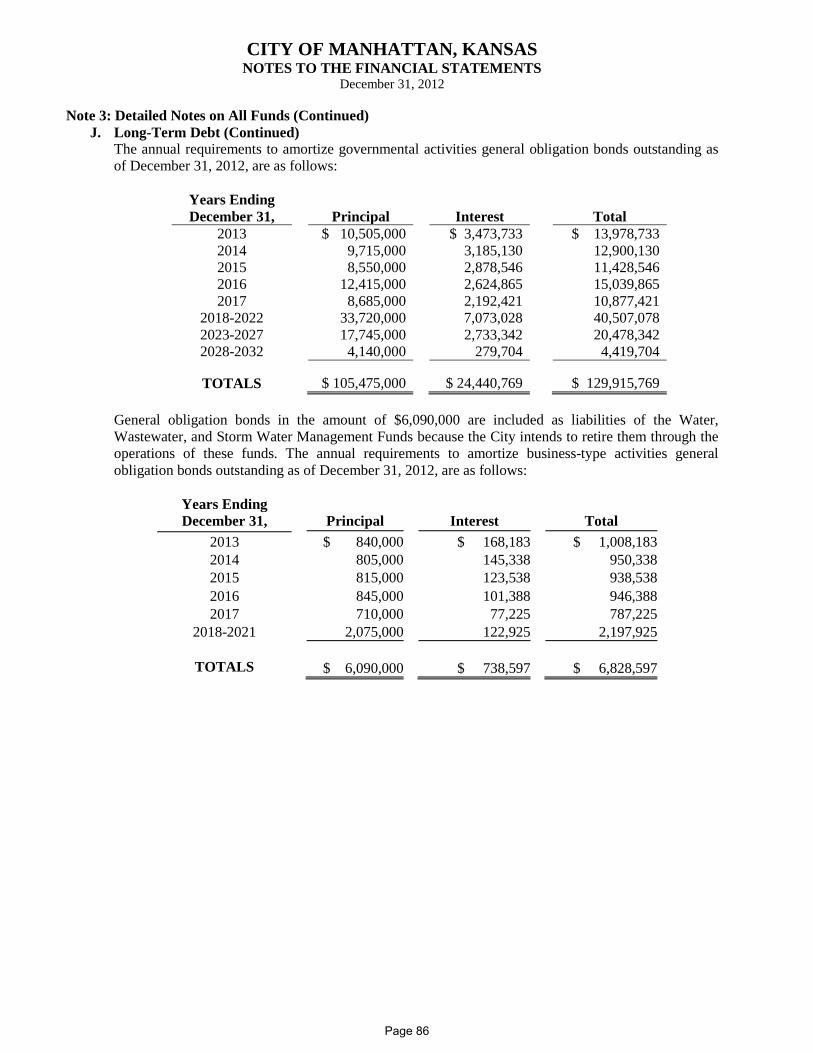
CITY OF MANHATTAN, KANSAS NOTES TO THE FINANCIAL STATEMENTS
December 31, 2012
Note 3: Detailed Notes on All Funds (Continued) J. Long-Term Debt (Continued)
The annual requirements to amortize governmental activities general obligation bonds outstanding as of December 31, 2012, are as follows:
Years Ending December 31,
Principal
Interest
Total 2013
$ 10,505,000
$ 3,473,733
$ 13,978,733
2014
9,715,000
3,185,130
12,900,130 2015
8,550,000
2,878,546
11,428,546
2016
12,415,000
2,624,865
15,039,865 2017
8,685,000
2,192,421
10,877,421
2018-2022
33,720,000
7,073,028
40,507,078 2023-2027
17,745,000
2,733,342
20,478,342
2028-2032
4,140,000
279,704
4,419,704
TOTALS
$ 105,475,000
$ 24,440,769
$ 129,915,769 General obligation bonds in the amount of $6,090,000 are included as liabilities of the Water, Wastewater, and Storm Water Management Funds because the City intends to retire them through the operations of these funds. The annual requirements to amortize business-type activities general obligation bonds outstanding as of December 31, 2012, are as follows:
Years Ending December 31, Principal Interest Total
2013 $ 840,000 $ 168,183 $ 1,008,183 2014 805,000 145,338 950,338 2015 815,000 123,538 938,538 2016 845,000 101,388 946,388 2017 710,000 77,225 787,225
2018-2021 2,075,000 122,925 2,197,925
TOTALS $ 6,090,000 $ 738,597 $ 6,828,597
Page 86
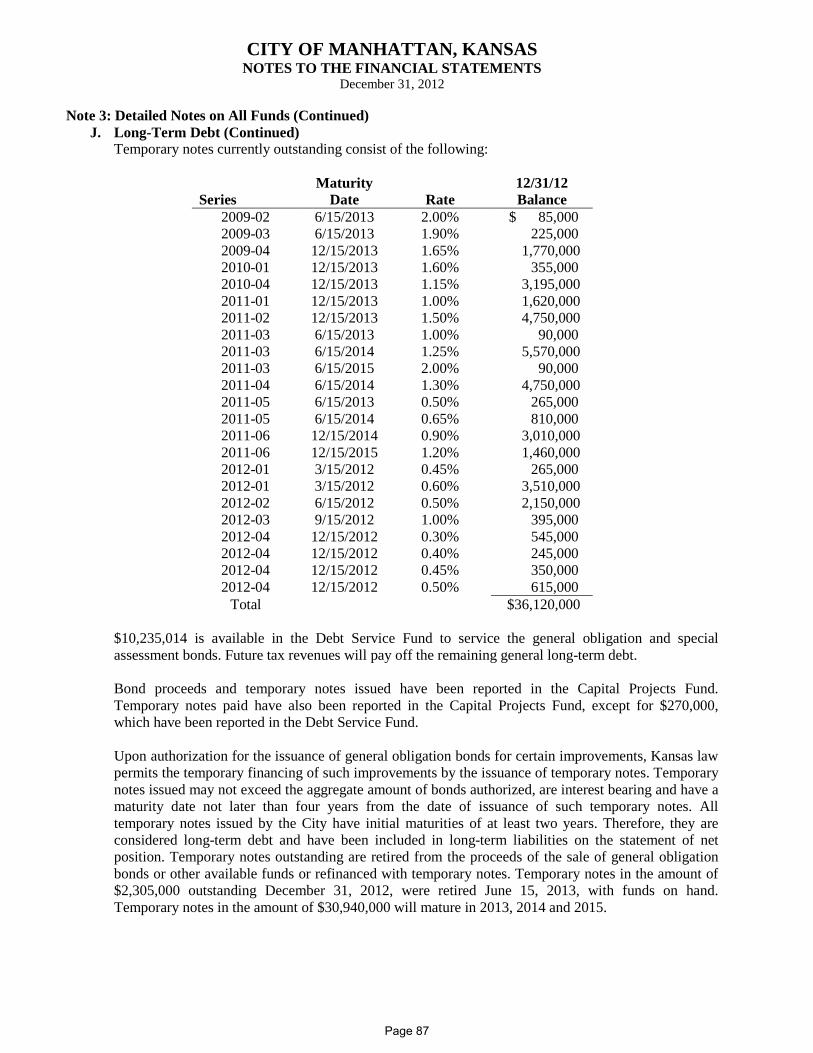
CITY OF MANHATTAN, KANSAS NOTES TO THE FINANCIAL STATEMENTS
December 31, 2012
Note 3: Detailed Notes on All Funds (Continued) J. Long-Term Debt (Continued)
Temporary notes currently outstanding consist of the following:
Series
Maturity Date
Rate
12/31/12 Balance
2009-02 6/15/2013 2.00% $ 85,000 2009-03 6/15/2013 1.90% 225,000 2009-04 12/15/2013 1.65% 1,770,000 2010-01 12/15/2013 1.60% 355,000 2010-04 12/15/2013 1.15% 3,195,000 2011-01 12/15/2013 1.00% 1,620,000 2011-02 12/15/2013 1.50% 4,750,000 2011-03 6/15/2013 1.00% 90,000 2011-03 6/15/2014 1.25% 5,570,000 2011-03 6/15/2015 2.00% 90,000 2011-04 6/15/2014 1.30% 4,750,000 2011-05 6/15/2013 0.50% 265,000 2011-05 6/15/2014 0.65% 810,000 2011-06 12/15/2014 0.90% 3,010,000 2011-06 12/15/2015 1.20% 1,460,000 2012-01 3/15/2012 0.45% 265,000 2012-01 3/15/2012 0.60% 3,510,000 2012-02 6/15/2012 0.50% 2,150,000 2012-03 9/15/2012 1.00% 395,000 2012-04 12/15/2012 0.30% 545,000 2012-04 12/15/2012 0.40% 245,000 2012-04 12/15/2012 0.45% 350,000 2012-04 12/15/2012 0.50% 615,000
Total $36,120,000 $10,235,014 is available in the Debt Service Fund to service the general obligation and special assessment bonds. Future tax revenues will pay off the remaining general long-term debt.
Bond proceeds and temporary notes issued have been reported in the Capital Projects Fund. Temporary notes paid have also been reported in the Capital Projects Fund, except for $270,000, which have been reported in the Debt Service Fund. Upon authorization for the issuance of general obligation bonds for certain improvements, Kansas law permits the temporary financing of such improvements by the issuance of temporary notes. Temporary notes issued may not exceed the aggregate amount of bonds authorized, are interest bearing and have a maturity date not later than four years from the date of issuance of such temporary notes. All temporary notes issued by the City have initial maturities of at least two years. Therefore, they are considered long-term debt and have been included in long-term liabilities on the statement of net position. Temporary notes outstanding are retired from the proceeds of the sale of general obligation bonds or other available funds or refinanced with temporary notes. Temporary notes in the amount of $2,305,000 outstanding December 31, 2012, were retired June 15, 2013, with funds on hand. Temporary notes in the amount of $30,940,000 will mature in 2013, 2014 and 2015.
Page 87
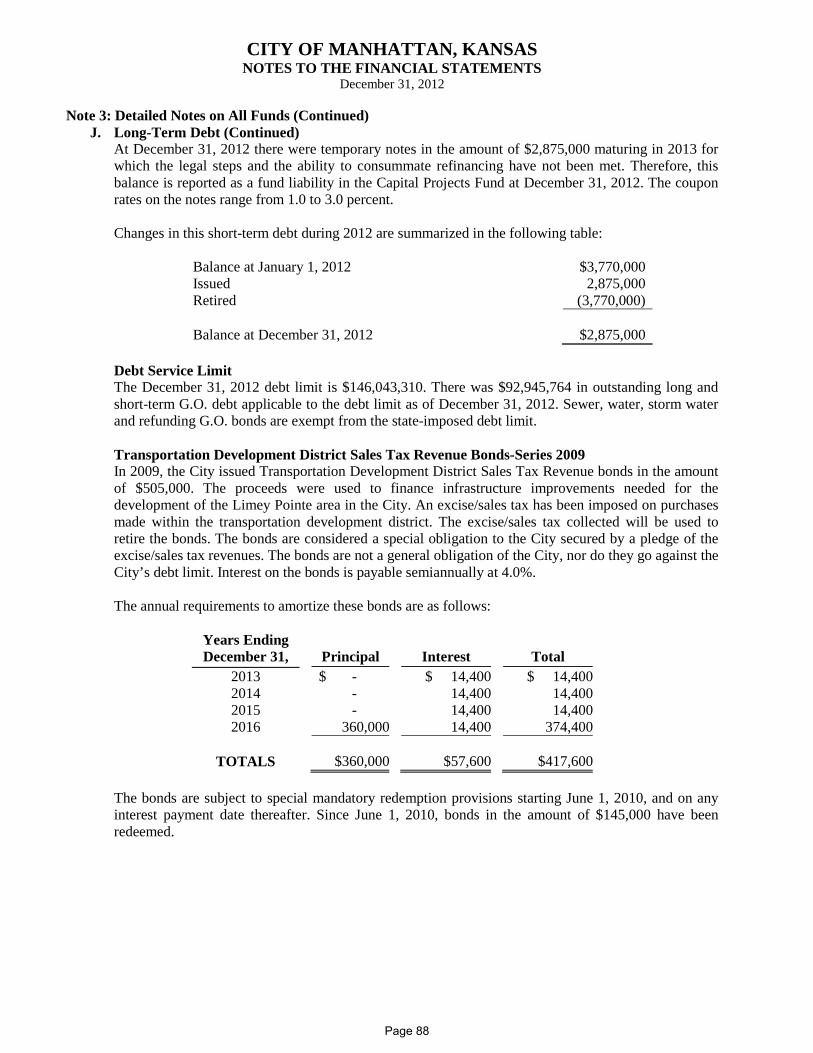
CITY OF MANHATTAN, KANSAS NOTES TO THE FINANCIAL STATEMENTS
December 31, 2012
Note 3: Detailed Notes on All Funds (Continued) J. Long-Term Debt (Continued)
At December 31, 2012 there were temporary notes in the amount of $2,875,000 maturing in 2013 for which the legal steps and the ability to consummate refinancing have not been met. Therefore, this balance is reported as a fund liability in the Capital Projects Fund at December 31, 2012. The coupon rates on the notes range from 1.0 to 3.0 percent. Changes in this short-term debt during 2012 are summarized in the following table:
Balance at January 1, 2012 $3,770,000 Issued 2,875,000 Retired (3,770,000) Balance at December 31, 2012 $2,875,000
Debt Service Limit The December 31, 2012 debt limit is $146,043,310. There was $92,945,764 in outstanding long and short-term G.O. debt applicable to the debt limit as of December 31, 2012. Sewer, water, storm water and refunding G.O. bonds are exempt from the state-imposed debt limit. Transportation Development District Sales Tax Revenue Bonds-Series 2009 In 2009, the City issued Transportation Development District Sales Tax Revenue bonds in the amount of $505,000. The proceeds were used to finance infrastructure improvements needed for the development of the Limey Pointe area in the City. An excise/sales tax has been imposed on purchases made within the transportation development district. The excise/sales tax collected will be used to retire the bonds. The bonds are considered a special obligation to the City secured by a pledge of the excise/sales tax revenues. The bonds are not a general obligation of the City, nor do they go against the City’s debt limit. Interest on the bonds is payable semiannually at 4.0%. The annual requirements to amortize these bonds are as follows:
Years Ending December 31, Principal Interest Total
2013 $ - $ 14,400 $ 14,400 2014 - 14,400 14,400 2015 - 14,400 14,400 2016 360,000 14,400 374,400
TOTALS $360,000 $57,600 $417,600
The bonds are subject to special mandatory redemption provisions starting June 1, 2010, and on any interest payment date thereafter. Since June 1, 2010, bonds in the amount of $145,000 have been redeemed.
Page 88
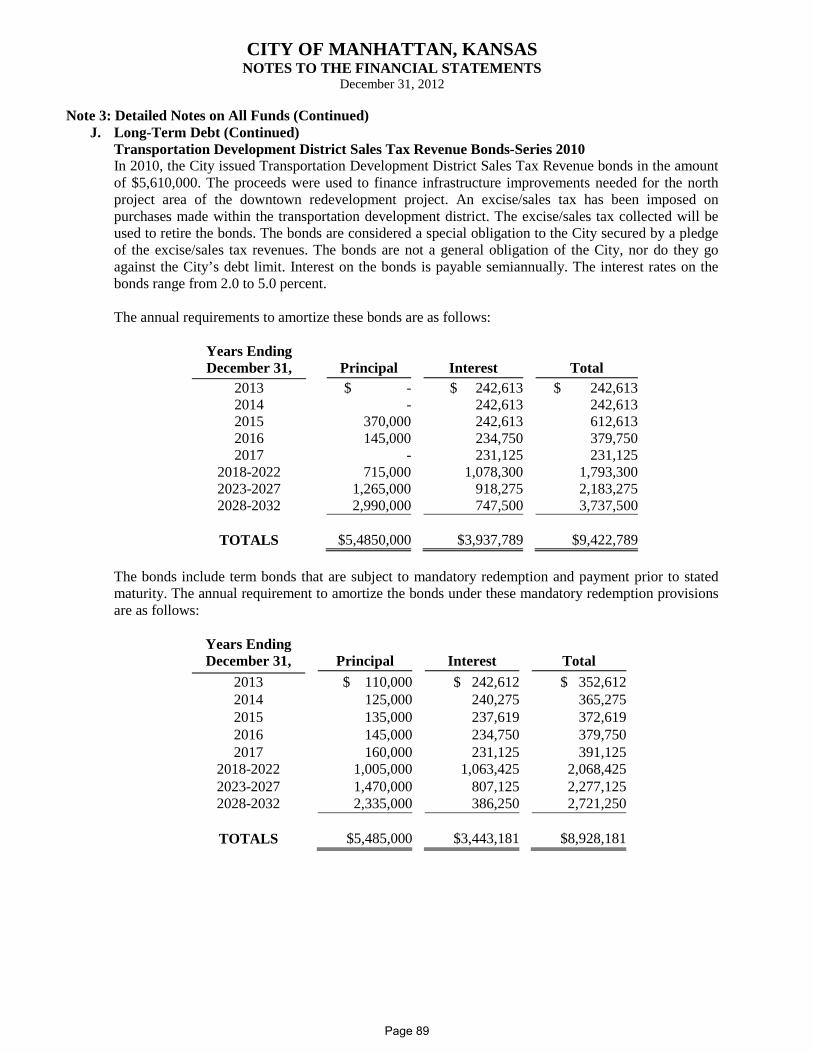
CITY OF MANHATTAN, KANSAS NOTES TO THE FINANCIAL STATEMENTS
December 31, 2012
Note 3: Detailed Notes on All Funds (Continued) J. Long-Term Debt (Continued)
Transportation Development District Sales Tax Revenue Bonds-Series 2010 In 2010, the City issued Transportation Development District Sales Tax Revenue bonds in the amount of $5,610,000. The proceeds were used to finance infrastructure improvements needed for the north project area of the downtown redevelopment project. An excise/sales tax has been imposed on purchases made within the transportation development district. The excise/sales tax collected will be used to retire the bonds. The bonds are considered a special obligation to the City secured by a pledge of the excise/sales tax revenues. The bonds are not a general obligation of the City, nor do they go against the City’s debt limit. Interest on the bonds is payable semiannually. The interest rates on the bonds range from 2.0 to 5.0 percent. The annual requirements to amortize these bonds are as follows:
Years Ending December 31, Principal Interest Total
2013 $ - $ 242,613 $ 242,613 2014 - 242,613 242,613 2015 370,000 242,613 612,613 2016 145,000 234,750 379,750 2017 - 231,125 231,125
2018-2022 715,000 1,078,300 1,793,300 2023-2027 1,265,000 918,275 2,183,275 2028-2032 2,990,000 747,500 3,737,500
TOTALS $5,4850,000 $3,937,789 $9,422,789
The bonds include term bonds that are subject to mandatory redemption and payment prior to stated maturity. The annual requirement to amortize the bonds under these mandatory redemption provisions are as follows:
Years Ending December 31, Principal Interest Total
2013 $ 110,000 $ 242,612 $ 352,612 2014 125,000 240,275 365,275 2015 135,000 237,619 372,619 2016 145,000 234,750 379,750 2017 160,000 231,125 391,125
2018-2022 1,005,000 1,063,425 2,068,425 2023-2027 1,470,000 807,125 2,277,125 2028-2032 2,335,000 386,250 2,721,250
TOTALS $5,485,000 $3,443,181 $8,928,181
Page 89
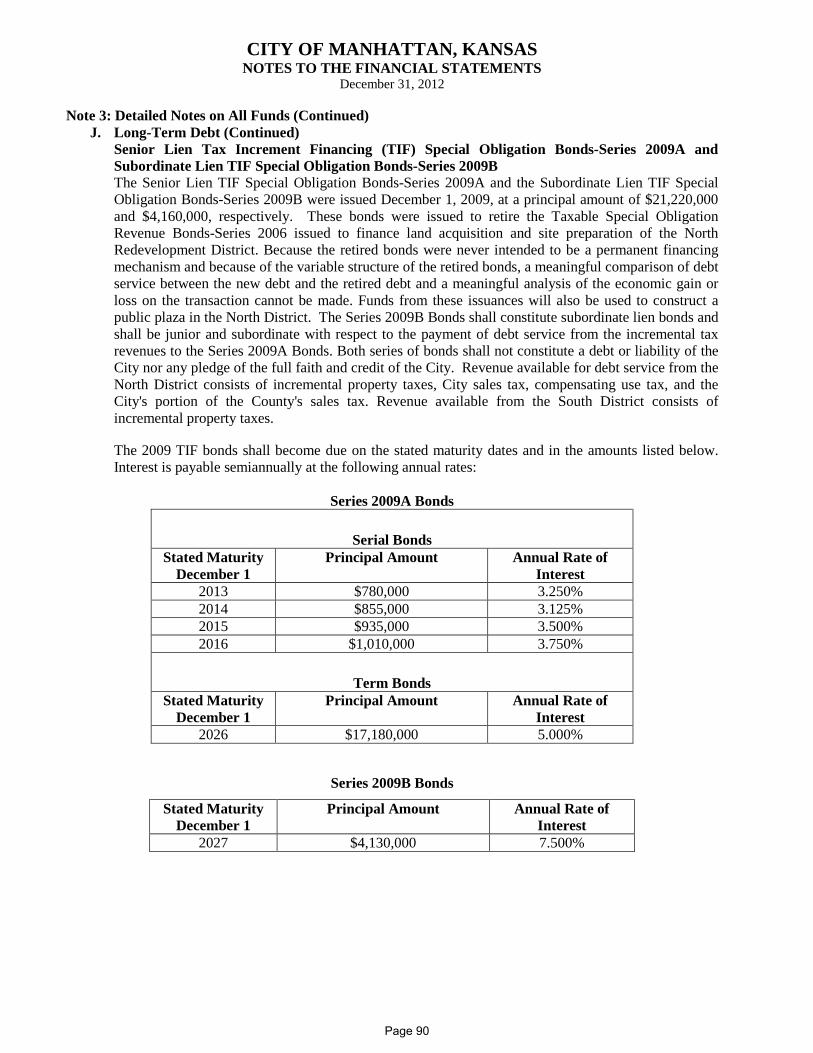
CITY OF MANHATTAN, KANSAS NOTES TO THE FINANCIAL STATEMENTS
December 31, 2012
Note 3: Detailed Notes on All Funds (Continued) J. Long-Term Debt (Continued)
Senior Lien Tax Increment Financing (TIF) Special Obligation Bonds-Series 2009A and Subordinate Lien TIF Special Obligation Bonds-Series 2009B The Senior Lien TIF Special Obligation Bonds-Series 2009A and the Subordinate Lien TIF Special Obligation Bonds-Series 2009B were issued December 1, 2009, at a principal amount of $21,220,000 and $4,160,000, respectively. These bonds were issued to retire the Taxable Special Obligation Revenue Bonds-Series 2006 issued to finance land acquisition and site preparation of the North Redevelopment District. Because the retired bonds were never intended to be a permanent financing mechanism and because of the variable structure of the retired bonds, a meaningful comparison of debt service between the new debt and the retired debt and a meaningful analysis of the economic gain or loss on the transaction cannot be made. Funds from these issuances will also be used to construct a public plaza in the North District. The Series 2009B Bonds shall constitute subordinate lien bonds and shall be junior and subordinate with respect to the payment of debt service from the incremental tax revenues to the Series 2009A Bonds. Both series of bonds shall not constitute a debt or liability of the City nor any pledge of the full faith and credit of the City. Revenue available for debt service from the North District consists of incremental property taxes, City sales tax, compensating use tax, and the City's portion of the County's sales tax. Revenue available from the South District consists of incremental property taxes.
The 2009 TIF bonds shall become due on the stated maturity dates and in the amounts listed below. Interest is payable semiannually at the following annual rates:
Series 2009A Bonds
Serial Bonds
Stated Maturity December 1
Principal Amount Annual Rate of Interest
2013 $780,000 3.250% 2014 $855,000 3.125% 2015 $935,000 3.500% 2016 $1,010,000 3.750%
Term Bonds
Stated Maturity December 1
Principal Amount Annual Rate of Interest
2026 $17,180,000 5.000%
Series 2009B Bonds
Stated Maturity December 1
Principal Amount Annual Rate of Interest
2027 $4,130,000 7.500%
Page 90
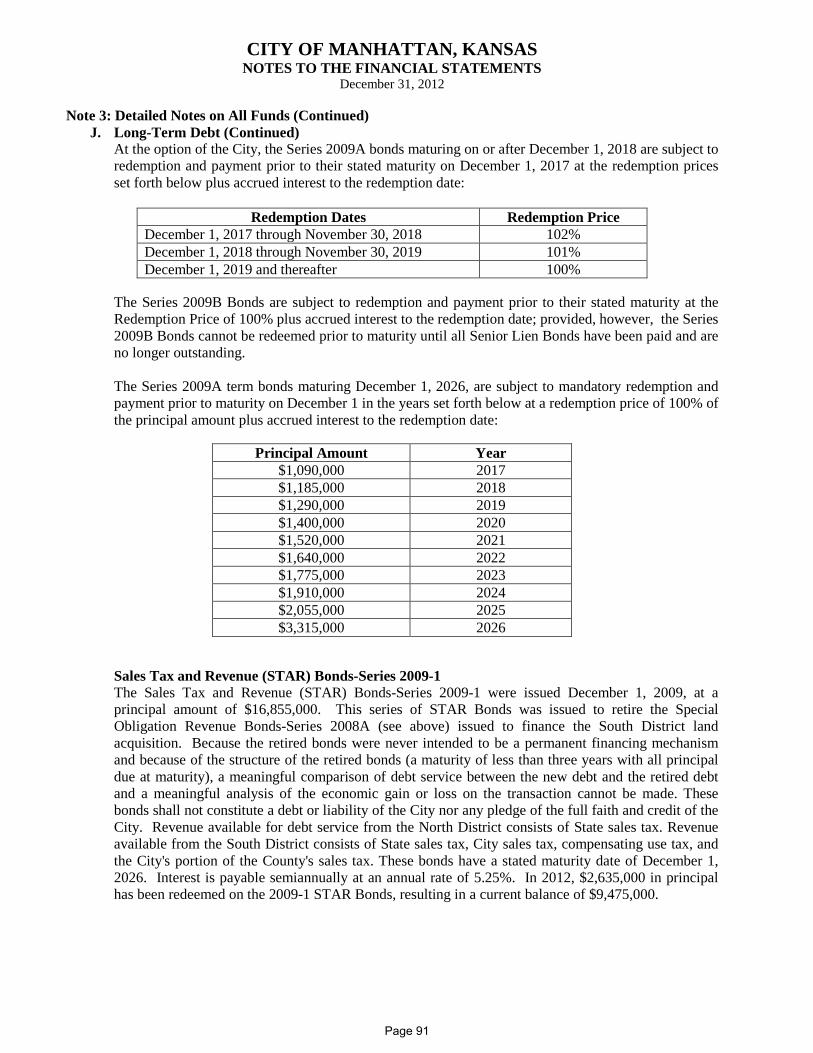
CITY OF MANHATTAN, KANSAS NOTES TO THE FINANCIAL STATEMENTS
December 31, 2012
Note 3: Detailed Notes on All Funds (Continued) J. Long-Term Debt (Continued)
At the option of the City, the Series 2009A bonds maturing on or after December 1, 2018 are subject to redemption and payment prior to their stated maturity on December 1, 2017 at the redemption prices set forth below plus accrued interest to the redemption date:
Redemption Dates Redemption Price
December 1, 2017 through November 30, 2018 102% December 1, 2018 through November 30, 2019 101% December 1, 2019 and thereafter 100%
The Series 2009B Bonds are subject to redemption and payment prior to their stated maturity at the Redemption Price of 100% plus accrued interest to the redemption date; provided, however, the Series 2009B Bonds cannot be redeemed prior to maturity until all Senior Lien Bonds have been paid and are no longer outstanding.
The Series 2009A term bonds maturing December 1, 2026, are subject to mandatory redemption and payment prior to maturity on December 1 in the years set forth below at a redemption price of 100% of the principal amount plus accrued interest to the redemption date:
Principal Amount Year
$1,090,000 2017 $1,185,000 2018 $1,290,000 2019 $1,400,000 2020 $1,520,000 2021 $1,640,000 2022 $1,775,000 2023 $1,910,000 2024 $2,055,000 2025 $3,315,000 2026
Sales Tax and Revenue (STAR) Bonds-Series 2009-1 The Sales Tax and Revenue (STAR) Bonds-Series 2009-1 were issued December 1, 2009, at a principal amount of $16,855,000. This series of STAR Bonds was issued to retire the Special Obligation Revenue Bonds-Series 2008A (see above) issued to finance the South District land acquisition. Because the retired bonds were never intended to be a permanent financing mechanism and because of the structure of the retired bonds (a maturity of less than three years with all principal due at maturity), a meaningful comparison of debt service between the new debt and the retired debt and a meaningful analysis of the economic gain or loss on the transaction cannot be made. These bonds shall not constitute a debt or liability of the City nor any pledge of the full faith and credit of the City. Revenue available for debt service from the North District consists of State sales tax. Revenue available from the South District consists of State sales tax, City sales tax, compensating use tax, and the City's portion of the County's sales tax. These bonds have a stated maturity date of December 1, 2026. Interest is payable semiannually at an annual rate of 5.25%. In 2012, $2,635,000 in principal has been redeemed on the 2009-1 STAR Bonds, resulting in a current balance of $9,475,000.
Page 91
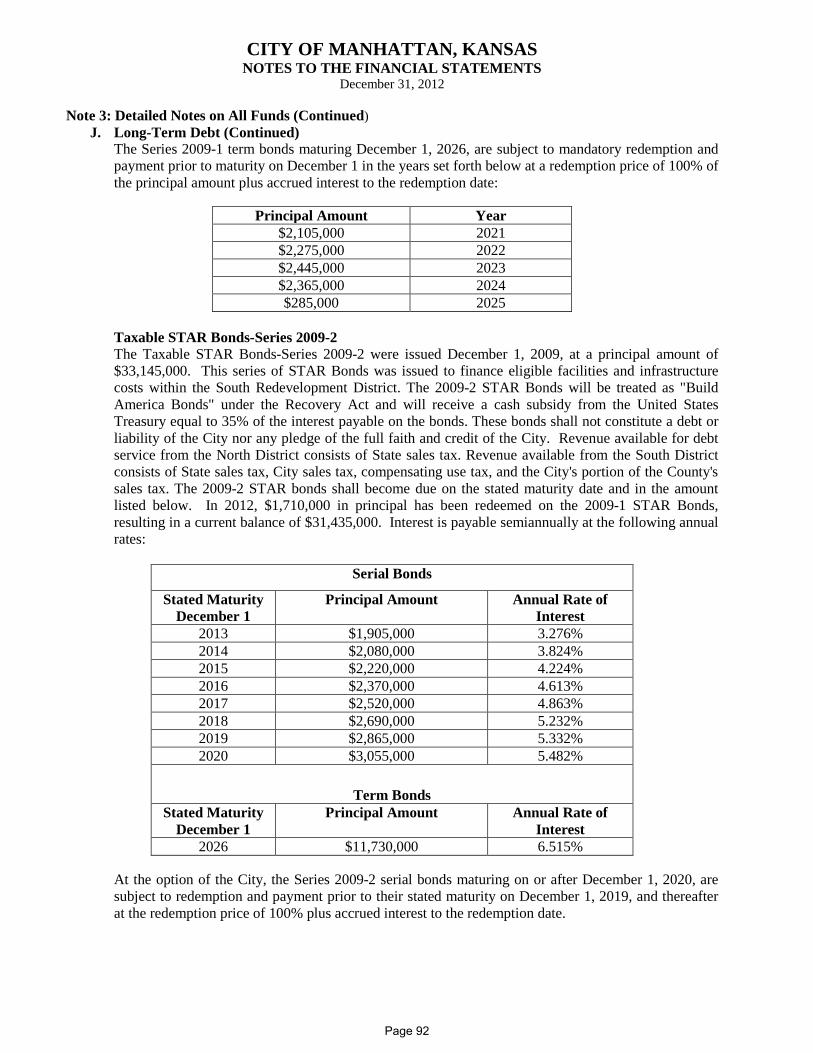
CITY OF MANHATTAN, KANSAS NOTES TO THE FINANCIAL STATEMENTS
December 31, 2012
Note 3: Detailed Notes on All Funds (Continued) J. Long-Term Debt (Continued)
The Series 2009-1 term bonds maturing December 1, 2026, are subject to mandatory redemption and payment prior to maturity on December 1 in the years set forth below at a redemption price of 100% of the principal amount plus accrued interest to the redemption date:
Principal Amount Year
$2,105,000 2021 $2,275,000 2022 $2,445,000 2023 $2,365,000 2024 $285,000 2025
Taxable STAR Bonds-Series 2009-2 The Taxable STAR Bonds-Series 2009-2 were issued December 1, 2009, at a principal amount of $33,145,000. This series of STAR Bonds was issued to finance eligible facilities and infrastructure costs within the South Redevelopment District. The 2009-2 STAR Bonds will be treated as "Build America Bonds" under the Recovery Act and will receive a cash subsidy from the United States Treasury equal to 35% of the interest payable on the bonds. These bonds shall not constitute a debt or liability of the City nor any pledge of the full faith and credit of the City. Revenue available for debt service from the North District consists of State sales tax. Revenue available from the South District consists of State sales tax, City sales tax, compensating use tax, and the City's portion of the County's sales tax. The 2009-2 STAR bonds shall become due on the stated maturity date and in the amount listed below. In 2012, $1,710,000 in principal has been redeemed on the 2009-1 STAR Bonds, resulting in a current balance of $31,435,000. Interest is payable semiannually at the following annual rates:
Serial Bonds
Stated Maturity December 1
Principal Amount Annual Rate of Interest
2013 $1,905,000 3.276% 2014 $2,080,000 3.824% 2015 $2,220,000 4.224% 2016 $2,370,000 4.613% 2017 $2,520,000 4.863% 2018 $2,690,000 5.232% 2019 $2,865,000 5.332% 2020 $3,055,000 5.482%
Term Bonds
Stated Maturity December 1
Principal Amount Annual Rate of Interest
2026 $11,730,000 6.515%
At the option of the City, the Series 2009-2 serial bonds maturing on or after December 1, 2020, are subject to redemption and payment prior to their stated maturity on December 1, 2019, and thereafter at the redemption price of 100% plus accrued interest to the redemption date.
Page 92
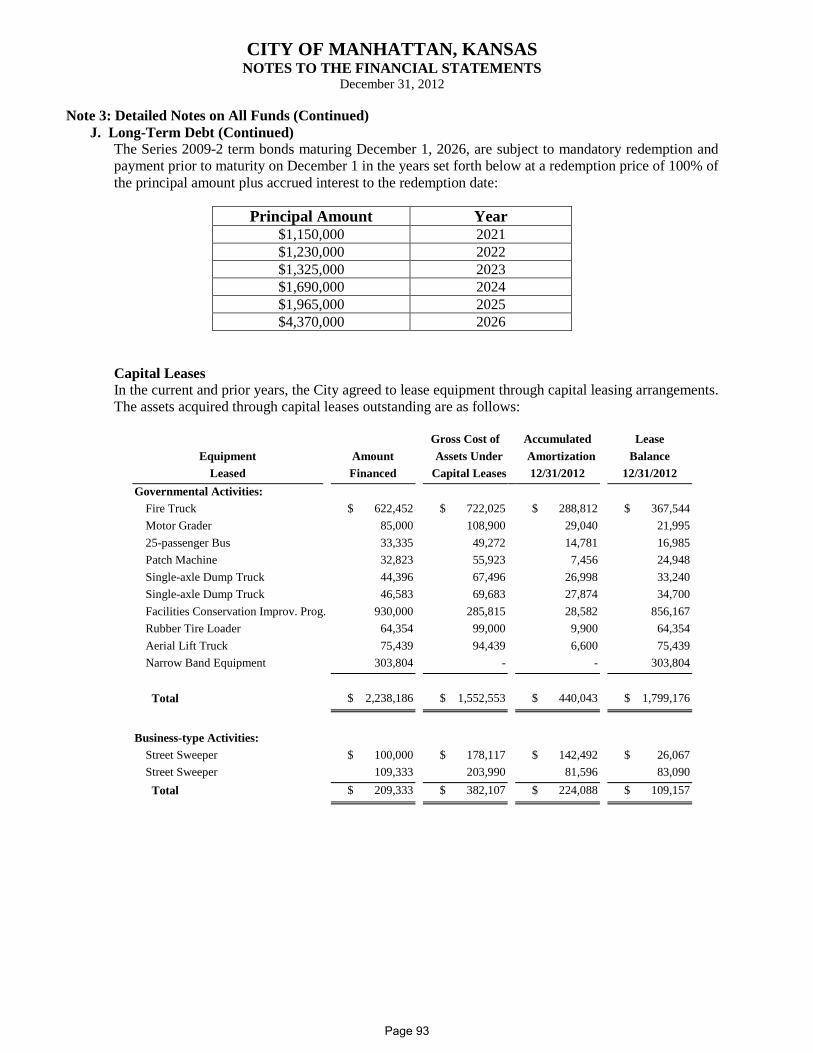
CITY OF MANHATTAN, KANSAS NOTES TO THE FINANCIAL STATEMENTS
December 31, 2012
Note 3: Detailed Notes on All Funds (Continued) J. Long-Term Debt (Continued)
The Series 2009-2 term bonds maturing December 1, 2026, are subject to mandatory redemption and payment prior to maturity on December 1 in the years set forth below at a redemption price of 100% of the principal amount plus accrued interest to the redemption date:
Principal Amount Year
$1,150,000 2021 $1,230,000 2022 $1,325,000 2023 $1,690,000 2024 $1,965,000 2025 $4,370,000 2026
Capital Leases In the current and prior years, the City agreed to lease equipment through capital leasing arrangements. The assets acquired through capital leases outstanding are as follows:
Gross Cost of Accumulated Lease Equipment Amount Assets Under Amortization Balance
Leased Financed Capital Leases 12/31/2012 12/31/2012 Governmental Activities:
Fire Truck $ 622,452 $ 722,025 $ 288,812 $ 367,544 Motor Grader 85,000 108,900 29,040 21,995 25-passenger Bus 33,335 49,272 14,781 16,985 Patch Machine 32,823 55,923 7,456 24,948 Single-axle Dump Truck 44,396 67,496 26,998 33,240 Single-axle Dump Truck 46,583 69,683 27,874 34,700 Facilities Conservation Improv. Prog. 930,000 285,815 28,582 856,167 Rubber Tire Loader 64,354 99,000 9,900 64,354 Aerial Lift Truck 75,439 94,439 6,600 75,439 Narrow Band Equipment 303,804 - - 303,804 Total $ 2,238,186 $ 1,552,553 $ 440,043 $ 1,799,176
Business-type Activities:
Street Sweeper $ 100,000 $ 178,117 $ 142,492 $ 26,067 Street Sweeper 109,333 203,990 81,596 83,090 Total $ 209,333 $ 382,107 $ 224,088 $ 109,157
Page 93
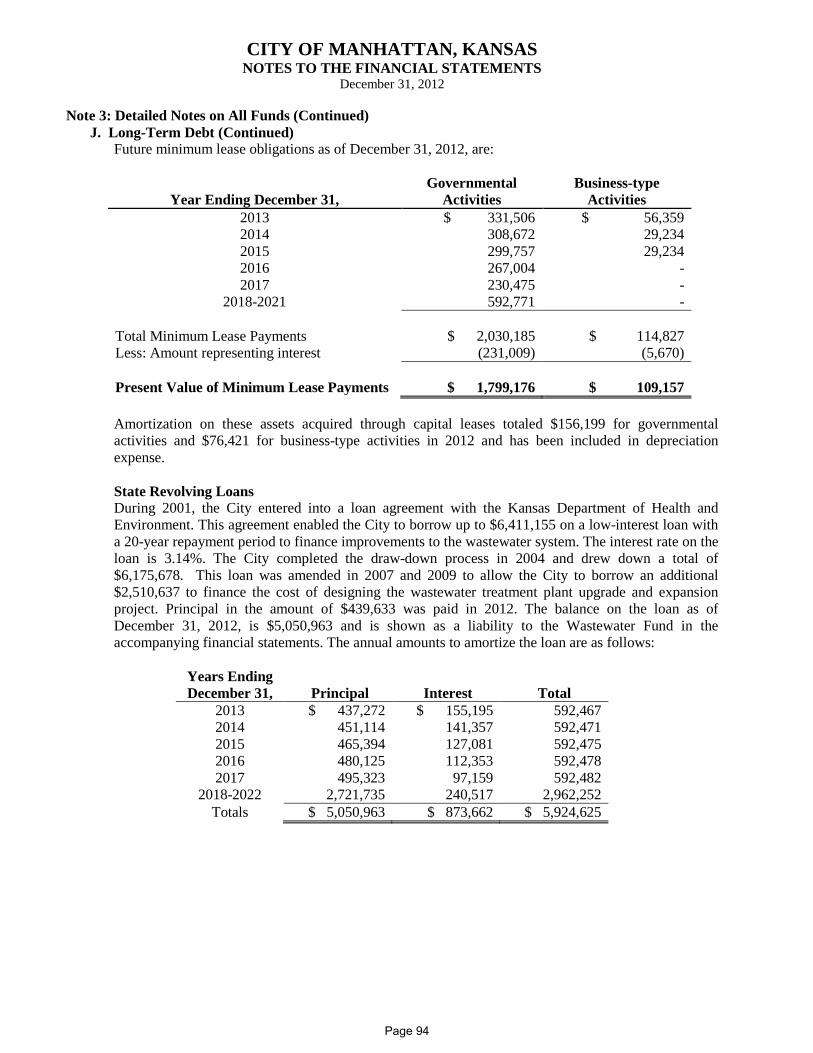
CITY OF MANHATTAN, KANSAS NOTES TO THE FINANCIAL STATEMENTS
December 31, 2012
Note 3: Detailed Notes on All Funds (Continued) J. Long-Term Debt (Continued)
Future minimum lease obligations as of December 31, 2012, are:
Year Ending December 31,
Governmental Activities
Business-type Activities
2013 $ 331,506 $ 56,359 2014 308,672 29,234 2015 299,757 29,234 2016 267,004 - 2017 230,475 -
2018-2021 592,771 - Total Minimum Lease Payments $ 2,030,185 $ 114,827 Less: Amount representing interest (231,009) (5,670) Present Value of Minimum Lease Payments $ 1,799,176 $ 109,157
Amortization on these assets acquired through capital leases totaled $156,199 for governmental activities and $76,421 for business-type activities in 2012 and has been included in depreciation expense. State Revolving Loans During 2001, the City entered into a loan agreement with the Kansas Department of Health and Environment. This agreement enabled the City to borrow up to $6,411,155 on a low-interest loan with a 20-year repayment period to finance improvements to the wastewater system. The interest rate on the loan is 3.14%. The City completed the draw-down process in 2004 and drew down a total of $6,175,678. This loan was amended in 2007 and 2009 to allow the City to borrow an additional $2,510,637 to finance the cost of designing the wastewater treatment plant upgrade and expansion project. Principal in the amount of $439,633 was paid in 2012. The balance on the loan as of December 31, 2012, is $5,050,963 and is shown as a liability to the Wastewater Fund in the accompanying financial statements. The annual amounts to amortize the loan are as follows:
Years Ending December 31, Principal Interest Total
2013 $ 437,272 $ 155,195 592,467 2014 451,114 141,357 592,471 2015 465,394 127,081 592,475 2016 480,125 112,353 592,478 2017 495,323 97,159 592,482
2018-2022 2,721,735 240,517 2,962,252 Totals $ 5,050,963 $ 873,662 $ 5,924,625
Page 94
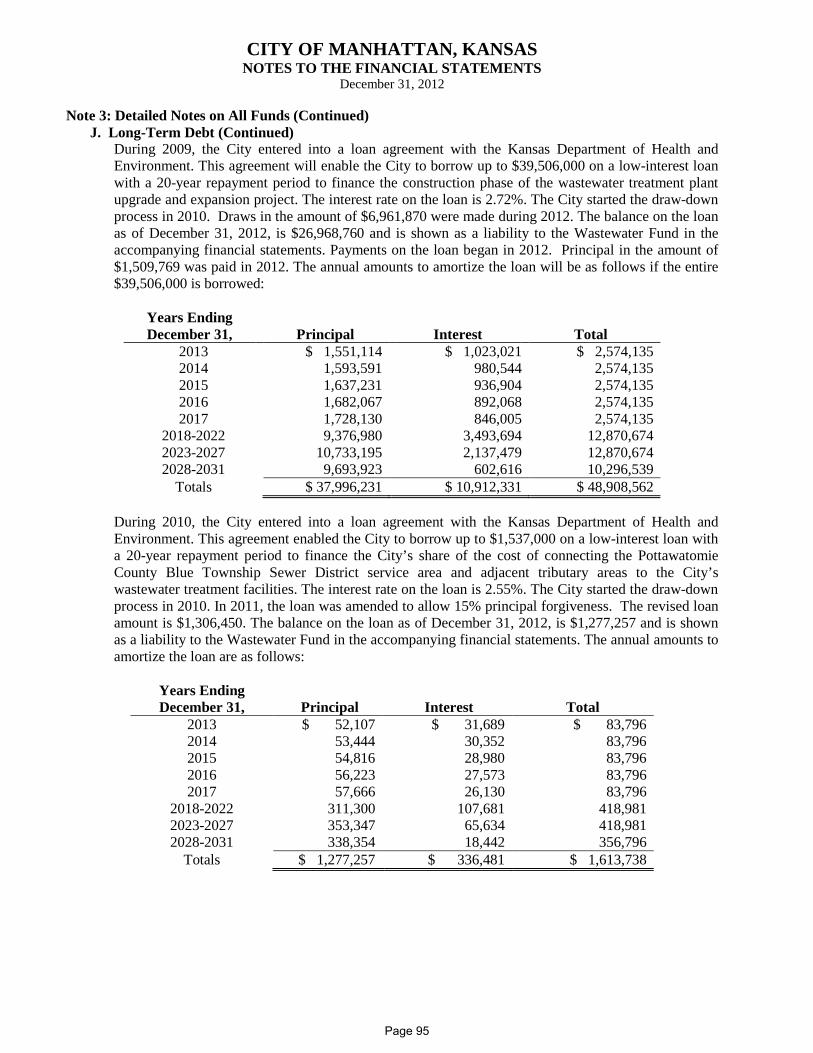
CITY OF MANHATTAN, KANSAS NOTES TO THE FINANCIAL STATEMENTS
December 31, 2012
Note 3: Detailed Notes on All Funds (Continued) J. Long-Term Debt (Continued)
During 2009, the City entered into a loan agreement with the Kansas Department of Health and Environment. This agreement will enable the City to borrow up to $39,506,000 on a low-interest loan with a 20-year repayment period to finance the construction phase of the wastewater treatment plant upgrade and expansion project. The interest rate on the loan is 2.72%. The City started the draw-down process in 2010. Draws in the amount of $6,961,870 were made during 2012. The balance on the loan as of December 31, 2012, is $26,968,760 and is shown as a liability to the Wastewater Fund in the accompanying financial statements. Payments on the loan began in 2012. Principal in the amount of $1,509,769 was paid in 2012. The annual amounts to amortize the loan will be as follows if the entire $39,506,000 is borrowed:
Years Ending December 31, Principal Interest Total
2013 $ 1,551,114 $ 1,023,021 $ 2,574,135 2014 1,593,591 980,544 2,574,135 2015 1,637,231 936,904 2,574,135 2016 1,682,067 892,068 2,574,135 2017 1,728,130 846,005 2,574,135
2018-2022 9,376,980 3,493,694 12,870,674 2023-2027 10,733,195 2,137,479 12,870,674 2028-2031 9,693,923 602,616 10,296,539
Totals $ 37,996,231 $ 10,912,331 $ 48,908,562
During 2010, the City entered into a loan agreement with the Kansas Department of Health and Environment. This agreement enabled the City to borrow up to $1,537,000 on a low-interest loan with a 20-year repayment period to finance the City’s share of the cost of connecting the Pottawatomie County Blue Township Sewer District service area and adjacent tributary areas to the City’s wastewater treatment facilities. The interest rate on the loan is 2.55%. The City started the draw-down process in 2010. In 2011, the loan was amended to allow 15% principal forgiveness. The revised loan amount is $1,306,450. The balance on the loan as of December 31, 2012, is $1,277,257 and is shown as a liability to the Wastewater Fund in the accompanying financial statements. The annual amounts to amortize the loan are as follows:
Years Ending December 31, Principal Interest Total
2013 $ 52,107 $ 31,689 $ 83,796 2014 53,444 30,352 83,796 2015 54,816 28,980 83,796 2016 56,223 27,573 83,796 2017 57,666 26,130 83,796
2018-2022 311,300 107,681 418,981 2023-2027 353,347 65,634 418,981 2028-2031 338,354 18,442 356,796
Totals $ 1,277,257 $ 336,481 $ 1,613,738
Page 95
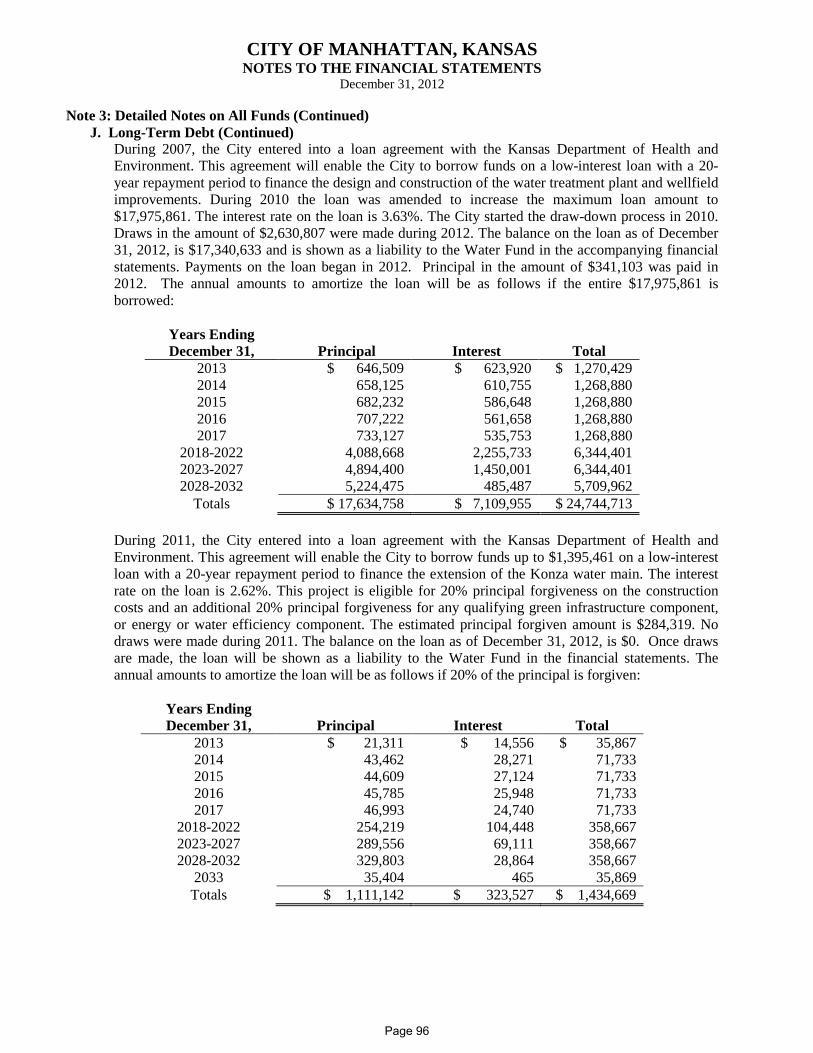
CITY OF MANHATTAN, KANSAS NOTES TO THE FINANCIAL STATEMENTS
December 31, 2012
Note 3: Detailed Notes on All Funds (Continued) J. Long-Term Debt (Continued)
During 2007, the City entered into a loan agreement with the Kansas Department of Health and Environment. This agreement will enable the City to borrow funds on a low-interest loan with a 20-year repayment period to finance the design and construction of the water treatment plant and wellfield improvements. During 2010 the loan was amended to increase the maximum loan amount to $17,975,861. The interest rate on the loan is 3.63%. The City started the draw-down process in 2010. Draws in the amount of $2,630,807 were made during 2012. The balance on the loan as of December 31, 2012, is $17,340,633 and is shown as a liability to the Water Fund in the accompanying financial statements. Payments on the loan began in 2012. Principal in the amount of $341,103 was paid in 2012. The annual amounts to amortize the loan will be as follows if the entire $17,975,861 is borrowed:
Years Ending December 31, Principal Interest Total
2013 $ 646,509 $ 623,920 $ 1,270,429 2014 658,125 610,755 1,268,880 2015 682,232 586,648 1,268,880 2016 707,222 561,658 1,268,880 2017 733,127 535,753 1,268,880
2018-2022 4,088,668 2,255,733 6,344,401 2023-2027 4,894,400 1,450,001 6,344,401 2028-2032 5,224,475 485,487 5,709,962
Totals $ 17,634,758 $ 7,109,955 $ 24,744,713 During 2011, the City entered into a loan agreement with the Kansas Department of Health and Environment. This agreement will enable the City to borrow funds up to $1,395,461 on a low-interest loan with a 20-year repayment period to finance the extension of the Konza water main. The interest rate on the loan is 2.62%. This project is eligible for 20% principal forgiveness on the construction costs and an additional 20% principal forgiveness for any qualifying green infrastructure component, or energy or water efficiency component. The estimated principal forgiven amount is $284,319. No draws were made during 2011. The balance on the loan as of December 31, 2012, is $0. Once draws are made, the loan will be shown as a liability to the Water Fund in the financial statements. The annual amounts to amortize the loan will be as follows if 20% of the principal is forgiven:
Years Ending December 31, Principal Interest Total
2013 $ 21,311 $ 14,556 $ 35,867 2014 43,462 28,271 71,733 2015 44,609 27,124 71,733 2016 45,785 25,948 71,733 2017 46,993 24,740 71,733
2018-2022 254,219 104,448 358,667 2023-2027 289,556 69,111 358,667 2028-2032 329,803 28,864 358,667
2033 35,404 465 35,869 Totals $ 1,111,142 $ 323,527 $ 1,434,669
Page 96
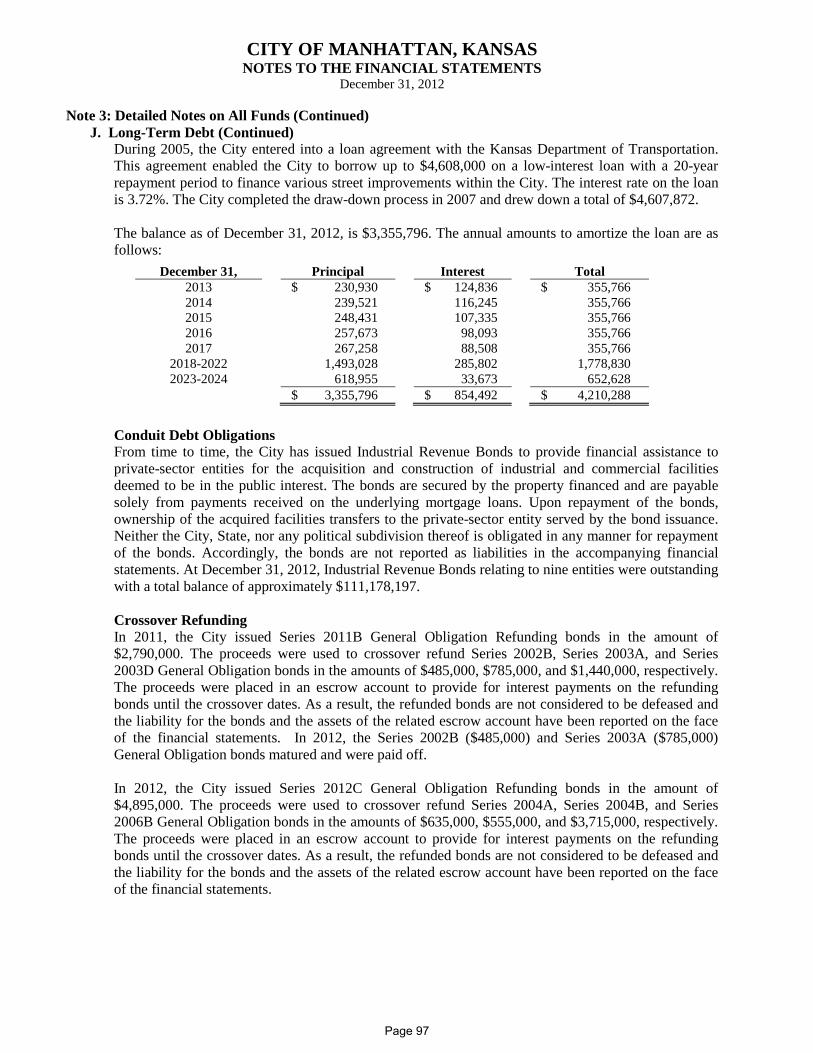
CITY OF MANHATTAN, KANSAS NOTES TO THE FINANCIAL STATEMENTS
December 31, 2012
Note 3: Detailed Notes on All Funds (Continued) J. Long-Term Debt (Continued)
During 2005, the City entered into a loan agreement with the Kansas Department of Transportation. This agreement enabled the City to borrow up to $4,608,000 on a low-interest loan with a 20-year repayment period to finance various street improvements within the City. The interest rate on the loan is 3.72%. The City completed the draw-down process in 2007 and drew down a total of $4,607,872. The balance as of December 31, 2012, is $3,355,796. The annual amounts to amortize the loan are as follows:
Conduit Debt Obligations From time to time, the City has issued Industrial Revenue Bonds to provide financial assistance to private-sector entities for the acquisition and construction of industrial and commercial facilities deemed to be in the public interest. The bonds are secured by the property financed and are payable solely from payments received on the underlying mortgage loans. Upon repayment of the bonds, ownership of the acquired facilities transfers to the private-sector entity served by the bond issuance. Neither the City, State, nor any political subdivision thereof is obligated in any manner for repayment of the bonds. Accordingly, the bonds are not reported as liabilities in the accompanying financial statements. At December 31, 2012, Industrial Revenue Bonds relating to nine entities were outstanding with a total balance of approximately $111,178,197. Crossover Refunding In 2011, the City issued Series 2011B General Obligation Refunding bonds in the amount of $2,790,000. The proceeds were used to crossover refund Series 2002B, Series 2003A, and Series 2003D General Obligation bonds in the amounts of $485,000, $785,000, and $1,440,000, respectively. The proceeds were placed in an escrow account to provide for interest payments on the refunding bonds until the crossover dates. As a result, the refunded bonds are not considered to be defeased and the liability for the bonds and the assets of the related escrow account have been reported on the face of the financial statements. In 2012, the Series 2002B ($485,000) and Series 2003A ($785,000) General Obligation bonds matured and were paid off. In 2012, the City issued Series 2012C General Obligation Refunding bonds in the amount of $4,895,000. The proceeds were used to crossover refund Series 2004A, Series 2004B, and Series 2006B General Obligation bonds in the amounts of $635,000, $555,000, and $3,715,000, respectively. The proceeds were placed in an escrow account to provide for interest payments on the refunding bonds until the crossover dates. As a result, the refunded bonds are not considered to be defeased and the liability for the bonds and the assets of the related escrow account have been reported on the face of the financial statements.
December 31,
Principal
Interest
Total 2013
$ 230,930
$ 124,836
$ 355,766
2014
239,521
116,245
355,766 2015
248,431
107,335
355,766
2016
257,673
98,093
355,766 2017
267,258
88,508
355,766
2018-2022
1,493,028
285,802
1,778,830 2023-2024
618,955
33,673
652,628
$ 3,355,796
$ 854,492
$ 4,210,288
Page 97
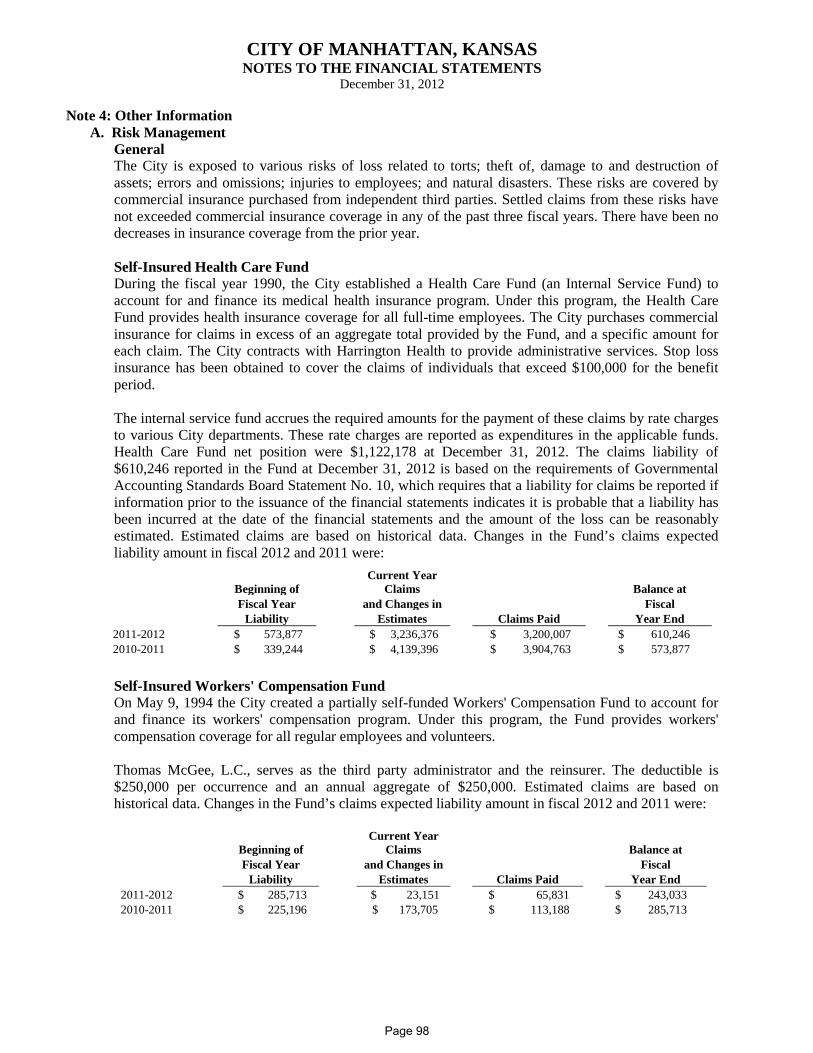
CITY OF MANHATTAN, KANSAS NOTES TO THE FINANCIAL STATEMENTS
December 31, 2012
Note 4: Other Information A. Risk Management
General The City is exposed to various risks of loss related to torts; theft of, damage to and destruction of assets; errors and omissions; injuries to employees; and natural disasters. These risks are covered by commercial insurance purchased from independent third parties. Settled claims from these risks have not exceeded commercial insurance coverage in any of the past three fiscal years. There have been no decreases in insurance coverage from the prior year. Self-Insured Health Care Fund During the fiscal year 1990, the City established a Health Care Fund (an Internal Service Fund) to account for and finance its medical health insurance program. Under this program, the Health Care Fund provides health insurance coverage for all full-time employees. The City purchases commercial insurance for claims in excess of an aggregate total provided by the Fund, and a specific amount for each claim. The City contracts with Harrington Health to provide administrative services. Stop loss insurance has been obtained to cover the claims of individuals that exceed $100,000 for the benefit period.
The internal service fund accrues the required amounts for the payment of these claims by rate charges to various City departments. These rate charges are reported as expenditures in the applicable funds. Health Care Fund net position were $1,122,178 at December 31, 2012. The claims liability of $610,246 reported in the Fund at December 31, 2012 is based on the requirements of Governmental Accounting Standards Board Statement No. 10, which requires that a liability for claims be reported if information prior to the issuance of the financial statements indicates it is probable that a liability has been incurred at the date of the financial statements and the amount of the loss can be reasonably estimated. Estimated claims are based on historical data. Changes in the Fund’s claims expected liability amount in fiscal 2012 and 2011 were:
Self-Insured Workers' Compensation Fund On May 9, 1994 the City created a partially self-funded Workers' Compensation Fund to account for and finance its workers' compensation program. Under this program, the Fund provides workers' compensation coverage for all regular employees and volunteers. Thomas McGee, L.C., serves as the third party administrator and the reinsurer. The deductible is $250,000 per occurrence and an annual aggregate of $250,000. Estimated claims are based on historical data. Changes in the Fund’s claims expected liability amount in fiscal 2012 and 2011 were:
Beginning of
Current Year Claims
Balance at
Fiscal Year
and Changes in
Fiscal
Liability
Estimates
Claims Paid
Year End
2011-2012 $ 285,713
$ 23,151
$ 65,831
$ 243,033 2010-2011 $ 225,196
$ 173,705
$ 113,188
$ 285,713
Beginning of
Current Year Claims
Balance at
Fiscal Year
and Changes in
Fiscal
Liability
Estimates
Claims Paid
Year End
2011-2012 $ 573,877
$ 3,236,376
$ 3,200,007
$ 610,246 2010-2011 $ 339,244
$ 4,139,396
$ 3,904,763
$ 573,877
Page 98
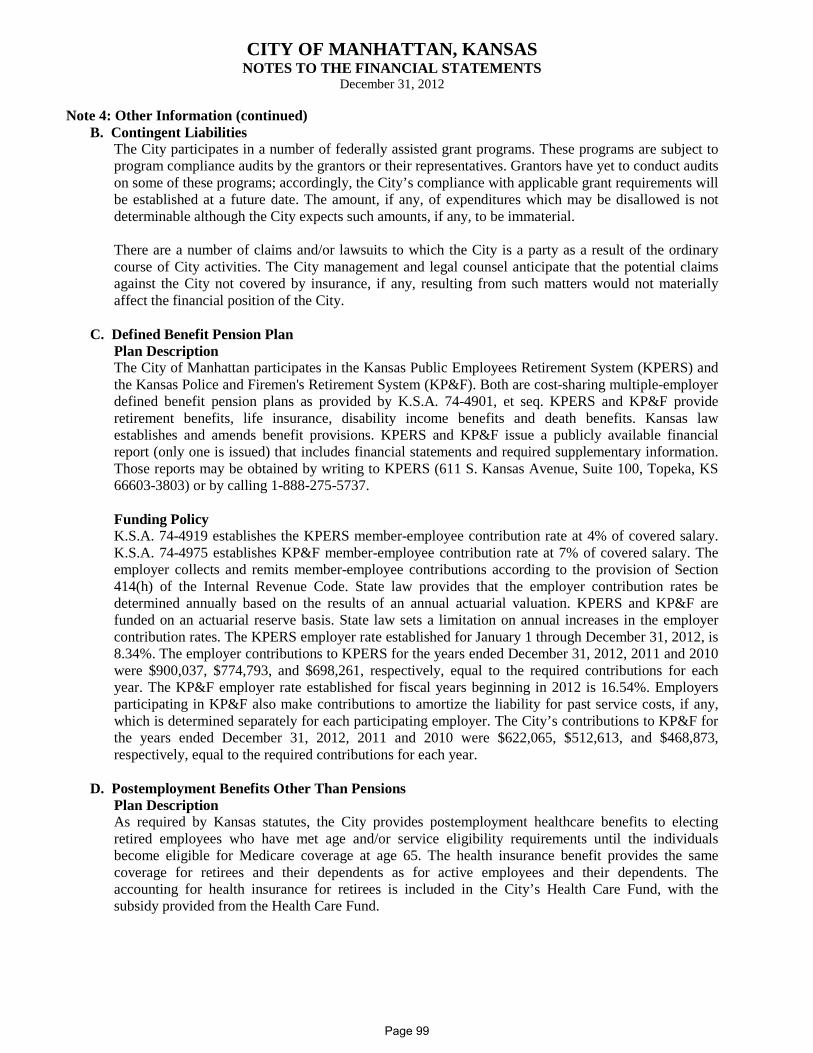
CITY OF MANHATTAN, KANSAS NOTES TO THE FINANCIAL STATEMENTS
December 31, 2012
Note 4: Other Information (continued) B. Contingent Liabilities
The City participates in a number of federally assisted grant programs. These programs are subject to program compliance audits by the grantors or their representatives. Grantors have yet to conduct audits on some of these programs; accordingly, the City’s compliance with applicable grant requirements will be established at a future date. The amount, if any, of expenditures which may be disallowed is not determinable although the City expects such amounts, if any, to be immaterial. There are a number of claims and/or lawsuits to which the City is a party as a result of the ordinary course of City activities. The City management and legal counsel anticipate that the potential claims against the City not covered by insurance, if any, resulting from such matters would not materially affect the financial position of the City.
C. Defined Benefit Pension Plan Plan Description
The City of Manhattan participates in the Kansas Public Employees Retirement System (KPERS) and the Kansas Police and Firemen's Retirement System (KP&F). Both are cost-sharing multiple-employer defined benefit pension plans as provided by K.S.A. 74-4901, et seq. KPERS and KP&F provide retirement benefits, life insurance, disability income benefits and death benefits. Kansas law establishes and amends benefit provisions. KPERS and KP&F issue a publicly available financial report (only one is issued) that includes financial statements and required supplementary information. Those reports may be obtained by writing to KPERS (611 S. Kansas Avenue, Suite 100, Topeka, KS 66603-3803) or by calling 1-888-275-5737. Funding Policy K.S.A. 74-4919 establishes the KPERS member-employee contribution rate at 4% of covered salary. K.S.A. 74-4975 establishes KP&F member-employee contribution rate at 7% of covered salary. The employer collects and remits member-employee contributions according to the provision of Section 414(h) of the Internal Revenue Code. State law provides that the employer contribution rates be determined annually based on the results of an annual actuarial valuation. KPERS and KP&F are funded on an actuarial reserve basis. State law sets a limitation on annual increases in the employer contribution rates. The KPERS employer rate established for January 1 through December 31, 2012, is 8.34%. The employer contributions to KPERS for the years ended December 31, 2012, 2011 and 2010 were $900,037, $774,793, and $698,261, respectively, equal to the required contributions for each year. The KP&F employer rate established for fiscal years beginning in 2012 is 16.54%. Employers participating in KP&F also make contributions to amortize the liability for past service costs, if any, which is determined separately for each participating employer. The City’s contributions to KP&F for the years ended December 31, 2012, 2011 and 2010 were $622,065, $512,613, and $468,873, respectively, equal to the required contributions for each year.
D. Postemployment Benefits Other Than Pensions Plan Description As required by Kansas statutes, the City provides postemployment healthcare benefits to electing retired employees who have met age and/or service eligibility requirements until the individuals become eligible for Medicare coverage at age 65. The health insurance benefit provides the same coverage for retirees and their dependents as for active employees and their dependents. The accounting for health insurance for retirees is included in the City’s Health Care Fund, with the subsidy provided from the Health Care Fund.
Page 99
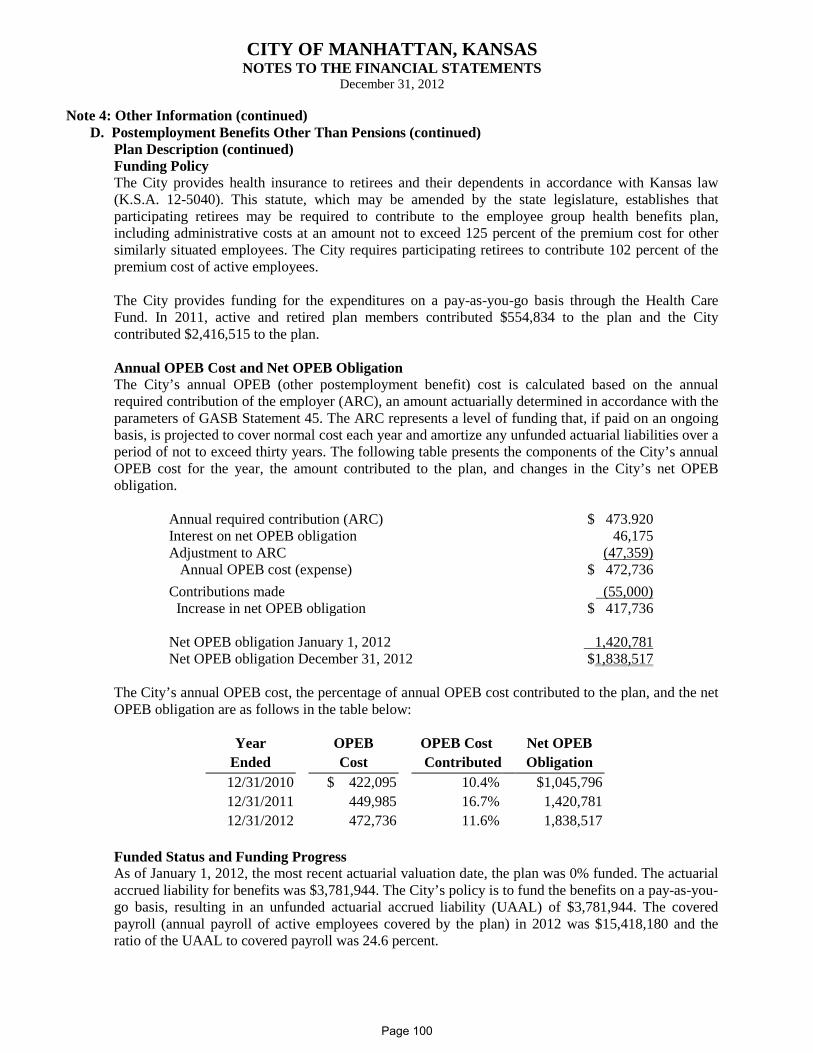
CITY OF MANHATTAN, KANSAS NOTES TO THE FINANCIAL STATEMENTS
December 31, 2012
Note 4: Other Information (continued) D. Postemployment Benefits Other Than Pensions (continued)
Plan Description (continued) Funding Policy The City provides health insurance to retirees and their dependents in accordance with Kansas law (K.S.A. 12-5040). This statute, which may be amended by the state legislature, establishes that participating retirees may be required to contribute to the employee group health benefits plan, including administrative costs at an amount not to exceed 125 percent of the premium cost for other similarly situated employees. The City requires participating retirees to contribute 102 percent of the premium cost of active employees. The City provides funding for the expenditures on a pay-as-you-go basis through the Health Care Fund. In 2011, active and retired plan members contributed $554,834 to the plan and the City contributed $2,416,515 to the plan.
Annual OPEB Cost and Net OPEB Obligation The City’s annual OPEB (other postemployment benefit) cost is calculated based on the annual required contribution of the employer (ARC), an amount actuarially determined in accordance with the parameters of GASB Statement 45. The ARC represents a level of funding that, if paid on an ongoing basis, is projected to cover normal cost each year and amortize any unfunded actuarial liabilities over a period of not to exceed thirty years. The following table presents the components of the City’s annual OPEB cost for the year, the amount contributed to the plan, and changes in the City’s net OPEB obligation.
Annual required contribution (ARC) $ 473.920 Interest on net OPEB obligation Adjustment to ARC
46,175 (47,359)
Annual OPEB cost (expense) $ 472,736 Contributions made (55,000) Increase in net OPEB obligation $ 417,736 Net OPEB obligation January 1, 2012 1,420,781 Net OPEB obligation December 31, 2012 $1,838,517
The City’s annual OPEB cost, the percentage of annual OPEB cost contributed to the plan, and the net OPEB obligation are as follows in the table below:
Year OPEB OPEB Cost Net OPEB Ended Cost Contributed Obligation 12/31/2010 $ 422,095 10.4% $1,045,796 12/31/2011 449,985 16.7% 1,420,781 12/31/2012 472,736 11.6% 1,838,517
Funded Status and Funding Progress As of January 1, 2012, the most recent actuarial valuation date, the plan was 0% funded. The actuarial accrued liability for benefits was $3,781,944. The City’s policy is to fund the benefits on a pay-as-you-go basis, resulting in an unfunded actuarial accrued liability (UAAL) of $3,781,944. The covered payroll (annual payroll of active employees covered by the plan) in 2012 was $15,418,180 and the ratio of the UAAL to covered payroll was 24.6 percent.
Page 100
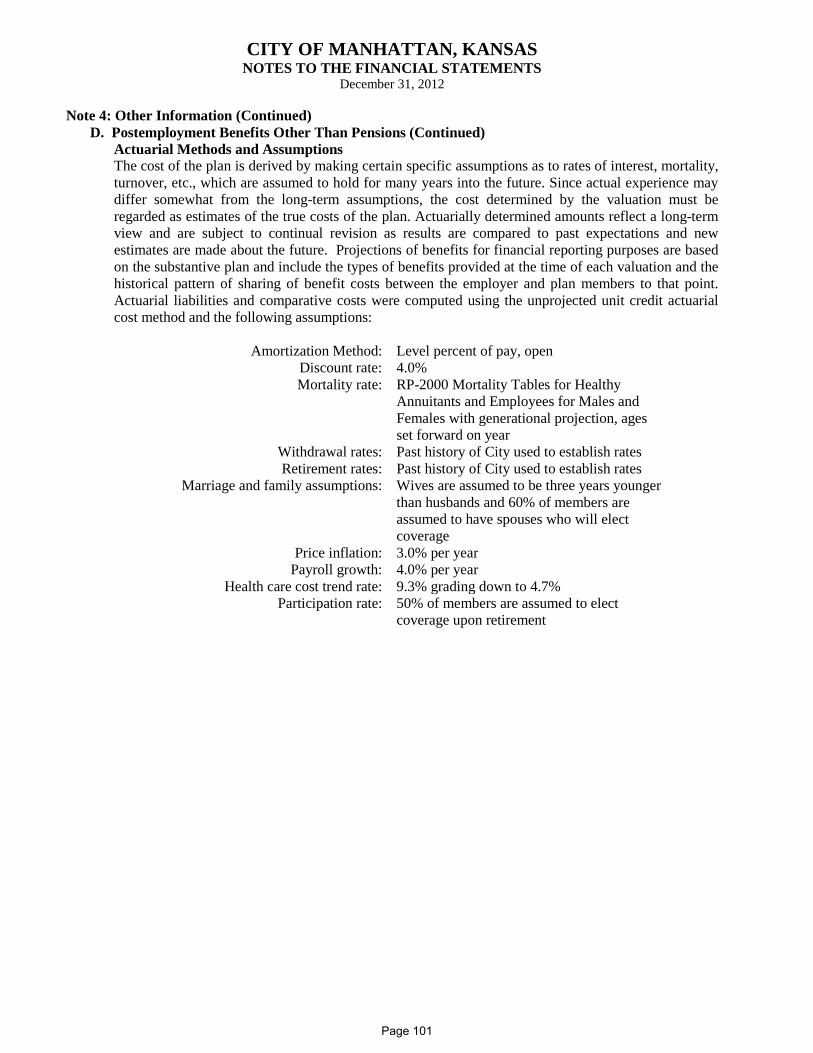
CITY OF MANHATTAN, KANSAS NOTES TO THE FINANCIAL STATEMENTS
December 31, 2012
Note 4: Other Information (Continued) D. Postemployment Benefits Other Than Pensions (Continued)
Actuarial Methods and Assumptions The cost of the plan is derived by making certain specific assumptions as to rates of interest, mortality, turnover, etc., which are assumed to hold for many years into the future. Since actual experience may differ somewhat from the long-term assumptions, the cost determined by the valuation must be regarded as estimates of the true costs of the plan. Actuarially determined amounts reflect a long-term view and are subject to continual revision as results are compared to past expectations and new estimates are made about the future. Projections of benefits for financial reporting purposes are based on the substantive plan and include the types of benefits provided at the time of each valuation and the historical pattern of sharing of benefit costs between the employer and plan members to that point. Actuarial liabilities and comparative costs were computed using the unprojected unit credit actuarial cost method and the following assumptions:
Amortization Method: Level percent of pay, open
Discount rate: 4.0% Mortality rate: RP-2000 Mortality Tables for Healthy
Annuitants and Employees for Males and Females with generational projection, ages set forward on year
Withdrawal rates: Past history of City used to establish rates Retirement rates: Past history of City used to establish rates
Marriage and family assumptions: Wives are assumed to be three years younger than husbands and 60% of members are assumed to have spouses who will elect coverage
Price inflation: 3.0% per year Payroll growth: 4.0% per year
Health care cost trend rate: 9.3% grading down to 4.7% Participation rate: 50% of members are assumed to elect
coverage upon retirement
Page 101
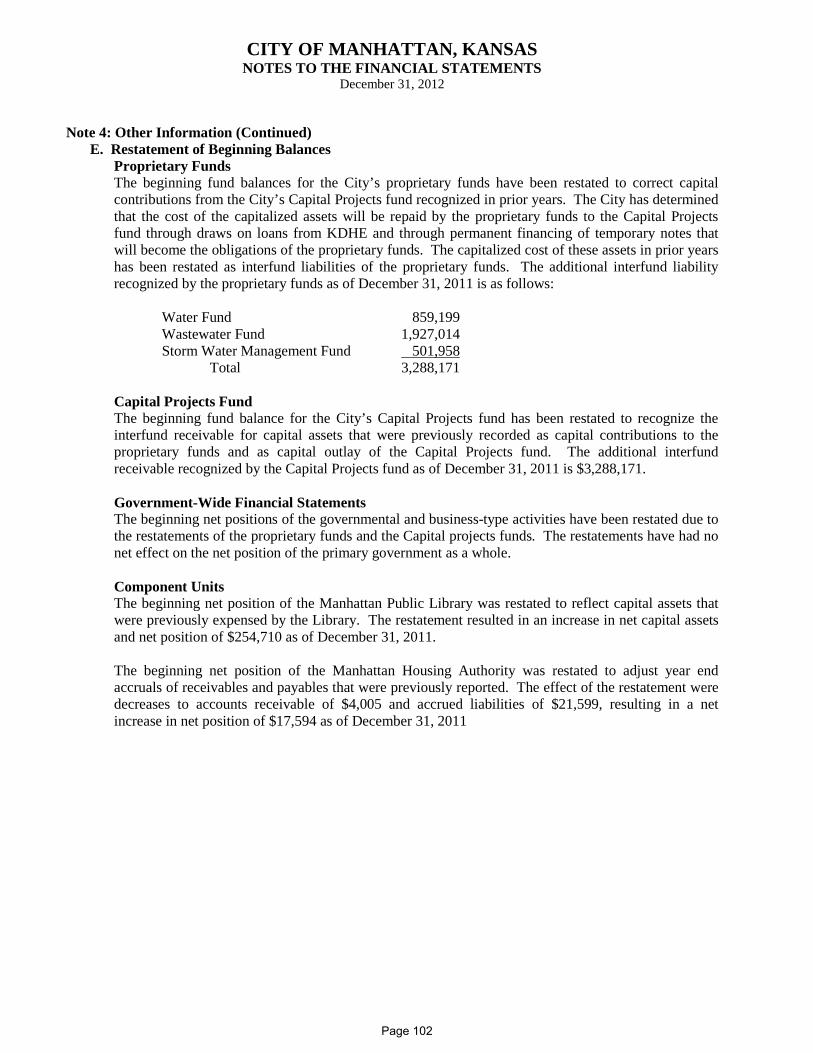
CITY OF MANHATTAN, KANSAS NOTES TO THE FINANCIAL STATEMENTS
December 31, 2012
Note 4: Other Information (Continued)
E. Restatement of Beginning Balances Proprietary Funds The beginning fund balances for the City’s proprietary funds have been restated to correct capital contributions from the City’s Capital Projects fund recognized in prior years. The City has determined that the cost of the capitalized assets will be repaid by the proprietary funds to the Capital Projects fund through draws on loans from KDHE and through permanent financing of temporary notes that will become the obligations of the proprietary funds. The capitalized cost of these assets in prior years has been restated as interfund liabilities of the proprietary funds. The additional interfund liability recognized by the proprietary funds as of December 31, 2011 is as follows:
Water Fund 859,199
Wastewater Fund 1,927,014 Storm Water Management Fund 501,958 Total 3,288,171 Capital Projects Fund
The beginning fund balance for the City’s Capital Projects fund has been restated to recognize the interfund receivable for capital assets that were previously recorded as capital contributions to the proprietary funds and as capital outlay of the Capital Projects fund. The additional interfund receivable recognized by the Capital Projects fund as of December 31, 2011 is $3,288,171. Government-Wide Financial Statements The beginning net positions of the governmental and business-type activities have been restated due to the restatements of the proprietary funds and the Capital projects funds. The restatements have had no net effect on the net position of the primary government as a whole. Component Units The beginning net position of the Manhattan Public Library was restated to reflect capital assets that were previously expensed by the Library. The restatement resulted in an increase in net capital assets and net position of $254,710 as of December 31, 2011. The beginning net position of the Manhattan Housing Authority was restated to adjust year end accruals of receivables and payables that were previously reported. The effect of the restatement were decreases to accounts receivable of $4,005 and accrued liabilities of $21,599, resulting in a net increase in net position of $17,594 as of December 31, 2011
Page 102
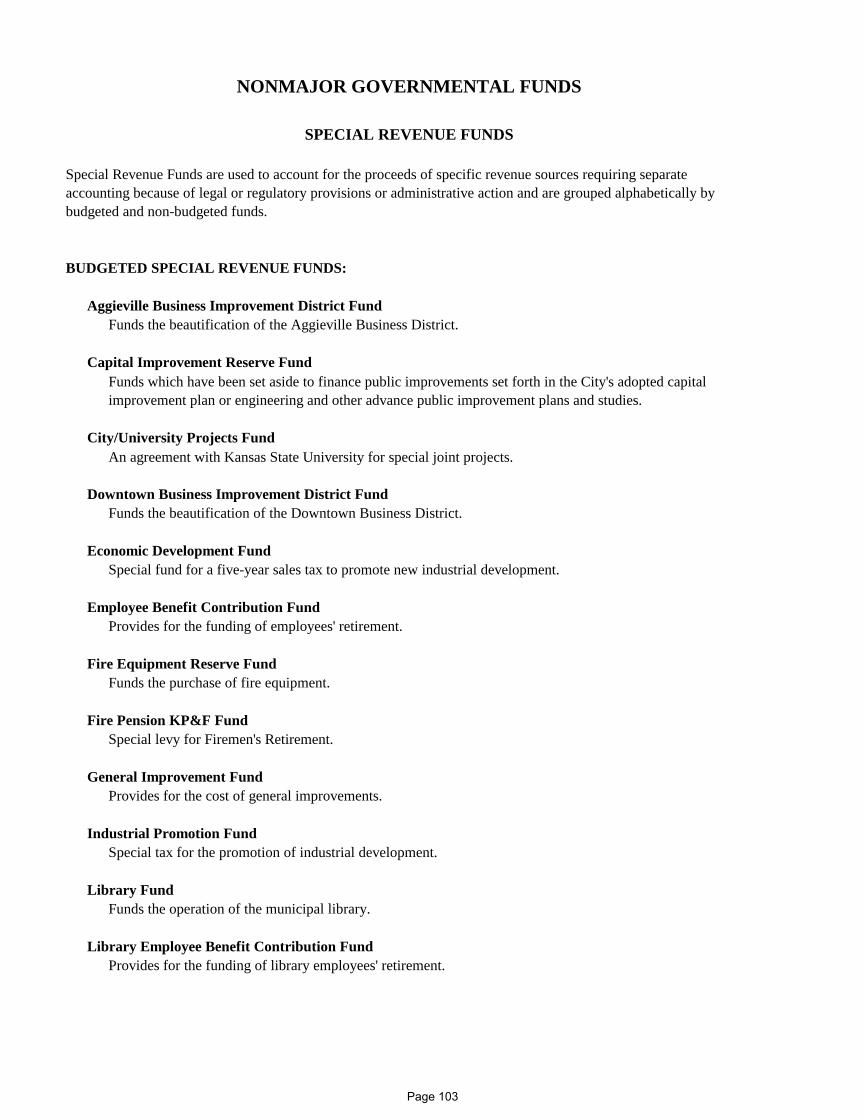
NONMAJOR GOVERNMENTAL FUNDS
SPECIAL REVENUE FUNDS
BUDGETED SPECIAL REVENUE FUNDS:
Aggieville Business Improvement District FundFunds the beautification of the Aggieville Business District.
Capital Improvement Reserve Fund
City/University Projects Fund
Downtown Business Improvement District FundFunds the beautification of the Downtown Business District.
Economic Development FundSpecial fund for a five-year sales tax to promote new industrial development.
Employee Benefit Contribution FundProvides for the funding of employees' retirement.
Fire Equipment Reserve FundFunds the purchase of fire equipment.
Fire Pension KP&F FundSpecial levy for Firemen's Retirement.
General Improvement FundProvides for the cost of general improvements.
Industrial Promotion FundSpecial tax for the promotion of industrial development.
Library FundFunds the operation of the municipal library.
Library Employee Benefit Contribution FundProvides for the funding of library employees' retirement.
Special Revenue Funds are used to account for the proceeds of specific revenue sources requiring separate accounting because of legal or regulatory provisions or administrative action and are grouped alphabetically by budgeted and non-budgeted funds.
Funds which have been set aside to finance public improvements set forth in the City's adopted capital improvement plan or engineering and other advance public improvement plans and studies.
An agreement with Kansas State University for special joint projects.
Page 103
Park Development FundProvides for park capital improvements.
Sales Tax FundReceives sales tax and transfers it to the General Fund and other funds.
Special Alcohol Programs FundSpecial alcohol liquor tax for the prevention or treatment of alcohol and substance abuse.
Special Parks and Recreation FundSpecial alcohol liquor tax for recreation.
Special Street and Highway FundState gasoline tax monies for streets and highways.
Special Sunset Zoo FundSpecial fees for zoo improvements.
Tourism and Convention Promotion FundSpecial hotel guest tax for tourism and $72,000 annually for new airport terminal.
NON-BUDGETED SPECIAL REVENUE FUNDS:
Airport Federal Grant No. 34 Fund
Airport Federal Grant No. 36 Fund
Airport Federal Grant No. 37/38 Fund
Airport Federal Grant No. 41 Fund
Airport Federal Grant No. 42 Fund
Airport Federal Grant No. 43 Fund
Airport Small Community Air Service Development Grant
SPECIAL REVENUE FUNDS
This federal grant pays for 90% of the cost of constructing the aircraft parking apron.
This federal grant pays for 95% of the cost of the Runway 3/21 Safety Area Improvement project.
This federal grant pays for 90% of the cost of desinging the airport terminal expansion.
This federal grant pays for 95% of the cost of acquiring the land needed to shift Runway 3/21.
This federal grant pays for 95% of the cost of conducting an Airport Passenger Terminal Study.
This federal grant pays for 95% of the cost of relocating weather and air navigation equipment required as a result of shifting Runway 3/21.
Funds from this federal grant will be used for a two-year program that will center on marketing the benefits of the regional jet service at the Airport to a broader audience. Two-thirds of the cost will be covered by the grant and one-third will be covered by local matching funds.
Page 104
Airport TVOR Land Acquisition Grant Fund
Alcohol and Drug Safety Fund - (K.S.A. 8-1008)
CDBG Land Sales Fund
Emergency Shelter Grant Funds
Federal Entitlement Funds
FHDC Archeology Grant Fund
Firefighter Memorial FundDonations and other funds received to go toward the construction of a firefighter memorial.
HOME Investment Partnerships Program Funds
Homeland Security Grant-Structural Collapse Course
Homeless Prevention Grant
Juneteenth Grant-2009Donations received to help fund the City's Juneteenth celebration.
Funds received from the Kansas Housing Resources Corporation to provide financial assistance and services to prevent individuals and families in the City from becoming homeless or help those who are experiencing homelessness to be quickly re-housed and stabilized.
This Federal Grant pays for 95% of the cost of acquiring the land needed to construct a wildlife fence around the Airport and to protect the critical area around the Federal Aviation Administration (FAA) electronic equipment used by pilots for navigating aircraft.
Money derived from DUI convictions and diversions is deposited into this fund. Monies are used for pre-sentence alcohol and drug evaluations. Each year 10% of the revenue is transferred to the General Fund to cover administrative overhead.
Funds recevied from the Kansas State Historical Society to conduct workshops at the Flint Hills Discovery Center to train teaches to use Kansas Project Archeology educational materials.
Community Development Block Grant Funds for Entitlement Communities received from the Department of Housing and Urban Development for developing viable urban communities by providing decent housing, a suitable living environment, and expanding economic opportunities, principally for persons of low and moderate income.
Fund accounts for the transfer of land for business expansion and green space purposes.
Funds received from the Kansas Housing Resources Corporation to provide assistance to local homeless shelters and social service agencies.
Funds received from the Kansas Housing Resources Corporation to provide assistance to low and moderate-income homeowners in the form of deferred loans for home repairs needed to bring properties into compliance with local building codes.
Funds received from the Kansas Highway Patrol to reimburse the City for payroll costs incurred while some of the City's firefighters attend structural collapse training courses.
SPECIAL REVENUE FUNDS
Page 105
Kansas Bioscience Authority Innovation Center Grant
Local Energy Assurance Plan Grant
Norvell Band Shell Fund
Old Engine One Fund
Park Improvement Fund
Special Taxi Fund
Sunset Zoo Animals Fund
Take Charge Energy Challenge
U.S. Small Business Administration Grant for Child Care
The Take Charge Energy Challenge funds are provided by the U.S. Department of Energy (DOE) through the Energy Efficiency and Conservation Block Grant (EECBG) program. EECBG is funded through the American Recovery and Reinvestment Act of 2009 (ARRA). The Take Charge Challenge is sponsored by the Kansas Energy Office (KEO) and administered through the Climate and Energy Project (CEP). Funds will be used to support future efficiency efforts in the community.
SPECIAL REVENUE FUNDS
Funds received from the Kansas Bioscience Authority to build out the remaining pilot space at the Manhattan/K-State Innovation Center, which is intended to house additional laboratory and research uses. The City is to provide approximately 30% in matching funds from the Economic Development Fund.
This fund receives donations for improvements to the various parks in the City, the Rose Garden, etc.
This fund was set up by resolution to handle the citizens portion (user fees) of the elderly and handicapped taxi coupons issued.
This federal grant provides funds under the American Recovery and Reinvestment Act of 2009 to update the 2002 Energy Emergency Response Plan and to conduct other training and implementation activities.
This fund was created by Lowell Jack to raise private dollars to renovate the Arts in the Park stage, which includes a covering. The new stage has been named after Larry Norvell, a long time music teacher at Manhattan High School who also played in the Municipal Band and served on the Municipal Band Board for years.
Funds received are used for fire prevention awareness and the maintenance of the historic 1947 Old Engine One Fire Truck.
The proceeds from the sale of zoo animals and the donations for the purchase of new animals go into this fund to be used to purchase animals for the zoo.
Funds received from the U.S. Small Business Administration through the 2008 Congressional Earmark Program for the construction of playground and outdoor learning environments for the K-State Center for Child Development and for the architectural design of a new Manhattan Day Care and Learning Center.
Page 106
Vacek Fund
Wetland Development Grant
Woodward Fund
Yes! Grant Funds
Funds received from the Kansas Alliance for Wetlands and Streams for wetland management in Frank Anneberg Park.
A grant from the Manhattan Yes! Fund to fund Z.O.O. Crew, an educational program for high school students interested in pursuing a career in the zoo field.
Joseph and Margaret Vacek named the Sunset Zoo as a beneficiary of their trust estate. Funds shall be used in support of the Sunset Zoo for such uses and purposes as directed by the governing body.
SPECIAL REVENUE FUNDS
Richard Woodard originally created this fund to buy property for additional soccer fields and name the complex after his son who was killed in an auto accident returning from a soccer tournament. Mr. Woodward has since agreed to allow these funds to go toward the construction of a gibbon exhibit at Sunset Zoo.
Page 107
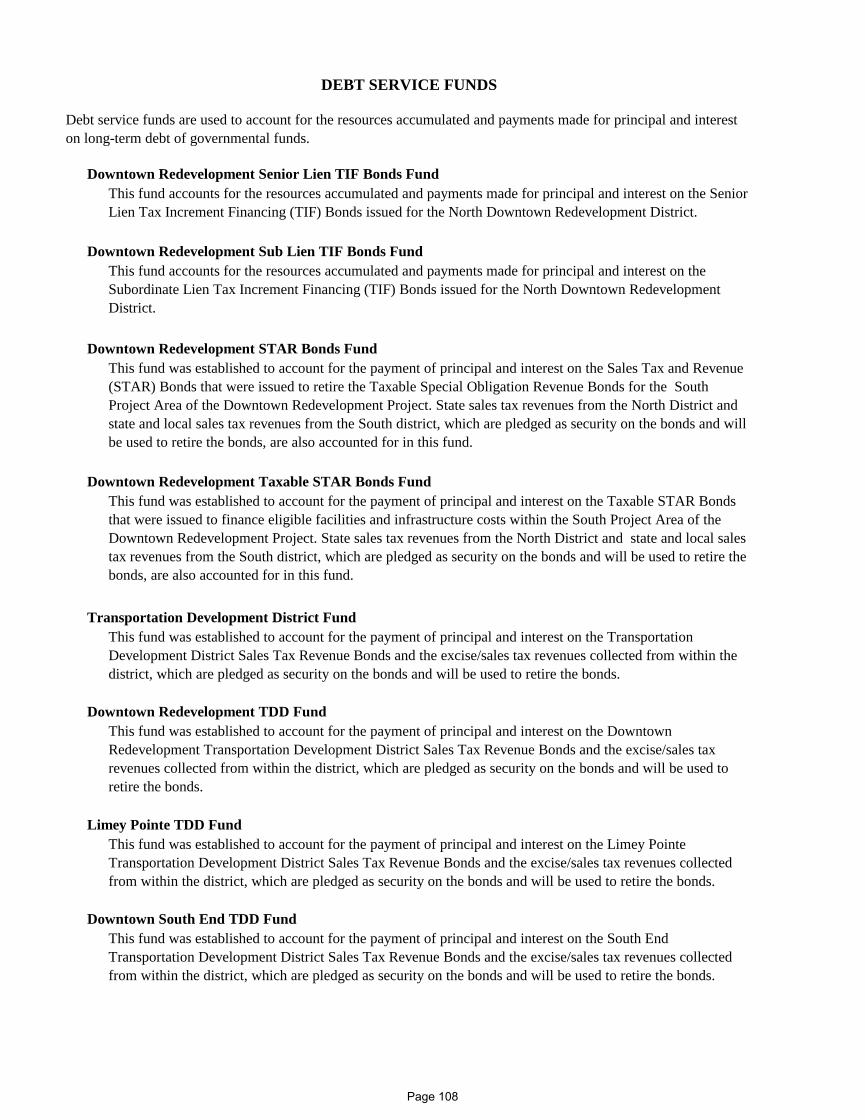
Downtown Redevelopment Senior Lien TIF Bonds Fund
Downtown Redevelopment Sub Lien TIF Bonds Fund
Downtown Redevelopment STAR Bonds Fund
Downtown Redevelopment Taxable STAR Bonds Fund
Transportation Development District Fund
Downtown Redevelopment TDD Fund
Limey Pointe TDD Fund
Downtown South End TDD Fund
This fund accounts for the resources accumulated and payments made for principal and interest on the Senior Lien Tax Increment Financing (TIF) Bonds issued for the North Downtown Redevelopment District.
This fund was established to account for the payment of principal and interest on the South End Transportation Development District Sales Tax Revenue Bonds and the excise/sales tax revenues collected from within the district, which are pledged as security on the bonds and will be used to retire the bonds.
DEBT SERVICE FUNDS
This fund was established to account for the payment of principal and interest on the Transportation Development District Sales Tax Revenue Bonds and the excise/sales tax revenues collected from within the district, which are pledged as security on the bonds and will be used to retire the bonds.
This fund was established to account for the payment of principal and interest on the Limey Pointe Transportation Development District Sales Tax Revenue Bonds and the excise/sales tax revenues collected from within the district, which are pledged as security on the bonds and will be used to retire the bonds.
This fund was established to account for the payment of principal and interest on the Downtown Redevelopment Transportation Development District Sales Tax Revenue Bonds and the excise/sales tax revenues collected from within the district, which are pledged as security on the bonds and will be used to retire the bonds.
Debt service funds are used to account for the resources accumulated and payments made for principal and interest on long-term debt of governmental funds.
This fund was established to account for the payment of principal and interest on the Sales Tax and Revenue (STAR) Bonds that were issued to retire the Taxable Special Obligation Revenue Bonds for the South Project Area of the Downtown Redevelopment Project. State sales tax revenues from the North District and state and local sales tax revenues from the South district, which are pledged as security on the bonds and will be used to retire the bonds, are also accounted for in this fund.
This fund was established to account for the payment of principal and interest on the Taxable STAR Bonds that were issued to finance eligible facilities and infrastructure costs within the South Project Area of the Downtown Redevelopment Project. State sales tax revenues from the North District and state and local sales tax revenues from the South district, which are pledged as security on the bonds and will be used to retire the bonds, are also accounted for in this fund.
This fund accounts for the resources accumulated and payments made for principal and interest on the Subordinate Lien Tax Increment Financing (TIF) Bonds issued for the North Downtown Redevelopment District.
Page 108

Sunrise Perpetual Care FundTwenty-five percent of the purchase price of the lots in Sunrise Cemetery is put directly into this fund for the upkeep and perpetual care of such lots.
Permanent funds are used to report resources that are legally restricted to the extent that only earnings, not principal, may be used for purposes that support the reporting government's programs.
PERMANENT FUND
Page 109
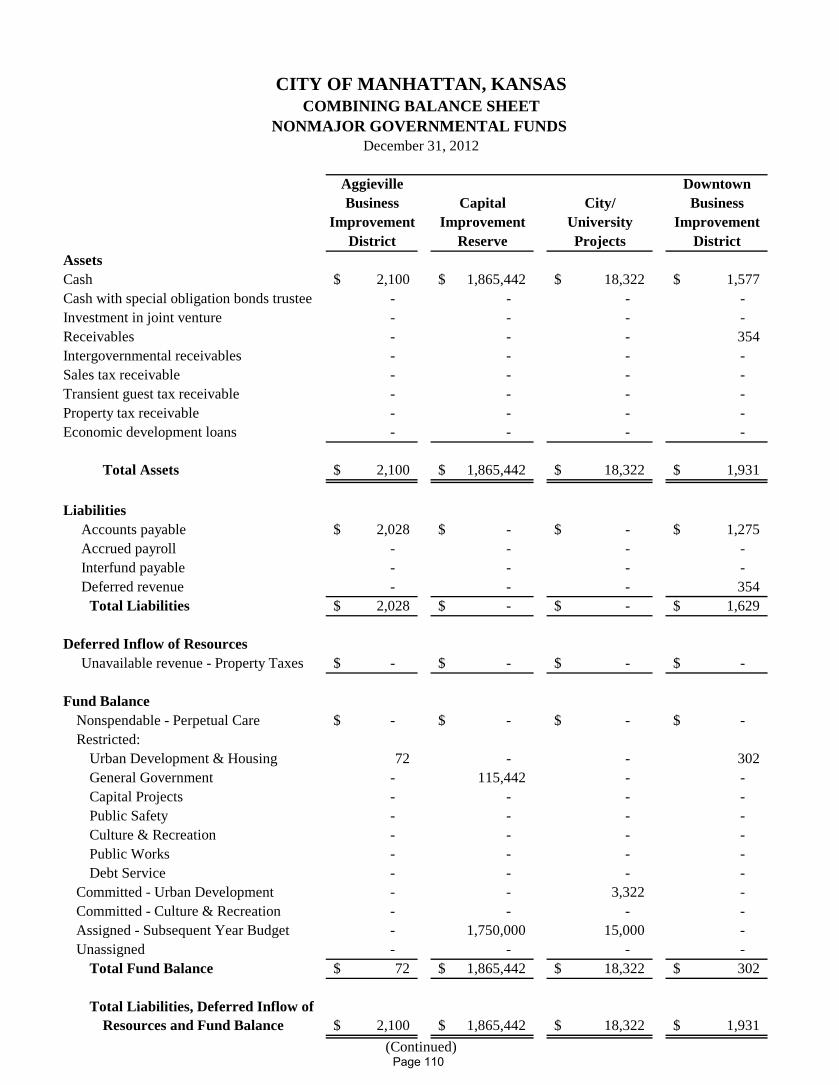
Aggieville DowntownBusiness Capital City/ Business
Improvement Improvement University ImprovementDistrict Reserve Projects District
AssetsCash 2,100$ 1,865,442$ 18,322$ 1,577$ Cash with special obligation bonds trustee - - - - Investment in joint venture - - - - Receivables - - - 354 Intergovernmental receivables - - - - Sales tax receivable - - - - Transient guest tax receivable - - - - Property tax receivable - - - - Economic development loans - - - -
Total Assets 2,100$ 1,865,442$ 18,322$ 1,931$
LiabilitiesAccounts payable 2,028$ -$ -$ 1,275$ Accrued payroll - - - - Interfund payable - - - - Deferred revenue - - - 354
Total Liabilities 2,028$ -$ -$ 1,629$
Deferred Inflow of ResourcesUnavailable revenue - Property Taxes -$ -$ -$ -$
Fund BalanceNonspendable - Perpetual Care -$ -$ -$ -$ Restricted:
Urban Development & Housing 72 - - 302 General Government - 115,442 - - Capital Projects - - - - Public Safety - - - - Culture & Recreation - - - - Public Works - - - - Debt Service - - - -
Committed - Urban Development - - 3,322 - Committed - Culture & Recreation - - - - Assigned - Subsequent Year Budget - 1,750,000 15,000 - Unassigned - - - -
Total Fund Balance 72$ 1,865,442$ 18,322$ 302$
Total Liabilities, Deferred Inflow ofResources and Fund Balance 2,100$ 1,865,442$ 18,322$ 1,931$
CITY OF MANHATTAN, KANSASCOMBINING BALANCE SHEET
December 31, 2012
(Continued)
NONMAJOR GOVERNMENTAL FUNDS
Page 110
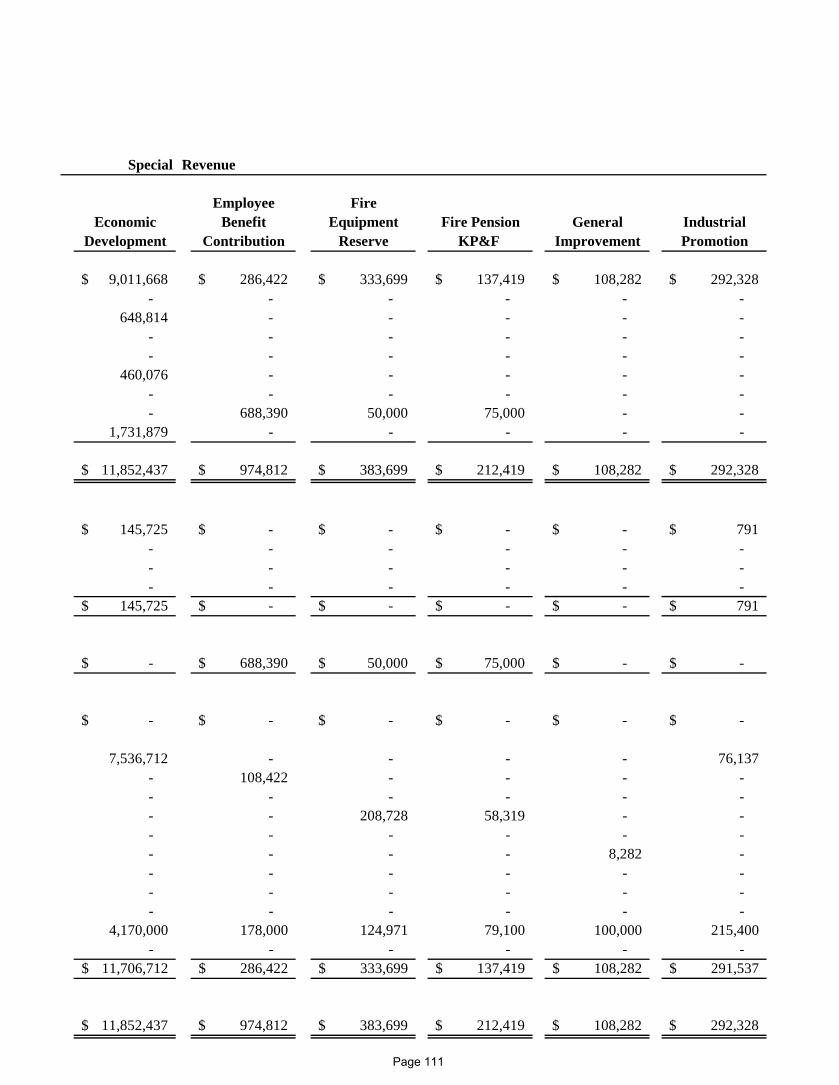
Special Revenue
Employee FireEconomic Benefit Equipment Fire Pension General Industrial
Development Contribution Reserve KP&F Improvement Promotion
9,011,668$ 286,422$ 333,699$ 137,419$ 108,282$ 292,328$ - - - - - -
648,814 - - - - - - - - - - - - - - - - -
460,076 - - - - - - - - - - - - 688,390 50,000 75,000 - -
1,731,879 - - - - -
11,852,437$ 974,812$ 383,699$ 212,419$ 108,282$ 292,328$
145,725$ -$ -$ -$ -$ 791$ - - - - - - - - - - - - - - - - - -
145,725$ -$ -$ -$ -$ 791$
-$ 688,390$ 50,000$ 75,000$ -$ -$
-$ -$ -$ -$ -$ -$
7,536,712 - - - - 76,137 - 108,422 - - - - - - - - - - - - 208,728 58,319 - - - - - - - - - - - - 8,282 - - - - - - - - - - - - - - - - - - -
4,170,000 178,000 124,971 79,100 100,000 215,400 - - - - - -
11,706,712$ 286,422$ 333,699$ 137,419$ 108,282$ 291,537$
11,852,437$ 974,812$ 383,699$ 212,419$ 108,282$ 292,328$
Page 111
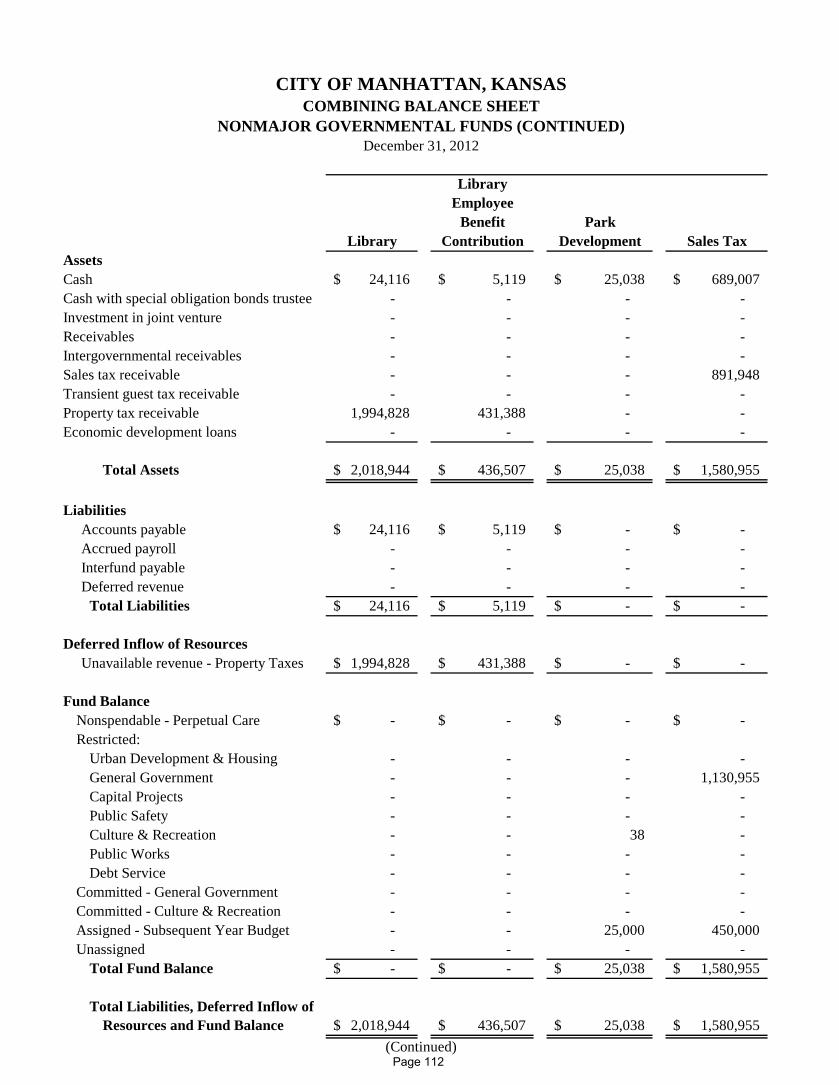
LibraryEmployee
Benefit ParkLibrary Contribution Development Sales Tax
AssetsCash 24,116$ 5,119$ 25,038$ 689,007$ Cash with special obligation bonds trustee - - - - Investment in joint venture - - - - Receivables - - - - Intergovernmental receivables - - - - Sales tax receivable - - - 891,948 Transient guest tax receivable - - - - Property tax receivable 1,994,828 431,388 - - Economic development loans - - - -
Total Assets 2,018,944$ 436,507$ 25,038$ 1,580,955$
LiabilitiesAccounts payable 24,116$ 5,119$ -$ -$ Accrued payroll - - - - Interfund payable - - - - Deferred revenue - - - -
Total Liabilities 24,116$ 5,119$ -$ -$
Deferred Inflow of ResourcesUnavailable revenue - Property Taxes 1,994,828$ 431,388$ -$ -$
Fund BalanceNonspendable - Perpetual Care -$ -$ -$ -$ Restricted:
Urban Development & Housing - - - - General Government - - - 1,130,955 Capital Projects - - - - Public Safety - - - - Culture & Recreation - - 38 - Public Works - - - - Debt Service - - - -
Committed - General Government - - - - Committed - Culture & Recreation - - - - Assigned - Subsequent Year Budget - - 25,000 450,000 Unassigned - - - -
Total Fund Balance -$ -$ 25,038$ 1,580,955$
Total Liabilities, Deferred Inflow ofResources and Fund Balance 2,018,944$ 436,507$ 25,038$ 1,580,955$
CITY OF MANHATTAN, KANSASCOMBINING BALANCE SHEET
NONMAJOR GOVERNMENTAL FUNDS (CONTINUED)
(Continued)
December 31, 2012
Page 112
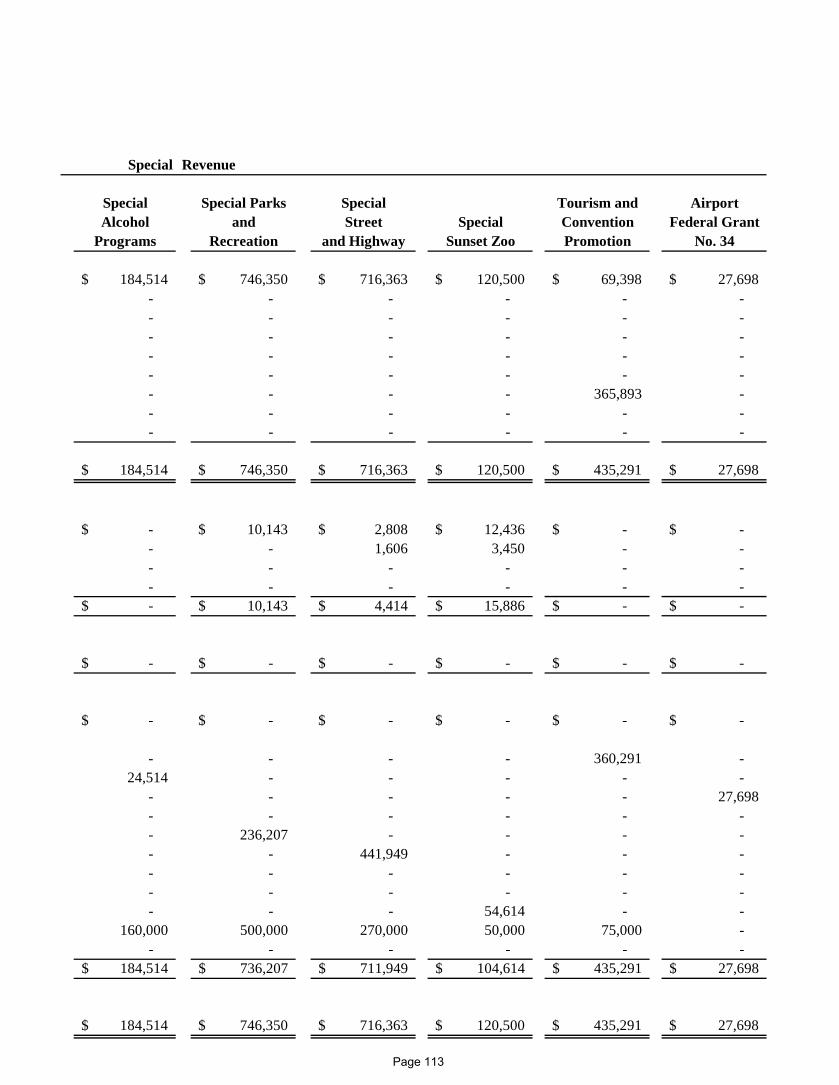
Special Revenue
Special Special Parks Special Tourism and AirportAlcohol and Street Special Convention Federal Grant
Programs Recreation and Highway Sunset Zoo Promotion No. 34
184,514$ 746,350$ 716,363$ 120,500$ 69,398$ 27,698$ - - - - - - - - - - - - - - - - - - - - - - - - - - - - - - - - - - 365,893 - - - - - - - - - - - - -
184,514$ 746,350$ 716,363$ 120,500$ 435,291$ 27,698$
-$ 10,143$ 2,808$ 12,436$ -$ -$ - - 1,606 3,450 - - - - - - - - - - - - - - -$ 10,143$ 4,414$ 15,886$ -$ -$
-$ -$ -$ -$ -$ -$
-$ -$ -$ -$ -$ -$
- - - - 360,291 - 24,514 - - - - -
- - - - - 27,698 - - - - - - - 236,207 - - - - - - 441,949 - - - - - - - - - - - - - - - - - - 54,614 - -
160,000 500,000 270,000 50,000 75,000 - - - - - - -
184,514$ 736,207$ 711,949$ 104,614$ 435,291$ 27,698$
184,514$ 746,350$ 716,363$ 120,500$ 435,291$ 27,698$
Page 113
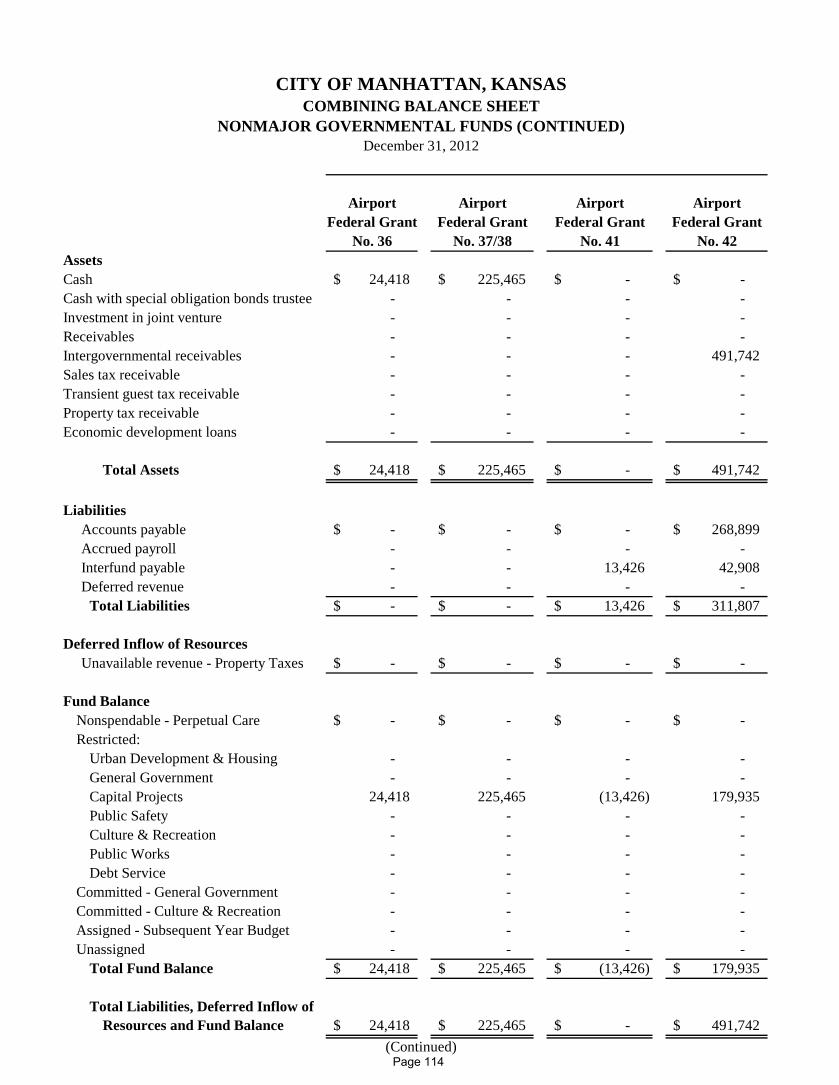
Airport Airport Airport AirportFederal Grant Federal Grant Federal Grant Federal Grant
No. 36 No. 37/38 No. 41 No. 42AssetsCash 24,418$ 225,465$ -$ -$ Cash with special obligation bonds trustee - - - - Investment in joint venture - - - - Receivables - - - - Intergovernmental receivables - - - 491,742 Sales tax receivable - - - - Transient guest tax receivable - - - - Property tax receivable - - - - Economic development loans - - - -
Total Assets 24,418$ 225,465$ -$ 491,742$
LiabilitiesAccounts payable -$ -$ -$ 268,899$ Accrued payroll - - - - Interfund payable - - 13,426 42,908 Deferred revenue - - - -
Total Liabilities -$ -$ 13,426$ 311,807$
Deferred Inflow of ResourcesUnavailable revenue - Property Taxes -$ -$ -$ -$
Fund BalanceNonspendable - Perpetual Care -$ -$ -$ -$ Restricted:
Urban Development & Housing - - - - General Government - - - - Capital Projects 24,418 225,465 (13,426) 179,935 Public Safety - - - - Culture & Recreation - - - - Public Works - - - - Debt Service - - - -
Committed - General Government - - - - Committed - Culture & Recreation - - - - Assigned - Subsequent Year Budget - - - - Unassigned - - - -
Total Fund Balance 24,418$ 225,465$ (13,426)$ 179,935$
Total Liabilities, Deferred Inflow ofResources and Fund Balance 24,418$ 225,465$ -$ 491,742$
December 31, 2012
(Continued)
CITY OF MANHATTAN, KANSASCOMBINING BALANCE SHEET
NONMAJOR GOVERNMENTAL FUNDS (CONTINUED)
Page 114

Airport Small AirportAirport Community TVOR Land Alcohol Emergency
Federal Grant Air Service Acquisition and Drug ShelterNo. 43 Development Grant Safety 2012
-$ -$ -$ 34,373$ 1,049$ - - - - - - - - - - - - - 46,258 -
1,552,151 164,370 22,229 - 12,500 - - - - - - - - - - - - - - - - - - - -
1,552,151$ 164,370$ 22,229$ 80,631$ 13,549$
936,142$ 81,182$ 1,750$ 13,149$ 11,454$ - - - - -
788,472 76,260 42,520 - - - - - 46,258 -
1,724,614$ 157,442$ 44,270$ 59,407$ 11,454$
-$ -$ -$ -$ -$
-$ -$ -$ -$ -$
- - - - 2,095 - - - 21,224 -
(172,463) 6,928 (22,041) - - - - - - - - - - - - - - - - - - - - - - - - - - - - - - - - - - - - - - - - - -
(172,463)$ 6,928$ (22,041)$ 21,224$ 2,095$
1,552,151$ 164,370$ 22,229$ 80,631$ 13,549$
Special Revenue
Page 115
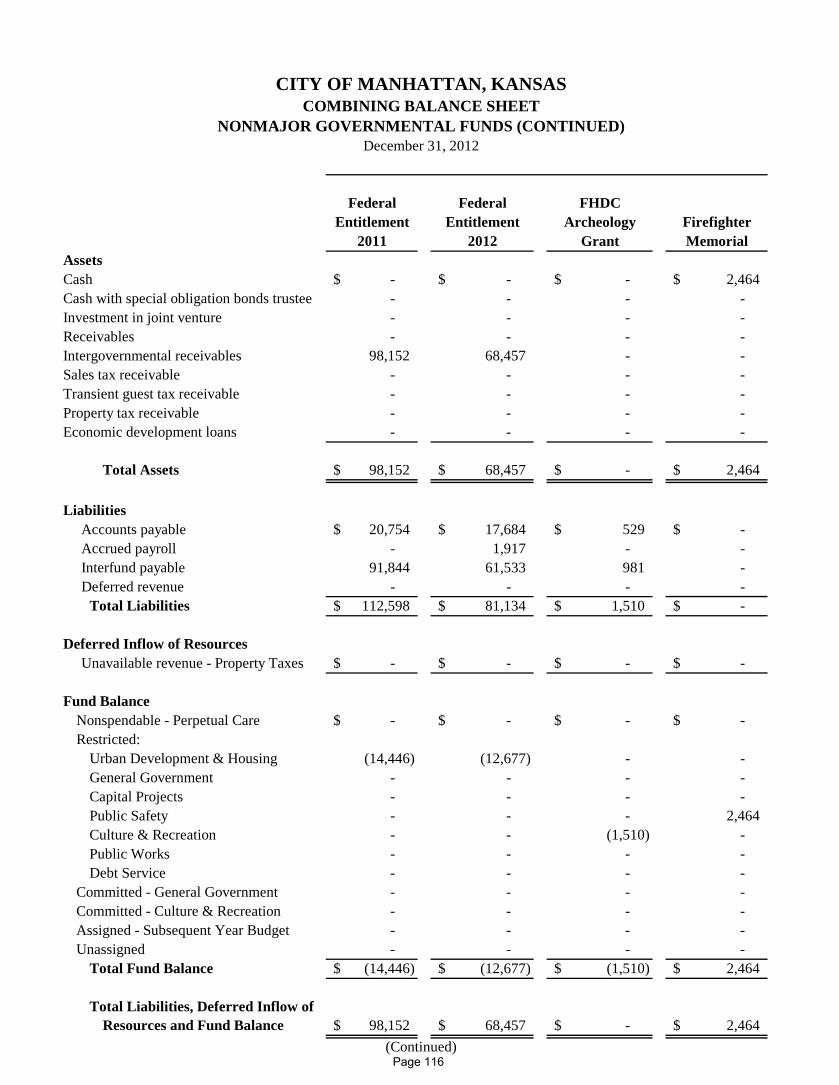
Federal Federal FHDCEntitlement Entitlement Archeology Firefighter
2011 2012 Grant MemorialAssetsCash -$ -$ -$ 2,464$ Cash with special obligation bonds trustee - - - - Investment in joint venture - - - - Receivables - - - - Intergovernmental receivables 98,152 68,457 - - Sales tax receivable - - - - Transient guest tax receivable - - - - Property tax receivable - - - - Economic development loans - - - -
Total Assets 98,152$ 68,457$ -$ 2,464$
LiabilitiesAccounts payable 20,754$ 17,684$ 529$ -$ Accrued payroll - 1,917 - - Interfund payable 91,844 61,533 981 - Deferred revenue - - - -
Total Liabilities 112,598$ 81,134$ 1,510$ -$
Deferred Inflow of ResourcesUnavailable revenue - Property Taxes -$ -$ -$ -$
Fund BalanceNonspendable - Perpetual Care -$ -$ -$ -$ Restricted:
Urban Development & Housing (14,446) (12,677) - - General Government - - - - Capital Projects - - - - Public Safety - - - 2,464 Culture & Recreation - - (1,510) - Public Works - - - - Debt Service - - - -
Committed - General Government - - - - Committed - Culture & Recreation - - - - Assigned - Subsequent Year Budget - - - - Unassigned - - - -
Total Fund Balance (14,446)$ (12,677)$ (1,510)$ 2,464$
Total Liabilities, Deferred Inflow ofResources and Fund Balance 98,152$ 68,457$ -$ 2,464$
(Continued)
COMBINING BALANCE SHEET
December 31, 2012
CITY OF MANHATTAN, KANSAS
NONMAJOR GOVERNMENTAL FUNDS (CONTINUED)
Page 116
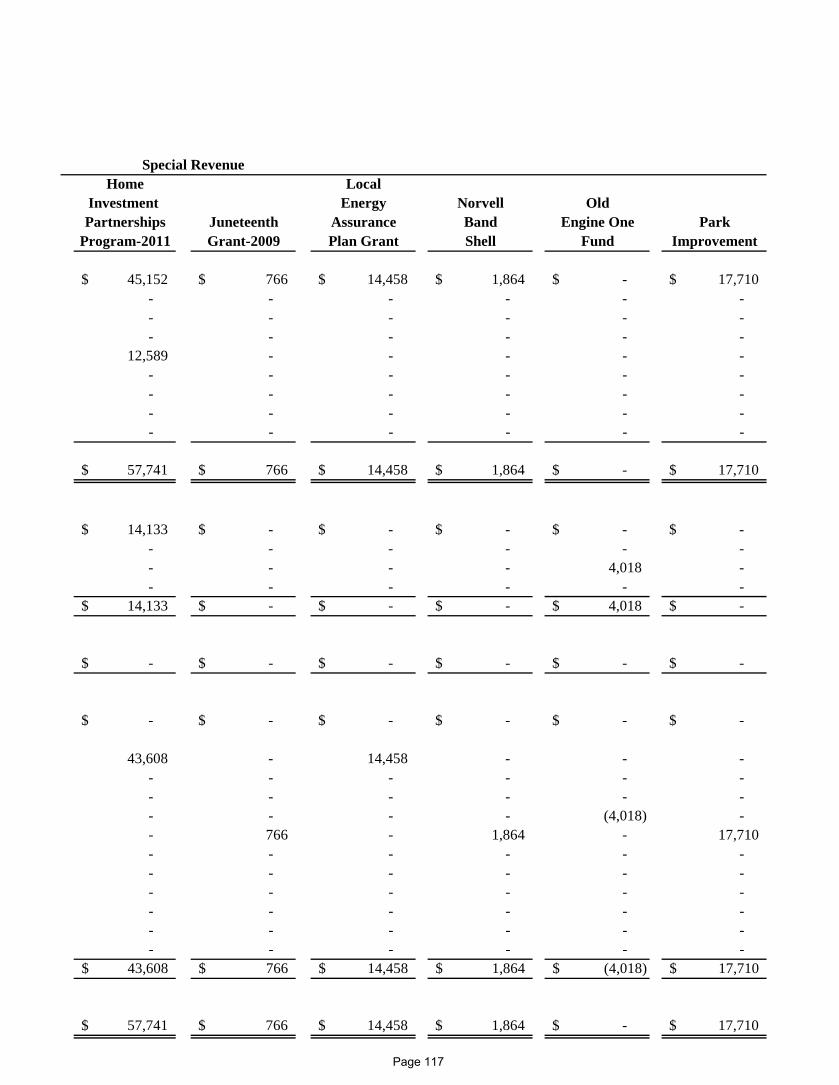
Home LocalInvestment Energy Norvell OldPartnerships Juneteenth Assurance Band Engine One Park
Program-2011 Grant-2009 Plan Grant Shell Fund Improvement
45,152$ 766$ 14,458$ 1,864$ -$ 17,710$ - - - - - - - - - - - - - - - - - -
12,589 - - - - - - - - - - - - - - - - - - - - - - - - - - - - -
57,741$ 766$ 14,458$ 1,864$ -$ 17,710$
14,133$ -$ -$ -$ -$ -$ - - - - - - - - - - 4,018 - - - - - - -
14,133$ -$ -$ -$ 4,018$ -$
-$ -$ -$ -$ -$ -$
-$ -$ -$ -$ -$ -$
43,608 - 14,458 - - - - - - - - - - - - - - - - - - - (4,018) - - 766 - 1,864 - 17,710 - - - - - - - - - - - - - - - - - - - - - - - - - - - - - - - - - - - -
43,608$ 766$ 14,458$ 1,864$ (4,018)$ 17,710$
57,741$ 766$ 14,458$ 1,864$ -$ 17,710$
Special Revenue
Page 117
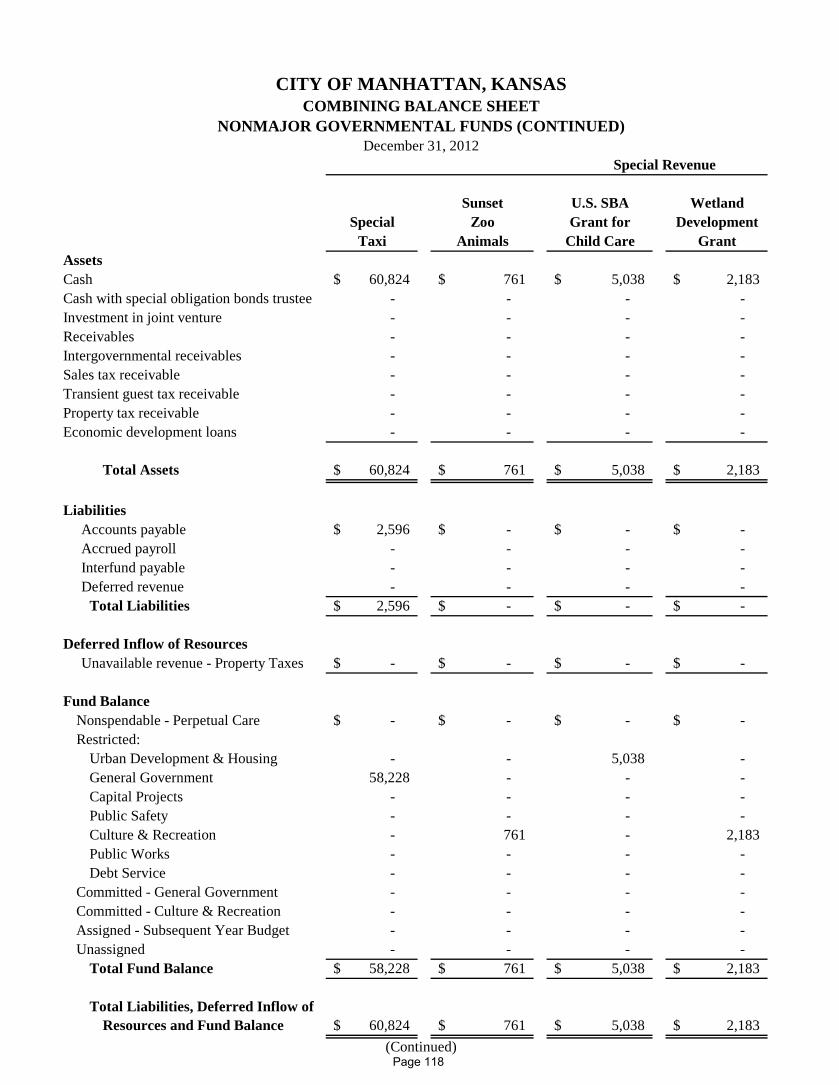
Sunset U.S. SBA WetlandSpecial Zoo Grant for Development
Taxi Animals Child Care GrantAssetsCash 60,824$ 761$ 5,038$ 2,183$ Cash with special obligation bonds trustee - - - - Investment in joint venture - - - - Receivables - - - - Intergovernmental receivables - - - - Sales tax receivable - - - - Transient guest tax receivable - - - - Property tax receivable - - - - Economic development loans - - - -
Total Assets 60,824$ 761$ 5,038$ 2,183$
LiabilitiesAccounts payable 2,596$ -$ -$ -$ Accrued payroll - - - - Interfund payable - - - - Deferred revenue - - - -
Total Liabilities 2,596$ -$ -$ -$
Deferred Inflow of ResourcesUnavailable revenue - Property Taxes -$ -$ -$ -$
Fund BalanceNonspendable - Perpetual Care -$ -$ -$ -$ Restricted:
Urban Development & Housing - - 5,038 - General Government 58,228 - - - Capital Projects - - - - Public Safety - - - - Culture & Recreation - 761 - 2,183 Public Works - - - - Debt Service - - - -
Committed - General Government - - - - Committed - Culture & Recreation - - - - Assigned - Subsequent Year Budget - - - - Unassigned - - - -
Total Fund Balance 58,228$ 761$ 5,038$ 2,183$
Total Liabilities, Deferred Inflow ofResources and Fund Balance 60,824$ 761$ 5,038$ 2,183$
(Continued)
NONMAJOR GOVERNMENTAL FUNDS (CONTINUED)December 31, 2012
CITY OF MANHATTAN, KANSASCOMBINING BALANCE SHEET
Special Revenue
Page 118
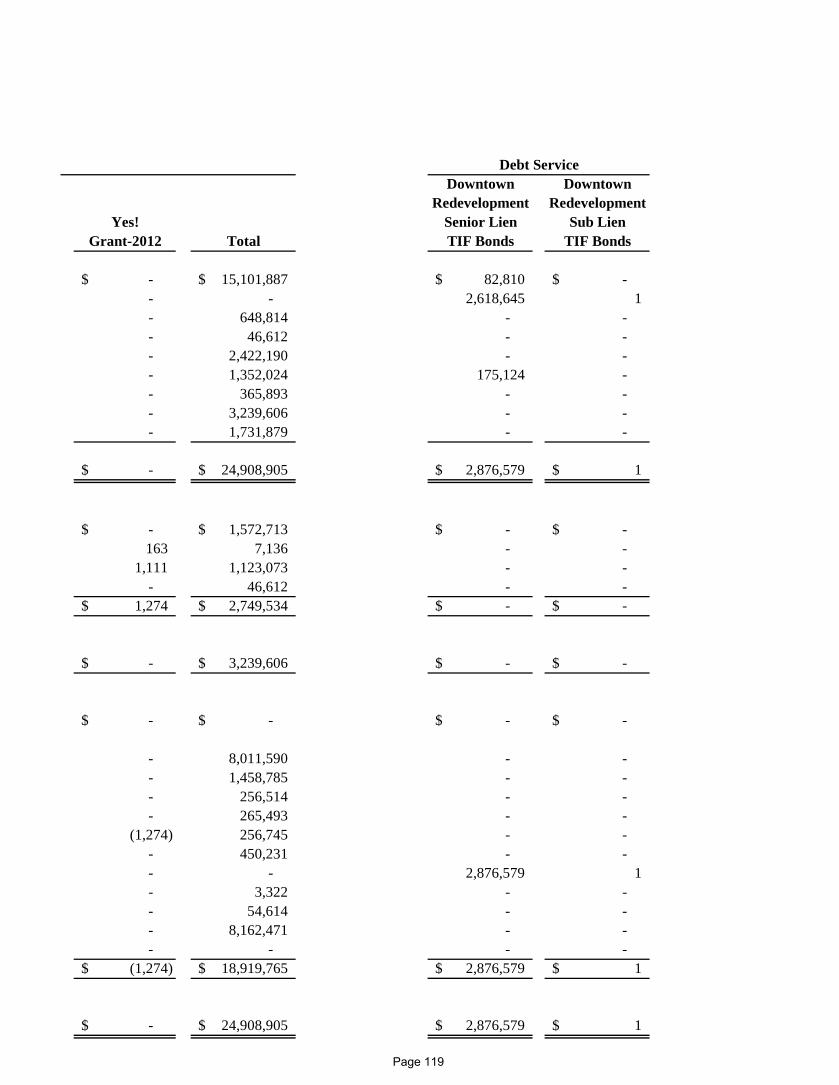
Downtown DowntownRedevelopment Redevelopment
Yes! Senior Lien Sub LienGrant-2012 Total TIF Bonds TIF Bonds
-$ 15,101,887$ 82,810$ -$ - - 2,618,645 1 - 648,814 - - - 46,612 - - - 2,422,190 - - - 1,352,024 175,124 - - 365,893 - - - 3,239,606 - - - 1,731,879 - -
-$ 24,908,905$ 2,876,579$ 1$
-$ 1,572,713$ -$ -$ 163 7,136 - -
1,111 1,123,073 - - - 46,612 - -
1,274$ 2,749,534$ -$ -$
-$ 3,239,606$ -$ -$
-$ -$ -$ -$
- 8,011,590 - - - 1,458,785 - - - 256,514 - - - 265,493 - -
(1,274) 256,745 - - - 450,231 - - - - 2,876,579 1 - 3,322 - - - 54,614 - - - 8,162,471 - - - - - -
(1,274)$ 18,919,765$ 2,876,579$ 1$
-$ 24,908,905$ 2,876,579$ 1$
Debt Service
Page 119
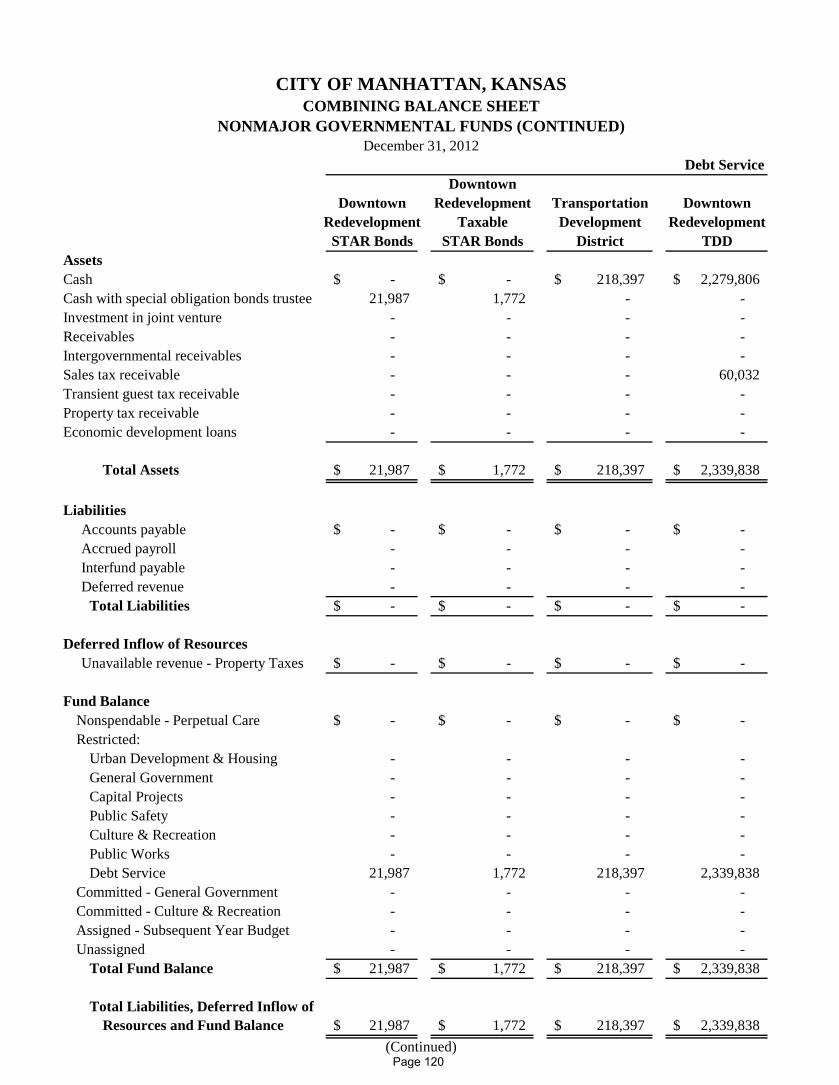
DowntownDowntown Redevelopment Transportation Downtown
Redevelopment Taxable Development RedevelopmentSTAR Bonds STAR Bonds District TDD
AssetsCash -$ -$ 218,397$ 2,279,806$ Cash with special obligation bonds trustee 21,987 1,772 - - Investment in joint venture - - - - Receivables - - - - Intergovernmental receivables - - - - Sales tax receivable - - - 60,032 Transient guest tax receivable - - - - Property tax receivable - - - - Economic development loans - - - -
Total Assets 21,987$ 1,772$ 218,397$ 2,339,838$
LiabilitiesAccounts payable -$ -$ -$ -$ Accrued payroll - - - - Interfund payable - - - - Deferred revenue - - - -
Total Liabilities -$ -$ -$ -$
Deferred Inflow of ResourcesUnavailable revenue - Property Taxes -$ -$ -$ -$
Fund BalanceNonspendable - Perpetual Care -$ -$ -$ -$ Restricted:
Urban Development & Housing - - - - General Government - - - - Capital Projects - - - - Public Safety - - - - Culture & Recreation - - - - Public Works - - - - Debt Service 21,987 1,772 218,397 2,339,838
Committed - General Government - - - - Committed - Culture & Recreation - - - - Assigned - Subsequent Year Budget - - - - Unassigned - - - -
Total Fund Balance 21,987$ 1,772$ 218,397$ 2,339,838$
Total Liabilities, Deferred Inflow ofResources and Fund Balance 21,987$ 1,772$ 218,397$ 2,339,838$
CITY OF MANHATTAN, KANSASCOMBINING BALANCE SHEET
NONMAJOR GOVERNMENTAL FUNDS (CONTINUED)December 31, 2012
Debt Service
(Continued)Page 120
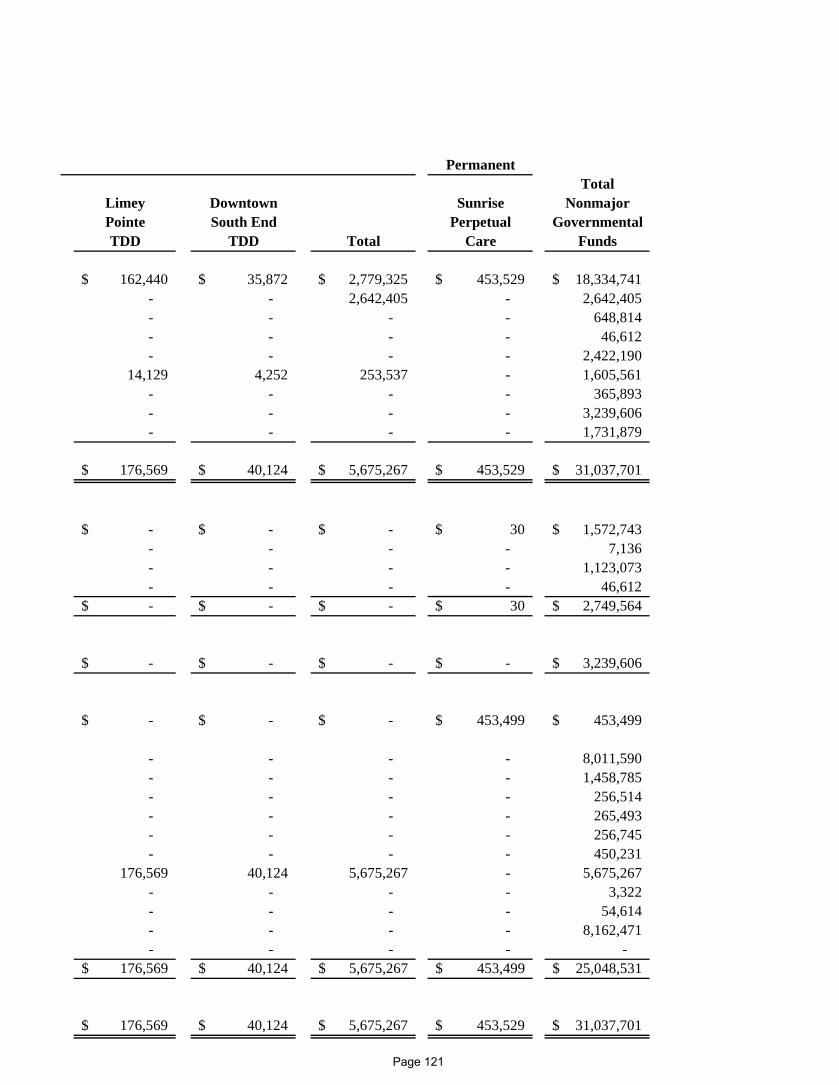
PermanentTotal
Limey Downtown Sunrise NonmajorPointe South End Perpetual GovernmentalTDD TDD Total Care Funds
162,440$ 35,872$ 2,779,325$ 453,529$ 18,334,741$ - - 2,642,405 - 2,642,405 - - - - 648,814 - - - - 46,612 - - - - 2,422,190
14,129 4,252 253,537 - 1,605,561 - - - - 365,893 - - - - 3,239,606 - - - - 1,731,879
176,569$ 40,124$ 5,675,267$ 453,529$ 31,037,701$
-$ -$ -$ 30$ 1,572,743$ - - - - 7,136 - - - - 1,123,073 - - - - 46,612 -$ -$ -$ 30$ 2,749,564$
-$ -$ -$ -$ 3,239,606$
-$ -$ -$ 453,499$ 453,499$
- - - - 8,011,590 - - - - 1,458,785 - - - - 256,514 - - - - 265,493 - - - - 256,745 - - - - 450,231
176,569 40,124 5,675,267 - 5,675,267 - - - - 3,322 - - - - 54,614 - - - - 8,162,471 - - - - -
176,569$ 40,124$ 5,675,267$ 453,499$ 25,048,531$
176,569$ 40,124$ 5,675,267$ 453,529$ 31,037,701$
Page 121
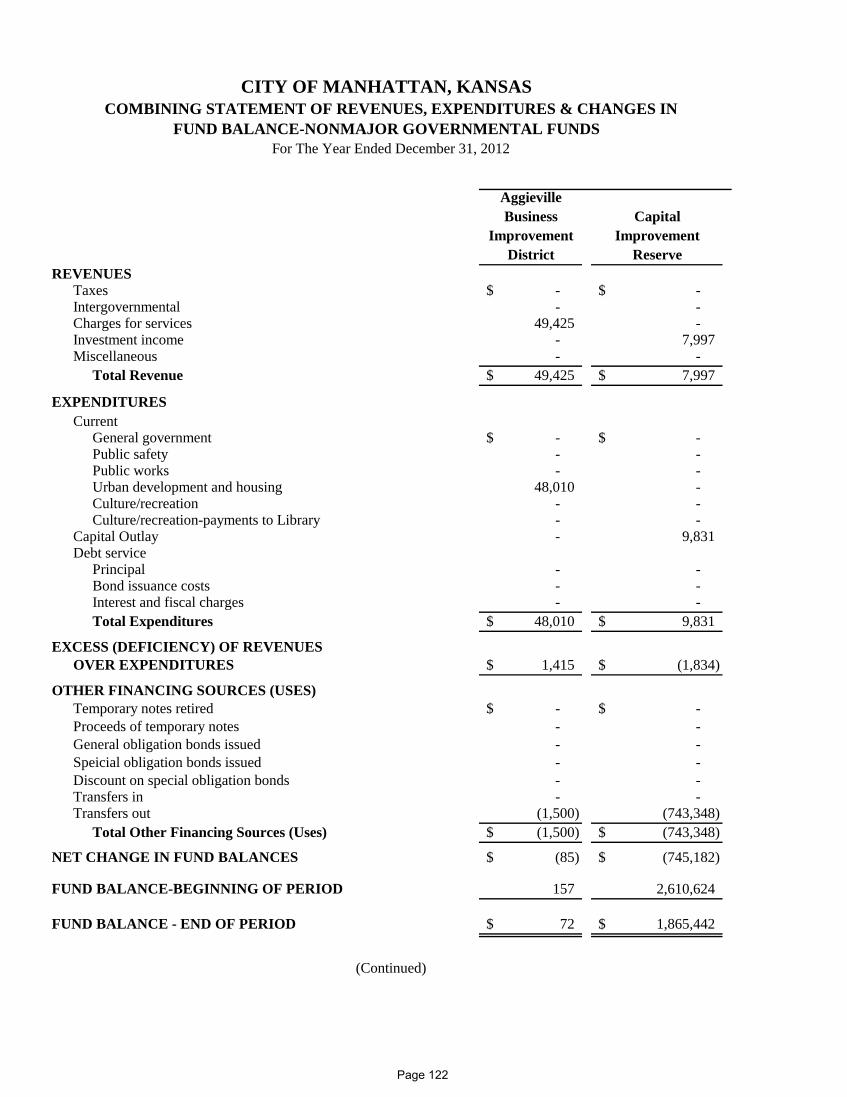
CITY OF MANHATTAN, KANSAS
AggievilleBusiness Capital
Improvement ImprovementDistrict Reserve
REVENUESTaxes -$ -$ Intergovernmental - - Charges for services 49,425 - Investment income - 7,997 Miscellaneous - -
Total Revenue 49,425$ 7,997$
EXPENDITURESCurrent
General government -$ -$ Public safety - - Public works - - Urban development and housing 48,010 - Culture/recreation - - Culture/recreation-payments to Library - -
Capital Outlay - 9,831 Debt service
Principal - - Bond issuance costs - - Interest and fiscal charges - - Total Expenditures 48,010$ 9,831$
EXCESS (DEFICIENCY) OF REVENUESOVER EXPENDITURES 1,415$ (1,834)$
OTHER FINANCING SOURCES (USES)Temporary notes retired -$ -$ Proceeds of temporary notes - - General obligation bonds issued - - Speicial obligation bonds issued - - Discount on special obligation bonds - - Transfers in - - Transfers out (1,500) (743,348)
Total Other Financing Sources (Uses) (1,500)$ (743,348)$
NET CHANGE IN FUND BALANCES (85)$ (745,182)$
FUND BALANCE-BEGINNING OF PERIOD 157 2,610,624
FUND BALANCE - END OF PERIOD 72$ 1,865,442$
(Continued)
FUND BALANCE-NONMAJOR GOVERNMENTAL FUNDS COMBINING STATEMENT OF REVENUES, EXPENDITURES & CHANGES IN
For The Year Ended December 31, 2012
Page 122
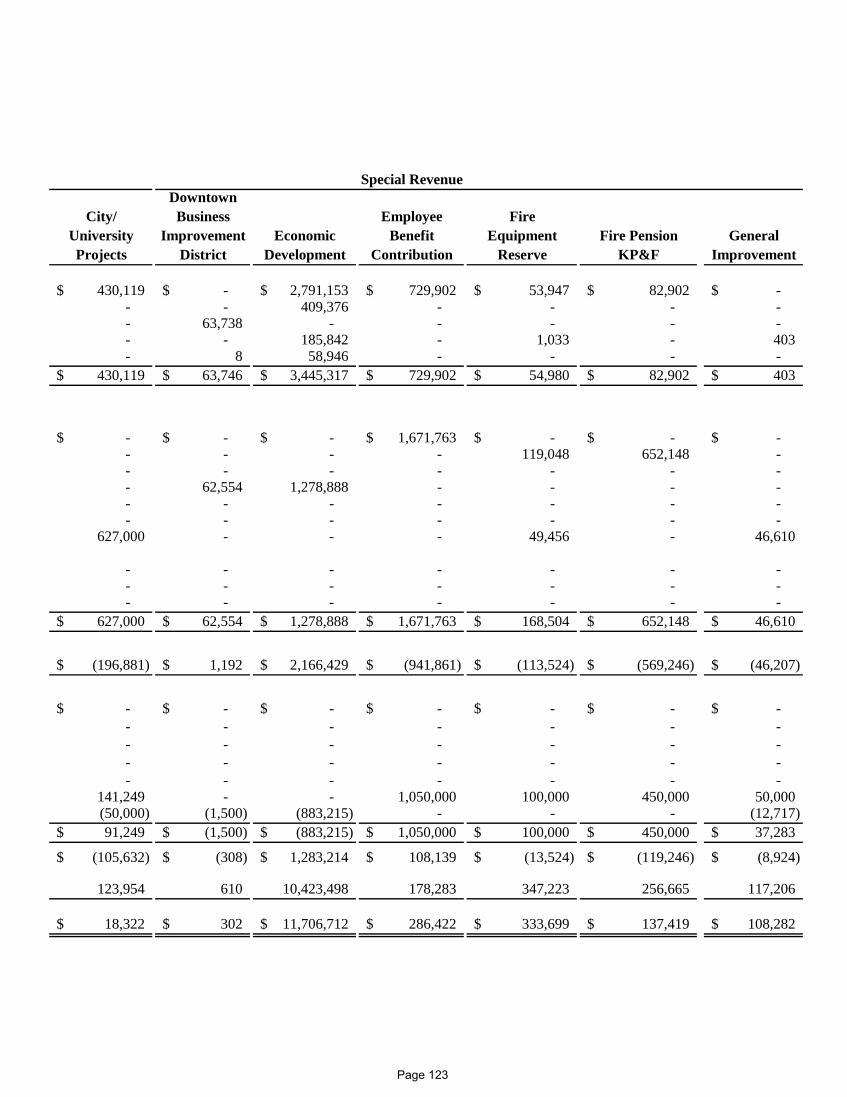
Special RevenueDowntown
City/ Business Employee FireUniversity Improvement Economic Benefit Equipment Fire Pension GeneralProjects District Development Contribution Reserve KP&F Improvement
430,119$ -$ 2,791,153$ 729,902$ 53,947$ 82,902$ -$ - - 409,376 - - - - - 63,738 - - - - - - - 185,842 - 1,033 - 403 - 8 58,946 - - - -
430,119$ 63,746$ 3,445,317$ 729,902$ 54,980$ 82,902$ 403$
-$ -$ -$ 1,671,763$ -$ -$ -$ - - - - 119,048 652,148 - - - - - - - - - 62,554 1,278,888 - - - - - - - - - - - - - - - - - -
627,000 - - - 49,456 - 46,610
- - - - - - - - - - - - - - - - - - - - -
627,000$ 62,554$ 1,278,888$ 1,671,763$ 168,504$ 652,148$ 46,610$
(196,881)$ 1,192$ 2,166,429$ (941,861)$ (113,524)$ (569,246)$ (46,207)$
-$ -$ -$ -$ -$ -$ -$ - - - - - - - - - - - - - - - - - - - - - - - - - - - -
141,249 - - 1,050,000 100,000 450,000 50,000 (50,000) (1,500) (883,215) - - - (12,717) 91,249$ (1,500)$ (883,215)$ 1,050,000$ 100,000$ 450,000$ 37,283$
(105,632)$ (308)$ 1,283,214$ 108,139$ (13,524)$ (119,246)$ (8,924)$
123,954 610 10,423,498 178,283 347,223 256,665 117,206
18,322$ 302$ 11,706,712$ 286,422$ 333,699$ 137,419$ 108,282$
Page 123
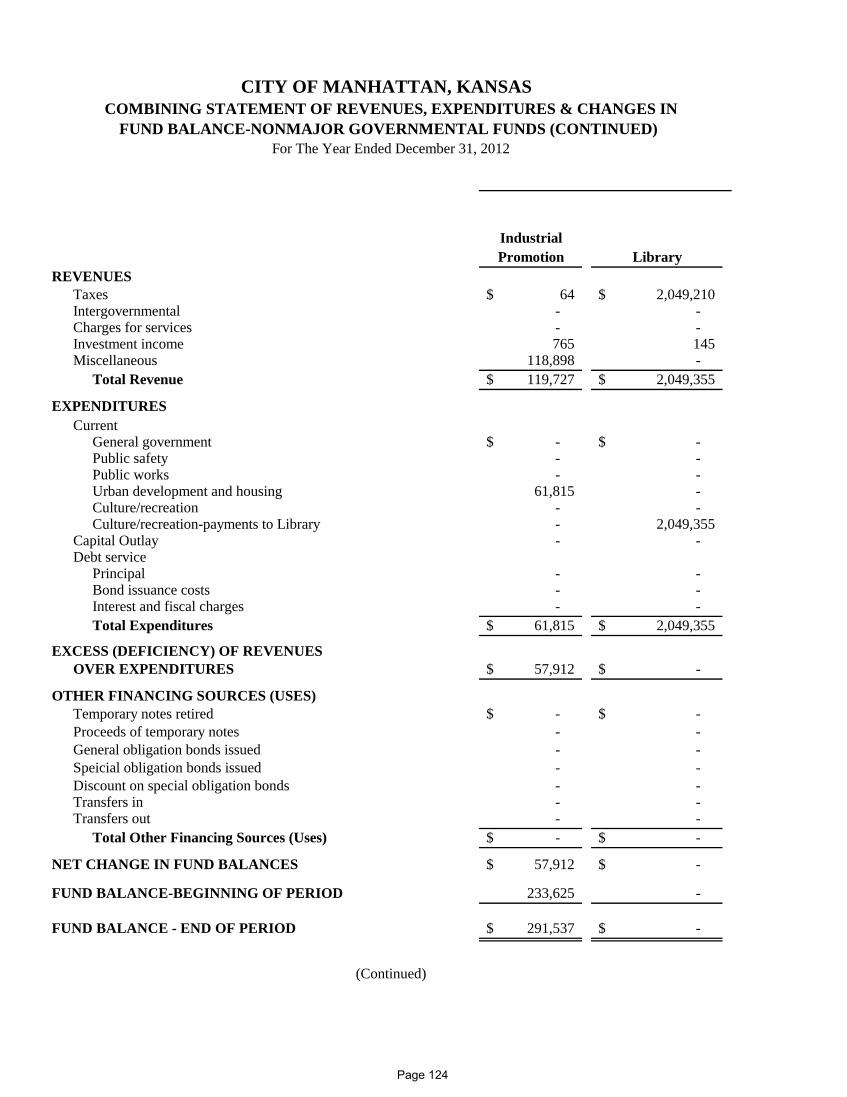
CITY OF MANHATTAN, KANSAS
IndustrialPromotion Library
REVENUESTaxes 64$ 2,049,210$ Intergovernmental - - Charges for services - - Investment income 765 145 Miscellaneous 118,898 -
Total Revenue 119,727$ 2,049,355$
EXPENDITURESCurrent
General government -$ -$ Public safety - - Public works - - Urban development and housing 61,815 - Culture/recreation - - Culture/recreation-payments to Library - 2,049,355
Capital Outlay - - Debt service
Principal - - Bond issuance costs - - Interest and fiscal charges - - Total Expenditures 61,815$ 2,049,355$
EXCESS (DEFICIENCY) OF REVENUESOVER EXPENDITURES 57,912$ -$
OTHER FINANCING SOURCES (USES)Temporary notes retired -$ -$ Proceeds of temporary notes - - General obligation bonds issued - - Speicial obligation bonds issued - - Discount on special obligation bonds - - Transfers in - - Transfers out - -
Total Other Financing Sources (Uses) -$ -$
NET CHANGE IN FUND BALANCES 57,912$ -$
FUND BALANCE-BEGINNING OF PERIOD 233,625 -
FUND BALANCE - END OF PERIOD 291,537$ -$
For The Year Ended December 31, 2012
COMBINING STATEMENT OF REVENUES, EXPENDITURES & CHANGES IN
(Continued)
FUND BALANCE-NONMAJOR GOVERNMENTAL FUNDS (CONTINUED)
Page 124
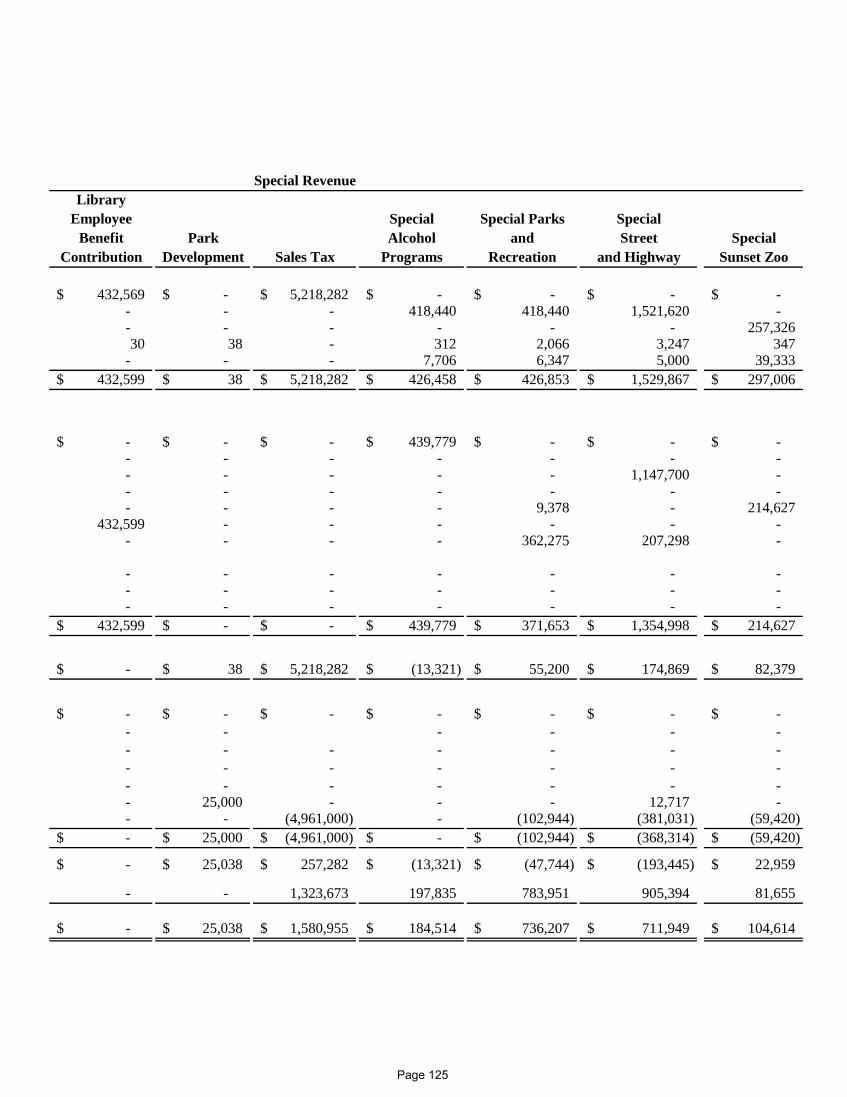
Special RevenueLibrary
Employee Special Special Parks SpecialBenefit Park Alcohol and Street Special
Contribution Development Sales Tax Programs Recreation and Highway Sunset Zoo
432,569$ -$ 5,218,282$ -$ -$ -$ -$ - - - 418,440 418,440 1,521,620 - - - - - - - 257,326 30 38 - 312 2,066 3,247 347
- - - 7,706 6,347 5,000 39,333 432,599$ 38$ 5,218,282$ 426,458$ 426,853$ 1,529,867$ 297,006$
-$ -$ -$ 439,779$ -$ -$ -$ - - - - - - - - - - - - 1,147,700 - - - - - - - - - - - - 9,378 - 214,627
432,599 - - - - - - - - - - 362,275 207,298 -
- - - - - - - - - - - - - - - - - - - - -
432,599$ -$ -$ 439,779$ 371,653$ 1,354,998$ 214,627$
-$ 38$ 5,218,282$ (13,321)$ 55,200$ 174,869$ 82,379$
-$ -$ -$ -$ -$ -$ -$ - - - - - - - - - - - - - - - - - - - - - - - - - - - - 25,000 - - - 12,717 - - - (4,961,000) - (102,944) (381,031) (59,420) -$ 25,000$ (4,961,000)$ -$ (102,944)$ (368,314)$ (59,420)$
-$ 25,038$ 257,282$ (13,321)$ (47,744)$ (193,445)$ 22,959$
- - 1,323,673 197,835 783,951 905,394 81,655
-$ 25,038$ 1,580,955$ 184,514$ 736,207$ 711,949$ 104,614$
Page 125
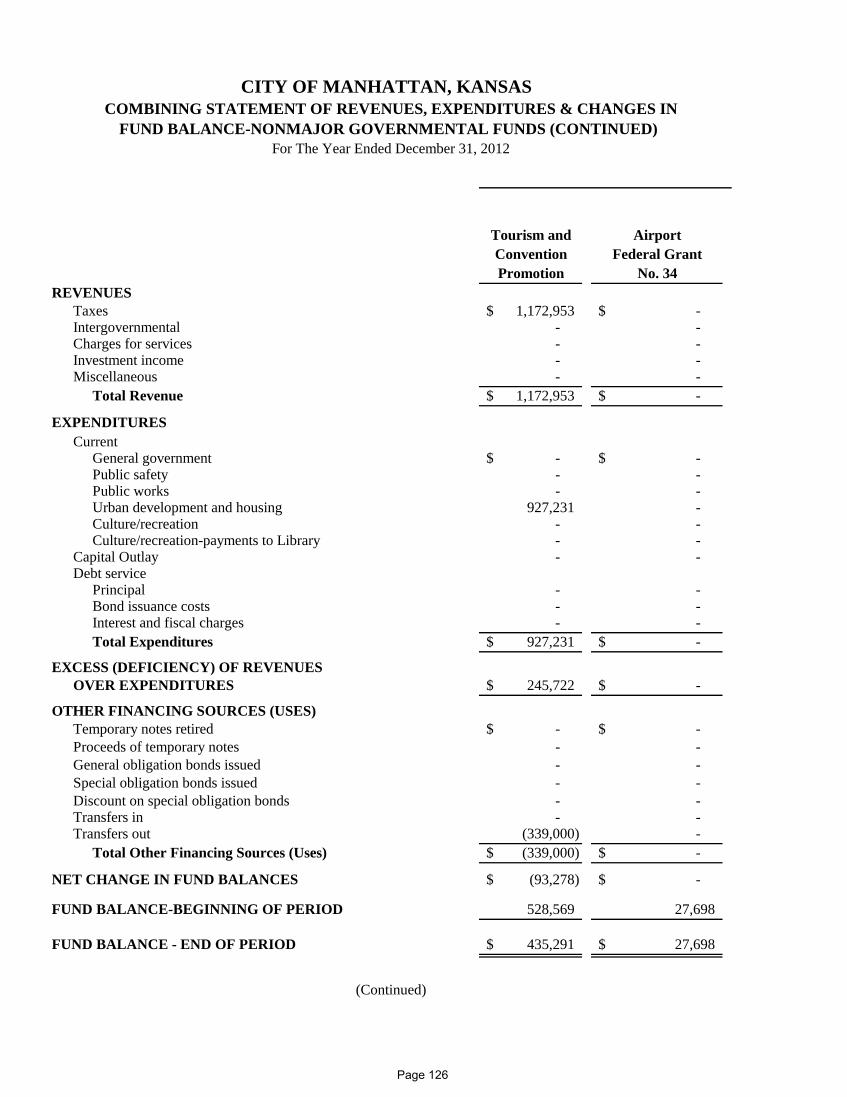
CITY OF MANHATTAN, KANSAS
Tourism and AirportConvention Federal GrantPromotion No. 34
REVENUESTaxes 1,172,953$ -$ Intergovernmental - - Charges for services - - Investment income - - Miscellaneous - -
Total Revenue 1,172,953$ -$
EXPENDITURESCurrent
General government -$ -$ Public safety - - Public works - - Urban development and housing 927,231 - Culture/recreation - - Culture/recreation-payments to Library - -
Capital Outlay - - Debt service
Principal - - Bond issuance costs - -
Interest and fiscal charges - - Total Expenditures 927,231$ -$
EXCESS (DEFICIENCY) OF REVENUESOVER EXPENDITURES 245,722$ -$
OTHER FINANCING SOURCES (USES)Temporary notes retired -$ -$ Proceeds of temporary notes - - General obligation bonds issued - - Special obligation bonds issued - - Discount on special obligation bonds - - Transfers in - - Transfers out (339,000) -
Total Other Financing Sources (Uses) (339,000)$ -$
NET CHANGE IN FUND BALANCES (93,278)$ -$
FUND BALANCE-BEGINNING OF PERIOD 528,569 27,698
FUND BALANCE - END OF PERIOD 435,291$ 27,698$
COMBINING STATEMENT OF REVENUES, EXPENDITURES & CHANGES IN
(Continued)
For The Year Ended December 31, 2012 FUND BALANCE-NONMAJOR GOVERNMENTAL FUNDS (CONTINUED)
Page 126
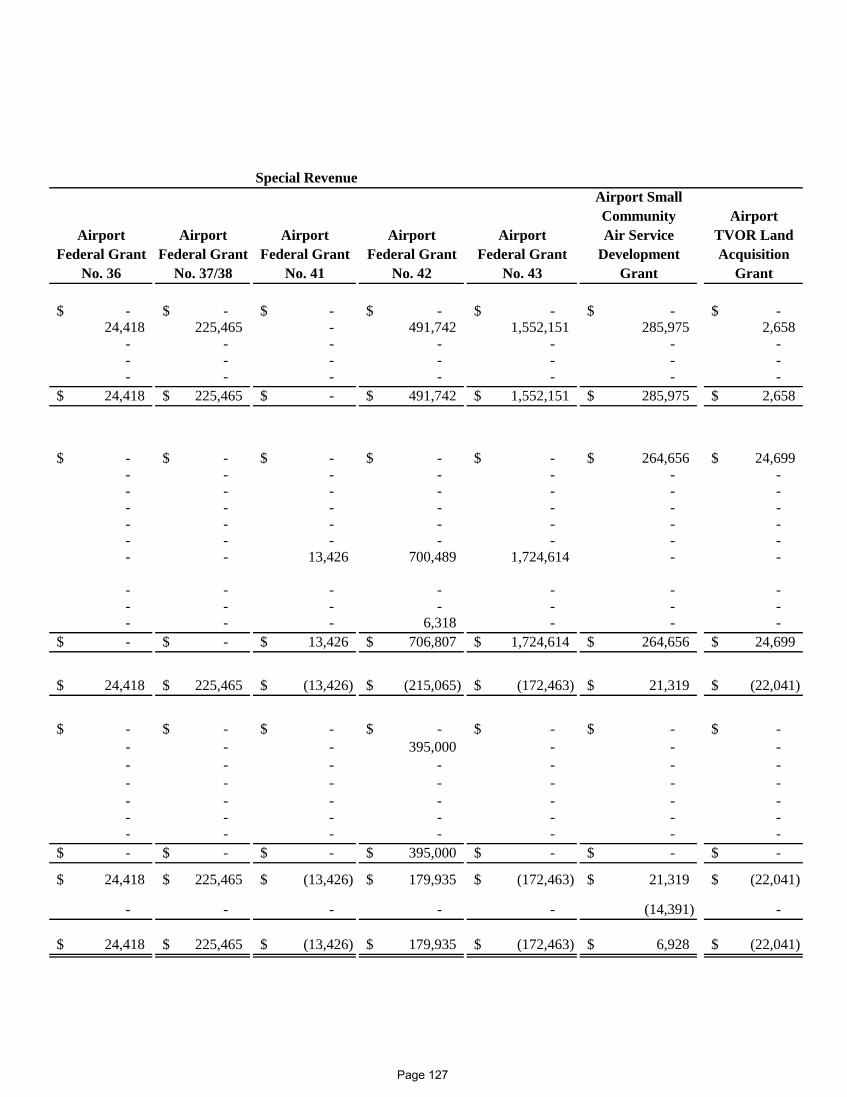
Special RevenueAirport SmallCommunity Airport
Airport Airport Airport Airport Airport Air Service TVOR LandFederal Grant Federal Grant Federal Grant Federal Grant Federal Grant Development Acquisition
No. 36 No. 37/38 No. 41 No. 42 No. 43 Grant Grant
-$ -$ -$ -$ -$ -$ -$ 24,418 225,465 - 491,742 1,552,151 285,975 2,658
- - - - - - - - - - - - - - - - - - - - -
24,418$ 225,465$ -$ 491,742$ 1,552,151$ 285,975$ 2,658$
-$ -$ -$ -$ -$ 264,656$ 24,699$ - - - - - - - - - - - - - - - - - - - - - - - - - - - - - - - - - - - - - 13,426 700,489 1,724,614 - -
- - - - - - - - - - - - - - - - - 6,318 - - - -$ -$ 13,426$ 706,807$ 1,724,614$ 264,656$ 24,699$
24,418$ 225,465$ (13,426)$ (215,065)$ (172,463)$ 21,319$ (22,041)$
-$ -$ -$ -$ -$ -$ -$ - - - 395,000 - - - - - - - - - - - - - - - - - - - - - - - - - - - - - - - - - - - - - - -$ -$ -$ 395,000$ -$ -$ -$
24,418$ 225,465$ (13,426)$ 179,935$ (172,463)$ 21,319$ (22,041)$
- - - - - (14,391) -
24,418$ 225,465$ (13,426)$ 179,935$ (172,463)$ 6,928$ (22,041)$
Page 127
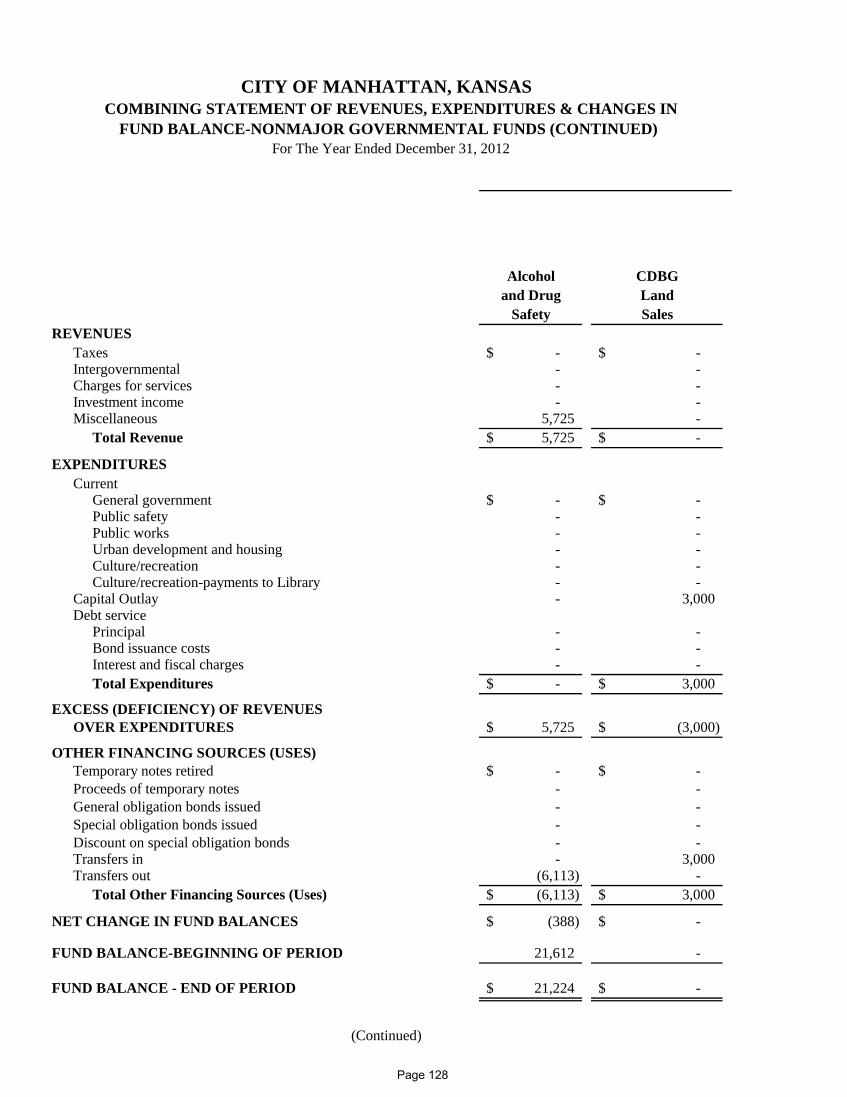
CITY OF MANHATTAN, KANSAS
Alcohol CDBGand Drug Land
Safety SalesREVENUES
Taxes -$ -$ Intergovernmental - - Charges for services - - Investment income - - Miscellaneous 5,725 -
Total Revenue 5,725$ -$
EXPENDITURESCurrent
General government -$ -$ Public safety - - Public works - - Urban development and housing - - Culture/recreation - - Culture/recreation-payments to Library - -
Capital Outlay - 3,000 Debt service
Principal - - Bond issuance costs - - Interest and fiscal charges - - Total Expenditures -$ 3,000$
EXCESS (DEFICIENCY) OF REVENUESOVER EXPENDITURES 5,725$ (3,000)$
OTHER FINANCING SOURCES (USES)Temporary notes retired -$ -$ Proceeds of temporary notes - - General obligation bonds issued - - Special obligation bonds issued - - Discount on special obligation bonds - - Transfers in - 3,000 Transfers out (6,113) -
Total Other Financing Sources (Uses) (6,113)$ 3,000$
NET CHANGE IN FUND BALANCES (388)$ -$
FUND BALANCE-BEGINNING OF PERIOD 21,612 -
FUND BALANCE - END OF PERIOD 21,224$ -$
(Continued)
FUND BALANCE-NONMAJOR GOVERNMENTAL FUNDS (CONTINUED)COMBINING STATEMENT OF REVENUES, EXPENDITURES & CHANGES IN
For The Year Ended December 31, 2012
Page 128
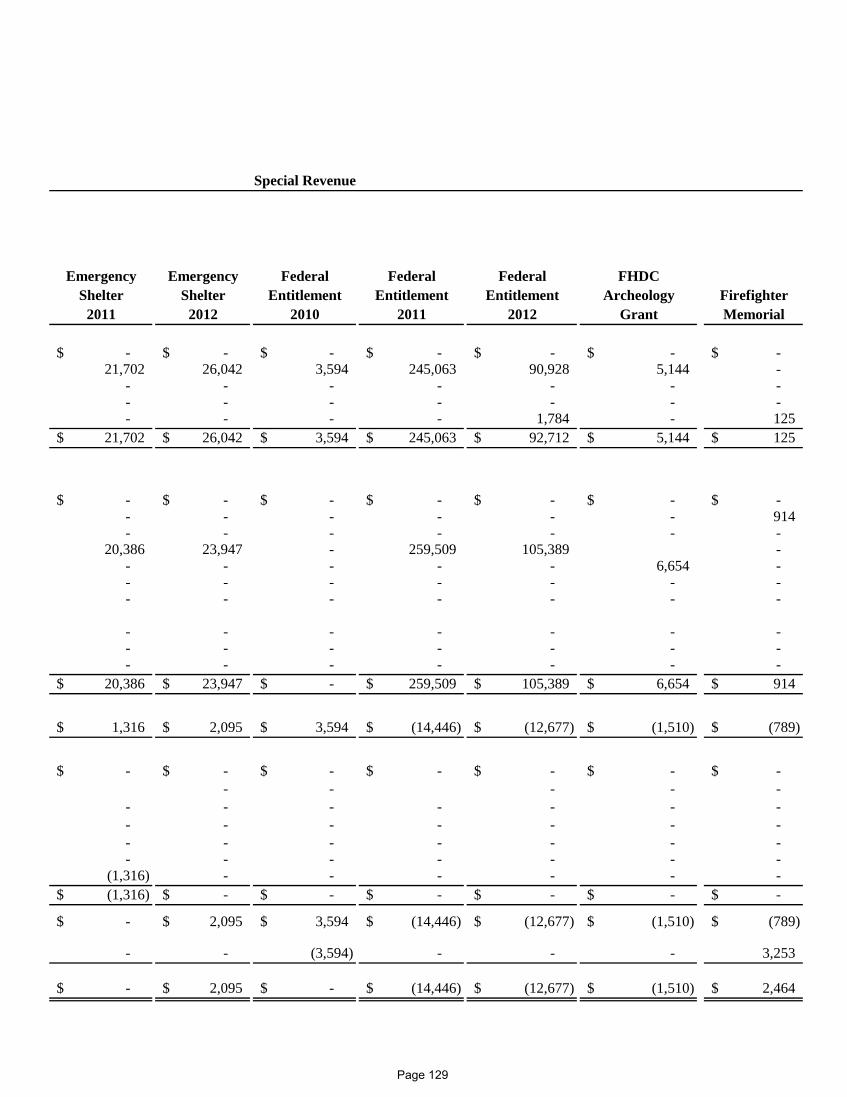
Special Revenue
Emergency Emergency Federal Federal Federal FHDCShelter Shelter Entitlement Entitlement Entitlement Archeology Firefighter
2011 2012 2010 2011 2012 Grant Memorial
-$ -$ -$ -$ -$ -$ -$ 21,702 26,042 3,594 245,063 90,928 5,144 -
- - - - - - - - - - - - - - - - - - 1,784 - 125
21,702$ 26,042$ 3,594$ 245,063$ 92,712$ 5,144$ 125$
-$ -$ -$ -$ -$ -$ -$ - - - - - - 914 - - - - - - -
20,386 23,947 - 259,509 105,389 - - - - - - 6,654 - - - - - - - - - - - - - - -
- - - - - - - - - - - - - - - - - - - - -
20,386$ 23,947$ -$ 259,509$ 105,389$ 6,654$ 914$
1,316$ 2,095$ 3,594$ (14,446)$ (12,677)$ (1,510)$ (789)$
-$ -$ -$ -$ -$ -$ -$ - - - - -
- - - - - - - - - - - - - - - - - - - - - - - - - - - -
(1,316) - - - - - - (1,316)$ -$ -$ -$ -$ -$ -$
-$ 2,095$ 3,594$ (14,446)$ (12,677)$ (1,510)$ (789)$
- - (3,594) - - - 3,253
-$ 2,095$ -$ (14,446)$ (12,677)$ (1,510)$ 2,464$
Page 129
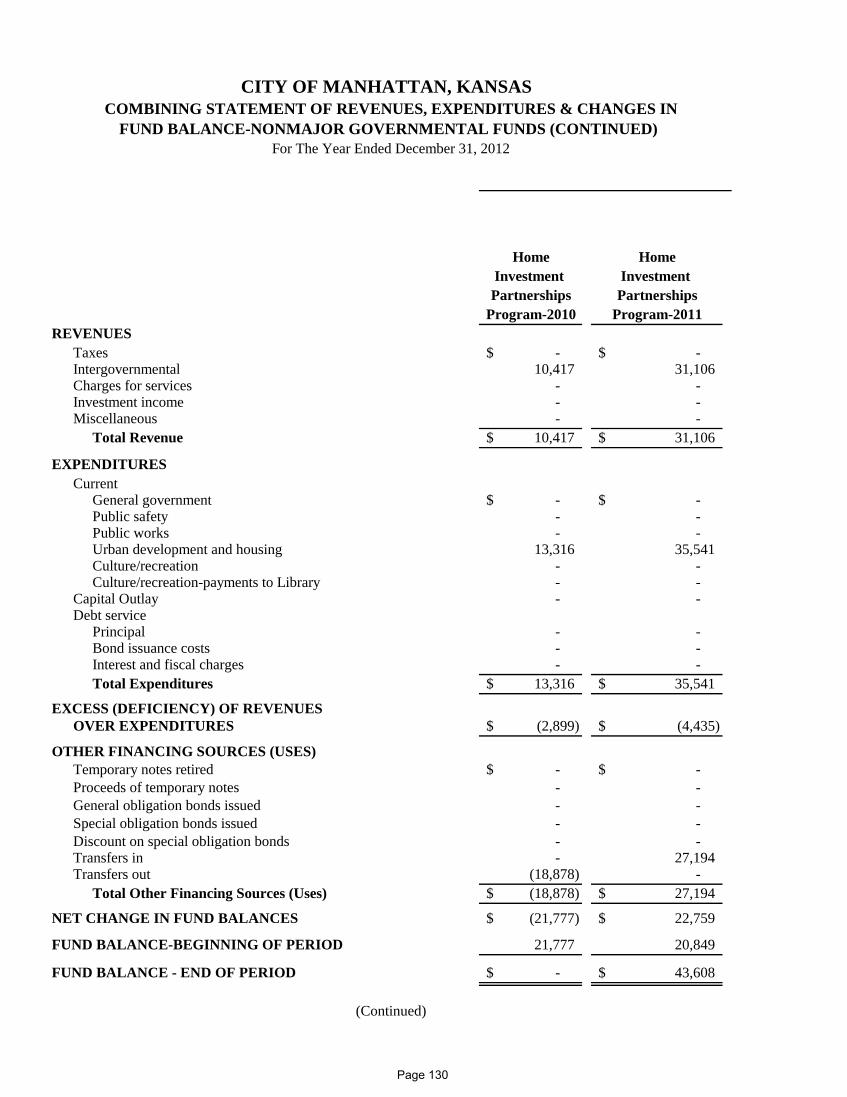
CITY OF MANHATTAN, KANSAS
Home HomeInvestment Investment Partnerships Partnerships
Program-2010 Program-2011REVENUES
Taxes -$ -$ Intergovernmental 10,417 31,106 Charges for services - - Investment income - - Miscellaneous - -
Total Revenue 10,417$ 31,106$
EXPENDITURESCurrent
General government -$ -$ Public safety - - Public works - - Urban development and housing 13,316 35,541 Culture/recreation - - Culture/recreation-payments to Library - -
Capital Outlay - - Debt service
Principal - - Bond issuance costs - - Interest and fiscal charges - - Total Expenditures 13,316$ 35,541$
EXCESS (DEFICIENCY) OF REVENUESOVER EXPENDITURES (2,899)$ (4,435)$
OTHER FINANCING SOURCES (USES)Temporary notes retired -$ -$ Proceeds of temporary notes - - General obligation bonds issued - - Special obligation bonds issued - - Discount on special obligation bonds - - Transfers in - 27,194 Transfers out (18,878) -
Total Other Financing Sources (Uses) (18,878)$ 27,194$
NET CHANGE IN FUND BALANCES (21,777)$ 22,759$
FUND BALANCE-BEGINNING OF PERIOD 21,777 20,849
FUND BALANCE - END OF PERIOD -$ 43,608$
COMBINING STATEMENT OF REVENUES, EXPENDITURES & CHANGES IN
(Continued)
For The Year Ended December 31, 2012
FUND BALANCE-NONMAJOR GOVERNMENTAL FUNDS (CONTINUED)
Page 130
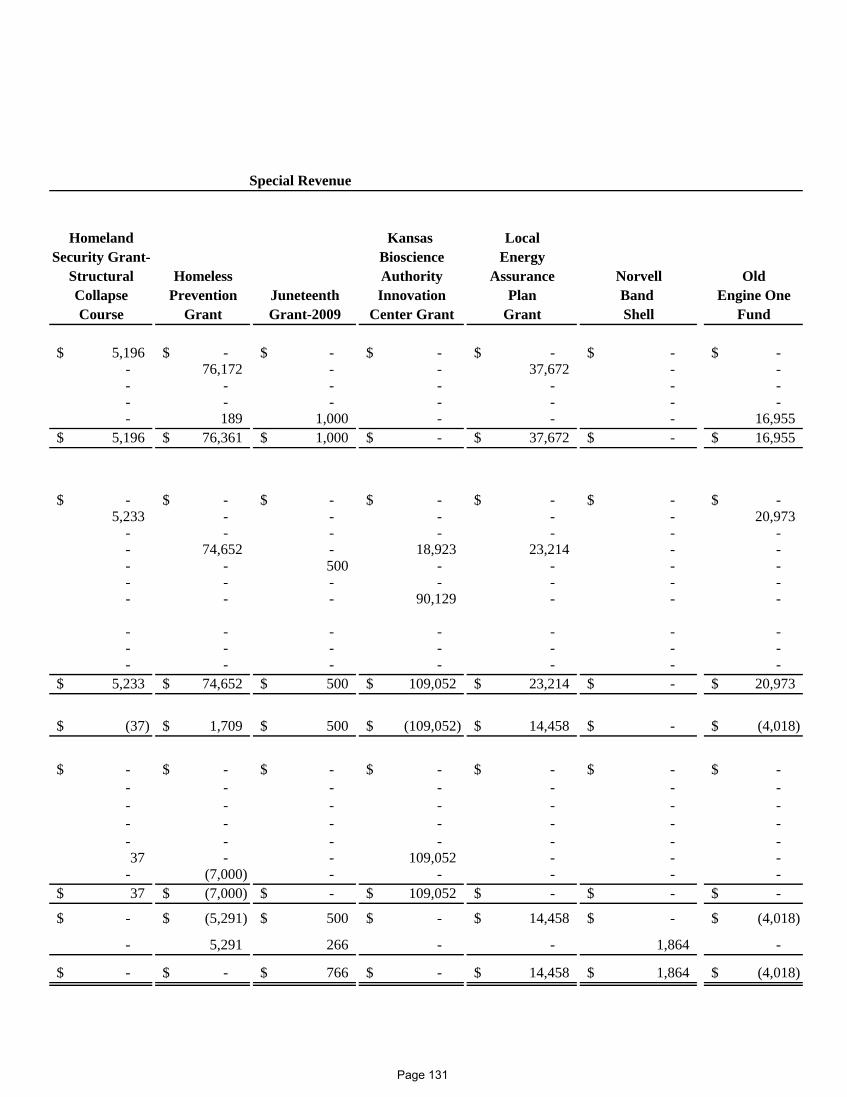
Homeland Kansas LocalSecurity Grant- Bioscience Energy
Structural Homeless Authority Assurance Norvell OldCollapse Prevention Juneteenth Innovation Plan Band Engine OneCourse Grant Grant-2009 Center Grant Grant Shell Fund
5,196$ -$ -$ -$ -$ -$ -$ - 76,172 - - 37,672 - - - - - - - - - - - - - - - - - 189 1,000 - - - 16,955
5,196$ 76,361$ 1,000$ -$ 37,672$ -$ 16,955$
-$ -$ -$ -$ -$ -$ -$ 5,233 - - - - - 20,973
- - - - - - - - 74,652 - 18,923 23,214 - - - - 500 - - - - - - - - - - - - - - 90,129 - - -
- - - - - - - - - - - - - - - - - - - - -
5,233$ 74,652$ 500$ 109,052$ 23,214$ -$ 20,973$
(37)$ 1,709$ 500$ (109,052)$ 14,458$ -$ (4,018)$
-$ -$ -$ -$ -$ -$ -$ - - - - - - - - - - - - - - - - - - - - - - - - - - - - 37 - - 109,052 - - -
- (7,000) - - - - - 37$ (7,000)$ -$ 109,052$ -$ -$ -$
-$ (5,291)$ 500$ -$ 14,458$ -$ (4,018)$
- 5,291 266 - - 1,864 -
-$ -$ 766$ -$ 14,458$ 1,864$ (4,018)$
Special Revenue
Page 131
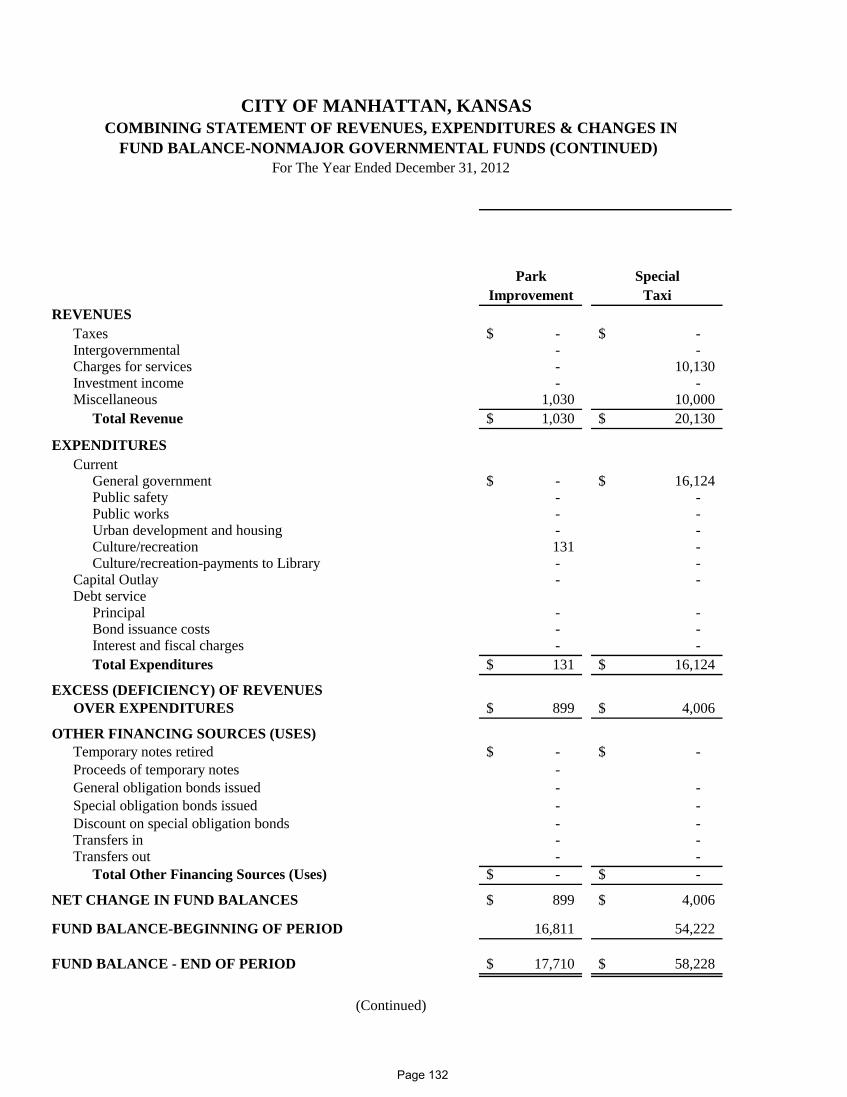
CITY OF MANHATTAN, KANSAS
Park SpecialImprovement Taxi
REVENUESTaxes -$ -$ Intergovernmental - - Charges for services - 10,130 Investment income - - Miscellaneous 1,030 10,000
Total Revenue 1,030$ 20,130$
EXPENDITURESCurrent
General government -$ 16,124$ Public safety - - Public works - - Urban development and housing - - Culture/recreation 131 - Culture/recreation-payments to Library - -
Capital Outlay - - Debt service
Principal - - Bond issuance costs - - Interest and fiscal charges - - Total Expenditures 131$ 16,124$
EXCESS (DEFICIENCY) OF REVENUESOVER EXPENDITURES 899$ 4,006$
OTHER FINANCING SOURCES (USES)Temporary notes retired -$ -$ Proceeds of temporary notes - General obligation bonds issued - - Special obligation bonds issued - - Discount on special obligation bonds - - Transfers in - - Transfers out - -
Total Other Financing Sources (Uses) -$ -$
NET CHANGE IN FUND BALANCES 899$ 4,006$
FUND BALANCE-BEGINNING OF PERIOD 16,811 54,222
FUND BALANCE - END OF PERIOD 17,710$ 58,228$
COMBINING STATEMENT OF REVENUES, EXPENDITURES & CHANGES IN
(Continued)
For The Year Ended December 31, 2012 FUND BALANCE-NONMAJOR GOVERNMENTAL FUNDS (CONTINUED)
Page 132
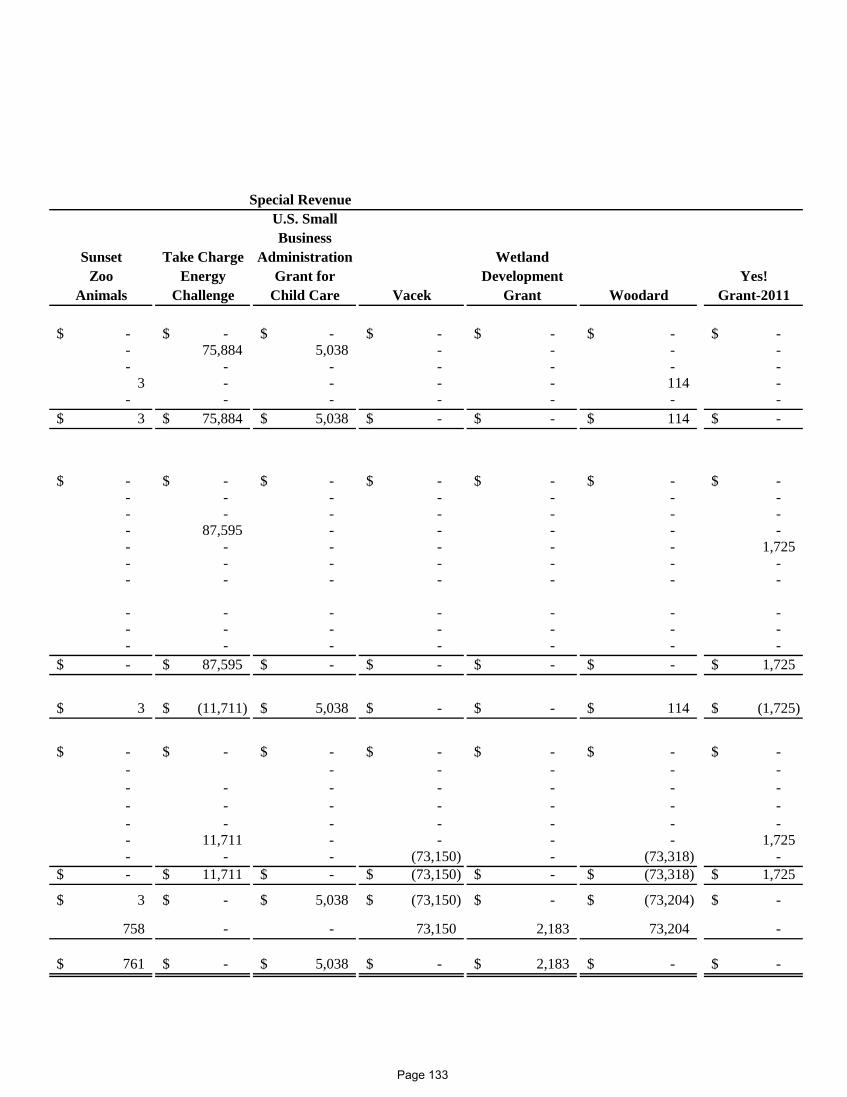
U.S. SmallBusiness
Sunset Take Charge Administration WetlandZoo Energy Grant for Development Yes!
Animals Challenge Child Care Vacek Grant Woodard Grant-2011
-$ -$ -$ -$ -$ -$ -$ - 75,884 5,038 - - - - - - - - - - -
3 - - - - 114 - - - - - - - -
3$ 75,884$ 5,038$ -$ -$ 114$ -$
-$ -$ -$ -$ -$ -$ -$ - - - - - - - - - - - - - - - 87,595 - - - - - - - - - - - 1,725 - - - - - - - - - - - - - -
- - - - - - - - - - - - - - - - - - - - - -$ 87,595$ -$ -$ -$ -$ 1,725$
3$ (11,711)$ 5,038$ -$ -$ 114$ (1,725)$
-$ -$ -$ -$ -$ -$ -$ - - - - - - - - - - - - - - - - - - - - - - - - - - - - 11,711 - - - - 1,725 - - - (73,150) - (73,318) - -$ 11,711$ -$ (73,150)$ -$ (73,318)$ 1,725$
3$ -$ 5,038$ (73,150)$ -$ (73,204)$ -$
758 - - 73,150 2,183 73,204 -
761$ -$ 5,038$ -$ 2,183$ -$ -$
Special Revenue
Page 133
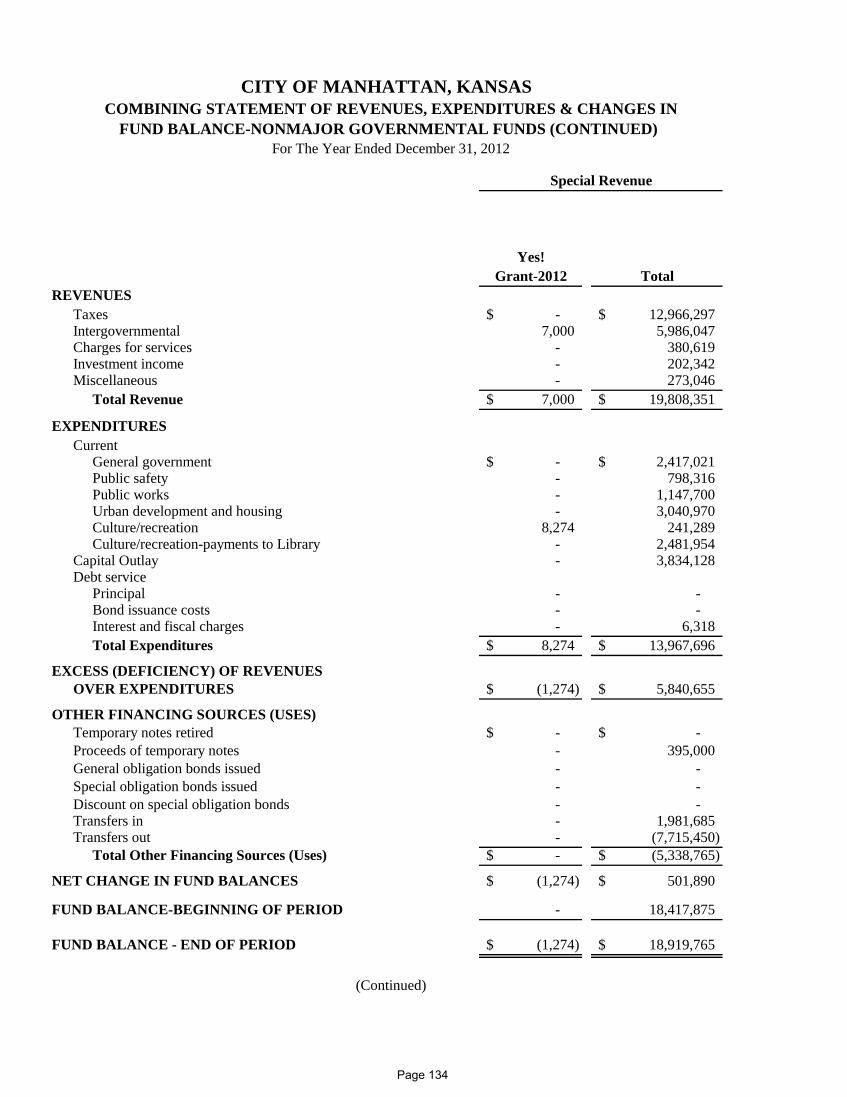
CITY OF MANHATTAN, KANSAS
Yes!Grant-2012 Total
REVENUESTaxes -$ 12,966,297$ Intergovernmental 7,000 5,986,047 Charges for services - 380,619 Investment income - 202,342 Miscellaneous - 273,046
Total Revenue 7,000$ 19,808,351$
EXPENDITURESCurrent
General government -$ 2,417,021$ Public safety - 798,316 Public works - 1,147,700 Urban development and housing - 3,040,970 Culture/recreation 8,274 241,289 Culture/recreation-payments to Library - 2,481,954
Capital Outlay - 3,834,128 Debt service
Principal - - Bond issuance costs - - Interest and fiscal charges - 6,318 Total Expenditures 8,274$ 13,967,696$
EXCESS (DEFICIENCY) OF REVENUESOVER EXPENDITURES (1,274)$ 5,840,655$
OTHER FINANCING SOURCES (USES)Temporary notes retired -$ -$ Proceeds of temporary notes - 395,000 General obligation bonds issued - - Special obligation bonds issued - - Discount on special obligation bonds - - Transfers in - 1,981,685 Transfers out - (7,715,450)
Total Other Financing Sources (Uses) -$ (5,338,765)$
NET CHANGE IN FUND BALANCES (1,274)$ 501,890$
FUND BALANCE-BEGINNING OF PERIOD - 18,417,875
FUND BALANCE - END OF PERIOD (1,274)$ 18,919,765$
COMBINING STATEMENT OF REVENUES, EXPENDITURES & CHANGES IN FUND BALANCE-NONMAJOR GOVERNMENTAL FUNDS (CONTINUED)
For The Year Ended December 31, 2012
(Continued)
Special Revenue
Page 134
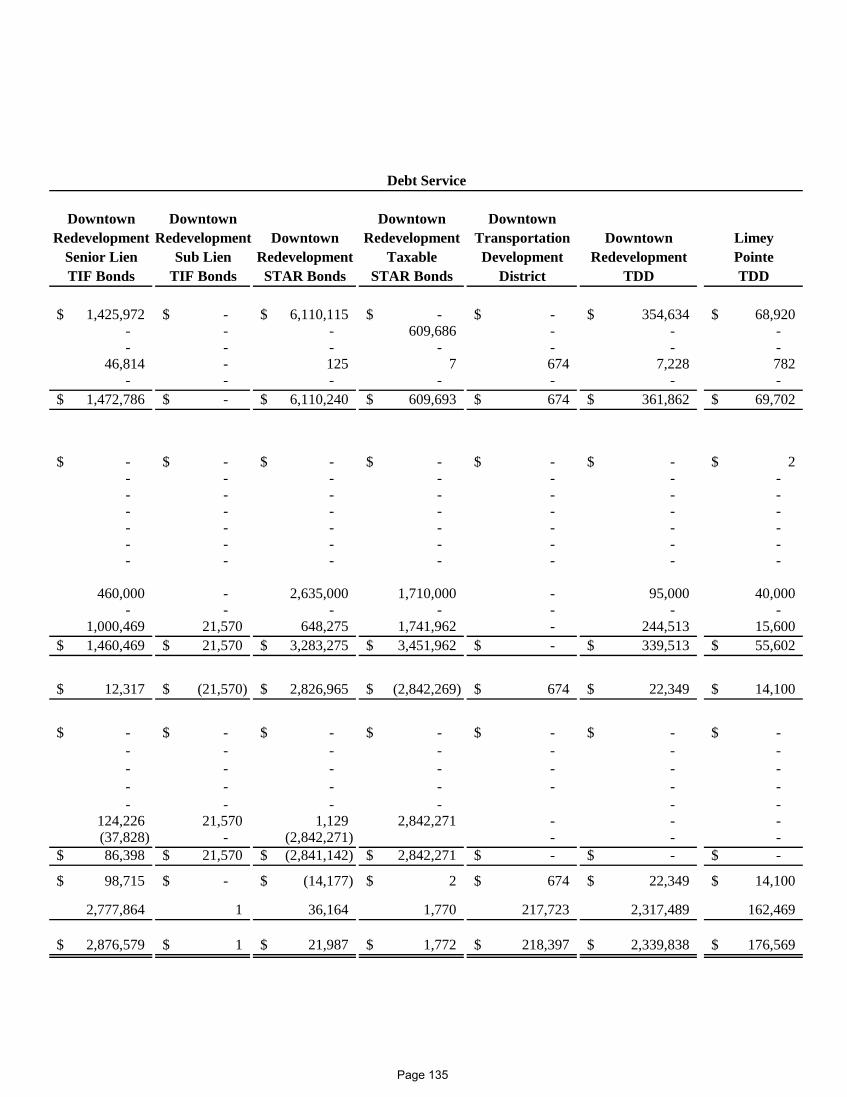
Downtown Downtown Downtown DowntownRedevelopment Redevelopment Downtown Redevelopment Transportation Downtown Limey
Senior Lien Sub Lien Redevelopment Taxable Development Redevelopment PointeTIF Bonds TIF Bonds STAR Bonds STAR Bonds District TDD TDD
1,425,972$ -$ 6,110,115$ -$ -$ 354,634$ 68,920$ - - - 609,686 - - - - - - - - - -
46,814 - 125 7 674 7,228 782 - - - - - - -
1,472,786$ -$ 6,110,240$ 609,693$ 674$ 361,862$ 69,702$
-$ -$ -$ -$ -$ -$ 2$ - - - - - - - - - - - - - - - - - - - - - - - - - - - - - - - - - - - - - - - - - -
460,000 - 2,635,000 1,710,000 - 95,000 40,000 - - - - - - -
1,000,469 21,570 648,275 1,741,962 - 244,513 15,600 1,460,469$ 21,570$ 3,283,275$ 3,451,962$ -$ 339,513$ 55,602$
12,317$ (21,570)$ 2,826,965$ (2,842,269)$ 674$ 22,349$ 14,100$
-$ -$ -$ -$ -$ -$ -$ - - - - - - - - - - - - - - - - - - - - - - - - - - -
124,226 21,570 1,129 2,842,271 - - - (37,828) - (2,842,271) - - - 86,398$ 21,570$ (2,841,142)$ 2,842,271$ -$ -$ -$
98,715$ -$ (14,177)$ 2$ 674$ 22,349$ 14,100$
2,777,864 1 36,164 1,770 217,723 2,317,489 162,469
2,876,579$ 1$ 21,987$ 1,772$ 218,397$ 2,339,838$ 176,569$
Debt Service
Page 135
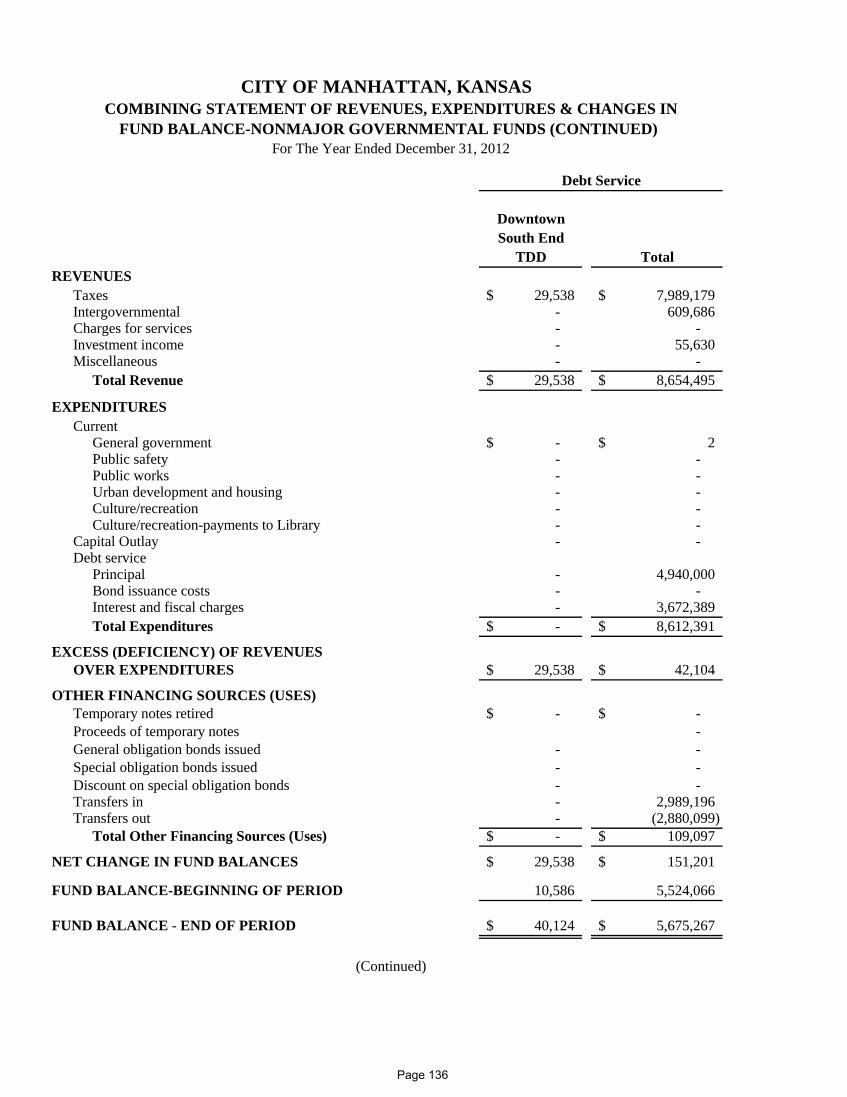
CITY OF MANHATTAN, KANSAS
DowntownSouth End
TDD TotalREVENUES
Taxes 29,538$ 7,989,179$ Intergovernmental - 609,686 Charges for services - - Investment income - 55,630 Miscellaneous - -
Total Revenue 29,538$ 8,654,495$
EXPENDITURESCurrent
General government -$ 2$ Public safety - - Public works - - Urban development and housing - - Culture/recreation - - Culture/recreation-payments to Library - -
Capital Outlay - - Debt service
Principal - 4,940,000 Bond issuance costs - - Interest and fiscal charges - 3,672,389 Total Expenditures -$ 8,612,391$
EXCESS (DEFICIENCY) OF REVENUESOVER EXPENDITURES 29,538$ 42,104$
OTHER FINANCING SOURCES (USES)Temporary notes retired -$ -$ Proceeds of temporary notes - General obligation bonds issued - - Special obligation bonds issued - - Discount on special obligation bonds - - Transfers in - 2,989,196 Transfers out - (2,880,099)
Total Other Financing Sources (Uses) -$ 109,097$
NET CHANGE IN FUND BALANCES 29,538$ 151,201$
FUND BALANCE-BEGINNING OF PERIOD 10,586 5,524,066
FUND BALANCE - END OF PERIOD 40,124$ 5,675,267$
(Continued)
Debt Service
COMBINING STATEMENT OF REVENUES, EXPENDITURES & CHANGES IN FUND BALANCE-NONMAJOR GOVERNMENTAL FUNDS (CONTINUED)
For The Year Ended December 31, 2012
Page 136
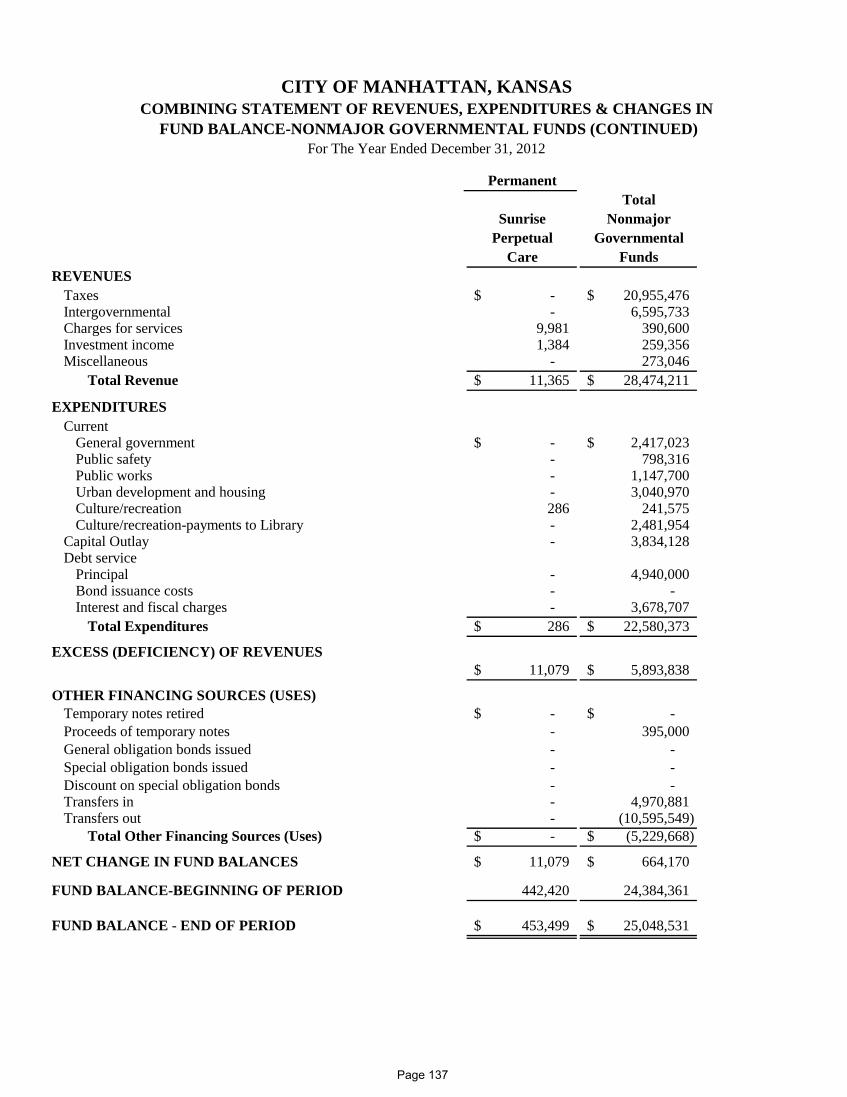
PermanentTotal
Sunrise NonmajorPerpetual Governmental
Care FundsREVENUES
Taxes -$ 20,955,476$ Intergovernmental - 6,595,733 Charges for services 9,981 390,600 Investment income 1,384 259,356 Miscellaneous - 273,046
Total Revenue 11,365$ 28,474,211$
EXPENDITURESCurrent
General government -$ 2,417,023$ Public safety - 798,316 Public works - 1,147,700 Urban development and housing - 3,040,970 Culture/recreation 286 241,575 Culture/recreation-payments to Library - 2,481,954
Capital Outlay - 3,834,128 Debt service
Principal - 4,940,000 Bond issuance costs - - Interest and fiscal charges - 3,678,707
Total Expenditures 286$ 22,580,373$
EXCESS (DEFICIENCY) OF REVENUES11,079$ 5,893,838$
OTHER FINANCING SOURCES (USES)Temporary notes retired -$ -$ Proceeds of temporary notes - 395,000 General obligation bonds issued - - Special obligation bonds issued - - Discount on special obligation bonds - - Transfers in - 4,970,881 Transfers out - (10,595,549)
Total Other Financing Sources (Uses) -$ (5,229,668)$
NET CHANGE IN FUND BALANCES 11,079$ 664,170$
FUND BALANCE-BEGINNING OF PERIOD 442,420 24,384,361
FUND BALANCE - END OF PERIOD 453,499$ 25,048,531$
For The Year Ended December 31, 2012
CITY OF MANHATTAN, KANSASCOMBINING STATEMENT OF REVENUES, EXPENDITURES & CHANGES IN
FUND BALANCE-NONMAJOR GOVERNMENTAL FUNDS (CONTINUED)
Page 137

THIS PAGE INTENTIONALLY LEFT BLANK
Page 138
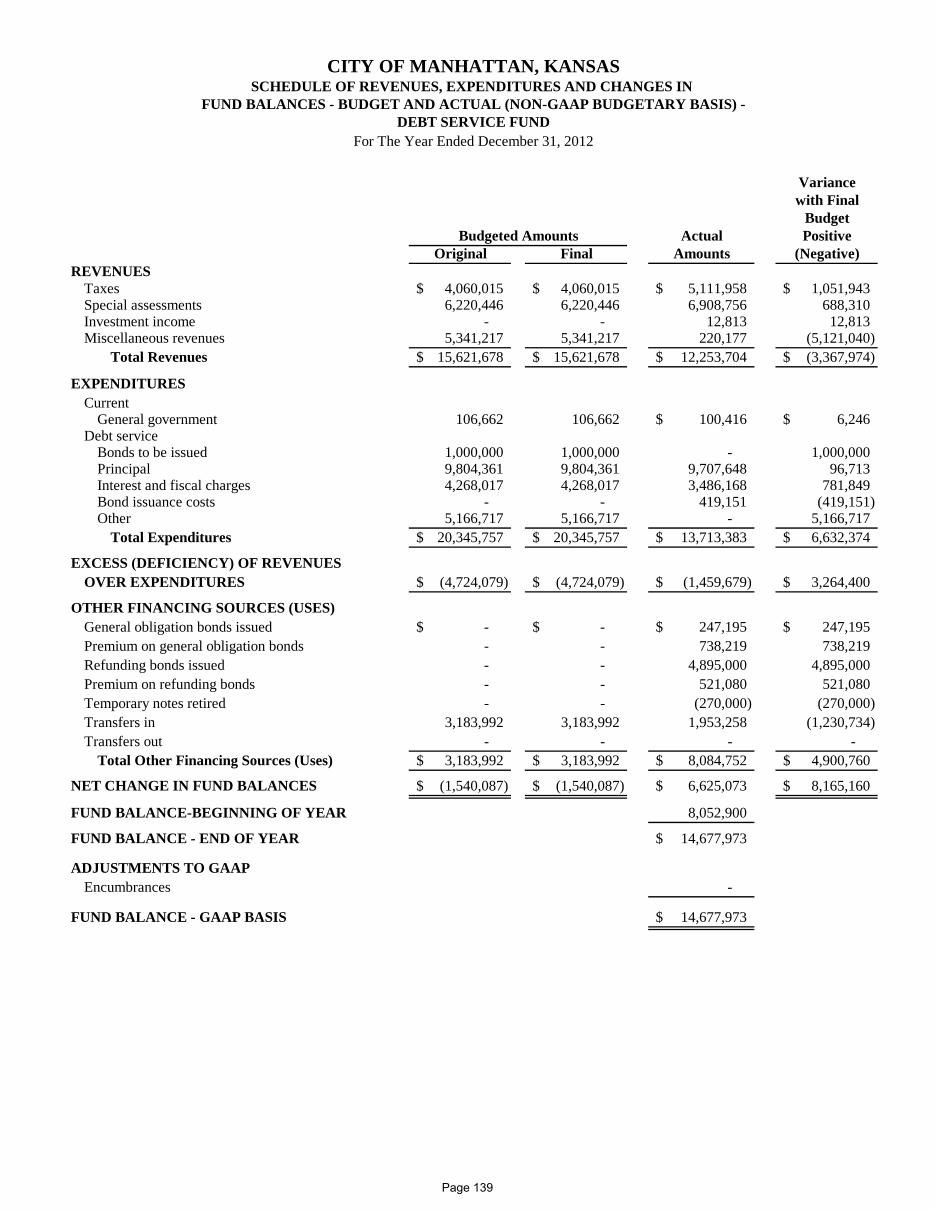
CITY OF MANHATTAN, KANSASSCHEDULE OF REVENUES, EXPENDITURES AND CHANGES IN
FUND BALANCES - BUDGET AND ACTUAL (NON-GAAP BUDGETARY BASIS) -DEBT SERVICE FUND
For The Year Ended December 31, 2012
Variancewith Final
BudgetActual Positive
Original Final Amounts (Negative)REVENUES
Taxes 4,060,015$ 4,060,015$ 5,111,958$ 1,051,943$ Special assessments 6,220,446 6,220,446 6,908,756 688,310 Investment income - - 12,813 12,813 Miscellaneous revenues 5,341,217 5,341,217 220,177 (5,121,040)
Total Revenues 15,621,678$ 15,621,678$ 12,253,704$ (3,367,974)$
EXPENDITURESCurrent
General government 106,662 106,662 100,416$ 6,246$ Debt service
Bonds to be issued 1,000,000 1,000,000 - 1,000,000 Principal 9,804,361 9,804,361 9,707,648 96,713 Interest and fiscal charges 4,268,017 4,268,017 3,486,168 781,849 Bond issuance costs - - 419,151 (419,151) Other 5,166,717 5,166,717 - 5,166,717
Total Expenditures 20,345,757$ 20,345,757$ 13,713,383$ 6,632,374$
EXCESS (DEFICIENCY) OF REVENUES OVER EXPENDITURES (4,724,079)$ (4,724,079)$ (1,459,679)$ 3,264,400$
OTHER FINANCING SOURCES (USES)General obligation bonds issued -$ -$ 247,195$ 247,195$ Premium on general obligation bonds - - 738,219 738,219 Refunding bonds issued - - 4,895,000 4,895,000 Premium on refunding bonds - - 521,080 521,080 Temporary notes retired - - (270,000) (270,000) Transfers in 3,183,992 3,183,992 1,953,258 (1,230,734) Transfers out - - - -
Total Other Financing Sources (Uses) 3,183,992$ 3,183,992$ 8,084,752$ 4,900,760$
NET CHANGE IN FUND BALANCES (1,540,087)$ (1,540,087)$ 6,625,073$ 8,165,160$
FUND BALANCE-BEGINNING OF YEAR 8,052,900
FUND BALANCE - END OF YEAR 14,677,973$
ADJUSTMENTS TO GAAPEncumbrances -
FUND BALANCE - GAAP BASIS 14,677,973$
Budgeted Amounts
Page 139
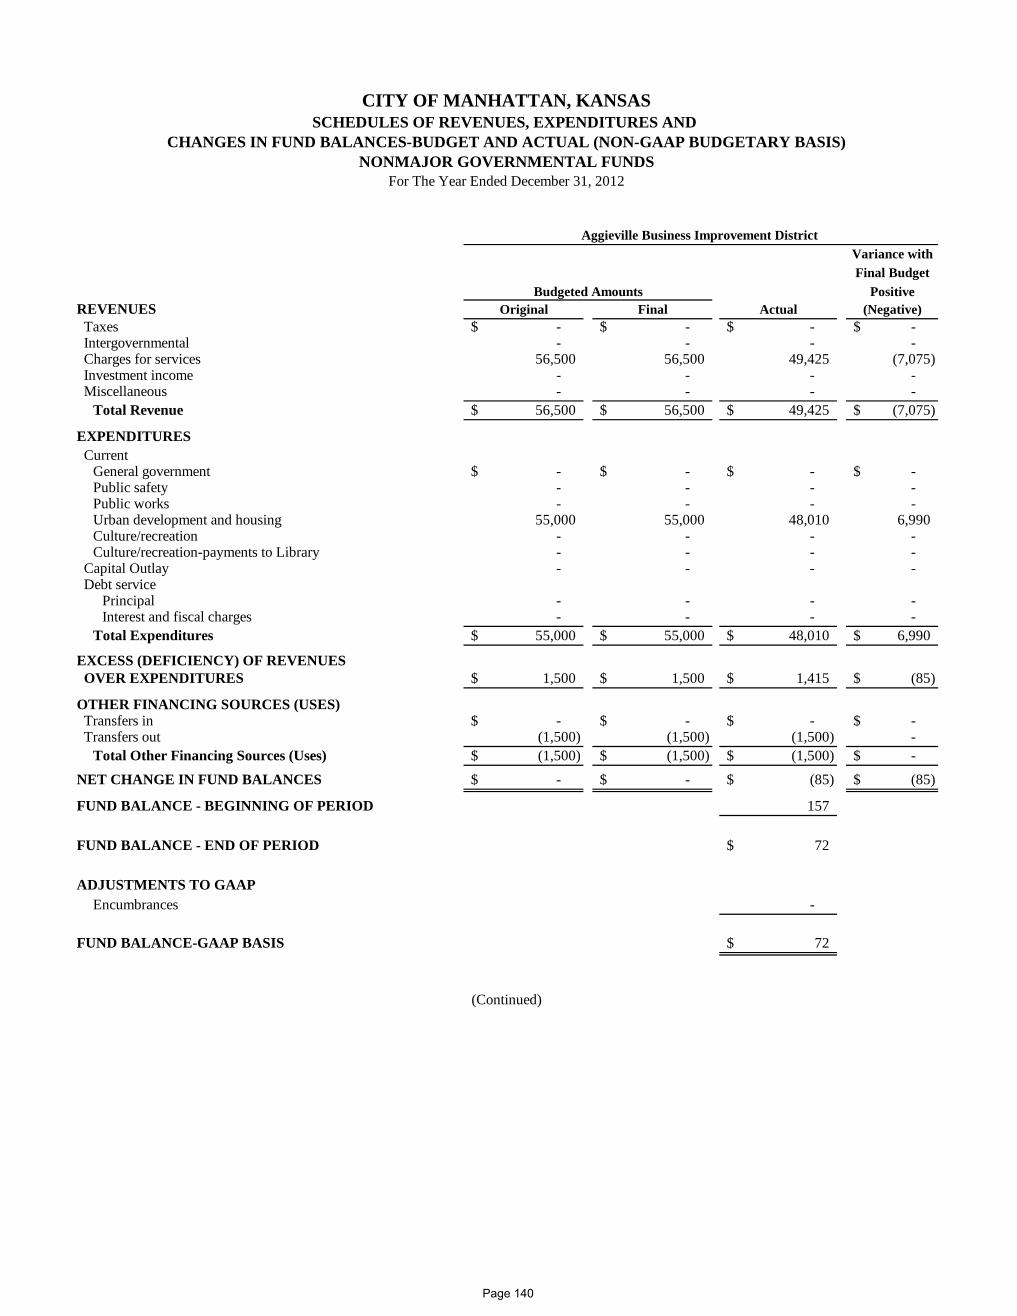
CITY OF MANHATTAN, KANSASSCHEDULES OF REVENUES, EXPENDITURES AND
CHANGES IN FUND BALANCES-BUDGET AND ACTUAL (NON-GAAP BUDGETARY BASIS)NONMAJOR GOVERNMENTAL FUNDS
For The Year Ended December 31, 2012
Aggieville Business Improvement District Variance withFinal Budget
PositiveREVENUES Original Final Actual (Negative)Taxes -$ -$ -$ -$ Intergovernmental - - - - Charges for services 56,500 56,500 49,425 (7,075) Investment income - - - - Miscellaneous - - - -
Total Revenue 56,500$ 56,500$ 49,425$ (7,075)$
EXPENDITURESCurrent
General government -$ -$ -$ -$ Public safety - - - - Public works - - - - Urban development and housing 55,000 55,000 48,010 6,990 Culture/recreation - - - - Culture/recreation-payments to Library - - - -
Capital Outlay - - - - Debt service
Principal - - - - Interest and fiscal charges - - - -
Total Expenditures 55,000$ 55,000$ 48,010$ 6,990$
EXCESS (DEFICIENCY) OF REVENUESOVER EXPENDITURES 1,500$ 1,500$ 1,415$ (85)$
OTHER FINANCING SOURCES (USES)Transfers in -$ -$ -$ -$ Transfers out (1,500) (1,500) (1,500) -
Total Other Financing Sources (Uses) (1,500)$ (1,500)$ (1,500)$ -$
NET CHANGE IN FUND BALANCES -$ -$ (85)$ (85)$
FUND BALANCE - BEGINNING OF PERIOD 157
FUND BALANCE - END OF PERIOD 72$
ADJUSTMENTS TO GAAPEncumbrances -
FUND BALANCE-GAAP BASIS 72$
(Continued)
Budgeted Amounts
Page 140
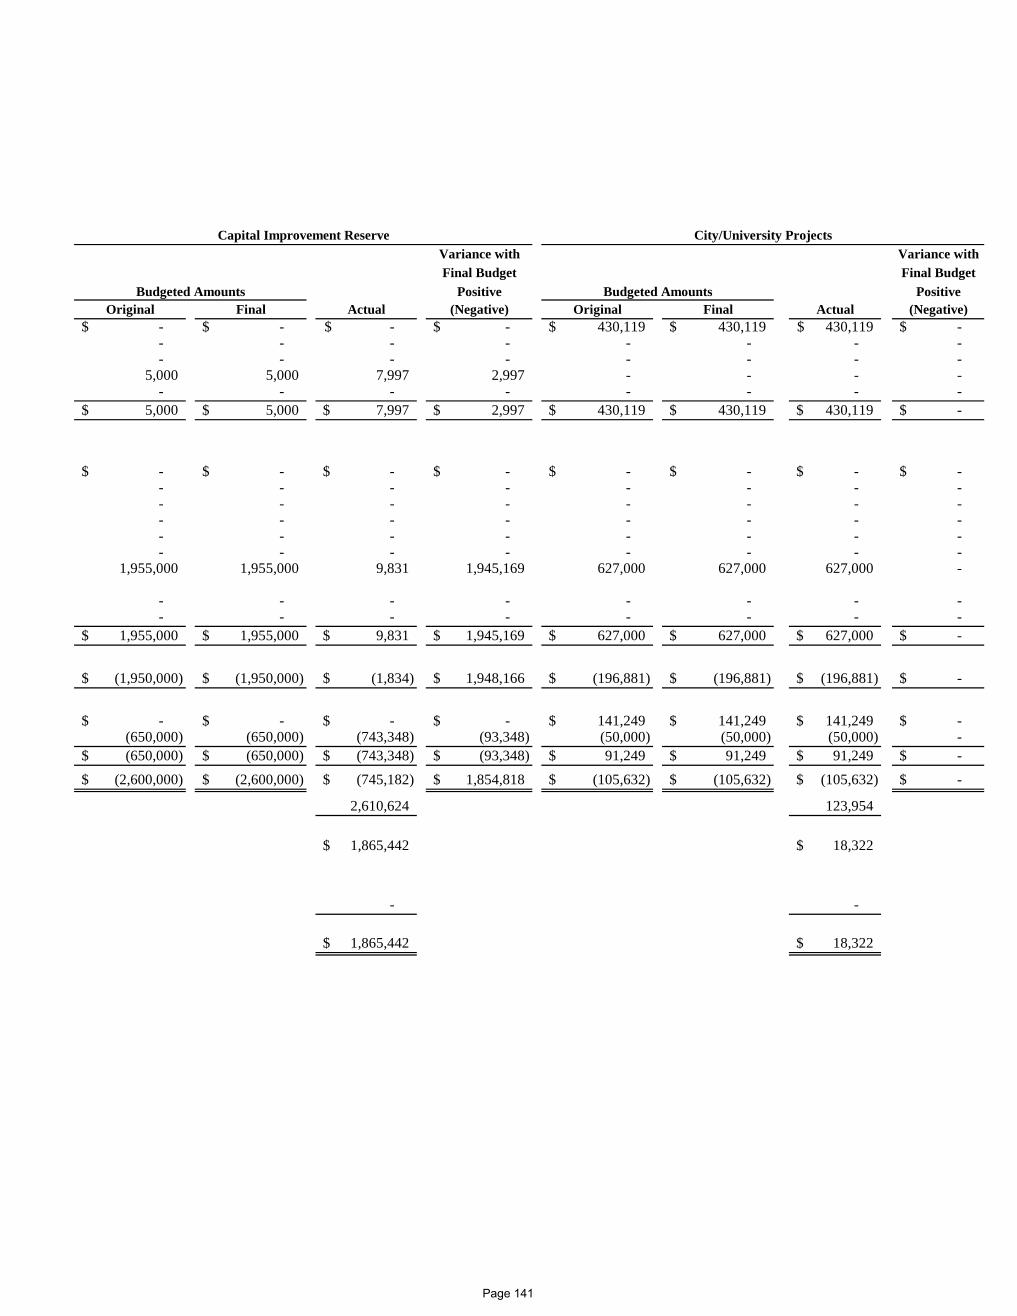
Variance with Variance withFinal Budget Final Budget
Positive PositiveOriginal Final Actual (Negative) Original Final Actual (Negative)
-$ -$ -$ -$ 430,119$ 430,119$ 430,119$ -$ - - - - - - - - - - - - - - - -
5,000 5,000 7,997 2,997 - - - - - - - - - - - -
5,000$ 5,000$ 7,997$ 2,997$ 430,119$ 430,119$ 430,119$ -$
-$ -$ -$ -$ -$ -$ -$ -$ - - - - - - - - - - - - - - - - - - - - - - - - - - - - - - - - - - - - - - - -
1,955,000 1,955,000 9,831 1,945,169 627,000 627,000 627,000 -
- - - - - - - - - - - - - - - -
1,955,000$ 1,955,000$ 9,831$ 1,945,169$ 627,000$ 627,000$ 627,000$ -$
(1,950,000)$ (1,950,000)$ (1,834)$ 1,948,166$ (196,881)$ (196,881)$ (196,881)$ -$
-$ -$ -$ -$ 141,249$ 141,249$ 141,249$ -$ (650,000) (650,000) (743,348) (93,348) (50,000) (50,000) (50,000) - (650,000)$ (650,000)$ (743,348)$ (93,348)$ 91,249$ 91,249$ 91,249$ -$
(2,600,000)$ (2,600,000)$ (745,182)$ 1,854,818$ (105,632)$ (105,632)$ (105,632)$ -$
2,610,624 123,954
1,865,442$ 18,322$
- -
1,865,442$ 18,322$
Capital Improvement Reserve City/University Projects
Budgeted AmountsBudgeted Amounts
Page 141
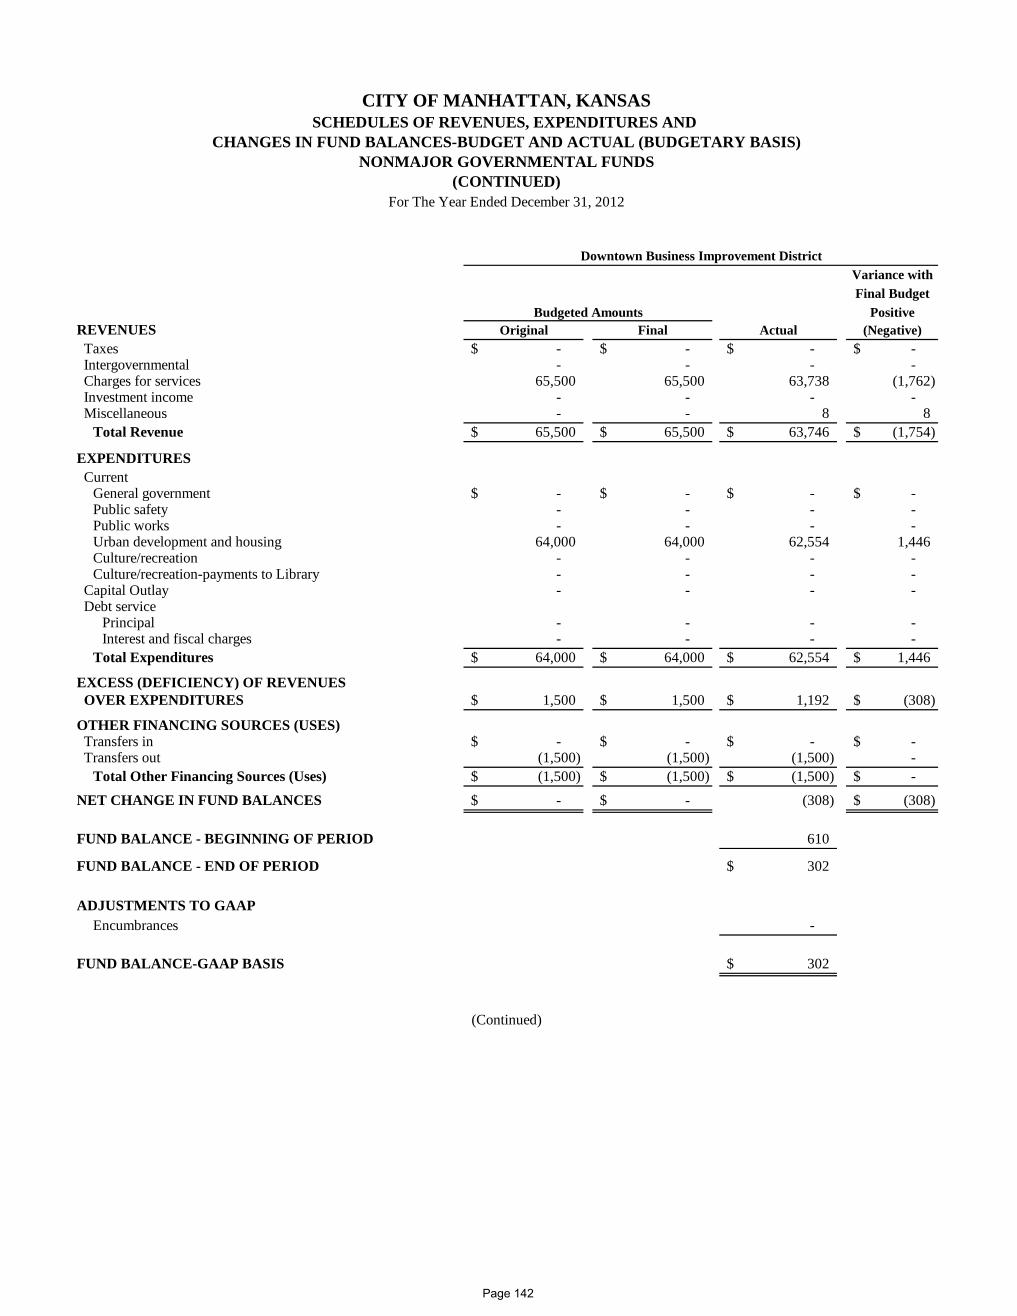
CITY OF MANHATTAN, KANSASSCHEDULES OF REVENUES, EXPENDITURES AND
CHANGES IN FUND BALANCES-BUDGET AND ACTUAL (BUDGETARY BASIS)NONMAJOR GOVERNMENTAL FUNDS
(CONTINUED)For The Year Ended December 31, 2012
Variance withFinal Budget
PositiveREVENUES Original Final Actual (Negative)Taxes -$ -$ -$ -$ Intergovernmental - - - - Charges for services 65,500 65,500 63,738 (1,762) Investment income - - - - Miscellaneous - - 8 8
Total Revenue 65,500$ 65,500$ 63,746$ (1,754)$
EXPENDITURESCurrent
General government -$ -$ -$ -$ Public safety - - - - Public works - - - - Urban development and housing 64,000 64,000 62,554 1,446 Culture/recreation - - - - Culture/recreation-payments to Library - - - -
Capital Outlay - - - - Debt service
Principal - - - - Interest and fiscal charges - - - -
Total Expenditures 64,000$ 64,000$ 62,554$ 1,446$
EXCESS (DEFICIENCY) OF REVENUESOVER EXPENDITURES 1,500$ 1,500$ 1,192$ (308)$
OTHER FINANCING SOURCES (USES)Transfers in -$ -$ -$ -$ Transfers out (1,500) (1,500) (1,500) -
Total Other Financing Sources (Uses) (1,500)$ (1,500)$ (1,500)$ -$
NET CHANGE IN FUND BALANCES -$ -$ (308) (308)$
FUND BALANCE - BEGINNING OF PERIOD 610
FUND BALANCE - END OF PERIOD 302$
ADJUSTMENTS TO GAAPEncumbrances -
FUND BALANCE-GAAP BASIS 302$
(Continued)
Budgeted Amounts
Downtown Business Improvement District
Page 142
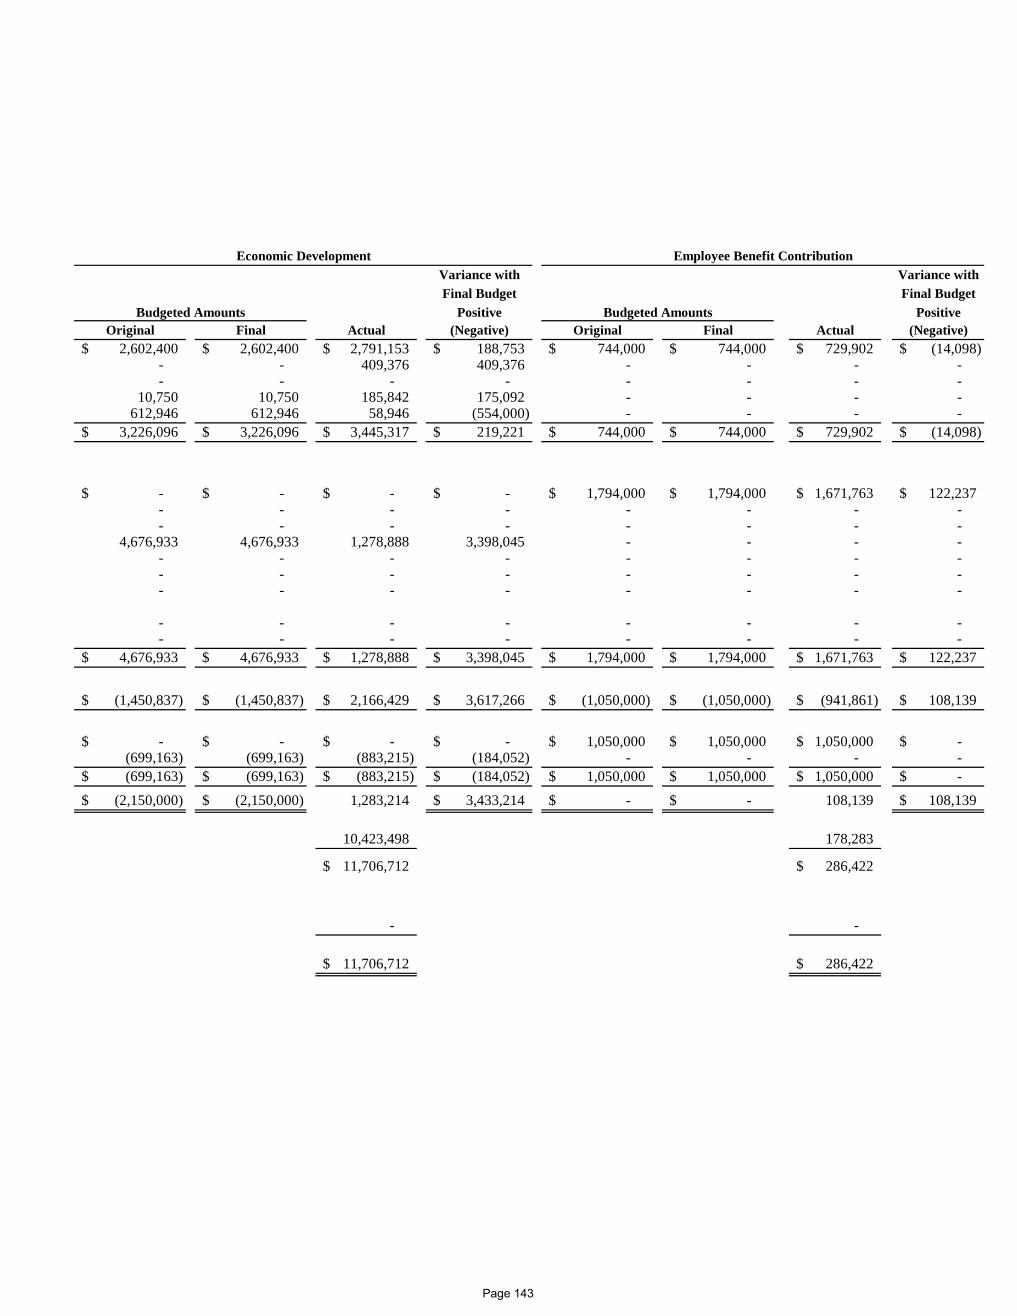
Variance with Variance withFinal Budget Final Budget
Positive PositiveOriginal Final Actual (Negative) Original Final Actual (Negative)
2,602,400$ 2,602,400$ 2,791,153$ 188,753$ 744,000$ 744,000$ 729,902$ (14,098)$ - - 409,376 409,376 - - - - - - - - - - - -
10,750 10,750 185,842 175,092 - - - - 612,946 612,946 58,946 (554,000) - - - -
3,226,096$ 3,226,096$ 3,445,317$ 219,221$ 744,000$ 744,000$ 729,902$ (14,098)$
-$ -$ -$ -$ 1,794,000$ 1,794,000$ 1,671,763$ 122,237$ - - - - - - - - - - - - - - - -
4,676,933 4,676,933 1,278,888 3,398,045 - - - - - - - - - - - - - - - - - - - - - - - - - - - -
- - - - - - - - - - - - - - - -
4,676,933$ 4,676,933$ 1,278,888$ 3,398,045$ 1,794,000$ 1,794,000$ 1,671,763$ 122,237$
(1,450,837)$ (1,450,837)$ 2,166,429$ 3,617,266$ (1,050,000)$ (1,050,000)$ (941,861)$ 108,139$
-$ -$ -$ -$ 1,050,000$ 1,050,000$ 1,050,000$ -$ (699,163) (699,163) (883,215) (184,052) - - - - (699,163)$ (699,163)$ (883,215)$ (184,052)$ 1,050,000$ 1,050,000$ 1,050,000$ -$
(2,150,000)$ (2,150,000)$ 1,283,214 3,433,214$ -$ -$ 108,139 108,139$
10,423,498 178,283
11,706,712$ 286,422$
- -
11,706,712$ 286,422$
Budgeted AmountsBudgeted Amounts
Employee Benefit ContributionEconomic Development
Page 143

CITY OF MANHATTAN, KANSASSCHEDULES OF REVENUES, EXPENDITURES AND
CHANGES IN FUND BALANCES-BUDGET AND ACTUAL (BUDGETARY BASIS)NONMAJOR GOVERNMENTAL FUNDS
(CONTINUED)For The Year Ended December 31, 2012
Variance withFinal Budget
PositiveREVENUES Original Final Actual (Negative)Taxes 54,267$ 54,267$ 53,947$ (320)$ Intergovernmental - - - - Charges for services - - - - Investment income 1,233 1,233 1,033 (200) Miscellaneous - - - -
Total Revenue 55,500$ 55,500$ 54,980$ (520)$
EXPENDITURESCurrent
General government -$ -$ -$ -$ Public safety 383,889 383,889 119,048 264,841 Public works - - - - Urban development and housing - - - - Culture/recreation - - - - Culture/recreation-payments to Library - - - -
Capital Outlay 99,611 99,611 97,910 1,701 Debt service
Principal - - - - Interest and fiscal charges - - - -
Total Expenditures 483,500$ 483,500$ 216,958$ 266,542$
EXCESS (DEFICIENCY) OF REVENUESOVER EXPENDITURES (428,000)$ (428,000)$ (161,978)$ 266,022$
OTHER FINANCING SOURCES (USES)Transfers in 100,000$ 100,000$ 100,000$ -$ Transfers out - - - -
Total Other Financing Sources (Uses) 100,000$ 100,000$ 100,000$ -$
NET CHANGE IN FUND BALANCES (328,000)$ (328,000)$ (61,978) 266,022$
FUND BALANCE - BEGINNING OF PERIOD 347,223
FUND BALANCE - END OF PERIOD 285,245$
ADJUSTMENTS TO GAAPEncumbrances 48,454
FUND BALANCE-GAAP BASIS 333,699$
(Continued)
Budgeted Amounts
Fire Equipment Reserve
Page 144
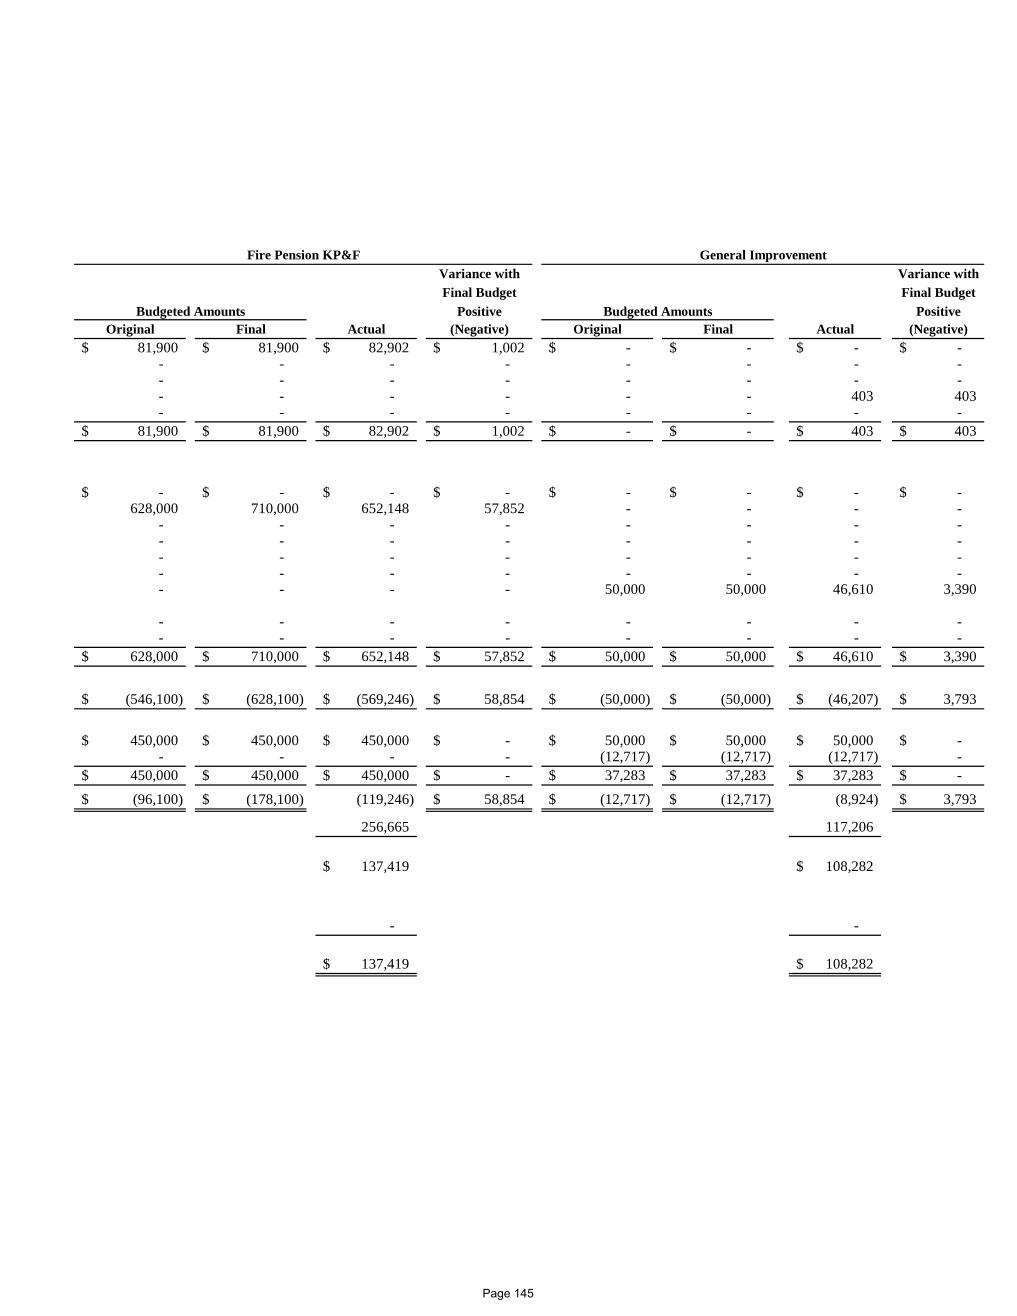
Variance with Variance withFinal Budget Final Budget
Positive PositiveOriginal Final Actual (Negative) Original Final Actual (Negative)
81,900$ 81,900$ 82,902$ 1,002$ -$ -$ -$ -$ - - - - - - - - - - - - - - - - - - - - - - 403 403 - - - - - - - -
81,900$ 81,900$ 82,902$ 1,002$ -$ -$ 403$ 403$
-$ -$ -$ -$ -$ -$ -$ -$ 628,000 710,000 652,148 57,852 - - - -
- - - - - - - - - - - - - - - - - - - - - - - - - - - - - - - - - - - - 50,000 50,000 46,610 3,390
- - - - - - - - - - - - - - - -
628,000$ 710,000$ 652,148$ 57,852$ 50,000$ 50,000$ 46,610$ 3,390$
(546,100)$ (628,100)$ (569,246)$ 58,854$ (50,000)$ (50,000)$ (46,207)$ 3,793$
450,000$ 450,000$ 450,000$ -$ 50,000$ 50,000$ 50,000$ -$ - - - - (12,717) (12,717) (12,717) -
450,000$ 450,000$ 450,000$ -$ 37,283$ 37,283$ 37,283$ -$
(96,100)$ (178,100)$ (119,246) 58,854$ (12,717)$ (12,717)$ (8,924) 3,793$
256,665 117,206
137,419$ 108,282$
- -
137,419$ 108,282$
General Improvement
Budgeted Amounts Budgeted Amounts
Fire Pension KP&F
Page 145

CITY OF MANHATTAN, KANSASSCHEDULES OF REVENUES, EXPENDITURES AND
CHANGES IN FUND BALANCES-BUDGET AND ACTUAL (BUDGETARY BASIS)NONMAJOR GOVERNMENTAL FUNDS
(CONTINUED)For The Year Ended December 31, 2012
Variance withFinal Budget
PositiveREVENUES Original Final Actual (Negative)Taxes -$ -$ 64$ 64$ Intergovernmental - - - - Charges for services - - - - Investment income 725 725 765 40 Miscellaneous 35,000 35,000 118,898 83,898
Total Revenue 35,725$ 35,725$ 119,727$ 84,002$
EXPENDITURESCurrent
General government -$ -$ -$ -$ Public safety - - - - Public works - - - - Urban development and housing 180,725 180,725 61,815 118,910 Culture/recreation - - - - Culture/recreation-payments to Library - - - -
Capital Outlay - - - - Debt service
Principal - - - - Interest and fiscal charges - - - -
Total Expenditures 180,725$ 180,725$ 61,815$ 118,910$
EXCESS (DEFICIENCY) OF REVENUESOVER EXPENDITURES (145,000)$ (145,000)$ 57,912$ 202,912$
OTHER FINANCING SOURCES (USES)Transfers in -$ -$ -$ -$ Transfers out - - - -
Total Other Financing Sources (Uses) -$ -$ -$ -$
NET CHANGE IN FUND BALANCES (145,000)$ (145,000)$ 57,912 202,912$
FUND BALANCE - BEGINNING OF PERIOD 233,625
FUND BALANCE - END OF PERIOD 291,537$
ADJUSTMENTS TO GAAPEncumbrances -
FUND BALANCE-GAAP BASIS 291,537$
(Continued)
Budgeted Amounts
Industrial Promotion
Page 146
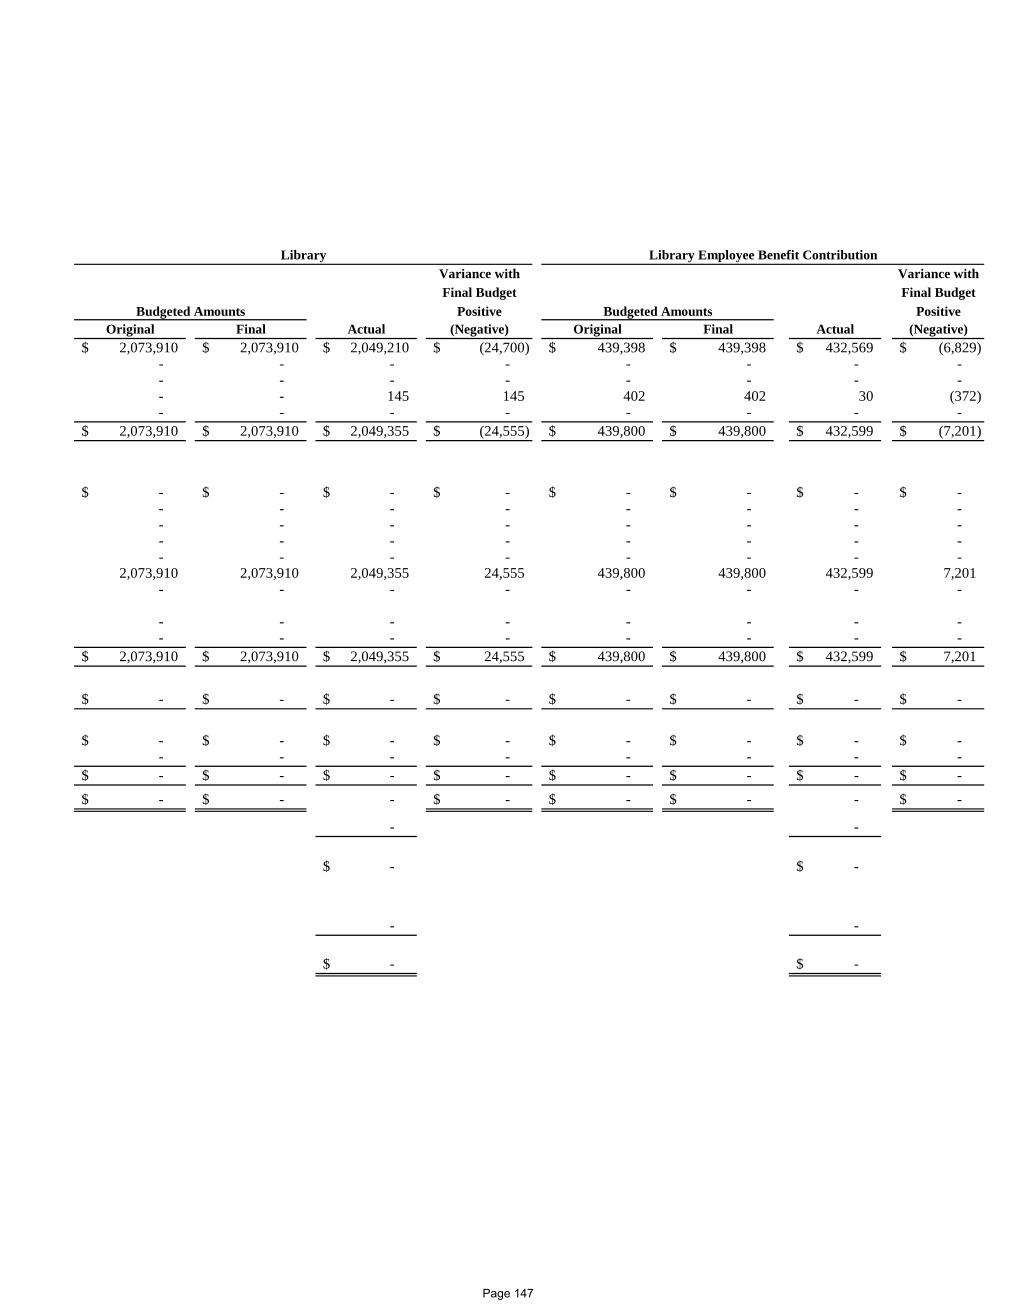
Variance with Variance withFinal Budget Final Budget
Positive PositiveOriginal Final Actual (Negative) Original Final Actual (Negative)
2,073,910$ 2,073,910$ 2,049,210$ (24,700)$ 439,398$ 439,398$ 432,569$ (6,829)$ - - - - - - - - - - - - - - - - - - 145 145 402 402 30 (372) - - - - - - - -
2,073,910$ 2,073,910$ 2,049,355$ (24,555)$ 439,800$ 439,800$ 432,599$ (7,201)$
-$ -$ -$ -$ -$ -$ -$ -$ - - - - - - - - - - - - - - - - - - - - - - - - - - - - - - - -
2,073,910 2,073,910 2,049,355 24,555 439,800 439,800 432,599 7,201 - - - - - - - -
- - - - - - - - - - - - - - - -
2,073,910$ 2,073,910$ 2,049,355$ 24,555$ 439,800$ 439,800$ 432,599$ 7,201$
-$ -$ -$ -$ -$ -$ -$ -$
-$ -$ -$ -$ -$ -$ -$ -$ - - - - - - - - -$ -$ -$ -$ -$ -$ -$ -$
-$ -$ - -$ -$ -$ - -$
- -
-$ -$
- -
-$ -$
Library Library Employee Benefit Contribution
Budgeted Amounts Budgeted Amounts
Page 147

CITY OF MANHATTAN, KANSASSCHEDULES OF REVENUES, EXPENDITURES AND
CHANGES IN FUND BALANCES-BUDGET AND ACTUAL (BUDGETARY BASIS)NONMAJOR GOVERNMENTAL FUNDS
(CONTINUED)For The Year Ended December 31, 2012
Variance withFinal Budget
PositiveREVENUES Original Final Actual (Negative)Taxes -$ -$ -$ -$ Intergovernmental - - - - Charges for services - - - - Investment income - - 38 38 Miscellaneous - - - -
Total Revenue -$ -$ 38$ 38$
EXPENDITURESCurrent
General government -$ -$ -$ -$ Public safety - - - - Public works - - - - Urban development and housing - - - - Culture/recreation 25,000 25,000 - 25,000 Culture/recreation-payments to Library - - - -
Capital Outlay - - - - Debt service
Principal - - - - Interest and fiscal charges - - - -
Total Expenditures 25,000$ 25,000$ -$ 25,000$
EXCESS (DEFICIENCY) OF REVENUESOVER EXPENDITURES (25,000)$ (25,000)$ 38$ 25,038$
OTHER FINANCING SOURCES (USES)Transfers in 25,000$ 25,000$ 25,000$ -$ Transfers out - - - -
Total Other Financing Sources (Uses) 25,000$ 25,000$ 25,000$ -$
NET CHANGE IN FUND BALANCES -$ -$ 25,038 25,038$
FUND BALANCE - BEGINNING OF PERIOD -
FUND BALANCE - END OF PERIOD 25,038$
ADJUSTMENTS TO GAAPEncumbrances -
FUND BALANCE-GAAP BASIS 25,038$
(Continued)
Budgeted Amounts
Park Development
Page 148
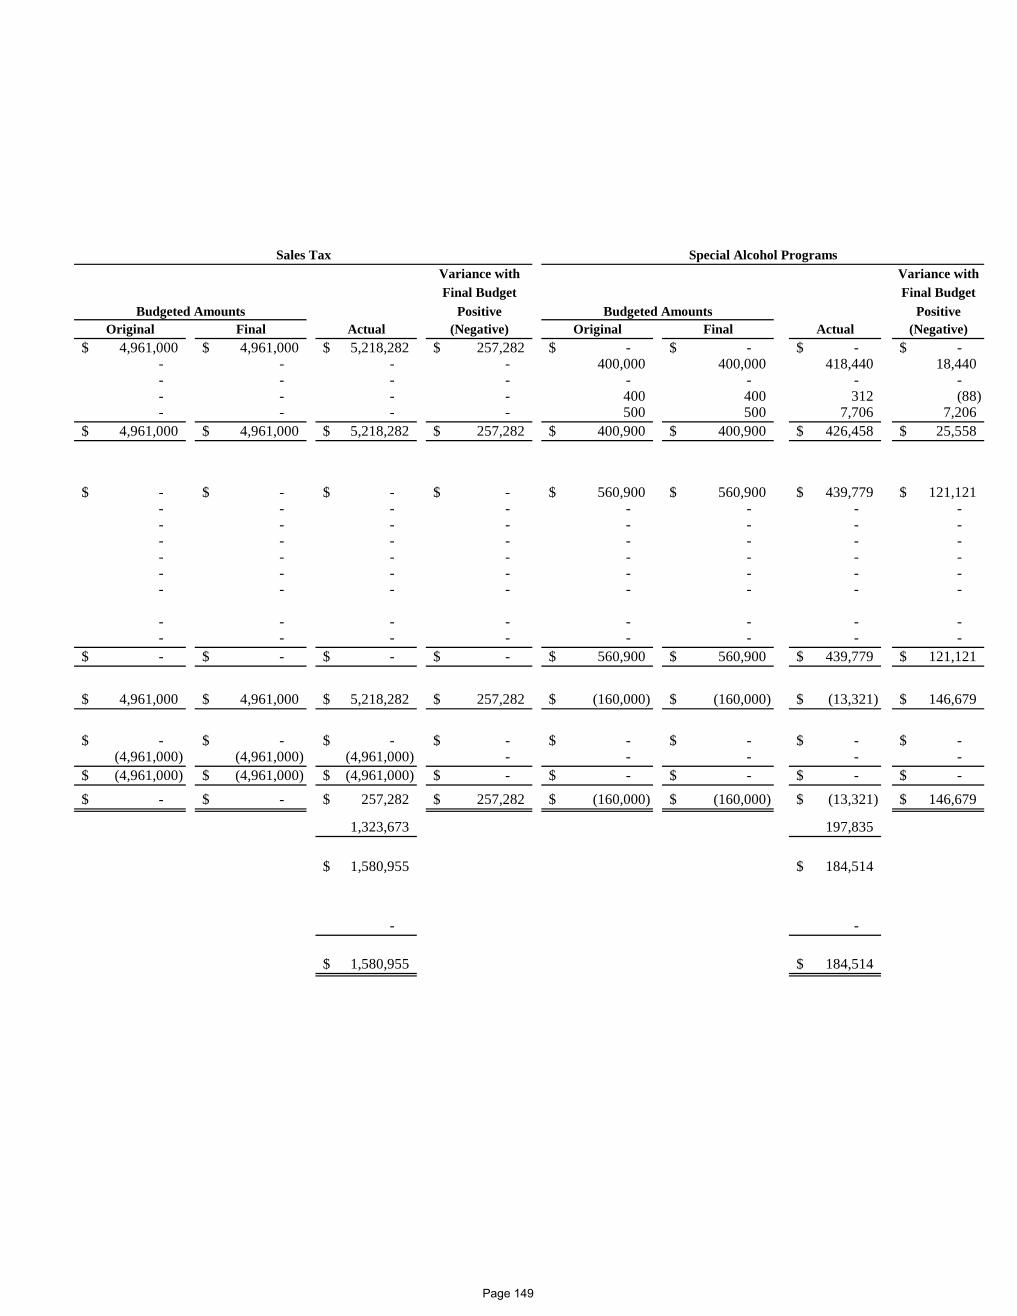
Variance with Variance withFinal Budget Final Budget
Positive PositiveOriginal Final Actual (Negative) Original Final Actual (Negative)
4,961,000$ 4,961,000$ 5,218,282$ 257,282$ -$ -$ -$ -$ - - - - 400,000 400,000 418,440 18,440 - - - - - - - - - - - - 400 400 312 (88) - - - - 500 500 7,706 7,206
4,961,000$ 4,961,000$ 5,218,282$ 257,282$ 400,900$ 400,900$ 426,458$ 25,558$
-$ -$ -$ -$ 560,900$ 560,900$ 439,779$ 121,121$ - - - - - - - - - - - - - - - - - - - - - - - - - - - - - - - - - - - - - - - - - - - - - - - -
- - - - - - - - - - - - - - - - -$ -$ -$ -$ 560,900$ 560,900$ 439,779$ 121,121$
4,961,000$ 4,961,000$ 5,218,282$ 257,282$ (160,000)$ (160,000)$ (13,321)$ 146,679$
-$ -$ -$ -$ -$ -$ -$ -$ (4,961,000) (4,961,000) (4,961,000) - - - - - (4,961,000)$ (4,961,000)$ (4,961,000)$ -$ -$ -$ -$ -$
-$ -$ 257,282$ 257,282$ (160,000)$ (160,000)$ (13,321)$ 146,679$
1,323,673 197,835
1,580,955$ 184,514$
- -
1,580,955$ 184,514$
Budgeted Amounts
Sales Tax Special Alcohol Programs
Budgeted Amounts
Page 149

CITY OF MANHATTAN, KANSASSCHEDULES OF REVENUES, EXPENDITURES AND
CHANGES IN FUND BALANCES-BUDGET AND ACTUAL (BUDGETARY BASIS)NONMAJOR GOVERNMENTAL FUNDS
(CONTINUED)For The Year Ended December 31, 2012
Variance withFinal Budget
PositiveREVENUES Original Final Actual (Negative)Taxes -$ -$ -$ -$ Intergovernmental 400,000 400,000 418,440 18,440 Charges for services - - - - Investment income 4,313 4,313 2,066 (2,247) Miscellaneous - - 6,347 6,347
Total Revenue 404,313$ 404,313$ 426,853$ 22,540$
EXPENDITURESCurrent
General government -$ -$ -$ -$ Public safety - - - - Public works - - - - Urban development and housing - - - - Culture/recreation 377,060 377,060 9,378 367,682 Culture/recreation-payments to Library - - - -
Capital Outlay 501,000 501,000 381,848 119,152 Debt service
Principal - - - - Interest and fiscal charges - - - -
Total Expenditures 878,060$ 878,060$ 391,226$ 486,834$
EXCESS (DEFICIENCY) OF REVENUESOVER EXPENDITURES (473,747)$ (473,747)$ 35,627$ 509,374$
OTHER FINANCING SOURCES (USES)Transfers in -$ -$ -$ -$ Transfers out (101,253) (101,253) (102,944) (1,691)
Total Other Financing Sources (Uses) (101,253)$ (101,253)$ (102,944)$ (1,691)$
NET CHANGE IN FUND BALANCES (575,000)$ (575,000)$ (67,317)$ 507,683$
FUND BALANCE - BEGINNING OF PERIOD 772,857
FUND BALANCE - END OF PERIOD 705,540$
ADJUSTMENTS TO GAAPEncumbrances 30,667
FUND BALANCE-GAAP BASIS 736,207$
Budgeted Amounts
Special Parks and Recreation
(Continued)
Page 150
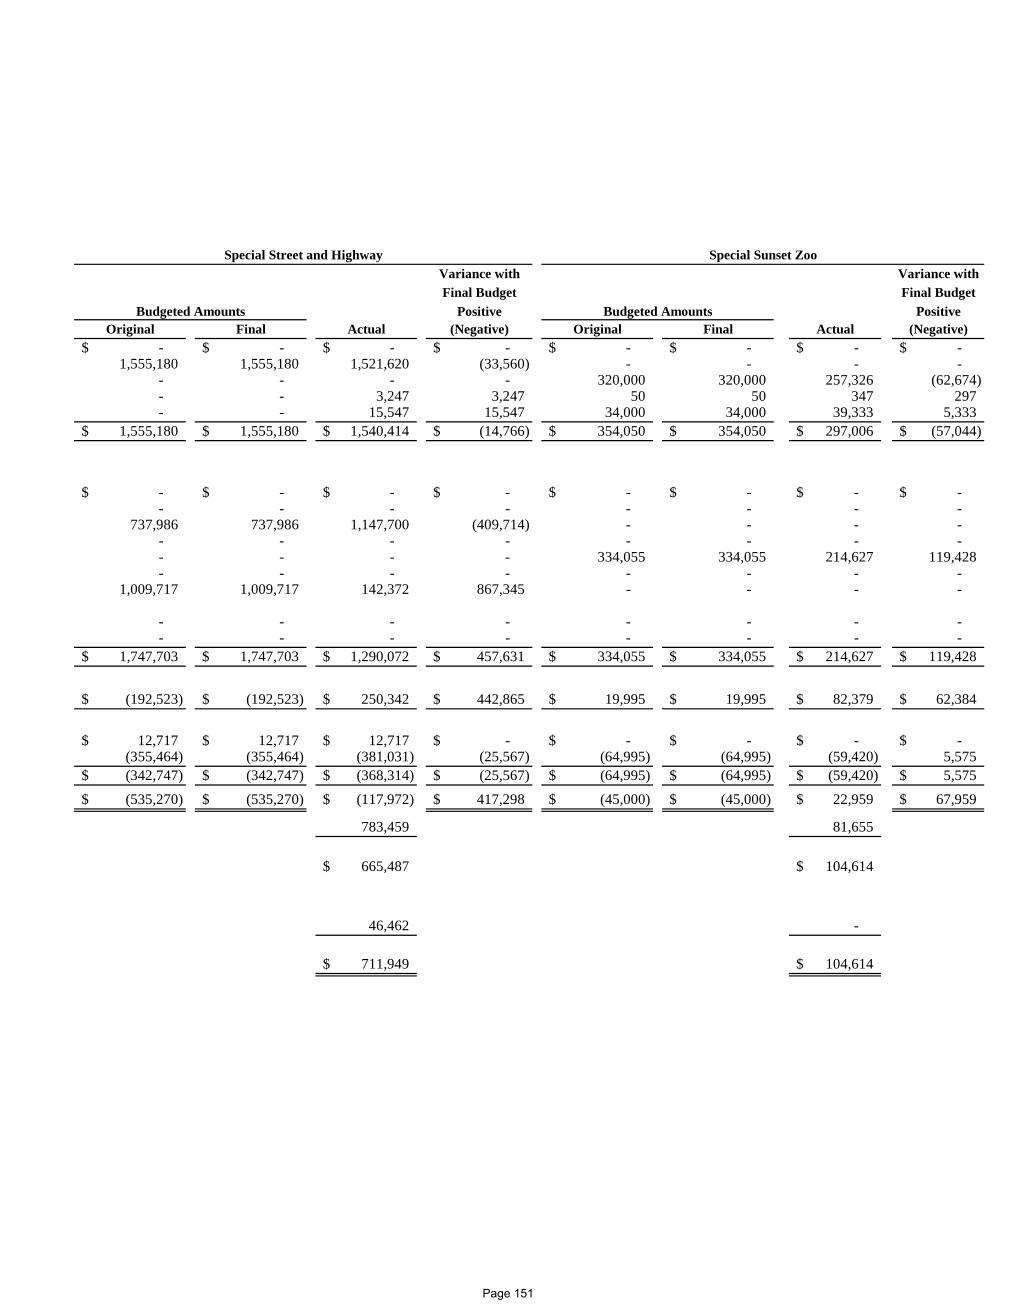
Variance with Variance withFinal Budget Final Budget
Positive PositiveOriginal Final Actual (Negative) Original Final Actual (Negative)
-$ -$ -$ -$ -$ -$ -$ -$ 1,555,180 1,555,180 1,521,620 (33,560) - - - -
- - - - 320,000 320,000 257,326 (62,674) - - 3,247 3,247 50 50 347 297 - - 15,547 15,547 34,000 34,000 39,333 5,333
1,555,180$ 1,555,180$ 1,540,414$ (14,766)$ 354,050$ 354,050$ 297,006$ (57,044)$
-$ -$ -$ -$ -$ -$ -$ -$ - - - - - - - -
737,986 737,986 1,147,700 (409,714) - - - - - - - - - - - - - - - - 334,055 334,055 214,627 119,428 - - - - - - - -
1,009,717 1,009,717 142,372 867,345 - - - -
- - - - - - - - - - - - - - - -
1,747,703$ 1,747,703$ 1,290,072$ 457,631$ 334,055$ 334,055$ 214,627$ 119,428$
(192,523)$ (192,523)$ 250,342$ 442,865$ 19,995$ 19,995$ 82,379$ 62,384$
12,717$ 12,717$ 12,717$ -$ -$ -$ -$ -$ (355,464) (355,464) (381,031) (25,567) (64,995) (64,995) (59,420) 5,575 (342,747)$ (342,747)$ (368,314)$ (25,567)$ (64,995)$ (64,995)$ (59,420)$ 5,575$
(535,270)$ (535,270)$ (117,972)$ 417,298$ (45,000)$ (45,000)$ 22,959$ 67,959$
783,459 81,655
665,487$ 104,614$
46,462 -
711,949$ 104,614$
Special Sunset ZooSpecial Street and Highway
Budgeted AmountsBudgeted Amounts
Page 151
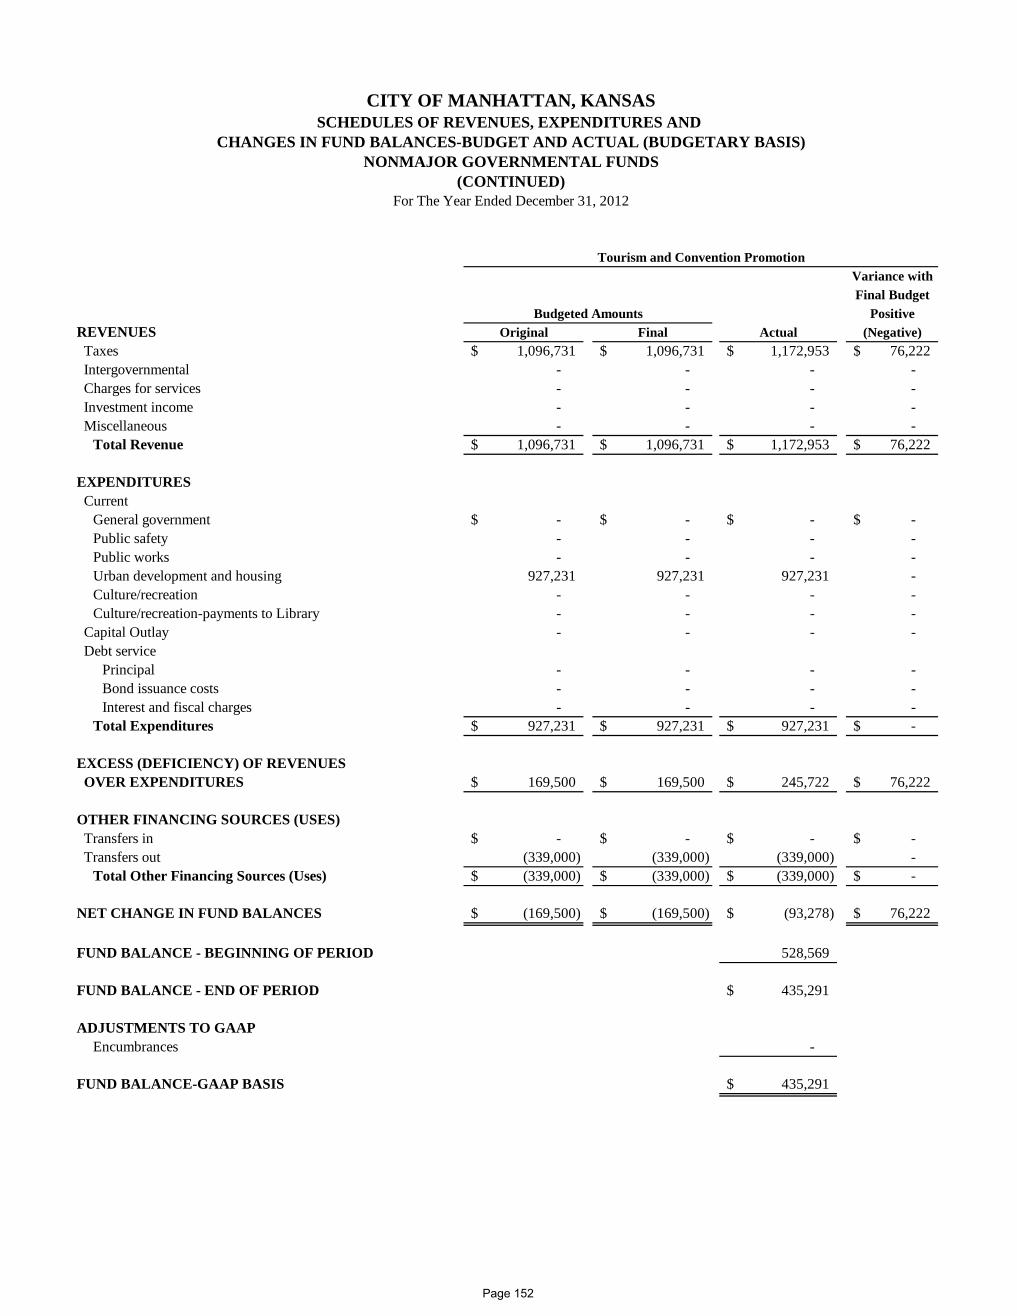
Variance withFinal Budget
PositiveREVENUES Original Final Actual (Negative)Taxes 1,096,731$ 1,096,731$ 1,172,953$ 76,222$ Intergovernmental - - - - Charges for services - - - - Investment income - - - - Miscellaneous - - - -
Total Revenue 1,096,731$ 1,096,731$ 1,172,953$ 76,222$
EXPENDITURESCurrent
General government -$ -$ -$ -$ Public safety - - - - Public works - - - - Urban development and housing 927,231 927,231 927,231 - Culture/recreation - - - - Culture/recreation-payments to Library - - - -
Capital Outlay - - - - Debt service
Principal - - - - Bond issuance costs - - - - Interest and fiscal charges - - - -
Total Expenditures 927,231$ 927,231$ 927,231$ -$
EXCESS (DEFICIENCY) OF REVENUESOVER EXPENDITURES 169,500$ 169,500$ 245,722$ 76,222$
OTHER FINANCING SOURCES (USES)Transfers in -$ -$ -$ -$ Transfers out (339,000) (339,000) (339,000) -
Total Other Financing Sources (Uses) (339,000)$ (339,000)$ (339,000)$ -$
NET CHANGE IN FUND BALANCES (169,500)$ (169,500)$ (93,278)$ 76,222$
FUND BALANCE - BEGINNING OF PERIOD 528,569
FUND BALANCE - END OF PERIOD 435,291$
ADJUSTMENTS TO GAAPEncumbrances -
FUND BALANCE-GAAP BASIS 435,291$
Budgeted Amounts
(CONTINUED)For The Year Ended December 31, 2012
NONMAJOR GOVERNMENTAL FUNDS
Tourism and Convention Promotion
CHANGES IN FUND BALANCES-BUDGET AND ACTUAL (BUDGETARY BASIS)SCHEDULES OF REVENUES, EXPENDITURES AND
CITY OF MANHATTAN, KANSAS
Page 152
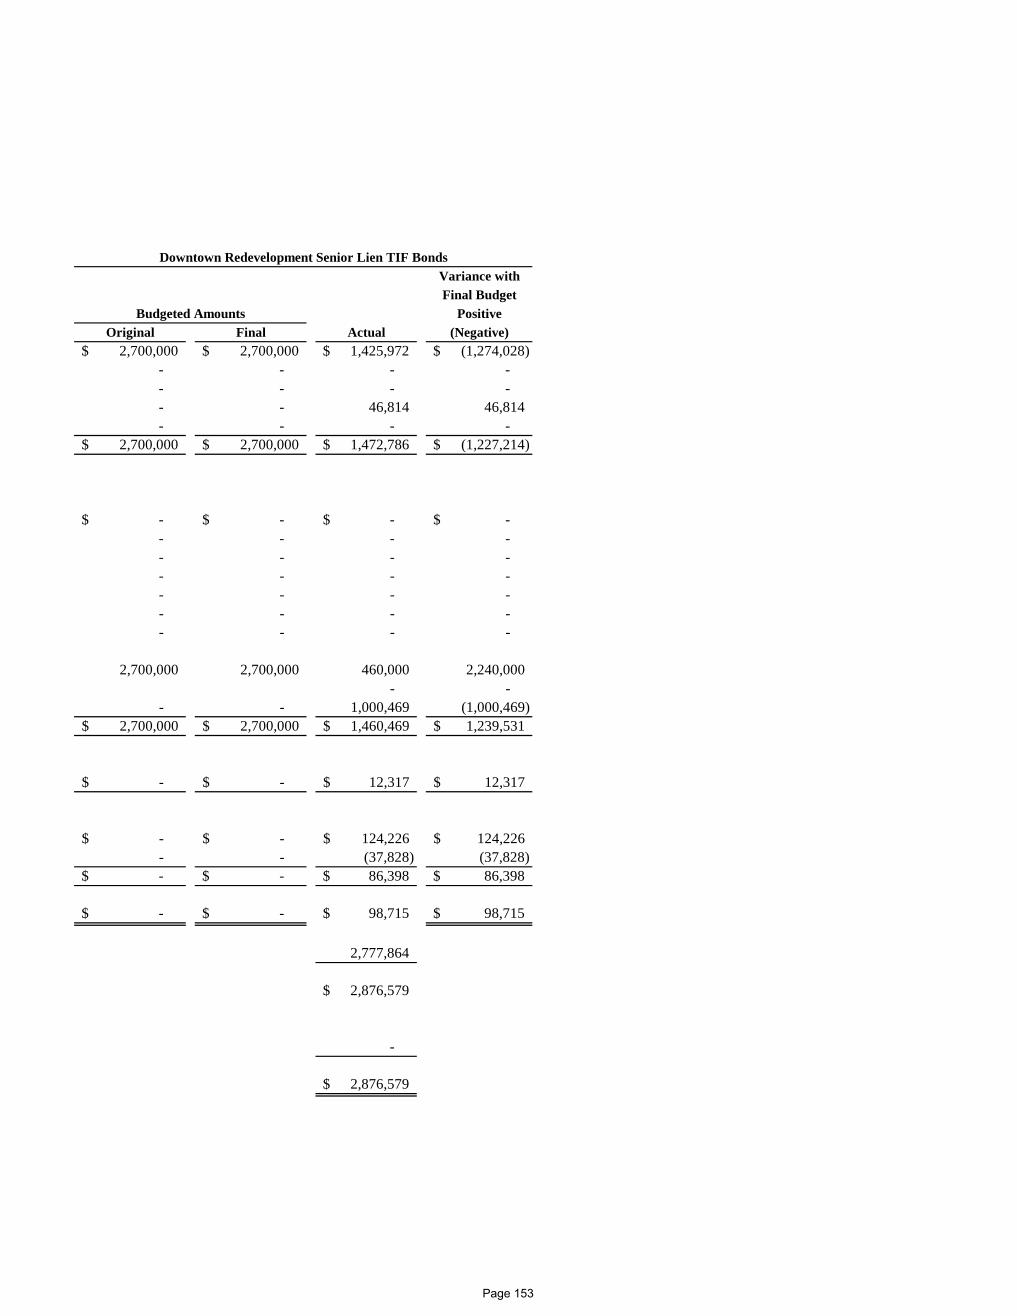
Variance withFinal Budget
PositiveOriginal Final Actual (Negative)
2,700,000$ 2,700,000$ 1,425,972$ (1,274,028)$ - - - - - - - - - - 46,814 46,814 - - - -
2,700,000$ 2,700,000$ 1,472,786$ (1,227,214)$
-$ -$ -$ -$ - - - - - - - - - - - - - - - - - - - - - - - -
2,700,000 2,700,000 460,000 2,240,000 - -
- - 1,000,469 (1,000,469) 2,700,000$ 2,700,000$ 1,460,469$ 1,239,531$
-$ -$ 12,317$ 12,317$
-$ -$ 124,226$ 124,226$ - - (37,828) (37,828) -$ -$ 86,398$ 86,398$
-$ -$ 98,715$ 98,715$
2,777,864
2,876,579$
-
2,876,579$
Budgeted Amounts
Downtown Redevelopment Senior Lien TIF Bonds
Page 153

THIS PAGE INTENTIONALLY LEFT BLANK
Page 154
INTERNAL SERVICE FUNDS
Motor Pool Fund
Health Care Fund
Workers' Compensation Fund
Photocopy Services Fund
This fund serves as a central clearinghouse for the City garage. All fuel, oil, motor vehicle parts, supplies and tools are paid from this fund.
The Internal Service Funds are used to account for services performed by one government organization or department for others. The City uses the funds to purchase and account for photocopy and motor pool supplies, employee health care and workers' compensation.
This fund serves as the central clearinghouse for all City, Library, and Housing Authority employee health care costs under the City's partially self-funded program.
The City has a partially self-funded workers' compensation program. All claims and administrative expenses are paid from this fund and money is transferred from the budgeted funds.
This fund serves as the central clearinghouse for all photocopy related expenses.
Page 155
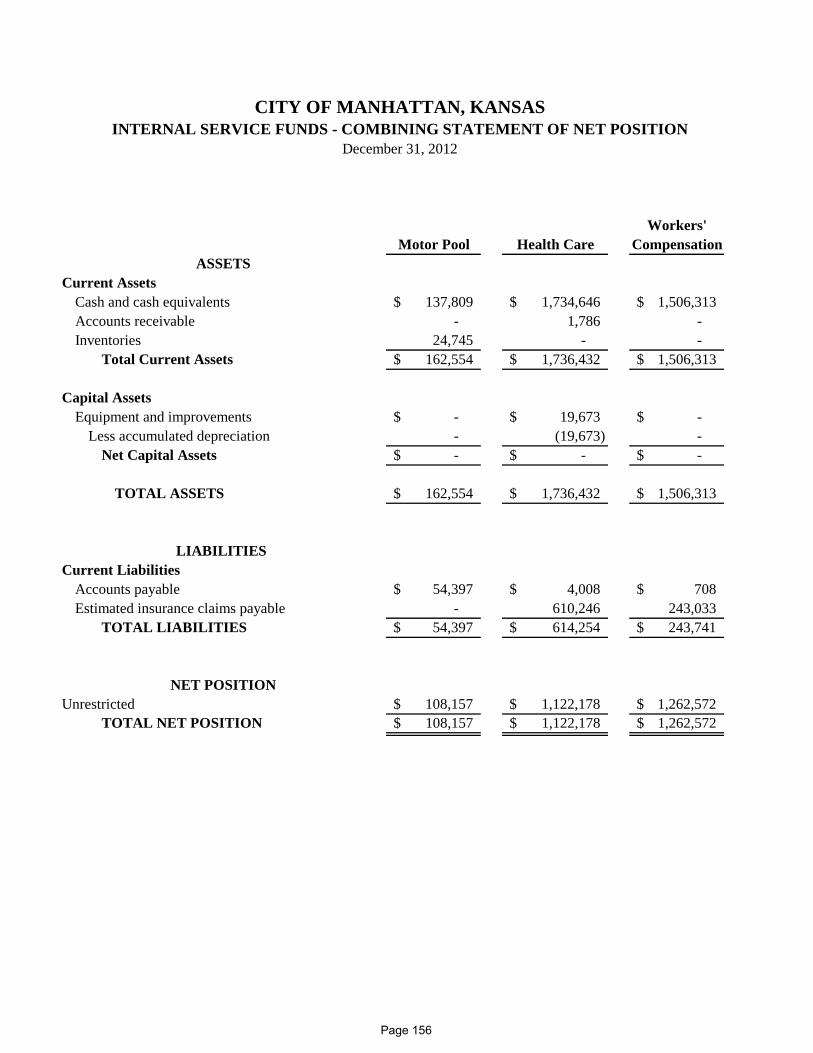
CITY OF MANHATTAN, KANSASINTERNAL SERVICE FUNDS - COMBINING STATEMENT OF NET POSITION
December 31, 2012
Workers'Motor Pool Health Care Compensation
ASSETSCurrent Assets
Cash and cash equivalents 137,809$ 1,734,646$ 1,506,313$ Accounts receivable - 1,786 - Inventories 24,745 - -
Total Current Assets 162,554$ 1,736,432$ 1,506,313$
Capital AssetsEquipment and improvements -$ 19,673$ -$
Less accumulated depreciation - (19,673) - Net Capital Assets -$ -$ -$
TOTAL ASSETS 162,554$ 1,736,432$ 1,506,313$
LIABILITIES Current Liabilities
Accounts payable 54,397$ 4,008$ 708$ Estimated insurance claims payable - 610,246 243,033
TOTAL LIABILITIES 54,397$ 614,254$ 243,741$
Unrestricted 108,157$ 1,122,178$ 1,262,572$
TOTAL NET POSITION 108,157$ 1,122,178$ 1,262,572$
NET POSITION
Page 156
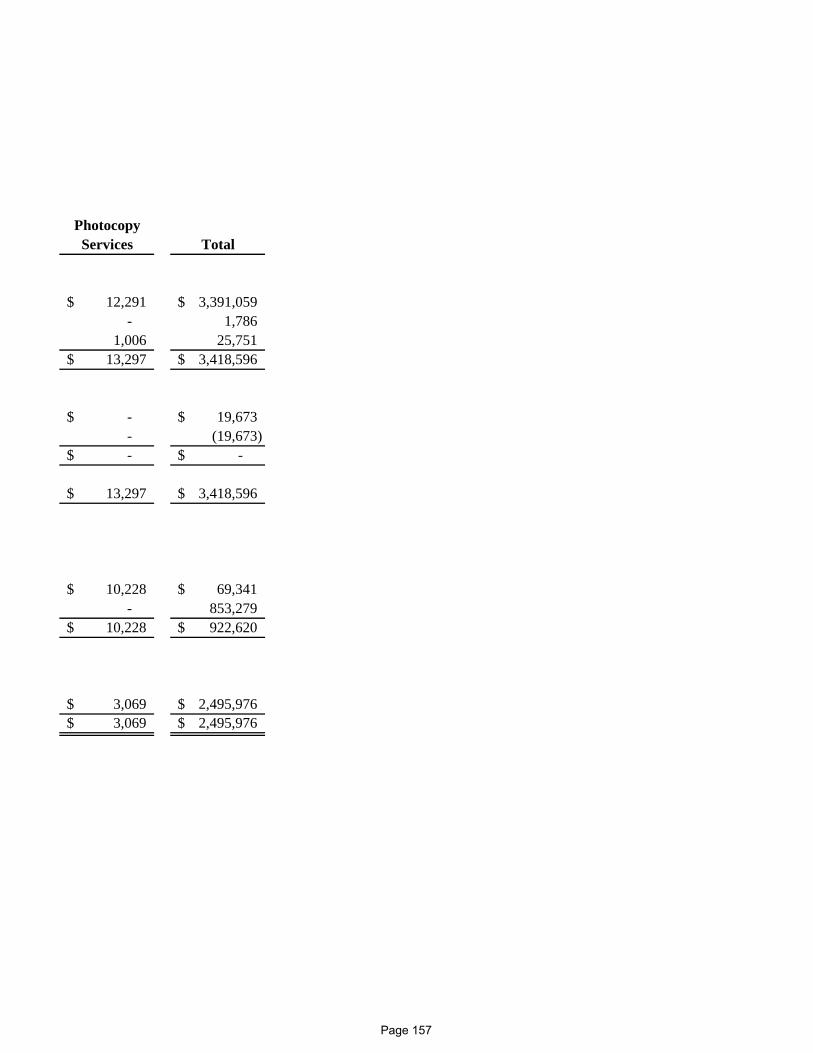
PhotocopyServices Total
12,291$ 3,391,059$ - 1,786
1,006 25,751 13,297$ 3,418,596$
-$ 19,673$ - (19,673) -$ -$
13,297$ 3,418,596$
10,228$ 69,341$ - 853,279
10,228$ 922,620$
3,069$ 2,495,976$ 3,069$ 2,495,976$
Page 157
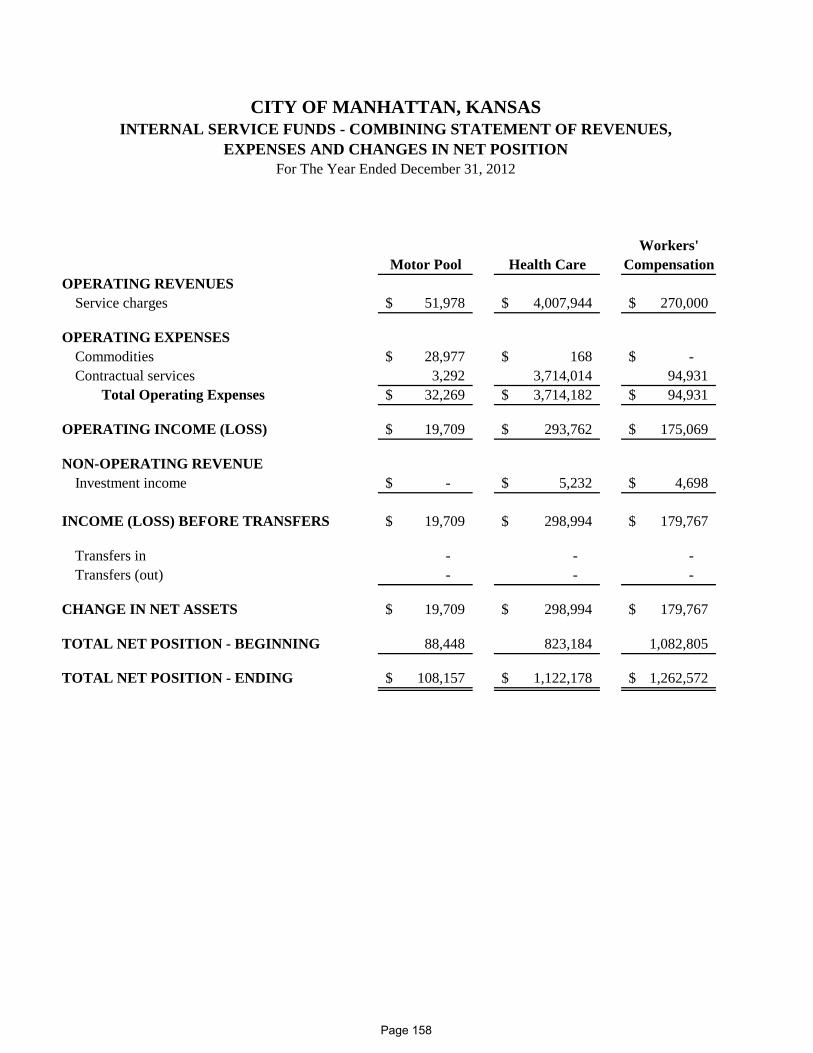
CITY OF MANHATTAN, KANSASINTERNAL SERVICE FUNDS - COMBINING STATEMENT OF REVENUES,
EXPENSES AND CHANGES IN NET POSITIONFor The Year Ended December 31, 2012
Workers'Motor Pool Health Care Compensation
OPERATING REVENUESService charges 51,978$ 4,007,944$ 270,000$
OPERATING EXPENSESCommodities 28,977$ 168$ -$ Contractual services 3,292 3,714,014 94,931
Total Operating Expenses 32,269$ 3,714,182$ 94,931$
OPERATING INCOME (LOSS) 19,709$ 293,762$ 175,069$
NON-OPERATING REVENUEInvestment income -$ 5,232$ 4,698$
INCOME (LOSS) BEFORE TRANSFERS 19,709$ 298,994$ 179,767$
Transfers in - - - Transfers (out) - - -
CHANGE IN NET ASSETS 19,709$ 298,994$ 179,767$
TOTAL NET POSITION - BEGINNING 88,448 823,184 1,082,805
TOTAL NET POSITION - ENDING 108,157$ 1,122,178$ 1,262,572$
Page 158
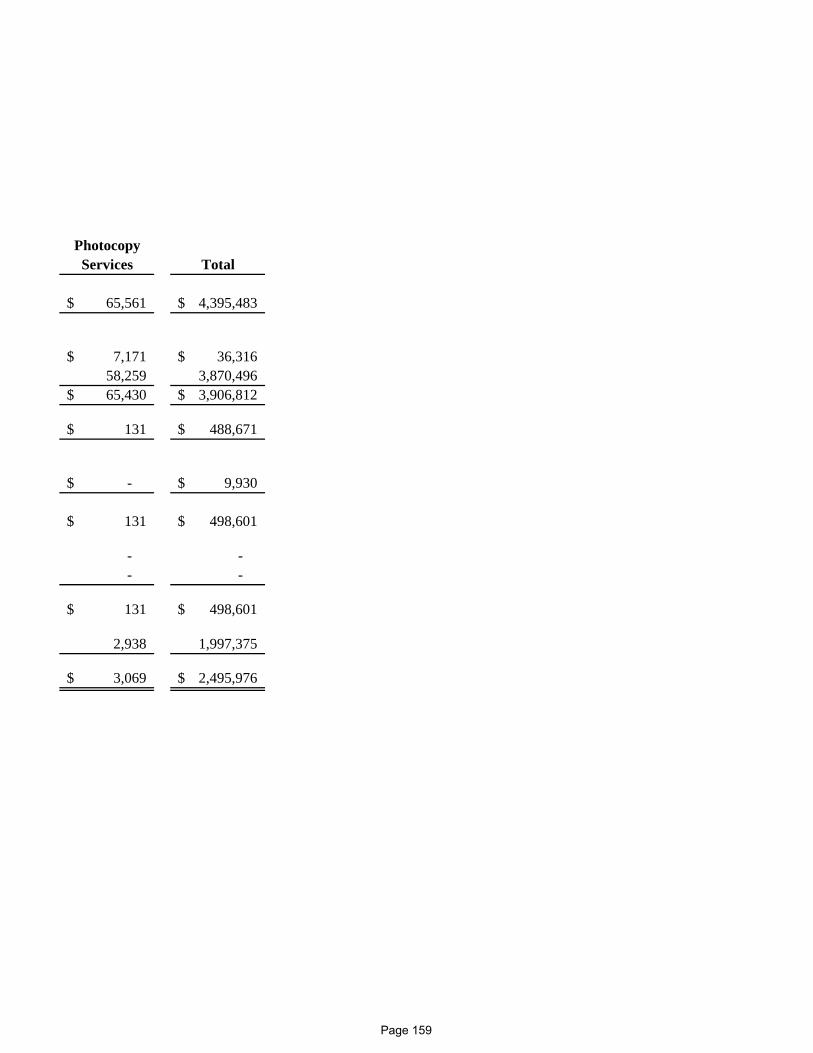
PhotocopyServices Total
65,561$ 4,395,483$
7,171$ 36,316$ 58,259 3,870,496 65,430$ 3,906,812$
131$ 488,671$
-$ 9,930$
131$ 498,601$
- - - -
131$ 498,601$
2,938 1,997,375
3,069$ 2,495,976$
Page 159
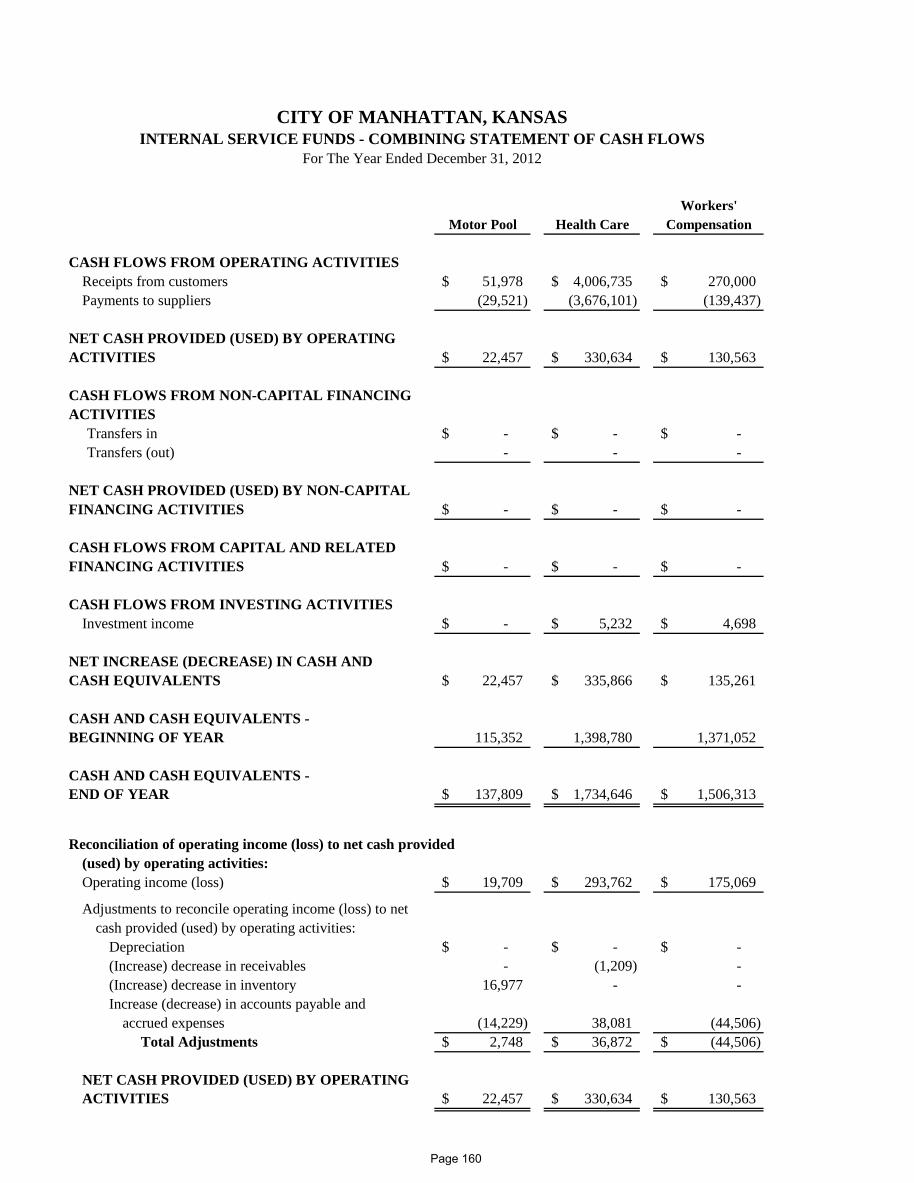
CITY OF MANHATTAN, KANSASINTERNAL SERVICE FUNDS - COMBINING STATEMENT OF CASH FLOWS
For The Year Ended December 31, 2012
Workers'Motor Pool Health Care Compensation
CASH FLOWS FROM OPERATING ACTIVITIESReceipts from customers 51,978$ 4,006,735$ 270,000$ Payments to suppliers (29,521) (3,676,101) (139,437)
NET CASH PROVIDED (USED) BY OPERATINGACTIVITIES 22,457$ 330,634$ 130,563$
CASH FLOWS FROM NON-CAPITAL FINANCINGACTIVITIES
Transfers in -$ -$ -$ Transfers (out) - - -
NET CASH PROVIDED (USED) BY NON-CAPITALFINANCING ACTIVITIES -$ -$ -$
CASH FLOWS FROM CAPITAL AND RELATEDFINANCING ACTIVITIES -$ -$ -$
CASH FLOWS FROM INVESTING ACTIVITIESInvestment income -$ 5,232$ 4,698$
NET INCREASE (DECREASE) IN CASH ANDCASH EQUIVALENTS 22,457$ 335,866$ 135,261$
CASH AND CASH EQUIVALENTS - BEGINNING OF YEAR 115,352 1,398,780 1,371,052
CASH AND CASH EQUIVALENTS - END OF YEAR 137,809$ 1,734,646$ 1,506,313$
Reconciliation of operating income (loss) to net cash provided (used) by operating activities:Operating income (loss) 19,709$ 293,762$ 175,069$
Adjustments to reconcile operating income (loss) to net cash provided (used) by operating activities:
Depreciation -$ -$ -$ (Increase) decrease in receivables - (1,209) - (Increase) decrease in inventory 16,977 - - Increase (decrease) in accounts payable and
accrued expenses (14,229) 38,081 (44,506) Total Adjustments 2,748$ 36,872$ (44,506)$
NET CASH PROVIDED (USED) BY OPERATINGACTIVITIES 22,457$ 330,634$ 130,563$
Page 160
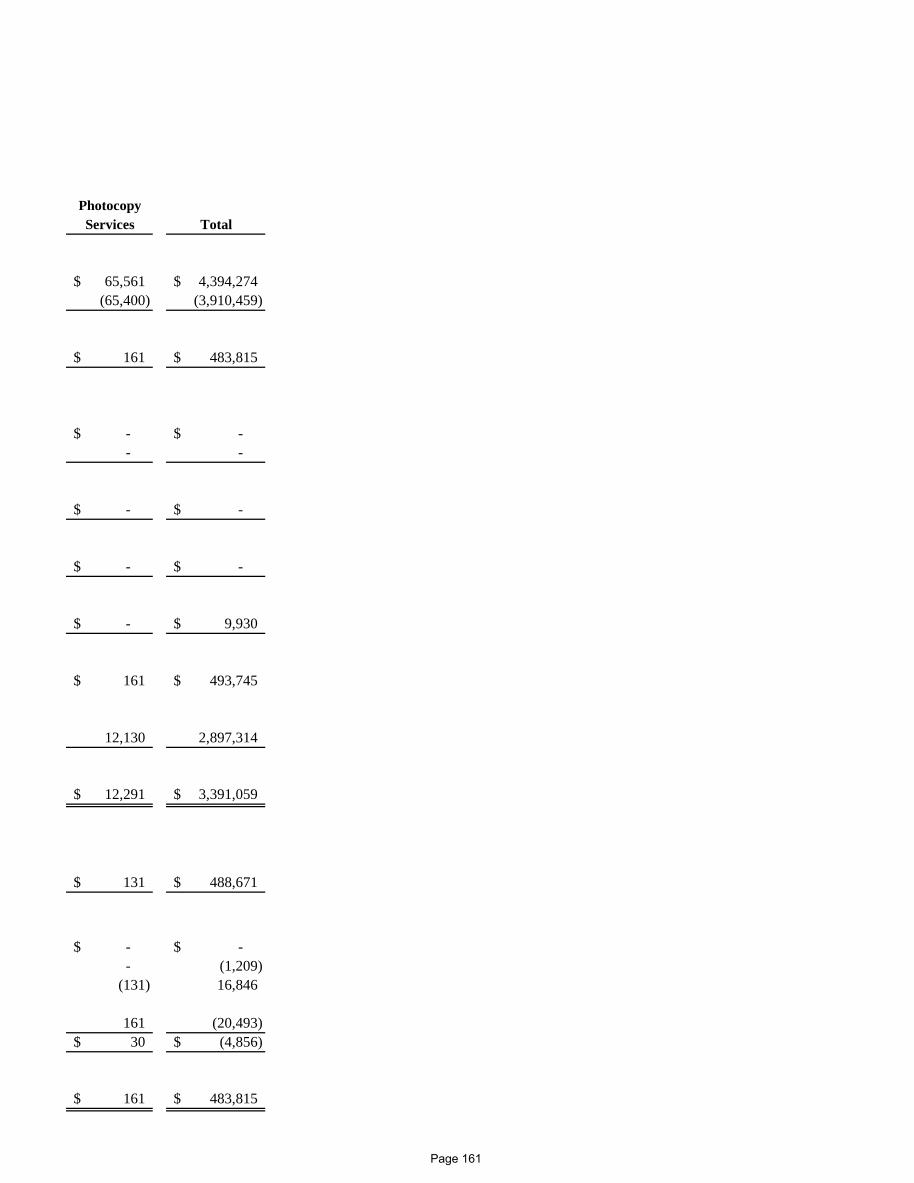
PhotocopyServices Total
65,561$ 4,394,274$ (65,400) (3,910,459)
161$ 483,815$
-$ -$ - -
-$ -$
-$ -$
-$ 9,930$
161$ 493,745$
12,130 2,897,314
12,291$ 3,391,059$
131$ 488,671$
-$ -$ - (1,209)
(131) 16,846
161 (20,493) 30$ (4,856)$
161$ 483,815$
Page 161

THIS PAGE INTENTIONALLY LEFT BLANK
Page 162
STATISTICAL SECTION
Contents Page
Financial Trends164
Revenue Capacity174
Debt Capacity186
Demographic and Economic Information193
Operating Information195
Sources: Unless otherwise noted, the information in these schedules is derived from the comprehensive annual financial reports for the relevant year.
These schedules contain trend information to help the reader understand how the City's financial performance and well-being have changed over time.
This part of the City of Manhattan's comprehensive annual financial report presents detailed information as a context for understanding what the information in the financial statements, note disclosures, and required supplementary information says about the City's overall financial health.
These schedules contain information to help the reader assess the City's most significant local revenue sources, property tax and sales tax.
These schedules present information to help the reader assess the affordability of the City's current levels of outstanding debt and the City's ability to issue additional debt in the future.
These schedules offer demographic and economic indicators to help the reader understand the environment within which the City's financial activities take place.
These schedules contain service and infrastructure data to help the reader understand how the information in the City's financial report relates to the services the government provides and the activities it performs.
Page 163
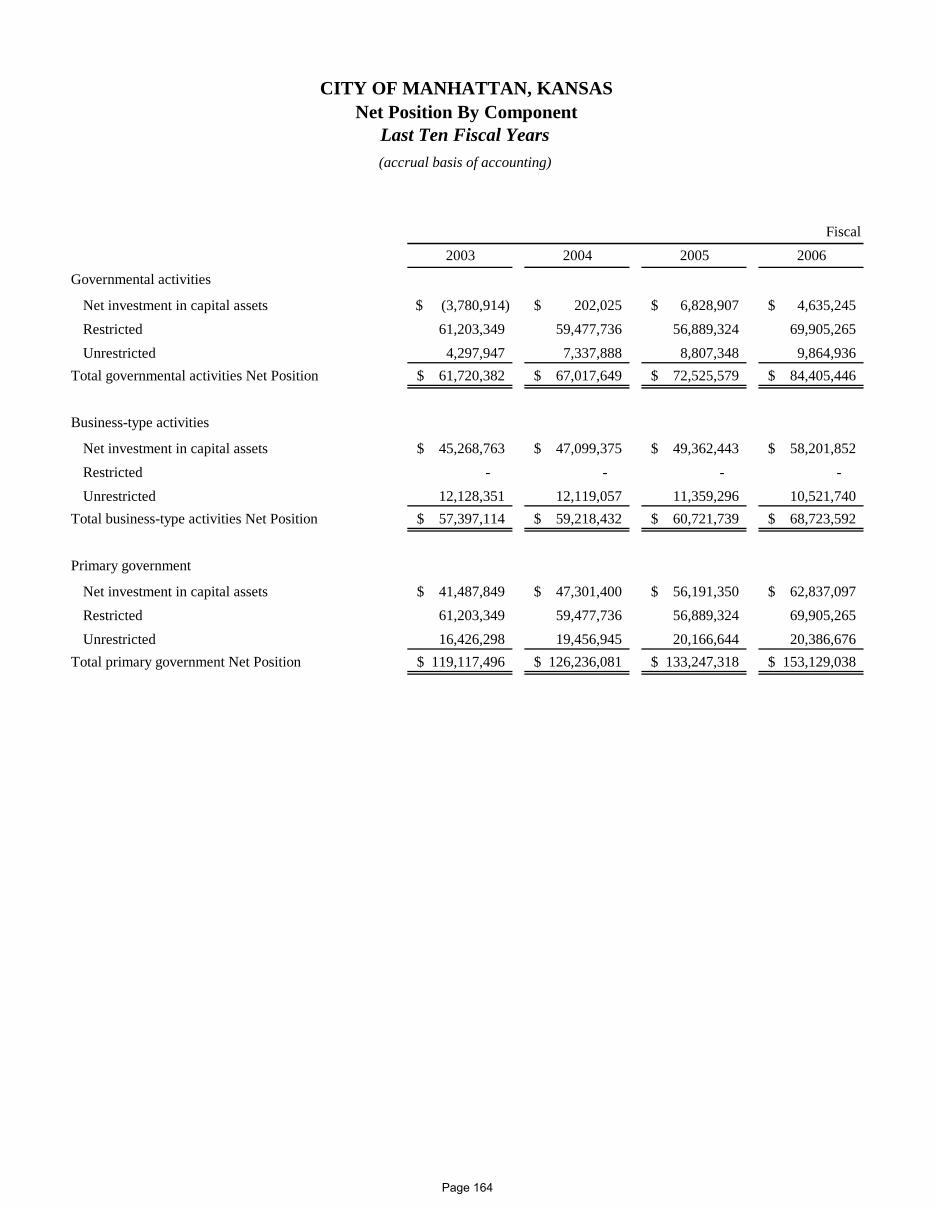
Fiscal2003 2004 2005 2006
Governmental activities
Net investment in capital assets (3,780,914)$ 202,025$ 6,828,907$ 4,635,245$ Restricted 61,203,349 59,477,736 56,889,324 69,905,265 Unrestricted 4,297,947 7,337,888 8,807,348 9,864,936
Total governmental activities Net Position 61,720,382$ 67,017,649$ 72,525,579$ 84,405,446$
Business-type activities
Net investment in capital assets 45,268,763$ 47,099,375$ 49,362,443$ 58,201,852$ Restricted - - - - Unrestricted 12,128,351 12,119,057 11,359,296 10,521,740
Total business-type activities Net Position 57,397,114$ 59,218,432$ 60,721,739$ 68,723,592$
Primary government
Net investment in capital assets 41,487,849$ 47,301,400$ 56,191,350$ 62,837,097$ Restricted 61,203,349 59,477,736 56,889,324 69,905,265 Unrestricted 16,426,298 19,456,945 20,166,644 20,386,676
Total primary government Net Position 119,117,496$ 126,236,081$ 133,247,318$ 153,129,038$
CITY OF MANHATTAN, KANSASNet Position By Component
Last Ten Fiscal Years(accrual basis of accounting)
Page 164
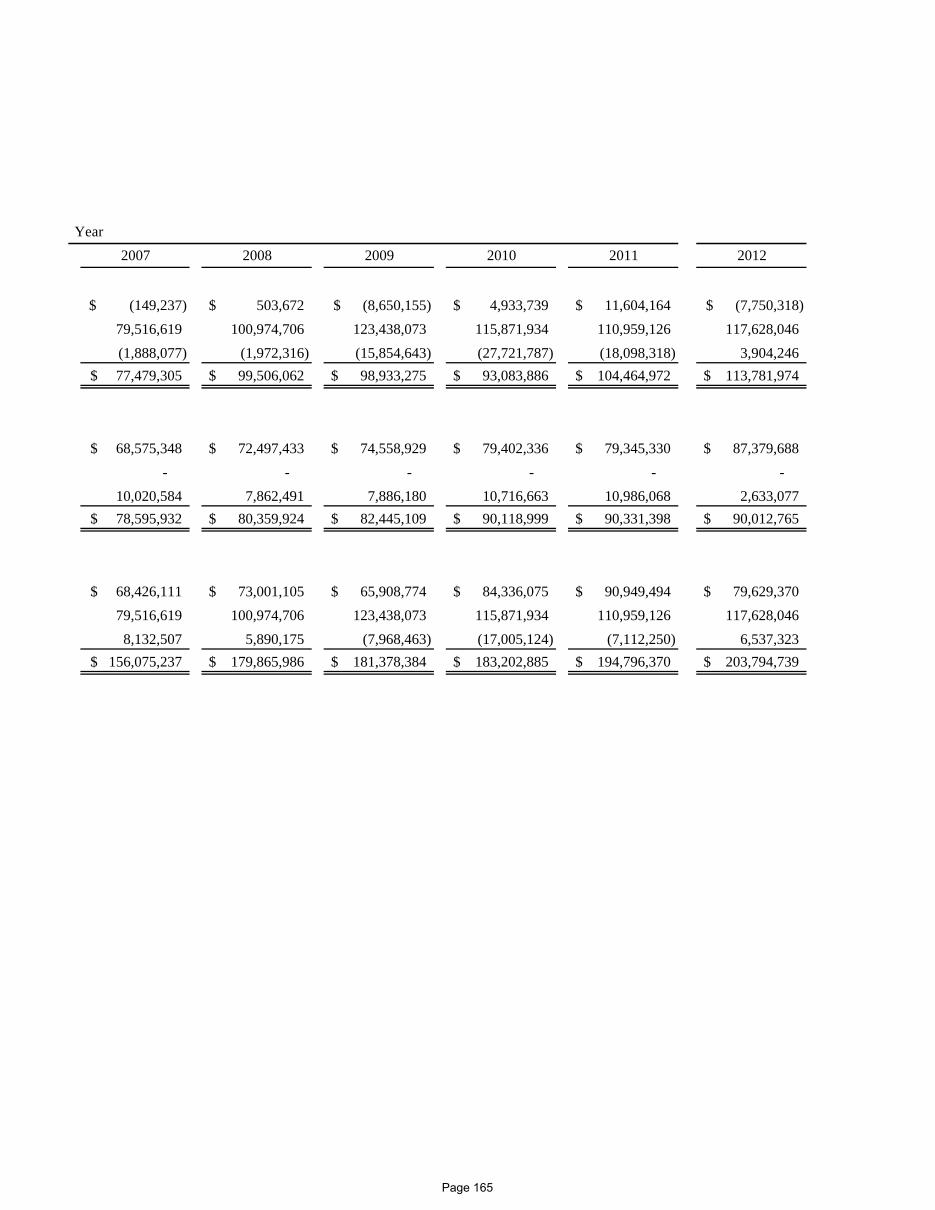
Year2007 2008 2009 2010 2011 2012
(149,237)$ 503,672$ (8,650,155)$ 4,933,739$ 11,604,164$ (7,750,318)$ 79,516,619 100,974,706 123,438,073 115,871,934 110,959,126 117,628,046 (1,888,077) (1,972,316) (15,854,643) (27,721,787) (18,098,318) 3,904,246 77,479,305$ 99,506,062$ 98,933,275$ 93,083,886$ 104,464,972$ 113,781,974$
68,575,348$ 72,497,433$ 74,558,929$ 79,402,336$ 79,345,330$ 87,379,688$ - - - - - -
10,020,584 7,862,491 7,886,180 10,716,663 10,986,068 2,633,077 78,595,932$ 80,359,924$ 82,445,109$ 90,118,999$ 90,331,398$ 90,012,765$
68,426,111$ 73,001,105$ 65,908,774$ 84,336,075$ 90,949,494$ 79,629,370$ 79,516,619 100,974,706 123,438,073 115,871,934 110,959,126 117,628,046 8,132,507 5,890,175 (7,968,463) (17,005,124) (7,112,250) 6,537,323
156,075,237$ 179,865,986$ 181,378,384$ 183,202,885$ 194,796,370$ 203,794,739$
Page 165
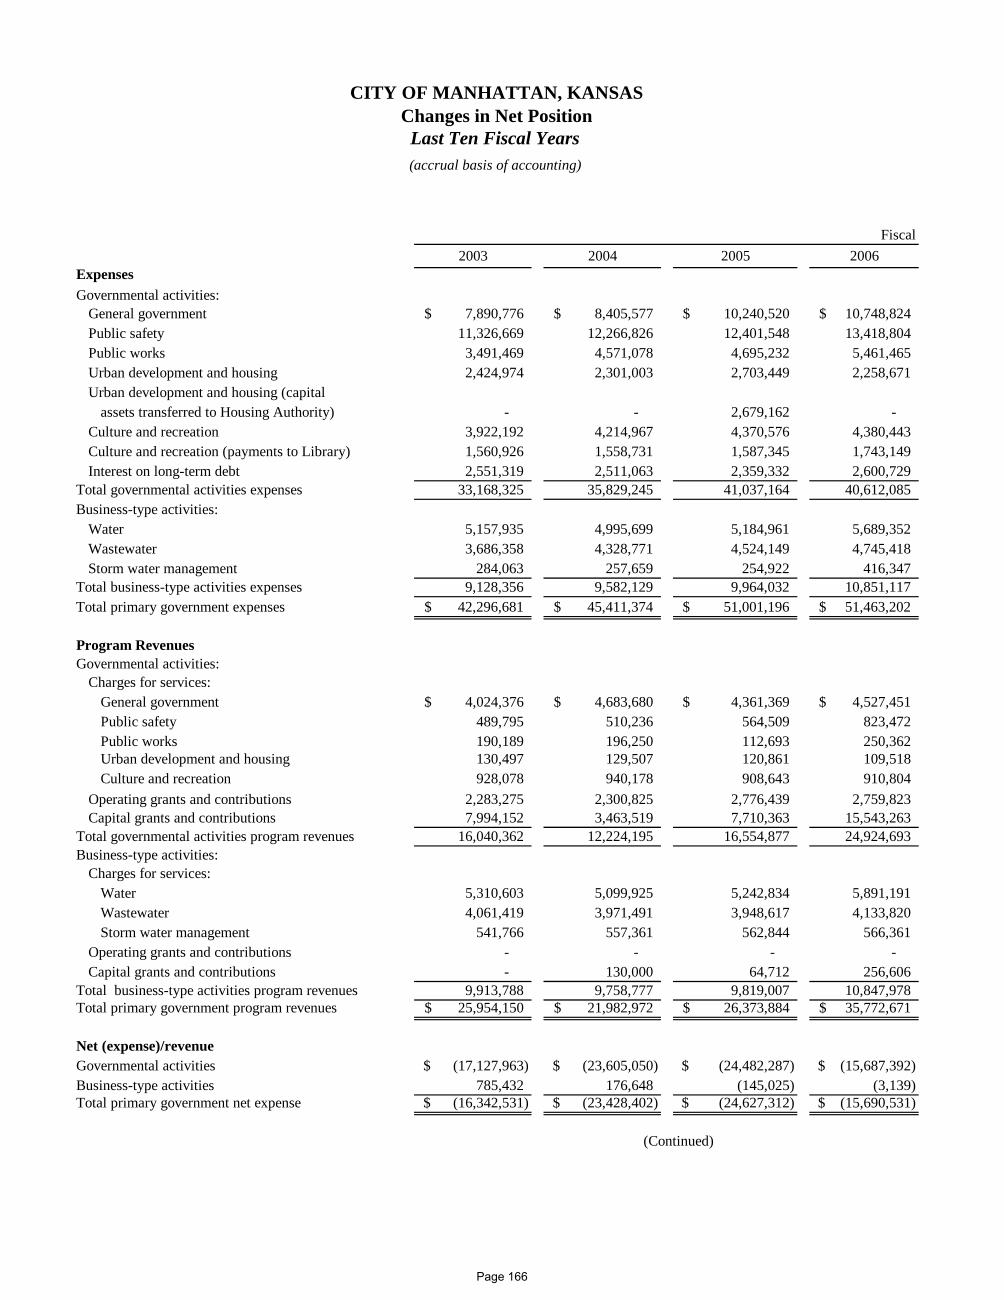
Fiscal2003 2004 2005 2006
ExpensesGovernmental activities:
General government 7,890,776$ 8,405,577$ 10,240,520$ 10,748,824$ Public safety 11,326,669 12,266,826 12,401,548 13,418,804 Public works 3,491,469 4,571,078 4,695,232 5,461,465 Urban development and housing 2,424,974 2,301,003 2,703,449 2,258,671 Urban development and housing (capital
assets transferred to Housing Authority) - - 2,679,162 - Culture and recreation 3,922,192 4,214,967 4,370,576 4,380,443 Culture and recreation (payments to Library) 1,560,926 1,558,731 1,587,345 1,743,149 Interest on long-term debt 2,551,319 2,511,063 2,359,332 2,600,729
Total governmental activities expenses 33,168,325 35,829,245 41,037,164 40,612,085 Business-type activities:
Water 5,157,935 4,995,699 5,184,961 5,689,352 Wastewater 3,686,358 4,328,771 4,524,149 4,745,418 Storm water management 284,063 257,659 254,922 416,347
Total business-type activities expenses 9,128,356 9,582,129 9,964,032 10,851,117 Total primary government expenses 42,296,681$ 45,411,374$ 51,001,196$ 51,463,202$
Program RevenuesGovernmental activities:
Charges for services:General government 4,024,376$ 4,683,680$ 4,361,369$ 4,527,451$ Public safety 489,795 510,236 564,509 823,472 Public works 190,189 196,250 112,693 250,362 Urban development and housing 130,497 129,507 120,861 109,518 Culture and recreation 928,078 940,178 908,643 910,804
Operating grants and contributions 2,283,275 2,300,825 2,776,439 2,759,823 Capital grants and contributions 7,994,152 3,463,519 7,710,363 15,543,263
Total governmental activities program revenues 16,040,362 12,224,195 16,554,877 24,924,693 Business-type activities:
Charges for services:Water 5,310,603 5,099,925 5,242,834 5,891,191 Wastewater 4,061,419 3,971,491 3,948,617 4,133,820 Storm water management 541,766 557,361 562,844 566,361
Operating grants and contributions - - - - Capital grants and contributions - 130,000 64,712 256,606
Total business-type activities program revenues 9,913,788 9,758,777 9,819,007 10,847,978 Total primary government program revenues 25,954,150$ 21,982,972$ 26,373,884$ 35,772,671$
Net (expense)/revenueGovernmental activities (17,127,963)$ (23,605,050)$ (24,482,287)$ (15,687,392)$ Business-type activities 785,432 176,648 (145,025) (3,139) Total primary government net expense (16,342,531)$ (23,428,402)$ (24,627,312)$ (15,690,531)$
CITY OF MANHATTAN, KANSASChanges in Net Position
Last Ten Fiscal Years(accrual basis of accounting)
(Continued)
Page 166
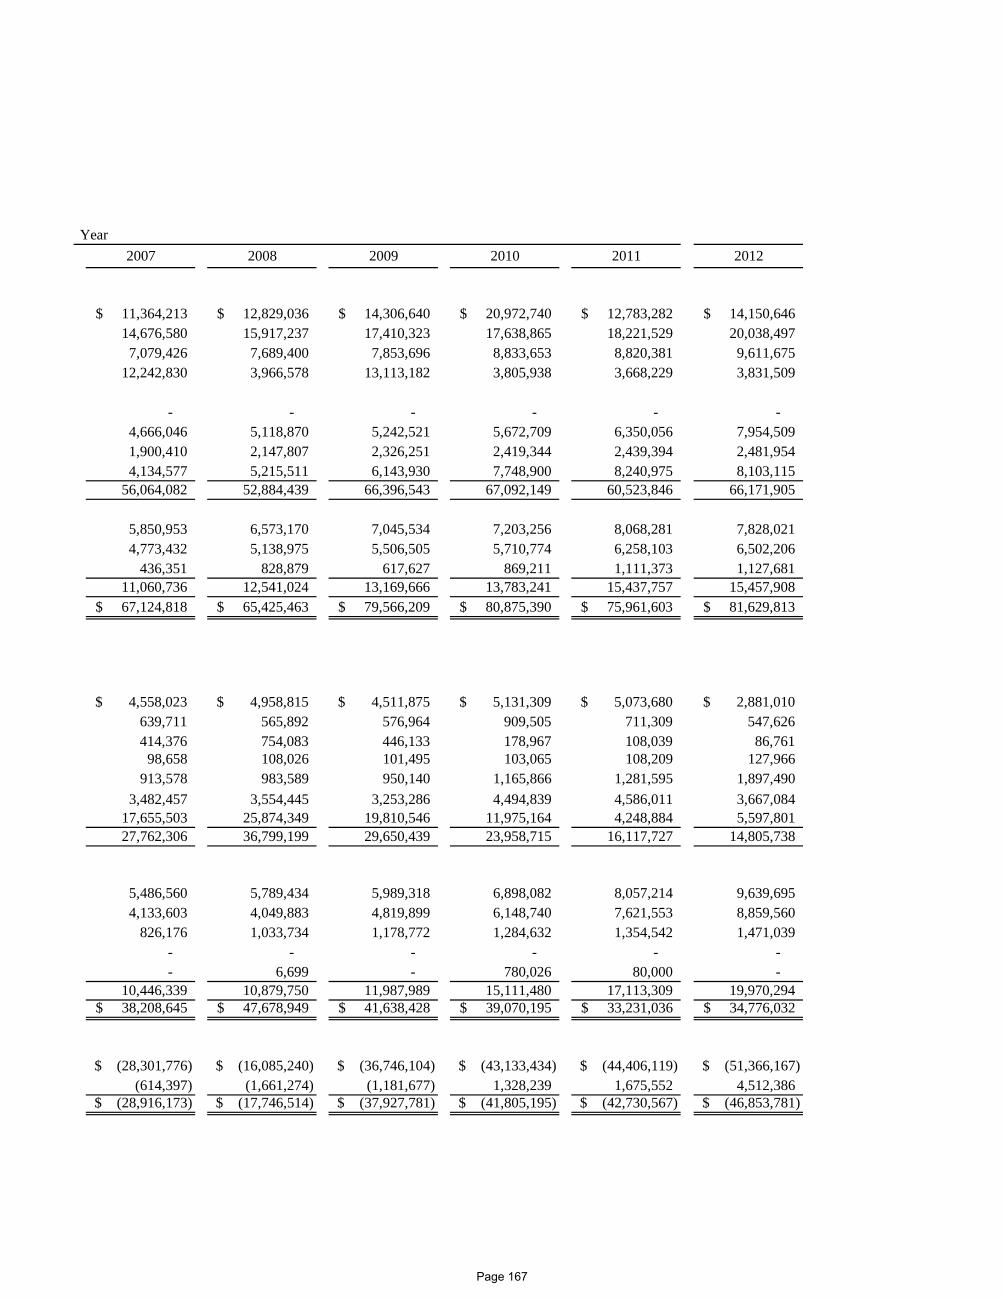
Year2007 2008 2009 2010 2011 2012
11,364,213$ 12,829,036$ 14,306,640$ 20,972,740$ 12,783,282$ 14,150,646$ 14,676,580 15,917,237 17,410,323 17,638,865 18,221,529 20,038,497 7,079,426 7,689,400 7,853,696 8,833,653 8,820,381 9,611,675
12,242,830 3,966,578 13,113,182 3,805,938 3,668,229 3,831,509
- - - - - - 4,666,046 5,118,870 5,242,521 5,672,709 6,350,056 7,954,509 1,900,410 2,147,807 2,326,251 2,419,344 2,439,394 2,481,954 4,134,577 5,215,511 6,143,930 7,748,900 8,240,975 8,103,115
56,064,082 52,884,439 66,396,543 67,092,149 60,523,846 66,171,905
5,850,953 6,573,170 7,045,534 7,203,256 8,068,281 7,828,021 4,773,432 5,138,975 5,506,505 5,710,774 6,258,103 6,502,206
436,351 828,879 617,627 869,211 1,111,373 1,127,681 11,060,736 12,541,024 13,169,666 13,783,241 15,437,757 15,457,908 67,124,818$ 65,425,463$ 79,566,209$ 80,875,390$ 75,961,603$ 81,629,813$
4,558,023$ 4,958,815$ 4,511,875$ 5,131,309$ 5,073,680$ 2,881,010$ 639,711 565,892 576,964 909,505 711,309 547,626 414,376 754,083 446,133 178,967 108,039 86,761
98,658 108,026 101,495 103,065 108,209 127,966 913,578 983,589 950,140 1,165,866 1,281,595 1,897,490
3,482,457 3,554,445 3,253,286 4,494,839 4,586,011 3,667,084 17,655,503 25,874,349 19,810,546 11,975,164 4,248,884 5,597,801 27,762,306 36,799,199 29,650,439 23,958,715 16,117,727 14,805,738
5,486,560 5,789,434 5,989,318 6,898,082 8,057,214 9,639,695 4,133,603 4,049,883 4,819,899 6,148,740 7,621,553 8,859,560
826,176 1,033,734 1,178,772 1,284,632 1,354,542 1,471,039 - - - - - - - 6,699 - 780,026 80,000 -
10,446,339 10,879,750 11,987,989 15,111,480 17,113,309 19,970,294 38,208,645$ 47,678,949$ 41,638,428$ 39,070,195$ 33,231,036$ 34,776,032$
(28,301,776)$ (16,085,240)$ (36,746,104)$ (43,133,434)$ (44,406,119)$ (51,366,167)$ (614,397) (1,661,274) (1,181,677) 1,328,239 1,675,552 4,512,386
(28,916,173)$ (17,746,514)$ (37,927,781)$ (41,805,195)$ (42,730,567)$ (46,853,781)$
Page 167
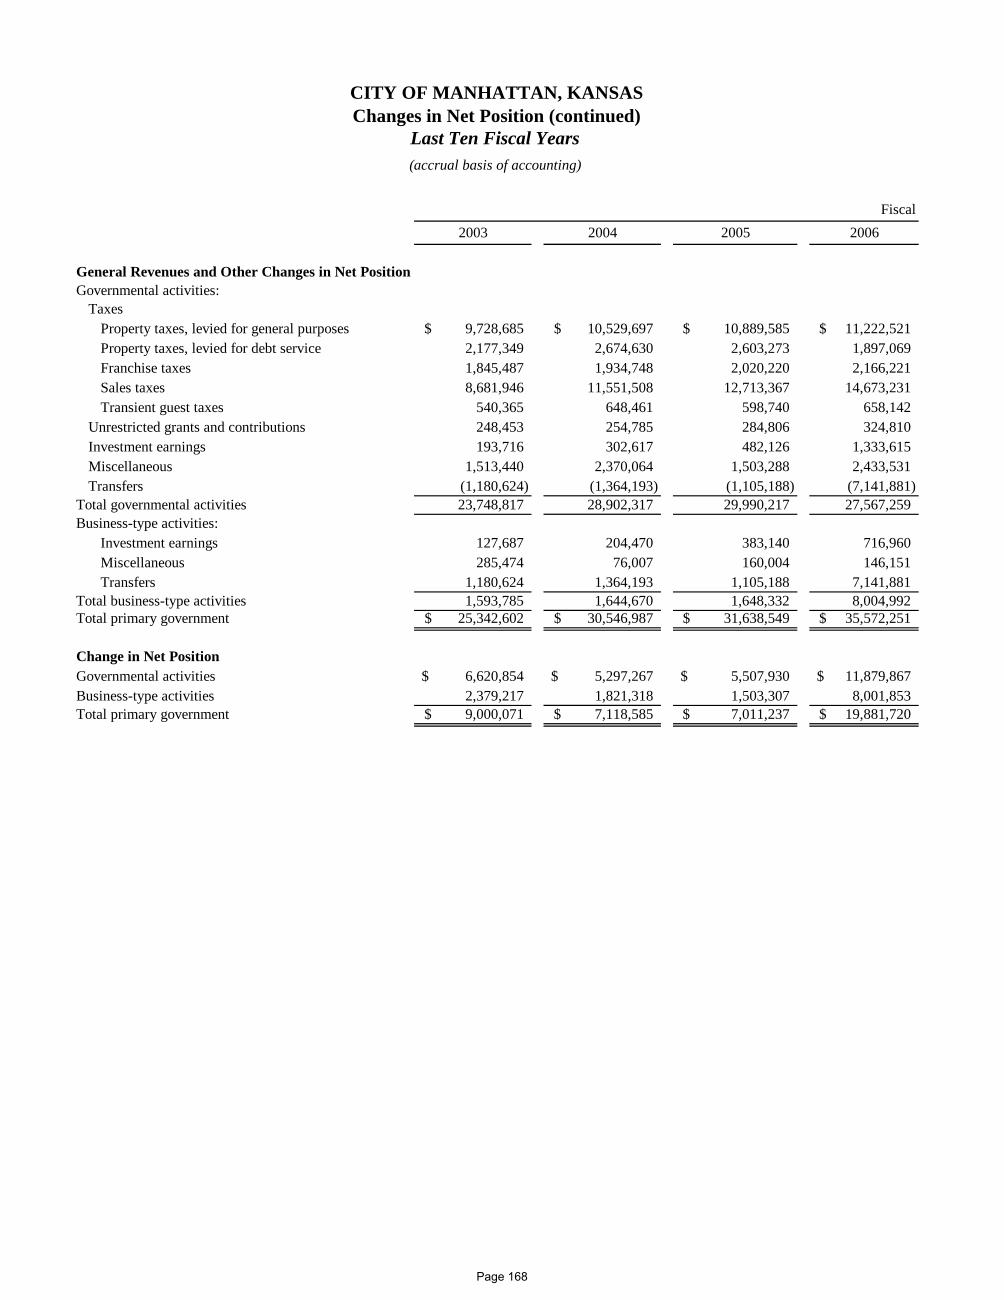
Fiscal2003 2004 2005 2006
General Revenues and Other Changes in Net PositionGovernmental activities:
TaxesProperty taxes, levied for general purposes 9,728,685$ 10,529,697$ 10,889,585$ 11,222,521$ Property taxes, levied for debt service 2,177,349 2,674,630 2,603,273 1,897,069 Franchise taxes 1,845,487 1,934,748 2,020,220 2,166,221 Sales taxes 8,681,946 11,551,508 12,713,367 14,673,231 Transient guest taxes 540,365 648,461 598,740 658,142
Unrestricted grants and contributions 248,453 254,785 284,806 324,810 Investment earnings 193,716 302,617 482,126 1,333,615 Miscellaneous 1,513,440 2,370,064 1,503,288 2,433,531 Transfers (1,180,624) (1,364,193) (1,105,188) (7,141,881)
Total governmental activities 23,748,817 28,902,317 29,990,217 27,567,259 Business-type activities:
Investment earnings 127,687 204,470 383,140 716,960 Miscellaneous 285,474 76,007 160,004 146,151 Transfers 1,180,624 1,364,193 1,105,188 7,141,881
Total business-type activities 1,593,785 1,644,670 1,648,332 8,004,992 Total primary government 25,342,602$ 30,546,987$ 31,638,549$ 35,572,251$
Change in Net PositionGovernmental activities 6,620,854$ 5,297,267$ 5,507,930$ 11,879,867$ Business-type activities 2,379,217 1,821,318 1,503,307 8,001,853 Total primary government 9,000,071$ 7,118,585$ 7,011,237$ 19,881,720$
CITY OF MANHATTAN, KANSASChanges in Net Position (continued)
Last Ten Fiscal Years(accrual basis of accounting)
Page 168
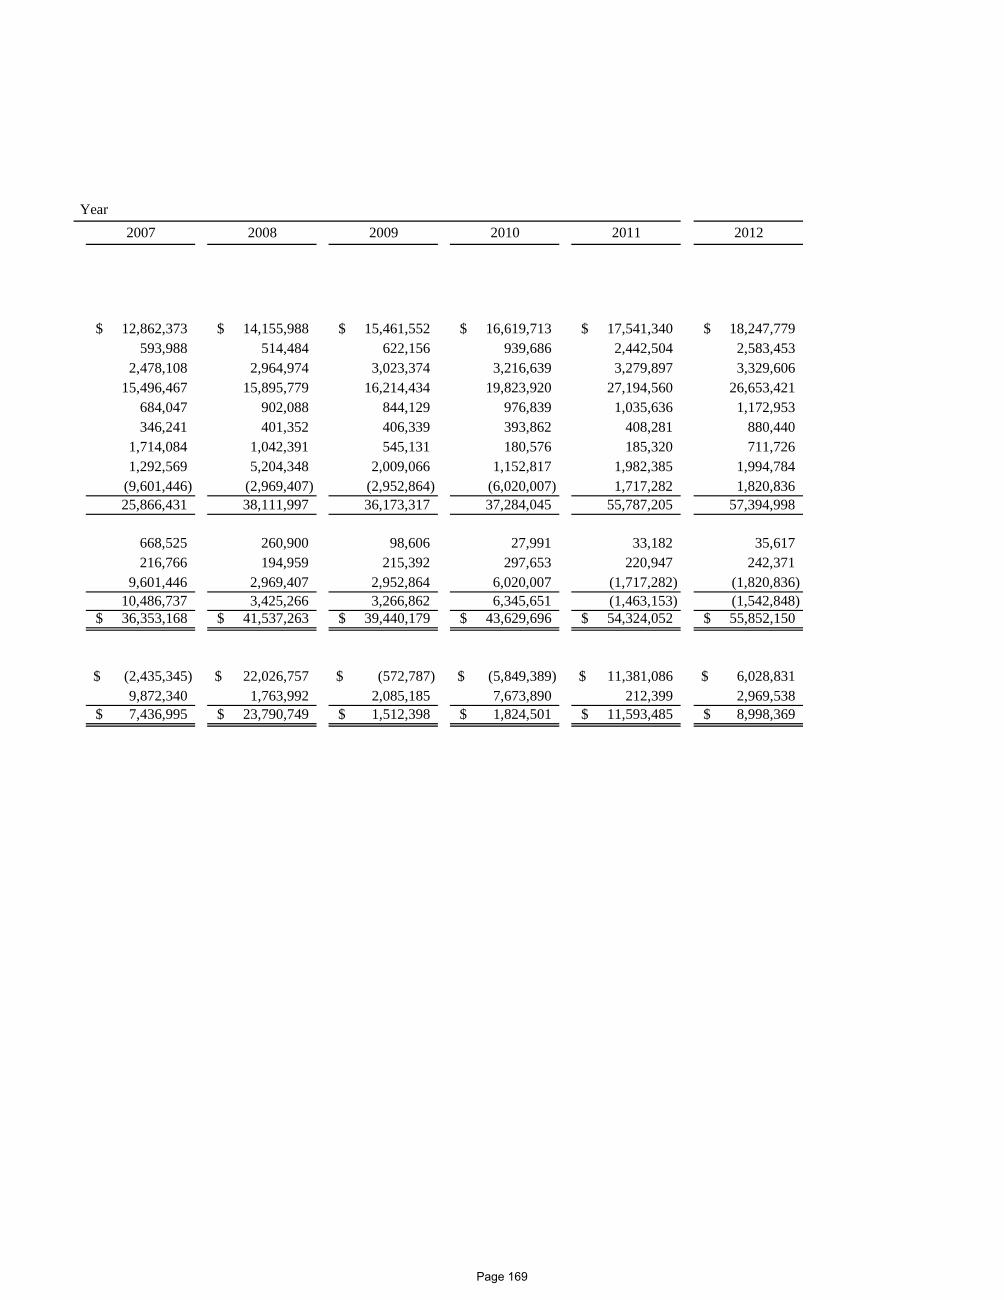
Year2007 2008 2009 2010 2011 2012
12,862,373$ 14,155,988$ 15,461,552$ 16,619,713$ 17,541,340$ 18,247,779$ 593,988 514,484 622,156 939,686 2,442,504 2,583,453
2,478,108 2,964,974 3,023,374 3,216,639 3,279,897 3,329,606 15,496,467 15,895,779 16,214,434 19,823,920 27,194,560 26,653,421
684,047 902,088 844,129 976,839 1,035,636 1,172,953 346,241 401,352 406,339 393,862 408,281 880,440
1,714,084 1,042,391 545,131 180,576 185,320 711,726 1,292,569 5,204,348 2,009,066 1,152,817 1,982,385 1,994,784
(9,601,446) (2,969,407) (2,952,864) (6,020,007) 1,717,282 1,820,836 25,866,431 38,111,997 36,173,317 37,284,045 55,787,205 57,394,998
668,525 260,900 98,606 27,991 33,182 35,617 216,766 194,959 215,392 297,653 220,947 242,371
9,601,446 2,969,407 2,952,864 6,020,007 (1,717,282) (1,820,836) 10,486,737 3,425,266 3,266,862 6,345,651 (1,463,153) (1,542,848) 36,353,168$ 41,537,263$ 39,440,179$ 43,629,696$ 54,324,052$ 55,852,150$
(2,435,345)$ 22,026,757$ (572,787)$ (5,849,389)$ 11,381,086$ 6,028,831$ 9,872,340 1,763,992 2,085,185 7,673,890 212,399 2,969,538 7,436,995$ 23,790,749$ 1,512,398$ 1,824,501$ 11,593,485$ 8,998,369$
Page 169
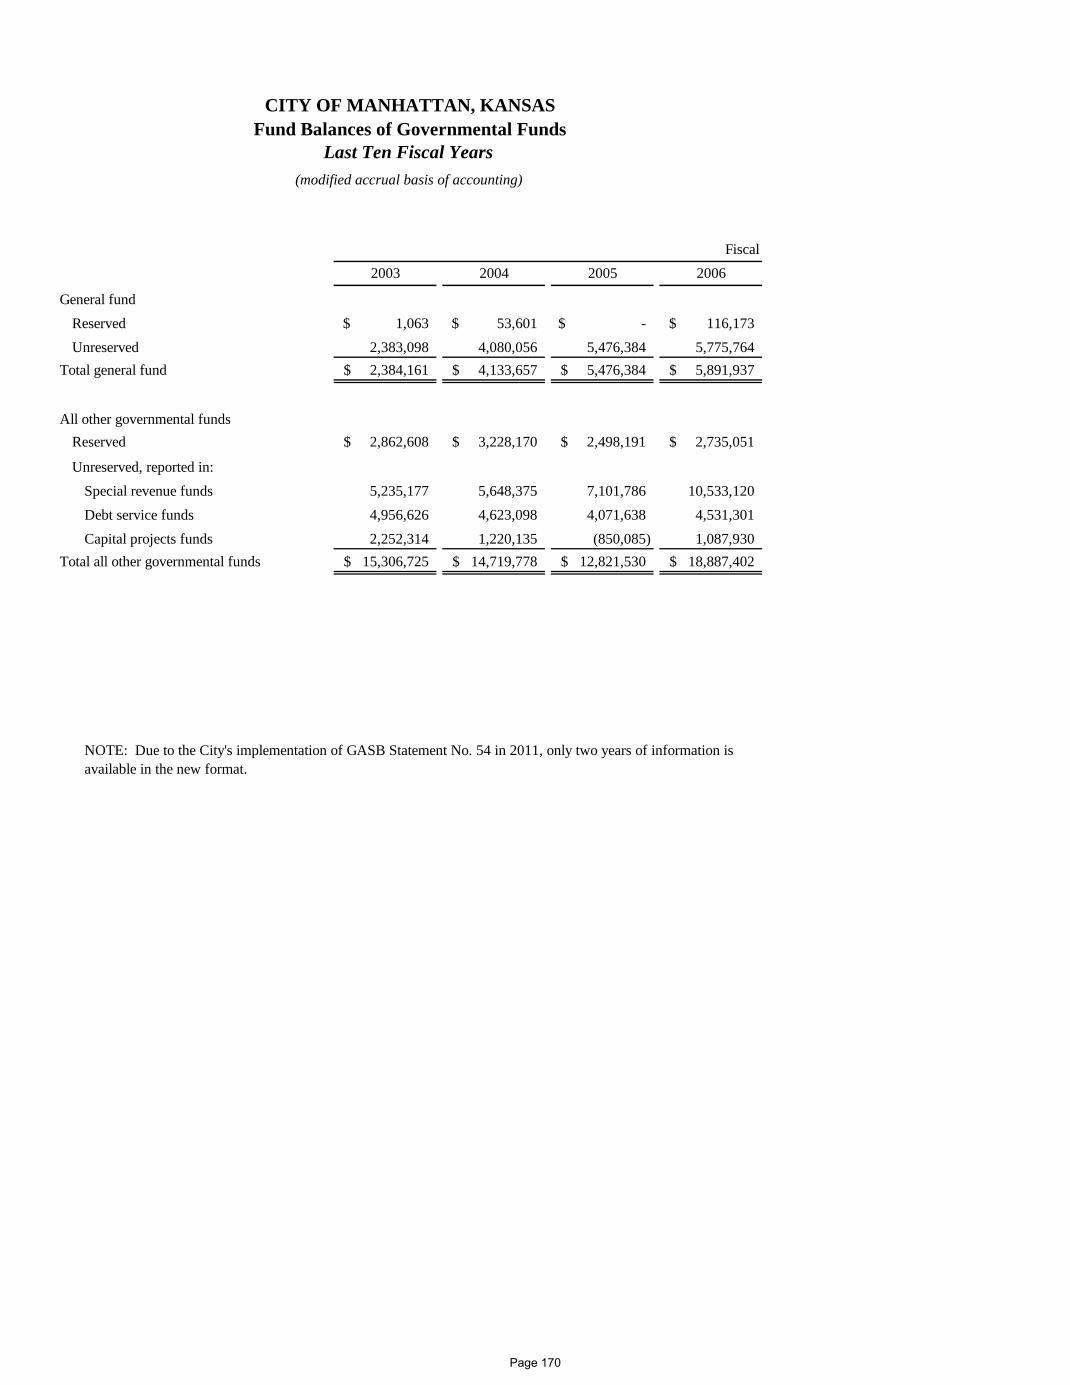
Fiscal2003 2004 2005 2006
General fundReserved 1,063$ 53,601$ -$ 116,173$ Unreserved 2,383,098 4,080,056 5,476,384 5,775,764
Total general fund 2,384,161$ 4,133,657$ 5,476,384$ 5,891,937$
All other governmental fundsReserved 2,862,608$ 3,228,170$ 2,498,191$ 2,735,051$
Unreserved, reported in:Special revenue funds 5,235,177 5,648,375 7,101,786 10,533,120 Debt service funds 4,956,626 4,623,098 4,071,638 4,531,301 Capital projects funds 2,252,314 1,220,135 (850,085) 1,087,930
Total all other governmental funds 15,306,725$ 14,719,778$ 12,821,530$ 18,887,402$
NOTE: Due to the City's implementation of GASB Statement No. 54 in 2011, only two years of information is available in the new format.
CITY OF MANHATTAN, KANSASFund Balances of Governmental Funds
Last Ten Fiscal Years(modified accrual basis of accounting)
Page 170
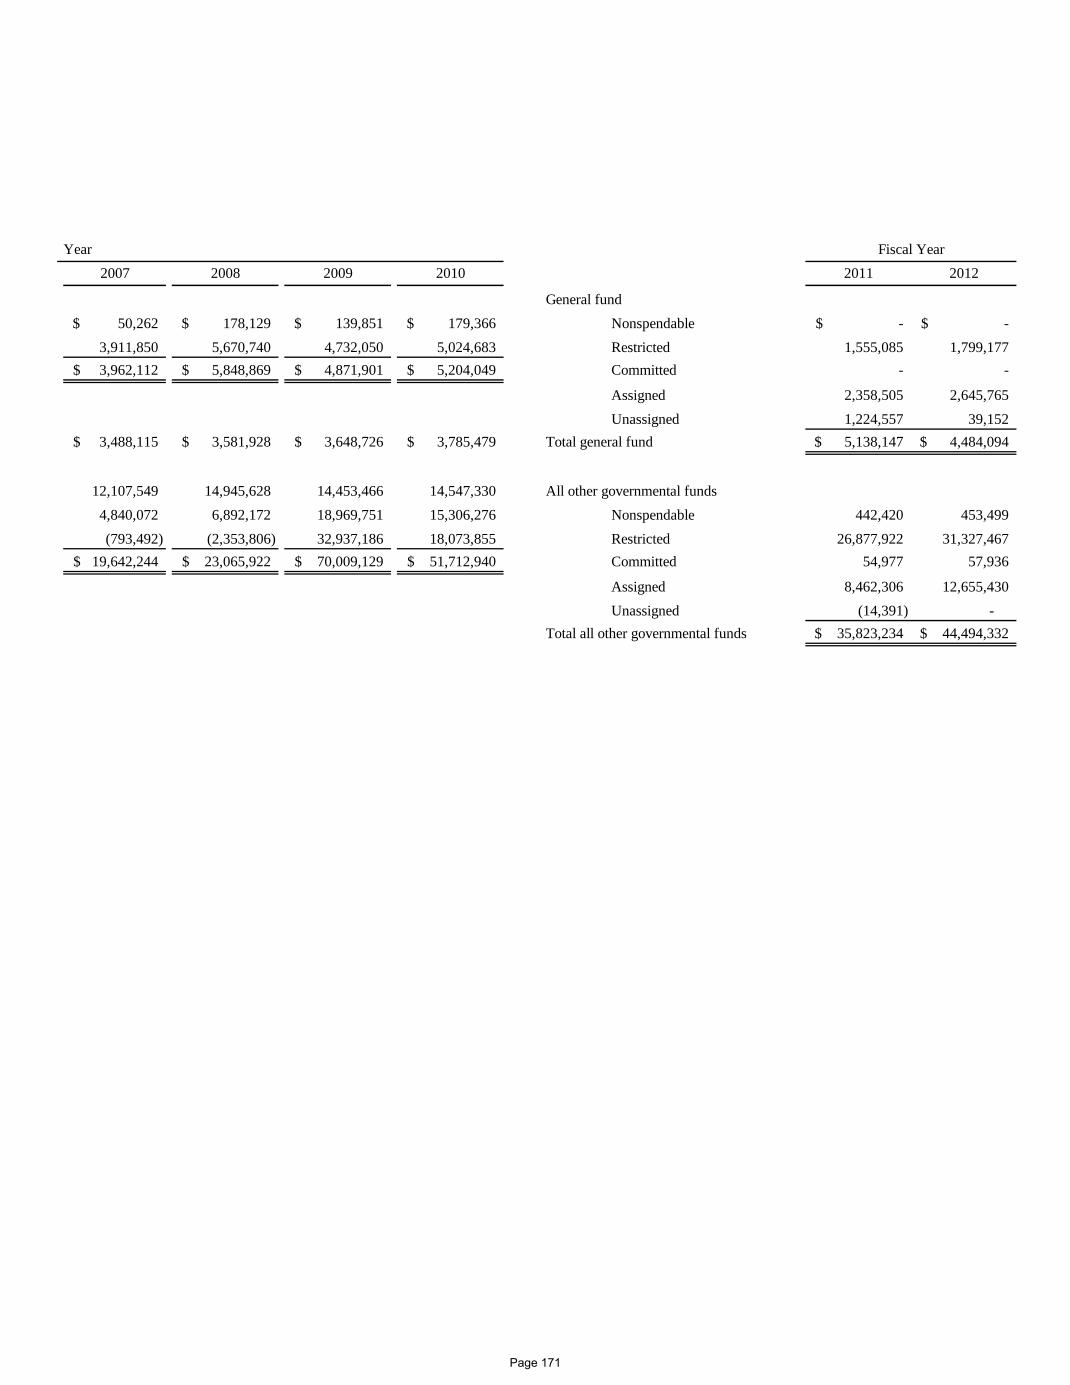
Year2007 2008 2009 2010 2011 2012
General fund50,262$ 178,129$ 139,851$ 179,366$ Nonspendable -$ -$
3,911,850 5,670,740 4,732,050 5,024,683 Restricted 1,555,085 1,799,177 3,962,112$ 5,848,869$ 4,871,901$ 5,204,049$ Committed - -
Assigned 2,358,505 2,645,765 Unassigned 1,224,557 39,152
3,488,115$ 3,581,928$ 3,648,726$ 3,785,479$ Total general fund 5,138,147$ 4,484,094$
12,107,549 14,945,628 14,453,466 14,547,330 All other governmental funds4,840,072 6,892,172 18,969,751 15,306,276 Nonspendable 442,420 453,499 (793,492) (2,353,806) 32,937,186 18,073,855 Restricted 26,877,922 31,327,467
19,642,244$ 23,065,922$ 70,009,129$ 51,712,940$ Committed 54,977 57,936
Assigned 8,462,306 12,655,430 Unassigned (14,391) -
Total all other governmental funds 35,823,234$ 44,494,332$
Fiscal Year
Page 171
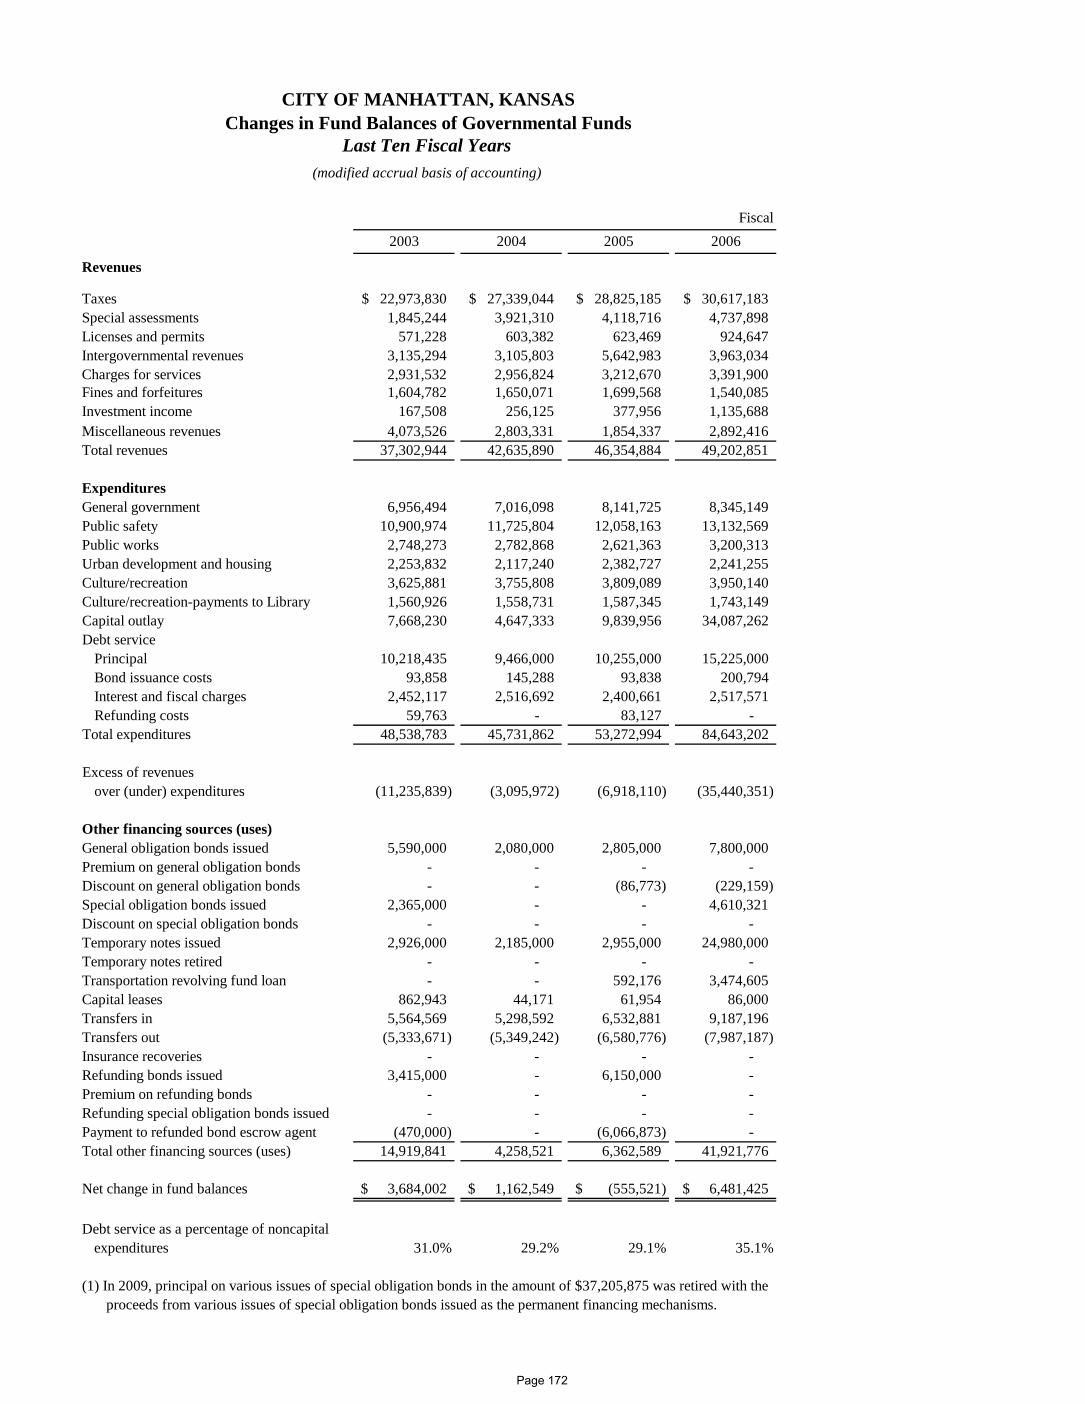
Fiscal2003 2004 2005 2006
Revenues
Taxes 22,973,830$ 27,339,044$ 28,825,185$ 30,617,183$ Special assessments 1,845,244 3,921,310 4,118,716 4,737,898 Licenses and permits 571,228 603,382 623,469 924,647 Intergovernmental revenues 3,135,294 3,105,803 5,642,983 3,963,034 Charges for services 2,931,532 2,956,824 3,212,670 3,391,900 Fines and forfeitures 1,604,782 1,650,071 1,699,568 1,540,085 Investment income 167,508 256,125 377,956 1,135,688 Miscellaneous revenues 4,073,526 2,803,331 1,854,337 2,892,416 Total revenues 37,302,944 42,635,890 46,354,884 49,202,851
ExpendituresGeneral government 6,956,494 7,016,098 8,141,725 8,345,149 Public safety 10,900,974 11,725,804 12,058,163 13,132,569 Public works 2,748,273 2,782,868 2,621,363 3,200,313 Urban development and housing 2,253,832 2,117,240 2,382,727 2,241,255 Culture/recreation 3,625,881 3,755,808 3,809,089 3,950,140 Culture/recreation-payments to Library 1,560,926 1,558,731 1,587,345 1,743,149 Capital outlay 7,668,230 4,647,333 9,839,956 34,087,262 Debt service
Principal 10,218,435 9,466,000 10,255,000 15,225,000 Bond issuance costs 93,858 145,288 93,838 200,794 Interest and fiscal charges 2,452,117 2,516,692 2,400,661 2,517,571 Refunding costs 59,763 - 83,127 -
Total expenditures 48,538,783 45,731,862 53,272,994 84,643,202
Excess of revenuesover (under) expenditures (11,235,839) (3,095,972) (6,918,110) (35,440,351)
Other financing sources (uses)General obligation bonds issued 5,590,000 2,080,000 2,805,000 7,800,000 Premium on general obligation bonds - - - - Discount on general obligation bonds - - (86,773) (229,159) Special obligation bonds issued 2,365,000 - - 4,610,321 Discount on special obligation bonds - - - - Temporary notes issued 2,926,000 2,185,000 2,955,000 24,980,000 Temporary notes retired - - - - Transportation revolving fund loan - - 592,176 3,474,605 Capital leases 862,943 44,171 61,954 86,000 Transfers in 5,564,569 5,298,592 6,532,881 9,187,196 Transfers out (5,333,671) (5,349,242) (6,580,776) (7,987,187) Insurance recoveries - - - - Refunding bonds issued 3,415,000 - 6,150,000 - Premium on refunding bonds - - - - Refunding special obligation bonds issued - - - - Payment to refunded bond escrow agent (470,000) - (6,066,873) - Total other financing sources (uses) 14,919,841 4,258,521 6,362,589 41,921,776
Net change in fund balances 3,684,002$ 1,162,549$ (555,521)$ 6,481,425$
Debt service as a percentage of noncapitalexpenditures 31.0% 29.2% 29.1% 35.1%
(1) In 2009, principal on various issues of special obligation bonds in the amount of $37,205,875 was retired with the proceeds from various issues of special obligation bonds issued as the permanent financing mechanisms.
CITY OF MANHATTAN, KANSASChanges in Fund Balances of Governmental Funds
Last Ten Fiscal Years(modified accrual basis of accounting)
Page 172
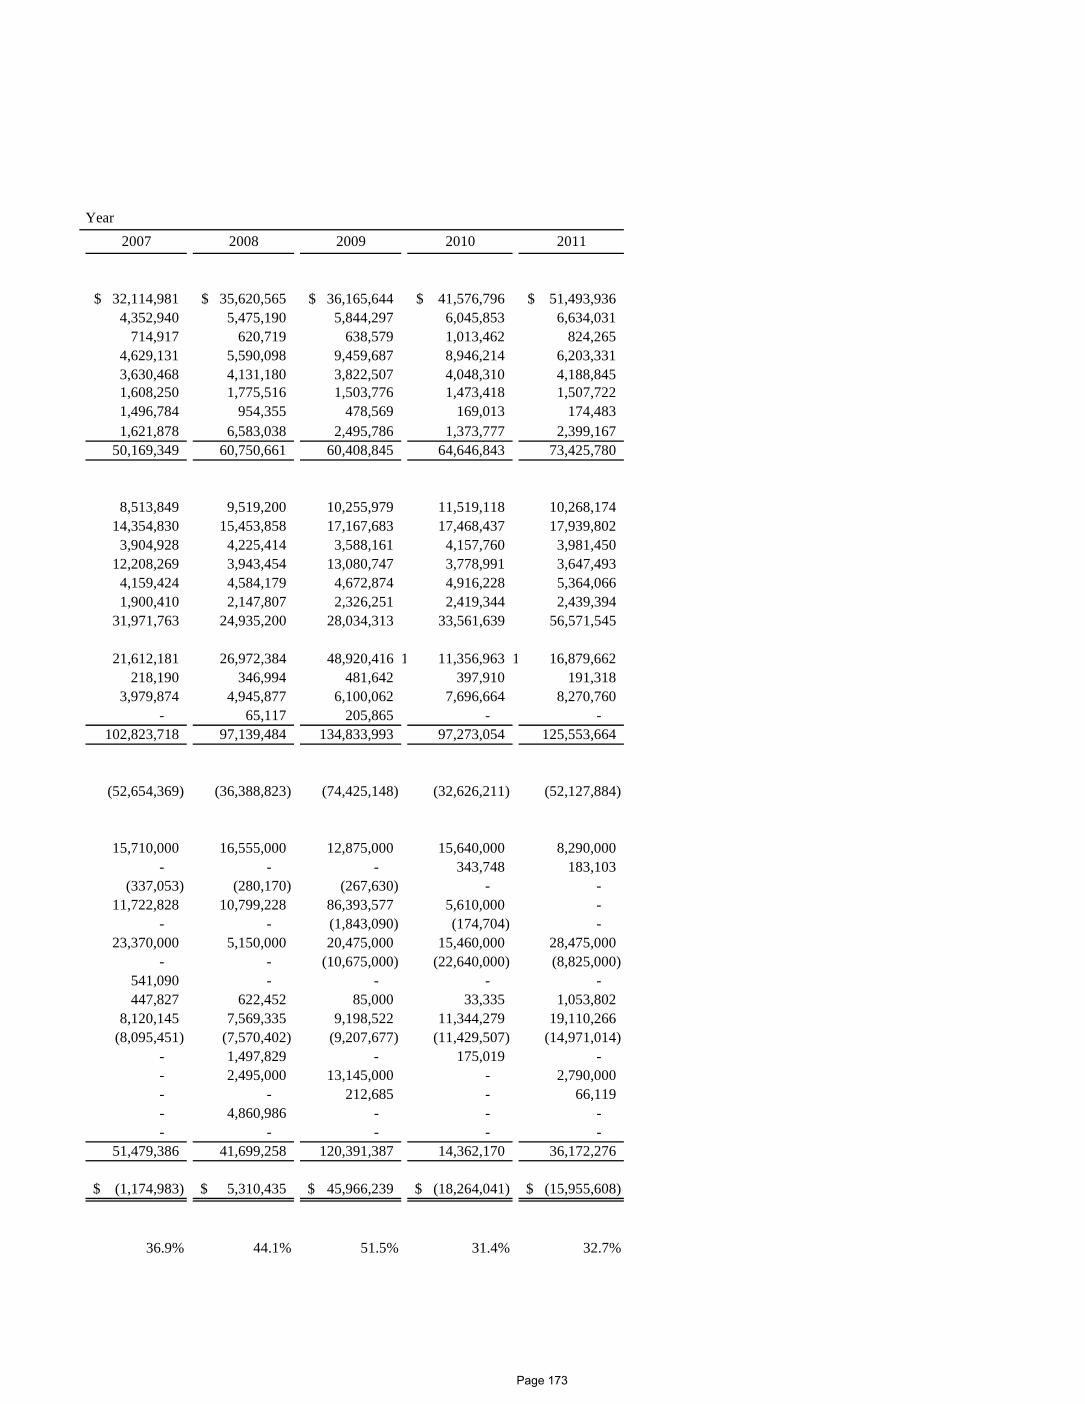
Year2007 2008 2009 2010 2011
32,114,981$ 35,620,565$ 36,165,644$ 41,576,796$ 51,493,936$ 4,352,940 5,475,190 5,844,297 6,045,853 6,634,031
714,917 620,719 638,579 1,013,462 824,265 4,629,131 5,590,098 9,459,687 8,946,214 6,203,331 3,630,468 4,131,180 3,822,507 4,048,310 4,188,845 1,608,250 1,775,516 1,503,776 1,473,418 1,507,722 1,496,784 954,355 478,569 169,013 174,483 1,621,878 6,583,038 2,495,786 1,373,777 2,399,167
50,169,349 60,750,661 60,408,845 64,646,843 73,425,780
8,513,849 9,519,200 10,255,979 11,519,118 10,268,174 14,354,830 15,453,858 17,167,683 17,468,437 17,939,802
3,904,928 4,225,414 3,588,161 4,157,760 3,981,450 12,208,269 3,943,454 13,080,747 3,778,991 3,647,493
4,159,424 4,584,179 4,672,874 4,916,228 5,364,066 1,900,410 2,147,807 2,326,251 2,419,344 2,439,394
31,971,763 24,935,200 28,034,313 33,561,639 56,571,545
21,612,181 26,972,384 48,920,416 1 11,356,963 1 16,879,662 218,190 346,994 481,642 397,910 191,318
3,979,874 4,945,877 6,100,062 7,696,664 8,270,760 - 65,117 205,865 - -
102,823,718 97,139,484 134,833,993 97,273,054 125,553,664
(52,654,369) (36,388,823) (74,425,148) (32,626,211) (52,127,884)
15,710,000 16,555,000 12,875,000 15,640,000 8,290,000 - - - 343,748 183,103
(337,053) (280,170) (267,630) - - 11,722,828 10,799,228 86,393,577 5,610,000 -
- - (1,843,090) (174,704) - 23,370,000 5,150,000 20,475,000 15,460,000 28,475,000
- - (10,675,000) (22,640,000) (8,825,000) 541,090 - - - - 447,827 622,452 85,000 33,335 1,053,802
8,120,145 7,569,335 9,198,522 11,344,279 19,110,266 (8,095,451) (7,570,402) (9,207,677) (11,429,507) (14,971,014)
- 1,497,829 - 175,019 - - 2,495,000 13,145,000 - 2,790,000 - - 212,685 - 66,119 - 4,860,986 - - - - - - - -
51,479,386 41,699,258 120,391,387 14,362,170 36,172,276
(1,174,983)$ 5,310,435$ 45,966,239$ (18,264,041)$ (15,955,608)$
36.9% 44.1% 51.5% 31.4% 32.7%
Page 173
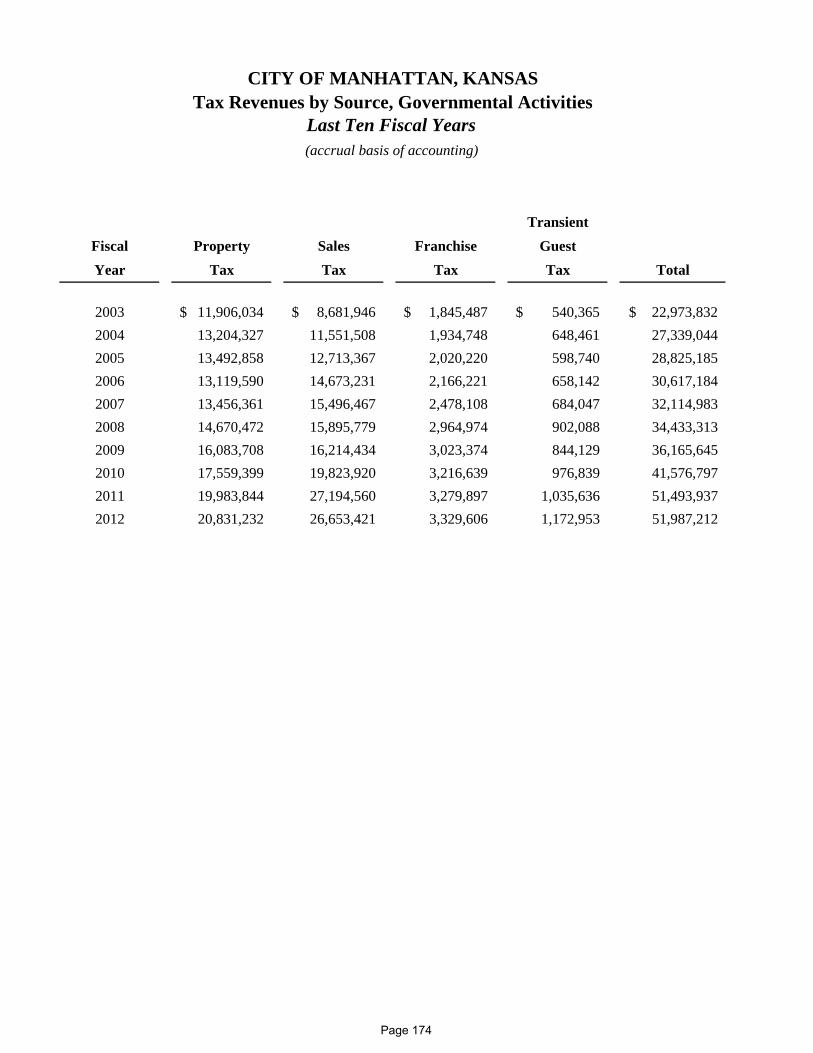
TransientFiscal Property Sales Franchise GuestYear Tax Tax Tax Tax Total
2003 11,906,034$ 8,681,946$ 1,845,487$ 540,365$ 22,973,832$ 2004 13,204,327 11,551,508 1,934,748 648,461 27,339,044 2005 13,492,858 12,713,367 2,020,220 598,740 28,825,185 2006 13,119,590 14,673,231 2,166,221 658,142 30,617,184 2007 13,456,361 15,496,467 2,478,108 684,047 32,114,983 2008 14,670,472 15,895,779 2,964,974 902,088 34,433,313 2009 16,083,708 16,214,434 3,023,374 844,129 36,165,645 2010 17,559,399 19,823,920 3,216,639 976,839 41,576,797 2011 19,983,844 27,194,560 3,279,897 1,035,636 51,493,937 2012 20,831,232 26,653,421 3,329,606 1,172,953 51,987,212
CITY OF MANHATTAN, KANSASTax Revenues by Source, Governmental Activities
Last Ten Fiscal Years(accrual basis of accounting)
Page 174

THIS PAGE INTENTIONALLY LEFT BLANK
Page 175
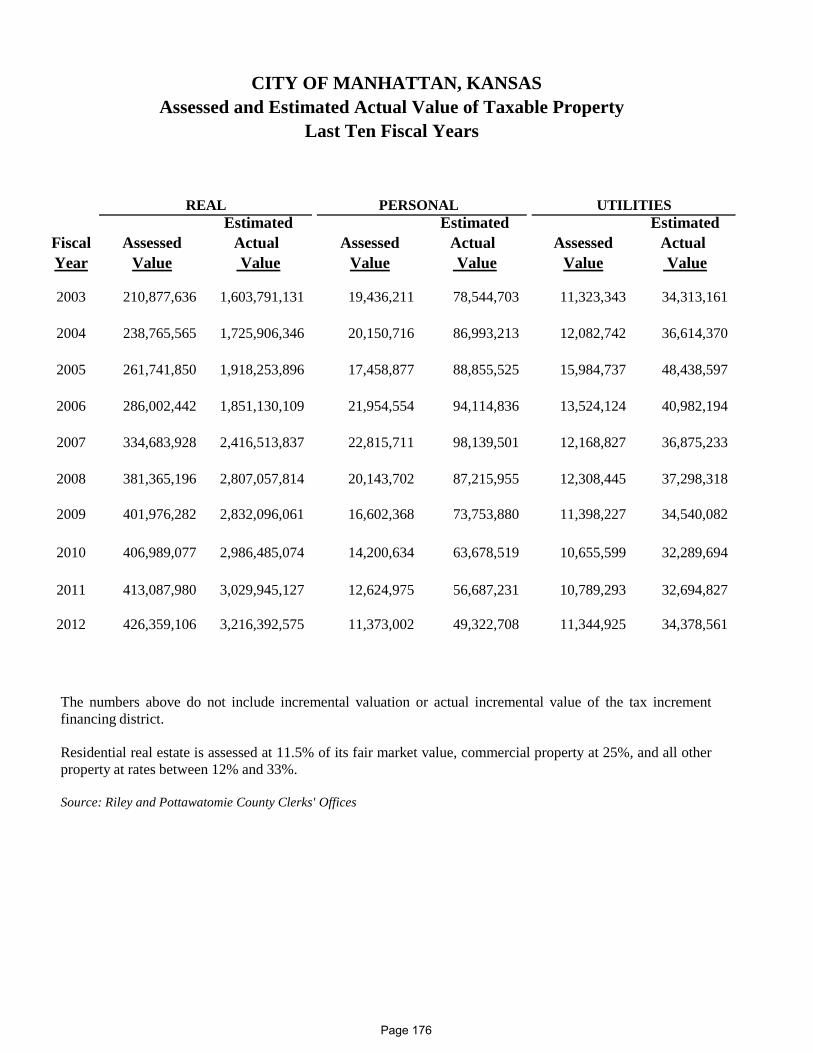
CITY OF MANHATTAN, KANSASAssessed and Estimated Actual Value of Taxable Property
Last Ten Fiscal Years
REAL PERSONAL UTILITIESEstimated Estimated Estimated
Fiscal Assessed Actual Assessed Actual Assessed Actual Year Value Value Value Value Value Value
2003 210,877,636 1,603,791,131 19,436,211 78,544,703 11,323,343 34,313,161
2004 238,765,565 1,725,906,346 20,150,716 86,993,213 12,082,742 36,614,370
2005 261,741,850 1,918,253,896 17,458,877 88,855,525 15,984,737 48,438,597
2006 286,002,442 1,851,130,109 21,954,554 94,114,836 13,524,124 40,982,194
2007 334,683,928 2,416,513,837 22,815,711 98,139,501 12,168,827 36,875,233
2008 381,365,196 2,807,057,814 20,143,702 87,215,955 12,308,445 37,298,318
2009 401,976,282 2,832,096,061 16,602,368 73,753,880 11,398,227 34,540,082
2010 406,989,077 2,986,485,074 14,200,634 63,678,519 10,655,599 32,289,694
2011 413,087,980 3,029,945,127 12,624,975 56,687,231 10,789,293 32,694,827
2012 426,359,106 3,216,392,575 11,373,002 49,322,708 11,344,925 34,378,561
The numbers above do not include incremental valuation or actual incremental value of the tax increment financing district. Residential real estate is assessed at 11.5% of its fair market value, commercial property at 25%, and all other property at rates between 12% and 33%. Source: Riley and Pottawatomie County Clerks' Offices
Page 176
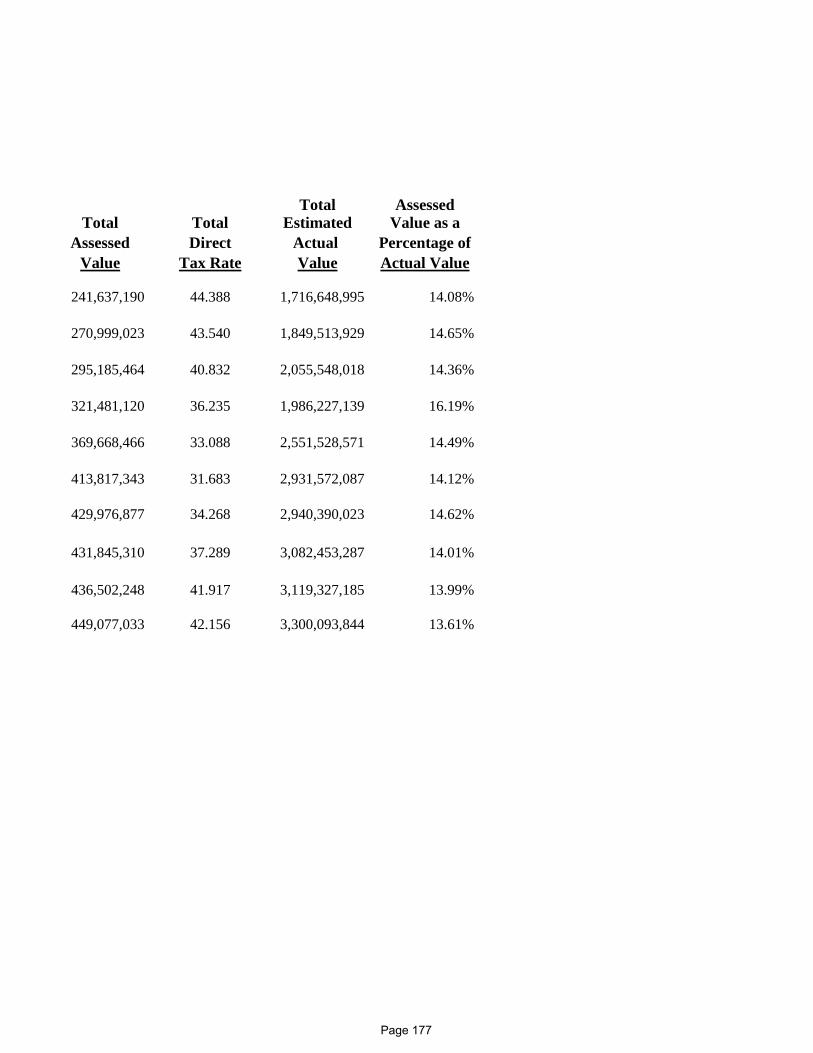
Total AssessedTotal Total Estimated Value as a
Assessed Direct Actual Percentage ofValue Tax Rate Value Actual Value
241,637,190 44.388 1,716,648,995 14.08%
270,999,023 43.540 1,849,513,929 14.65%
295,185,464 40.832 2,055,548,018 14.36%
321,481,120 36.235 1,986,227,139 16.19%
369,668,466 33.088 2,551,528,571 14.49%
413,817,343 31.683 2,931,572,087 14.12%
429,976,877 34.268 2,940,390,023 14.62%
431,845,310 37.289 3,082,453,287 14.01%
436,502,248 41.917 3,119,327,185 13.99%
449,077,033 42.156 3,300,093,844 13.61%
Page 177
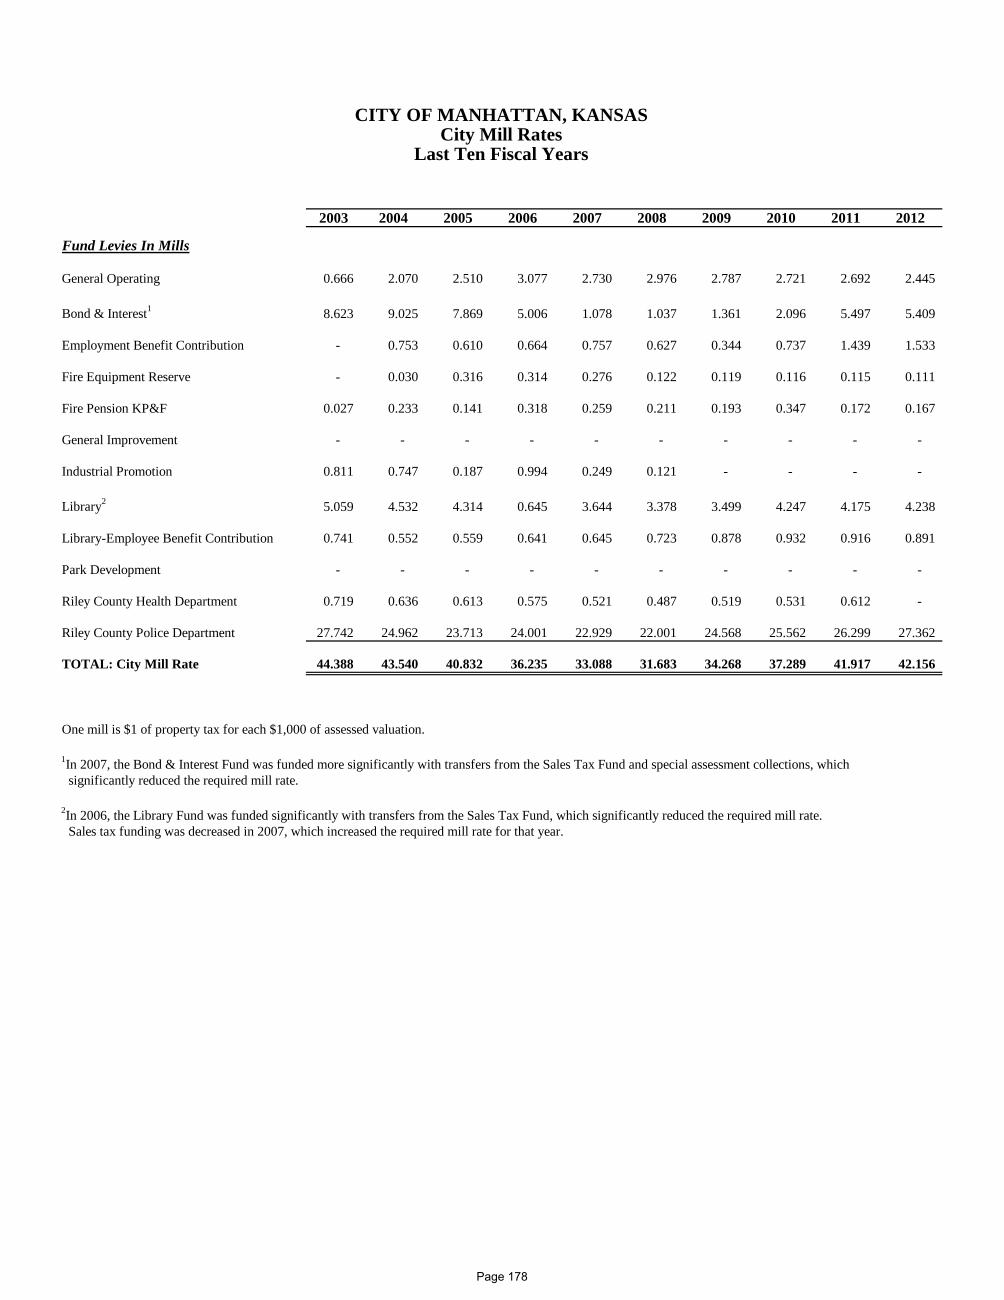
2003 2004 2005 2006 2007 2008 2009 2010 2011 2012
Fund Levies In Mills
General Operating 0.666 2.070 2.510 3.077 2.730 2.976 2.787 2.721 2.692 2.445
Bond & Interest1 8.623 9.025 7.869 5.006 1.078 1.037 1.361 2.096 5.497 5.409
Employment Benefit Contribution - 0.753 0.610 0.664 0.757 0.627 0.344 0.737 1.439 1.533
Fire Equipment Reserve - 0.030 0.316 0.314 0.276 0.122 0.119 0.116 0.115 0.111
Fire Pension KP&F 0.027 0.233 0.141 0.318 0.259 0.211 0.193 0.347 0.172 0.167
General Improvement - - - - - - - - - -
Industrial Promotion 0.811 0.747 0.187 0.994 0.249 0.121 - - - -
Library2 5.059 4.532 4.314 0.645 3.644 3.378 3.499 4.247 4.175 4.238
Library-Employee Benefit Contribution 0.741 0.552 0.559 0.641 0.645 0.723 0.878 0.932 0.916 0.891
Park Development - - - - - - - - - -
Riley County Health Department 0.719 0.636 0.613 0.575 0.521 0.487 0.519 0.531 0.612 -
Riley County Police Department 27.742 24.962 23.713 24.001 22.929 22.001 24.568 25.562 26.299 27.362
TOTAL: City Mill Rate 44.388 43.540 40.832 36.235 33.088 31.683 34.268 37.289 41.917 42.156
One mill is $1 of property tax for each $1,000 of assessed valuation.
1In 2007, the Bond & Interest Fund was funded more significantly with transfers from the Sales Tax Fund and special assessment collections, which significantly reduced the required mill rate.
2In 2006, the Library Fund was funded significantly with transfers from the Sales Tax Fund, which significantly reduced the required mill rate. Sales tax funding was decreased in 2007, which increased the required mill rate for that year.
CITY OF MANHATTAN, KANSASCity Mill Rates
Last Ten Fiscal Years
Page 178
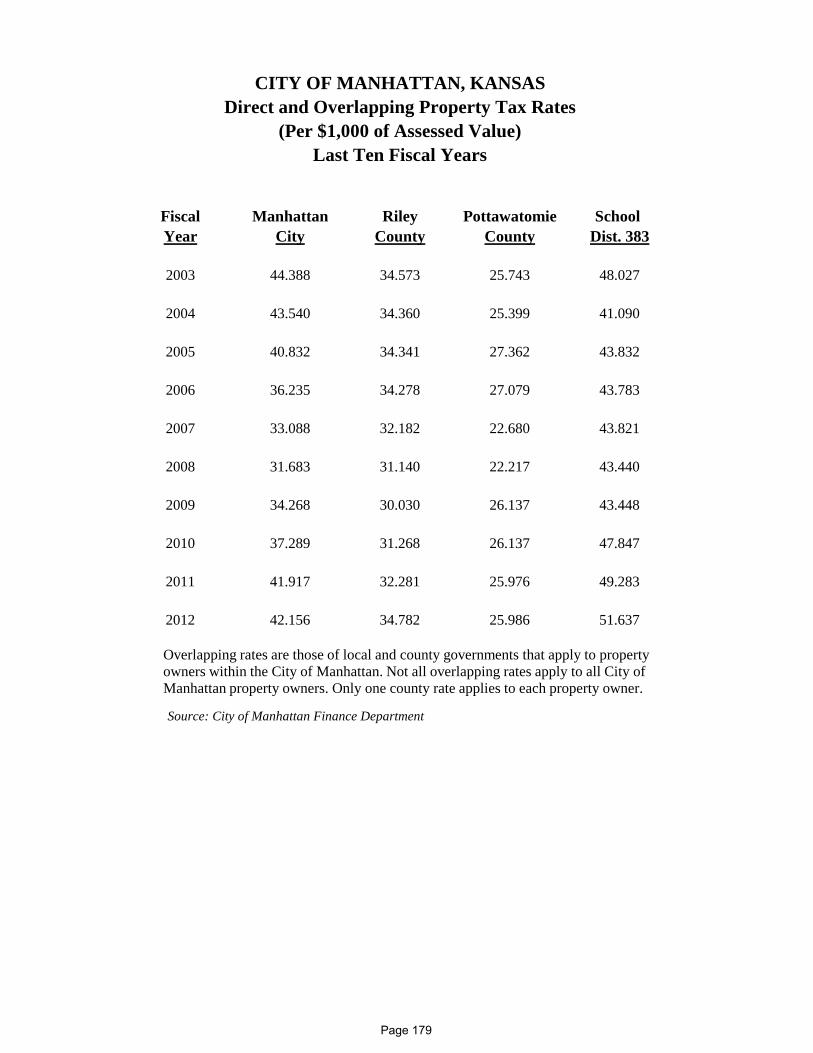
Fiscal Manhattan Riley Pottawatomie School Year City County County Dist. 383
2003 44.388 34.573 25.743 48.027
2004 43.540 34.360 25.399 41.090
2005 40.832 34.341 27.362 43.832
2006 36.235 34.278 27.079 43.783
2007 33.088 32.182 22.680 43.821
2008 31.683 31.140 22.217 43.440
2009 34.268 30.030 26.137 43.448
2010 37.289 31.268 26.137 47.847
2011 41.917 32.281 25.976 49.283
2012 42.156 34.782 25.986 51.637
Source: City of Manhattan Finance Department
CITY OF MANHATTAN, KANSASDirect and Overlapping Property Tax Rates
(Per $1,000 of Assessed Value)Last Ten Fiscal Years
Overlapping rates are those of local and county governments that apply to property owners within the City of Manhattan. Not all overlapping rates apply to all City of Manhattan property owners. Only one county rate applies to each property owner.
Page 179
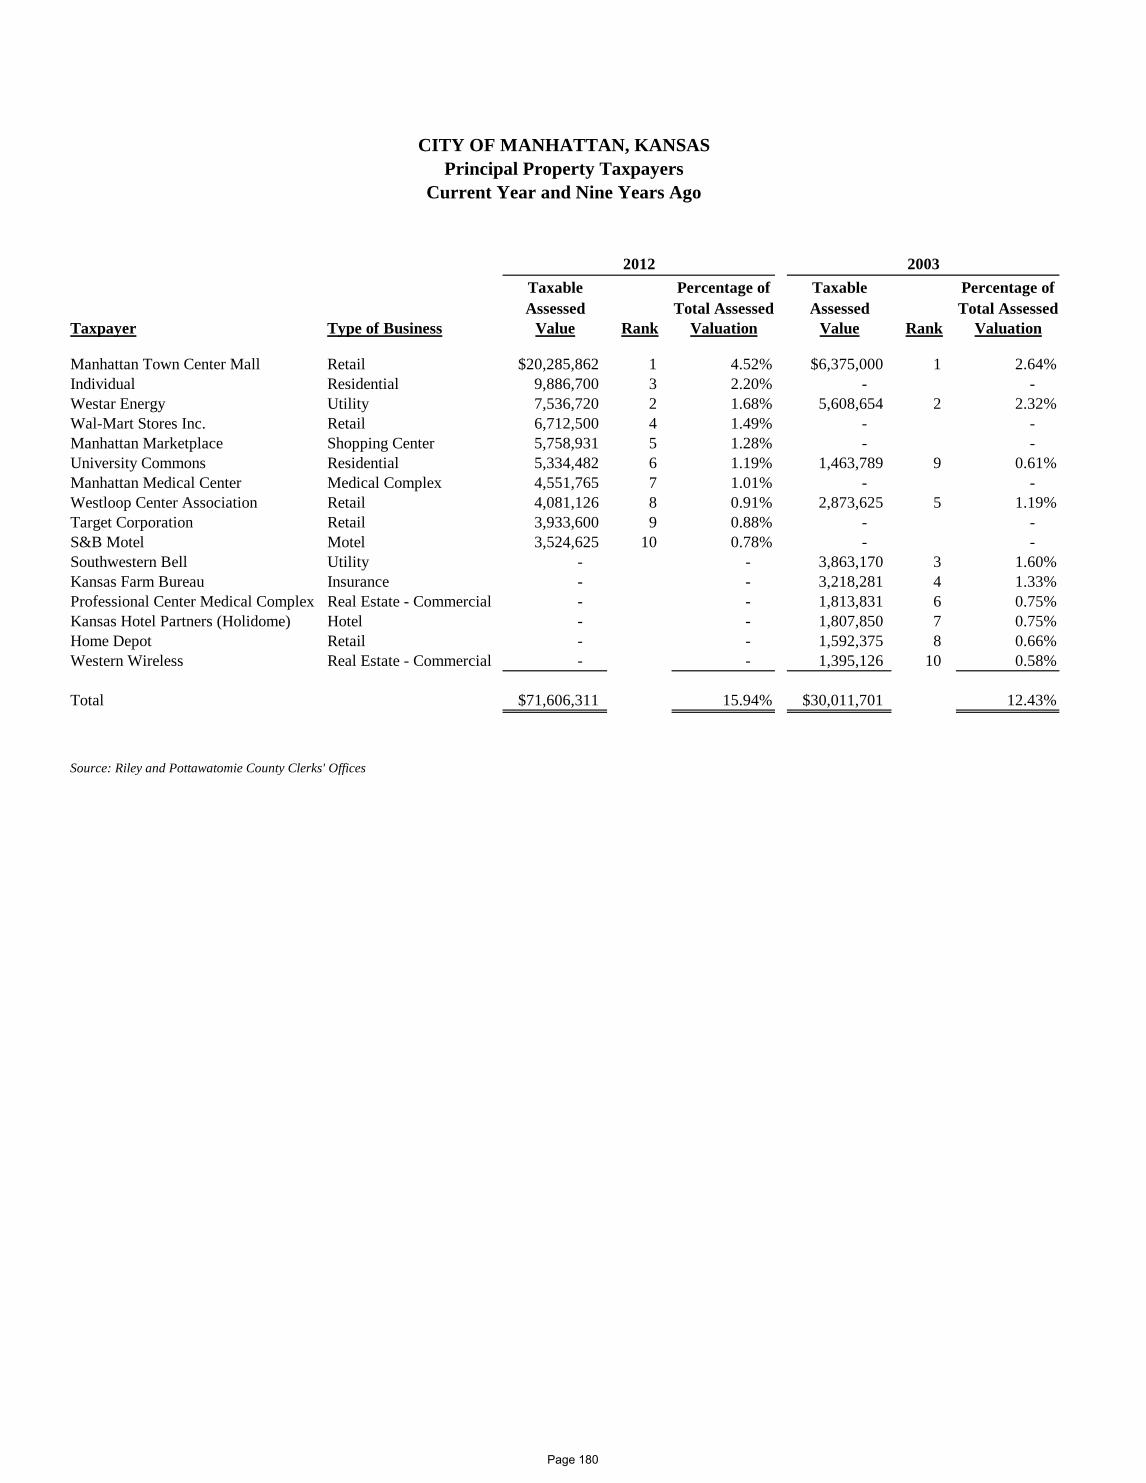
Taxable Percentage of Taxable Percentage ofAssessed Total Assessed Assessed Total Assessed
Taxpayer Type of Business Value Rank Valuation Value Rank Valuation
Manhattan Town Center Mall Retail $20,285,862 1 4.52% $6,375,000 1 2.64%Individual Residential 9,886,700 3 2.20% - - Westar Energy Utility 7,536,720 2 1.68% 5,608,654 2 2.32%Wal-Mart Stores Inc. Retail 6,712,500 4 1.49% - - Manhattan Marketplace Shopping Center 5,758,931 5 1.28% - - University Commons Residential 5,334,482 6 1.19% 1,463,789 9 0.61%Manhattan Medical Center Medical Complex 4,551,765 7 1.01% - - Westloop Center Association Retail 4,081,126 8 0.91% 2,873,625 5 1.19%Target Corporation Retail 3,933,600 9 0.88% - - S&B Motel Motel 3,524,625 10 0.78% - - Southwestern Bell Utility - - 3,863,170 3 1.60%Kansas Farm Bureau Insurance - - 3,218,281 4 1.33%Professional Center Medical Complex Real Estate - Commercial - - 1,813,831 6 0.75%Kansas Hotel Partners (Holidome) Hotel - - 1,807,850 7 0.75%Home Depot Retail - - 1,592,375 8 0.66%Western Wireless Real Estate - Commercial - - 1,395,126 10 0.58%
Total $71,606,311 15.94% $30,011,701 12.43%
Source: Riley and Pottawatomie County Clerks' Offices
2012 2003
CITY OF MANHATTAN, KANSASPrincipal Property Taxpayers
Current Year and Nine Years Ago
Page 180
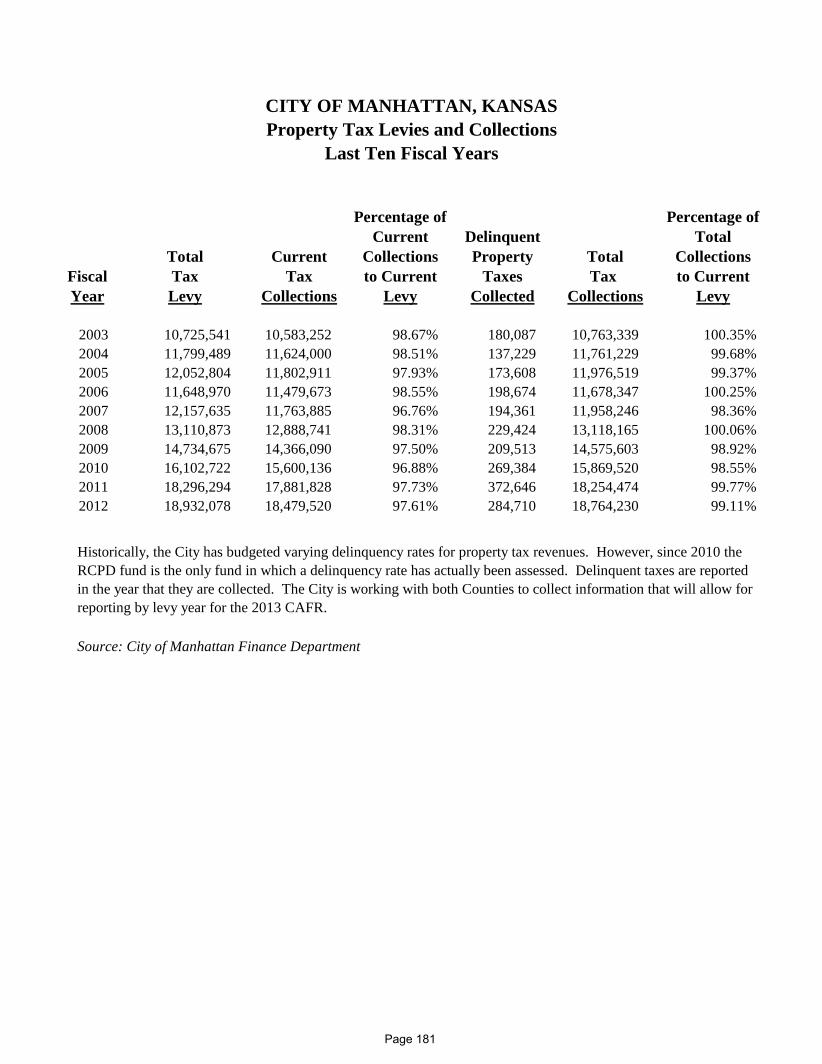
CITY OF MANHATTAN, KANSASProperty Tax Levies and Collections
Last Ten Fiscal Years
Percentage of Percentage ofCurrent Delinquent Total
Total Current Collections Property Total CollectionsFiscal Tax Tax to Current Taxes Tax to CurrentYear Levy Collections Levy Collected Collections Levy
2003 10,725,541 10,583,252 98.67% 180,087 10,763,339 100.35%2004 11,799,489 11,624,000 98.51% 137,229 11,761,229 99.68%2005 12,052,804 11,802,911 97.93% 173,608 11,976,519 99.37%2006 11,648,970 11,479,673 98.55% 198,674 11,678,347 100.25%2007 12,157,635 11,763,885 96.76% 194,361 11,958,246 98.36%2008 13,110,873 12,888,741 98.31% 229,424 13,118,165 100.06%2009 14,734,675 14,366,090 97.50% 209,513 14,575,603 98.92%2010 16,102,722 15,600,136 96.88% 269,384 15,869,520 98.55%2011 18,296,294 17,881,828 97.73% 372,646 18,254,474 99.77%2012 18,932,078 18,479,520 97.61% 284,710 18,764,230 99.11%
Source: City of Manhattan Finance Department
Historically, the City has budgeted varying delinquency rates for property tax revenues. However, since 2010 the RCPD fund is the only fund in which a delinquency rate has actually been assessed. Delinquent taxes are reported in the year that they are collected. The City is working with both Counties to collect information that will allow for reporting by levy year for the 2013 CAFR.
Page 181
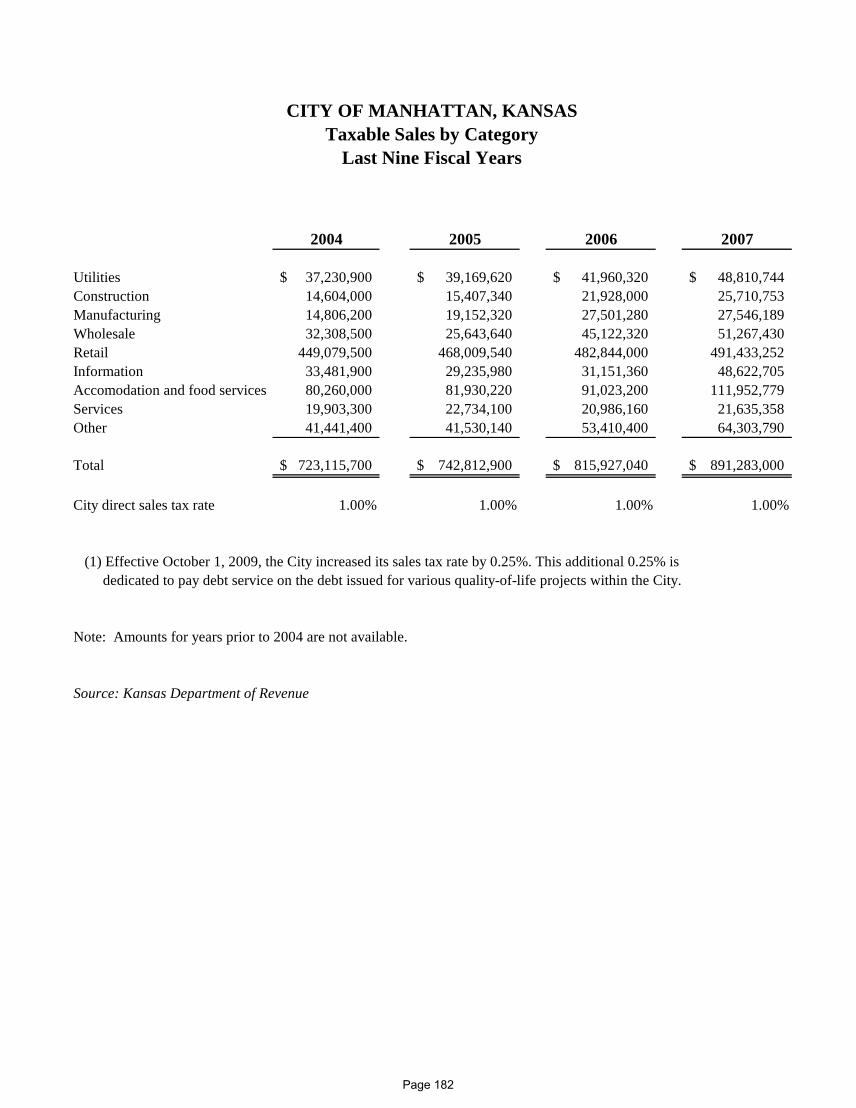
2004 2005 2006 2007
Utilities 37,230,900$ 39,169,620$ 41,960,320$ 48,810,744$ Construction 14,604,000 15,407,340 21,928,000 25,710,753 Manufacturing 14,806,200 19,152,320 27,501,280 27,546,189 Wholesale 32,308,500 25,643,640 45,122,320 51,267,430 Retail 449,079,500 468,009,540 482,844,000 491,433,252 Information 33,481,900 29,235,980 31,151,360 48,622,705 Accomodation and food services 80,260,000 81,930,220 91,023,200 111,952,779 Services 19,903,300 22,734,100 20,986,160 21,635,358 Other 41,441,400 41,530,140 53,410,400 64,303,790
Total 723,115,700$ 742,812,900$ 815,927,040$ 891,283,000$
City direct sales tax rate 1.00% 1.00% 1.00% 1.00%
dedicated to pay debt service on the debt issued for various quality-of-life projects within the City.
Note: Amounts for years prior to 2004 are not available.
Source: Kansas Department of Revenue
(1) Effective October 1, 2009, the City increased its sales tax rate by 0.25%. This additional 0.25% is
CITY OF MANHATTAN, KANSASTaxable Sales by Category
Last Nine Fiscal Years
Page 182
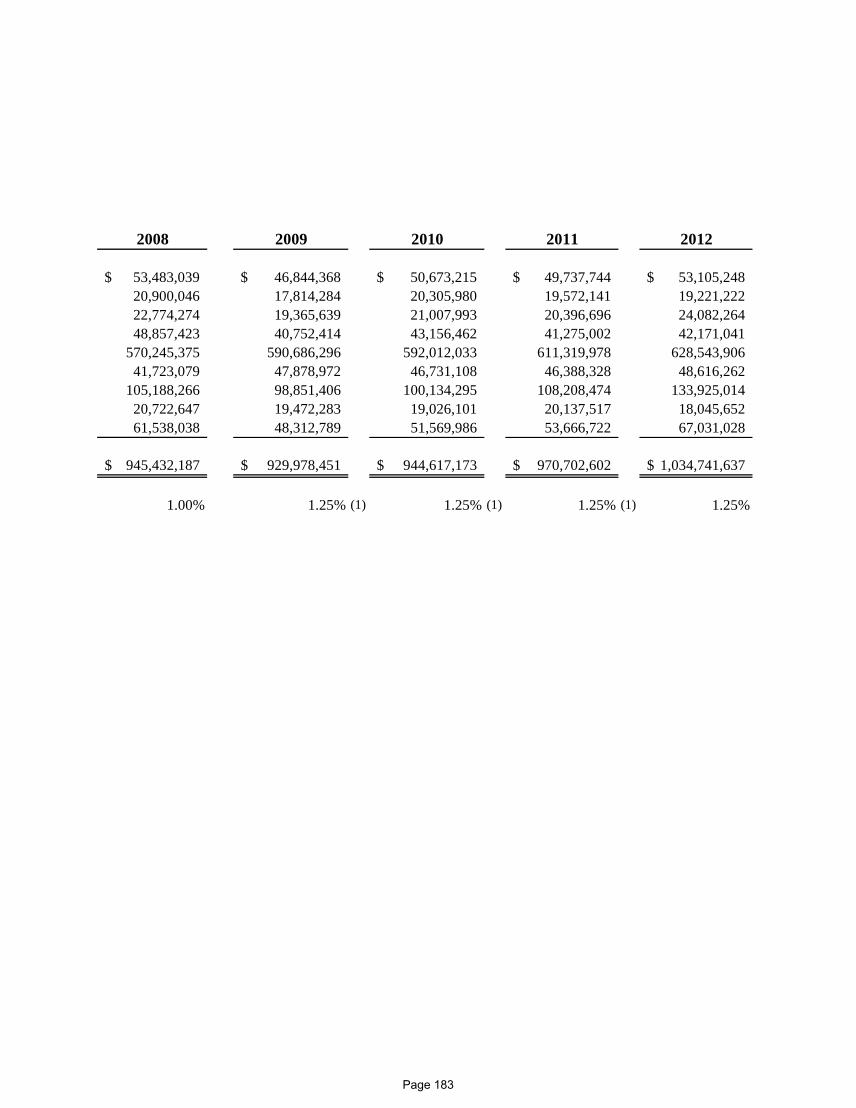
2008 2009 2010 2011 2012
53,483,039$ 46,844,368$ 50,673,215$ 49,737,744$ 53,105,248$ 20,900,046 17,814,284 20,305,980 19,572,141 19,221,222 22,774,274 19,365,639 21,007,993 20,396,696 24,082,264 48,857,423 40,752,414 43,156,462 41,275,002 42,171,041
570,245,375 590,686,296 592,012,033 611,319,978 628,543,906 41,723,079 47,878,972 46,731,108 46,388,328 48,616,262
105,188,266 98,851,406 100,134,295 108,208,474 133,925,014 20,722,647 19,472,283 19,026,101 20,137,517 18,045,652 61,538,038 48,312,789 51,569,986 53,666,722 67,031,028
945,432,187$ 929,978,451$ 944,617,173$ 970,702,602$ 1,034,741,637$
1.00% 1.25% (1) 1.25% (1) 1.25% (1) 1.25%
Page 183
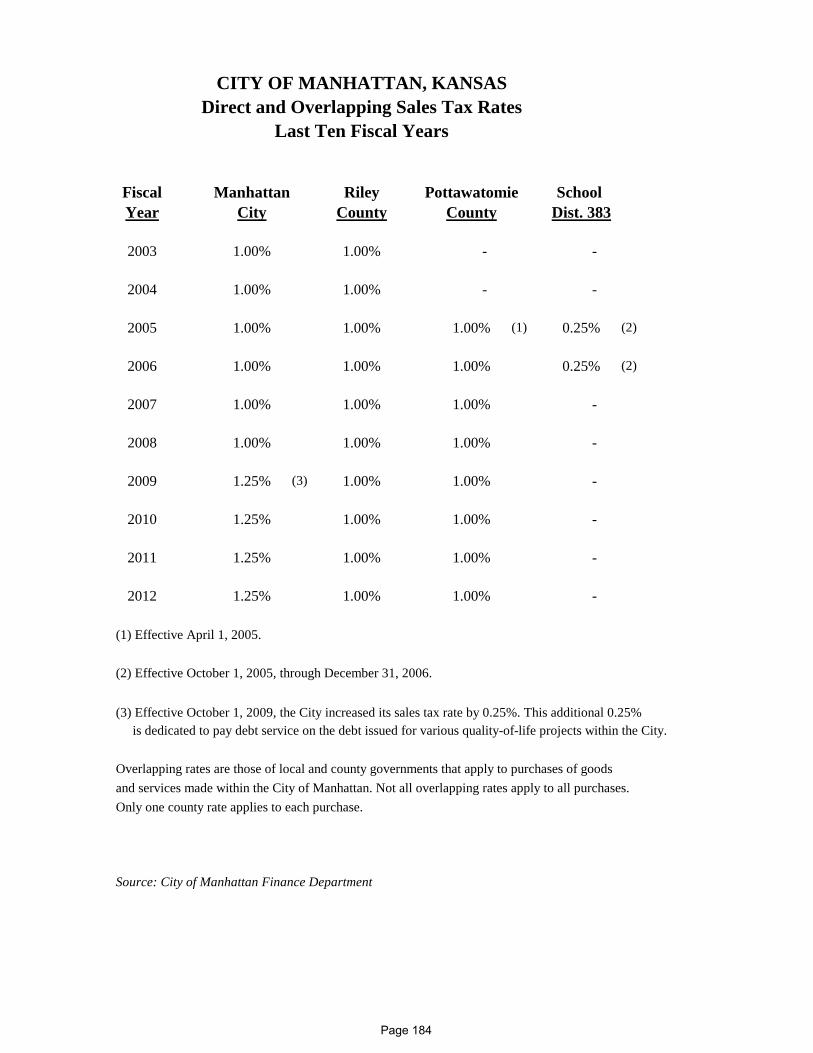
Fiscal Manhattan Riley Pottawatomie School Year City County County Dist. 383
2003 1.00% 1.00% - -
2004 1.00% 1.00% - -
2005 1.00% 1.00% 1.00% (1) 0.25% (2)
2006 1.00% 1.00% 1.00% 0.25% (2)
2007 1.00% 1.00% 1.00% -
2008 1.00% 1.00% 1.00% -
2009 1.25% (3) 1.00% 1.00% -
2010 1.25% 1.00% 1.00% -
2011 1.25% 1.00% 1.00% -
2012 1.25% 1.00% 1.00% -
(1) Effective April 1, 2005.
(2) Effective October 1, 2005, through December 31, 2006.
is dedicated to pay debt service on the debt issued for various quality-of-life projects within the City.
Overlapping rates are those of local and county governments that apply to purchases of goods and services made within the City of Manhattan. Not all overlapping rates apply to all purchases. Only one county rate applies to each purchase.
Source: City of Manhattan Finance Department
CITY OF MANHATTAN, KANSASDirect and Overlapping Sales Tax Rates
Last Ten Fiscal Years
(3) Effective October 1, 2009, the City increased its sales tax rate by 0.25%. This additional 0.25%
Page 184
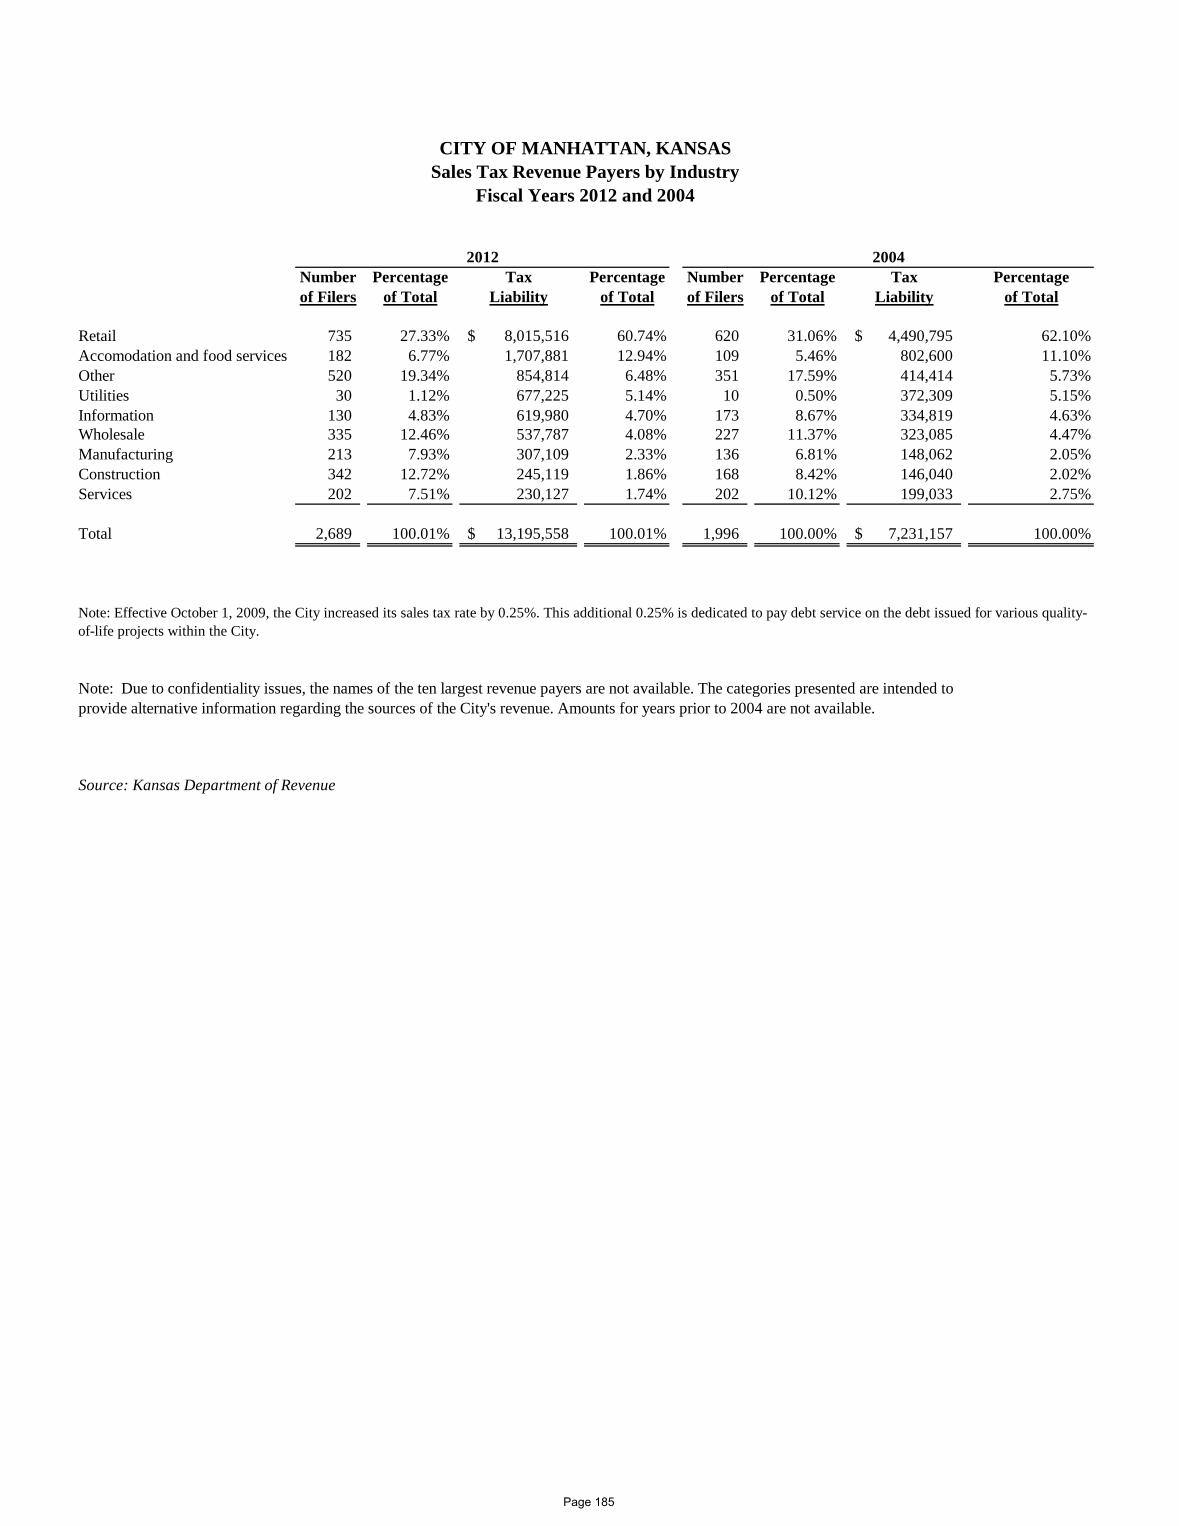
Number Percentage Tax Percentage Number Percentage Tax Percentageof Filers of Total Liability of Total of Filers of Total Liability of Total
Retail 735 27.33% 8,015,516$ 60.74% 620 31.06% 4,490,795$ 62.10%Accomodation and food services 182 6.77% 1,707,881 12.94% 109 5.46% 802,600 11.10%Other 520 19.34% 854,814 6.48% 351 17.59% 414,414 5.73%Utilities 30 1.12% 677,225 5.14% 10 0.50% 372,309 5.15%Information 130 4.83% 619,980 4.70% 173 8.67% 334,819 4.63%Wholesale 335 12.46% 537,787 4.08% 227 11.37% 323,085 4.47%Manufacturing 213 7.93% 307,109 2.33% 136 6.81% 148,062 2.05%Construction 342 12.72% 245,119 1.86% 168 8.42% 146,040 2.02%Services 202 7.51% 230,127 1.74% 202 10.12% 199,033 2.75%
Total 2,689 100.01% 13,195,558$ 100.01% 1,996 100.00% 7,231,157$ 100.00%
Note: Due to confidentiality issues, the names of the ten largest revenue payers are not available. The categories presented are intended to provide alternative information regarding the sources of the City's revenue. Amounts for years prior to 2004 are not available.
Source: Kansas Department of Revenue
Note: Effective October 1, 2009, the City increased its sales tax rate by 0.25%. This additional 0.25% is dedicated to pay debt service on the debt issued for various quality-of-life projects within the City.
2012 2004
CITY OF MANHATTAN, KANSASSales Tax Revenue Payers by Industry
Fiscal Years 2012 and 2004
Page 185
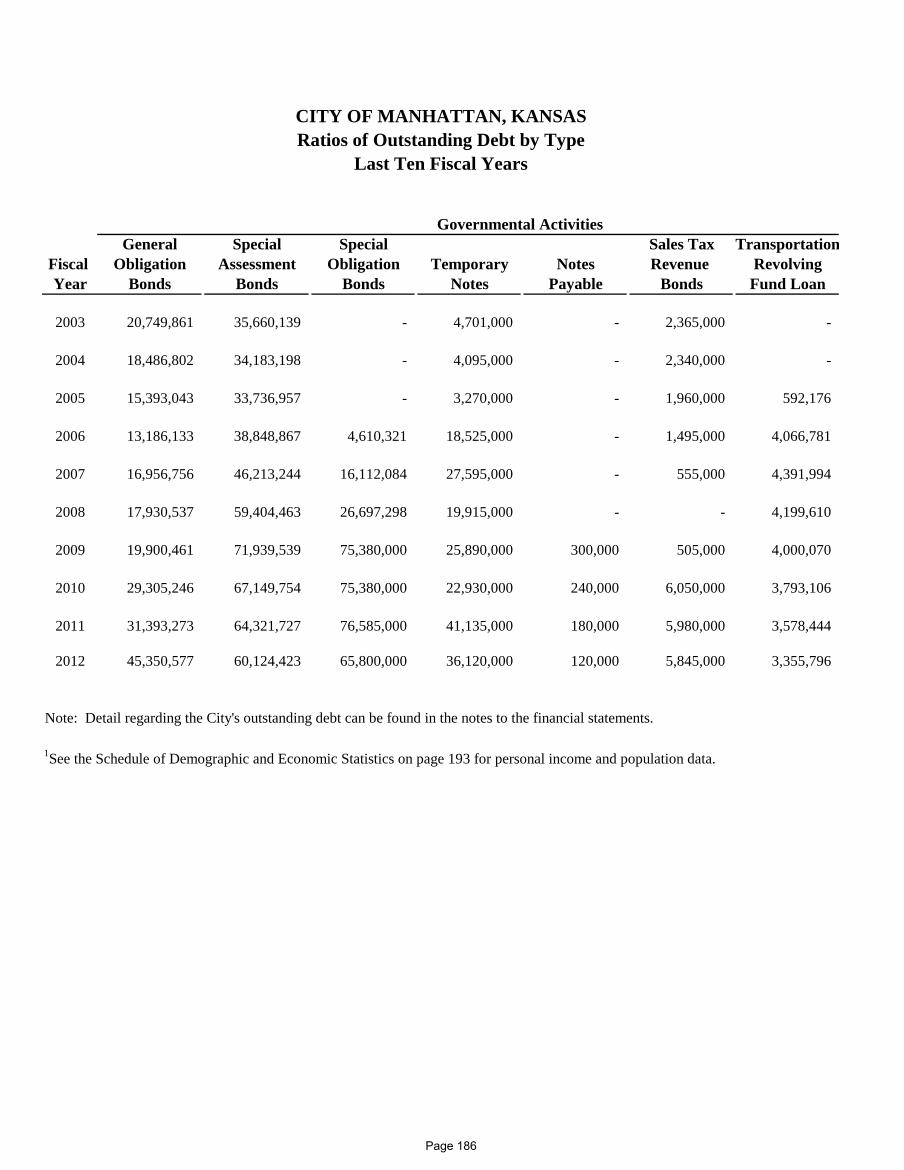
General Special Special Sales Tax TransportationFiscal Obligation Assessment Obligation Temporary Notes Revenue RevolvingYear Bonds Bonds Bonds Notes Payable Bonds Fund Loan
2003 20,749,861 35,660,139 - 4,701,000 - 2,365,000 -
2004 18,486,802 34,183,198 - 4,095,000 - 2,340,000 -
2005 15,393,043 33,736,957 - 3,270,000 - 1,960,000 592,176
2006 13,186,133 38,848,867 4,610,321 18,525,000 - 1,495,000 4,066,781
2007 16,956,756 46,213,244 16,112,084 27,595,000 - 555,000 4,391,994
2008 17,930,537 59,404,463 26,697,298 19,915,000 - - 4,199,610
2009 19,900,461 71,939,539 75,380,000 25,890,000 300,000 505,000 4,000,070
2010 29,305,246 67,149,754 75,380,000 22,930,000 240,000 6,050,000 3,793,106
2011 31,393,273 64,321,727 76,585,000 41,135,000 180,000 5,980,000 3,578,444
2012 45,350,577 60,124,423 65,800,000 36,120,000 120,000 5,845,000 3,355,796
Note: Detail regarding the City's outstanding debt can be found in the notes to the financial statements.
1See the Schedule of Demographic and Economic Statistics on page 193 for personal income and population data.
Governmental Activities
CITY OF MANHATTAN, KANSASRatios of Outstanding Debt by Type
Last Ten Fiscal Years
Page 186
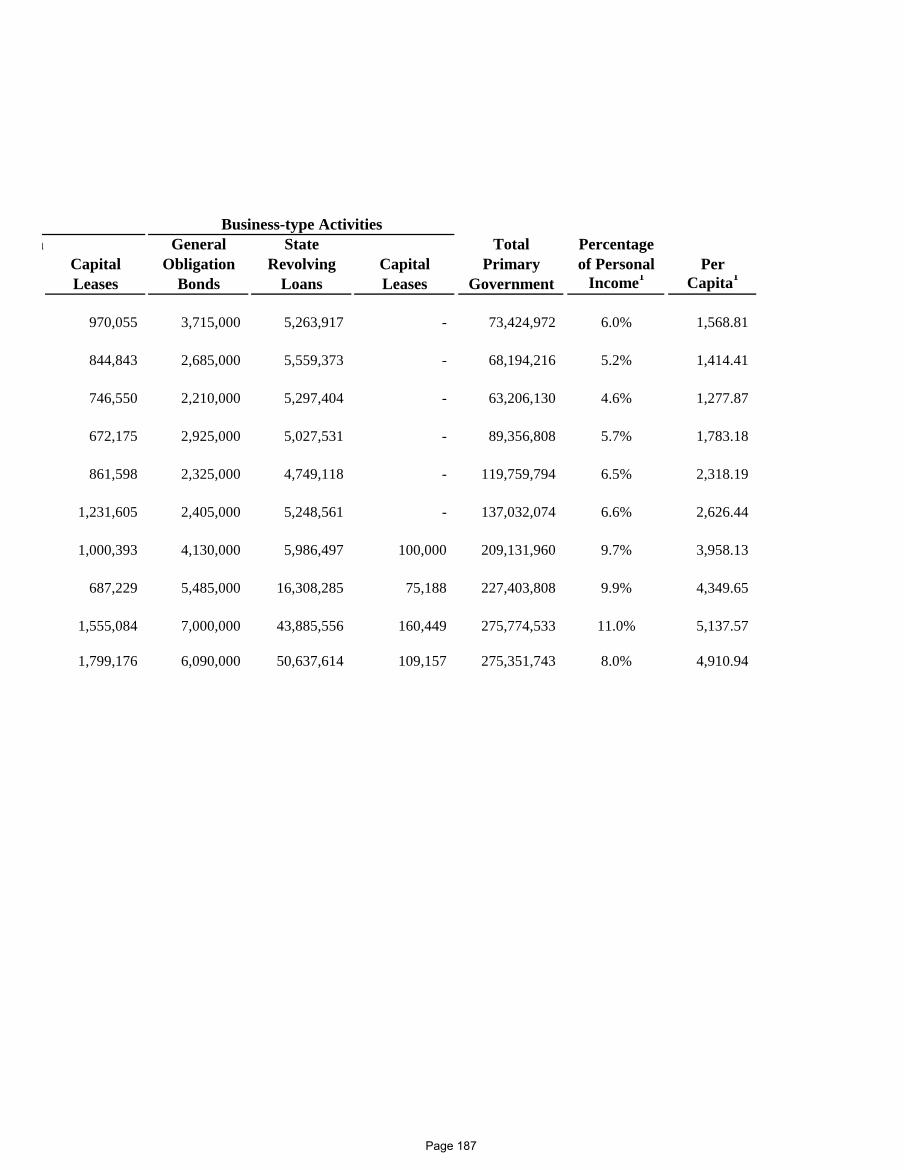
n General State Total PercentageCapital Obligation Revolving Capital Primary of Personal PerLeases Bonds Loans Leases Government Income1 Capita1
970,055 3,715,000 5,263,917 - 73,424,972 6.0% 1,568.81
844,843 2,685,000 5,559,373 - 68,194,216 5.2% 1,414.41
746,550 2,210,000 5,297,404 - 63,206,130 4.6% 1,277.87
672,175 2,925,000 5,027,531 - 89,356,808 5.7% 1,783.18
861,598 2,325,000 4,749,118 - 119,759,794 6.5% 2,318.19
1,231,605 2,405,000 5,248,561 - 137,032,074 6.6% 2,626.44
1,000,393 4,130,000 5,986,497 100,000 209,131,960 9.7% 3,958.13
687,229 5,485,000 16,308,285 75,188 227,403,808 9.9% 4,349.65
1,555,084 7,000,000 43,885,556 160,449 275,774,533 11.0% 5,137.57
1,799,176 6,090,000 50,637,614 109,157 275,351,743 8.0% 4,910.94
Business-type Activities
Page 187
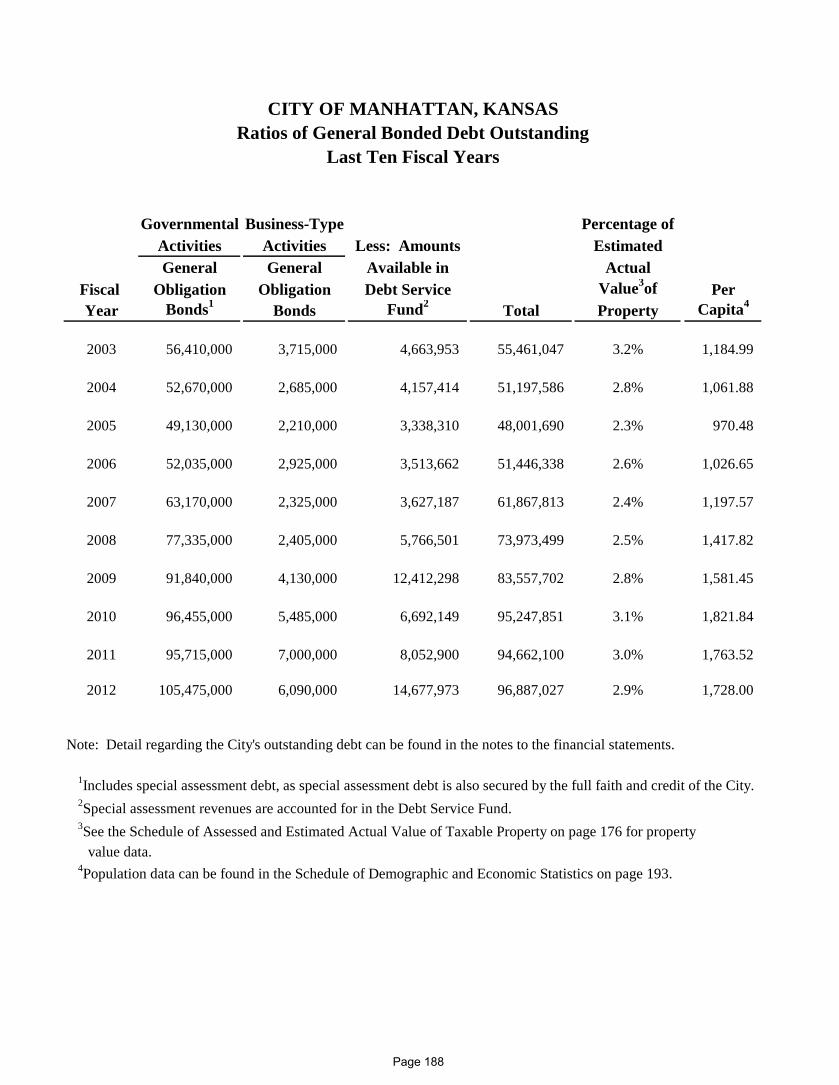
CITY OF MANHATTAN, KANSASRatios of General Bonded Debt Outstanding
Last Ten Fiscal Years
Governmental Business-Type Percentage ofActivities Activities Less: Amounts EstimatedGeneral General Available in Actual
Fiscal Obligation Obligation Debt Service Value3of PerYear Bonds1 Bonds Fund2 Total Property Capita4
2003 56,410,000 3,715,000 4,663,953 55,461,047 3.2% 1,184.99
2004 52,670,000 2,685,000 4,157,414 51,197,586 2.8% 1,061.88
2005 49,130,000 2,210,000 3,338,310 48,001,690 2.3% 970.48
2006 52,035,000 2,925,000 3,513,662 51,446,338 2.6% 1,026.65
2007 63,170,000 2,325,000 3,627,187 61,867,813 2.4% 1,197.57
2008 77,335,000 2,405,000 5,766,501 73,973,499 2.5% 1,417.82
2009 91,840,000 4,130,000 12,412,298 83,557,702 2.8% 1,581.45
2010 96,455,000 5,485,000 6,692,149 95,247,851 3.1% 1,821.84
2011 95,715,000 7,000,000 8,052,900 94,662,100 3.0% 1,763.52
2012 105,475,000 6,090,000 14,677,973 96,887,027 2.9% 1,728.00
Note: Detail regarding the City's outstanding debt can be found in the notes to the financial statements.
1Includes special assessment debt, as special assessment debt is also secured by the full faith and credit of the City. 2Special assessment revenues are accounted for in the Debt Service Fund. 3See the Schedule of Assessed and Estimated Actual Value of Taxable Property on page 176 for property value data. 4Population data can be found in the Schedule of Demographic and Economic Statistics on page 193.
Page 188
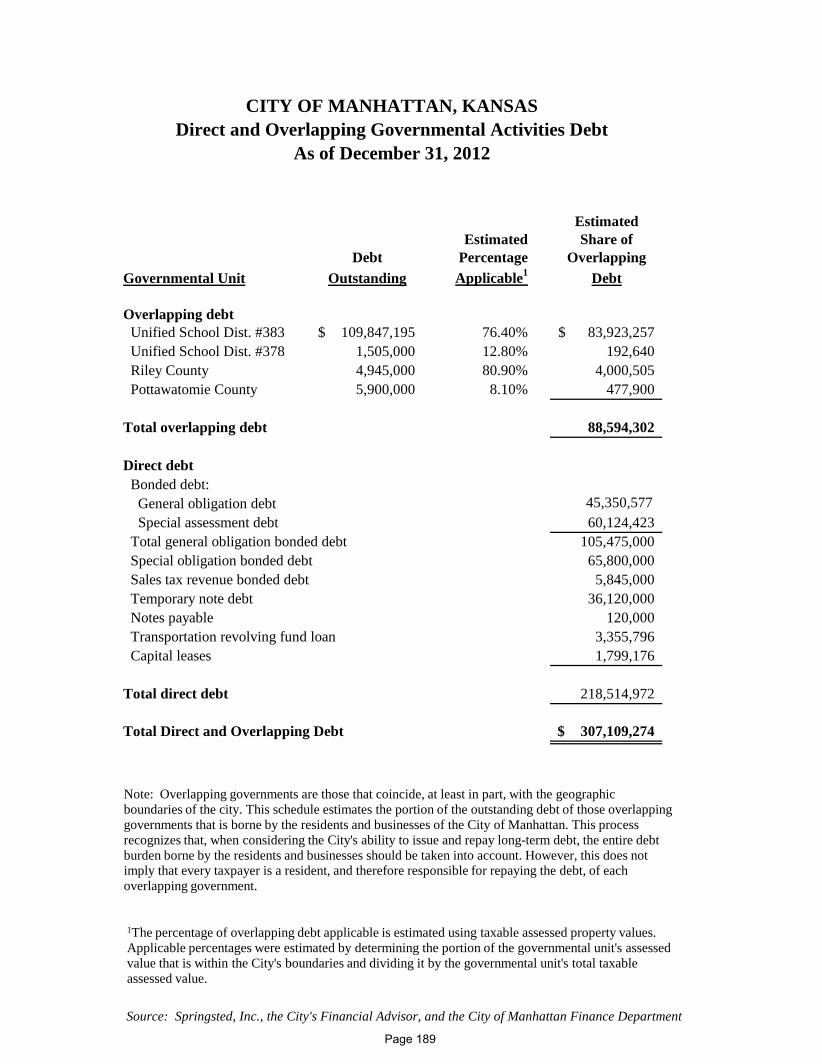
CITY OF MANHATTAN, KANSASDirect and Overlapping Governmental Activities Debt
As of December 31, 2012
EstimatedEstimated Share of
Debt Percentage OverlappingGovernmental Unit Outstanding Applicable1 Debt
Overlapping debt Unified School Dist. #383 109,847,195$ 76.40% 83,923,257$ Unified School Dist. #378 1,505,000 12.80% 192,640 Riley County 4,945,000 80.90% 4,000,505 Pottawatomie County 5,900,000 8.10% 477,900
Total overlapping debt 88,594,302
Direct debt Bonded debt: General obligation debt 45,350,577 Special assessment debt 60,124,423 Total general obligation bonded debt 105,475,000 Special obligation bonded debt 65,800,000 Sales tax revenue bonded debt 5,845,000 Temporary note debt 36,120,000 Notes payable 120,000 Transportation revolving fund loan 3,355,796 Capital leases 1,799,176
Total direct debt 218,514,972
Total Direct and Overlapping Debt 307,109,274$
Source: Springsted, Inc., the City's Financial Advisor, and the City of Manhattan Finance Department
1The percentage of overlapping debt applicable is estimated using taxable assessed property values. Applicable percentages were estimated by determining the portion of the governmental unit's assessed value that is within the City's boundaries and dividing it by the governmental unit's total taxable assessed value.
Note: Overlapping governments are those that coincide, at least in part, with the geographic boundaries of the city. This schedule estimates the portion of the outstanding debt of those overlapping governments that is borne by the residents and businesses of the City of Manhattan. This process recognizes that, when considering the City's ability to issue and repay long-term debt, the entire debt burden borne by the residents and businesses should be taken into account. However, this does not imply that every taxpayer is a resident, and therefore responsible for repaying the debt, of each overlapping government.
Page 189
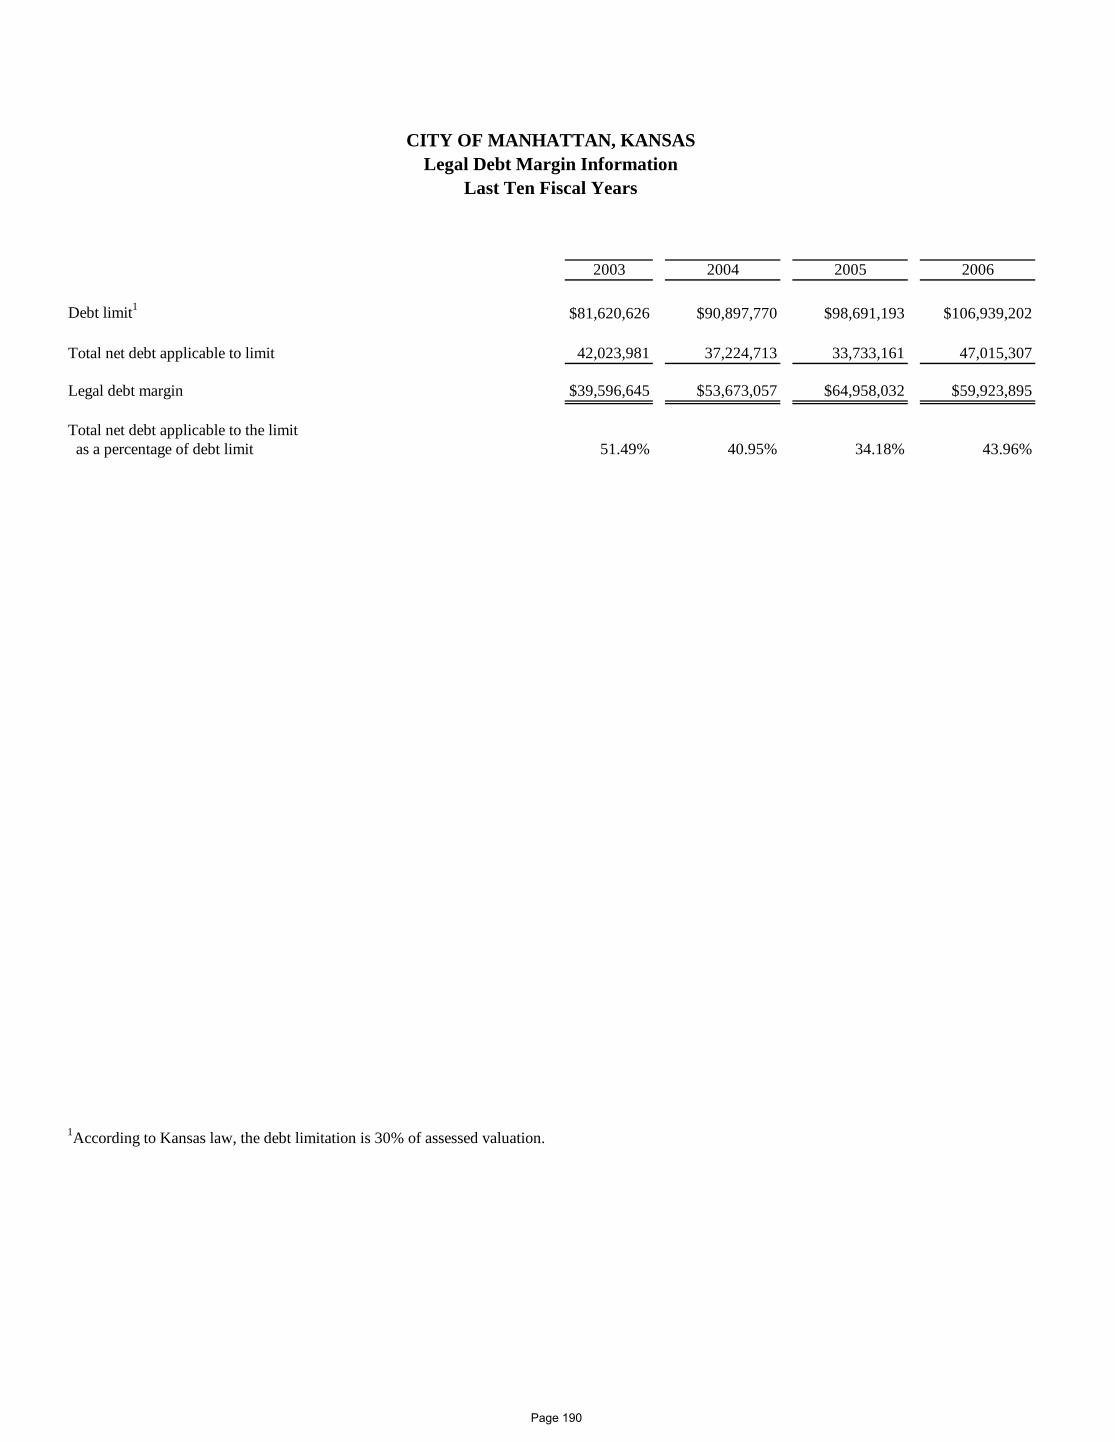
2003 2004 2005 2006
Debt limit1 $81,620,626 $90,897,770 $98,691,193 $106,939,202
Total net debt applicable to limit 42,023,981 37,224,713 33,733,161 47,015,307
Legal debt margin $39,596,645 $53,673,057 $64,958,032 $59,923,895
Total net debt applicable to the limit as a percentage of debt limit 51.49% 40.95% 34.18% 43.96%
1According to Kansas law, the debt limitation is 30% of assessed valuation.
CITY OF MANHATTAN, KANSASLegal Debt Margin Information
Last Ten Fiscal Years
Page 190
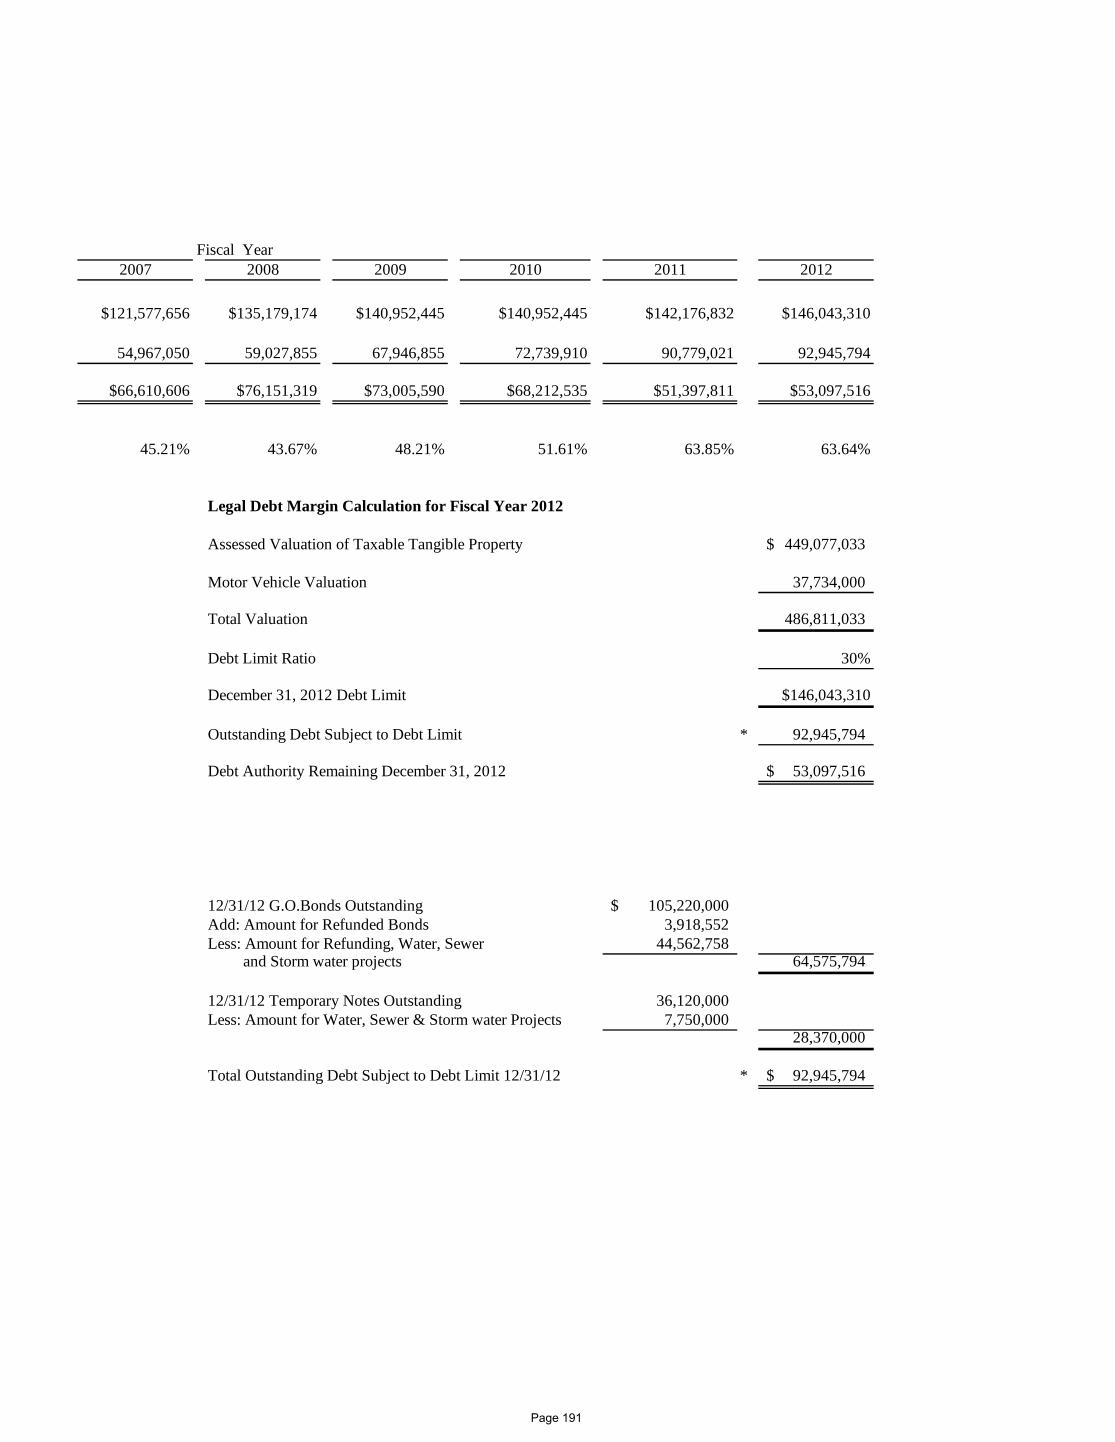
2007 2008 2009 2010 2011 2012
$121,577,656 $135,179,174 $140,952,445 $140,952,445 $142,176,832 $146,043,310
54,967,050 59,027,855 67,946,855 72,739,910 90,779,021 92,945,794
$66,610,606 $76,151,319 $73,005,590 $68,212,535 $51,397,811 $53,097,516
45.21% 43.67% 48.21% 51.61% 63.85% 63.64%
Legal Debt Margin Calculation for Fiscal Year 2012
Assessed Valuation of Taxable Tangible Property 449,077,033$
Motor Vehicle Valuation 37,734,000
Total Valuation 486,811,033
Debt Limit Ratio 30%
December 31, 2012 Debt Limit $146,043,310
Outstanding Debt Subject to Debt Limit * 92,945,794
Debt Authority Remaining December 31, 2012 53,097,516$
12/31/12 G.O.Bonds Outstanding 105,220,000$ Add: Amount for Refunded Bonds 3,918,552 Less: Amount for Refunding, Water, Sewer 44,562,758 and Storm water projects 64,575,794
12/31/12 Temporary Notes Outstanding 36,120,000 Less: Amount for Water, Sewer & Storm water Projects 7,750,000
28,370,000
Total Outstanding Debt Subject to Debt Limit 12/31/12 * 92,945,794$
Fiscal Year
Page 191
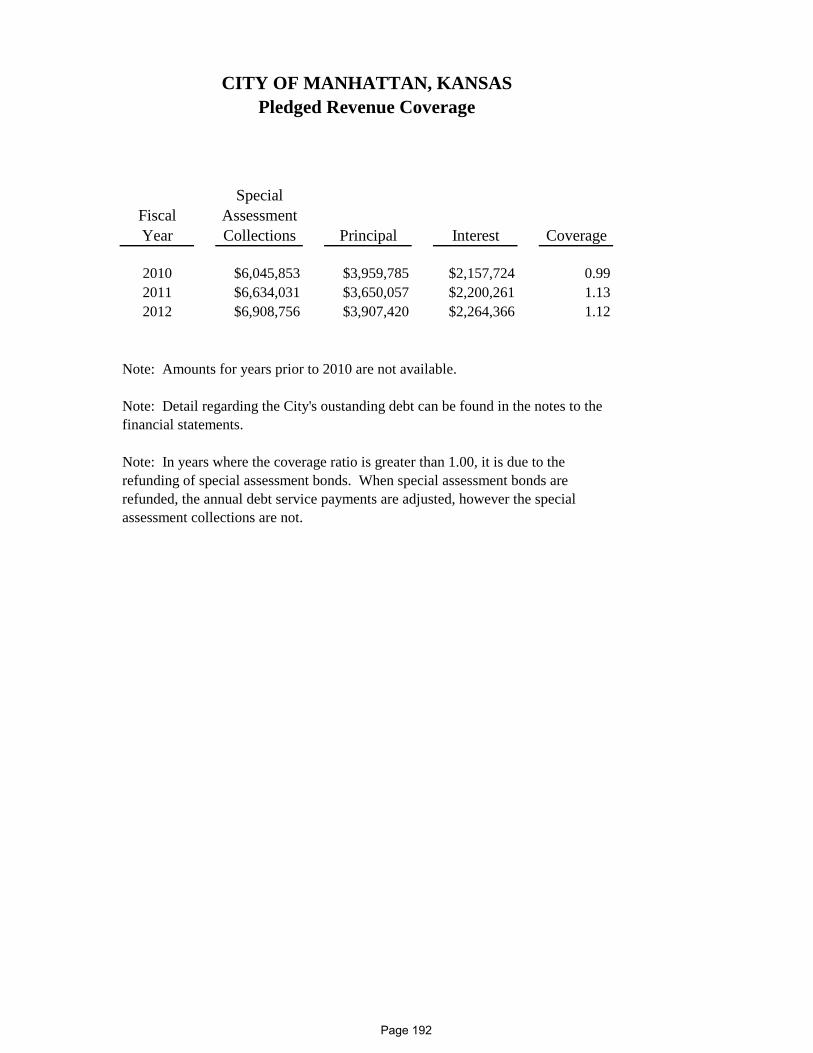
SpecialFiscal AssessmentYear Collections Principal Interest Coverage
2010 $6,045,853 $3,959,785 $2,157,724 0.992011 $6,634,031 $3,650,057 $2,200,261 1.132012 $6,908,756 $3,907,420 $2,264,366 1.12
Note: Amounts for years prior to 2010 are not available.
CITY OF MANHATTAN, KANSASPledged Revenue Coverage
Note: Detail regarding the City's oustanding debt can be found in the notes to the financial statements.
Note: In years where the coverage ratio is greater than 1.00, it is due to the refunding of special assessment bonds. When special assessment bonds are refunded, the annual debt service payments are adjusted, however the special assessment collections are not.
Page 192
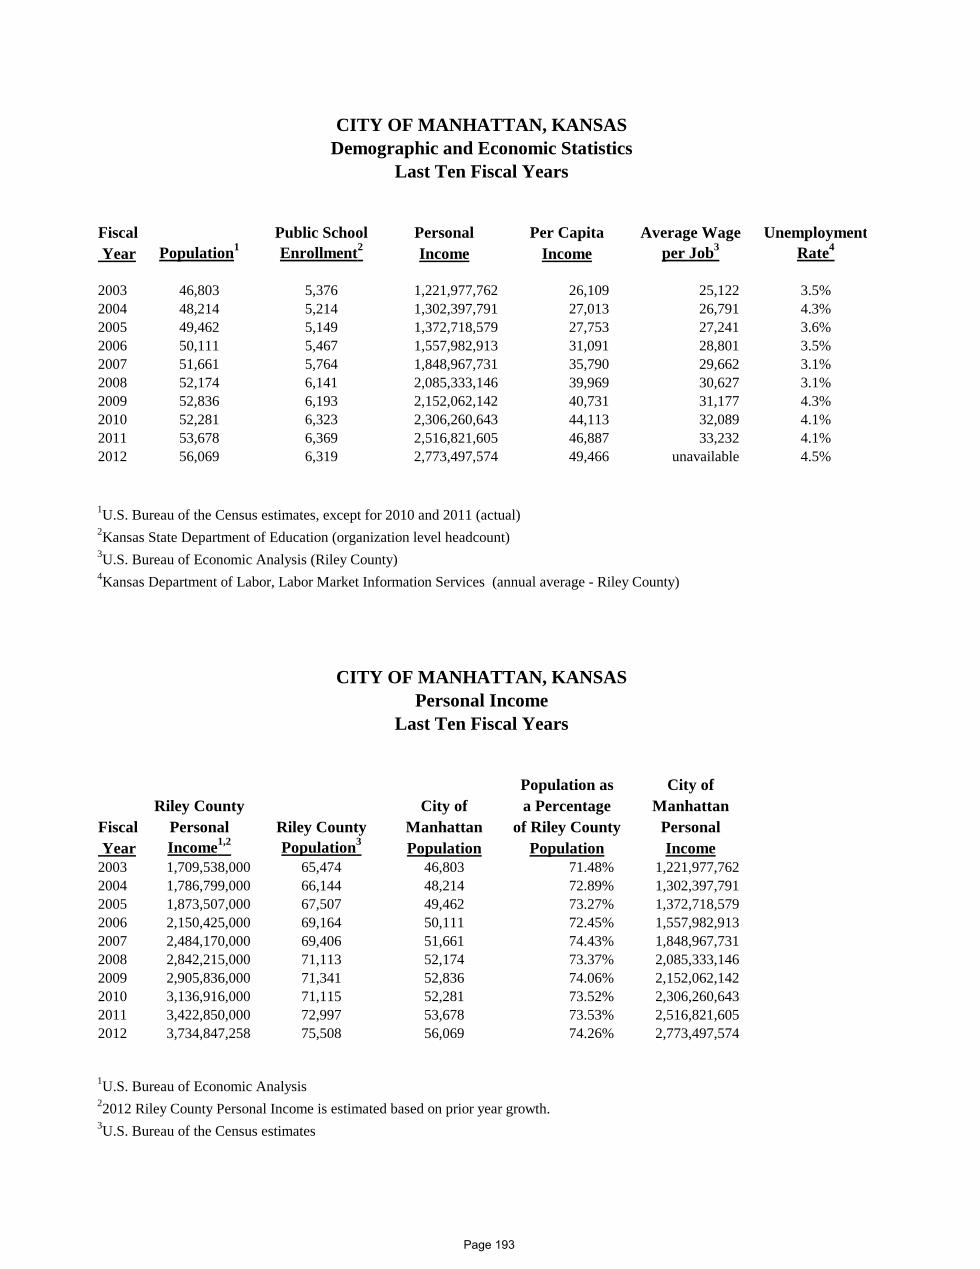
Fiscal Public School Personal Per Capita Average Wage Unemployment Year Population1 Enrollment2 Income Income per Job3 Rate4
2003 46,803 5,376 1,221,977,762 26,109 25,122 3.5%2004 48,214 5,214 1,302,397,791 27,013 26,791 4.3%2005 49,462 5,149 1,372,718,579 27,753 27,241 3.6%2006 50,111 5,467 1,557,982,913 31,091 28,801 3.5%2007 51,661 5,764 1,848,967,731 35,790 29,662 3.1%2008 52,174 6,141 2,085,333,146 39,969 30,627 3.1%2009 52,836 6,193 2,152,062,142 40,731 31,177 4.3%2010 52,281 6,323 2,306,260,643 44,113 32,089 4.1%2011 53,678 6,369 2,516,821,605 46,887 33,232 4.1%2012 56,069 6,319 2,773,497,574 49,466 unavailable 4.5%
1U.S. Bureau of the Census estimates, except for 2010 and 2011 (actual)2Kansas State Department of Education (organization level headcount)3U.S. Bureau of Economic Analysis (Riley County)4Kansas Department of Labor, Labor Market Information Services (annual average - Riley County)
Population as City ofRiley County City of a Percentage Manhattan
Fiscal Personal Riley County Manhattan of Riley County Personal Year Income1,2 Population3 Population Population Income2003 1,709,538,000 65,474 46,803 71.48% 1,221,977,762 2004 1,786,799,000 66,144 48,214 72.89% 1,302,397,791 2005 1,873,507,000 67,507 49,462 73.27% 1,372,718,579 2006 2,150,425,000 69,164 50,111 72.45% 1,557,982,913 2007 2,484,170,000 69,406 51,661 74.43% 1,848,967,731 2008 2,842,215,000 71,113 52,174 73.37% 2,085,333,146 2009 2,905,836,000 71,341 52,836 74.06% 2,152,062,142 2010 3,136,916,000 71,115 52,281 73.52% 2,306,260,643 2011 3,422,850,000 72,997 53,678 73.53% 2,516,821,605 2012 3,734,847,258 75,508 56,069 74.26% 2,773,497,574
1U.S. Bureau of Economic Analysis22012 Riley County Personal Income is estimated based on prior year growth.3U.S. Bureau of the Census estimates
Last Ten Fiscal Years
CITY OF MANHATTAN, KANSASDemographic and Economic Statistics
Last Ten Fiscal Years
CITY OF MANHATTAN, KANSASPersonal Income
Page 193
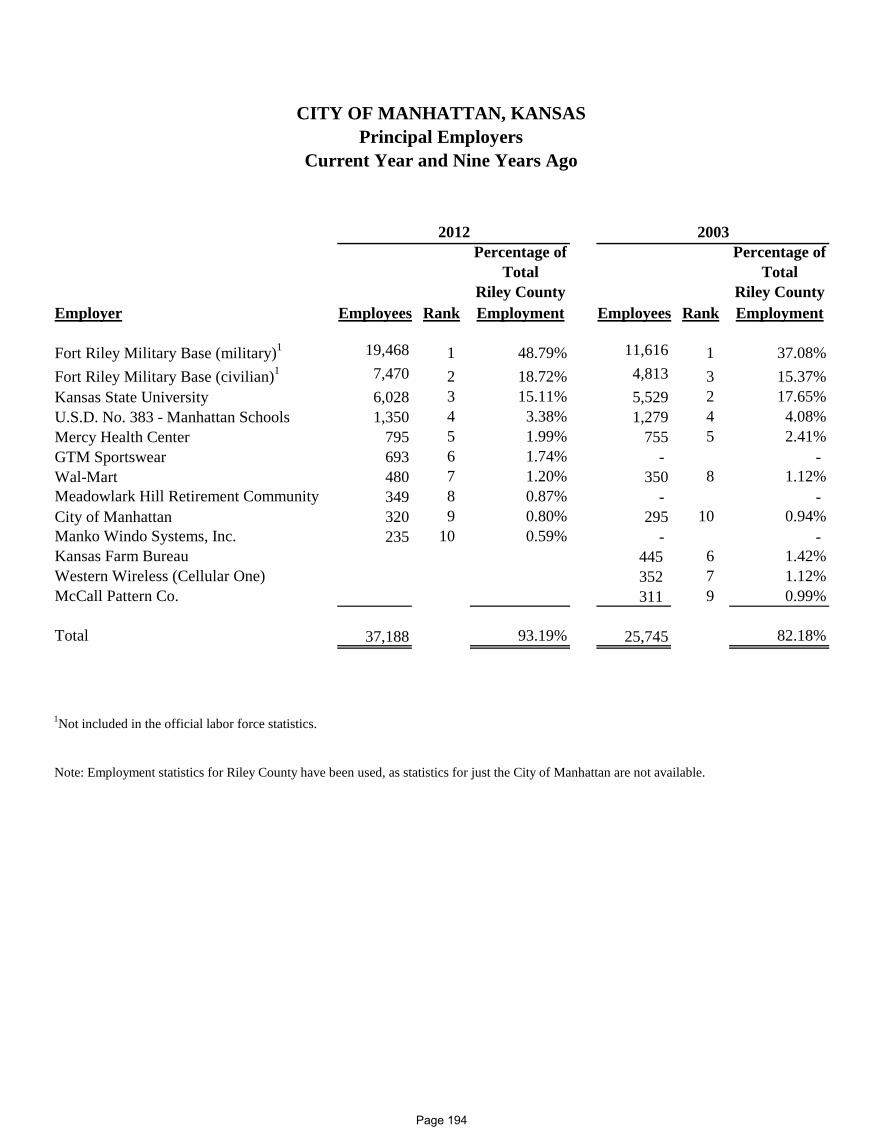
Percentage of Percentage ofTotal Total
Riley County Riley CountyEmployer Employees Rank Employment Employees Rank Employment
Fort Riley Military Base (military)1 19,468 1 48.79% 11,616 1 37.08%Fort Riley Military Base (civilian)1 7,470 2 18.72% 4,813 3 15.37%Kansas State University 6,028 3 15.11% 5,529 2 17.65%U.S.D. No. 383 - Manhattan Schools 1,350 4 3.38% 1,279 4 4.08%Mercy Health Center 795 5 1.99% 755 5 2.41%GTM Sportswear 693 6 1.74% - - Wal-Mart 480 7 1.20% 350 8 1.12%Meadowlark Hill Retirement Community 349 8 0.87% - - City of Manhattan 320 9 0.80% 295 10 0.94%Manko Windo Systems, Inc. 235 10 0.59% - - Kansas Farm Bureau 445 6 1.42%Western Wireless (Cellular One) 352 7 1.12%McCall Pattern Co. 311 9 0.99%
Total 37,188 93.19% 25,745 82.18%
1Not included in the official labor force statistics.
Note: Employment statistics for Riley County have been used, as statistics for just the City of Manhattan are not available.
2012 2003
CITY OF MANHATTAN, KANSASPrincipal Employers
Current Year and Nine Years Ago
Page 194
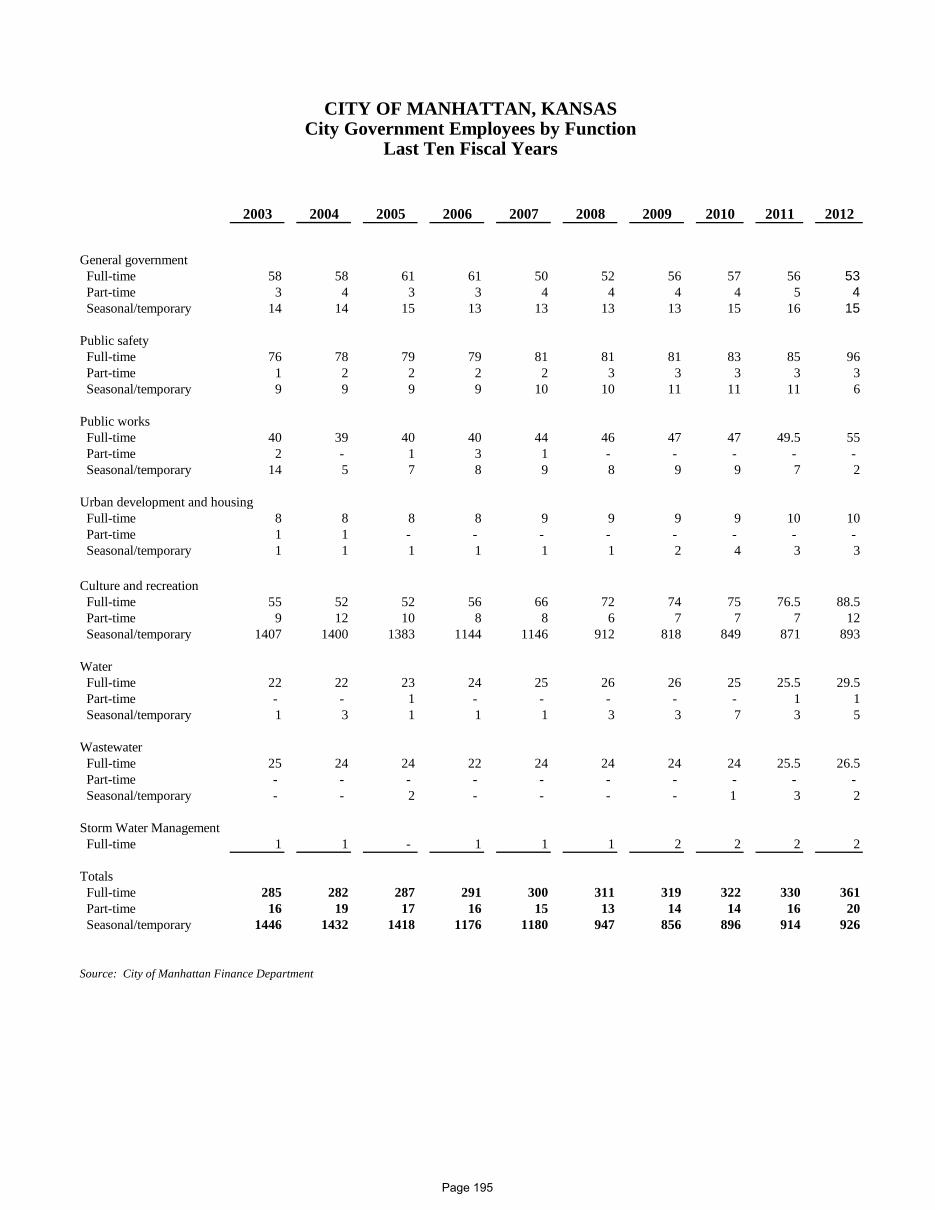
2003 2004 2005 2006 2007 2008 2009 2010 2011 2012
General government Full-time 58 58 61 61 50 52 56 57 56 53 Part-time 3 4 3 3 4 4 4 4 5 4 Seasonal/temporary 14 14 15 13 13 13 13 15 16 15
Public safety Full-time 76 78 79 79 81 81 81 83 85 96 Part-time 1 2 2 2 2 3 3 3 3 3 Seasonal/temporary 9 9 9 9 10 10 11 11 11 6
Public works Full-time 40 39 40 40 44 46 47 47 49.5 55 Part-time 2 - 1 3 1 - - - - - Seasonal/temporary 14 5 7 8 9 8 9 9 7 2
Urban development and housing Full-time 8 8 8 8 9 9 9 9 10 10 Part-time 1 1 - - - - - - - - Seasonal/temporary 1 1 1 1 1 1 2 4 3 3
Culture and recreation Full-time 55 52 52 56 66 72 74 75 76.5 88.5 Part-time 9 12 10 8 8 6 7 7 7 12 Seasonal/temporary 1407 1400 1383 1144 1146 912 818 849 871 893
Water Full-time 22 22 23 24 25 26 26 25 25.5 29.5 Part-time - - 1 - - - - - 1 1 Seasonal/temporary 1 3 1 1 1 3 3 7 3 5
Wastewater Full-time 25 24 24 22 24 24 24 24 25.5 26.5 Part-time - - - - - - - - - - Seasonal/temporary - - 2 - - - - 1 3 2
Storm Water Management Full-time 1 1 - 1 1 1 2 2 2 2
Totals Full-time 285 282 287 291 300 311 319 322 330 361 Part-time 16 19 17 16 15 13 14 14 16 20 Seasonal/temporary 1446 1432 1418 1176 1180 947 856 896 914 926
Source: City of Manhattan Finance Department
CITY OF MANHATTAN, KANSASCity Government Employees by Function
Last Ten Fiscal Years
Page 195
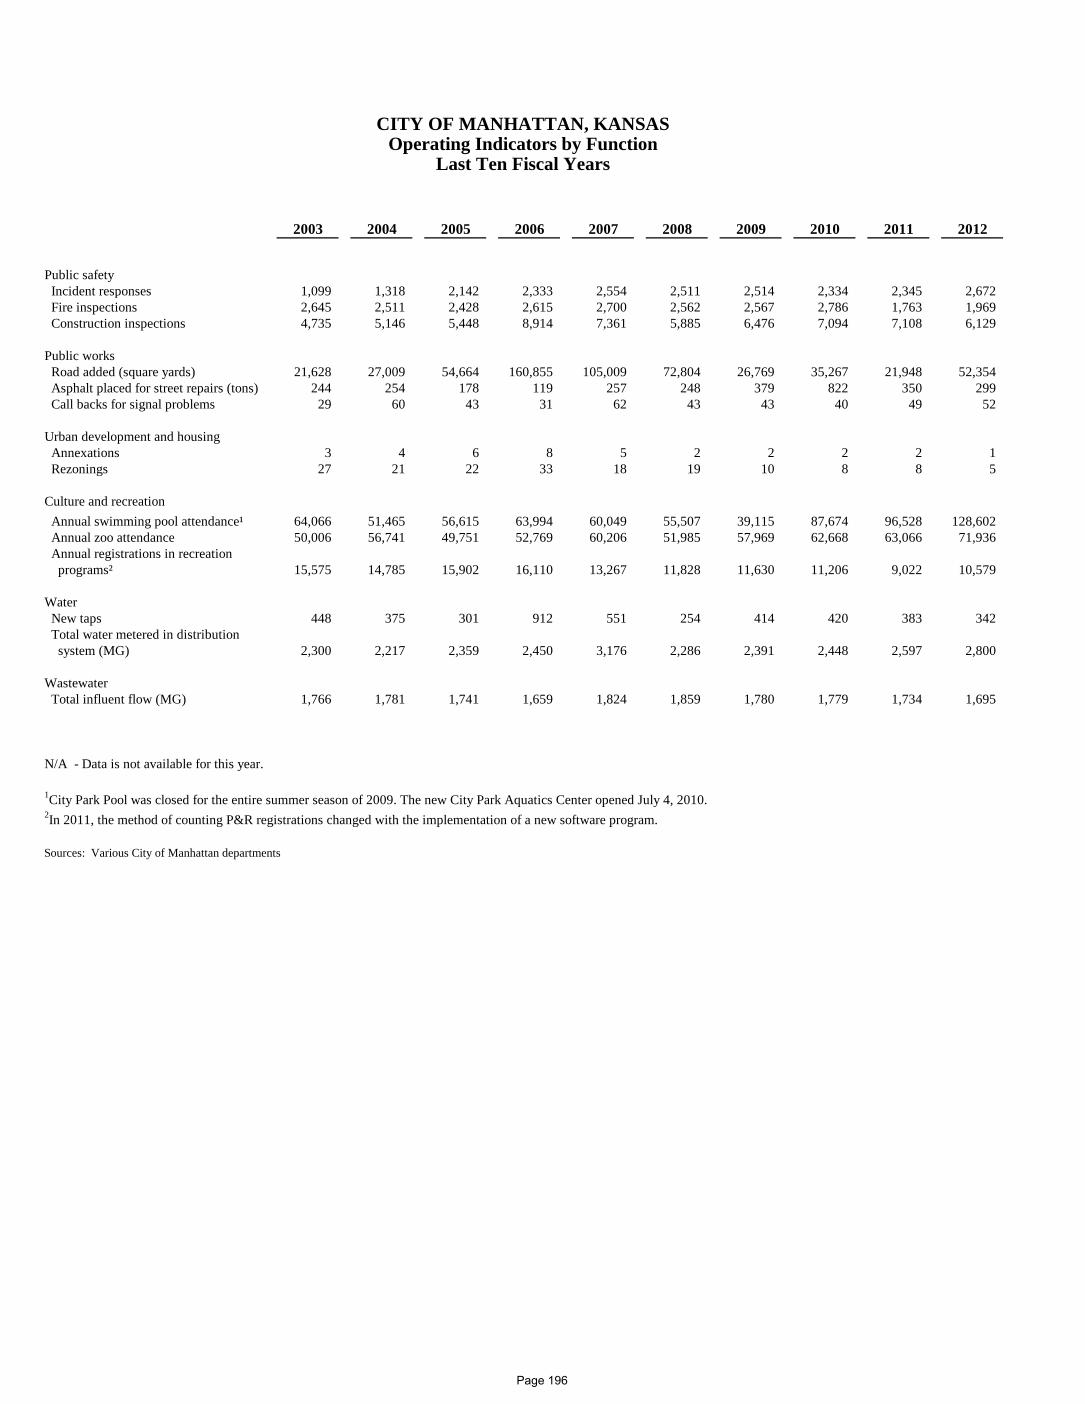
2003 2004 2005 2006 2007 2008 2009 2010 2011 2012
Public safety Incident responses 1,099 1,318 2,142 2,333 2,554 2,511 2,514 2,334 2,345 2,672 Fire inspections 2,645 2,511 2,428 2,615 2,700 2,562 2,567 2,786 1,763 1,969 Construction inspections 4,735 5,146 5,448 8,914 7,361 5,885 6,476 7,094 7,108 6,129
Public works Road added (square yards) 21,628 27,009 54,664 160,855 105,009 72,804 26,769 35,267 21,948 52,354 Asphalt placed for street repairs (tons) 244 254 178 119 257 248 379 822 350 299 Call backs for signal problems 29 60 43 31 62 43 43 40 49 52
Urban development and housing Annexations 3 4 6 8 5 2 2 2 2 1 Rezonings 27 21 22 33 18 19 10 8 8 5
Culture and recreation Annual swimming pool attendance¹ 64,066 51,465 56,615 63,994 60,049 55,507 39,115 87,674 96,528 128,602 Annual zoo attendance 50,006 56,741 49,751 52,769 60,206 51,985 57,969 62,668 63,066 71,936 Annual registrations in recreation programs² 15,575 14,785 15,902 16,110 13,267 11,828 11,630 11,206 9,022 10,579
Water New taps 448 375 301 912 551 254 414 420 383 342 Total water metered in distribution system (MG) 2,300 2,217 2,359 2,450 3,176 2,286 2,391 2,448 2,597 2,800
Wastewater Total influent flow (MG) 1,766 1,781 1,741 1,659 1,824 1,859 1,780 1,779 1,734 1,695
N/A - Data is not available for this year.
1City Park Pool was closed for the entire summer season of 2009. The new City Park Aquatics Center opened July 4, 2010.2In 2011, the method of counting P&R registrations changed with the implementation of a new software program.
Sources: Various City of Manhattan departments
CITY OF MANHATTAN, KANSASOperating Indicators by Function
Last Ten Fiscal Years
Page 196
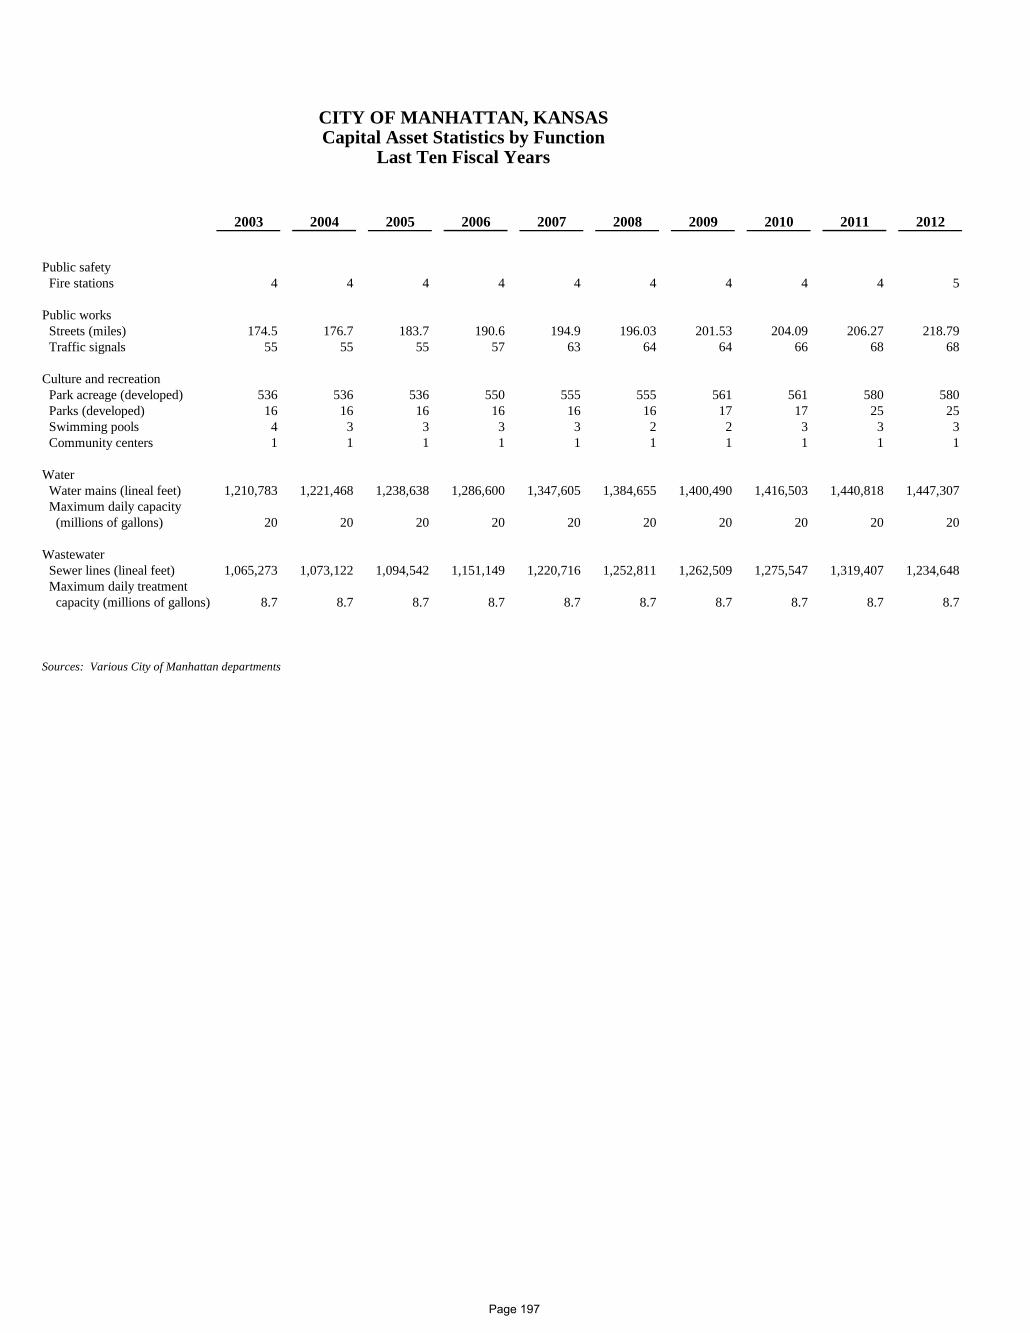
2003 2004 2005 2006 2007 2008 2009 2010 2011 2012
Public safety Fire stations 4 4 4 4 4 4 4 4 4 5
Public works Streets (miles) 174.5 176.7 183.7 190.6 194.9 196.03 201.53 204.09 206.27 218.79 Traffic signals 55 55 55 57 63 64 64 66 68 68
Culture and recreation Park acreage (developed) 536 536 536 550 555 555 561 561 580 580 Parks (developed) 16 16 16 16 16 16 17 17 25 25 Swimming pools 4 3 3 3 3 2 2 3 3 3 Community centers 1 1 1 1 1 1 1 1 1 1
Water Water mains (lineal feet) 1,210,783 1,221,468 1,238,638 1,286,600 1,347,605 1,384,655 1,400,490 1,416,503 1,440,818 1,447,307 Maximum daily capacity (millions of gallons) 20 20 20 20 20 20 20 20 20 20
Wastewater Sewer lines (lineal feet) 1,065,273 1,073,122 1,094,542 1,151,149 1,220,716 1,252,811 1,262,509 1,275,547 1,319,407 1,234,648 Maximum daily treatment capacity (millions of gallons) 8.7 8.7 8.7 8.7 8.7 8.7 8.7 8.7 8.7 8.7
Sources: Various City of Manhattan departments
CITY OF MANHATTAN, KANSASCapital Asset Statistics by Function
Last Ten Fiscal Years
Page 197

THIS PAGE INTENTIONALLY LEFT BLANK
Page 198
Page 199
Page 200
Page 201
Page 202
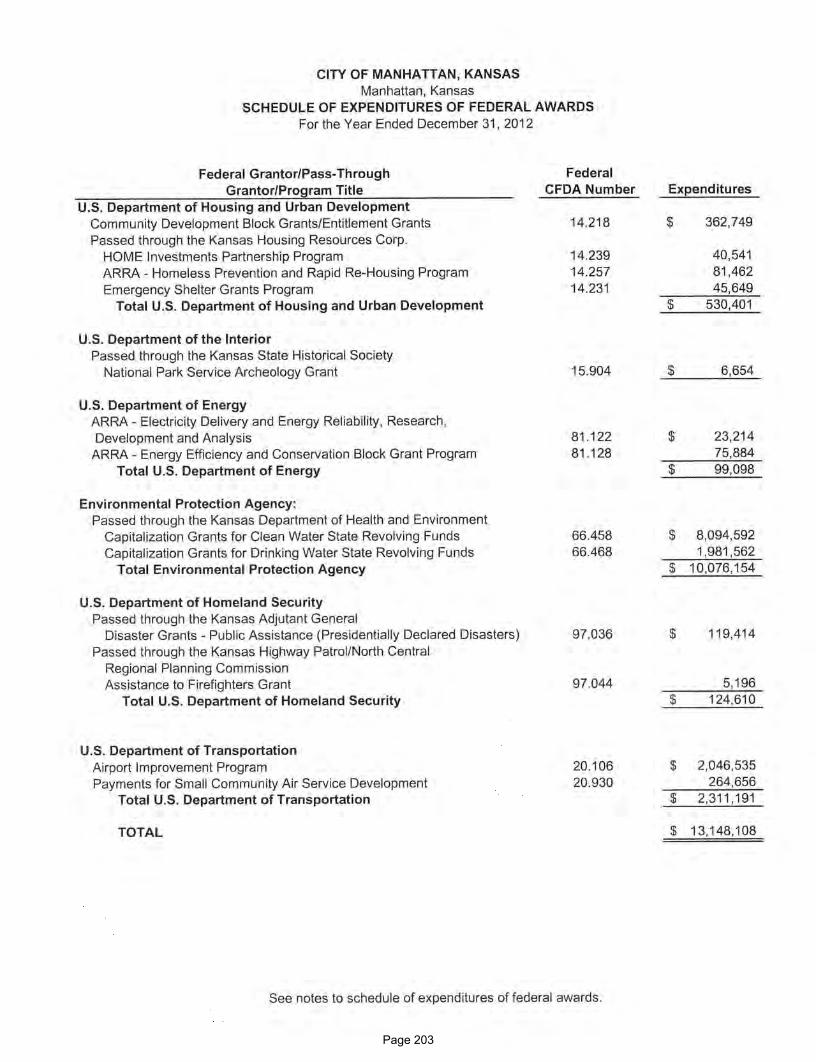
Page 203
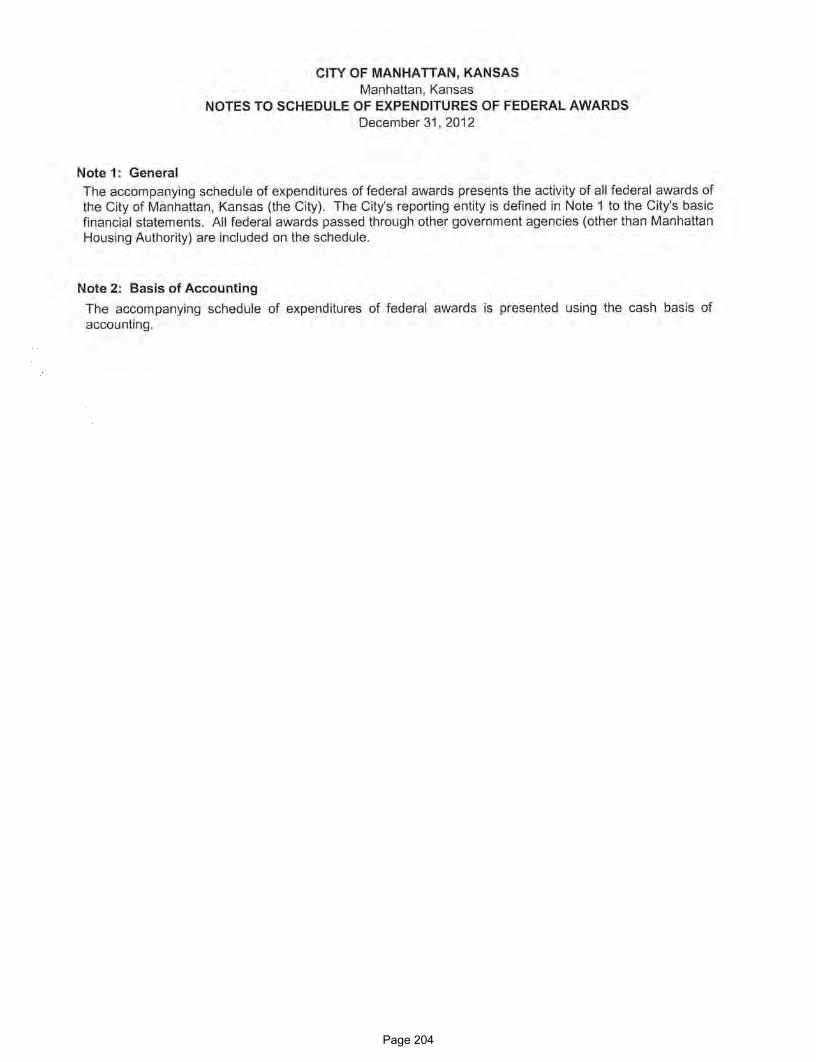
Page 204
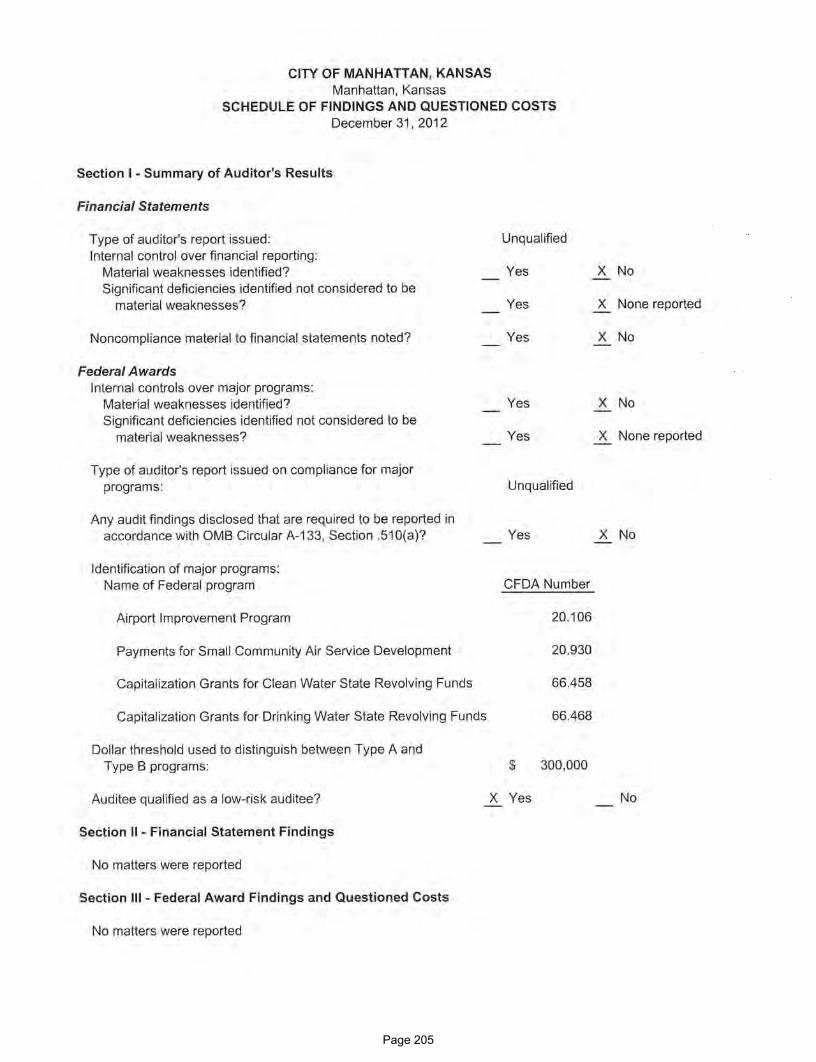
Page 205

Page 206