city of los angeles, californiaclkrep.lacity.org/onlinedocs/2016/16-0440_misc_04-15-2016.pdfovertime...
TRANSCRIPT

CITY OF LOS ANGELES, CALIFORNIA
Cost Allocation Plan 38 For Central Services and Fringe Benefits
(With Independent Auditor’s Report)
For the Fiscal Year Ended June 30, 2014

CITY OF LOS ANGELES, CALIFORNIA Cost Allocation Plan 38
For Central Services and Fringe Benefits For the Fiscal Year Ended June 30, 2014
Table of Contents
Page(s)
Independent Auditor’s Report ................................................................................................................. 1 Central Services Cost Allocation Plan 38
Schedule of Salary Base, Allocated Costs and Rates by Department to be Applied in Fiscal Year 2015-2016 ..................................................................... 3
Central Services Cost Allocation Plan 38
Schedule of Salary Base, Allocated Costs and Rates Including Overtime by Department to be Applied In Fiscal Year 2015-2016 ............................................................................................................... 6
Fringe Benefits Cost Allocation Plan 38
Schedule of Salary Base, Allocated Costs and Rate by Department to be Applied in Fiscal Year 2015-2016 ..................................................................... 9
Fringe Benefits Cost Allocation Plan 38
Schedule of Salary Base, Allocated Costs and Rates Including Overtime by Department to be Applied ....................................................................... 12 In Fiscal Year 2015-2016
Notes to Schedules ................................................................................................................................ 15

www.mgocpa.com
Certified Public Accountants
Macias Gini & O’Connell LLP777 S. Figueroa Street, Suite 2500Los Angeles, CA 90017
Sacramento
Walnut Creek
San Francisco
Oakland
Los Angeles
Century City
Newport Beach
San Diego
1
Independent Auditor’s Report
Honorable Members of the City Council City of Los Angeles, California We have audited the accompanying Central Services and Fringe Benefits Schedules of Salary Base, Allocated Costs and Rates by Department and Schedules of Salary Base, Allocated Costs and Rates Including Overtime by Department (Schedules) of the City of Los Angeles, California (City) Cost Allocation Plan 38 for the fiscal year ended June 30, 2014, and the related notes to the Schedules as listed in the table of contents. Management’s Responsibility for the Schedules Management is responsible for the preparation and fair presentation of the Schedules in accordance with Title 2 in the Code of Federal Regulations (CFR), Subtitle A, Chapter II, Part 225, “Cost Principles for State, Local, and Indian Tribal Governments” (formerly Office of Management and Budget Circular A-87); this includes the design, implementation, and maintenance of internal control relevant to the preparation and fair presentation of the Schedules that are free from material misstatement, whether due to fraud or error. Auditor’s Responsibility Our responsibility is to express an opinion on the Schedules based on our audit. We conducted our audit in accordance with auditing standards generally accepted in the United States of America. Those standards require that we plan and perform the audit to obtain reasonable assurance about whether the Schedules are free from material misstatement. An audit involves performing procedures to obtain audit evidence about the amounts and disclosures in the Schedules. The procedures selected depend on the auditor’s judgment, including the assessment of the risks of material misstatement of the Schedules, whether due to fraud or error. In making those risk assessments, the auditor considers internal control relevant to the entity’s preparation and fair presentation of the Schedules in order to design audit procedures that are appropriate in the circumstances, but not for the purpose of expressing an opinion on the effectiveness of the entity’s internal control. Accordingly, we express no such opinion. An audit also includes evaluating the appropriateness of accounting policies used and the reasonableness of significant accounting estimates made by management, as well as evaluating the overall presentation of the Schedules. We believe that the audit evidence we have obtained is sufficient and appropriate to provide a basis for our audit opinion. Opinion In our opinion, the Schedules referred to above present fairly, in all material respects, the Central Services and Fringe Benefits Salary Base, Allocated Costs, and Rates by Department and Salary Base, Allocated Costs, and Rates Including Overtime by Department for the City Cost Allocation Plan 38 for the fiscal year ended June 30, 2014 in accordance with the basis of accounting described in Note 1.

2
Basis of Accounting We draw attention to Note 1 to the Schedules, which describes the basis of accounting. The Schedules were prepared by the City on the cash basis of accounting, which is a basis of accounting other than accounting principles generally accepted in the United States of America. Our opinion is not modified with respect to that matter. Restriction on Use This report is intended solely for the information and use of City management, City Council, others within the City, and the U.S. Department of Housing and Urban Development, and is not intended to be and should not be used by anyone other than these specified parties.
Los Angeles California April 14, 2016
AllocatedDEPARTMENT/Cost Center Salary Base Costs Rates
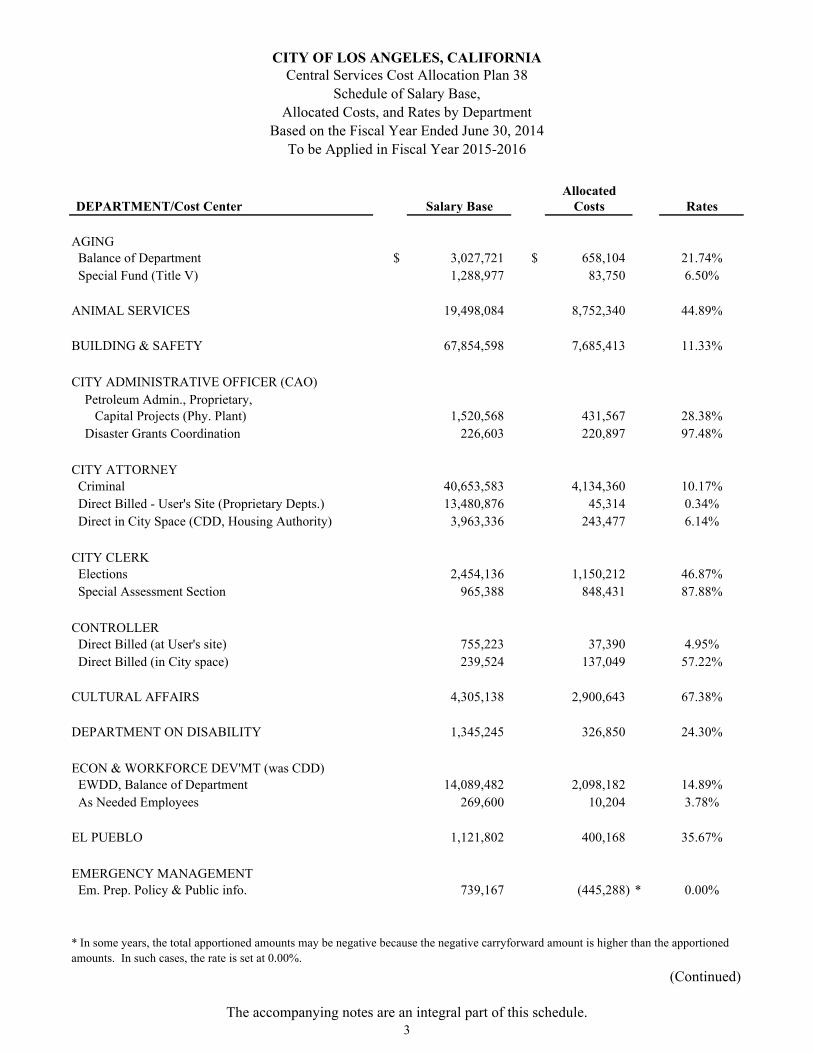
CITY OF LOS ANGELES, CALIFORNIACentral Services Cost Allocation Plan 38
Schedule of Salary Base,
Allocated Costs, and Rates by Department
Based on the Fiscal Year Ended June 30, 2014
To be Applied in Fiscal Year 2015-2016
AGING Balance of Department $ 3,027,721 $ 658,104 21.74%
Special Fund (Title V) 1,288,977 83,750 6.50%
ANIMAL SERVICES 19,498,084 8,752,340 44.89%
BUILDING & SAFETY 67,854,598 7,685,413 11.33%
CITY ADMINISTRATIVE OFFICER (CAO)
Petroleum Admin., Proprietary, Capital Projects (Phy. Plant) 1,520,568 431,567 28.38%
Disaster Grants Coordination 226,603 220,897 97.48%
CITY ATTORNEY Criminal 40,653,583 4,134,360 10.17%
Direct Billed - User's Site (Proprietary Depts.) 13,480,876 45,314 0.34%
Direct in City Space (CDD, Housing Authority) 3,963,336 243,477 6.14%
CITY CLERK Elections 2,454,136 1,150,212 46.87%
Special Assessment Section 965,388 848,431 87.88%
CONTROLLER Direct Billed (at User's site) 755,223 37,390 4.95%
Direct Billed (in City space) 239,524 137,049 57.22%
CULTURAL AFFAIRS 4,305,138 2,900,643 67.38%
DEPARTMENT ON DISABILITY 1,345,245 326,850 24.30%
ECON & WORKFORCE DEV'MT (was CDD) EWDD, Balance of Department 14,089,482 2,098,182 14.89%
As Needed Employees 269,600 10,204 3.78%
EL PUEBLO 1,121,802 400,168 35.67%
EMERGENCY MANAGEMENT Em. Prep. Policy & Public info. 739,167 (445,288) * 0.00%
(Continued)
* In some years, the total apportioned amounts may be negative because the negative carryforward amount is higher than the apportioned
amounts. In such cases, the rate is set at 0.00%.
The accompanying notes are an integral part of this schedule.3

AllocatedDEPARTMENT/Cost Center Salary Base Costs Rates
CITY OF LOS ANGELES, CALIFORNIACentral Services Cost Allocation Plan 38
Schedule of Salary Base,
Allocated Costs, and Rates by Department
Based on the Fiscal Year Ended June 30, 2014
To be Applied in Fiscal Year 2015-2016
FINANCE, OFFICE OF Revenue Collections $ 21,902,387 $ 11,090,493 50.64%
Cash Management & Street Bonds 869,717 225,420 25.92%
FIRE Civilian 23,246,681 4,731,515 20.35%
Sworn 339,405,026 69,292,730 20.42%
GENERAL SERVICES Materials Testing 6,534,791 1,799,529 27.54%
Print Shop 2,515,098 923,904 36.73%
HOUSING + COMMUNITY INVESTMENT Grant Funded Housing 16,653,951 1,255,638 7.54%
Enforcement 24,490,919 1,973,142 8.06%
Housing, Internal Administration 8,927,936 2,314,053 25.92%
LIBRARY 58,452,323 9,977,211 17.07%
LOS ANGELES CONVENTION CENTER 6,881,724 4,054,394 58.92%
MAYOR Executive/Policy 5,893,607 4,622,747 78.44%
Grant Funded/Spec. Prog. 5,016,050 3,875,601 77.26%
Direct in City Space 2,155 126 5.85%
NEIGHBORHOOD EMPOWERMENT 1,902,588 935,028 49.15%
PERSONNEL Custody Care (Jails) 4,764,705 400,221 8.40%
Grant-Funded & Special Programs 861,167 (133,893) * 0.00%
PLANNING 22,109,192 10,434,672 47.20%
POLICE Civilian 206,441,670 22,512,564 10.91%
Sworn (Police Officers) 959,155,604 157,353,243 16.41%
(Continued)
* In some years, the total apportioned amounts may be negative because the negative carryforward amount is higher than the apportioned
amounts. In such cases, the rate is set at 0.00%.
The accompanying notes are an integral part of this schedule.4

AllocatedDEPARTMENT/Cost Center Salary Base Costs Rates
CITY OF LOS ANGELES, CALIFORNIACentral Services Cost Allocation Plan 38
Schedule of Salary Base,
Allocated Costs, and Rates by Department
Based on the Fiscal Year Ended June 30, 2014
To be Applied in Fiscal Year 2015-2016
PUBLIC WORKS
Board Office Direct: Pub. Svcs. $ 743,161 $ 376,167 50.62%
Contract Administration Construction Inspection 21,159,129 1,351,445 6.39%
Engineering
Stormwater Facilities Engineering 3,539,971 299,773 8.47%
Wastewater Facilities Engineering 22,447,079 2,027,004 9.03%
Privately Financed Improvements Eng. 7,818,083 1,086,876 13.90%
Street Improvements Engineering 11,521,768 1,117,260 9.70%
Municipal Facilities Engineering 11,068,967 567,030 5.12% Gen'l. Mapping & Survey 4,437,012 472,230 10.64%
Sanitation Solid Waste Program 76,427,552 91,643,914 119.91%
Wastewater/Flood Control 107,571,348 18,158,039 16.88%
Street Lighting 18,050,295 3,864,558 21.41%
Street Services (St. Maintenance) 68,445,802 47,979,318 70.10%
RECREATION AND PARKS 118,163,761 41,527,240 35.14%
TRANSPORTATION 103,795,492 28,561,751 27.52%
ZOO 14,621,818 3,956,432 27.06%
The accompanying notes are an integral part of this schedule.5

Salary BaseOvertime Including Allocated
DEPARTMENT/Cost Center Salary Base Salaries Overtime Costs Rates
To Be Applied in Fiscal Year 2015-2016
CITY OF LOS ANGELES, CALIFORNIACentral Services Cost Allocation Plan 38Schedule of Salary Base, Allocated Costs
And Rates Including Overtime by DepartmentBased on the Fiscal Year Ended June 30, 2014
AGING
Balance of Department 3,027,721$ 4,635$ 3,032,356$ 11,088$ 0.37%
Special Fund (Title V) 1,288,977 - 1,288,977 - 0.00%
ANIMAL SERVICES 19,498,084 20,243 19,518,327 1,410,853 7.23%
BUILDING & SAFETY 67,854,598 5,581,122 73,435,720 467,828 0.64%
CITY ADMINISTRATIVE OFFICER (CAO)
Petroleum Admin., Proprietary,
Capital Projects (Phy. Plant) 1,520,568 7,763 1,528,331 66,577 4.36%
Disaster Grants Coordination 226,603 1,725 228,328 20,849 9.13%
CITY ATTORNEY
Criminal 40,653,583 495 40,654,078 423,238 1.04%
Direct Billed - User's Site (Proprietary Depts.) 13,480,876 10 13,480,886 - 0.00%
Direct in City Space (CDD, Housing Authority) 3,963,336 - 3,963,336 47,864 1.21%
CITY CLERK
Elections 2,454,136 24,408 2,478,544 45,227 1.82%
Special Assessment Section 965,388 280 965,668 97,604 10.11%
CONTROLLER
Direct Billed (at User's site) 755,223 21,682 776,905 - 0.00%
Direct Billed (in City space) 239,524 812 240,336 13,019 5.42%
CULTURAL AFFAIRS 4,305,138 4,802 4,309,940 437,307 10.15%
DEPARTMENT ON DISABILITY 1,345,245 343 1,345,588 9,529 0.71%
ECON & WORKFORCE DEV'MT (was CDD)
EWDD, Balance of Department 14,089,482 18,078 14,107,560 153,286 1.09%
As Needed Employees 269,600 269,600 - 0.00%
EL PUEBLO 1,121,802 23,851 1,145,653 12,272 1.07%
EMERGENCY MANAGEMENT
Em. Prep. Policy & Public info. 739,167 9,672 748,839 (26,468) * 0.00%
(Continued)
* In some years, the total apportioned amounts may be negative because the negative carryforward amount is higher than the apportioned amounts. In
such cases, the rate is set at 0.00%.
The accompanying notes are in integral part of this schedule.6
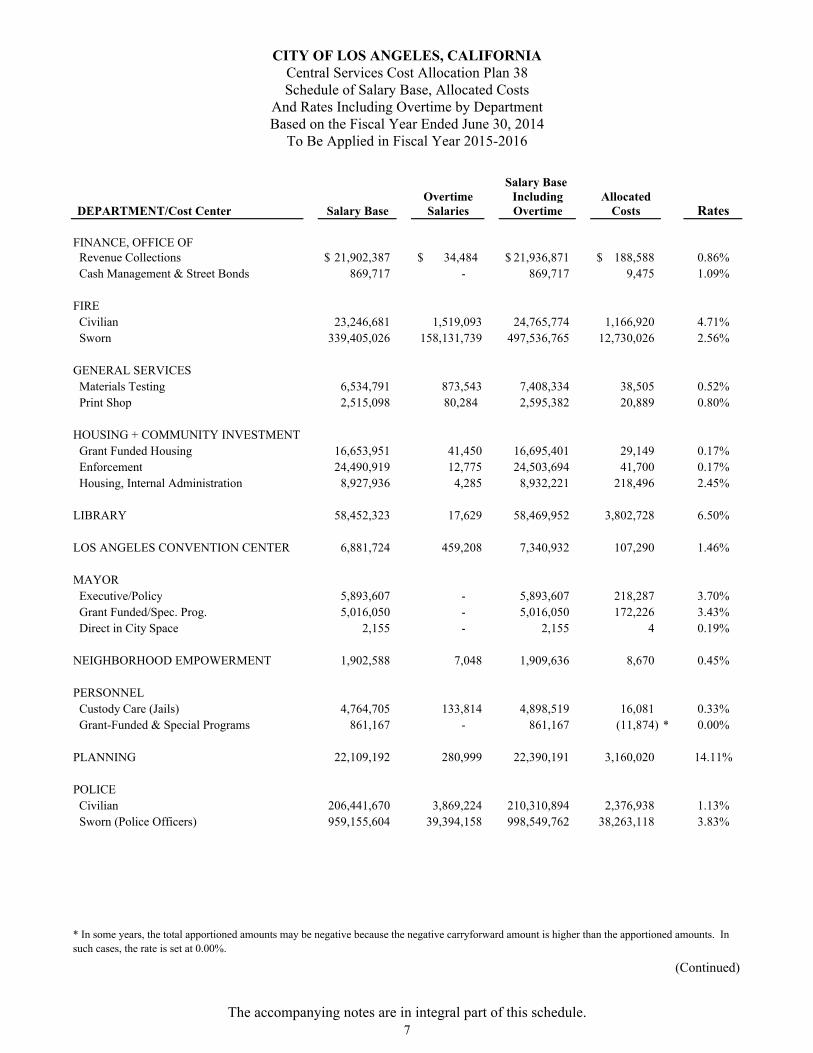
Salary BaseOvertime Including Allocated
DEPARTMENT/Cost Center Salary Base Salaries Overtime Costs Rates
To Be Applied in Fiscal Year 2015-2016
CITY OF LOS ANGELES, CALIFORNIACentral Services Cost Allocation Plan 38Schedule of Salary Base, Allocated Costs
And Rates Including Overtime by DepartmentBased on the Fiscal Year Ended June 30, 2014
FINANCE, OFFICE OF Revenue Collections 21,902,387$ 34,484$ 21,936,871$ 188,588$ 0.86%
Cash Management & Street Bonds 869,717 - 869,717 9,475 1.09%
FIRE
Civilian 23,246,681 1,519,093 24,765,774 1,166,920 4.71%
Sworn 339,405,026 158,131,739 497,536,765 12,730,026 2.56%
GENERAL SERVICES
Materials Testing 6,534,791 873,543 7,408,334 38,505 0.52%
Print Shop 2,515,098 80,284 2,595,382 20,889 0.80%
HOUSING + COMMUNITY INVESTMENT
Grant Funded Housing 16,653,951 41,450 16,695,401 29,149 0.17%
Enforcement 24,490,919 12,775 24,503,694 41,700 0.17%
Housing, Internal Administration 8,927,936 4,285 8,932,221 218,496 2.45%
LIBRARY 58,452,323 17,629 58,469,952 3,802,728 6.50%
LOS ANGELES CONVENTION CENTER 6,881,724 459,208 7,340,932 107,290 1.46%
MAYOR
Executive/Policy 5,893,607 - 5,893,607 218,287 3.70%
Grant Funded/Spec. Prog. 5,016,050 - 5,016,050 172,226 3.43%
Direct in City Space 2,155 - 2,155 4 0.19%
NEIGHBORHOOD EMPOWERMENT 1,902,588 7,048 1,909,636 8,670 0.45%
PERSONNEL
Custody Care (Jails) 4,764,705 133,814 4,898,519 16,081 0.33%
Grant-Funded & Special Programs 861,167 - 861,167 (11,874) * 0.00%
PLANNING 22,109,192 280,999 22,390,191 3,160,020 14.11%
POLICE
Civilian 206,441,670 3,869,224 210,310,894 2,376,938 1.13%
Sworn (Police Officers) 959,155,604 39,394,158 998,549,762 38,263,118 3.83%
(Continued)
* In some years, the total apportioned amounts may be negative because the negative carryforward amount is higher than the apportioned amounts. In
such cases, the rate is set at 0.00%.
The accompanying notes are in integral part of this schedule.7
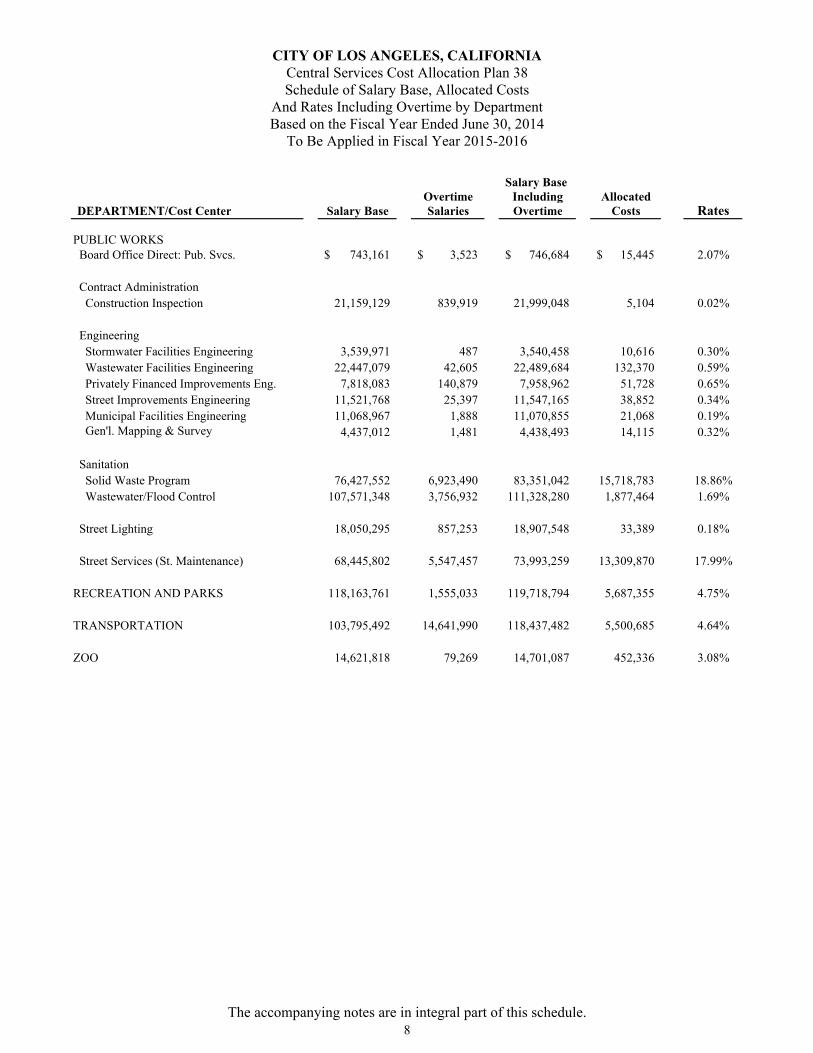
Salary BaseOvertime Including Allocated
DEPARTMENT/Cost Center Salary Base Salaries Overtime Costs Rates
To Be Applied in Fiscal Year 2015-2016
CITY OF LOS ANGELES, CALIFORNIACentral Services Cost Allocation Plan 38Schedule of Salary Base, Allocated Costs
And Rates Including Overtime by DepartmentBased on the Fiscal Year Ended June 30, 2014
PUBLIC WORKS Board Office Direct: Pub. Svcs. 743,161$ 3,523$ 746,684$ 15,445$ 2.07%
Contract Administration
Construction Inspection 21,159,129 839,919 21,999,048 5,104 0.02%
Engineering
Stormwater Facilities Engineering 3,539,971 487 3,540,458 10,616 0.30%
Wastewater Facilities Engineering 22,447,079 42,605 22,489,684 132,370 0.59%
Privately Financed Improvements Eng. 7,818,083 140,879 7,958,962 51,728 0.65%
Street Improvements Engineering 11,521,768 25,397 11,547,165 38,852 0.34%
Municipal Facilities Engineering 11,068,967 1,888 11,070,855 21,068 0.19% Gen'l. Mapping & Survey 4,437,012 1,481 4,438,493 14,115 0.32%
Sanitation
Solid Waste Program 76,427,552 6,923,490 83,351,042 15,718,783 18.86%
Wastewater/Flood Control 107,571,348 3,756,932 111,328,280 1,877,464 1.69%
Street Lighting 18,050,295 857,253 18,907,548 33,389 0.18%
Street Services (St. Maintenance) 68,445,802 5,547,457 73,993,259 13,309,870 17.99%
RECREATION AND PARKS 118,163,761 1,555,033 119,718,794 5,687,355 4.75%
TRANSPORTATION 103,795,492 14,641,990 118,437,482 5,500,685 4.64%
ZOO 14,621,818 79,269 14,701,087 452,336 3.08%
The accompanying notes are in integral part of this schedule.8

Salary Base Salary Base AllocatedDEPARTMENT/Cost Center (Standard) [1] (Special) [1] Costs Rates [1]
AGING Balance of Department 2,922,336$ 3,027,721$ 1,503,135$ 43.59% Special Fund (Title V) 1,288,977 1,288,977 344,152 26.70%
ANIMAL SERVICES 19,227,177 19,498,084 9,859,683 49.20%
BUILDING & SAFETY 66,844,660 67,854,598 33,881,670 42.53%
CITY ADMINISTRATIVE OFFICER (CAO) Petroleum Admin., Proprietary, Capital Projects (Phy. Plant) 1,491,165 1,520,568 1,168,052 71.37% Disaster Grants Coordination 210,715 226,603 167,596 72.51%
CITY ATTORNEY Criminal 40,653,583 40,653,583 17,088,548 39.47% Direct Billed - User's Site (Proprietary Depts.) 13,480,876 13,480,876 5,452,645 37.89% Direct in City Space (CDD, Housing Authority) 3,963,336 3,963,336 1,483,880 34.88%
CITY CLERK Elections 2,119,117 2,454,136 1,774,659 76.32% Special Assessment Section 965,388 965,388 442,705 43.40%
CONTROLLER Direct Billed (at User's site) 755,223 755,223 380,876 45.14% Direct Billed (in City space) 239,524 239,524 121,605 45.48%
CULTURAL AFFAIRS 3,157,028 4,305,138 2,274,104 60.04%
DEPARTMENT ON DISABILITY 1,345,245 1,345,245 544,366 40.47%
ECON & WORKFORCE DEV'MT (was CDD) EWDD, Balance of Department 14,089,482 14,089,482 5,608,076 39.80% As Needed Employees. 269,600 269,600 48,800 18.10%
EL PUEBLO 928,248 1,121,802 315,962 32.90%
EMERGENCY MANAGEMENT Em. Prep. Policy & Public info. 739,167 739,167 261,414 41.20%
(Continued)
[1] The Fringe Benefits "Salary Base (Special)" is used to calculate the fringe benefits rates for Medicare, Workers' Compensation, and UnemploymentInsurance. The "Salary Base (Standard)" is used to calculate the fringe benefits rates for all other fringe benefits. The Fringe Benefits rates above are aweighted combination of the two calculations.
To Be Applied in Fiscal Year 2015-2016Based on the Fiscal Year Ended June 30, 2014
CITY OF LOS ANGELES, CALIFORNIAFringe Benefits Cost Allocation Plan 38
Schedule of Salary Base,Allocated Costs, and Rates by Department
The acompanying notes are an integral part of this schedule.9

Salary Base Salary Base AllocatedDEPARTMENT/Cost Center (Standard) [1] (Special) [1] Costs Rates [1]
To Be Applied in Fiscal Year 2015-2016Based on the Fiscal Year Ended June 30, 2014
CITY OF LOS ANGELES, CALIFORNIAFringe Benefits Cost Allocation Plan 38
Schedule of Salary Base,Allocated Costs, and Rates by Department
FINANCE, OFFICE OF Revenue Collections 21,533,310$ 21,902,387$ 10,347,268$ 44.89% Cash Management & Street Bonds 863,868 869,717 339,016 36.14%
FIRE Civilian 23,205,020 23,205,020 11,583,390 43.01% Sworn 339,405,026 357,996,341 250,638,314 71.30%
GENERAL SERVICES Materials Testing 6,534,173 6,534,173 2,799,924 43.29% Print Shop 2,515,098 2,515,098 1,087,600 43.68%
HOUSING + COMMUNITY INVESTMENT Grant Funded Housing 16,380,277 16,653,951 7,455,598 42.13% Enforcement 24,269,643 24,490,919 11,038,972 42.10% Housing, Internal Administration 8,887,096 8,887,096 4,146,444 43.30%
LIBRARY 55,355,372 58,452,323 30,046,333 48.67%
LOS ANGELES CONVENTION CENTER 5,830,119 6,881,724 1,959,790 51.98%
MAYOR Executive/Policy 5,853,178 5,893,607 1,960,058 45.74% Grant Funded/Spec. Prog. 4,983,249 5,016,050 2,032,732 53.05% Direct in City Space 2,155 2,155 396 30.67%
NEIGHBORHOOD EMPOWERMENT 1,725,025 1,902,588 980,610 49.68%
PERSONNEL Custody Care (Jails) 3,715,670 4,764,705 1,793,177 43.96% Grant-Funded & Special Programs 861,167 861,167 438,399 47.51%
PLANNING 21,851,818 22,109,192 12,528,681 42.94%
POLICE Civilian 205,246,045 206,441,670 97,381,534 46.52% Sworn (Police Officers) 959,155,604 985,685,350 681,738,819 69.79%
(Continued)
[1] The Fringe Benefits "Salary Base (Special)" is used to calculate the fringe benefits rates for Medicare, Workers' Compensation, and UnemploymentInsurance. The "Salary Base (Standard)" is used to calculate the fringe benefits rates for all other fringe benefits. The Fringe Benefits rates above are aweighted combination of the two calculations.
The acompanying notes are an integral part of this schedule.10
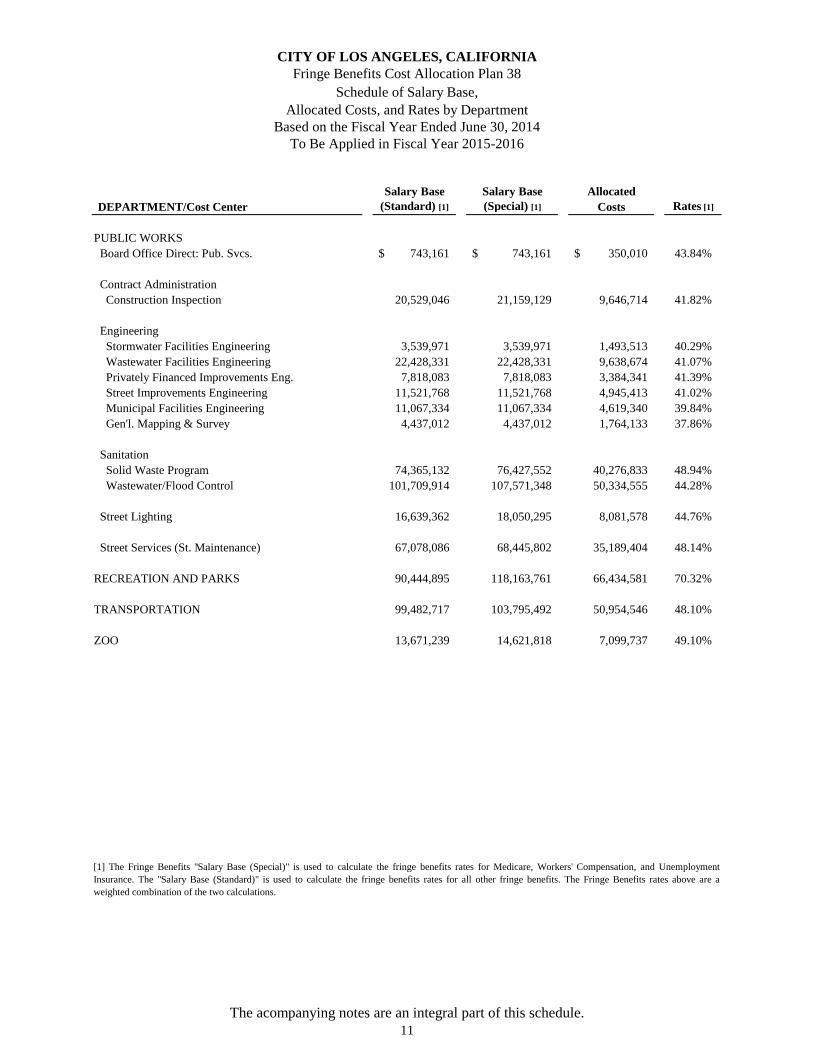
Salary Base Salary Base AllocatedDEPARTMENT/Cost Center (Standard) [1] (Special) [1] Costs Rates [1]
To Be Applied in Fiscal Year 2015-2016Based on the Fiscal Year Ended June 30, 2014
CITY OF LOS ANGELES, CALIFORNIAFringe Benefits Cost Allocation Plan 38
Schedule of Salary Base,Allocated Costs, and Rates by Department
PUBLIC WORKS Board Office Direct: Pub. Svcs. 743,161$ 743,161$ 350,010$ 43.84%
Contract Administration Construction Inspection 20,529,046 21,159,129 9,646,714 41.82%
Engineering Stormwater Facilities Engineering 3,539,971 3,539,971 1,493,513 40.29% Wastewater Facilities Engineering 22,428,331 22,428,331 9,638,674 41.07% Privately Financed Improvements Eng. 7,818,083 7,818,083 3,384,341 41.39% Street Improvements Engineering 11,521,768 11,521,768 4,945,413 41.02% Municipal Facilities Engineering 11,067,334 11,067,334 4,619,340 39.84% Gen'l. Mapping & Survey 4,437,012 4,437,012 1,764,133 37.86%
Sanitation Solid Waste Program 74,365,132 76,427,552 40,276,833 48.94% Wastewater/Flood Control 101,709,914 107,571,348 50,334,555 44.28%
Street Lighting 16,639,362 18,050,295 8,081,578 44.76%
Street Services (St. Maintenance) 67,078,086 68,445,802 35,189,404 48.14%
RECREATION AND PARKS 90,444,895 118,163,761 66,434,581 70.32%
TRANSPORTATION 99,482,717 103,795,492 50,954,546 48.10%
ZOO 13,671,239 14,621,818 7,099,737 49.10%
[1] The Fringe Benefits "Salary Base (Special)" is used to calculate the fringe benefits rates for Medicare, Workers' Compensation, and UnemploymentInsurance. The "Salary Base (Standard)" is used to calculate the fringe benefits rates for all other fringe benefits. The Fringe Benefits rates above are aweighted combination of the two calculations.
The acompanying notes are an integral part of this schedule.11

Salary BaseSalary Base Including Allocated
DEPARTMENT/Cost Center (Special) Overtime Overtime Costs Rates
AGING Balance of Department 3,027,721$ 4,635$ 3,032,356$ 95,032$ 3.13% Special Fund (Title V) 1,288,977 - 1,288,977 188,675 14.64%
ANIMAL SERVICES 19,498,084 20,243 19,518,327 1,058,744 5.42%
BUILDING & SAFETY 67,854,598 5,581,122 73,435,720 2,160,447 2.94%
CITY ADMINISTRATIVE OFFICER (CAO) Petroleum Admin., Proprietary, Capital Projects (Phy. Plant) 1,520,568 7,763 1,528,331 32,822 2.15% Disaster Grants Coordination 226,603 1,725 228,328 4,899 2.15%
CITY ATTORNEY Criminal 40,653,583 495 40,654,078 1,095,198 2.69% Direct Billed - User's Site (Proprietary Depts.) 13,480,876 10 13,480,886 333,235 2.47% Direct in City Space (CDD, Housing Authority) 3,963,336 - 3,963,336 88,349 2.23%
CITY CLERK Elections 2,454,136 24,408 2,478,544 712,492 28.75% Special Assessment Section 965,388 280 965,668 17,174 1.78%
CONTROLLER Direct Billed (at User's site) 755,223 21,682 776,905 19,090 2.46% Direct Billed (in City space) 239,524 812 240,336 6,122 2.55%
CULTURAL AFFAIRS 4,305,138 4,802 4,309,940 474,633 11.01%
DEPARTMENT ON DISABILITY 1,345,245 343 1,345,588 17,114 1.27%
ECON & WORKFORCE DEV'MT (was CDD) EWDD, Balance of Department 14,089,482 18,078 14,107,560 405,085 2.87% As Needed Employees. 269,600 269,600 38,385 14.24%
EL PUEBLO 1,121,802 23,851 1,145,653 29,601 2.58%
EMERGENCY MANAGEMENT Em. Prep. Policy & Public info. 739,167 9,672 748,839 33,084 4.42%
(Continued)
To Be Applied in Fiscal Year 2015-2016
CITY OF LOS ANGELES, CALIFORNIAFringe Benefits Cost Allocation Plan 38
Schedule of Salary Base, Allocated Costs,And Rates Including Overtime By DepartmentBased on the Fiscal Year Ended June 30, 2014
The accompanying notes are an integral part of this schedule.12

Salary BaseSalary Base Including Allocated
DEPARTMENT/Cost Center (Special) Overtime Overtime Costs Rates
To Be Applied in Fiscal Year 2015-2016
CITY OF LOS ANGELES, CALIFORNIAFringe Benefits Cost Allocation Plan 38
Schedule of Salary Base, Allocated Costs,And Rates Including Overtime By DepartmentBased on the Fiscal Year Ended June 30, 2014
FINANCE, OFFICE OF Revenue Collections 21,902,387$ 34,484$ 21,936,871$ 880,207$ 4.01% Cash Management & Street Bonds 869,717 - 869,717 12,723 1.46%
FIRE Civilian 23,205,020 1,519,093 24,724,113 877,425 3.55% Sworn 357,996,341 158,131,739 516,128,080 34,469,157 6.68%
GENERAL SERVICES Materials Testing 6,534,173 873,543 7,407,716 207,245 2.80% Print Shop 2,515,098 80,284 2,595,382 71,384 2.75%
HOUSING + COMMUNITY INVESTMENT Grant Funded Housing 16,653,951 41,450 16,695,401 279,881 1.68% Enforcement 24,490,919 12,775 24,503,694 670,965 2.74% Housing, Internal Administration 8,887,096 4,285 8,891,381 191,451 2.15%
LIBRARY 58,452,323 17,629 58,469,951 1,835,366 3.14%
LOS ANGELES CONVENTION CENTER 6,881,724 459,208 7,340,932 621,884 8.47%
MAYOR Executive/Policy 5,893,607 - 5,893,607 248,122 4.21% Grant Funded/Spec. Prog. 5,016,050 - 5,016,050 259,860 5.18% Direct in City Space 2,155 2,155 39 1.81%
NEIGHBORHOOD EMPOWERMENT 1,902,588 7,048 1,909,636 83,635 4.38%
PERSONNEL Custody Care (Jails) 4,764,705 133,814 4,898,519 151,988 3.10% Grant-Funded & Special Programs 861,167 - 861,167 31,526 3.66%
PLANNING 22,109,192 280,999 22,390,191 657,617 2.94%
POLICE Civilian 206,441,670 3,869,224 210,310,894 11,203,941 5.33% Sworn (Police Officers) 985,685,350 39,394,158 1,025,079,508 84,218,133 8.22%
(Continued)
The accompanying notes are an integral part of this schedule.13

Salary BaseSalary Base Including Allocated
DEPARTMENT/Cost Center (Special) Overtime Overtime Costs Rates
To Be Applied in Fiscal Year 2015-2016
CITY OF LOS ANGELES, CALIFORNIAFringe Benefits Cost Allocation Plan 38
Schedule of Salary Base, Allocated Costs,And Rates Including Overtime By DepartmentBased on the Fiscal Year Ended June 30, 2014
PUBLIC WORKS Board Office Direct: Pub. Svcs. 743,161$ 3,523$ 746,684$ 20,846$ 2.79%
Contract Administration Construction Inspection 21,159,129 839,919 21,999,048 450,366 2.05%
Engineering Stormwater Facilities Engineering 3,539,971 487 3,540,458 58,321 1.65% Wastewater Facilities Engineering 22,428,331 42,605 22,470,936 376,306 1.67% Privately Financed Improvements Eng. 7,818,083 140,879 7,958,962 132,108 1.66% Street Improvements Engineering 11,521,768 25,397 11,547,165 193,115 1.67% Municipal Facilities Engineering 11,067,334 1,888 11,069,222 180,454 1.63% Gen'l. Mapping & Survey 4,437,012 1,481 4,438,493 69,081 1.56%
Sanitation Solid Waste Program 76,427,552 6,923,490 83,351,042 5,598,700 6.72% Wastewater/Flood Control 107,571,348 3,756,932 111,328,280 3,625,792 3.26%
Street Lighting 18,050,295 857,253 18,907,548 460,336 2.43%
Street Services (St. Maintenance) 68,445,802 5,547,457 73,993,259 4,358,359 5.89%
RECREATION AND PARKS 118,163,761 1,555,033 119,718,794 8,801,320 7.35%
TRANSPORTATION 103,795,492 14,641,990 118,437,482 6,381,128 5.39%
ZOO 14,621,818 79,269 14,701,087 555,648 3.78%
The accompanying notes are an integral part of this schedule.14

CITY OF LOS ANGELES, CALIFORNIA Cost Allocation Plan 38
For Central Services and Fringe Benefits Notes to Schedules
For the Fiscal Year Ended June 30, 2014
15
Note 1 - Accounting Policies The City of Los Angeles (City) prepares its Cost Allocation Plan (CAP) in accordance with Title 2 in the Code of Federal Regulations (CFR), Subtitle A, Chapter II, Part 225, “Cost Principles for State, Local, and Indian Tribal Governments” (formerly Office of Management and Budget Circular A-87). The costs allocated in the Central Services and Fringe Benefits CAPs, except for pension and retirement costs (See Note 3), represent the actual costs incurred in the fiscal year 2013-2014 as reported in the City’s basic accounting system, Financial Management System (FMS), adjusted by the “carryforward” amounts as described below. Costs reported in FMS are accounted for on the cash basis method of accounting. Actual costs incurred during the fiscal year 2013-2014 are then added to “carryforward” amounts, which represent the difference between the costs theoretically recovered in the fiscal year 2013-2014 and the costs entitled to be recovered in the fiscal year 2013-2014. The sum of the actual and carryforward costs (i.e., total allocated costs) is divided by departmental salary bases to calculate overhead rates for each department cost center. Overhead rates are calculated for “direct departments,” which are departments that do not provide services to other City departments, and for “support” departments with direct cost objectives. Overhead rates of support departments are only calculated for the “direct” component of such departments. Overhead rates presented in the accompanying schedules will be negotiated with the U.S. Department of Housing and Urban Development (HUD), the City’s CAP cognizant agency. Final overhead rates to be applied in the fiscal year 2015-2016 will be developed and approved by HUD based upon this negotiation process. During the fiscal year 2014-2015, HUD contracted with the U.S. Department of Health and Human Services (HHS) to negotiate the overhead rates. It is expected HHS will continue to perform the negotiation of the City’s CAP for the fiscal year 2015-2016. Note 2 - Central Services CAP – Salary Bases and Overhead Rates The Central Services overhead rates are calculated and presented under two different methods, one utilizes a denominator of total salaries excluding overtime, the other uses a denominator of total salaries including overtime. Total salaries include salaries for all City employees included in each respective cost center. The overhead rates determined using total salaries excluding overtime are utilized for the majority of grant projects. For certain Federal and/or State projects, overhead rates using total salaries including overtime are allowed. Overtime rates were created with overtime costs in the salary base; costs allocated included gas (natural gas utility), petroleum products, water & electricity, and communication lease. Note 3 - Fringe Benefits CAP - Salary Bases and Overhead Rates The Fringe Benefits overhead rates are calculated and presented under two different methods. One method, which is described in the next paragraph, utilizes three salary bases: the standard Fringe Benefits salary base, the special Fringe Benefits salary base, and the fiscal year 2015-2016 proposed salary base. The other method uses a denominator of the special salary base plus overtime. The overhead rates determined using the standard salary base, special salary base, and the fiscal year 2015-2016 proposed salary base are utilized for a majority of grants projects. For certain Federal and/or State

CITY OF LOS ANGELES, CALIFORNIA Cost Allocation Plan 38
For Central Services and Fringe Benefits Notes to Schedules
For the Fiscal Year Ended June 30, 2014 (Continued)
16
Note 3 - Fringe Benefits CAP - Salary Bases and Overhead Rates (Continued) projects, overhead rates using a salary base including overtime are allowed. Overtime rates were created with overtime costs in the salary base; costs allocated included Workers’ Compensation, Medicare, and Unemployment. The standard Fringe Benefits salary base, which does not include overtime, represents total salaries subject to retirement. Salaries subject to retirement equal total salaries less part-time and temporary employees’ salaries. The special salary base is equal to the standard Fringe Benefits salary base unless the amount of part-time and temporary employees’ salaries exceed 0.5% of the total salary base, in which case the salary base is then adjusted to include salaries for all employees (total salaries), including part-time and temporary employees. The Fringe Benefits overhead rates computed with salary bases which do not include overtime are determined by calculating the Fringe Benefits rates for each individual cost pool (i.e., retirement, pensions, health insurance, etc.) and aggregating such rates to determine the final Fringe Benefits overhead rate for each department/cost center presented in the accompanying schedule. These individual cost pool rates, except for those relating to Medicare, Workers’ Compensation, and Unemployment, are calculated by dividing the individually allocated cost pool costs by the standard Fringe Benefits salary base. The Medicare, Workers’ Compensation, and Unemployment individual cost pool rates are calculated by dividing the allocated Medicare, Workers’ Compensation, and Unemployment costs by the special salary base. As in the prior year’s CAP, Fire and Police Pension System costs are based on estimated rather than actual amounts. The Fire and Police Pension System is the City’s pension system for all sworn police, fire and paramedic employees. The City contributes to the Fire and Police Pension System in conformance with the requirements of the City Charter, Articles 17, 18 and 35. This estimate represents the pension costs in the City’s 2015-2016 Budget. Historically, actual expenditures have approximated the budgeted amount. A budget-based estimate is used rather than using actual costs from the two-year fiscal year, because the method of determining the amount of pension contribution to be paid by the City is based on actuarial computations and investment performance results, which may vary dramatically from year to year. Therefore, this cost is not at all well predicted by the actual costs from the earlier period. To be consistent with the estimate used for the pension costs, the City used an estimate for the Police and Fire sworn salary rate base for the Pension cost pool in the Fringe Benefits rate computation. This salary estimate is based on the salaries in the City’s 2015-2016 Budget. Note 4 - Cost Centers and Cost Categories In order to more accurately allocate costs to the proper organizational units, and to accommodate the inclusion of allowable but heretofore unrecovered costs, cost centers and cost categories are constantly reviewed for changes and updates.
CITY OF LOS ANGELES, CALIFORNIA Cost Allocation Plan 38
For Central Services and Fringe Benefits Notes to Schedules
For the Fiscal Year Ended June 30, 2014 (Continued)
17
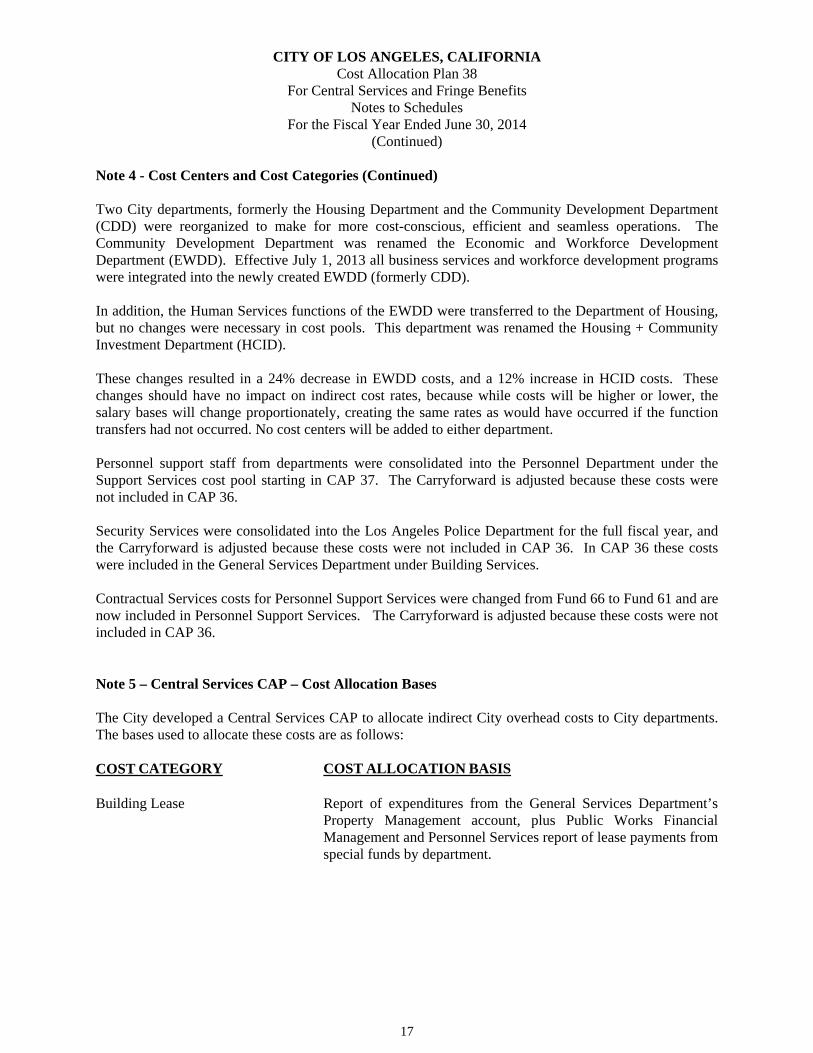
Note 4 - Cost Centers and Cost Categories (Continued)
Two City departments, formerly the Housing Department and the Community Development Department (CDD) were reorganized to make for more cost-conscious, efficient and seamless operations. The Community Development Department was renamed the Economic and Workforce Development Department (EWDD). Effective July 1, 2013 all business services and workforce development programs were integrated into the newly created EWDD (formerly CDD).
In addition, the Human Services functions of the EWDD were transferred to the Department of Housing, but no changes were necessary in cost pools. This department was renamed the Housing + Community Investment Department (HCID).
These changes resulted in a 24% decrease in EWDD costs, and a 12% increase in HCID costs. These changes should have no impact on indirect cost rates, because while costs will be higher or lower, the salary bases will change proportionately, creating the same rates as would have occurred if the function transfers had not occurred. No cost centers will be added to either department. Personnel support staff from departments were consolidated into the Personnel Department under the Support Services cost pool starting in CAP 37. The Carryforward is adjusted because these costs were not included in CAP 36. Security Services were consolidated into the Los Angeles Police Department for the full fiscal year, and the Carryforward is adjusted because these costs were not included in CAP 36. In CAP 36 these costs were included in the General Services Department under Building Services. Contractual Services costs for Personnel Support Services were changed from Fund 66 to Fund 61 and are now included in Personnel Support Services. The Carryforward is adjusted because these costs were not included in CAP 36.
Note 5 – Central Services CAP – Cost Allocation Bases The City developed a Central Services CAP to allocate indirect City overhead costs to City departments. The bases used to allocate these costs are as follows: COST CATEGORY COST ALLOCATION BASIS Building Lease Report of expenditures from the General Services Department’s
Property Management account, plus Public Works Financial Management and Personnel Services report of lease payments from special funds by department.

CITY OF LOS ANGELES, CALIFORNIA Cost Allocation Plan 38
For Central Services and Fringe Benefits Notes to Schedules
For the Fiscal Year Ended June 30, 2014 (Continued)
18
Note 5 – Central Services CAP – Cost Allocation Bases (Continued) COST CATEGORY COST ALLOCATION BASIS Building Depreciation Based on GAAP Depreciation expenses net of federal funding and
allocated to departments based on square feet occupied. Library, Recreation & Parks, and Zoo allocations have been reduced to 15% of their total depreciation (represents administrative use only).
Communications Lease Information Technology Agency’s report by department of leased
services costs. Computer Assets Depreciation
Based on GAAP Depreciation expenses net of federal funding by department.
Equipment Expense Under $5,000
Actual expenditures from department equipment accounts.
Equipment Depreciation GAAP depreciation expenses net of federal funding by department.
Gas (Utilities Expenditures)
Based on gas company billings itemized by building, then allocated by square footage occupied by each department.
General City Purposes Equivalent personnel, all departments, reduced for proprietary
departments who do not benefit from annual City audit. Insurance Occupancy by each department in insured space, and assignment
of insured equipment. ISU Fringe Benefits Cost of fringe benefits for indirect cost pools, determined by the
Fringe Benefit Plan step-down report. Liability Claims Based on actual payments authorized by the City Attorney. Petroleum Products General Services' record of usage by each department. Vehicle Depreciation GAAP depreciation expenses net of federal funding by department.
Water and Electricity Report of General Services’ payments itemized by building, then
allocated by square footage occupied by each department.

CITY OF LOS ANGELES, CALIFORNIA Cost Allocation Plan 38
For Central Services and Fringe Benefits Notes to Schedules
For the Fiscal Year Ended June 30, 2014 (Continued)
19
Note 5 – Central Services CAP – Cost Allocation Bases (Continued) COST CATEGORY
COST ALLOCATION BASIS
City Administrative Officer
(CAO)
Budget CAO report of staff time and effort. 5% is allocated to "Council, City Administration."
Employee Relations and Living Wage
Living Wage by CAO timekeeping records, remainder by equivalent personnel, to all departments except Department of Water & Power (DWP).
General Support Equivalent personnel, excluding the proprietary Departments.
Management & Policy Analysis and Department Liaison
CAO timekeeping records.
Municipal Facilities Average of Building Depreciation for single and multiple
department uses.
CAO, Internal Admin. Departmental analysis of administrative support provided to each cost center.
City Attorney
Municipal Counsel/ General Counsel & Leg Services
Civil Liability & Workers’ Compensation
City Attorney report of staff time and effort.
City Attorney report of staff time and effort for the Civil Liability Section combined with the report of Workers' Compensation claims paid.
Employee Relations
Equivalent personnel, excluding the Airports, Harbor and DWP.
Land Use City Attorney report of staff time and effort.
Police Division Allocated entirely to Police Department.
City Attorney, Internal Admin.
Departmental analysis of administrative support provided to each cost center.
CITY OF LOS ANGELES, CALIFORNIA Cost Allocation Plan 38
For Central Services and Fringe Benefits Notes to Schedules
For the Fiscal Year Ended June 30, 2014 (Continued)
20
Note 5 – Central Services CAP – Cost Allocation Bases (Continued) COST CATEGORY
COST ALLOCATION BASIS
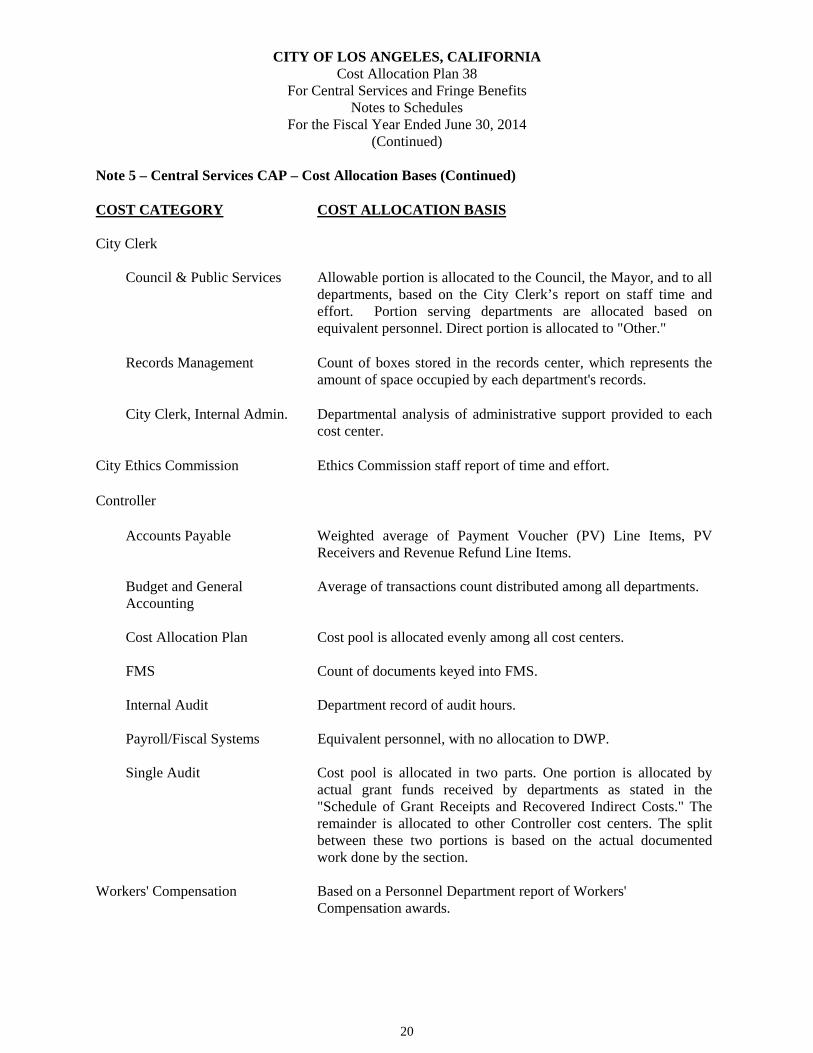
City Clerk
Council & Public Services Allowable portion is allocated to the Council, the Mayor, and to all departments, based on the City Clerk’s report on staff time and effort. Portion serving departments are allocated based on equivalent personnel. Direct portion is allocated to "Other."
Records Management Count of boxes stored in the records center, which represents the
amount of space occupied by each department's records.
City Clerk, Internal Admin. Departmental analysis of administrative support provided to each cost center.
City Ethics Commission Ethics Commission staff report of time and effort. Controller
Accounts Payable Weighted average of Payment Voucher (PV) Line Items, PV Receivers and Revenue Refund Line Items.
Budget and General Accounting
Average of transactions count distributed among all departments.
Cost Allocation Plan Cost pool is allocated evenly among all cost centers.
FMS Count of documents keyed into FMS.
Internal Audit Department record of audit hours.
Payroll/Fiscal Systems Equivalent personnel, with no allocation to DWP.
Single Audit Cost pool is allocated in two parts. One portion is allocated by actual grant funds received by departments as stated in the "Schedule of Grant Receipts and Recovered Indirect Costs." The remainder is allocated to other Controller cost centers. The split between these two portions is based on the actual documented work done by the section.
Workers' Compensation Based on a Personnel Department report of Workers'
Compensation awards.

CITY OF LOS ANGELES, CALIFORNIA Cost Allocation Plan 38
For Central Services and Fringe Benefits Notes to Schedules
For the Fiscal Year Ended June 30, 2014 (Continued)
21
Note 5 – Central Services CAP – Cost Allocation Bases (Continued) COST CATEGORY COST ALLOCATION BASIS Controller, Internal Admin.
Departmental analysis of administrative support provided to each cost center.
Emergency Preparedness City Dept. Emergency Prep. Coordination
Emergency Preparedness Department report of staff time and effort.
Emergency Preparedness, Internal Admin.
Departmental analysis of administrative support provided to each cost center.
Employee Relations Board Equivalent personnel, all departments.
Finance
Citywide Collections Based on dollar amount of referrals as reported by the Office of Finance.
Finance, Internal Admin. Departmental analysis of administrative support provided to each
cost center. General Services (GSD)
Assets Management and Leasing
An average of three statistics: Building Depreciation - Single, Building Depreciation - Multiple, and Building Leases.
Building Services Based on actual costs incurred, split out by building and Benefiting
Department. Construction Projects Report of maintenance project costs from General Services
Construction Division.
Fleet Services General Services Vehicle Management System records of service provided.
Mail and Messenger Services
Report of postage costs maintained by General Services.
Parking Services Square footage of space occupancy in City buildings having
nearby City parking lots.

CITY OF LOS ANGELES, CALIFORNIA Cost Allocation Plan 38
For Central Services and Fringe Benefits Notes to Schedules
For the Fiscal Year Ended June 30, 2014 (Continued)
22
Note 5 – Central Services CAP – Cost Allocation Bases (Continued) COST CATEGORY
COST ALLOCATION BASIS
General Services (GSD) (Continued)
Supply Services Proportional cost reports from General Services combiningpurchasing order amounts and warehousing costs.
General Services, Internal Admin.
Departmental analysis of administrative support provided to each cost center.
Information Technology Agency (ITA)
IT Services Work order report of costs, by department. Communications Services ITA records of staff time and effort, computer connections, and
radio usage. Telecommunications ITA records of staff time and effort. ITA, Internal Admin. Departmental analysis of administrative support provided to each
cost center. Mayor
Mayor, Internal Admin. Departmental analysis of administrative support provided to each
cost center. Personnel
Support Services Equivalent personnel, all departments with weights assigned to civilian and sworn, and allocations to DWP reduced to acknowledge that DWP provides certain support services in-house.
Workers’ Comp. & Safety Report of Workers' Compensation awards provided by Personnel
Department with weights assigned to civilian and sworn.
Personnel, Internal Admin. Departmental analysis of administrative support provided to each cost center.
CITY OF LOS ANGELES, CALIFORNIA Cost Allocation Plan 38
For Central Services and Fringe Benefits Notes to Schedules
For the Fiscal Year Ended June 30, 2014 (Continued)
23
Note 5 – Central Services CAP – Cost Allocation Bases (Continued)
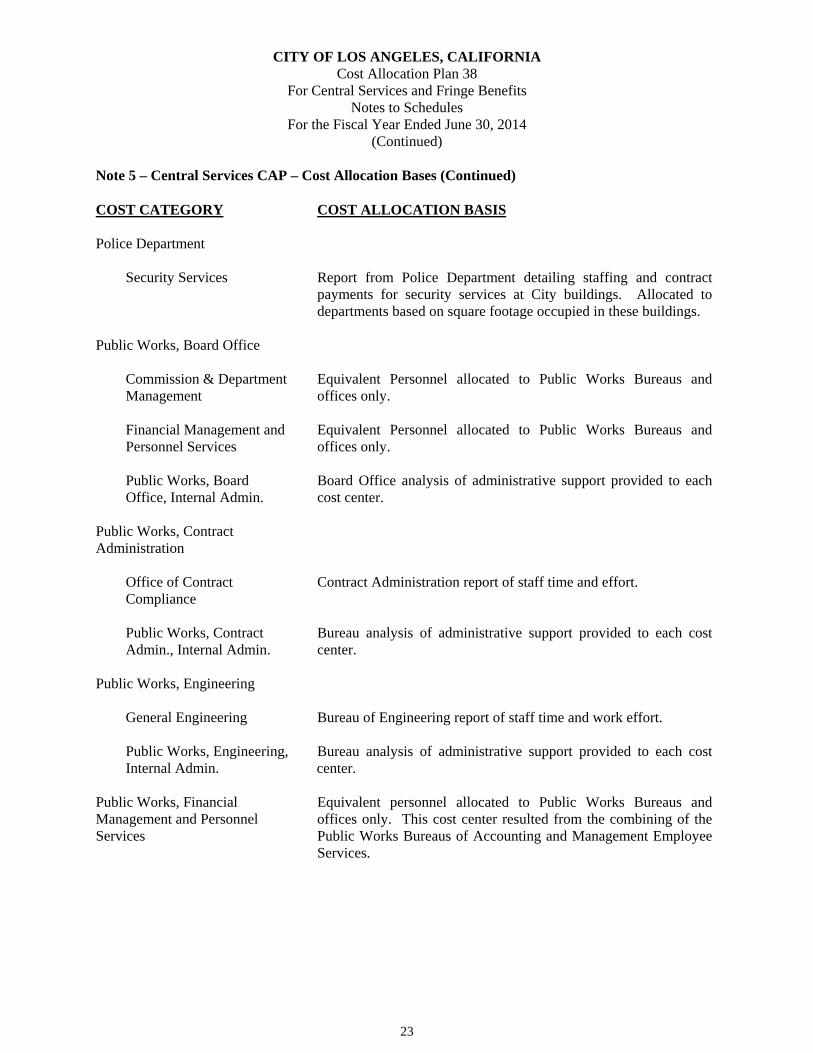
COST CATEGORY COST ALLOCATION BASIS Police Department
Security Services Public Works, Board Office
Report from Police Department detailing staffing and contract payments for security services at City buildings. Allocated to departments based on square footage occupied in these buildings.
Commission & Department Management
Equivalent Personnel allocated to Public Works Bureaus and offices only.
Financial Management and Personnel Services
Equivalent Personnel allocated to Public Works Bureaus and offices only.
Public Works, Board Office, Internal Admin.
Board Office analysis of administrative support provided to each cost center.
Public Works, Contract Administration
Office of Contract Compliance
Contract Administration report of staff time and effort.
Public Works, Contract Admin., Internal Admin.
Bureau analysis of administrative support provided to each cost center.
Public Works, Engineering
General Engineering Public Works, Engineering, Internal Admin.
Bureau of Engineering report of staff time and work effort. Bureau analysis of administrative support provided to each cost center.
Public Works, Financial Management and Personnel Services
Equivalent personnel allocated to Public Works Bureaus and offices only. This cost center resulted from the combining of the Public Works Bureaus of Accounting and Management Employee Services.
CITY OF LOS ANGELES, CALIFORNIA Cost Allocation Plan 38
For Central Services and Fringe Benefits Notes to Schedules
For the Fiscal Year Ended June 30, 2014 (Continued)
24
Note 5 – Central Services CAP – Cost Allocation Bases (Continued)
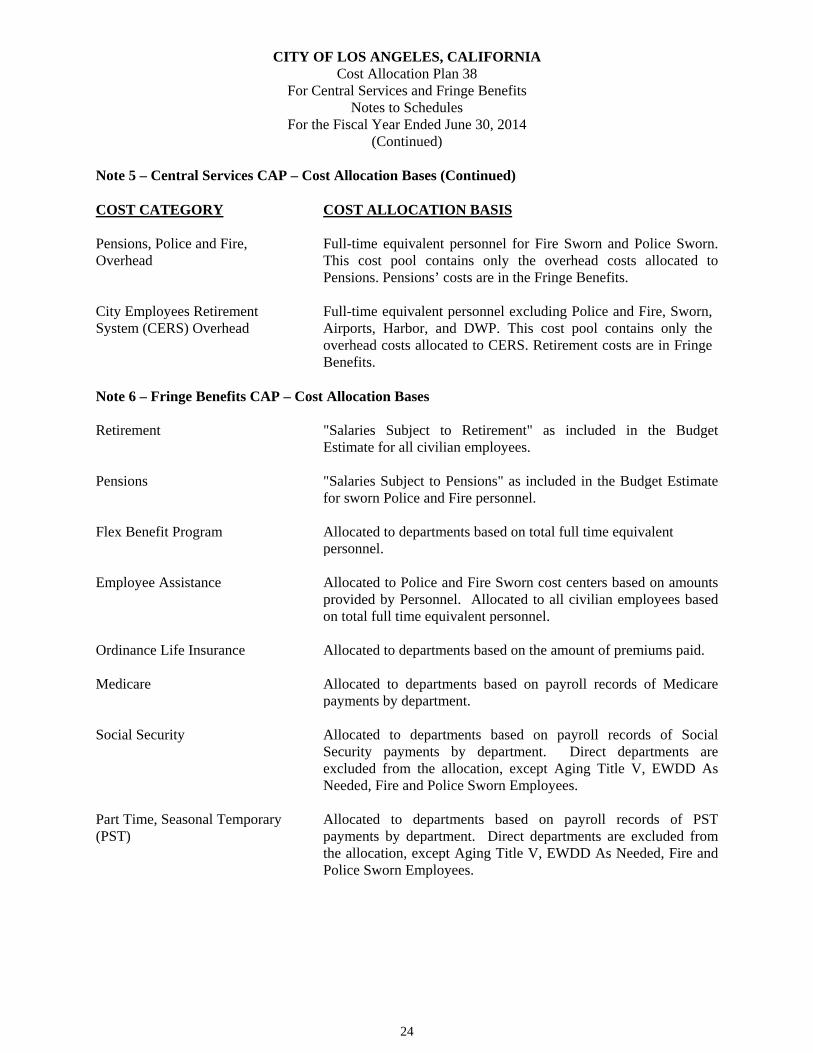
COST CATEGORY COST ALLOCATION BASIS Pensions, Police and Fire, Overhead
Full-time equivalent personnel for Fire Sworn and Police Sworn.This cost pool contains only the overhead costs allocated toPensions. Pensions’ costs are in the Fringe Benefits.
City Employees Retirement System (CERS) Overhead
Full-time equivalent personnel excluding Police and Fire, Sworn, Airports, Harbor, and DWP. This cost pool contains only the overhead costs allocated to CERS. Retirement costs are in Fringe Benefits.
Note 6 – Fringe Benefits CAP – Cost Allocation Bases Retirement "Salaries Subject to Retirement" as included in the Budget
Estimate for all civilian employees. Pensions "Salaries Subject to Pensions" as included in the Budget Estimate
for sworn Police and Fire personnel. Flex Benefit Program Allocated to departments based on total full time equivalent
personnel. Employee Assistance Allocated to Police and Fire Sworn cost centers based on amounts
provided by Personnel. Allocated to all civilian employees based on total full time equivalent personnel.
Ordinance Life Insurance Allocated to departments based on the amount of premiums paid. Medicare Allocated to departments based on payroll records of Medicare
payments by department.
Social Security Allocated to departments based on payroll records of Social Security payments by department. Direct departments are excluded from the allocation, except Aging Title V, EWDD As Needed, Fire and Police Sworn Employees.
Part Time, Seasonal Temporary (PST)
Allocated to departments based on payroll records of PST payments by department. Direct departments are excluded from the allocation, except Aging Title V, EWDD As Needed, Fire and Police Sworn Employees.

CITY OF LOS ANGELES, CALIFORNIA Cost Allocation Plan 38
For Central Services and Fringe Benefits Notes to Schedules
For the Fiscal Year Ended June 30, 2014 (Continued)
25
Note 6 – Fringe Benefits CAP – Cost Allocation Bases (Continued) COST CATEGORY
COST ALLOCATION BASIS
Union Sponsored Benefits
Allocated to departments based on Personnel Department recordsof payments by MOU groups. Allocations to cost centers in multiple cost center departments are based on bargaining unitmembership.
Unused Sick/Vacation Allocated to departments based on payroll records of payments by
department. Unemployment Insurance Allocation is based on Personnel Department records of claim
payments. Workers’ Compensation
Hiring Hall Fringe Benefits
Personnel Department database report of claim payments perdepartment. Allocations to cost centers in multiple cost centerdepartments are based on equivalent personnel in office-work type cost centers. For departments with field workers, departmentsidentify the cost center involved. Allocated to departments based on expenditures in departmentalHiring Hall Fringe Benefits Accounts. Direct departments areexcluded from the allocation.