city of dover, nh · pdf fileyear 2 m&v report city of dover, nh ... therefore...
TRANSCRIPT

Dover, NH
Year 2 M&V Report
CITY OF DOVER, NH
YEAR 2
MEASUREMENT & VERIFICATION REPORT
Annual Contract Savings
(November 1, 2012 – October 31, 2013)
July 2014

Dover, NH
Year 2 M&V Report
CITY OF DOVER, NH
PERFORMANCE CONTRACT
Year 2
Annual M&V Report
Performance Period Dates Covered: November 1, 2012 to October 31, 2013
Contract #: 9236-0143
Contract Year #: 2
Annual Year 2 Guaranteed Energy Savings: $280,169
Annual Year 2 Guaranteed O&M Savings: $14,227
Annual Year 2 Guaranteed Capital Cost Avoidance: $33,840
Annual Year 2 Total Guarantee: $328,236
Contract Term: 10-Years
Term Guaranteed Savings: $3,623,746
Utility Cost Avoidance Escalation Rate: 3.0%
Operations & Maintenance (O&M) Cost Avoidance Escalation Rate: 4.0%
Guarantee Start Date: 11/1/2011
Guarantee End Date: 10/31/2021
City of Dover, NH Year 2- Annual Contract Report
Contract # 9236-0143
November 1, 2012 – October 31, 2013
TABLE OF CONTENTS
Johnson Controls, Inc. 3
Executive Summary
Cost Avoidance Summary 4
Monthly Comparison 5
Total Guarantee Year Savings 6
Savings per Facility 8
Aggregate Monthly FIM Savings 10
FIM Description 11
Environmental Benefits 24
Appendix A
FIM 1 & 2: Lighting Fixture Retrofit & Controls 26
FIM 3: Weatherization 28
FIM 4: EMS Upgrades 29
FIM 6: Water Conservation 33
FIM 9: Vending Machine Controls 34
FIM 10: Pool Cover 35
FIM 11: Ice Arena Upgrades 36
FIM 12: Power Factor Correction 52
FIM 13: Transformers 54
FIM 14: Aeration Blower Upgrade 55
FIM 15: Boiler Replacement 56
Appendix B
Performance Contract Project Progress 57
Weather Degree Days 58
Utility Rate Schedule 60
Glossary 61
Appendix C
Savings Calculations 62

City of Dover, NH Year 2- Annual Contract Report
Contract # 9236-0143
November 1, 2012 – October 31, 2013
EXECUTIVE SUMMARY
Johnson Controls, Inc. 4
Cost Avoidance Summary
The City of Dover, NH and Johnson Controls, Inc. entered into a performance contract in September in 2009. The purpose of this contract is to lessen the energy and energy related costs realized by the City of Dover moving forward through the implementation of specific Facility Improvement Measures (FIMs). The guaranteed savings portion of the contract (10 years) started on November 1 of 2011 and will end on October 31, 2021.
The original 1st year annual savings guarantee of $304,510 includes $256,990 in energy cost avoidance, $13,680 in operations and maintenance (O&M) cost avoidance, and a future capital cost avoidance of $33,840. This initial savings guarantee was increased from the original amount to $319,463 due to Change Order (CO) # 9236-0142-CO2 which comprised of a lighting retrofit project at the McConnell Center. The annual guaranteed energy savings amount escalates by 3% and the O&M savings escalates by 4% each year to compensate for inflation. Total term benefits are $3,623,746.
The following table summarizes the annual guaranteed savings by year vs. verified project savings:
City of Dover Annual Cost Savings Summary
Guarantee
Period
Guaranteed
Energy Cost
Avoidance
Guaranteed
O&M Cost
Avoidance
Guaranteed
Future Capital
Cost Avoidance
Total
Guaranteed
Cost Avoidance
Verified Annual
Cost Avoidance Variance
Year 1 $271,943 $13,680 $33,840 $319,463 $317,642 ($1,821)(1)
Year 2 $280,169 $14,227 $33,840 $328,236 $321,420 ($6,817)
Year 3 $288,644 $14,796 $33,840 $337,280
Year 4 $297,375 $15,388 $33,840 $346,603
Year 5 $306,371 $16,004 $33,840 $356,214
Year 6 $315,638 $16,644 $33,840 $366,122
Year 7 $325,186 $17,310 $33,840 $376,336
Year 8 $335,023 $18,002 $33,840 $386,865
Year 9 $345,157 $18,722 $33,840 $397,719
Year 10 $355,598 $19,471 $33,840 $408,909
Total $3,121,103 $164,244 $338,400 $3,623,746 $639,062 N/A (1) Year 1 variance is due to non-installation of FIM 12- Power Factor Correction during Year 1 as explained in previous reports. The equipment was installed in the first quarter of Year 2 (January of 2013). The City of Dover has been compensated for the variance from guaranteed savings.
This report is designed to provide another tracking point for the City of Dover in understanding the energy savings of this project. The following report details the status of this project, including guaranteed and verified savings for all Facility Improvement Measures (FIMs) involved.
This report covers the second full contract (guarantee) year which runs from November 2012 through October 2013.
City of Dover, NH Year 2- Annual Contract Report
Contract # 9236-0143
November 1, 2012 – October 31, 2013
EXECUTIVE SUMMARY
Johnson Controls, Inc. 5
Monthly Comparison
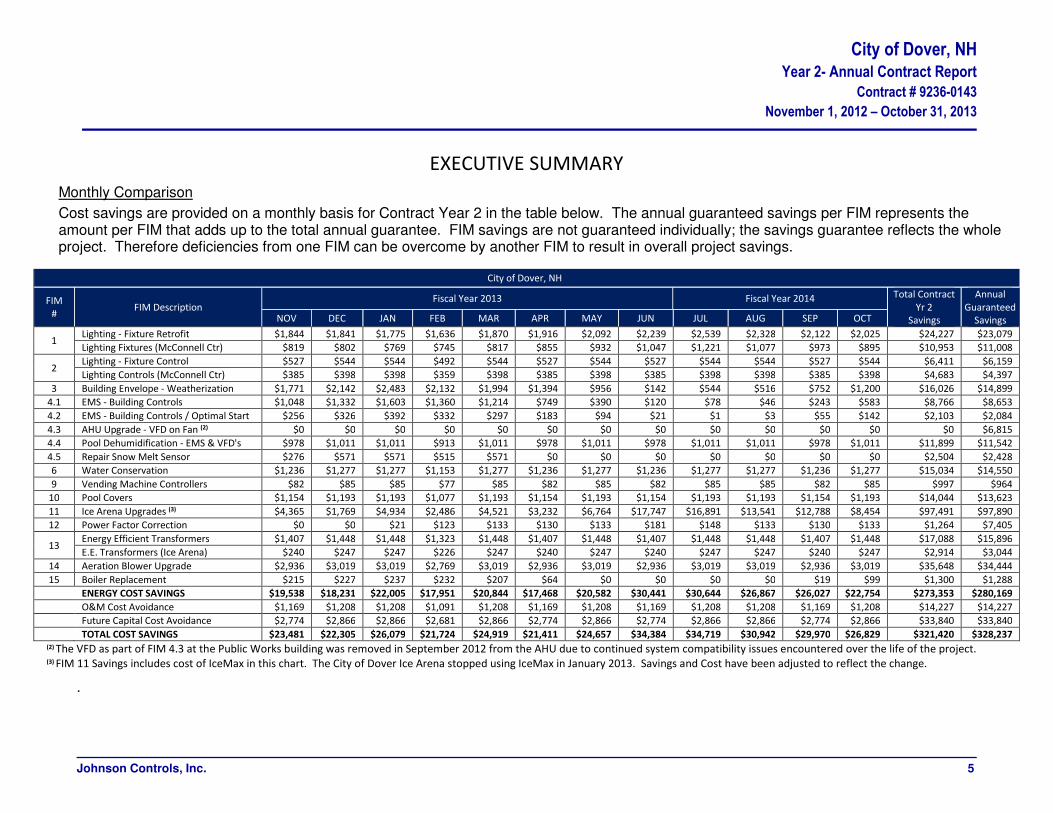
Cost savings are provided on a monthly basis for Contract Year 2 in the table below. The annual guaranteed savings per FIM represents the amount per FIM that adds up to the total annual guarantee. FIM savings are not guaranteed individually; the savings guarantee reflects the whole project. Therefore deficiencies from one FIM can be overcome by another FIM to result in overall project savings.
City of Dover, NH
FIM
# FIM Description
Fiscal Year 2013 Fiscal Year 2014 Total Contract
Yr 2
Savings
Annual
Guaranteed
Savings NOV DEC JAN FEB MAR APR MAY JUN JUL AUG SEP OCT
1 Lighting - Fixture Retrofit $1,844 $1,841 $1,775 $1,636 $1,870 $1,916 $2,092 $2,239 $2,539 $2,328 $2,122 $2,025 $24,227 $23,079
Lighting Fixtures (McConnell Ctr) $819 $802 $769 $745 $817 $855 $932 $1,047 $1,221 $1,077 $973 $895 $10,953 $11,008
2 Lighting - Fixture Control $527 $544 $544 $492 $544 $527 $544 $527 $544 $544 $527 $544 $6,411 $6,159
Lighting Controls (McConnell Ctr) $385 $398 $398 $359 $398 $385 $398 $385 $398 $398 $385 $398 $4,683 $4,397
3 Building Envelope - Weatherization $1,771 $2,142 $2,483 $2,132 $1,994 $1,394 $956 $142 $544 $516 $752 $1,200 $16,026 $14,899
4.1 EMS - Building Controls $1,048 $1,332 $1,603 $1,360 $1,214 $749 $390 $120 $78 $46 $243 $583 $8,766 $8,653
4.2 EMS - Building Controls / Optimal Start $256 $326 $392 $332 $297 $183 $94 $21 $1 $3 $55 $142 $2,103 $2,084
4.3 AHU Upgrade - VFD on Fan (2) $0 $0 $0 $0 $0 $0 $0 $0 $0 $0 $0 $0 $0 $6,815
4.4 Pool Dehumidification - EMS & VFD's $978 $1,011 $1,011 $913 $1,011 $978 $1,011 $978 $1,011 $1,011 $978 $1,011 $11,899 $11,542
4.5 Repair Snow Melt Sensor $276 $571 $571 $515 $571 $0 $0 $0 $0 $0 $0 $0 $2,504 $2,428
6 Water Conservation $1,236 $1,277 $1,277 $1,153 $1,277 $1,236 $1,277 $1,236 $1,277 $1,277 $1,236 $1,277 $15,034 $14,550
9 Vending Machine Controllers $82 $85 $85 $77 $85 $82 $85 $82 $85 $85 $82 $85 $997 $964
10 Pool Covers $1,154 $1,193 $1,193 $1,077 $1,193 $1,154 $1,193 $1,154 $1,193 $1,193 $1,154 $1,193 $14,044 $13,623
11 Ice Arena Upgrades (3) $4,365 $1,769 $4,934 $2,486 $4,521 $3,232 $6,764 $17,747 $16,891 $13,541 $12,788 $8,454 $97,491 $97,890
12 Power Factor Correction $0 $0 $21 $123 $133 $130 $133 $181 $148 $133 $130 $133 $1,264 $7,405
13 Energy Efficient Transformers $1,407 $1,448 $1,448 $1,323 $1,448 $1,407 $1,448 $1,407 $1,448 $1,448 $1,407 $1,448 $17,088 $15,896
E.E. Transformers (Ice Arena) $240 $247 $247 $226 $247 $240 $247 $240 $247 $247 $240 $247 $2,914 $3,044
14 Aeration Blower Upgrade $2,936 $3,019 $3,019 $2,769 $3,019 $2,936 $3,019 $2,936 $3,019 $3,019 $2,936 $3,019 $35,648 $34,444
15 Boiler Replacement $215 $227 $237 $232 $207 $64 $0 $0 $0 $0 $19 $99 $1,300 $1,288
ENERGY COST SAVINGS $19,538 $18,231 $22,005 $17,951 $20,844 $17,468 $20,582 $30,441 $30,644 $26,867 $26,027 $22,754 $273,353 $280,169
O&M Cost Avoidance $1,169 $1,208 $1,208 $1,091 $1,208 $1,169 $1,208 $1,169 $1,208 $1,208 $1,169 $1,208 $14,227 $14,227
Future Capital Cost Avoidance $2,774 $2,866 $2,866 $2,681 $2,866 $2,774 $2,866 $2,774 $2,866 $2,866 $2,774 $2,866 $33,840 $33,840
TOTAL COST SAVINGS $23,481 $22,305 $26,079 $21,724 $24,919 $21,411 $24,657 $34,384 $34,719 $30,942 $29,970 $26,829 $321,420 $328,237
(2) The VFD as part of FIM 4.3 at the Public Works building was removed in September 2012 from the AHU due to continued system compatibility issues encountered over the life of the project. (3) FIM 11 Savings includes cost of IceMax in this chart. The City of Dover Ice Arena stopped using IceMax in January 2013. Savings and Cost have been adjusted to reflect the change.
.

City of Dover, NH Year 2- Annual Contract Report
Contract # 9236-0143
November 1, 2012 – October 31, 2013
EXECUTIVE SUMMARY
Johnson Controls, Inc. 6
Total Guarantee Year Savings
Savings realized by the project during Guarantee Year 2 to Date totals 840,223 kWh & 1,809 kW ($107,933), 11,443 MMBTU’s ($153,627) and 1,181 kGals of water/ sewer savings ($13,437). Operation and maintenance (O&M) savings and capital cost avoidance stipulated in the performance contract totals $48,067. FIM 11 Icemax costs are $1,644 over this 12 month period where used.
Thermal Savings consist of savings from Natural Gas (therms), Oil (gallons), and Propane (gallons). In order to provide a basis for comparison, these have all been reported in MMBtu. Conversion factors used in assembling this report are listed below:
Natural Gas: 1 therm = 0.1 MMBtu
Oil: 1 gallon = 0.139 MMBtu
Propane: 1 gallon = 0.0916 MMBtu

City of Dover, NH Year 2- Annual Contract Report
Contract # 9236-0143
November 1, 2012 – October 31, 2013
EXECUTIVE SUMMARY
Johnson Controls, Inc. 7
City of Dover, NH - Guarantee Year 2 Savings
FIM
# FIM Description
Electricity Savings Thermal Savings Water Savings Total Y2
$ Savings kW kWh $ MMBtu $ kgal $
1 Lighting - Fixture Retrofit 1,426 263,379 $38,323 (228) ($3,143) 0 $0 $35,181
2 Lighting - Fixture Control 310 93,119 $11,094 0 $0 0 $0 $11,094
3 Bldg. Envelope - Weatherization 0 4,943 $562 1,079 $15,463 0 $0 $16,026
4 EMS -Upgrades 0 86,458 $9,673 1,039 $15,599 0 $0 $25,272
6 Water Conservation 0 0 $0 164 $2,329 1,117 $12,705 $15,034
9 Vending Machine Controllers 0 8,425 $997 0 $0 0 $0 $997
10 Pool Cover 0 46,656 $5,023 560 $8,290 64 $732 $14,044
11 Ice Arena - Upgrades (1,010) (70,313) ($14,653) 8,740 $113,788 0 $0 $99,135
12 Power Factor Correction 40 8,917 $1,264 0 $0 0 $0 $1,264
13 Energy Efficient Transformers 318 150,628 $20,002 0 $0 0 $0 $20,002
14 Aeration Blower Upgrade 724 248,010 $35,648 0 $0 0 $0 $35,648
15 Boiler Replacement 0 0 $0 89 $1,300 0 $0 $1,300
Energy Totals 1,809 840,223 $107,933 11,443 $153,627 1,181 $13,437 $274,997
Ice Arena IceMax Cost(4) - - - - - - - ($1,644)
O&M Cost Avoidance - - - - - - - $14,227
Future Capital Cost Avoidance - - - - - - - $33,840
Totals 1,809 840,223 $107,933 11,443 $153,627 1,181 $13,437 $321,420 (4) Total IceMax Cost separated out from FIM 11 in this chart

City of Dover, NH Year 2- Annual Contract Report
Contract # 9236-0143
November 1, 2012 – October 31, 2013
EXECUTIVE SUMMARY
Johnson Controls, Inc. 8
Savings per Facility
City of Dover, NH – Guarantee Year 2 Savings
Facility Location Electricity Savings Thermal Savings Water Savings (5)O&M / Cap
Cost Savings
Total $
Savings kW kWh $ MMBtu $ kgal $
Central Fire Station 0 194 $25 54 $850 21 $235 $1,111
Dover City Hall 150 36,007 $4,620 188 $3,236 302 $3,438 $499 $11,793
Dover Ice Arena (711) 33,570 ($1,554) 9,076 $118,157 239 $2,715 $10,087 $129,405
Dover Public Library 102 34,257 $4,748 183 $2,668 127 $1,448 $499 $9,362
Dover Transportation Ctr. 0 19,905 $2,504 0 $0 0 $0 $2,504
Indoor Pool 37 123,672 $13,645 1,016 $15,037 280 $3,182 $34,339 $66,203
Jenny Thompson Pool 0 0 $0 25 $351 141 $1,601 $1,952
McConnell Center 821 168,780 $24,662 457 $6,650 0 $0 $499 $31,811
Pine Hill Barn 0 0 $0 25 $435 0 $0 $435
Pine Hill Chapel 0 23 $4 45 $766 7 $74 $844
Public Works 571 136,225 $17,956 192 $2,233 56 $641 $499 $21,328
South End Fire Station 0 94 $12 94 $1,705 9 $102 $1,819
Veterans Hall 0 0 $0 18 $333 0 $0 $333
Waste Water
Treatment Facility 838 287,496 $41,312 70 $1,208 0 $0 $42,519
Totals 1,809 840,223 $107,933 11,443 $153,627 1,181 $13,437 $46,423 $321,420
(5) Total O&M / Capital Cost Savings contains $1,644 cost of Icemax for FIM 11- Ice Arena Upgrades
City of Dover, NH Year 2- Annual Contract Report
Contract # 9236-0143
November 1, 2012 – October 31, 2013
EXECUTIVE SUMMARY
Johnson Controls, Inc. 9
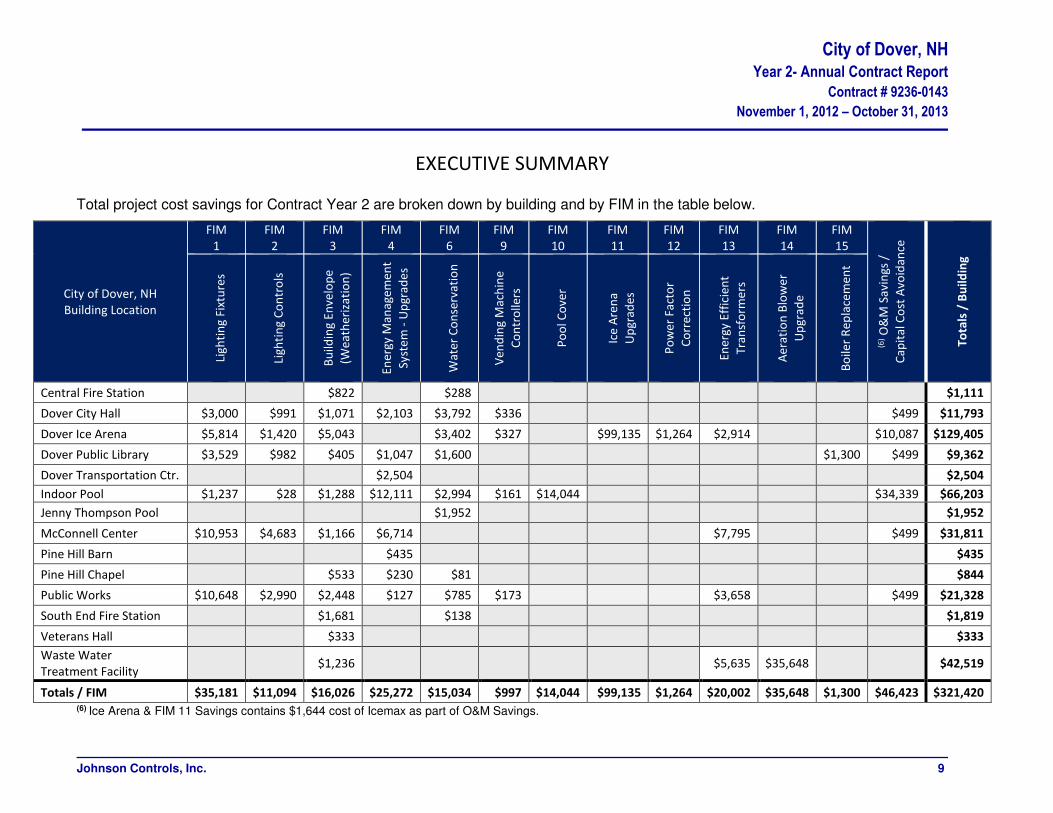
Total project cost savings for Contract Year 2 are broken down by building and by FIM in the table below.
City of Dover, NH
Building Location
FIM
1
FIM
2
FIM
3
FIM
4
FIM
6
FIM
9
FIM
10
FIM
11
FIM
12
FIM
13
FIM
14
FIM
15
(6) O
&M
Sa
vin
gs
/
Ca
pit
al C
ost
Avo
ida
nce
To
tals
/ B
uil
din
g
Lig
hti
ng
Fix
ture
s
Lig
hti
ng
Co
ntr
ols
Bu
ildin
g E
nve
lop
e
(We
ath
eri
zati
on
)
En
erg
y M
an
ag
em
en
t
Syst
em
- U
pg
rad
es
Wa
ter
Co
nse
rva
tio
n
Ve
nd
ing
Ma
chin
e
Co
ntr
olle
rs
Po
ol C
ove
r
Ice
Are
na
Up
gra
de
s
Po
we
r Fa
cto
r
Co
rre
ctio
n
En
erg
y E
ffic
ien
t
Tra
nsf
orm
ers
Ae
rati
on
Blo
we
r
Up
gra
de
Bo
iler
Re
pla
cem
en
t
Central Fire Station $822 $288 $1,111
Dover City Hall $3,000 $991 $1,071 $2,103 $3,792 $336 $499 $11,793
Dover Ice Arena $5,814 $1,420 $5,043 $3,402 $327 $99,135 $1,264 $2,914 $10,087 $129,405
Dover Public Library $3,529 $982 $405 $1,047 $1,600 $1,300 $499 $9,362
Dover Transportation Ctr. $2,504 $2,504
Indoor Pool $1,237 $28 $1,288 $12,111 $2,994 $161 $14,044 $34,339 $66,203
Jenny Thompson Pool $1,952 $1,952
McConnell Center $10,953 $4,683 $1,166 $6,714 $7,795 $499 $31,811
Pine Hill Barn $435 $435
Pine Hill Chapel $533 $230 $81 $844
Public Works $10,648 $2,990 $2,448 $127 $785 $173 $3,658 $499 $21,328
South End Fire Station $1,681 $138 $1,819
Veterans Hall $333 $333
Waste Water
Treatment Facility $1,236 $5,635 $35,648 $42,519
Totals / FIM $35,181 $11,094 $16,026 $25,272 $15,034 $997 $14,044 $99,135 $1,264 $20,002 $35,648 $1,300 $46,423 $321,420 (6) Ice Arena & FIM 11 Savings contains $1,644 cost of Icemax as part of O&M Savings.

City of Dover, NH Year 2- Annual Contract Report
Contract # 9236-0143
November 1, 2012 – October 31, 2013
EXECUTIVE SUMMARY
Johnson Controls, Inc. 10
Aggregate Monthly FIM Savings
Included below are the total monthly energy unit savings and associated dollar cost savings for all
FIMs.
City of Dover- Performance Contract Savings
Contract Year 2 Energy Cost Avoidance
Month Year Electric Savings Thermal Savings Water Savings O&M / Cap.
Cost Savings(7)
Total Cost
$ Savings kW kWh Cost $ MMBtu Cost $ kGal Cost $
November 2012 154 61,057 $8,034 823 $11,208 97 $1,104 $3,134 $23,481
December 2012 132 37,968 $5,414 915 $12,511 100 $1,141 $3,239 $22,305
January 2013 90 48,052 $6,182 1,075 $14,681 100 $1,141 $4,075 $26,079
February 2013 66 42,769 $5,379 841 $11,542 91 $1,031 $3,773 $21,724
March 2013 105 55,148 $7,093 926 $12,610 100 $1,141 $4,075 $24,919
April 2013 133 61,769 $7,922 618 $8,441 97 $1,104 $3,943 $21,411
May 2013 198 64,446 $8,715 803 $10,726 100 $1,141 $4,075 $24,657
June 2013 227 128,737 $15,938 1,016 $13,398 97 $1,104 $3,943 $34,384
July 2013 152 88,386 $11,029 1,407 $18,475 100 $1,141 $4,075 $34,719
August 2013 204 81,808 $10,669 1,144 $15,057 100 $1,141 $4,075 $30,942
September 2013 177 90,292 $11,366 1,024 $13,556 97 $1,104 $3,943 $29,970
October 2013 171 79,791 $10,191 851 $11,422 100 $1,141 $4,075 $26,829
Contract Yr 2 1,809 840,223 $107,933 11,443 $153,627 1,181 $13,437 $46,423 $321,420 (7) IceMax Cost from FIM 11 included in O&M column in this chart
$0
$2,000
$4,000
$6,000
$8,000
$10,000
$12,000
$14,000
$16,000
$18,000
$20,000
2012
Nov
2012
Dec
2013
Jan
2013
Feb
2013
Mar
2013
Apr
2013
May
2013
Jun
2013
Jul
2013
Aug
2013
Sep
2013
Oct
Co
st S
av
ing
s ($
)
Monthly Project Savings
Electricity Savings Thermal Savings Water Savings O&M / Cap. Cost Savings
City of Dover, NH Year 2- Annual Contract Report
Contract # 9236-0143
November 1, 2012 – October 31, 2013
FIM DESCRIPTION
Johnson Controls, Inc. 11
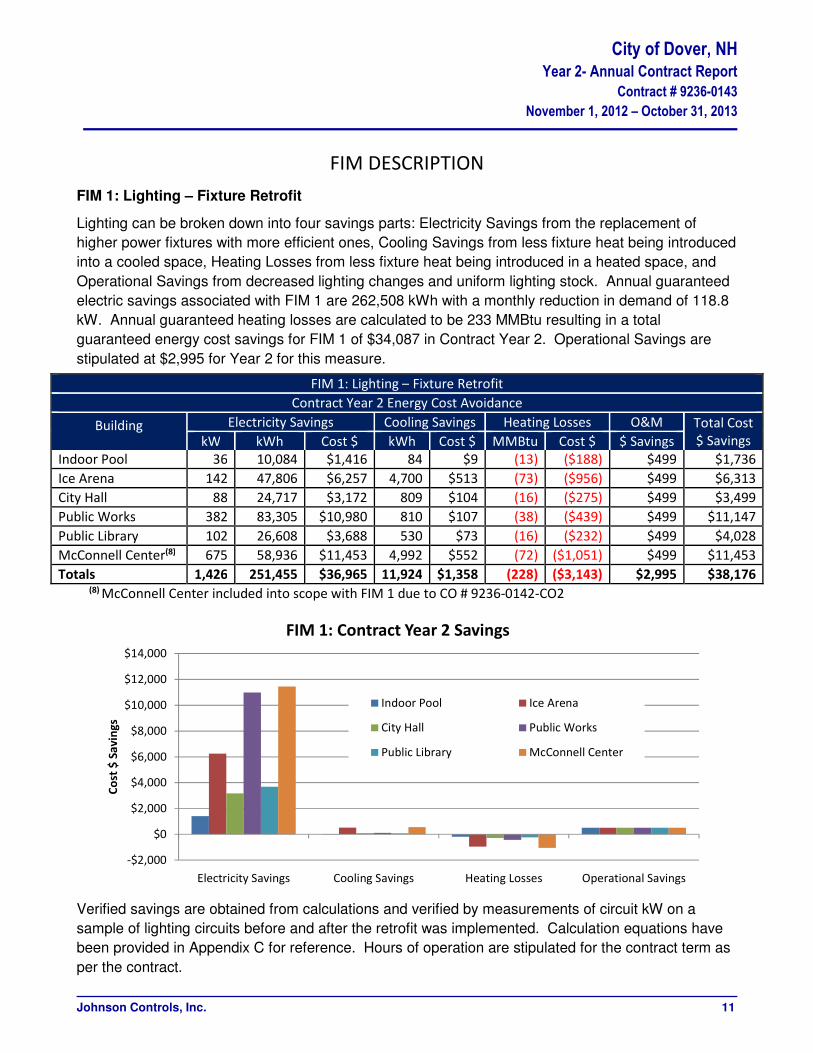
FIM 1: Lighting – Fixture Retrofit
Lighting can be broken down into four savings parts: Electricity Savings from the replacement of
higher power fixtures with more efficient ones, Cooling Savings from less fixture heat being introduced
into a cooled space, Heating Losses from less fixture heat being introduced in a heated space, and
Operational Savings from decreased lighting changes and uniform lighting stock. Annual guaranteed
electric savings associated with FIM 1 are 262,508 kWh with a monthly reduction in demand of 118.8
kW. Annual guaranteed heating losses are calculated to be 233 MMBtu resulting in a total
guaranteed energy cost savings for FIM 1 of $34,087 in Contract Year 2. Operational Savings are
stipulated at $2,995 for Year 2 for this measure.
FIM 1: Lighting – Fixture Retrofit
Contract Year 2 Energy Cost Avoidance
Building Electricity Savings Cooling Savings Heating Losses O&M Total Cost
$ Savings kW kWh Cost $ kWh Cost $ MMBtu Cost $ $ Savings
Indoor Pool 36 10,084 $1,416 84 $9 (13) ($188) $499 $1,736
Ice Arena 142 47,806 $6,257 4,700 $513 (73) ($956) $499 $6,313
City Hall 88 24,717 $3,172 809 $104 (16) ($275) $499 $3,499
Public Works 382 83,305 $10,980 810 $107 (38) ($439) $499 $11,147
Public Library 102 26,608 $3,688 530 $73 (16) ($232) $499 $4,028
McConnell Center(8) 675 58,936 $11,453 4,992 $552 (72) ($1,051) $499 $11,453
Totals 1,426 251,455 $36,965 11,924 $1,358 (228) ($3,143) $2,995 $38,176 (8) McConnell Center included into scope with FIM 1 due to CO # 9236-0142-CO2
Verified savings are obtained from calculations and verified by measurements of circuit kW on a
sample of lighting circuits before and after the retrofit was implemented. Calculation equations have
been provided in Appendix C for reference. Hours of operation are stipulated for the contract term as
per the contract.
-$2,000
$0
$2,000
$4,000
$6,000
$8,000
$10,000
$12,000
$14,000
Electricity Savings Cooling Savings Heating Losses Operational Savings
Co
st $
Sa
vin
gs
FIM 1: Contract Year 2 Savings
Indoor Pool Ice Arena
City Hall Public Works
Public Library McConnell Center
City of Dover, NH Year 2- Annual Contract Report
Contract # 9236-0143
November 1, 2012 – October 31, 2013
FIM DESCRIPTION
Johnson Controls, Inc. 12
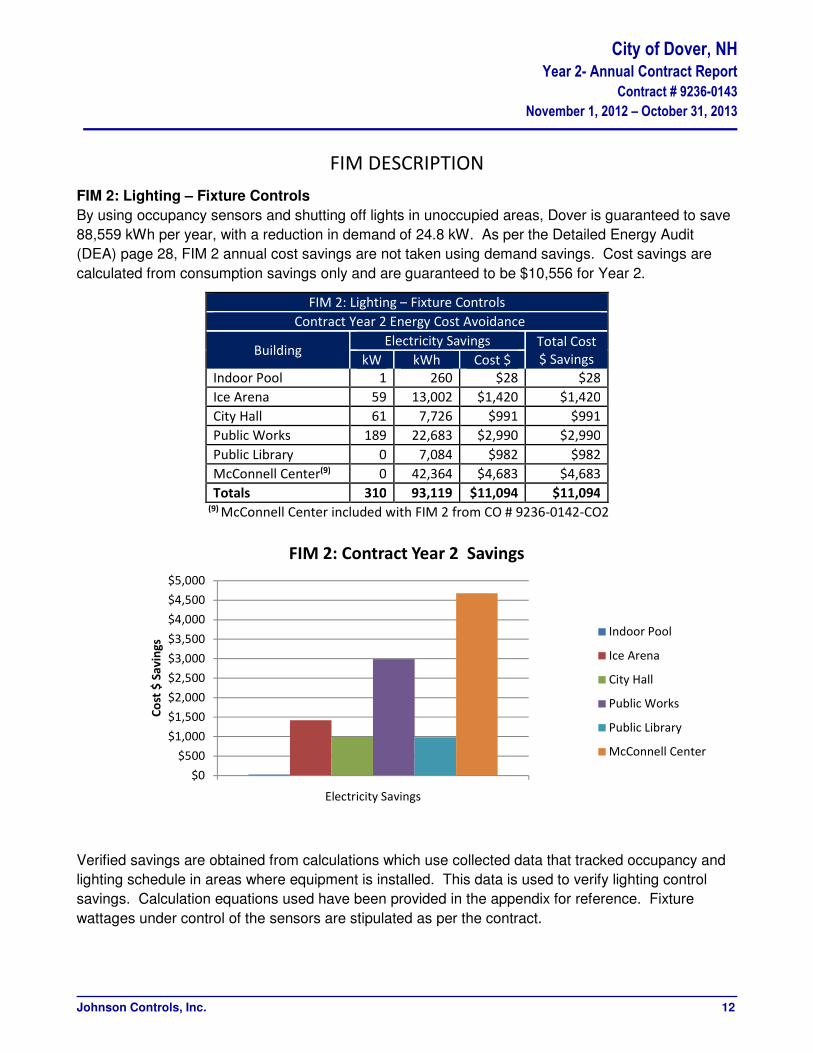
FIM 2: Lighting – Fixture Controls
By using occupancy sensors and shutting off lights in unoccupied areas, Dover is guaranteed to save
88,559 kWh per year, with a reduction in demand of 24.8 kW. As per the Detailed Energy Audit
(DEA) page 28, FIM 2 annual cost savings are not taken using demand savings. Cost savings are
calculated from consumption savings only and are guaranteed to be $10,556 for Year 2.
FIM 2: Lighting – Fixture Controls
Contract Year 2 Energy Cost Avoidance
Building Electricity Savings Total Cost
$ Savings kW kWh Cost $
Indoor Pool 1 260 $28 $28
Ice Arena 59 13,002 $1,420 $1,420
City Hall 61 7,726 $991 $991
Public Works 189 22,683 $2,990 $2,990
Public Library 0 7,084 $982 $982
McConnell Center(9) 0 42,364 $4,683 $4,683
Totals 310 93,119 $11,094 $11,094 (9) McConnell Center included with FIM 2 from CO # 9236-0142-CO2
Verified savings are obtained from calculations which use collected data that tracked occupancy and
lighting schedule in areas where equipment is installed. This data is used to verify lighting control
savings. Calculation equations used have been provided in the appendix for reference. Fixture
wattages under control of the sensors are stipulated as per the contract.
$0
$500
$1,000
$1,500
$2,000
$2,500
$3,000
$3,500
$4,000
$4,500
$5,000
Electricity Savings
Co
st $
Sa
vin
gs
FIM 2: Contract Year 2 Savings
Indoor Pool
Ice Arena
City Hall
Public Works
Public Library
McConnell Center

City of Dover, NH Year 2- Annual Contract Report
Contract # 9236-0143
November 1, 2012 – October 31, 2013
FIM DESCRIPTION
Johnson Controls, Inc. 13
FIM 3: Building Envelope- Weatherization
Weatherization savings are determined by the losses of less conditioned air due to seals of gaps and
openings in the building. The weatherization portion of the project is guaranteed to save 4,486 kWh
of electrical energy and 1,019 MMBtu’s in thermal energy, resulting in Year 2 savings of $14,899.
FIM 3: Building Envelope- Weatherization
Contract Year 2 Energy Cost Avoidance
Building Electricity Savings Thermal Savings Total Cost
$ Savings kW kWh Cost $ MMBtu Cost $
Indoor Pool 0 4 $0 87 $1,287 $1,288
Ice Arena 0 3,708 $405 356 $4,638 $5,043
WWTP 0 231 $28 70 $1,208 $1,236
City Hall 0 134 $17 61 $1,054 $1,071
Public Works 0 366 $48 207 $2,400 $2,448
McConnell Center 0 154 $17 79 $1,149 $1,166
Public Library 0 35 $5 27 $400 $405
Central Fire Station 0 194 $25 51 $798 $822
South End Fire Station 0 94 $12 92 $1,668 $1,681
Pine Hill Chapel 0 23 $4 31 $529 $533
Veteran's Hall 0 0 $0 18 $333 $333
Totals 0 4,943 $562 1,079 $15,463 $16,026
Weatherization savings are derived directly from engineering spreadsheet calculations. General
formulas used are located in Appendix C. The scope of work has been verified to be complete.
$0
$500
$1,000
$1,500
$2,000
$2,500
$3,000
$3,500
$4,000
$4,500
$5,000
Electricity Savings Thermal Savings
Co
st $
Sa
vin
gs
FIM 3: Contract Year 2 SavingsIndoor Pool
Ice Arena
WWTP
City Hall
Public Works
McConnell Ctr
Public Library
Central Fire Station
South End Fire Station
Pine Hill Chapel
Veteran's Hall

City of Dover, NH Year 2- Annual Contract Report
Contract # 9236-0143
November 1, 2012 – October 31, 2013
FIM DESCRIPTION
Johnson Controls, Inc. 14
FIM 4: Energy Management System (EMS) - Upgrades
The EMS upgrade project is guaranteed to save 125,107 kWh of electrical energy and 1,138 MMBtu’s
of thermal energy. All sections of this FIM are further broken down as follows:
FIM 4.1: EMS- Building Controls
The building controls measure provides savings by providing a run-time schedule to provide a
temperature setback when buildings are unoccupied, thus wasting less energy. The guaranteed
annual energy savings for this FIM are calculated to be 1,092 kWh and 581 MMBtu’s totaling $8,653
over the Year 2 period.
FIM 4.1: Building Controls
Contract Year 2 Energy Cost Avoidance
Building Electricity Savings Thermal Savings Total Cost
$ Savings kW kWh Cost $ MMBtu Cost $
Indoor Pool 0 (8) ($1) 14 $213 $212
Public Works 0 0 $0 11 $127 $127
McConnell Center 0 1,466 $162 450 $6,552 $6,714
Public Library 0 0 $0 72 $1,047 $1,047
Pine Hill Chapel 0 0 $0 13 $230 $230
Pine Hill Barn 0 0 $0 25 $435 $435
Totals 0 1,457 $161 586 $8,605 $8,766
Verified savings are derived from calculations and verified by trending and totalization with FMS.
General formulas have been provided in the appendix for reference. Hours of operation, pre-
installation control strategies, and pre & post retrofit equipment energy consumption are stipulated.
($1,000)
$0
$1,000
$2,000
$3,000
$4,000
$5,000
$6,000
$7,000
Electricity Savings Thermal Savings
Co
st $
Sa
vin
gs
FIM 4.1: Contract Year 2 Savings
Indoor Pool
Public Works
McConnell Center
Public Library
Pine Hill Chapel
Pine Hill Barn

City of Dover, NH Year 2- Annual Contract Report
Contract # 9236-0143
November 1, 2012 – October 31, 2013
FIM DESCRIPTION
Johnson Controls, Inc. 15
FIM 4.2: EMS- Building Controls / Optimal Start
Savings for Building Controls / Optimal Start are based off of improved starting and running of air
systems at the Dover City Hall. By optimizing control, there are guaranteed savings of 121 MMBtu
resulting in $2,023 annually in Year 2.
FIM 4.2: Building Controls / Optimal Start
Contract Year 2 Energy Cost Avoidance
Building Thermal Savings Total Cost
$ Savings MMBtu Cost $
City Hall 122 $2,103 $2,103
Verified savings are from calculations and tracked with FMS. Formulas have been provided in
Appendix C for reference. Hours of operation, pre-installation control strategies, and pre & post
retrofit equipment energy consumption are stipulated.
FIM 4.3: Air Handling Unit Upgrade- VFD on Fan
The upgrade at the Dover Public Works building was installed for the AHU that serves the repair shop.
With the VFD in place, the unit is able to slow down air flow based off occupancy. Thus savings are
realized by using less energy on the AHU fan and having to condition less air. This measure has
been guaranteed to save 41,564 kWh & 115 MMBtu’s per year.
FIM 4.3: Air Handling Unit Upgrade - VFD on Fan
Contract Year 2 Energy Cost Avoidance
Building Electricity Savings Cooling Savings Heating Savings Total Cost
$ Savings kW kWh Cost $ kWh Cost $ MMBtu Cost $
Public Works 0 0 $0 0 $0 0 $0 $0
Verified savings were based off calculations and verified through measurement of fan kW, supply &
space air temperatures. Calculations are spreadsheet based and general formulas have been
provided in the appendix for reference. Hours of operation and motor power are stipulated.
*** This measure has been removed from the project (in September 2012) due to continued difficulty
with parallel controls at the site. Any realized & verified savings realized from this measure have been
discontinued as of mid-September and will continue to produce no savings for the remainder of the
project, unless the measure is re-visited in the future. There are no current plans to re-install this
savings measure.

City of Dover, NH Year 2- Annual Contract Report
Contract # 9236-0143
November 1, 2012 – October 31, 2013
FIM DESCRIPTION
Johnson Controls, Inc. 16
FIM 4.4: Pool Dehumidification- EMS & VFDs
The replacement of the AHU with a new PoolPacTM unit in the Dover Indoor Pool will create savings
through the implementation of a temperature setback and slowed fan speeds during unoccupied
hours. Additionally, this FIM will eliminate simultaneous heating and cooling in the pool office. These
upgrades are guaranteed to save Dover 63,143 kWh and 320 MMBtu’s. Additionally, as stipulated in
the contract, a capital cost avoidance savings with this measure is valued at $338,400 over the 10
year term or an annual cost avoidance of $33,840.
FIM 4.4: Pool Dehumidification - EMS & VFD's
Contract Year 2 Energy Cost Avoidance
Building Electricity Savings Thermal Savings Capital Cost Total Cost
$ Savings kW kWh Cost $ MMBtu Cost $ Avoidance $
Indoor Pool 0 65,096 $7,008 330 $4,891 $33,840 $45,739
Verified savings are from engineering spreadsheet calculations and verified through tracking and
trending of pool humidity levels using the BAS and loggers. Hours of operation, equipment energy
consumption pre & post retrofit, and pool operational temperatures are stipulated.
FIM 4.5: Repair Snow Melt Sensor
The snow melt sensor system at the Dover Transportation Center is generally run from mid-November
through the end of March; during the winter snow season. By repairing the system and adding
sensors to control use, Dover is guaranteed to save 19,308 kWh per winter.
FIM 4.5: Repair Snow Melt Sensor
Contract Year 2 Energy Cost Avoidance
Building Electricity Savings Total Cost
$ Savings kW kWh Cost $
Dover Transportation Center 0 19,905 $2,504 $2,504
Verified savings are derived from calculations involving power draw of the snow melt system and
time-of-use of the system while operated manually. Savings are verified through inspection of post
installation hours of operation. Calculations are from spreadsheets located in the DEA. Pre-
installation hours of operation are a stipulated variable. A consideration is that savings are a function
of the severity of the winter.

City of Dover, NH Year 2- Annual Contract Report
Contract # 9236-0143
November 1, 2012 – October 31, 2013
FIM DESCRIPTION
Johnson Controls, Inc. 17
FIM 6: Water Conservation
The change in fixtures to more efficient ones is guaranteed to save 1,083 kgals of water annually and
159 MMBtu’s in costs associated with heating that water. Total guaranteed savings are $14,550.
FIM 6: Water Conservation
Contract Year 2 Energy Cost Avoidance
Building Thermal Savings Water Savings Total Cost
$ Savings MMBtu Cost $ kGal Cost $
Indoor Pool 37 $544 215 $2,451 $2,994
Ice Arena 53 $687 239 $2,715 $3,402
City Hall 21 $354 302 $3,438 $3,792
Public Works 12 $144 56 $641 $785
Public Library 10 $152 127 $1,448 $1,600
Jenny Thompson Pool 25 $351 141 $1,601 $1,952
Central Fire Station 3 $53 21 $235 $288
South End Fire Station 2 $37 9 $102 $138
Pine Hill Chapel 0 $7 7 $74 $81
Totals 164 $2,329 1,117 $12,705 $15,034
Verified savings are obtained from calculations and verified through flow measurements of fixtures
before and after retrofit. Calculations have been provided in the appendix for reference. Pre-
installation operation and occupancy are stipulated variables.
$0
$500
$1,000
$1,500
$2,000
$2,500
$3,000
$3,500
$4,000
Thermal Savings Water Savings
Co
st $
Sa
vin
gs
FIM 6: Contract Year 2 SavingsIndoor Pool
Ice Arena
City Hall
Public Works
Public Library
Jenny Thompson Pool
Central Fire Station
South End Fire Station
Pine Hill Chapel

City of Dover, NH Year 2- Annual Contract Report
Contract # 9236-0143
November 1, 2012 – October 31, 2013
FIM DESCRIPTION
Johnson Controls, Inc. 18
FIM 9: Vending Machine Controls
Savings from this FIM are derived from motion sensors which shut off the lights to the vending
machine when nobody is around. The annual savings are guaranteed to be 8,146 kWh.
FIM 9: Vending Machine Controls
Contract Year 2 Energy Cost Avoidance
Building Electricity Savings Total Cost
$ Savings kW kWh Cost $
Indoor Pool 0 1,498 $161 $161
Ice Arena 0 2,995 $327 $327
City Hall 0 2,621 $336 $336
Public Works 0 1,311 $173 $173
Totals 0 8,425 $997 $997
Verified savings for vending machine controls are directly from engineering calculations. Equations
used have been provided in the appendix. The scope of work has been verified to be fully
implemented.
$0
$50
$100
$150
$200
$250
$300
$350
$400
Electricity Savings
Co
st $
Sa
vin
gs
FIM 9: Contract Year 2 Savings
Indoor Pool
Ice Arena
City Hall
Public Works

City of Dover, NH Year 2- Annual Contract Report
Contract # 9236-0143
November 1, 2012 – October 31, 2013
FIM DESCRIPTION
Johnson Controls, Inc. 19
FIM 10: Pool Covers
Covering the pool when it is not in use eliminates heating need and water losses during unoccupied
times. The annual savings that Dover can expect to see by using the pool cover is 45,256 kWh, 543
MMBtu’s & 62.4 kgals of water, resulting in a cost savings over Year 2 of $13,623.
FIM 10: Pool Covers
Contract Year 2 Energy Cost Avoidance
Building Electricity Savings Thermal Savings Water Savings Total Cost
$ Savings kW kWh Cost $ MMBtu Cost $ kGal Cost $
Indoor Pool 0 46,656 $5,023 560 $8,290 64 $732 $14,044
Verified savings for the pool covers are directly from engineering calcualtions. The installation has
been inspected for completeness. Operational hours are a stipulated variable.

City of Dover, NH Year 2- Annual Contract Report
Contract # 9236-0143
November 1, 2012 – October 31, 2013
FIM DESCRIPTION
Johnson Controls, Inc. 20
FIM 11: Ice Arena Updates
The Dover Ice Arena updates have been designed to produce an extra 32,649 kWh per year and
create 61.8 kW more electrical demand per month (742 kW annually) in order to save 9,370 MMBtu’s
of natural gas annually. Additionally, from the work performed, there is an Operational Savings of
$11,232 for Year 2 that is realized at the Ice Arena. This is a result of moving the dashers and a
decreased cost in overall maintenance costs due to the new electric chiller.
FIM 11: Ice Arena Upgrades
Contract Year 2 Energy Cost Avoidance
Building Electricity Savings Thermal Savings Icemax O&M Total Cost
$ Savings kW kWh Cost $ MMBtu Cost $ Cost $ $ Savings
Ice Arena (1,010) (70,313) ($14,653) 8,740 $113,788 ($1,644) $11,232 $108,723
This FIM is measured using IPMVP option C which measures performance through the use of utility
bill analysis. Monthly utility invoices have been analyzed and accounted for to determine FIM 11
savings. Calculations and supporting documentation can in the FIM 11 section of Appendix A.
FIM 11: Ice Arena Updates consists of the following measures which contribute to arena savings
• FIM 11.1: Low Emissivity Ceiling
• FIM 11.2: Ice Temperature Control Optimization
• FIM 11.3: Dehumidification Controls
• FIM 11.4: Icemax System **** (Arena discontinued use in December 2012)
• FIM 11.5: Move the Dashers Inboard
• FIM 11.6: Installation of New Chiller
• FIM 11.7: Pumping System – VFD on Pump
• FIM 11.8: Controls Update
Since the implementation of these measures, savings realized over the summer at the Ice Arena are
more significant than winter period. This is due to several of the measures providing more savings
during warmer weather. For example, the low-e ceiling provides more of a difference in transfer of
heat onto the ice surface over the summertime when weather is warmer and the suns path is higher
and longer.

City of Dover, NH Year 2- Annual Contract Report
Contract # 9236-0143
November 1, 2012 – October 31, 2013
FIM DESCRIPTION
Johnson Controls, Inc. 21
FIM 12: Power Factor Correction
The power factor correction measure was designed to be applied at the Dover Ice Arena to correct
and prevent low power factor. Other ancillary benefits to be gained by power factor correction include
lower energy losses and better voltage regulation. It is guaranteed that by using the KVAR Energy
Savings System the rink will save 67,810 kWh annually.
Expected completion of this measure took substantially longer than expected due to inability to have
the chiller company provide documentation that the warranty on their equipment would not be affected
by the implementation of the capacitors. The scope of work has varied slightly from the original scope
but the equipment was installed at the ice arena in January 2013. Savings below (in this report)
reflect operation of the measure for a period of time representative of 9 months of the contract year.
FIM 12: Power Factor Correction
Contract Year 2 Energy Cost Avoidance
Building Electricity Savings Total Cost
$ Savings kW kWh Cost $
Ice Arena 40 8,917 $1,264 $1,264
Verified savings are obtained from calculations and verified through electric measurements before
and after the installation. Additional details are provided in the appendix on the installation of this
measure.

City of Dover, NH Year 2- Annual Contract Report
Contract # 9236-0143
November 1, 2012 – October 31, 2013
FIM DESCRIPTION
Johnson Controls, Inc. 22
FIM 13: Energy Efficient Transformers
Savings associated with FIM 13 are from the replacement of transformers with more efficient ones,
thus saving 145,554 kWh annually, with a monthly 25.7 kW reduction in demand (306 kW annually).
Contact Year 2 cost savings are guaranteed to be $18,941.
FIM 13: Transformers
Contract Year 2 Energy Cost Avoidance
Building Electricity Savings Total Cost
$ Savings kW kWh Cost $
WWTP 114 39,255 $5,635 $5,635
Public Works 0 27,750 $3,658 $3,658
McConnell Center 146 60,869 $7,795 $7,795
Ice Arena 59 22,754 $2,914 $2,914
Totals 318 150,628 $20,002 $20,002
Verified savings for transformers are based off calculations and verfied through field measurements of
power, harmonics, and efficiency. Calculation equations have been provided in the appendix for
reference. Operational hours and input power are stipulated variables.
$0
$1,000
$2,000
$3,000
$4,000
$5,000
$6,000
$7,000
$8,000
$9,000
Electricity Savings
Co
st $
Sa
vin
gs
FIM 13: Contract Year 2 Savings
Ice Arena
WWTP
Public Works
McConnell Center

City of Dover, NH Year 2- Annual Contract Report
Contract # 9236-0143
November 1, 2012 – October 31, 2013
FIM DESCRIPTION
Johnson Controls, Inc. 23
FIM 14: Aeration Blowers – Retrofit
This measure was guaranteed to save $34,444 over Year 2 through the replacement of three older
positive displacement blowers with new high efficiency turbine blowers. Guaranteed annual energy
savings for this FIM are obtained by reducing the electricity consumption by 272,264 kWh and
monthly demand by 62.2 kW. In March of 2012, the odor control unit and silencer which provides
ability to run the unit 24-7 were installed and scheduled to run full time to prevent odiferous
concentration in the tanks. The energy usage of this blower has been subtracted from the verified
overall blower savings but does not modify the guarantee.
FIM 14: Aeration Blowers Retrofit
Contract Year 2 Energy Cost Avoidance
Building Electricity Savings Total Cost
$ Savings kW kWh Cost $
WWTP 724 248,010 $35,648 $35,648
Additional controls work has been provided since full installation by both Dover and JCI to allow for
further control of the units. This will assist the WWTP in control of the units and provide unrealized
additional energy and operations savings based.
Verified savings are obtained from calculations and verified using measurements of power draw on
the previous and new system. Methods of calculation have been provided in Appendix C for
reference. Pre- installation loading and hours of operation are stipulated variables.
FIM 15: Boiler Replacement
Savings for this measure are based on an increase in boiler efficiency from the old boiler to the high
efficiency gas-fired boiler by approximately 7%. It is assumed that the boiler runs roughly from the
middle of September through the middle of April. The annual savings associated with FIM 15 are
calculated to be 88 MMBtu’s annually or an estimated $1,288 in Year 2.
FIM 15: Boiler Replacement
Contract Year 2 Energy Cost Avoidance
Building Thermal Savings Total Cost
$ Savings MMBtu Cost $
Public Library 89 $1,300 $1,300
Verified savings are obtained from calculations and verified by testing the improved efficiency of the
new boiler after emergency replacement of the old one. Calculations have been provided in the
appendix for reference. Pre- installation boiler efficiency is a stipulated variable.
City of Dover, NH Year 2- Annual Contract Report
Contract # 9236-0143
November 1, 2012 – October 31, 2013
ENVIRONMENTAL BENEFITS
Johnson Controls, Inc. 24
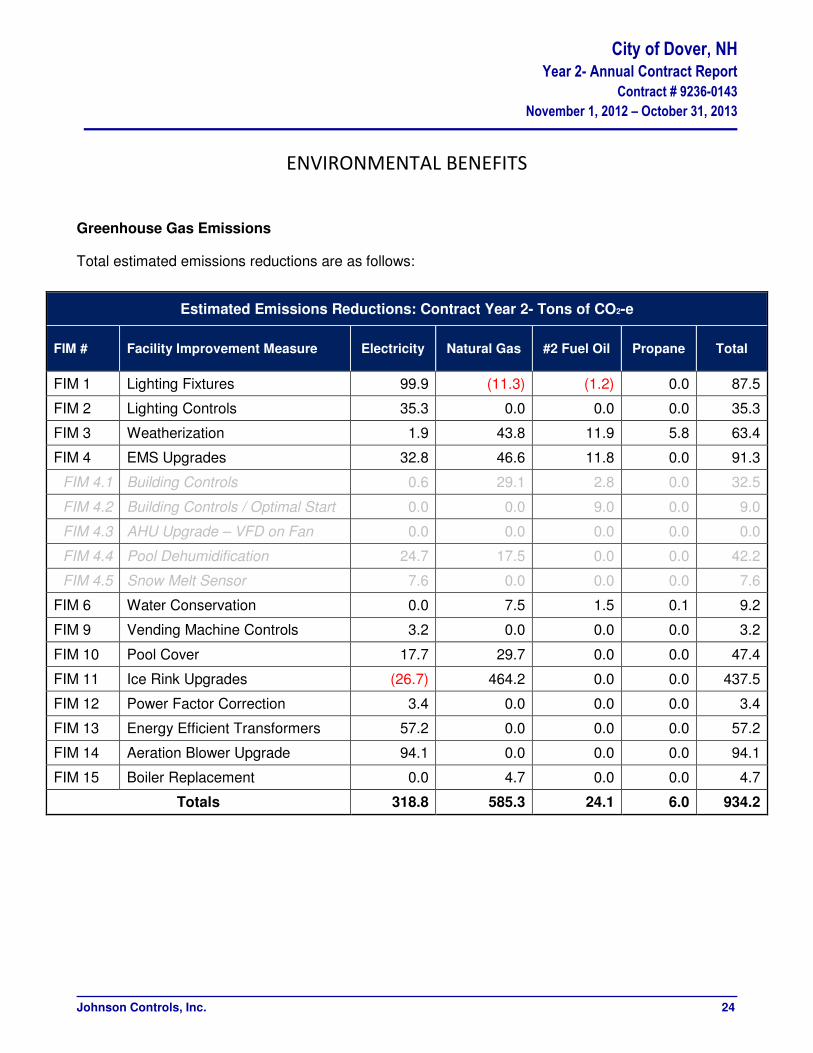
Greenhouse Gas Emissions
Total estimated emissions reductions are as follows:
Estimated Emissions Reductions: Contract Year 2- Tons of CO2-e
FIM # Facility Improvement Measure Electricity Natural Gas #2 Fuel Oil Propane Total
FIM 1 Lighting Fixtures 99.9 (11.3) (1.2) 0.0 87.5
FIM 2 Lighting Controls 35.3 0.0 0.0 0.0 35.3
FIM 3 Weatherization 1.9 43.8 11.9 5.8 63.4
FIM 4 EMS Upgrades 32.8 46.6 11.8 0.0 91.3
FIM 4.1 Building Controls 0.6 29.1 2.8 0.0 32.5
FIM 4.2 Building Controls / Optimal Start 0.0 0.0 9.0 0.0 9.0
FIM 4.3 AHU Upgrade – VFD on Fan 0.0 0.0 0.0 0.0 0.0
FIM 4.4 Pool Dehumidification 24.7 17.5 0.0 0.0 42.2
FIM 4.5 Snow Melt Sensor 7.6 0.0 0.0 0.0 7.6
FIM 6 Water Conservation 0.0 7.5 1.5 0.1 9.2
FIM 9 Vending Machine Controls 3.2 0.0 0.0 0.0 3.2
FIM 10 Pool Cover 17.7 29.7 0.0 0.0 47.4
FIM 11 Ice Rink Upgrades (26.7) 464.2 0.0 0.0 437.5
FIM 12 Power Factor Correction 3.4 0.0 0.0 0.0 3.4
FIM 13 Energy Efficient Transformers 57.2 0.0 0.0 0.0 57.2
FIM 14 Aeration Blower Upgrade 94.1 0.0 0.0 0.0 94.1
FIM 15 Boiler Replacement 0.0 4.7 0.0 0.0 4.7
Totals 318.8 585.3 24.1 6.0 934.2

City of Dover, NH Year 2- Annual Contract Report
Contract # 9236-0143
November 1, 2012 – October 31, 2013
ENVIRONMENTAL BENEFITS
Johnson Controls, Inc. 25
Dover Contract Year 2 Equivalency Savings
Version:
Energy Project GHG Calculator. USA Version 3.0. January 7, 2009.
City of Dover, NH Year 2- Annual Contract Report
Contract # 9236-0143
November 1, 2012 – October 31, 2013
APPENDIX A
Johnson Controls, Inc. 26
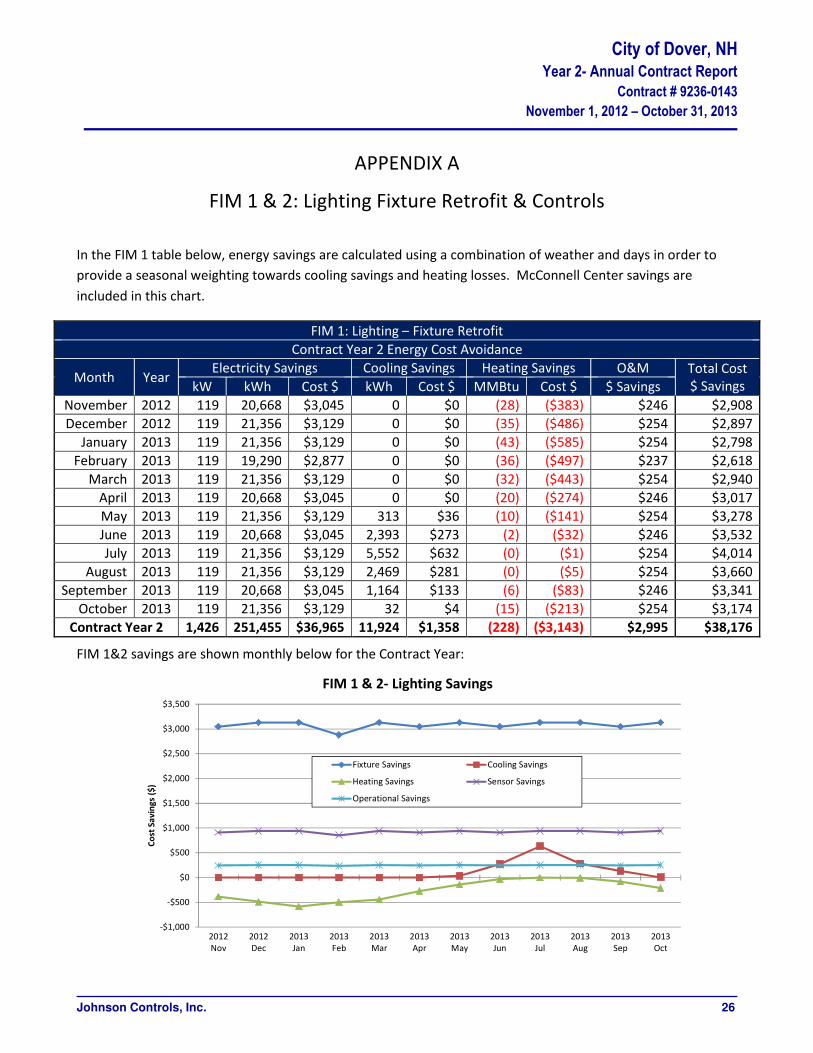
FIM 1 & 2: Lighting Fixture Retrofit & Controls
In the FIM 1 table below, energy savings are calculated using a combination of weather and days in order to
provide a seasonal weighting towards cooling savings and heating losses. McConnell Center savings are
included in this chart.
FIM 1: Lighting – Fixture Retrofit
Contract Year 2 Energy Cost Avoidance
Month Year Electricity Savings Cooling Savings Heating Savings O&M Total Cost
$ Savings kW kWh Cost $ kWh Cost $ MMBtu Cost $ $ Savings
November 2012 119 20,668 $3,045 0 $0 (28) ($383) $246 $2,908
December 2012 119 21,356 $3,129 0 $0 (35) ($486) $254 $2,897
January 2013 119 21,356 $3,129 0 $0 (43) ($585) $254 $2,798
February 2013 119 19,290 $2,877 0 $0 (36) ($497) $237 $2,618
March 2013 119 21,356 $3,129 0 $0 (32) ($443) $254 $2,940
April 2013 119 20,668 $3,045 0 $0 (20) ($274) $246 $3,017
May 2013 119 21,356 $3,129 313 $36 (10) ($141) $254 $3,278
June 2013 119 20,668 $3,045 2,393 $273 (2) ($32) $246 $3,532
July 2013 119 21,356 $3,129 5,552 $632 (0) ($1) $254 $4,014
August 2013 119 21,356 $3,129 2,469 $281 (0) ($5) $254 $3,660
September 2013 119 20,668 $3,045 1,164 $133 (6) ($83) $246 $3,341
October 2013 119 21,356 $3,129 32 $4 (15) ($213) $254 $3,174
Contract Year 2 1,426 251,455 $36,965 11,924 $1,358 (228) ($3,143) $2,995 $38,176
FIM 1&2 savings are shown monthly below for the Contract Year:
-$1,000
-$500
$0
$500
$1,000
$1,500
$2,000
$2,500
$3,000
$3,500
2012
Nov
2012
Dec
2013
Jan
2013
Feb
2013
Mar
2013
Apr
2013
May
2013
Jun
2013
Jul
2013
Aug
2013
Sep
2013
Oct
Co
st S
av
ing
s ($
)
FIM 1 & 2- Lighting Savings
Fixture Savings Cooling Savings
Heating Savings Sensor Savings
Operational Savings

City of Dover, NH Year 2- Annual Contract Report
Contract # 9236-0143
November 1, 2012 – October 31, 2013
APPENDIX A
Johnson Controls, Inc. 27
FIM 1 & 2: Lighting Fixture Retrofit & Controls The FIM 2 table breaks down the measure by month over the year. McConnell Center savings are included in
this chart.
FIM 2: Lighting – Fixture Controls
Contract Year 2 Energy Cost Avoidance
Month Year Electricity Savings Total Cost
$ Savings kW kWh Cost $
November 2012 26 7,654 $912 $912
December 2012 26 7,909 $942 $942
January 2013 26 7,909 $942 $942
February 2013 26 7,143 $851 $851
March 2013 26 7,909 $942 $942
April 2013 26 7,654 $912 $912
May 2013 26 7,909 $942 $942
June 2013 26 7,654 $912 $912
July 2013 26 7,909 $942 $942
August 2013 26 7,909 $942 $942
September 2013 26 7,654 $912 $912
October 2013 26 7,909 $942 $942
Contract Year 2 310 93,119 $11,094 $11,094

City of Dover, NH Year 2- Annual Contract Report
Contract # 9236-0143
November 1, 2012 – October 31, 2013
APPENDIX A
Johnson Controls, Inc. 28
FIM 3: Weatherization
In the FIM 3 table below, energy savings are calculated using a combination of weather and days in order to
provide a seasonal weighting towards cooling and heating savings. As such, cooling savings are more
concentrated during warmer weather and heating savings are larger during colder weather when more heating
is necessary.
FIM 3: Weatherization
Contract Year 2 Energy Cost Avoidance
Month Year Electricity Savings Thermal Savings Total Cost
$ Savings kW kWh Cost $ MMBtu Cost $
November 2012 0 332 $36 120 $1,734 $1,771
December 2012 0 343 $37 145 $2,105 $2,142
January 2013 0 343 $37 168 $2,445 $2,483
February 2013 0 310 $34 144 $2,099 $2,132
March 2013 0 343 $37 135 $1,956 $1,994
April 2013 0 332 $36 95 $1,358 $1,394
May 2013 0 376 $42 65 $914 $956
June 2013 0 248 $32 7 $110 $142
July 2013 0 918 $111 33 $433 $544
August 2013 0 599 $70 34 $446 $516
September 2013 0 453 $52 51 $701 $752
October 2013 0 346 $38 82 $1,162 $1,200
Contract Year 2 0 4,943 $562 1,079 $15,463 $16,026
$0
$500
$1,000
$1,500
$2,000
$2,500
$3,000
2012
Nov
2012
Dec
2013
Jan
2013
Feb
2013
Mar
2013
Apr
2013
May
2013
Jun
2013
Jul
2013
Aug
2013
Sep
2013
Oct
Co
st S
av
ings
($
)
FIM 3- Weatherization Savings
Electricity Savings
Thermal Savings

City of Dover, NH Year 2- Annual Contract Report
Contract # 9236-0143
November 1, 2012 – October 31, 2013
APPENDIX A
Johnson Controls, Inc. 29
FIM 4: Energy Management System Upgrades
FIM 4.1: EMS – Building Controls & FIM 4.2: EMS – Building Controls / Optimal Start
In the FIM 4.1 & 4.2 table below, weather is used to provide a seasonal weighting towards cooling and heating
savings. As such, cooling savings are more concentrated during warmer weather and heating savings are
concentrated during colder weather when more heating is necessary.
City of Dover FIM 4.1: EMS - Building Controls FIM 4.2: Building Controls / Optimal Start
Contract Year 2 Energy Cost Avoidance Contract Year 2 Energy Cost Avoidance
Month Year Electricity Savings Thermal Savings Total Cost
$ Savings
Thermal Savings Total Cost
$ Savings kW kWh Cost $ MMBtu Cost $ MMBtu Cost $
November 2012 0 0 $0 71 $1,048 $1,048 15 $256 $256
December 2012 0 0 $0 91 $1,332 $1,332 19 $326 $326
January 2013 0 0 $0 109 $1,603 $1,603 23 $392 $392
February 2013 0 0 $0 93 $1,360 $1,360 19 $332 $332
March 2013 0 0 $0 83 $1,214 $1,214 17 $297 $297
April 2013 0 0 $0 51 $749 $749 11 $183 $183
May 2013 0 38 $4 26 $385 $390 5 $94 $94
June 2013 0 293 $32 6 $87 $120 1 $21 $21
July 2013 0 679 $75 0 $3 $78 0 $1 $1
August 2013 0 302 $33 1 $13 $46 0 $3 $3
September 2013 0 142 $16 15 $227 $243 3 $55 $55
October 2013 0 4 $0 40 $583 $583 8 $142 $142
Contract Year 2 0 1,457 $161 586 $8,605 $8,766 122 $2,103 $2,103
$0
$200
$400
$600
$800
$1,000
$1,200
$1,400
$1,600
$1,800
2012
Nov
2012
Dec
2013
Jan
2013
Feb
2013
Mar
2013
Apr
2013
May
2013
Jun
2013
Jul
2013
Aug
2013
Sep
2013
Oct
Co
st S
av
ing
s ($
)
FIM 4.1/4.2- EMS Building Controls
FIM 4.1 Electricity Savings
FIM 4.1 Thermal Savings
FIM 4.2 Thermal Savings

City of Dover, NH Year 2- Annual Contract Report
Contract # 9236-0143
November 1, 2012 – October 31, 2013
APPENDIX A
Johnson Controls, Inc. 30
FIM 4: Energy Management System Upgrades
FIM 4.3: AHU Upgrade – VFD on Fan
Savings for fan electricity are based off fan run-time while conditioning savings are weighted based off monthly
weather and temperature profiles. This VFD installed as part of this unit was removed in September of 2012
due to difficulty of operation and multiple ongoing problems. JCI has paid to restore the system to previous
operation capability. There is no current plan to re-install the VFD on this unit
FIM 4.3: AHU Upgrade - VFD on Fan
Contract Year 2 Energy Cost Avoidance
Month Year Fan Electricity Savings Cooling Savings Thermal Savings Total Cost
$ Savings kW kWh Cost $ kWh Cost $ MMBtu Cost $
November 2012 0 0 $0 0 $0 0 $0 $0
December 2012 0 0 $0 0 $0 0 $0 $0
January 2013 0 0 $0 0 $0 0 $0 $0
February 2013 0 0 $0 0 $0 0 $0 $0
March 2013 0 0 $0 0 $0 0 $0 $0
April 2013 0 0 $0 0 $0 0 $0 $0
May 2013 0 0 $0 0 $0 0 $0 $0
June 2013 0 0 $0 0 $0 0 $0 $0
July 2013 0 0 $0 0 $0 0 $0 $0
August 2013 0 0 $0 0 $0 0 $0 $0
September 2013 0 0 $0 0 $0 0 $0 $0
October 2013 0 0 $0 0 $0 0 $0 $0
Contract Year 2 0 0 $0 0 $0 0 $0 $0

City of Dover, NH Year 2- Annual Contract Report
Contract # 9236-0143
November 1, 2012 – October 31, 2013
APPENDIX A
Johnson Controls, Inc. 31
FIM 4: Energy Management System Upgrades
FIM 4.4: Pool Dehumidification – EMS & VFD’s
In the FIM 4.4 table below, electricity and thermal savings are realized by the Indoor Pool as follows:
FIM 4.4: Pool Dehumidification - EMS & VFD's
Contract Year 2 Energy Cost Avoidance
Month Year Electricity Savings Thermal Savings Capital Cost Total Cost
$ Savings kW kWh Cost $ MMBtu Cost $ $ Avoidance
November 2012 0 5,350 $576 27 $402 $2,774 $3,752
December 2012 0 5,529 $595 28 $415 $2,866 $3,877
January 2013 0 5,529 $595 28 $415 $2,866 $3,877
February 2013 0 4,994 $538 25 $375 $2,681 $3,594
March 2013 0 5,529 $595 28 $415 $2,866 $3,877
April 2013 0 5,350 $576 27 $402 $2,774 $3,752
May 2013 0 5,529 $595 28 $415 $2,866 $3,877
June 2013 0 5,350 $576 27 $402 $2,774 $3,752
July 2013 0 5,529 $595 28 $415 $2,866 $3,877
August 2013 0 5,529 $595 28 $415 $2,866 $3,877
September 2013 0 5,350 $576 27 $402 $2,774 $3,752
October 2013 0 5,529 $595 28 $415 $2,866 $3,877
Contract Year 2 0 65,096 $7,008 330 $4,891 $33,840 $45,739
$0
$100
$200
$300
$400
$500
$600
$700
2012
Nov
2012
Dec
2013
Jan
2013
Feb
2013
Mar
2013
Apr
2013
May
2013
Jun
2013
Jul
2013
Aug
2013
Sep
2013
Oct
Co
st S
av
ing
s ($
)
FIM 4.4- Pool Dehumidification Savings
Electricity Savings
Thermal Savings

City of Dover, NH Year 2- Annual Contract Report
Contract # 9236-0143
November 1, 2012 – October 31, 2013
APPENDIX A
Johnson Controls, Inc. 32
FIM 4: Energy Management System Upgrades
FIM 4.5: Repair Snow Melt Sensor
The snow melt sensor is assumed to be operational from mid November through March during the snow
season. Savings are concentrated over that period.
FIM 4.5: Repair Snow Melt Sensor
Contract Year 2 Energy Cost Avoidance
Month Year Electricity Savings Total Cost
$ Savings kW kWh Cost $
November 2012 0 2,195 $276 $276
December 2012 0 4,537 $571 $571
January 2013 0 4,537 $571 $571
February 2013 0 4,098 $515 $515
March 2013 0 4,537 $571 $571
April 2013 0 0 $0 $0
May 2013 0 0 $0 $0
June 2013 0 0 $0 $0
July 2013 0 0 $0 $0
August 2013 0 0 $0 $0
September 2013 0 0 $0 $0
October 2013 0 0 $0 $0
Contract Year 2 0 19,905 $2,504 $2,504
$0
$100
$200
$300
$400
$500
$600
2012
Nov
2012
Dec
2013
Jan
2013
Feb
2013
Mar
2013
Apr
2013
May
2013
Jun
2013
Jul
2013
Aug
2013
Sep
2013
Oct
Co
st S
avi
ng
s ($
)
FIM 4.5- Snow Melt Sensor Savings
Electricity Savings

City of Dover, NH Year 2- Annual Contract Report
Contract # 9236-0143
November 1, 2012 – October 31, 2013
APPENDIX A
Johnson Controls, Inc. 33
FIM 6: Water Conservation
The FIM 6 table and chart breaks down the monthly savings by month over Contract Year:
FIM 6: Water Conservation
Contract Year 2 Energy Cost Avoidance
Month Year Thermal Savings Water Savings Total Cost
$ Savings MMBtu Cost $ kGal Cost $
November 2012 13 $191 92 $1,044 $1,236
December 2012 14 $198 95 $1,079 $1,277
January 2013 14 $198 95 $1,079 $1,277
February 2013 13 $179 86 $975 $1,153
March 2013 14 $198 95 $1,079 $1,277
April 2013 13 $191 92 $1,044 $1,236
May 2013 14 $198 95 $1,079 $1,277
June 2013 13 $191 92 $1,044 $1,236
July 2013 14 $198 95 $1,079 $1,277
August 2013 14 $198 95 $1,079 $1,277
September 2013 13 $191 92 $1,044 $1,236
October 2013 14 $198 95 $1,079 $1,277
Contract Year 2 164 $2,329 1,117 $12,705 $15,034
$0
$200
$400
$600
$800
$1,000
$1,200
2012
Nov
2012
Dec
2013
Jan
2013
Feb
2013
Mar
2013
Apr
2013
May
2013
Jun
2013
Jul
2013
Aug
2013
Sep
2013
Oct
Co
st S
av
ing
s ($
)
FIM 6- Water Conservation Savings
Thermal Savings
Water Savings
City of Dover, NH Year 2- Annual Contract Report
Contract # 9236-0143
November 1, 2012 – October 31, 2013
APPENDIX A
Johnson Controls, Inc. 34
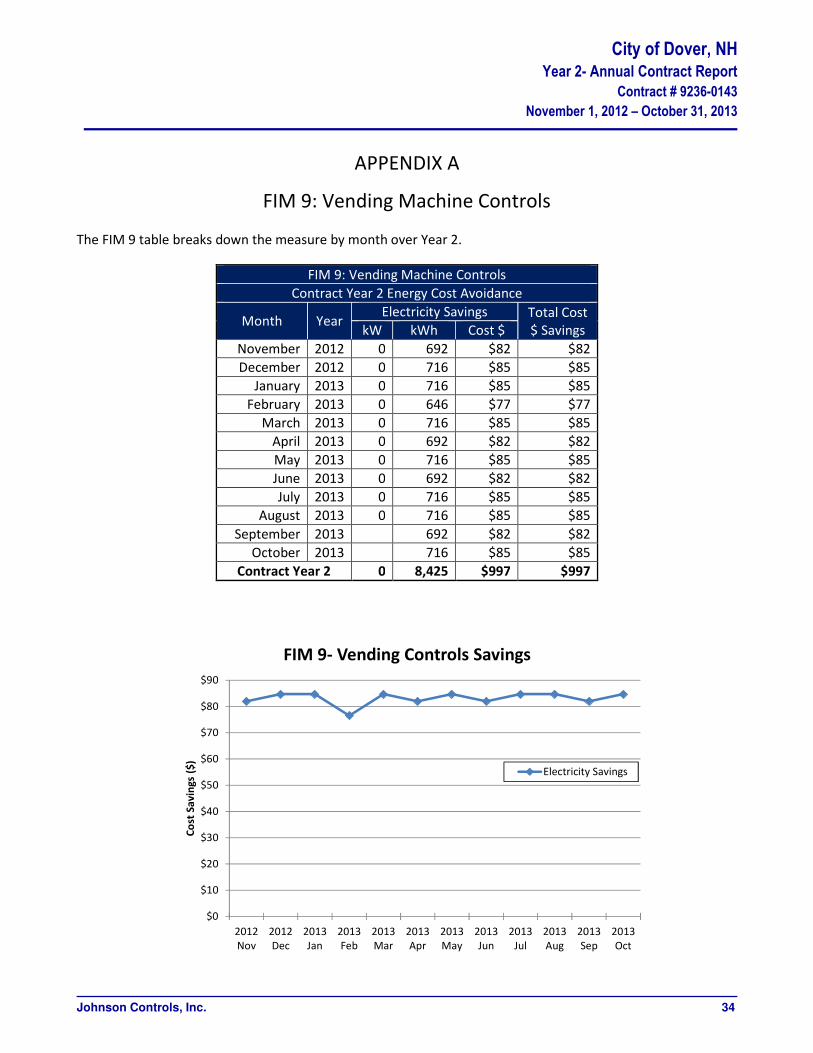
FIM 9: Vending Machine Controls
The FIM 9 table breaks down the measure by month over Year 2.
FIM 9: Vending Machine Controls
Contract Year 2 Energy Cost Avoidance
Month Year Electricity Savings Total Cost
$ Savings kW kWh Cost $
November 2012 0 692 $82 $82
December 2012 0 716 $85 $85
January 2013 0 716 $85 $85
February 2013 0 646 $77 $77
March 2013 0 716 $85 $85
April 2013 0 692 $82 $82
May 2013 0 716 $85 $85
June 2013 0 692 $82 $82
July 2013 0 716 $85 $85
August 2013 0 716 $85 $85
September 2013 692 $82 $82
October 2013 716 $85 $85
Contract Year 2 0 8,425 $997 $997
$0
$10
$20
$30
$40
$50
$60
$70
$80
$90
2012
Nov
2012
Dec
2013
Jan
2013
Feb
2013
Mar
2013
Apr
2013
May
2013
Jun
2013
Jul
2013
Aug
2013
Sep
2013
Oct
Co
st S
av
ing
s ($
)
FIM 9- Vending Controls Savings
Electricity Savings

City of Dover, NH Year 2- Annual Contract Report
Contract # 9236-0143
November 1, 2012 – October 31, 2013
APPENDIX A
Johnson Controls, Inc. 35
FIM 10: Pool Cover
The following FIM 10 table and chart break down the measure by month over the year.
FIM 10: Pool Cover
Contract Year 2 Energy Cost Avoidance
Month Year Electricity Savings Thermal Savings Water Savings Total Cost
$ Savings kW kWh Cost $ MMBtu Cost $ kGal Cost $
November 2012 0 3,835 $413 46 $681 5.3 $60 $1,154
December 2012 0 3,963 $427 48 $704 5.5 $62 $1,193
January 2013 0 3,963 $427 48 $704 5.5 $62 $1,193
February 2013 0 3,579 $385 43 $636 4.9 $56 $1,077
March 2013 0 3,963 $427 48 $704 5.5 $62 $1,193
April 2013 0 3,835 $413 46 $681 5.3 $60 $1,154
May 2013 0 3,963 $427 48 $704 5.5 $62 $1,193
June 2013 0 3,835 $413 46 $681 5.3 $60 $1,154
July 2013 0 3,963 $427 48 $704 5.5 $62 $1,193
August 2013 0 3,963 $427 48 $704 5.5 $62 $1,193
September 2013 3,835 $413 46 $681 5.3 $60 $1,154
October 2013 3,963 $427 48 $704 5.5 $62 $1,193
Contract Year 2 0 46,656 $5,023 560 $8,290 64 $732 $14,044
$0
$100
$200
$300
$400
$500
$600
$700
$800
2012
Nov
2012
Dec
2013
Jan
2013
Feb
2013
Mar
2013
Apr
2013
May
2013
Jun
2013
Jul
2013
Aug
2013
Sep
2013
Oct
Co
st S
av
ing
s ($
)
FIM 10- Pool Cover Savings
Electricity Savings
Thermal Savings
Water Savings

City of Dover, NH Year 2- Annual Contract Report
Contract # 9236-0143
November 1, 2012 – October 31, 2013
APPENDIX A
Johnson Controls, Inc. 36
FIM 11: Ice Arena Upgrades
Overall Utility Comparison
The Ice Arena part of this project consists of many items that together will achieve savings. The measurement
method of FIM 11 is done via entire building utility comparison analysis. This analysis compares the usage of
electricity and natural gas before and after the changes occurred. It applies the change in utilities use to track
the effectiveness and calculate the savings of the work done.
The natural gas and electric usage are affected by the measures implemented at the Ice Arena. There is major
mechanical equipment at the site that runs on both gas and electric. As part of this project, an electric chiller
was installed as the lead unit which was previously gas, so there is a relationship between the two energy
usages. Below is a graph showing the history of both since July 2007. As a note, most FIM 11 work was
completed between June and September 2010.
0
20,000
40,000
60,000
80,000
100,000
120,000
140,000
160,000
180,000
200,000
0
2,000
4,000
6,000
8,000
10,000
12,000
14,000
16,000
18,000
Jul-
07
Sep
-07
No
v-0
7
Jan
-08
Ma
r-0
8
Ma
y-0
8
Jul-
08
Sep
-08
No
v-0
8
Jan
-09
Ma
r-0
9
Ma
y-0
9
Jul-
09
Sep
-09
No
v-0
9
Jan
-10
Ma
r-1
0
Ma
y-1
0
Jul-
10
Sep
-10
No
v-1
0
Jan
-11
Ma
r-1
1
Ma
y-1
1
Jul-
11
Sep
-11
No
v-1
1
Jan
-12
Ma
r-1
2
Ma
y-1
2
Jul-
12
Sep
-12
No
v-1
2
Jan
-13
Ma
r-1
3
Ma
y-1
3
Jul-
13
Sep
-13
No
v-1
3
Ele
ctri
c (k
Wh
)
Na
tura
l Ga
s (T
he
rms)
Dover Ice Arena- Monthly Electric & Gas Usage
Natural Gas Usage (Therms) Electric Usage (kWh)

City of Dover, NH Year 2- Annual Contract Report
Contract # 9236-0143
November 1, 2012 – October 31, 2013
APPENDIX A
Johnson Controls, Inc. 37
FIM 11: Ice Arena Upgrades
As part of the utility bill comparison, normalization of utility data is done through the use of Metrix software.
This takes weather history and other entered variables into account in order to provide bills in different years
and scenarios on an equal playing field. Weather degree days have been provided in Appendix B.
The one entered variable needed in this case is shown below. In order to properly take into account the load
seen by the chillers and rink scheduling, this ‘Chiller- Ice Hours’ variable was created and used in the regression
analysis performed. Below is the simple calculation table and equations used to create the variable.
Dover Ice Arena Chiller- Ice Hours Variable Calculation
Month Avail Hours Arena 1 Arena 2 Ice Hours 2nd Rink Startup Chiller- Ice Hours
August 744 100% 0% 744 0 744
September 720 100% 23% 888 540 1,428
October 744 100% 100% 1,488 186 1,674
November 720 100% 100% 1,440 0 1,440
December 744 100% 100% 1,488 0 1,488
January 744 100% 100% 1,488 0 1,488
February 696 100% 100% 1,392 0 1,392
March 744 100% 100% 1,488 0 1,488
April 720 100% 0% 720 0 720
May 744 100% 0% 744 0 744
June 720 0% 0% 0 0 0
July 744 100% 0% 744 0 744
IceHours AvailableHours��Arena1 � Arena2� Chiller-IceHours IceHours � 2ndRinkStartup
2ndRinkStartup!"#$. 168HoursWeek x30 DaysMonth x 34 MonthsRunTime7 DaysWeek
2ndRinkStartup34$. 168HoursWeek x31 DaysMonth x 14 MonthsRunTime7 DaysWeek

City of Dover, NH Year 2- Annual Contract Report
Contract # 9236-0143
November 1, 2012 – October 31, 2013
APPENDIX A
Johnson Controls, Inc. 38
FIM 11: Ice Arena Upgrades- Natural Gas
Natural Gas
Savings from FIM 11 are realized through comparison of utility bills. Below is the natural gas usage per month
obtained from bills since August 2007. Baseline data in the chart below is in green, year 1 contract data is in
yellow, and year 2 contract period in blue. Future year 3 contract period is in pink.
Dover Ice Arena Natural Gas Billable Usage (Therms)
Month 2007 - 08 2008 - 09 2009 - 10 2010 - 11 2011 - 12 2012 - 13 2013 - 14
August 13,703 12,769 13,718 2,828 1,869 2,959 3,271
September 12,817 12,369 13,008 1,995 2,403 3,384 3,877
October 12,869 13,804 16,225 2,527 3,522 4,433 5,084
November 8,430 15,155 10,880 2,917 3,956 5,443 5,643
December 14,039 14,410 15,114 3,875 5,092 6,689 6,970
January 14,419 13,171 11,041 4,593 5,911 7,404 7,598
February 12,708 11,754 12,717 4,225 5,183 7,410 6,489
March 13,110 11,687 14,072 4,003 3,955 6,090 6,343
April 7,784 7,441 8,006 2,246 2,323 3,762 4,001
May 9,038 6,892 7,616 1,470 2,665 2,500 1,838
June 9,495 2,336 675 688 742 915 -
July 15,589 10,925 3,110 1,943 2,599 3,210 -
0
2,000
4,000
6,000
8,000
10,000
12,000
14,000
16,000
18,000
Th
erm
s
Dover Ice Arena- Monthly Natural Gas Usage
FY 2006
FY 2007
FY 2008
FY 2009
FY 2010
FY 2011
FY 2012
FY 2013
FY 2014

City of Dover, NH Year 2- Annual Contract Report
Contract # 9236-0143
November 1, 2012 – October 31, 2013
APPENDIX A
Johnson Controls, Inc. 39
FIM 11: Ice Arena Upgrades- Natural Gas
Using Metrix regression analysis software, a natural gas usage baseline was developed for the Ice Arena to be
used in comparing bills with different weather and arena usage. The meter tuning contract for natural gas is
included below. This provides the calculation of how the FIM 11 baseline for natural gas was developed.
The regression has a R2 value of 0.991 excluding two of the twelve baseline points, which is exceptionally
better than required. As per the contract, the natural gas baseline is within 1.4% of the actual utility data
complying with the necessary 2% mark.

City of Dover, NH Year 2- Annual Contract Report
Contract # 9236-0143
November 1, 2012 – October 31, 2013
APPENDIX A
Johnson Controls, Inc. 40
FIM 11: Ice Arena Upgrades- Natural Gas This regression analysis graph was run for natural gas therm usage. The three solid lines shown represent the calculated Year 2 baseline (blue),
target utility use based off calculations and guarantees (black), and actual Year 2 ice arena utility use from utility invoices (pink). Year 1 data
baseline (teal) and actual (purple) have been superimposed using dotted lines for reference as shown below:
Scenario Nov-12 Dec-12 Jan-13 Feb-13 Mar-13 Apr-13 May-13 Jun-13 Jul-13 Aug-13 Sep-13 Oct-13 Total
Baseline Yr 2 11,142 12,859 14,401 12,509 12,187 7,784 8,923 10,119 16,244 13,663 12,672 11,441 143,944
Target 5,700 5,348 4,898 4,992 5,714 3,571 2,949 2,551 2,859 2,162 2,918 3,302 46,964
Actual Yr 2 5,443 6,689 7,404 7,410 6,090 3,762 2,500 915 3,210 3,271 3,877 5,084 55,655
Savings 5,699 6,170 6,997 5,099 6,097 4,022 6,423 9,204 13,034 10,392 8,795 6,357 88,289
Baseline/Target/Actual Natural Gas Therm for Dover Ice Arena Natural Gas Meter
-
2,000
4,000
6,000
8,000
10,000
12,000
14,000
16,000
18,000
No
v-1
2
De
c-1
2
Jan
-13
Feb
-13
Mar
-13
Ap
r-1
3
May
-13
Jun
-13
Jul-
13
Au
g-1
3
Sep
-13
Oct
-13
Na
tura
l Ga
s T
he
rms
Baseline Yr 2 Baseline Yr 1 Target Actual Yr 2 Actual Yr 1

City of Dover, NH Year 2- Annual Contract Report
Contract # 9236-0143
November 1, 2012 – October 31, 2013
APPENDIX A
Johnson Controls, Inc. 41
FIM 11: Ice Arena Upgrades- Natural Gas This regression analysis graph was run for natural gas cost. The three solid lines shown represent the calculated Yr 2 baseline (blue), target utility
cost based off calculations and guarantees (black), and actual Yr 2 contractual ice arena utility cost from utility use & contractual rates (pink). Year
1 cost baseline (teal) and actual (purple) have been superimposed using dotted lines for reference as shown below:
Scenario Nov-12 Dec-12 Jan-13 Feb-13 Mar-13 Apr-13 May-13 Jun-13 Jul-13 Aug-13 Sep-13 Oct-13 Total
Baseline Yr 2 14,507$ 16,742$ 18,750$ 16,287$ 15,867$ 10,135$ 11,618$ 13,175$ 21,150$ 17,789$ 16,499$ 14,896$ 187,415$
Target 7,421$ 6,963$ 6,377$ 6,500$ 7,440$ 4,649$ 3,840$ 3,321$ 3,722$ 2,815$ 3,799$ 4,299$ 61,147$
Actual Yr 2 7,087$ 8,709$ 9,640$ 9,648$ 7,929$ 4,898$ 3,255$ 1,191$ 4,179$ 4,259$ 5,048$ 6,619$ 72,463$
Savings 7,420$ 8,033$ 9,110$ 6,639$ 7,938$ 5,237$ 8,363$ 11,984$ 16,970$ 13,530$ 11,451$ 8,277$ 114,952$
Baseline/Target/Actual Total $ for Dover Ice Arena Natural Gas Meter
$-
$5,000
$10,000
$15,000
$20,000
$25,000
No
v-1
2
De
c-1
2
Jan
-13
Feb
-13
Mar
-13
Ap
r-1
3
May
-13
Jun
-13
Jul-
13
Au
g-1
3
Sep
-13
Oct
-13
Tota
l $
Baseline Yr 2 Baseline Yr 1 Target Actual Yr 2 Actual Yr 1

City of Dover, NH Year 2- Annual Contract Report
Contract # 9236-0143
November 1, 2012 – October 31, 2013
APPENDIX A
Johnson Controls, Inc. 42
FIM 11: Ice Arena Upgrades- Natural Gas
Since there are measures included at the Ice Arena that are not to be measured by utility bill analysis, they
must be subtracted from the overall savings as to not be counted twice. Below is a table of Year 2 natural gas
savings from all other measures at the Ice Arena:
FIM 11: Ice Arena Upgrades
Year 2 Savings from Other FIMs
FIM # FIM Description Thermal Savings
MMBtu Cost $
1 Lighting Fixtures (73) ($956)
2 Lighting Controls 0 $0
3 Weatherization 356 $4,638
6 Water Conservation 53 $687
9 Vending Controls 0 $0
12 Power Factor 0 $0
13 Transformers 0 $0
Total 336 $4,369
FIM 11: Ice Arena Upgrades
Year 2 Savings Adjustments
FIM # FIM Description Thermal Savings
MMBtu Cost $
11.4 Ice Max 246 $3,204
Natural Gas consumption savings from the analysis are 88,289 therms for Yr 2. Of those, as seen in the first
table above, 336 MMBtu = 3,355 therms are from different measures within this project. In the second table,
an adjustment of 246 MMBtu = 2,461 therms are taken due to the discontinued use of IceMax. So the total
reported savings from FIM 11 in Year 2 is 87,395 therms.
The natural gas cost savings from the analysis are $114,952 with $4,369 in savings coming from other FIMs and
$3,204 attributed to IceMax. By isolating and removing savings from the other measures (including IceMax),
the total FIM 11 natural gas utility analysis cost savings is $113,788.
FIM 11: Ice Arena Upgrades
Contract Year 2 Energy Cost Avoidance
Building Thermal Savings
MMBtu Cost $
Ice Arena 8,740 $113,788

City of Dover, NH Year 2- Annual Contract Report
Contract # 9236-0143
November 1, 2012 – October 31, 2013
APPENDIX A
Johnson Controls, Inc. 43
FIM 11: Ice Arena Upgrades- Electric
Electric
Savings from FIM 11 were obtained through utility bill analysis. Below is the electric consumption per month
obtained from bills for the baseline year through the installation period. Baseline data is in green, year 1
contract data is in yellow, and year 2 contract period in blue. Future year 3 contract period is in pink.
Dover Ice Arena Electric Consumption (kWh)
Month 2007 - 08 2008 - 09 2009 - 10 2010 - 11 2011 - 12 2012 - 13 2013 - 14
September 146,400 173,600 155,000 126,800 104,400 120,800 134,800
October 179,800 117,800 129,800 158,000 159,000 174,800 157,400
November 146,200 116,800 122,000 142,000 153,200 158,600 138,000
December 145,200 139,200 153,600 127,200 145,800 155,600 140,200
January 127,400 94,800 118,000 125,400 144,400 156,200 148,400
February 127,800 120,800 135,400 130,000 153,200 153,800 132,400
March 111,200 108,000 124,000 140,200 142,400 137,400 134,800
April 105,600 103,400 101,600 86,800 111,000 113,600 106,600
May 93,200 81,600 93,200 89,400 103,800 102,800 89,400
June 89,600 44,400 53,000 28,600 45,400 27,400 -
July 106,000 67,600 100,800 85,600 74,400 91,800 -
August 95,200 99,000 119,200 131,200 143,200 122,600 -
0
20,000
40,000
60,000
80,000
100,000
120,000
140,000
160,000
180,000
200,000
kW
h
Dover Ice Arena- Monthly Electricity Usage
FY 2006
FY 2007
FY 2008
FY 2009
FY 2010
FY 2011
FY 2012
FY 2013
FY 2014

City of Dover, NH Year 2- Annual Contract Report
Contract # 9236-0143
November 1, 2012 – October 31, 2013
APPENDIX A
Johnson Controls, Inc. 44
FIM 11: Ice Arena Upgrades- Electric
Below is the electric demand per month obtained from bills from the baseline year through the installation
period. Baseline data is in green, year 1 contract data is in yellow, and year 2 contract period in blue. Future
year 3 contract period is in pink.
Dover Ice Arena Electric Demand (kW)
Month 2007 - 08 2008 - 09 2009 - 10 2010 - 11 2011 - 12 2012 - 13 2013 - 14
September 312 336 316 259 265 303 331
October 315 275 328 329 338 314 332
November 327 217 301 291 321 342 344
December 321 263 327 308 299 299 337
January 240 257 261 293 317 347 340
February 222 262 313 290 307 365 324
March 217 294 211 312 310 326 321
April 283 257 203 276 295 287 294
May 243 162 185 231 237 235 220
June 232 176 281 231 226 220 -
July 235 171 266 250 243 304 -
August 250 190 290 275 259 279 -
0
50
100
150
200
250
300
350
400
450
kW
Dover Ice Arena- Monthly Electricity Demand
FY 2006
FY 2007
FY 2008
FY 2009
FY 2010
FY 2011
FY 2012
FY 2013
FY 2014

City of Dover, NH Year 2- Annual Contract Report
Contract # 9236-0143
November 1, 2012 – October 31, 2013
APPENDIX A
Johnson Controls, Inc. 45
FIM 11: Ice Arena Upgrades- Electric
Using Metrix regression analysis software, a electric consumption baseline was developed for the Ice Arena to
be used in comparing bills with different weather and arena usage. The meter tuning contract for electric kWh
is included below. This provides the calculation of how the baseline for electric consumption was developed.
The regression has a R2 value of 0.998 excluding two of the twelve baseline points, which is exceptionally
better than required. As per the contract, the electric consumption baseline is within 0.5% of the actual utility
data complying with the necessary 2% mark.
City of Dover, NH Year 2- Annual Contract Report
Contract # 9236-0143
November 1, 2012 – October 31, 2013
APPENDIX A
Johnson Controls, Inc. 46
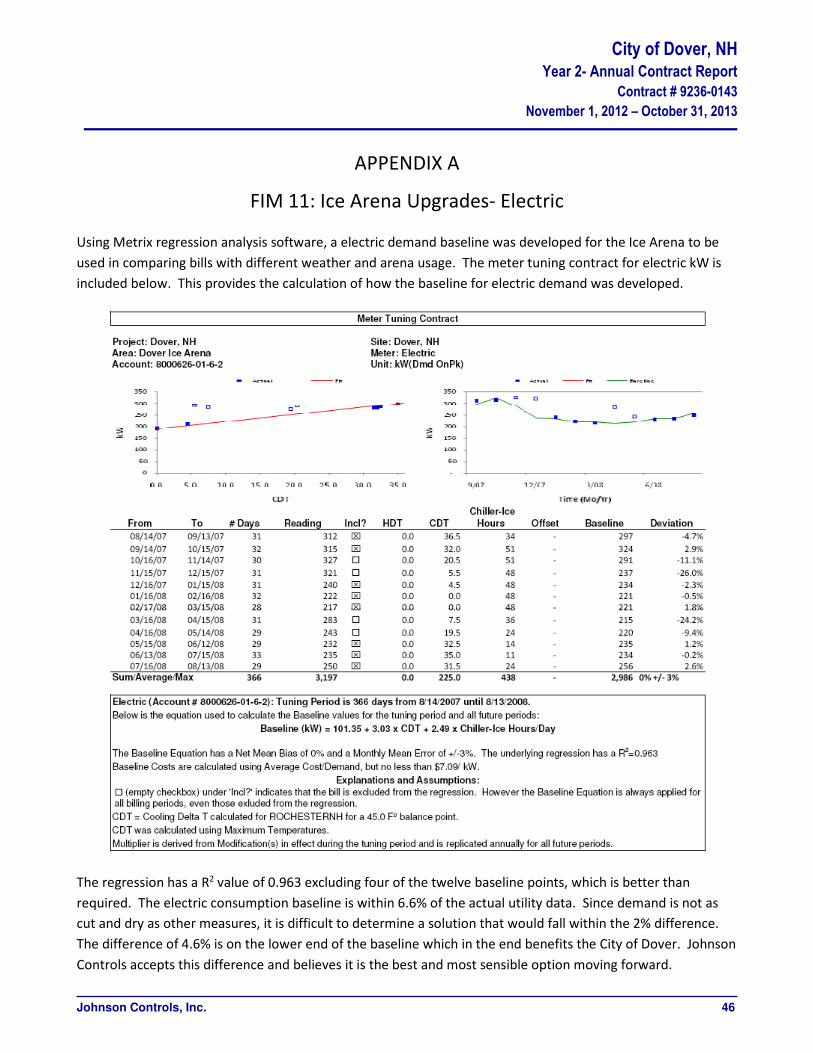
FIM 11: Ice Arena Upgrades- Electric
Using Metrix regression analysis software, a electric demand baseline was developed for the Ice Arena to be
used in comparing bills with different weather and arena usage. The meter tuning contract for electric kW is
included below. This provides the calculation of how the baseline for electric demand was developed.
The regression has a R2 value of 0.963 excluding four of the twelve baseline points, which is better than
required. The electric consumption baseline is within 6.6% of the actual utility data. Since demand is not as
cut and dry as other measures, it is difficult to determine a solution that would fall within the 2% difference.
The difference of 4.6% is on the lower end of the baseline which in the end benefits the City of Dover. Johnson
Controls accepts this difference and believes it is the best and most sensible option moving forward.

City of Dover, NH Year 2- Annual Contract Report
Contract # 9236-0143
November 1, 2012 – October 31, 2013
APPENDIX A
Johnson Controls, Inc. 47
FIM 11: Ice Arena Upgrades- Electric This regression analysis graph was run for electric kWh consumption. The three solid lines shown represent the calculated Year 2 baseline (blue),
target utility use based off calculations and guarantees (black), and actual Year 2 ice arena utility use from utility invoices (pink). Year 1 data
baseline (teal) and actual (purple) have been superimposed using dotted lines for reference as shown below:
Scenario Nov-12 Dec-12 Jan-13 Feb-13 Mar-13 Apr-13 May-13 Jun-13 Jul-13 Aug-13 Sep-13 Oct-13 Total
Baseline Yr 2 153,612 123,053 125,474 124,615 113,770 107,388 96,877 90,297 105,459 132,245 154,077 162,923 1,489,790
Target 148,852 116,721 118,955 118,171 109,598 96,900 85,855 82,617 95,959 124,620 144,792 155,627 1,398,667
Actual Yr 2 158,600 155,600 156,200 153,800 137,400 113,600 102,800 27,400 91,800 122,600 134,800 157,400 1,512,000
Savings (4,988) (32,547) (30,726) (29,185) (23,630) (6,212) (5,923) 62,897 13,659 9,645 19,277 5,523 (22,210)
Baseline/Target/Actual Electricity kWh for Dover Ice Arena Electric Meter
-
20,000
40,000
60,000
80,000
100,000
120,000
140,000
160,000
180,000
200,000
No
v-1
2
De
c-1
2
Jan
-13
Feb
-13
Mar
-13
Ap
r-1
3
May
-13
Jun
-13
Jul-
13
Au
g-1
3
Sep
-13
Oct
-13
Ele
ctri
city
kW
h
Baseline Yr 2 Baseline Yr 1 Target Actual Yr 2 Actual Yr 1

City of Dover, NH Year 2- Annual Contract Report
Contract # 9236-0143
November 1, 2012 – October 31, 2013
APPENDIX A
Johnson Controls, Inc. 48
FIM 11: Ice Arena Upgrades- Electric
This regression analysis was run for electric kW demand. The three lines shown represent the calculated Year 2 baseline (blue), target utility use
based off calculations and guarantees (black), and actual Year 2 ice arena utility use from utility invoices (pink). Year 1 data baseline (teal) and
actual (purple) have been superimposed using dotted lines for reference as shown below:
Scenario Nov-12 Dec-12 Jan-13 Feb-13 Mar-13 Apr-13 May-13 Jun-13 Jul-13 Aug-13 Sep-13 Oct-13 Total
Baseline Yr 2 286 221 227 221 221 210 223 237 246 273 298 293 2,956
Target 329 262 269 265 261 253 265 279 288 315 341 334 3,461
Actual Yr 2 342 299 347 365 326 287 235 220 304 279 331 332 3,667
Savings (56) (78) (120) (144) (105) (77) (12) 17 (58) (6) (33) (39) (711)
Baseline/Target/Actual Electricity kW for Dover Ice Arena Electric Meter
-
50
100
150
200
250
300
350
400
No
v-1
2
De
c-1
2
Jan
-13
Feb
-13
Mar
-13
Ap
r-1
3
May
-13
Jun
-13
Jul-
13
Au
g-1
3
Sep
-13
Oct
-13
Ele
ctri
city
kW
Baseline Yr 2 Baseline Yr 1 Target Actual Yr 2 Actual Yr 1

City of Dover, NH Year 2- Annual Contract Report
Contract # 9236-0143
November 1, 2012 – October 31, 2013
APPENDIX A
Johnson Controls, Inc. 49
FIM 11: Ice Arena Upgrades- Electric This regression analysis was run for electric cost which includes both demand and consumption. The three solid lines shown represent the
calculated Year 2 baseline (blue), target utility use based off calculations and guarantees (black), and actual Year 2 cost from utility invoices and
contractual rates (pink). Year 1 cost baseline (teal) and actual (purple) have been superimposed using dotted lines for reference as shown below:
Scenario Nov-12 Dec-12 Jan-13 Feb-13 Mar-13 Apr-13 May-13 Jun-13 Jul-13 Aug-13 Sep-13 Oct-13 Total
Yr 2 Baseline 18,865$ 15,052$ 15,361$ 15,223$ 14,039$ 13,261$ 12,208$ 11,592$ 13,314$ 16,436$ 19,003$ 19,932$ 184,287$
Target 18,659$ 14,660$ 14,956$ 14,841$ 13,875$ 12,430$ 11,312$ 11,060$ 12,583$ 15,910$ 18,303$ 19,435$ 178,024$
Yr 2 Actual 19,818$ 19,177$ 19,593$ 19,462$ 17,386$ 14,502$ 12,943$ 4,599$ 12,246$ 15,427$ 17,139$ 19,614$ 191,906$
Savings (954)$ (4,124)$ (4,232)$ (4,239)$ (3,348)$ (1,241)$ (734)$ 6,993$ 1,068$ 1,009$ 1,864$ 318$ (7,619)$
Baseline/Target/Actual Total $ for Dover Ice Arena Electric Meter
$-
$5,000
$10,000
$15,000
$20,000
$25,000
No
v-1
2
De
c-1
2
Jan
-13
Feb
-13
Mar
-13
Ap
r-1
3
May
-13
Jun
-13
Jul-
13
Au
g-1
3
Sep
-13
Oct
-13
Tota
l $
Yr 2 Baseline Yr 1 Baseline Target Yr 2 Actual Yr 1 Actual
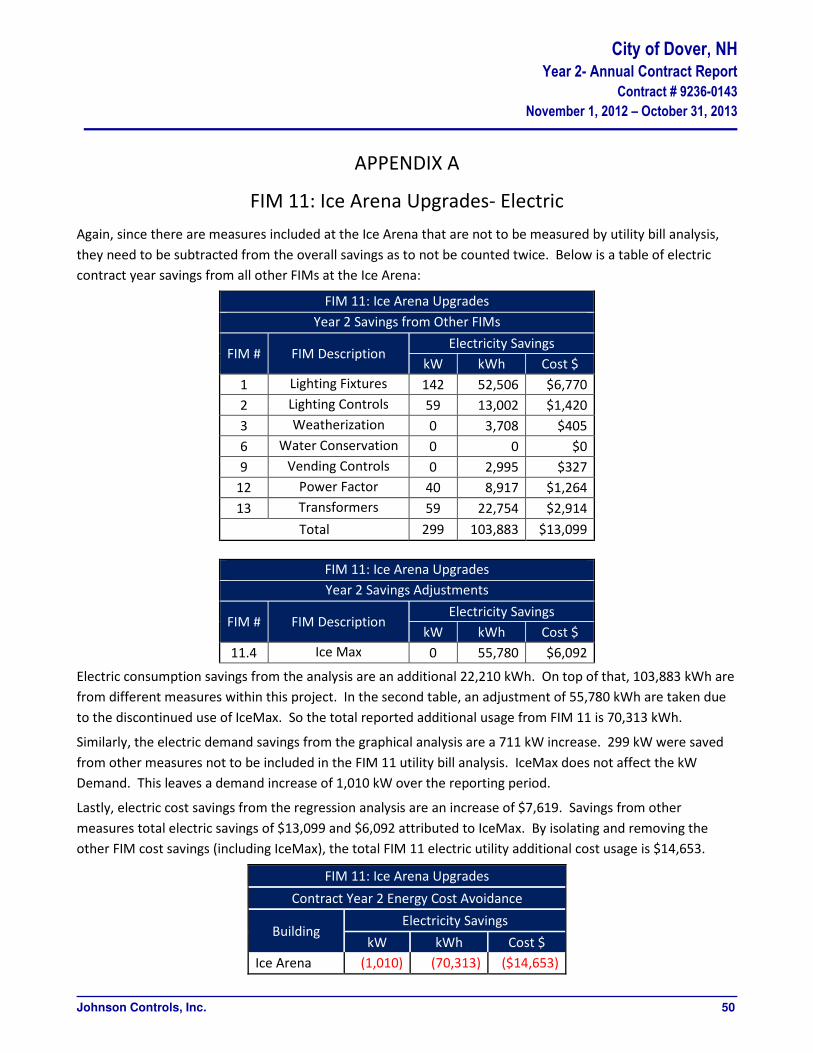
City of Dover, NH Year 2- Annual Contract Report
Contract # 9236-0143
November 1, 2012 – October 31, 2013
APPENDIX A
Johnson Controls, Inc. 50
FIM 11: Ice Arena Upgrades- Electric
Again, since there are measures included at the Ice Arena that are not to be measured by utility bill analysis,
they need to be subtracted from the overall savings as to not be counted twice. Below is a table of electric
contract year savings from all other FIMs at the Ice Arena:
FIM 11: Ice Arena Upgrades
Year 2 Savings from Other FIMs
FIM # FIM Description Electricity Savings
kW kWh Cost $
1 Lighting Fixtures 142 52,506 $6,770
2 Lighting Controls 59 13,002 $1,420
3 Weatherization 0 3,708 $405
6 Water Conservation 0 0 $0
9 Vending Controls 0 2,995 $327
12 Power Factor 40 8,917 $1,264
13 Transformers 59 22,754 $2,914
Total 299 103,883 $13,099
FIM 11: Ice Arena Upgrades
Year 2 Savings Adjustments
FIM # FIM Description Electricity Savings
kW kWh Cost $
11.4 Ice Max 0 55,780 $6,092
Electric consumption savings from the analysis are an additional 22,210 kWh. On top of that, 103,883 kWh are
from different measures within this project. In the second table, an adjustment of 55,780 kWh are taken due
to the discontinued use of IceMax. So the total reported additional usage from FIM 11 is 70,313 kWh.
Similarly, the electric demand savings from the graphical analysis are a 711 kW increase. 299 kW were saved
from other measures not to be included in the FIM 11 utility bill analysis. IceMax does not affect the kW
Demand. This leaves a demand increase of 1,010 kW over the reporting period.
Lastly, electric cost savings from the regression analysis are an increase of $7,619. Savings from other
measures total electric savings of $13,099 and $6,092 attributed to IceMax. By isolating and removing the
other FIM cost savings (including IceMax), the total FIM 11 electric utility additional cost usage is $14,653.
FIM 11: Ice Arena Upgrades
Contract Year 2 Energy Cost Avoidance
Building Electricity Savings
kW kWh Cost $
Ice Arena (1,010) (70,313) ($14,653)

City of Dover, NH Year 2- Annual Contract Report
Contract # 9236-0143
November 1, 2012 – October 31, 2013
APPENDIX A
Johnson Controls, Inc. 51
FIM 11: Ice Arena Upgrades
Breaking out the energy savings on a monthly basis and combining all previous figures, the total FIM 11 savings
for Year 2 are listed below:
FIM 11: Ice Arena Upgrades
Contract Year 2 Energy Cost Avoidance
Month Year Electricity Savings Thermal Savings Icemax O&M Total Cost
$ Savings kW kWh Cost $ MMBtu Cost $ Cost $ $ Savings
November 2012 (78) (12,434) ($1,889) 542 $7,062 ($809) $921 $5,285
December 2012 (100) (40,242) ($5,086) 591 $7,691 ($836) $951 $2,720
January 2013 (142) (30,349) ($4,339) 712 $9,273 $0 $951 $5,885
February 2013 (169) (28,766) ($4,340) 524 $6,826 $0 $890 $3,376
March 2013 (130) (24,052) ($3,541) 619 $8,062 $0 $951 $5,473
April 2013 (102) (10,485) ($1,854) 391 $5,086 $0 $921 $4,152
May 2013 (37) (10,600) ($1,392) 626 $8,156 $0 $951 $7,715
June 2013 (15) 53,880 $5,810 917 $11,937 $0 $921 $18,668
July 2013 (85) 6,917 $170 1,284 $16,721 $0 $951 $17,843
August 2013 (31) 4,118 $259 1,020 $13,282 $0 $951 $14,493
September 2013 (58) 16,611 $1,426 873 $11,362 $0 $921 $13,708
October 2013 (64) 5,089 $124 640 $8,330 $0 $951 $9,405
Contract Year 2 (1,010) (70,313) ($14,653) 8,739.5 $113,788 ($1,644) $11,232 $108,723
($10,000)
($5,000)
$0
$5,000
$10,000
$15,000
$20,000
2012
Nov
2012
Dec
2013
Jan
2013
Feb
2013
Mar
2013
Apr
2013
May
2013
Jun
2013
Jul
2013
Aug
2013
Sep
2013
Oct
Co
st S
av
ing
s ($
)
FIM 11- Ice Arena Savings
Electricity Savings Thermal Savings Icemax Cost $ Operational Savings

City of Dover, NH Year 2- Annual Contract Report
Contract # 9236-0143
November 1, 2012 – October 31, 2013
APPENDIX A
Johnson Controls, Inc. 52
FIM 12: Power Factor Correction
This measure was fully installed on January 26, 2013 on the following devices:
- A1 63kw Compressor
- B1 63kw Compressor
- A2 45kw Compressor
- 15 HP Electric Chiller Pump
- 30 HP Backup Pump
Power measurements taken on the following equipment yields the following savings from the installation of
the equipment:
Equipment INITIAL INITIAL OPTIMIZED OPTIMIZED KW KW
AMPS P.F. AMPS P.F. BEFORE AFTER
A1 63 kW Compressor 63 0.73 47 0.95 39 37
B1 63 kW Compressor 62 0.74 46 0.95 38 37
A2 45 kW Compressor 55 0.78 43 0.96 36 35
15 HP Electric Chiller Pump 13 0.81 11 0.98 9 9
30 HP Back Up Pump 39 0.81 33 0.98 27 27
Run Hours for the equipment is as follows:
Equipment MOTOR
RUNTIME
YEARLY HRS
A1 63 kW Compressor 3,600
B1 63 kW Compressor 3,600
A2 45 kW Compressor 3,600
15 HP Electric Chiller Pump 8,640
30 HP Back Up Pump 2,880
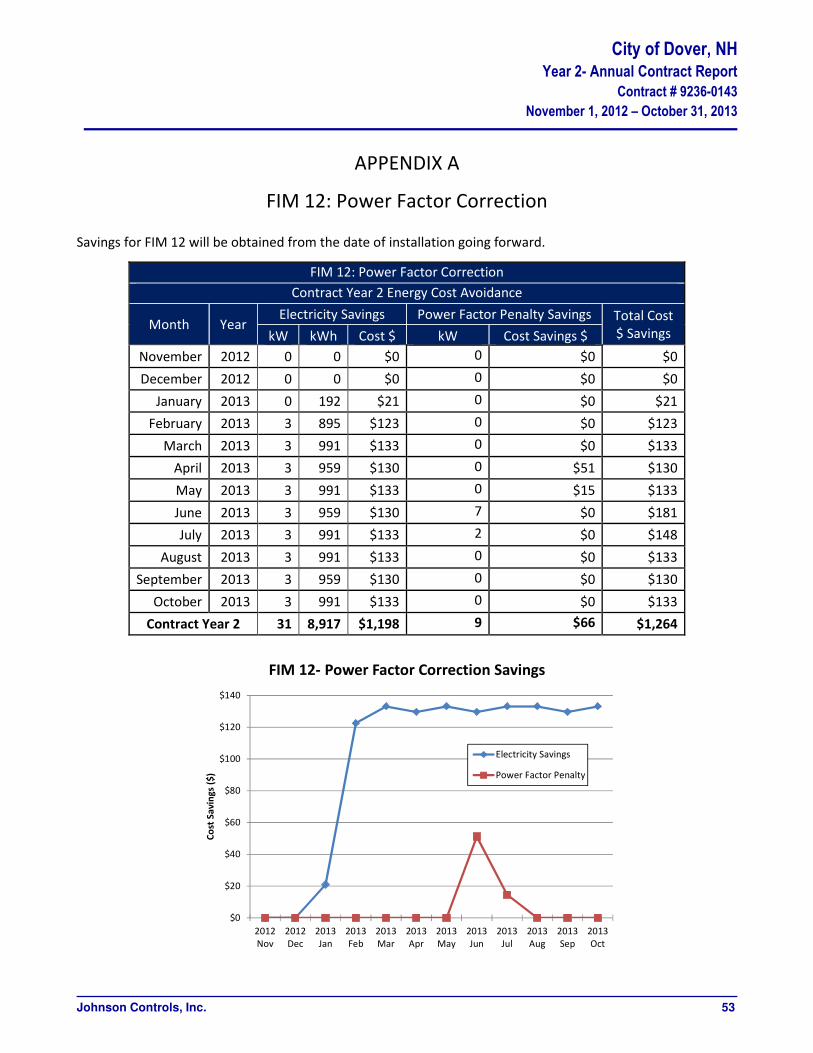
City of Dover, NH Year 2- Annual Contract Report
Contract # 9236-0143
November 1, 2012 – October 31, 2013
APPENDIX A
Johnson Controls, Inc. 53
FIM 12: Power Factor Correction
Savings for FIM 12 will be obtained from the date of installation going forward.
FIM 12: Power Factor Correction
Contract Year 2 Energy Cost Avoidance
Month Year Electricity Savings Power Factor Penalty Savings Total Cost
$ Savings kW kWh Cost $ kW Cost Savings $
November 2012 0 0 $0 0 $0 $0
December 2012 0 0 $0 0 $0 $0
January 2013 0 192 $21 0 $0 $21
February 2013 3 895 $123 0 $0 $123
March 2013 3 991 $133 0 $0 $133
April 2013 3 959 $130 0 $51 $130
May 2013 3 991 $133 0 $15 $133
June 2013 3 959 $130 7 $0 $181
July 2013 3 991 $133 2 $0 $148
August 2013 3 991 $133 0 $0 $133
September 2013 3 959 $130 0 $0 $130
October 2013 3 991 $133 0 $0 $133
Contract Year 2 31 8,917 $1,198 9 $66 $1,264
$0
$20
$40
$60
$80
$100
$120
$140
2012
Nov
2012
Dec
2013
Jan
2013
Feb
2013
Mar
2013
Apr
2013
May
2013
Jun
2013
Jul
2013
Aug
2013
Sep
2013
Oct
Co
st S
av
ing
s ($
)
FIM 12- Power Factor Correction Savings
Electricity Savings
Power Factor Penalty

City of Dover, NH Year 2- Annual Contract Report
Contract # 9236-0143
November 1, 2012 – October 31, 2013
APPENDIX A
Johnson Controls, Inc. 54
FIM 13: Transformers
The FIM 13 table breaks down the measure by month over the contract year. Savings for the replacement of
transformers come from the Ice Arena, Waste Water Treatment Plant, Public Works, and McConnell Center.
FIM 13: Transformers
Contract Year 2 Energy Cost Avoidance
Month Year Electricity Savings Total Cost
$ Savings kW kWh Cost $
November 2012 27 12,380 $1,647 $1,647
December 2012 27 12,793 $1,695 $1,695
January 2013 27 12,793 $1,695 $1,695
February 2013 27 11,555 $1,550 $1,550
March 2013 27 12,793 $1,695 $1,695
April 2013 27 12,380 $1,647 $1,647
May 2013 27 12,793 $1,695 $1,695
June 2013 27 12,380 $1,647 $1,647
July 2013 27 12,793 $1,695 $1,695
August 2013 27 12,793 $1,695 $1,695
September 2013 27 12,380 $1,647 $1,647
October 2013 27 12,793 $1,695 $1,695
Contract Year 2 318 150,628 $20,002 $20,002
$0
$200
$400
$600
$800
$1,000
$1,200
$1,400
$1,600
$1,800
2012
Nov
2012
Dec
2013
Jan
2013
Feb
2013
Mar
2013
Apr
2013
May
2013
Jun
2013
Jul
2013
Aug
2013
Sep
2013
Oct
Co
st S
av
ing
s ($
)
FIM 13- Transformers Savings
Electricity Savings

City of Dover, NH Year 2- Annual Contract Report
Contract # 9236-0143
November 1, 2012 – October 31, 2013
APPENDIX A
Johnson Controls, Inc. 55
FIM 14: Aeration Blower Upgrade
The FIM 14 table breaks down the measure over the contract year. A silencer was added to the unit in March
2012 allowing for the recommended 24-7 run time to control odors. This has been included in the savings
below.
FIM 14: Aeration Blower Upgrade
Contract Year 2 Energy Cost Avoidance
Month Year Electricity Savings Total Cost
$ Savings kW kWh Cost $
November 2012 60 20,384 $2,936 $2,936
December 2012 60 21,064 $3,019 $3,019
January 2013 60 21,064 $3,019 $3,019
February 2013 60 19,025 $2,769 $2,769
March 2013 60 21,064 $3,019 $3,019
April 2013 60 20,384 $2,936 $2,936
May 2013 60 21,064 $3,019 $3,019
June 2013 60 20,384 $2,936 $2,936
July 2013 60 21,064 $3,019 $3,019
August 2013 60 21,064 $3,019 $3,019
September 2013 60 20,384 $2,936 $2,936
October 2013 60 21,064 $3,019 $3,019
Contract Year 2 724 248,010 $35,648 $35,648
-$1,000
-$500
$0
$500
$1,000
$1,500
$2,000
$2,500
$3,000
$3,500
$4,000
2012
Nov
2012
Dec
2013
Jan
2013
Feb
2013
Mar
2013
Apr
2013
May
2013
Jun
2013
Jul
2013
Aug
2013
Sep
2013
Oct
Co
st S
av
ing
s ($
)
FIM 14- Aeration Blower Savings
Blower Electricity Savings
Odor Unit Usage

City of Dover, NH Year 2- Annual Contract Report
Contract # 9236-0143
November 1, 2012 – October 31, 2013
APPENDIX A
Johnson Controls, Inc. 56
FIM 15: Boiler Replacement
Annual savings are concentrated over the winter months from mid-September through mid-April with a partial
weighting for weather over that time.
FIM 15: Boiler Replacement
Contract Year 2 Energy Cost Avoidance
Month Year Thermal Savings Total Cost
$ Savings MMBTU Cost $
November 2012 15 $215 $215
December 2012 16 $227 $227
January 2013 16 $237 $237
February 2013 16 $232 $232
March 2013 14 $207 $207
April 2013 4 $64 $64
May 2013 0 $0 $0
June 2013 0 $0 $0
July 2013 0 $0 $0
August 2013 0 $0 $0
September 2013 1 $19 $19
October 2013 7 $99 $99
Contract Year 2 89 $1,300 $1,300
$0
$50
$100
$150
$200
$250
2012
Nov
2012
Dec
2013
Jan
2013
Feb
2013
Mar
2013
Apr
2013
May
2013
Jun
2013
Jul
2013
Aug
2013
Sep
2013
Oct
Co
st S
av
ing
s ($
)
FIM 15- Boiler Replacement Savings
Thermal Savings
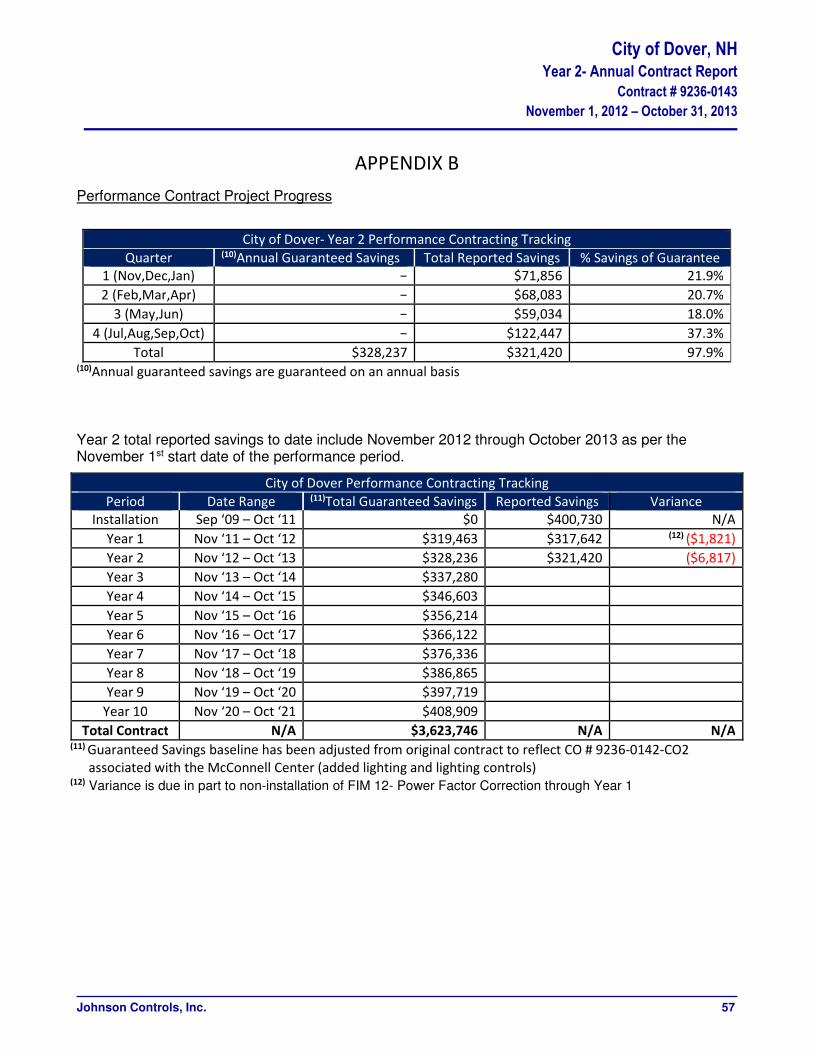
City of Dover, NH Year 2- Annual Contract Report
Contract # 9236-0143
November 1, 2012 – October 31, 2013
APPENDIX B
Johnson Controls, Inc. 57
Performance Contract Project Progress
City of Dover- Year 2 Performance Contracting Tracking
Quarter (10)Annual Guaranteed Savings Total Reported Savings % Savings of Guarantee
1 (Nov,Dec,Jan) − $71,856 21.9%
2 (Feb,Mar,Apr) − $68,083 20.7%
3 (May,Jun) − $59,034 18.0%
4 (Jul,Aug,Sep,Oct) − $122,447 37.3%
Total $328,237 $321,420 97.9% (10)Annual guaranteed savings are guaranteed on an annual basis
Year 2 total reported savings to date include November 2012 through October 2013 as per the November 1st start date of the performance period.
City of Dover Performance Contracting Tracking
Period Date Range (11)Total Guaranteed Savings Reported Savings Variance
Installation Sep ‘09 – Oct ‘11 $0 $400,730 N/A
Year 1 Nov ‘11 – Oct ‘12 $319,463 $317,642 (12) ($1,821)
Year 2 Nov ‘12 – Oct ‘13 $328,236 $321,420 ($6,817)
Year 3 Nov ‘13 – Oct ‘14 $337,280
Year 4 Nov ‘14 – Oct ‘15 $346,603
Year 5 Nov ‘15 – Oct ‘16 $356,214
Year 6 Nov ‘16 – Oct ‘17 $366,122
Year 7 Nov ‘17 – Oct ‘18 $376,336
Year 8 Nov ‘18 – Oct ‘19 $386,865
Year 9 Nov ‘19 – Oct ‘20 $397,719
Year 10 Nov ‘20 – Oct ‘21 $408,909
Total Contract N/A $3,623,746 N/A N/A (11) Guaranteed Savings baseline has been adjusted from original contract to reflect CO # 9236-0142-CO2
associated with the McConnell Center (added lighting and lighting controls) (12) Variance is due in part to non-installation of FIM 12- Power Factor Correction through Year 1

City of Dover, NH Year 2- Annual Contract Report
Contract # 9236-0143
November 1, 2012 – October 31, 2013
APPENDIX B
Johnson Controls, Inc. 58
Weather Degree Days
Weather data obtained from Skyhaven Airport Weather Station, Rochester, NH for Base 65°F.
Rochester, NH Weather Heating Degree Days (Base 65°F)
Report Period FY 2008 FY 2009 FY 2010 FY 2011 FY 2012 FY 2013 FY 2014
July 16.5 0.0 41.5 8.5 0.0 0.0 2.5
August 46.0 23.0 29.0 14.0 3.5 2.5 10.0
September 145.5 160.5 181.0 109.0 102.0 189.0 174.0
October 344.0 521.5 555.0 480.0 427.5 380.0 447.0
November 872.5 780.0 643.0 749.0 616.0 804.0 836.0
December 1,224.5 1,133.0 1,166.0 1,130.5 983.5 1,021.5 1,215.0
January 1,196.5 1,456.0 1,251.5 1,350.5 1,094.0 1,229.0 1,343.0
February 1,109.5 1,064.5 968.5 1,141.5 981.5 1,043.0 1,168.0
March 1,032.5 960.5 752.5 965.5 688.0 931.0 1,167.5
April 550.5 529.0 445.0 552.5 502.0 574.5 602.0
May 315.0 272.5 197.5 294.0 223.5 295.5 271.0
June 63.0 108.5 55.5 97.0 106.0 67.0 57.0
The baseline period is highlighted in green, year 1 contract period is yellow, and year 2 contract period in blue.
Future year 3 contract period is in pink.
0
200
400
600
800
1,000
1,200
1,400
1,600
Jul Aug Sep Oct Nov Dec Jan Feb Mar Apr May Jun
HD
D (
65
°F)
Monthly Heating Degree Days
FY 2008
FY 2009
FY 2010
FY 2011
FY 2012
FY 2013
FY 2014

City of Dover, NH Year 2- Annual Contract Report
Contract # 9236-0143
November 1, 2012 – October 31, 2013
APPENDIX B
Johnson Controls, Inc. 59
Rochester, NH Weather Cooling Degree Days (Base 65°F)
Report Period FY 2008 FY 2009 FY 2010 FY 2011 FY 2012 FY 2013 FY 2014
July 148.5 201.5 106.0 273.5 245.0 221.0 257.5
August 151.0 65.5 189.0 166.5 137.5 204.5 114.5
September 51.5 33.5 12.0 84.5 60.5 33.0 54.0
October 4.5 0.0 0.0 2.0 6.0 1.0 1.5
November 0.0 0.0 0.0 0.0 0.0 0.0 0.0
December 0.0 0.0 0.0 0.0 0.0 0.0 0.0
January 0.0 0.0 0.0 0.0 0.0 0.0 0.0
February 0.0 0.0 0.0 0.0 0.0 0.0 0.0
March 0.0 0.0 0.0 0.0 7.5 0.0 0.0
April 0.0 8.0 0.0 3.5 11.0 0.0 0.0
May 4.5 14.5 40.5 1.5 16.0 14.5 3.0
June 79.5 19.0 107.0 77.0 84.0 111.0 77.5
The baseline period is highlighted in green, year 1 contract period is yellow, and year 2 contract period in blue.
Future year 3 contract period is in pink.
0
50
100
150
200
250
300
Jul Aug Sep Oct Nov Dec Jan Feb Mar Apr May Jun
CD
D (
65
°F)
Monthly Cooling Degree Days
FY 2008
FY 2009
FY 2010
FY 2011
FY 2012
FY 2013
FY 2014

City of Dover, NH Year 2- Annual Contract Report
Contract # 9236-0143
November 1, 2012 – October 31, 2013
APPENDIX B
Johnson Controls, Inc. 60
Utility Rate Schedule
Below are the contractual utility rates obtained from Schedule C: Part III of the contract. The rates below are the contractual rate escalated by the contractual 3% per year. The above rates have been escalated by 3% for the second guarantee year as per the contract.
Rate Summary Table
Contract Year 2 Rates
City of Dover, NH Electric Natural Gas Oil Propane Water Sewer
Building Location $/kW $/kWh $/Therm $/Therm $/Therm $/HCF $/HCF
Indoor Pool $9.08 $0.108 $1.481 - -
$3.86 $4.65
Dover Ice Arena $7.30 $0.109 $1.302 - -
Waste Water Treatment Facility $7.24 $0.123 - $1.717 -
Dover City Hall - $0.128 - $1.717 -
Public Works - $0.132 $1.162 - -
McConnell Center $7.31 $0.111 $1.454 - -
Dover Public Library - $0.139 $1.457 - -
Jenny Thompson Pool - $0.130 $1.390 - -
Central Fire Station - $0.129 $1.575 - -
South End Fire Station - $0.132 - - $1.821
Pine Hill Chapel - $0.174 - $1.717 -
Pine Hill Barn - $0.206 - $1.717 -
Veterans Hall - $1.700 $1.857 - -
Dover Train Station - $0.126 $1.971 - -
Note: Unblended cost if demand charges are available, if not blended cost
******These rates are used to cover all months between November 2012 – October 2013****** The above contract rates for Oil and Propane are listed in $/Therm. The below conversions are provided for both to give the rates in $/Gallon: Oil rate at $1.717 per Therm = $2.387 per Gallon Propane rate at $1.821 per Therm = $1.668 per Gallon

City of Dover, NH Year 2- Annual Contract Report
Contract # 9236-0143
November 1, 2012 – October 31, 2013
APPENDIX B
Johnson Controls, Inc. 61
Glossary
Actual Utility Usage (FIM 11)- Amount of electricity or natural gas used; Obtained from invoices received
through utility companies
Baseline- The adjusted pre-retrofit bills (usually one year) used to compare to the post-retrofit energy usage in
order to provide a basis for calculating savings; can be adjusted for variables such as weather, hours, etc.
Construction Period- The period between the commencement date and the first day of the month following
the date of Substantial Completion
Contract Savings- Savings obtained over the course of the contract, in this case from the start of Year 1
Contract (Guarantee) Year Savings- Savings occurring over the course of a contract year; this contract’s year
runs from November through October
Cost Avoidance- Dollars that would have been spent if the energy conservation measures had not been
installed.
Degree Day- A unit of measurement equal to a difference of one degree between the mean outdoor
temperature on a certain day and a reference temperature (can be summed monthly or yearly). For
example, a daily outdoor average temperature of 30°F would be 35 Heating Degree Days with a base
temperature of 65°F.
FIM- Facility improvement measure, sometimes referred to as energy conservation measure (ECM)
Fiscal Year Savings- Savings occurring over the course of a fiscal year; Dover’s runs from July through June
Guarantee Period- The period of time typically after the date of Substantial Completion. This period starts the
reporting and monitoring of the performance contract.
Guaranteed Savings- The amount of savings guaranteed to be achieved.
Installation Savings- FIMs installed during the construction period and being of beneficial use prior to the date
of Substantial Completion are monitored to determine savings.
Savings to Date- Savings obtained through a portion of a period
Substantial Completion- Sufficient materials and services have been provided to permit the intended benefit
from the work. This term can apply to individual measures and the overall project.
Target Savings- Savings figures estimated to be achieved, determined by calculations and measurements

City of Dover, NH Year 2- Annual Contract Report
Contract # 9236-0143
November 1, 2012 – October 31, 2013
APPENDIX C
Johnson Controls, Inc. 62
FIM 1- Lighting: Formulas & Calculations Used
LightingkWSavings 7�FixtureWattage9:"– RetrofitFixtureWattage9=>$� LightingkWhSavings 7�LightingkWSavingsxHoursofOperation� kWhCoolingSavings9":@=A CDD9":@=ACDDBCCDEF �kWhCoolingSavingsBCCDEF MMBtuHeatingLosses9":@=A HDD9":@=AHDDBCCDEF �MMBtuHeatingLossesBCCDEF
FIM 2- Lighting Controls: Formulas & Calculations Used
LightingControlskWhSavings 7 RetrofitFixtureWattage9=>$��LightingRuntime9:" H HoursofOccupancy�
FIM 3- Weatherization: Formulas & Calculations Used
Spreadsheet based- General Formulas used include:
CFMICJ@F$:E$@=CKWinterL WindSpeed�AreaofCracks�%AreaHeated�%WindwardDiversity
CFMICJ@F$:E$@=CKSummerL WindSpeed�AreaofCracks�%AreawithAC�%WindwardDiversity
ExistingBtuSaved344D#@"A 1.08�CFMICJ@F$:E$@=C�∆T�BinHours344D#@"A
ExistingBtuSavedQC=44D#@"A 1.08�CFMICJ@F$:E$@=C�∆T�BinHoursQC=44D#@"A
kWhSaved CoolingBtuSaved�1212,000 BtuTon �EER
MMBtuSaved HeatingBtuSaved1x10S BtuMMBtu�BoilerEfficiency�%�

City of Dover, NH Year 2- Annual Contract Report
Contract # 9236-0143
November 1, 2012 – October 31, 2013
APPENDIX C
Johnson Controls, Inc. 63
FIM 4.1- EMS Building Controls: Formulas & Calculations Used
Spreadsheet based- General Formulas used include:
CoolingkWh �EnvelopeLoad � InfiltrationLoad�� 1x10SBtuMMBtu �Cooling kWTon12,000 TonsBtuHr
HeatingMMBtu �EnvelopeLoad � InfiltrationLoad�BoilerEfficiency�%�
EnvelopeLoad 1Rvalue �ExposedArea1x10S x T7UAirTemp3D$A==: H Setpoint344D#@"AV�OccupiedHours�7UAirTemp3D$A==: H SetpointQC=44D#@"AV�UnoccupiedHoursX
InfiltrationLoad 1.08�InfiltrationCFM1x10S x T7UAirTemp3D$A==: H Setpoint344D#@"AV�OccupiedHours�7UAirTemp3D$A==: H SetpointQC=44D#@"AV�UnoccupiedHoursX
FIM 4.2- EMS Building Controls/ Optimal Start: Formulas & Calculations Used
Spreadsheet based- General Formulas used include:
BaselineMMBtu 1.08xCFMx%SpeedatWarmupx�AirTemp3D$A==: H AirTempY==Z�xWarmupHours ProposedMMBtu EnvelopeLoad � InfiltrationLoad1x10S xWarmupHoursMorningRunHours
WarmupHours HoursbeforeOccupancyUnitVentilatorsTurnedtoOccupiedMode
MMBtuSavings BaselineMMBtu H ProposeMMBtuBoilerEfficiency�%�

City of Dover, NH Year 2- Annual Contract Report
Contract # 9236-0143
November 1, 2012 – October 31, 2013
APPENDIX C
Johnson Controls, Inc. 64
FIM 4.3-AHU Upgrade / VFD on Fan: Formulas & Calculations Used
Spreadsheet based- General Formulas used include:
CoolingkWh =]SensibleCooling ^BtuHr _ + LatentCooling ^BtuHr _` �Cooling kWTon �BinHours
12,000 TonsBtuHr
SensibleCooling aBtuHr b = 1.08xCFMc@d"AB@:x(Tempc@d"AB@: − Tempe==F@Cfe=@F)
LatentCooling aBtuHr b = 0.68xCFMc@d"AB@:x(RelativeHumidityc@d"AB@: − RHSetpointg@>4hE:f"B@:)
HeatingMMBtu = Preheat ^BtuHr _ + Reheat ^BtuHr _1x10SBoilerEfficiency(%) �BinHours
Preheat aBtuHr b = 1.08xCFMc@d"AB@:x(Temp9:"h"E$e=@F − Tempc@d"AB@:)
Reheat aBtuHr b [CoolingSeason] = 1.08xCFMc@d"AB@:x(Tempg@>4hE:f"B@:;!DZZ": − Tempe==F@Cfe=@F)
Reheat aBtuHr b [HeatingSeason]= 1.08xCFMc@d"AB@:x[Tempg@>4hE:f"B@:;j@C$": −Max(Temp9:"h"E$e=@F, Tempc@d"AB@:)] CFMc@d"AB@: = CFMk=$EF!D##Fl�%FanSpeed
Tempc@d"AB@: = CFM3D$>@A"B@:CFMc@d"AB@: �Temp3D$>@A"B@: +CFMY"$D:CB@:CFMc@d"AB@: �TempY"$D:CB@:
RelativeHumidityc@d"AB@: = CFM3D$>@A"B@:CFMc@d"AB@: �RH3D$>@A"B@: +CFMY"$D:CB@:CFMc@d"AB@: �RHY"$D:CB@:

City of Dover, NH Year 2- Annual Contract Report
Contract # 9236-0143
November 1, 2012 – October 31, 2013
APPENDIX C
Johnson Controls, Inc. 65
FIM 4.4- Pool Dehumidification: Formulas & Calculations Used
Spreadsheet based-
See DEA Appendix for Calculations
FIM 4.5- Snow Melt Sensor: Formulas & Calculations Used
Spreadsheet based-
See DEA Appendix for Calculations
FIM 6- Water Conservation: Formulas & Calculations Used
WaterSavings = 7(FixtureWaterFlow9:"–RetrofitFixtureWaterFlow9=>$) WaterCostSavings = 7(WaterSavings)�FixtureUsage

City of Dover, NH Year 2- Annual Contract Report
Contract # 9236-0143
November 1, 2012 – October 31, 2013
APPENDIX C
Johnson Controls, Inc. 66
FIM 9- Vending Controls: Formulas & Calculations Used
ElectricSavings 7�EnergyUsage9:"–EnergyUsage9=>$� EnergyUsage 7�LightingkWh � CompressorkWh� Lighting9:"kWh 7�LightingkW�HoursperDay�DaysperYear� Lighting9=>$kWh 7LightingkW��Hours344D#@"A ��HoursQC=44D#@"A�NightDutyCycle�� CompressorHours9=>$ 7�Hours344D#@"A�ExistingDutyCycle� ��HoursQC=44D#@"A�NightDutyCycle�
Compressor9:"kWh 7oVolts�Amps�80%P. F.1,000W1kW H LightingkWp� Hours9:"Year �DutyCycle
Compressor9=>$kWh 7oVolts�Amps�80%P. F.1,000W1kW H LightingkWp� CompressorHours9=>$Year
FIM 10- Pool Cover: Formulas & Calculations Used
Spreadsheet based-
See DEA Appendix for Calculations
FIM 11- Ice Arena Upgrades: Formulas & Calculations Used
Savings based on Utility Invoices & Metrix Meter Tuning Contracts contained in previous sections of this
report.

City of Dover, NH Year 2- Annual Contract Report
Contract # 9236-0143
November 1, 2012 – October 31, 2013
APPENDIX C
Johnson Controls, Inc. 67
FIM 12- Power Factor: Formulas & Calculations Used
ElectrickWhSavings = ∑(kW9:"– kW9=>$) �rstuvwxyz{
kW = √}y~{x����u{��w�{�}��xz�~�u�z1,000�~uu{��
PowerFactorPenaltykW������� = kW������� − kW����
FIM 13- Transformers: Formulas & Calculations Used
ElectricSavings = 7(TransformerLosses9:"– TransformerLosses9=>$)
TransformerLosses = 7[kVA�Load�LoadFactor�( 1%Efficiency– 1)]
FIM 14- Aeration Blowers: Formulas & Calculations Used
ElectricSavings = kWhUse9:" − kWhUse9=>$
kWhUse = VoltagexAmperagexPFx√31,000WkW
�Hours
FIM 15- Boiler Replacement: Formulas & Calculations Used
FuelSavings = FuelUsagex FueltoHeatEfficicency9:"FueltoHeatEfficicency9=>$
FueltoHeatEfficicency(%) = CombustionEfficiency�(1 − RadiantJacketLosses)�(1 − DistributionLosses)