city of boulder water resources advisory board … · august 19. a city council study session on...
TRANSCRIPT

CITY OF BOULDER
WATER RESOURCES ADVISORY BOARD AGENDA ITEM
MEETING DATE: July 15, 2019
AGENDA TITLE: Public hearing and consideration of a recommendation regarding the 2020 Utilities (Water, Wastewater and Stormwater/ Flood Management) 6-year Capital Improvement Program (CIP) and associated rate increases.
PRESENTERS: Jeff Arthur, Director of Public Works for Utilities Ken Baird, Utilities Financial Manager Pieter Beyer – Engineering Services Manager
EXECUTIVE SUMMARY: As part of the city’s annual budget process, Utilities staff develops a six-year planning budget, this year for the time period of 2020 through 2025. The Water Resources Advisory Board (WRAB) role in this process is defined in the Boulder Revised Code: “. . . to review all environmental assessments and capital improvements conducted or proposed by the utilities division.” Utilities staff has formulated revenue and expenditure projections for each of the three utility funds through the year 2025. Within the budget process council approves and appropriates funds only for the first year, 2020.
At the June 17, 2019 WRAB meeting, staff presented the preliminary six-year capital improvement program with associated rate increases, and project and financial information is available in that agenda item. The attached fund financials and CIP spreadsheets (Attachment A – Water Utility, Attachment B – Wastewater Utility, Attachment C -Stormwater / Flood Management Utility – Scenario 1 and Attachment D -Stormwater / Flood Management Utility – Scenario 2) reflect the proposed funding plan and CIP. The CIP spreadsheets are the same as those presented on the June WRAB meeting with the exception of the following adjustment. A portion of the funding for the Meter Replacement project has been moved from the Water Fund to the Wastewater Fund to reflect the benefit of meter replacement in the wastewater utility.
Staff requests a recommendation from the WRAB concerning the 6-year Capital Improvement Program (CIP) and associated rate increases. Staff will submit the CIP to the Planning Board which will meet to discuss the citywide CIP and make a recommendation to City Council on August 19. A City Council study session on the city-wide budget, including the CIP, is scheduled for September 10. City Council is scheduled to hold first and second readings on adoption of the budget on October 1 and October 15 respectively.
07.15.2019 WRAB Agenda 4 - Capital Improvements Program Page 1 of 22
STAFF RECOMMENDATION: Staff recommends that WRAB make the following motion related to the 2020-2025 CIP: The Water Resources Advisory Board recommends approval of the 2020-2025 CIP for the Water, Wastewater, and Flood/Stormwater Utilities including proposed rate adjustments to support 2020 revenue increases of 7% in the water utility, 5% in the wastewater utility, and 5% in the stormwater and flood management utility. FISCAL IMPACTS: The following percentage increases in additional revenue from the monthly utility rates and fees were previously recommended by Utilities staff for 2020 to fund the preliminary Utilities budget and capital improvements program. These increases are consistent with projections provided during the budget process in 2018.
Water 7% Wastewater 5% Stormwater/ Flood Management 5%
The above rate increases are one option for consideration. Another rate option for the Stormwater/Flood Management increase was suggested by the city Executive Budget Team (EBT). The City Manager is responsible for making the annual budget proposal to City Council and convenes an EBT of executive and financial staff to advise on the recommended budget. The Stormwater/Flood fund financial anticipates a rate increase of 15% in 2022 but has 5% increases in the years before and after 2022. The EBT suggested providing a rate increase model to smooth out the rate spike in 2022 by increasing the rates in the other years. For WRAB’s consideration, an alternative rate increase scenario is included below that will decrease the rate change in 2022, and increase the change for the other years, including 2020. While staff has not changed the recommended motion in this memorandum due to this change not being previously discussed with the WRAB, WRAB could modify the draft motion to reflect this change or make a second motion regarding alternative scenario. BOARD FEEDBACK: The preliminary 2020-2025 CIP was presented to the WRAB on May 20 and June 17, 2019. The Board provided comments as documented in the meeting minutes and generally included discussion of key projects and rate impacts, and suggestions regarding communication related to rate increases. Further information is provided below in the analysis section in response to specific board questions. PUBLIC FEEDBACK: During the May WRAB meeting, a member of the public provided information regarding historical rate increases to historical cost of living data. At the June WRAB meeting, a member
07.15.2019 WRAB Agenda 4 - Capital Improvements Program Page 2 of 22
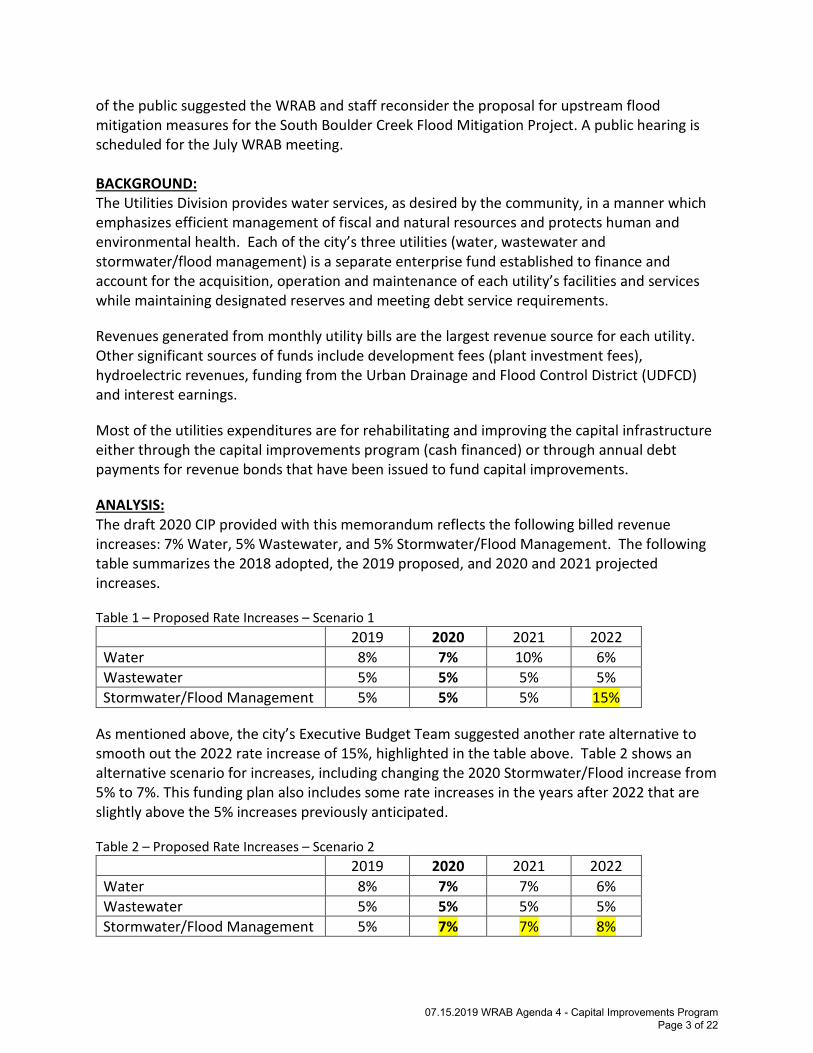
of the public suggested the WRAB and staff reconsider the proposal for upstream flood mitigation measures for the South Boulder Creek Flood Mitigation Project. A public hearing is scheduled for the July WRAB meeting. BACKGROUND: The Utilities Division provides water services, as desired by the community, in a manner which emphasizes efficient management of fiscal and natural resources and protects human and environmental health. Each of the city’s three utilities (water, wastewater and stormwater/flood management) is a separate enterprise fund established to finance and account for the acquisition, operation and maintenance of each utility’s facilities and services while maintaining designated reserves and meeting debt service requirements. Revenues generated from monthly utility bills are the largest revenue source for each utility. Other significant sources of funds include development fees (plant investment fees), hydroelectric revenues, funding from the Urban Drainage and Flood Control District (UDFCD) and interest earnings. Most of the utilities expenditures are for rehabilitating and improving the capital infrastructure either through the capital improvements program (cash financed) or through annual debt payments for revenue bonds that have been issued to fund capital improvements. ANALYSIS: The draft 2020 CIP provided with this memorandum reflects the following billed revenue increases: 7% Water, 5% Wastewater, and 5% Stormwater/Flood Management. The following table summarizes the 2018 adopted, the 2019 proposed, and 2020 and 2021 projected increases. Table 1 – Proposed Rate Increases – Scenario 1
2019 2020 2021 2022 Water 8% 7% 10% 6% Wastewater 5% 5% 5% 5% Stormwater/Flood Management 5% 5% 5% 15%
As mentioned above, the city’s Executive Budget Team suggested another rate alternative to smooth out the 2022 rate increase of 15%, highlighted in the table above. Table 2 shows an alternative scenario for increases, including changing the 2020 Stormwater/Flood increase from 5% to 7%. This funding plan also includes some rate increases in the years after 2022 that are slightly above the 5% increases previously anticipated. Table 2 – Proposed Rate Increases – Scenario 2
2019 2020 2021 2022 Water 8% 7% 7% 6% Wastewater 5% 5% 5% 5% Stormwater/Flood Management 5% 7% 7% 8%
07.15.2019 WRAB Agenda 4 - Capital Improvements Program Page 3 of 22

The impact of a 1% budget increase on required revenue varies substantially across the three funds: Table 3 – 1% Increase Rate Impact
Water $310,000 Wastewater $220,000 Stormwater / Flood Mgmt $120,000
As a point of reference, $100,000 provides for debt service coverage on a bond of approximately $1,000,000. Single Family Residential Customer Bill Impact The proposed preliminary 2019 revenue increases for Scenario 1 (7%-5%-5%) would increase a typical residential customer’s average monthly utility bill by $5.33 or an increase of $63.96 annually. Table 4 provides a breakdown of the potential increases by utility. This monthly bill assumes a ¾” water meter and an average monthly consumption of 7,000 gallons. Table 5 shows the impact of a 7% increase in the Stormwater/Flood fee instead of 5%. Table 4 – Sample Residential Monthly Bill Impacts – Scenario 1
Monthly Bill 2019 Rates
Monthly Bill 2020 Rates
Monthly Difference
Water $38.99 $41.72 $2.73 Wastewater $35.67 $37.45 $1.78 Stormwater/ Flood Mgmt $16.39 $17.21 $0.82 Total $91.05 $96.38 $5.33
Table 5 – Sample Residential Monthly Bill Impacts – Scenario 2
Monthly Bill 2019 Rates
Monthly Bill 2020 Rates
Monthly Difference
Water $38.99 $41.72 $2.73 Wastewater $35.67 $37.45 $1.78 Stormwater/ Flood Mgmt $16.39 $17.54 $1.15 Total $91.05 $96.71 $5.66
At the June WRAB meeting, a question was asked about bill impacts for other classes of customers. Within the commercial and multi-family classes, utility bills vary much more than in the single-family customers classes. City staff is available to help estimate for individual customers in these classes what the impact of rate increases would be on their account. The following tables provide some different types of commercial and multi-family example customers with estimated rate change impacts.
07.15.2019 WRAB Agenda 4 - Capital Improvements Program Page 4 of 22

Table 6 – Sample Commercial Monthly Bill Impacts Monthly Bill 2019 Rates
Monthly Bill 2020 Rates - Scenario 1
Monthly Bill 2020 Rates - Scenario 2
Grocery Store $7,995 $8,442 $8,488 Pearl Street Retailer $196 $207 $207 Large Format Retailer $4,689 $4,949 $4,993 Hotel $5,162 $5,461 $5,472 Downtown Brewpub $845 $891 $892 Hospital $12,263 $12,960 $12,977
Table 7 – Sample Multi-Family Monthly Bill Impacts
Monthly Bill 2019 Rates
Monthly Bill 2020 Rates - Scenario 1
Monthly Bill 2020 Rates - Scenario 2
Duplex $144 $152 $153 Mid-Size Apartment Complex $4,282 $4,495 $4,528 Mobile Home Park $16,731 $17,600 $17,715
Another area of discussion during the June WRAB meeting was related to impacts to the single-family residential customer class by lowering the indoor monthly water budget by 1,000 gallons. Further analysis will be provided at the July WRAB presentation regarding how many customers fall in the different blocks. The following table is provided to help clarify the thresholds of when customer usage is charged in these blocks.
Table 8 – Water Budget Block Rate Structure Rate
Calculation Rate per 1,000
Gallons Block Size Block 1 3/4 Base Rate $3.41 Water usage up to 60% of monthly water budget
Block 2 Base Rate $4.55 Water usage between 61-100% of monthly water budget
Block 3 2 x Base Rate $9.10 Water usage over monthly water budget up to 150% of monthly water budget
Block 4 3 x Base Rate $13.64 Water usage between 150-200% of monthly water budget
Block 5 5 x Base Rate $22.74 Water usage over 200% monthly water budget
CIP Prioritization
Utilities staff utilizes a comprehensive approach to address prioritization for projects and annual programs across the three Utility funds. The Utilities are funded by three enterprise funds that are specifically dedicated to the Water, Wastewater, and Stormwater/Flood Management utilities. While there is coordination across the three enterprises to support efficiency, prioritization is primarily within the individual funds to ensure the regulatory compliance and reliability of the respective systems. For example a regulatory compliance
07.15.2019 WRAB Agenda 4 - Capital Improvements Program Page 5 of 22

project in the wastewater fund would not clearly be a higher or lower priority than a regulatory compliance project in the water fund. Within each utility several master plans have been developed to serve as the overarching guiding documents for the identification of system needs and prioritization of resources. The master plans serve as the primary source for the various utility CIP planning processes, with revisions to the prioritizations being made if newer more relevant information has emerged that would supersede the prioritization processes in the master plans. Examples of information that has caused a reprioritization of projects in the past has included items such as updated structural condition assessments, new system operational data, or the passage of more stringent regulations. The master plans all fall under the umbrella of the Boulder Valley Comprehensive Plan (BVCP) which provides a baseline data set for key assumptions that should be common across the various utilities, and also defines levels of service that should be achieved by the various utility systems. An example of the common data provided in the BVCP is the population growth projections and the geographic location of that growth, and an example of a level of service definition is the goal that flood mitigation projects should mitigate to the 100 year flood where possible. Using this core data and the levels of service goals the Utilities division has developed infrastructure system specific master plans that focus on various components the utility systems. This division of master plans is influenced by the technologies that are used for the planning process. Hydraulic modeling efforts for example lead to master plans that guide the identification of projects in the piped systems, whereas treatment process analysis and regulatory considerations guide the master planning of treatment facilities. The result of this is the below comprehensive set of master plans that accounts for the needs of all utility systems.
• Water supply - Source Water Master Plan • Water treatment and water distribution system – Treated Water Master Plan • Water quality program – Water Quality Strategic Plan • Major Flood and Drainageways – Comprehensive Flood and Stormwater Utility Master
Plan and individual drainageway Flood Mitigation Studies • Stormwater collection system – Stormwater Master Plan • Wastewater collection system – Wastewater Collection System Master Plan • Wastewater Treatment - Wastewater Treatment Plant Master Plan
The projects and prioritizations provided by each of these master plans is then aggregated within each utility to provide an overall set of recommendations per enterprise utility. From this point financial analysis is performed to determine the affordability of these recommended projects and identify what level of additional funding would be required to advance all projects. Upon review of this financial analysis Utilities staff performs an in-depth review of the projects to determine what projects can be deferred to reduce the impacts on the enterprise funding
07.15.2019 WRAB Agenda 4 - Capital Improvements Program Page 6 of 22
structure. The key considerations that are reviewed to make this determination are whether a deferral of the project would result in critical scenarios such as:
• A likely failure of an asset or system that would cause a loss of service or non-attainment ofservice level goals.
• A violation of existing regulatory standards.• Non-attainment of upcoming regulatory standards.• A loss of system redundancy that would increase the risk of system failures.• Missing the opportunity to leverage utilities funds by partnering required improvements with
other City projects.
The results of this review are then used to populate the recommended CIP and rate increases.
The city’s water and wastewater utilities are largely built out systems. As a result, capital projects prioritize asset management and regulatory compliance which lend themselves well to technical analysis. The stormwater and flood management utility is a much newer utility and faces different challenges. Much of the city was built prior to modern drainage and flood management standards. There are large areas of the city identified as having flood risk during major precipitation events as well as areas with no infrastructure to manage even minor events. The risks across different drainageways and neighborhoods are comparable enough from a statistical perspective that additional considerations are needed to effectively prioritize limited resources.
The planning for and design of flood mitigation projects consequently also requires extensive public outreach and a very thorough analysis of the relative impacts and benefits of various mitigation strategies. The Comprehensive Flood and Stormwater Master Plan (CFS) that was completed in 2004 provided a project planning framework that acknowledged this challenge and provided guiding principles and best practices for flood mitigation improvements. The implementation of this framework has resulted in robust mitigation planning and alternatives analyses that incorporate many considerations such as the below list of criteria from the recent Twomile Canyon Creek/Upper Goose Creek mitigation study:
• Life Safety• Property Damage Mitigation• Water Quality Enhancement• Habitat Protection and Restoration• Operation/Maintenance Costs• Protection of Cultural Resources• Recreation Opportunities• Alternative Transportation Routes• Construction Costs• Public Input/Community Acceptance• Resiliency/Adaptability to Climate Change and Uncertainty• Ability to Implement Quickly
07.15.2019 WRAB Agenda 4 - Capital Improvements Program Page 7 of 22
Since the inception of the stormwater and flood management utility the City has used frameworks such as this to guide the planning and implementation of improvements to the major drainageway network. The result of these improvements is that several sections of the major drainageways in the City are now capable of managing impacts from a 100 year flood event. Mitigation master plans have also been completed for most major drainageways. The exception to this are the King’s Gulch/Bluebell Creek/Skunk Creek drainage and the Twomile Canyon Creek/Upper Goose Creek drainage whose master plans are currently under development, the Sunshine Canyon Creek mapping and mitigation study which will be led by the Urban Drainage and Flood Control District, and the Boulder Slough whose mapping and mitigation will follow at a later date.
As mitigation master plans are completed for individual drainageways it provides the opportunity to prioritize the resulting recommendations not only within the drainageways but also relative to each other. Completion of these last remaining mitigation master plans will be a significant milestone in this process because it will for the first time allow the City to formally prioritize a comprehensive list of flood mitigation needs across all drainageways in a holistic manner.
The current 6 year CIP includes the below list of flood mitigation studies and projects that have been identified via the aforementioned master plans and CFS framework.
• South Boulder Creek ($ 43M)• Bluebell Canyon ($ 500k)• Fourmile Canyon Creek ($ 200k)• Gregory Canyon Creek ($9 M)• Upper Goose Creek ($25M)
While these projects did not receive the benefit of being prioritized against the mitigation master plans that are still in progress they nonetheless were identified as high priorities in their respective drainageway master plans and using the planning framework defined in the CFS. It is not anticipated that future prioritizations would result in the removal of these projects as high priority recommended improvements. The sequencing and prioritization of these projects has also been coordinated to leverage the utility’s limited funding with capital projects being performed by other departments, and to be responsive to feedback by the public on specific drainageways.
07.15.2019 WRAB Agenda 4 - Capital Improvements Program Page 8 of 22

NEXT STEPS: The current schedule of major budget milestones is provided below. Elements involving the WRAB are highlighted in bold italics. Milestone Date WRAB Recommendation on CIP/Rates July 15, 2019 Planning Board CIP Hearing Aug 15, 2019 City Council Study Session on Budget Sept. 10, 2019 City Council Consideration/Adoption of Budget Oct. 1 and Oct. 15, 2019 Attachments: A: Water - Fund Financial and Capital Improvement Program B: Wastewater - Fund Financial and Capital Improvement Program C: Stormwater/ Flood Management - Fund Financial and Capital Improvement Program – Scenario 1 D: Stormwater/ Flood Management - Fund Financial and Capital Improvement Program – Scenario 2
07.15.2019 WRAB Agenda 4 - Capital Improvements Program Page 9 of 22
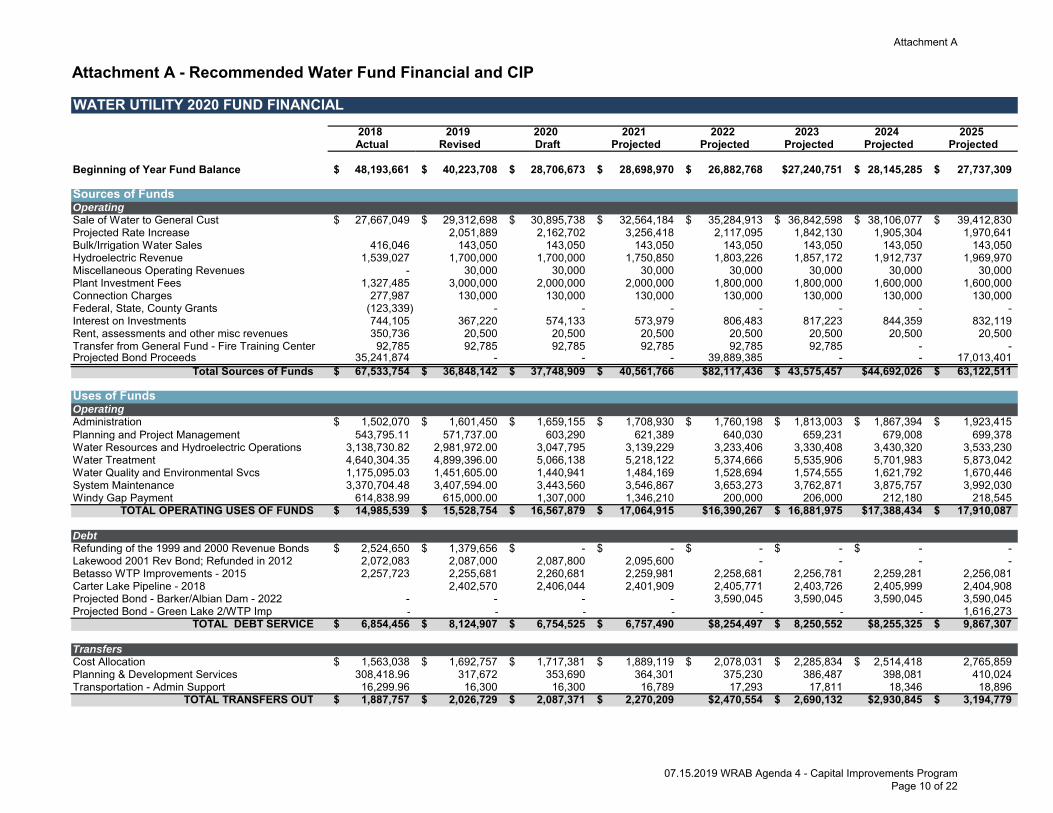
Attachment A - Recommended Water Fund Financial and CIP
WATER UTILITY 2020 FUND FINANCIAL2018 2019 2020 2021 2022 2023 2024 2025Actual Revised Draft Projected Projected Projected Projected Projected
Beginning of Year Fund Balance 48,193,661$ 40,223,708$ 28,706,673$ 28,698,970$ 26,882,768$ $27,240,751 28,145,285$ 27,737,309$
Sources of FundsOperating 8.0% 7.0% 7.0% 10.0% 6.0% 5.0% 5.0%Sale of Water to General Cust 27,667,049$ 29,312,698$ 30,895,738$ 32,564,184$ 35,284,913$ 36,842,598$ 38,106,077$ 39,412,830$ Projected Rate Increase 2,051,889 2,162,702 3,256,418 2,117,095 1,842,130 1,905,304 1,970,641 Bulk/Irrigation Water Sales 416,046 143,050 143,050 143,050 143,050 143,050 143,050 143,050 Hydroelectric Revenue 1,539,027 1,700,000 1,700,000 1,750,850 1,803,226 1,857,172 1,912,737 1,969,970 Miscellaneous Operating Revenues - 30,000 30,000 30,000 30,000 30,000 30,000 30,000Plant Investment Fees 1,327,485 3,000,000 2,000,000 2,000,000 1,800,000 1,800,000 1,600,000 1,600,000 Connection Charges 277,987 130,000 130,000 130,000 130,000 130,000 130,000 130,000 Federal, State, County Grants (123,339) - - - - - - - Interest on Investments 744,105 367,220 574,133 573,979 806,483 817,223 844,359 832,119 Rent, assessments and other misc revenues 350,736 20,500 20,500 20,500 20,500 20,500 20,500 20,500Transfer from General Fund - Fire Training Center 92,785 92,785 92,785 92,785 92,785 92,785 - - Projected Bond Proceeds 35,241,874 - - - 39,889,385 - - 17,013,401
Total Sources of Funds 67,533,754$ 36,848,142$ 37,748,909$ 40,561,766$ $82,117,436 43,575,457$ $44,692,026 63,122,511$
Uses of FundsOperatingAdministration 1,502,070$ 1,601,450$ 1,659,155$ 1,708,930$ 1,760,198$ 1,813,003$ 1,867,394$ 1,923,415$ Planning and Project Management 543,795.11 571,737.00 603,290 621,389 640,030 659,231 679,008 699,378 Water Resources and Hydroelectric Operations 3,138,730.82 2,981,972.00 3,047,795 3,139,229 3,233,406 3,330,408 3,430,320 3,533,230 Water Treatment 4,640,304.35 4,899,396.00 5,066,138 5,218,122 5,374,666 5,535,906 5,701,983 5,873,042 Water Quality and Environmental Svcs 1,175,095.03 1,451,605.00 1,440,941 1,484,169 1,528,694 1,574,555 1,621,792 1,670,446 System Maintenance 3,370,704.48 3,407,594.00 3,443,560 3,546,867 3,653,273 3,762,871 3,875,757 3,992,030 Windy Gap Payment 614,838.99 615,000.00 1,307,000 1,346,210 200,000 206,000 212,180 218,545
TOTAL OPERATING USES OF FUNDS 14,985,539$ 15,528,754$ 16,567,879$ 17,064,915$ $16,390,267 16,881,975$ $17,388,434 17,910,087$
DebtRefunding of the 1999 and 2000 Revenue Bonds 2,524,650$ 1,379,656$ -$ -$ -$ -$ -$ - Lakewood 2001 Rev Bond; Refunded in 2012 2,072,083 2,087,000 2,087,800 2,095,600 - - - - Betasso WTP Improvements - 2015 2,257,723 2,255,681 2,260,681 2,259,981 2,258,681 2,256,781 2,259,281 2,256,081 Carter Lake Pipeline - 2018 2,402,570 2,406,044 2,401,909 2,405,771 2,403,726 2,405,999 2,404,908 Projected Bond - Barker/Albian Dam - 2022 - - - - 3,590,045 3,590,045 3,590,045 3,590,045 Projected Bond - Green Lake 2/WTP Imp - - - - - - - 1,616,273
TOTAL DEBT SERVICE 6,854,456$ 8,124,907$ 6,754,525$ 6,757,490$ $8,254,497 8,250,552$ $8,255,325 9,867,307$
TransfersCost Allocation 1,563,038$ 1,692,757$ 1,717,381$ 1,889,119$ 2,078,031$ 2,285,834$ 2,514,418$ 2,765,859 Planning & Development Services 308,418.96 317,672 353,690 364,301 375,230 386,487 398,081 410,024 Transportation - Admin Support 16,299.96 16,300 16,300 16,789 17,293 17,811 18,346 18,896
TOTAL TRANSFERS OUT 1,887,757$ 2,026,729$ 2,087,371$ 2,270,209$ $2,470,554 2,690,132$ $2,930,845 3,194,779$
Attachment A
07.15.2019 WRAB Agenda 4 - Capital Improvements Program Page 10 of 22

Attachment A - Recommended Water Fund Financial and CIP
WATER UTILITY 2020 FUND FINANCIAL2018 2019 2020 2021 2022 2023 2024 2025Actual Revised Draft Projected Projected Projected Projected Projected
CONTINUEDCapital 7,697,731$ 10,189,756$ 12,346,837$ 16,285,354$ 14,754,752$ 14,848,265$ 16,525,399$ 16,344,191$
Projected Bond - Betasso WTP IMP 8,836,291.19 - - - - - - - 2018 Bond - NCWCD Conveyance Line 34,900,000.00 - - - - - - - Projected Bond - Barker&Albian Dam/WTP Imp - - - - 39,489,385 - - - Projected Bond - Green Lake 2/WTP Imp 16,863,401 Projected Bond - Issuance Costs 341,933.72 - - - 400,000 - - 150,000 Encumbrances, Carryover and Adjustments to Base 12,495,031 - - - - - -
Total Uses of Funds 75,503,708$ 48,365,177$ 37,756,612$ 42,377,968$ $81,759,453 42,670,923$ 45,100,002$ 64,329,765$
Ending Fund Balance Before Reserves 40,223,708$ 28,706,673$ 28,698,970$ 26,882,768$ $27,240,751 28,145,285$ $27,737,309 26,530,055$
ReservesBond Reserve 2,081,429$ 2,081,429$ 2,081,429$ 2,081,429$ -$ -$ -$ -$ Lakewood Pipeline Remediation Reserve 16,919,884 17,385,876 17,851,867 15,400,000 15,400,000 15,400,000 15,400,000 15,400,000 Carter Lake Pipeline Reserve 1,530,697 1,530,697 1,530,697 1,530,697 1,530,697 1,530,697 1,530,697 1,530,697 FEMA Deobligation Reserve 87,951 87,951 87,951 87,951 87,951 87,951 87,951 87,951 Sick/Vacation/Bonus Reserve 601,981 620,041 65,040 66,991 69,001 71,071 73,203 75,399 PERA Legislative Contingency - 6,933 - - - - - Pay Period 27 Reserve 286,357 287,303 288,249 289,195 290,141 291,087 292,033 317,033 Operating Reserve 4,218,324 4,388,871 4,663,813 4,833,781 4,715,205 4,893,027 5,079,820 5,276,217 Capital Reserve 2,000,000 2,000,000 2,000,000 2,000,000 2,000,000 2,000,000 2,000,000 2,000,000
Total Reserves 27,726,624$ 28,389,100$ 28,569,045$ 26,290,044$ 24,092,995$ 24,273,833$ 24,463,704$ 24,687,297$
Ending Fund Balance After Reserves 12,497,085$ 317,574$ 129,925$ 592,724$ $3,147,756 3,871,452$ $3,273,605 1,842,759$
Attachment A
07.15.2019 WRAB Agenda 4 - Capital Improvements Program Page 11 of 22
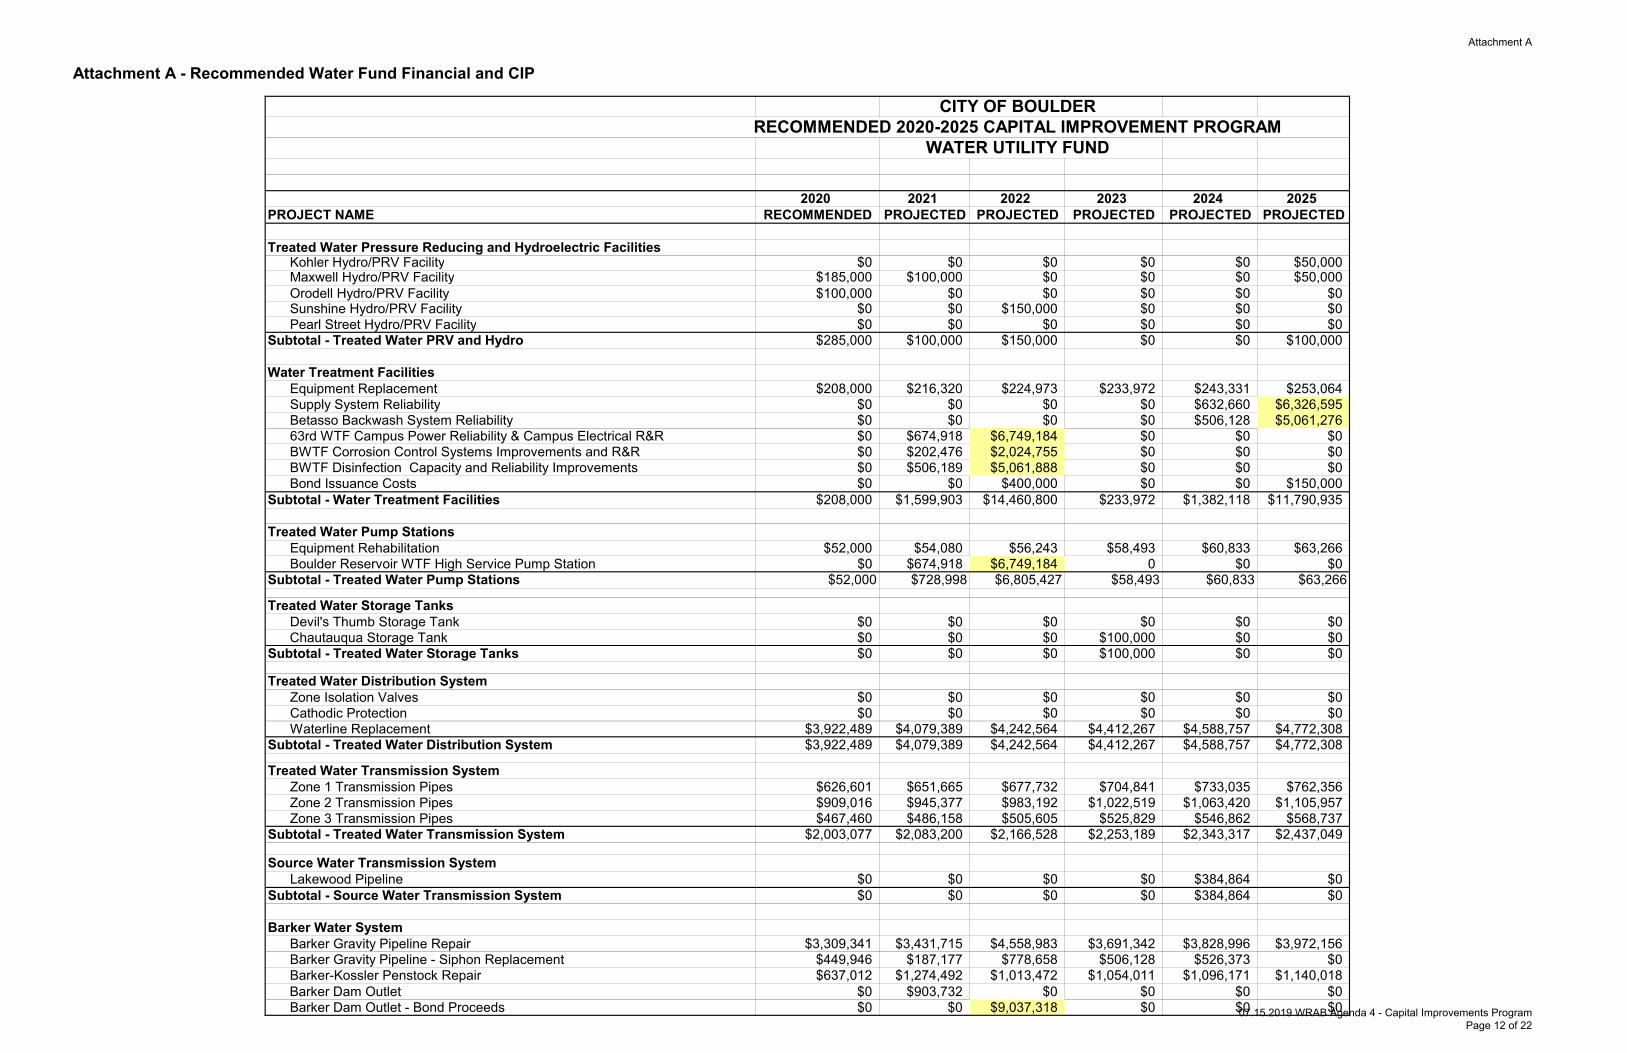
Attachment A - Recommended Water Fund Financial and CIP
CITY OF BOULDERRECOMMENDED 2020-2025 CAPITAL IMPROVEMENT PROGRAM
WATER UTILITY FUND
2020 2021 2022 2023 2024 2025PROJECT NAME RECOMMENDED PROJECTED PROJECTED PROJECTED PROJECTED PROJECTED
Treated Water Pressure Reducing and Hydroelectric Facilities Kohler Hydro/PRV Facility $0 $0 $0 $0 $0 $50,000 Maxwell Hydro/PRV Facility $185,000 $100,000 $0 $0 $0 $50,000 Orodell Hydro/PRV Facility $100,000 $0 $0 $0 $0 $0 Sunshine Hydro/PRV Facility $0 $0 $150,000 $0 $0 $0 Pearl Street Hydro/PRV Facility $0 $0 $0 $0 $0 $0Subtotal - Treated Water PRV and Hydro $285,000 $100,000 $150,000 $0 $0 $100,000
Water Treatment Facilities Equipment Replacement $208,000 $216,320 $224,973 $233,972 $243,331 $253,064 Supply System Reliability $0 $0 $0 $0 $632,660 $6,326,595 Betasso Backwash System Reliability $0 $0 $0 $0 $506,128 $5,061,276 63rd WTF Campus Power Reliability & Campus Electrical R&R $0 $674,918 $6,749,184 $0 $0 $0 BWTF Corrosion Control Systems Improvements and R&R $0 $202,476 $2,024,755 $0 $0 $0 BWTF Disinfection Capacity and Reliability Improvements $0 $506,189 $5,061,888 $0 $0 $0 Bond Issuance Costs $0 $0 $400,000 $0 $0 $150,000Subtotal - Water Treatment Facilities $208,000 $1,599,903 $14,460,800 $233,972 $1,382,118 $11,790,935
Treated Water Pump Stations Equipment Rehabilitation $52,000 $54,080 $56,243 $58,493 $60,833 $63,266 Boulder Reservoir WTF High Service Pump Station $0 $674,918 $6,749,184 0 $0 $0Subtotal - Treated Water Pump Stations $52,000 $728,998 $6,805,427 $58,493 $60,833 $63,266
Treated Water Storage Tanks Devil's Thumb Storage Tank $0 $0 $0 $0 $0 $0 Chautauqua Storage Tank $0 $0 $0 $100,000 $0 $0Subtotal - Treated Water Storage Tanks $0 $0 $0 $100,000 $0 $0
Treated Water Distribution System Zone Isolation Valves $0 $0 $0 $0 $0 $0 Cathodic Protection $0 $0 $0 $0 $0 $0 Waterline Replacement $3,922,489 $4,079,389 $4,242,564 $4,412,267 $4,588,757 $4,772,308Subtotal - Treated Water Distribution System $3,922,489 $4,079,389 $4,242,564 $4,412,267 $4,588,757 $4,772,308
Treated Water Transmission System Zone 1 Transmission Pipes $626,601 $651,665 $677,732 $704,841 $733,035 $762,356 Zone 2 Transmission Pipes $909,016 $945,377 $983,192 $1,022,519 $1,063,420 $1,105,957 Zone 3 Transmission Pipes $467,460 $486,158 $505,605 $525,829 $546,862 $568,737Subtotal - Treated Water Transmission System $2,003,077 $2,083,200 $2,166,528 $2,253,189 $2,343,317 $2,437,049
Source Water Transmission System Lakewood Pipeline $0 $0 $0 $0 $384,864 $0Subtotal - Source Water Transmission System $0 $0 $0 $0 $384,864 $0
Barker Water System Barker Gravity Pipeline Repair $3,309,341 $3,431,715 $4,558,983 $3,691,342 $3,828,996 $3,972,156 Barker Gravity Pipeline - Siphon Replacement $449,946 $187,177 $778,658 $506,128 $526,373 $0 Barker-Kossler Penstock Repair $637,012 $1,274,492 $1,013,472 $1,054,011 $1,096,171 $1,140,018 Barker Dam Outlet $0 $903,732 $0 $0 $0 $0 Barker Dam Outlet - Bond Proceeds $0 $0 $9,037,318 $0 $0 $0
Attachment A
07.15.2019 WRAB Agenda 4 - Capital Improvements Program Page 12 of 22

Attachment A - Recommended Water Fund Financial and CIP
CITY OF BOULDERRECOMMENDED 2020-2025 CAPITAL IMPROVEMENT PROGRAM
WATER UTILITY FUND
2020 2021 2022 2023 2024 2025PROJECT NAME RECOMMENDED PROJECTED PROJECTED PROJECTED PROJECTED PROJECTED
Barker Dam and Reservoir $100,000 $0 $0 $0 $0 $0 Kossler Dam $0 $0 $50,000 $300,000 $100,000 $750,000Subtotal - Barker Water System $4,496,298 $5,797,116 $15,438,431 $5,551,481 $5,551,540 $5,862,174
Raw Water Storage Reservoirs Source Systems Condition Assessment $350,000 $0 $0 $0 $0 $425,829 Albion Dam $0 $986,706 $9,867,055 $0 $0 $0 Silver Lake Dam $200,000 $0 $0 $0 $0 $0 Green Lake 2 Dam $0 $0 $0 $75,000 $547,553 $5,475,530 Skyscraper Dam $0 $171,071 $0 $0 $0 $0 Wittemyer Ponds $0 $0 $0 $0 $100,000 $599,426Subtotal - Raw Water Storage Reservoirs $550,000 $1,157,777 $9,867,055 $75,000 $647,553 $6,500,785
Other Raw Water Facilities Source Water Facilities Rehab Program $168,730 $175,479 $182,498 $189,798 $197,390 $205,285 Watershed Improvements $30,000 $30,000 $30,000 $30,000 $30,000 $0 Instream Flow Structures and Gaging $10,000 $10,000 $10,000 $10,000 $10,000 $0 NCWCD Conveyance - Carter Lake Pipeline 160,000 $160,000 $160,000 $160,000 $160,000 $160,000Subtotal - Other Raw Water Facilities $368,730 $375,479 $382,498 $389,798 $397,390 $365,285
Source Water Pressure Reducing, Pumping and Hydroelectric Lakewood Hydroelectric/PRV $0 $50,000 $0 $0 $0 $0 Silver Lake Hydroelectric/PRV $0 $0 $0 $250,000 $0 $0 Hydroelectric Facilities Rehabilitiation Program $56,243 $58,493 $60,833 $63,266 $65,797 $68,428 Betasso Hydroelectric / Pressure Reducing Facility $150,000 $0 $0 $0 $0 $0 Barker Dam Hydroelectric $0 $0 $50,000 $0 $0 $0 Boulder Canyon Hydroelectric $0 $0 $0 $250,000 $0 $0 Carter Lake Hydroelectric $0 $0 $0 $0 $0 $250,000Subtotal - Source Water PRV, Pumping and Hydro $206,243 $108,493 $110,833 $563,266 $65,797 $318,428
Water System Monitoring and Metering Meter Replacement Program $255,000 $255,000 $1,020,000 $1,060,800 $1,103,232 $1,147,361 Utility Billing Computer System $0 $0 $0 $150,000 $0 $0Subtotal - Water System Monitoring and Metering $255,000 $255,000 $1,020,000 $1,210,800 $1,103,232 $1,147,361
TOTAL CAPITAL USES OF FUNDS $12,346,837 $16,285,354 $54,644,136 $14,848,265 $16,525,399 $33,357,592
Attachment A
07.15.2019 WRAB Agenda 4 - Capital Improvements Program Page 13 of 22

Attachment B: Wastewater Fund Financial and CIP
WASTEWATER UTILITY 2020 FUND FINANCIAL2018 2019 2020 2021 2022 2023 2024 2025
Actual Revised Proposed Projected Projected Projected Projected Projected
Beginning Fund Balance 23,945,036$ 30,280,286$ 5,453,089$ 4,377,562$ 6,286,977$ 4,865,984$ 4,674,387$ 4,799,778$
Sources of FundsOperating 5.0% 5.0% 5.0% $0 $0 $0 $0 $0Sewer Charges to General Customers 21,232,937$ 21,067,023$ 21,899,171$ 22,764,188$ 23,663,373$ 24,598,076$ 25,569,700$ 26,579,704$ Projected Rate Increase - 1,053,351 1,094,959 1,138,209 1,183,169 1,229,904 1,278,485 797,391 Surcharge/ Pretreatment Fees 149,798 142,353 142,353 142,353 142,353 142,353 142,353 142,353 Plant Investment Fees 307,145 750,000 750,000 750,000 250,000 250,000 250,000 250,000 Connection Charges 10,620 10,000 10,000 10,000 10,000 10,000 10,000 10,000 Special Assessments - 25,000 25,000 25,000 25,000 25,000 25,000 25,000 Federal & State Grants (13,788) - - - - - - - Interest on Investments 381,282 224,823 229,030 183,858 264,053 204,371 196,324 201,591 Rent and other miscellaneous revenue 123,799 176,000 351,000 351,000 351,000 351,000 351,000 351,000 Bond Proceeds 3,534,463 - - 24,088,463 22,442,992 - - -
Total Sources of Funds $25,726,257 23,448,550$ 24,501,512 49,453,071$ 48,331,940$ 26,810,705$ 27,822,863$ 28,357,038$
Uses of FundsOperatingAdministration 919,619$ 1,035,185$ 1,079,237$ 1,111,614$ 1,144,963$ 1,179,311$ 1,214,691$ 1,251,131$ Planning and Project Management 581,692 421,895 436,291 449,380 462,861 476,747 491,049 505,781 Wastewater Quality & Environmental Svcs - 1,238,833 1,317,679 1,357,209 1,397,926 1,439,863 1,483,059 1,527,551 System Maintenance 1,958,761 1,741,544 1,732,942 1,784,930 1,838,478 1,893,633 1,950,441 2,008,955 Wastewater Treatment 5,226,997 5,090,201 5,131,031 5,284,962 5,443,511 5,606,816 5,775,021 5,948,271
TOTAL OPERATING USES OF FUNDS $8,687,070 9,527,658$ 9,697,180$ 9,988,095$ 10,287,738$ 10,596,370$ 10,914,262$ 11,241,689$
Debt2012 Refunding of the WWTP 2005 Revenue Bond 3,162,250 3,154,750 3,142,250 3,124,750 3,127,250 3,128,500 3,128,500 3,128,500 WWTP UV, Digester, Headworks Imp 2010 Rev Bond 673,838 675,188 671,088 671,688 671,838 671,538 669,438 673,188 Sanitary Sewer Rehabilitation Bond 2015 666,952 679,531 676,131 677,631 678,931 680,581 676,781 677,681 Foothills Baseline Sewer Bond 2018 - 240,945 241,306 240,880 241,268 241,063 241,190 241,181 WWTP Nutrient Compliance and Trunk Sewer Bond 2022 - - - - 2,019,869 2,019,869 2,019,869 2,019,869 Anticipated Bond - Interceptor Replacement - - - 2,167,962 2,167,962 2,167,962 2,167,962 2,167,962
TOTAL DEBT SERVICE 4,563,726 4,750,414$ 4,730,775 6,882,911$ 8,907,118$ 8,909,513$ 8,903,740$ 8,908,381$
TransfersCost Allocation 950,838$ 1,029,260 1,044,444 1,148,888 1,263,777 1,390,155 1,459,663 1,532,646 Planning & Development Services 305,838 315,013 350,952 361,481 372,325 383,495 395,000 406,850 Transportation - Admin Support - 16,300 16,300 16,789 17,293 17,812 18,346 18,896
TOTAL TRANSFERS OUT $1,256,676 1,360,573$ $1,411,696 1,527,158$ 1,653,395$ 1,791,462$ 1,873,009$ 1,958,392$
Attachment B
07.15.2019 WRAB Agenda 4 - Capital Improvements Program Page 14 of 22

Attachment B: Wastewater Fund Financial and CIP
WASTEWATER UTILITY 2020 FUND FINANCIAL2018 2019 2020 2021 2022 2023 2024 2025
Actual Revised Proposed Projected Projected Projected Projected ProjectedCONTINUEDCapital Improvement Program 4,854,842$ 9,912,767$ 9,737,389$ 5,057,028$ 6,461,690$ 5,704,957$ 6,006,461$ 6,239,260 Projected Bond-Interceptor/Digester - - - 23,838,463 - - - - WWTF Permit Impr. and Sanitary Sewer Bond 2022 - - - - 22,192,992 - - Bond Issuance Costs 28,694 200,000 - 250,000 250,000 - - - Carryover, Encumbrances and Adjustments to Base 22,524,335 - - - - - -
Total Uses of Funds $19,391,007 48,275,747$ $25,577,040 47,543,656$ 49,752,933$ 27,002,302$ 27,697,472$ 28,347,722$
Ending Fund Balance Before Reserves 30,280,286$ 5,453,089$ $4,377,562 6,286,977$ 4,865,984$ 4,674,387$ 4,799,778$ 4,809,094$
ReservesBond Reserves 670,139$ 670,139$ 670,139$ 670,139$ 670,139$ 670,139$ 670,139$ 670,139$ FEMA Deobligation Reserve 36,445 36,445 36,445 36,445 36,445 36,445 36,445 Sick/Vacation/Bonus Reserve 295,873 304,750 62,004 63,864 65,780 67,753 69,786 71,880 PERA Legislative Contingency - 4,859 - - - - - Pay Period 27 Reserve 226,024 226,024 226,024 226,024 226,024 226,024 226,024 27,774 Operating Reserve 2,485,936 2,722,058 2,777,219 2,878,813 2,985,283 3,096,958 3,196,818 3,300,020 Capital Reserve 500,000 500,000 500,000 500,000 500,000 500,000 500,000 500,000
Total Reserves 4,214,418$ 4,464,274$ 4,271,831$ 4,375,285$ 4,483,671$ 4,597,320$ 4,699,212$ 4,569,813$
Ending Fund Balance After Reserves 26,065,869$ 988,815$ 105,731$ 1,911,691$ 382,312$ 77,067$ 100,566$ 239,281$
Attachment B
07.15.2019 WRAB Agenda 4 - Capital Improvements Program Page 15 of 22

Attachment B: Wastewater Fund Financial and CIP
CITY OF BOULDERDRAFT 2020 - 2025 CAPITAL IMPROVEMENT PROGRAM
WASTEWATER UTILITY FUND
2020 2021 2022 2023 2024 2025PROJECT NAME RECOMMENDED PROJECTED PROJECTED PROJECTED PROJECTED PROJECTED
Wastewater Treatment WWTF Pumps $75,000 $0 $150,000 $0 $0 $150,000 WWTF Permit Improvements $919,232 $1,838,463 $0 $71,166 $0 $0 WWTF Permit Improvements - Bond $0 $0 $18,384,634 $0 $0 $0 WWTF Laboratory $0 $0 $0 $0 $0 $0 WWTF Instrumentation/Control $1,594,415 $0 $0 $0 $0 $98,695 WWTF Activated Sludge $0 $0 $0 $0 $230,918 $0 WWTF Primary Clarifiers $0 $70,893 $708,934 $0 $0 $0 WWTF Secondary Clarifiers $0 $50,000 $500,000 $0 $0 $0 WWTF Rehabilitation $250,000 $250,000 $250,000 $250,000 $250,000 $250,000 WRRF Biogas $1,100,000 $0 $0 $0 $0 $0 WWTF Digester Complex $0 $2,000,000 $0 $0 $0 $0 WWTF Digester Cleaning $0 $142,331 $0 $0 $0 $0 Bond Issuance Costs $0 $250,000 $250,000 $0 $0 $0Subtotal - Wastewater Treatment Plant $3,938,647 $4,601,688 $20,243,568 $321,166 $480,918 $498,695
Wastewater System Monitoring and Metering Yards Master Plan Implementation $0 $0 $0 $0 $0 $0 Automated Meter Reading $45,000 $45,000 $180,000 $187,200 $194,688 $202,476 Asset Management Software $0 $0 $0 $0 $0 $0 Utility Billing Computer System $0 $0 $0 $65,000 $0 $0Subtotal - Monitoring and Metering $45,000 $45,000 $180,000 $252,200 $194,688 $202,476
Collection and Conveyance System Rehabilitation Collection System Monitoring $150,000 $150,000 $150,000 $150,000 $150,000 $150,000 Condition Assessment Program $701,915 $729,991 $759,191 $1,067,484 $1,110,183 $1,154,591 Sanitary Sewer Rehabilitation $3,226,563 $3,355,626 $3,489,851 $3,629,445 $3,774,623 $3,925,608 Sanitary Sewer Manhole Rehabilitation $253,064 $263,186 $273,714 $284,662 $296,049 $307,891 Main Interceptor Realignment $0 $20,000,000 $0 $0 $0 $0 Lower Goose Creek Trunk Sewer Replacement $0 $0 $3,808,358 $0 $0 Foothills & Baseline Trunk Sewer Replacement $1,422,200 $0 $0 $0 $0 $0 Arapahoe Trunk Sewer Replacement $0 $0 $0 0 $0 $0Subtotal - Sewer System Rehabilitation $5,753,742 $24,498,804 $8,481,114 $5,131,591 $5,330,855 $5,538,089
TOTAL CAPITAL USES OF FUNDS $9,737,389 $29,145,492 $28,904,683 $5,704,957 $6,006,461 $6,239,260
Attachment B
07.15.2019 WRAB Agenda 4 - Capital Improvements Program Page 16 of 22
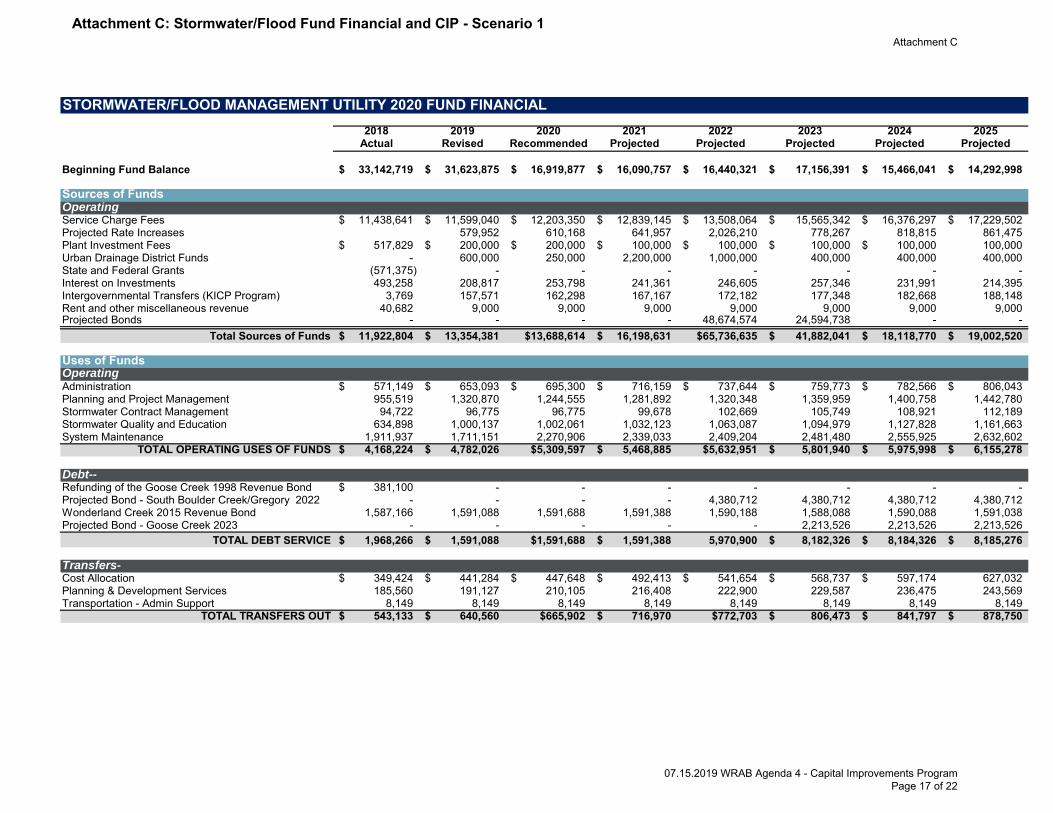
Attachment C: Stormwater/Flood Fund Financial and CIP - Scenario 1
STORMWATER/FLOOD MANAGEMENT UTILITY 2020 FUND FINANCIAL2018 2019 2020 2021 2022 2023 2024 2025
Actual Revised Recommended Projected Projected Projected Projected Projected
Beginning Fund Balance 33,142,719$ 31,623,875$ 16,919,877$ 16,090,757$ 16,440,321$ 17,156,391$ 15,466,041$ 14,292,998$
Sources of FundsOperatingService Charge Fees 11,438,641$ 11,599,040$ 12,203,350$ 12,839,145$ 13,508,064$ 15,565,342$ 16,376,297$ 17,229,502$ Projected Rate Increases 579,952 610,168 641,957 2,026,210 778,267 818,815 861,475 Plant Investment Fees 517,829$ 200,000$ 200,000$ 100,000$ 100,000$ 100,000$ 100,000$ 100,000 Urban Drainage District Funds - 600,000 250,000 2,200,000 1,000,000 400,000 400,000 400,000 State and Federal Grants (571,375) - - - - - - - Interest on Investments 493,258 208,817 253,798 241,361 246,605 257,346 231,991 214,395 Intergovernmental Transfers (KICP Program) 3,769 157,571 162,298 167,167 172,182 177,348 182,668 188,148 Rent and other miscellaneous revenue 40,682 9,000 9,000 9,000 9,000 9,000 9,000 9,000Projected Bonds - - - - 48,674,574 24,594,738 - -
Total Sources of Funds 11,922,804$ 13,354,381$ $13,688,614 16,198,631$ $65,736,635 41,882,041$ 18,118,770$ 19,002,520$
Uses of FundsOperatingAdministration 571,149$ 653,093$ 695,300$ 716,159$ 737,644$ 759,773$ 782,566$ 806,043$ Planning and Project Management 955,519 1,320,870 1,244,555 1,281,892 1,320,348 1,359,959 1,400,758 1,442,780 Stormwater Contract Management 94,722 96,775 96,775 99,678 102,669 105,749 108,921 112,189 Stormwater Quality and Education 634,898 1,000,137 1,002,061 1,032,123 1,063,087 1,094,979 1,127,828 1,161,663 System Maintenance 1,911,937 1,711,151 2,270,906 2,339,033 2,409,204 2,481,480 2,555,925 2,632,602
TOTAL OPERATING USES OF FUNDS 4,168,224$ 4,782,026$ $5,309,597 5,468,885$ $5,632,951 5,801,940$ 5,975,998$ 6,155,278$
Debt--Refunding of the Goose Creek 1998 Revenue Bond 381,100$ - - - - - - - Projected Bond - South Boulder Creek/Gregory 2022 - - - - 4,380,712 4,380,712 4,380,712 4,380,712 Wonderland Creek 2015 Revenue Bond 1,587,166 1,591,088 1,591,688 1,591,388 1,590,188 1,588,088 1,590,088 1,591,038 Projected Bond - Goose Creek 2023 - - - - - 2,213,526 2,213,526 2,213,526
TOTAL DEBT SERVICE 1,968,266$ 1,591,088$ $1,591,688 1,591,388$ 5,970,900 8,182,326$ 8,184,326$ 8,185,276$
Transfers- Cost Allocation 349,424$ 441,284$ 447,648$ 492,413$ 541,654$ 568,737$ 597,174$ 627,032 Planning & Development Services 185,560 191,127 210,105 216,408 222,900 229,587 236,475 243,569 Transportation - Admin Support 8,149 8,149 8,149 8,149 8,149 8,149 8,149 8,149
TOTAL TRANSFERS OUT 543,133$ 640,560$ $665,902 716,970$ $772,703 806,473$ 841,797$ 878,750$
Attachment C
07.15.2019 WRAB Agenda 4 - Capital Improvements Program Page 17 of 22

Attachment C: Stormwater/Flood Fund Financial and CIP - Scenario 1
STORMWATER/FLOOD MANAGEMENT UTILITY 2020 FUND FINANCIAL2018 2019 2020 2021 2022 2023 2024 2025
Actual Revised Recommended Projected Projected Projected Projected ProjectedCONTINUEDCapital 6,762,024$ $3,540,290 $6,950,548 $8,071,823 $3,969,437 $4,186,915 $4,289,691 4,655,754 Projected Bond - Goose Creek - - - - - 24,344,738 Projected Bond - South Boulder Creek - - - - 48,224,574 - - - Projected Bond Issuance Costs - - - - 450,000 250,000 - - Encumbrances, Carryover and Adjustments to Base 17,504,415 - - - - - -
Total Uses of Funds 13,441,647$ 28,058,379$ $14,517,734 15,849,066$ $65,020,565 43,572,391$ 19,291,813$ 19,875,059$
Ending Fund Balance Before Reserves 31,623,875$ 16,919,877$ $16,090,757 16,440,321$ $17,156,391 15,466,041$ 14,292,998$ 13,420,459$
ReservesBond Reserves 1,987,568$ 1,987,568$ 1,987,568$ 1,987,568$ 6,368,280$ 8,581,806$ 8,581,806$ 8,581,806$ Post Flood Property Acquisition 1,050,000 1,050,000 1,050,000 1,050,000 1,050,000 1,050,000 1,050,000 1,050,000 FEMA Deobligation Reserve 41,750 41,750 41,750 41,750 41,750 41,750 41,750 41,750 PERA Legislative Contingency - 2,672 - - - - - - Sick/Vacation/Bonus Reserve 128,912 132,779 11,060 11,392 11,734 12,086 12,448 12,822 Pay Period 27 Reserve 81,384 84,165 86,946 89,727 92,508 95,289 98,070 114,070 Operating Reserve 1,177,839 1,355,646 1,493,875 1,546,464 1,601,414 1,652,103 1,704,449 1,758,507 Capital Reserve 200,000 200,000 200,000 200,000 200,000 200,000 200,000 200,000
Total Reserves 4,667,453$ 4,854,581$ 4,871,199$ 4,926,900$ 9,365,685$ 11,633,034$ 11,688,523$ 11,758,955$
Ending Fund Balance After Reserves 26,956,422$ 12,065,296$ $11,219,558 11,513,421$ $7,790,706 3,833,007$ 2,604,475$ 1,661,505$
Attachment C
07.15.2019 WRAB Agenda 4 - Capital Improvements Program Page 18 of 22

Attachment C: Stormwater/Flood Fund Financial and CIP - Scenario 1
CITY OF BOULDERDRAFT 2020-2025 CAPITAL IMPROVEMENT PROGRAM
STORMWATER AND FLOOD MANAGEMENT UTILITY FUND
2020 2021 2022 2023 2024 2025PROJECT NAME PROJECTED PROJECTED PROJECTED PROJECTED PROJECTED PROJECTED
Major Drainageways South Boulder Creek $2,000,000 $0 $0 $0 $0 $0 South Boulder Creek - Bond Proceeds $0 $0 $40,000,000 $0 $0 $0 Bond Issuance Costs $0 $0 $450,000 $250,000 $0 $0 Bluebell Canyon Creek - King's Gulch $540,800 $0 $0 $0 $0 $0 Four Mile Canyon Creek $0 $0 $0 $0 $0 $202,775 Gregory Canyon Creek $822,457 $0 $8,224,574 $0 $0 $0 Drainageway Maintenance/Enhancements $520,000 $540,000 $560,000 $580,000 $610,000 $630,000 Preflood Acquisition $660,000 $684,285 $711,656 $740,122 $769,727 $800,516 Greenways Program Transfer $97,500 $97,500 $97,500 $97,500 $97,500 $97,500Subtotal - Major Drainageway Improvements $4,640,757 $1,321,785 $50,043,730 $1,667,622 $1,477,227 $1,730,792
Miscellaneous Utility Billing Computer System $0 $0 $0 $65,000 $0 $0Subtotal - Miscellaneous Drainage Improvements $0 $0 $0 $65,000 $0 $0
Stormwater Management Upper Goose Creek Storm and Flood Projects $0 $0 $0 $24,344,738 $0 $0 E Pearl Storm Sewers (2016 Master Plan - Middle Boulder Creek - 2) $0 $3,862,873 $0 $0 $0 $0 N Broadway Storm Sewers (2016 Master Plan - Wonderland Creek - 1) $0 $386,896 $0 $0 $0 $0 Ithaca & Wildwood (2016 Master Plan - Bear Canyon Creek - 5) $0 $0 $0 $0 $0 $0 Local Drainage Improvements $854,090 $986,949 $1,026,427 $1,067,484 $1,110,183 $1,154,591 Stormwater Quality Improvements $190,000 $197,390 $205,285 $213,497 $222,037 $230,918 Storm Sewer Rehabilitation $632,700 $657,966 $684,285 $711,656 $740,122 $769,727 Transportation Coordination $633,000 $657,966 $684,285 $711,656 $740,122 $769,727Subtotal - Localized Drainage Improvements $2,309,790 $6,750,039 $2,600,281 $27,049,030 $2,812,464 $2,924,963
TOTAL CAPITAL USES OF FUNDS $6,950,548 $8,071,823 $52,644,011 $28,781,653 $4,289,691 $4,655,754
Attachment C
07.15.2019 WRAB Agenda 4 - Capital Improvements Program Page 19 of 22

Attachment D: Stormwater/Flood Fund Financial and CIP - Scenario 2
STORMWATER/FLOOD MANAGEMENT UTILITY 2020 FUND FINANCIAL2018 2019 2020 2021 2022 2023 2024 2025
Actual Revised Recommended Projected Projected Projected Projected Projected
Beginning Fund Balance 33,142,719$ 31,623,875$ 16,919,877$ 16,334,824$ 17,206,506$ 17,549,557$ 15,612,361$ 14,336,832$
Sources of FundsOperatingService Charge Fees 11,438,641$ 11,599,040$ 12,203,350$ 13,083,700$ 14,027,558$ 15,180,062$ 16,123,048$ 17,124,611$ Projected Rate Increases 579,952 854,235 915,859 1,122,205 910,804 967,383 856,231 Plant Investment Fees 517,829$ 200,000$ 200,000$ 100,000$ 100,000$ 100,000$ 100,000$ 100,000 Urban Drainage District Funds - 600,000 250,000 2,200,000 1,000,000 400,000 400,000 400,000 State and Federal Grants (571,375) - - - - - - - Interest on Investments 493,258 208,817 253,798 245,022 258,098 263,243 234,185 215,052 Intergovernmental Transfers (KICP Program) 3,769 157,571 162,298 167,167 172,182 177,348 182,668 188,148 Rent and other miscellaneous revenue 40,682 9,000 9,000 9,000 9,000 9,000 9,000 9,000Projected Bonds - - - - 48,674,574 24,594,738 - -
Total Sources of Funds 11,922,804$ 13,354,381$ $13,932,681 16,720,748$ $65,363,616 41,635,195$ 18,016,284$ 18,893,043$
Uses of FundsOperatingAdministration 571,149$ 653,093$ 695,300$ 716,159$ 737,644$ 759,773$ 782,566$ 806,043$ Planning and Project Management 955,519 1,320,870 1,244,555 1,281,892 1,320,348 1,359,959 1,400,758 1,442,780 Stormwater Contract Management 94,722 96,775 96,775 99,678 102,669 105,749 108,921 112,189 Stormwater Quality and Education 634,898 1,000,137 1,002,061 1,032,123 1,063,087 1,094,979 1,127,828 1,161,663 System Maintenance 1,911,937 1,711,151 2,270,906 2,339,033 2,409,204 2,481,480 2,555,925 2,632,602
TOTAL OPERATING USES OF FUNDS 4,168,224$ 4,782,026$ $5,309,597 5,468,885$ $5,632,951 5,801,940$ 5,975,998$ 6,155,278$
Debt--Refunding of the Goose Creek 1998 Revenue Bond 381,100$ - - - - - - - Projected Bond - South Boulder Creek/Gregory 2022 - - - - 4,380,712 4,380,712 4,380,712 4,380,712 Wonderland Creek 2015 Revenue Bond 1,587,166 1,591,088 1,591,688 1,591,388 1,590,188 1,588,088 1,590,088 1,591,038 Projected Bond - Goose Creek 2023 - - - - - 2,213,526 2,213,526 2,213,526
TOTAL DEBT SERVICE 1,968,266$ 1,591,088$ $1,591,688 1,591,388$ 5,970,900 8,182,326$ 8,184,326$ 8,185,276$
Transfers- Cost Allocation 349,424$ 441,284$ 447,648$ 492,413$ 541,654$ 568,737$ 597,174$ 627,032 Planning & Development Services 185,560 191,127 210,105 216,408 222,900 229,587 236,475 243,569 Transportation - Admin Support 8,149 8,149 8,149 8,149 8,149 8,149 8,149 8,149
TOTAL TRANSFERS OUT 543,133$ 640,560$ $665,902 716,970$ $772,703 806,473$ 841,797$ 878,750$
Attachment D
07.15.2019 WRAB Agenda 4 - Capital Improvements Program Page 20 of 22

Attachment D: Stormwater/Flood Fund Financial and CIP - Scenario 2
STORMWATER/FLOOD MANAGEMENT UTILITY 2020 FUND FINANCIAL2018 2019 2020 2021 2022 2023 2024 2025
Actual Revised Recommended Projected Projected Projected Projected ProjectedCONTINUEDCapital 6,762,024$ $3,540,290 $6,950,548 $8,071,823 $3,969,437 $4,186,915 $4,289,691 4,655,754 Projected Bond - Goose Creek - - - - - 24,344,738 Projected Bond - South Boulder Creek - - - - 48,224,574 - - - Projected Bond Issuance Costs - - - - 450,000 250,000 - - Encumbrances, Carryover and Adjustments to Base 17,504,415 - - - - - -
Total Uses of Funds 13,441,647$ 28,058,379$ $14,517,734 15,849,066$ $65,020,565 43,572,391$ 19,291,813$ 19,875,059$
Ending Fund Balance Before Reserves 31,623,875$ 16,919,877$ $16,334,824 17,206,506$ $17,549,557 15,612,361$ 14,336,832$ 13,354,816$
ReservesBond Reserves 1,987,568$ 1,987,568$ 1,987,568$ 1,987,568$ 6,368,280$ 8,581,806$ 8,581,806$ 8,581,806$ Post Flood Property Acquisition 1,050,000 1,050,000 1,050,000 1,050,000 1,050,000 1,050,000 1,050,000 1,050,000 FEMA Deobligation Reserve 41,750 41,750 41,750 41,750 41,750 41,750 41,750 41,750 PERA Legislative Contingency - 2,672 - - - - - - Sick/Vacation/Bonus Reserve 128,912 132,779 11,060 11,392 11,734 12,086 12,448 12,822 Pay Period 27 Reserve 81,384 84,165 86,946 89,727 92,508 95,289 98,070 114,070 Operating Reserve 1,177,839 1,355,646 1,493,875 1,546,464 1,601,414 1,652,103 1,704,449 1,758,507 Capital Reserve 200,000 200,000 200,000 200,000 200,000 200,000 200,000 200,000
Total Reserves 4,667,453$ 4,854,581$ 4,871,199$ 4,926,900$ 9,365,685$ 11,633,034$ 11,688,523$ 11,758,955$
Ending Fund Balance After Reserves 26,956,422$ 12,065,296$ $11,463,625 12,279,606$ $8,183,873 3,979,327$ 2,648,309$ 1,595,861$
Attachment D
07.15.2019 WRAB Agenda 4 - Capital Improvements Program Page 21 of 22

Attachment D: Stormwater/Flood Fund Financial and CIP - Scenario 2CITY OF BOULDER
DRAFT 2020-2025 CAPITAL IMPROVEMENT PROGRAMSTORMWATER AND FLOOD MANAGEMENT UTILITY FUND
2020 2021 2022 2023 2024 2025PROJECT NAME PROJECTED PROJECTED PROJECTED PROJECTED PROJECTED PROJECTED
Major Drainageways South Boulder Creek $2,000,000 $0 $0 $0 $0 $0 South Boulder Creek - Bond Proceeds $0 $0 $40,000,000 $0 $0 $0 Bond Issuance Costs $0 $0 $450,000 $250,000 $0 $0 Bluebell Canyon Creek - King's Gulch $540,800 $0 $0 $0 $0 $0 Four Mile Canyon Creek $0 $0 $0 $0 $0 $202,775 Gregory Canyon Creek $822,457 $0 $8,224,574 $0 $0 $0 Drainageway Maintenance/Enhancements $520,000 $540,000 $560,000 $580,000 $610,000 $630,000 Preflood Acquisition $660,000 $684,285 $711,656 $740,122 $769,727 $800,516 Greenways Program Transfer $97,500 $97,500 $97,500 $97,500 $97,500 $97,500Subtotal - Major Drainageway Improvements $4,640,757 $1,321,785 $50,043,730 $1,667,622 $1,477,227 $1,730,792
Miscellaneous Utility Billing Computer System $0 $0 $0 $65,000 $0 $0Subtotal - Miscellaneous Drainage Improvements $0 $0 $0 $65,000 $0 $0
Stormwater Management Upper Goose Creek Storm and Flood Projects $0 $0 $0 $24,344,738 $0 $0 E Pearl Storm Sewers (2016 Master Plan - Middle Boulder Creek - 2) $0 $3,862,873 $0 $0 $0 $0 N Broadway Storm Sewers (2016 Master Plan - Wonderland Creek - 1) $0 $386,896 $0 $0 $0 $0 Ithaca & Wildwood (2016 Master Plan - Bear Canyon Creek - 5) $0 $0 $0 $0 $0 $0 Local Drainage Improvements $854,090 $986,949 $1,026,427 $1,067,484 $1,110,183 $1,154,591 Stormwater Quality Improvements $190,000 $197,390 $205,285 $213,497 $222,037 $230,918 Storm Sewer Rehabilitation $632,700 $657,966 $684,285 $711,656 $740,122 $769,727 Transportation Coordination $633,000 $657,966 $684,285 $711,656 $740,122 $769,727Subtotal - Localized Drainage Improvements $2,309,790 $6,750,039 $2,600,281 $27,049,030 $2,812,464 $2,924,963
TOTAL CAPITAL USES OF FUNDS $6,950,548 $8,071,823 $52,644,011 $28,781,653 $4,289,691 $4,655,754
Attachment D
07.15.2019 WRAB Agenda 4 - Capital Improvements Program Page 22 of 22