city of boise c. energy...... on the status of energy consumed and energy conservation projects ......
TRANSCRIPT
1
INTEROFFICE MEMORANDUM
Date: March 6, 2013 To: Boise Public Works Commission From: Anthony Perreira, P.E., project manager Subject: Energy Consumption at Major Facilities Managed by Public Works
This report contains new information shown in bold. This memo is presented twice annually to update the Commission on the status of energy consumed and energy conservation projects occurring at major City-owned facilities managed by Public Works. Changes from the previous report are shown with bold font. Energy Use Narrative for Wastewater Facilities
In the past several years a number of projects have been initiated to reduce utility energy use. A narrative providing the historical perspective on these projects is included at the end of this report, along with a comprehensive project list and tables of plant electrical use by plant area. The monitoring of plant electrical use provides baseline data and enables better documentation of the actual performance of energy savings projects. Late in the fall of 2010 the lab addition was put in service, increasing the amount of outside air to be heated. From Dec 2010 through March 2011 the new biogas burners in the boilers did not work reliably, but beginning in April 2011 the natural gas consumption dropped to approximately the pre-addition amount and the biogas use increased a proportionate amount. Consumption remained at these levels through the entire heating season of 2011-2012, demonstrating the economic benefit of using biogas for building heating. West Boise WWTF’s combined heat and power (CHP) project development is currently included as part of the design for receiving food wastes and brown grease for the purpose of digestion and gas production. Project predesign will be complete in June 2013. Digester gas from this facility as well as from the municipal sludge digesters could be treated and burned in a CHP system. A major new heating load is being designed at West Boise to use natural gas rather than biogas or heating loop hot water. The thickening and fermentation building will have an estimated peak load of one million BTUs per hour, about 20 percent of existing heating hot water loop capacity. New boilers would be required to heat the building with hot water. The heating system is being designed for easy conversion to hot water heating if the CHP project is implemented, since heat recovered from the CHP would effectively provide the additional heating capacity needed. Work is nearing completion at the Lander Street WWTF on a permit-required project for chemically enhanced primary treatment. The new process will increase the sludge heating requirements. A few buildings have been constructed or remodeled

2
which require space heating. The buildings have been connected to the plant’s existing hot water heating system. The boilers used to provide process and space heat are fired using biogas produced by the treatment process. Heating these new structures is not expected to increase the natural gas use at the plant. A project is being planned to add a new dual-fuel boiler (biogas or natural gas) to the Lander St hot water loop that will increase the system heating capacity and improve equipment redundancy.
Current and Planned Projects to Reduce Utility Energy Consumption Project Name Dates Purpose
West Boise new THK/PSF building
Final Design through May 2013; in service May 2015
Natural gas heating system designed for easy conversion to hot water if CHP project is constructed.
Lander St. boiler addition
Design & install before fall 2013
Provide capacity and redundancy for new process and space heating loads.
West Boise Food and Grease Waste Receiving Facility
Pre-design complete by June 2013, design/bid in 2013/2014, construction in 2014/2015
Divert food waste from the landfill and grease trap waste from hazardous waste landfill for beneficial use generating biogas for CHP.
Energy Use Narrative for City Hall and City Hall West
The City Hall Complex is comprised of three separate buildings connected by a central atrium. Electricity is used in the City Hall complex for space cooling, equipment motors and controls, lights, computer and security systems, domestic water heating, and other minor loads. Electricity is also used as a backup for space heating in the event geothermal heat is not available. Space heating for the complex is supplied primarily by geothermal water. During the summer months there is no geothermal water use, so the charts below only show the months of October through March. Geothermal water use is higher in 2011-2012 than in 2010-2011 due to an increase in the heating setpoint for the complex. This change was made in an effort to better utilize this resource and minimize the need for localized electric space heaters. There is an accompanying reduction in electrical use that is attributed to this change that was made in the geothermal system operation. Geothermal is less costly than electricity and this change also capitalizes on the City’s use of an environmentally friendly resource. City Hall West utilizes natural gas in boilers for space heating, and in a separate boiler for domestic water heating. Electricity is used for space cooling, equipment motors and controls, lights, computer and security systems, and other minor loads. Historical data for electricity and gas use are attached. The City has only fully occupied the building since the spring of 2009. The energy use history documents the efforts of building staff to optimize energy use to meet occupancy needs with existing equipment. The solar heating demonstration project using DOE EECBG funds was put into service on December 23, 2010. Quarterly energy savings from solar are reported in a table below, but represent only a fraction of one percent of the total building energy consumption.

3
Energy Use Narrative for Twenty Mile South Farm
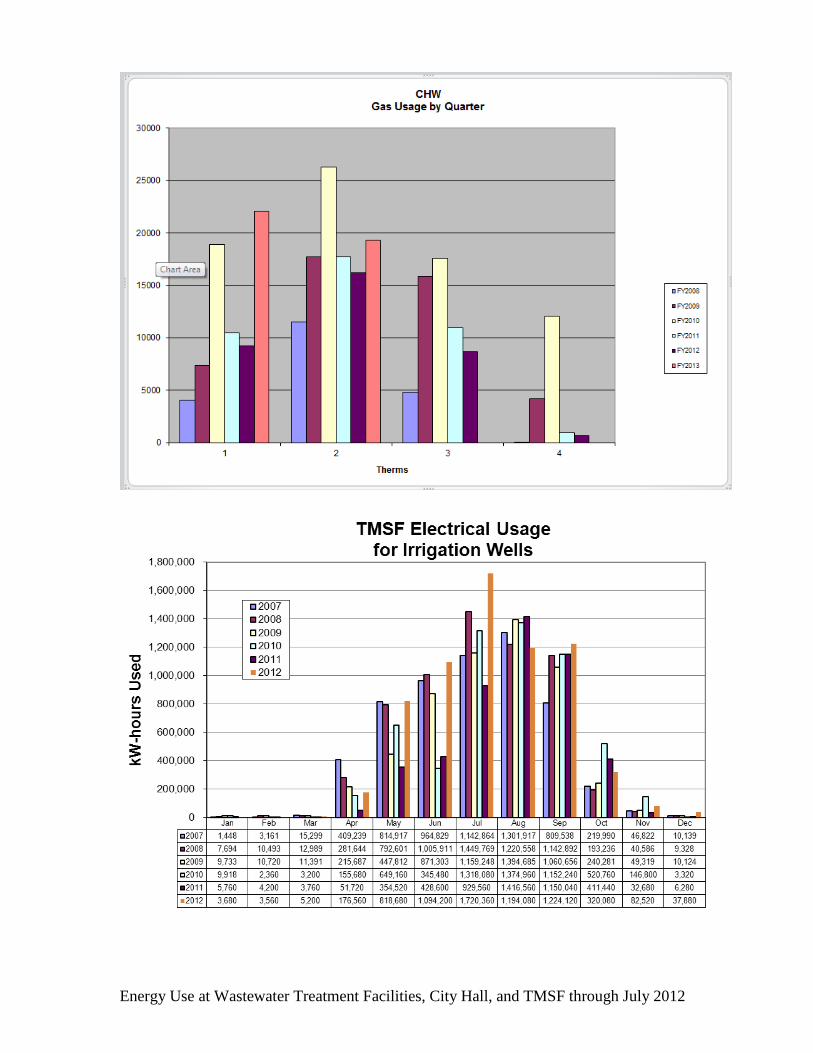
Practices at the Farm have been developed to use irrigation water efficiently with the current infrastructure. Efficient water use can be related directly to electrical usage by the irrigation well pumps delivering water to the irrigation equipment (for example, kWh per million gallons pumped) and applying water commensurate with crop requirements. TMSF continues to monitor irrigation rates by field and crop for comparison to local evapotranspiration data. The attached TMSF electrical use chart has been updated using data from the Idaho Power website and reflects power consumption for the TMSF irrigation wells. Approximately 95% of the TMSF power consumption is used for pumping irrigation water. Below is a comparison of actual calendar year power consumption data for the irrigation wells from 2007 through 2012. Power consumption in 2012 was similar to the power consumed in 2007 and 2008. The decreasing trend observed from 2008 through 2011 has not continued in 2012. From 2008 through 2011, we had very cool wet spring weather that helped to keep energy use down. In 2012, we experienced an extremely dry and hot summer season. July was one of the hottest months on record for the Boise area and resulted in a high demand for water at the TMSF to maintain crop vitality. The City has contracted with SPF Water Engineering to implement an Observation and Maintenance Program for the irrigation wells at the farm, which should continue to ensure adequate water delivery in the most efficient manner possible. This program resembles the program SPF implemented for the Boise Parks and Recreation Department. The intent of the program is to document and track well system performance and efficiency to help identify abnormal or deteriorating conditions that would warrant further investigation or maintenance. The farm continues to implement measures such as this to increase power efficiency. The City has also contracted with SPF Water Engineering to conduct an efficiency study for the TMSF in 2012. The preliminary draft report was received by Public Works staff in late January, 2013. TMSF staff met with the engineering staff in February, 2013 to discuss SPF’s preliminary recommendations and plan for the implementation of both short and long term improvements to the irrigation system. The SPF efficiency study included an evaluation of each individual well at the farm to identify the relative efficiency and production of each well. SPF also investigated the water distribution system to determine several piping improvement alternatives to reduce friction losses in the system. Sprinkler conversion and/or replacement will be another possible gain in efficiency and SPF has recommended the installation of two new center pivots to replace wheel lines. SPF has also developed a hydraulic model of the entire irrigation system at TMSF. The Farm expects to have the same number of irrigated acres in 2013, so power consumption should be similar to recent years. However, as evident in 2012, the actual power consumption will depend on actual climatic conditions.

4
Calendar Year kW-hours Acres Irrigated kW-hr per irrigated acre 2012 6,680,920 3,327 2,008 2011 4,795,120 3,327 1,441 2010 5,681,958 3,327 1,708 2009 5,480,959 3,088 1,775 2008 3,838,052 3,088 1,997 2007 3,622,586 2,814 2,040
AJP/ap Attachments:
- Lander Street WWTF Unit Energy Use- Natural Gas - City Hall Electrical Use by Quarter - West Boise WWTF Unit Energy Use- Natural Gas - City Hall West Electrical Use by Quarter - Lander Street WWTF Unit Energy Use- Natural Gas Only - City Hall West Gas Usage by Quarter - Lander Street WWTF Unit Energy Use- Digester Gas Only - West Boise WWTF Unit Energy Use- Natural Gas Only - TMSF Electrical Usage for Irrigation Wells - West Boise WWTF Unit Energy Use- Digester Gas Only
- Energy Use- Comprehensive Historical Narrative for Wastewater Facilities
- Lander Street WWTF Unit Energy Use- Electricity - WWTF Projects to Reduce Utility Energy Consumption - West Boise WWTF Unit Energy Use- Electricity - Lander Street Electrical Monitoring Summary - City Hall Bldg 1 - Geothermal Gallons per Heating Degree
Day per square foot - West Boise Electrical Monitoring Summary
- City Hall Bldg 2 - Geothermal Gallons per Heating Degree Day per square foot
I:\PWA\Project Program\SAR\655\120828 PWC energy report-draft.doc

Energy Use at Wastewater Treatment Facilities, City Hall, and TMSF through July 2012
FY 2010 Annual Cost: $ 11,630 for 3.8 therms/mg FY 2011 Annual Cost: $ 13,705 for 3.8 therms/mg FY 2012 Annual Cost: $ 10,870 for 3.2 therms/mg FY 2013 YTD Cost: $ 8,255 for 8.1 therms/mg FY 2013 budget: $ 12,494 (spent 86.3% of budget)
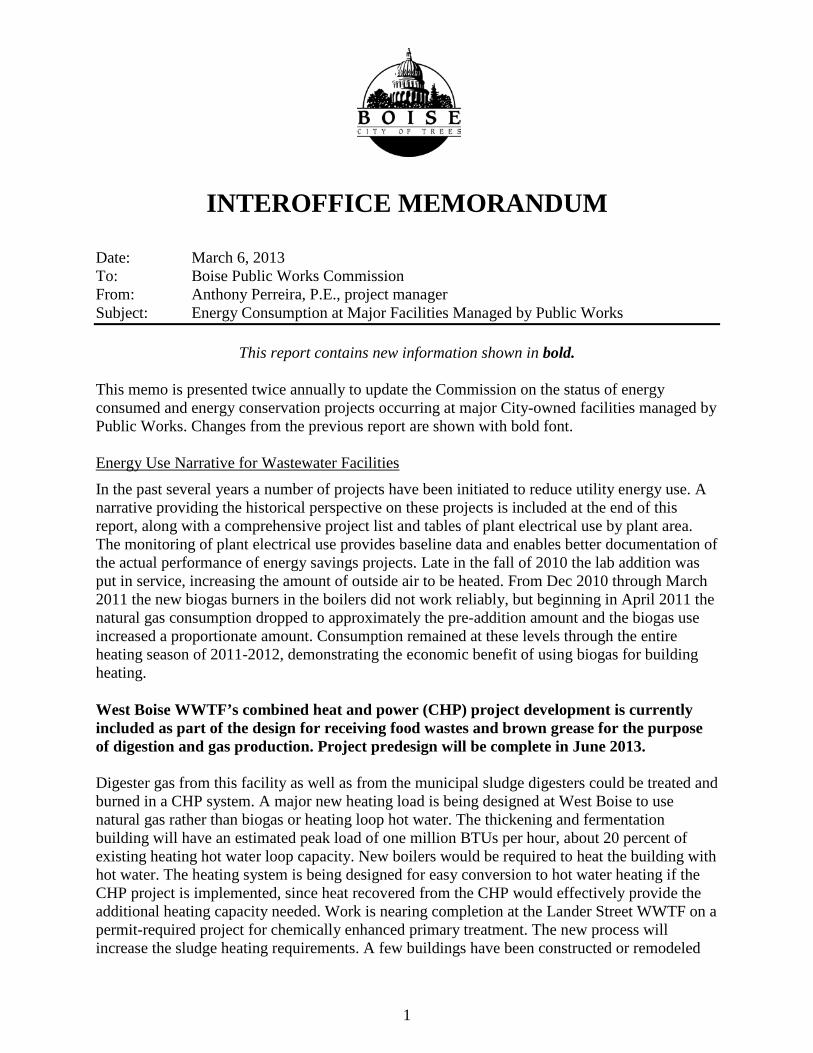
FY 2010 Annual Cost: $ 66,652 for 16.2 therms/mg FY 2011 Annual Cost: $ 66,014 for 15.3 therms/mg FY 2012 Annual Cost: $ 26,287 for 15.3 therms/mg FY 2013 YTD Cost: $ 20,415 for 6.6 therms/mg FY 2013 budget: $ 90,053 (spent 28.0 % of budget)

Energy Use at Wastewater Treatment Facilities, City Hall, and TMSF through July 2012
Compare Natural Gas and Digester Gas use at Lander St WWTF

Energy Use at Wastewater Treatment Facilities, City Hall, and TMSF through July 2012
Compare Natural Gas and Digester Gas use at West Boise WWTF

Energy Use at Wastewater Treatment Facilities, City Hall, and TMSF through July 2012
FY 2010 Annual Cost: $382,884 for 2,089 kWh/mg FY 2011 Annual Cost: $337,590 for 1,763 kWh/mg FY 2012 Annual Cost: $349,982 for 1,744 kWh/mg FY 2013 YTD Cost: $127,199 for 1,865 kWh/mg FY 2013 budget: $396,327 (spent 71.2% of budget)
FY 2009 Annual Cost: $656,687 for 2,970 kWh/mg FY 2010 Annual Cost: $682,685 for 2,797 kWh/mg FY 2011 Annual Cost: $659,925 for 2,891 kWh/mg FY 2012 YTD Cost: $544,355 for 3,333 kWh/mg FY 2012 budget: $690,068 (spent 78.9% of budget)

Energy Use at Wastewater Treatment Facilities, City Hall, and TMSF through July 2012

Energy Use at Wastewater Treatment Facilities, City Hall, and TMSF through July 2012
Energy Use at Wastewater Treatment Facilities, City Hall, and TMSF through July 2012

Wastewater Treatment Facilities Utility Energy Reduction Projects 12
Energy Use- Comprehensive Historical Narrative for Wastewater Facilities In the past several years a number of projects have been initiated to reduce utility energy use. Two projects cleaned the biogas to reduce the maintenance impacts. Other projects used the biogas in applications that previously used natural gas. At West Boise, from August 2009 through July 2010 the lab natural gas use dropped to 19.3 percent of the amount used during the same period in previous years, while the biosolids dewatering building natural gas use dropped to 3.9 percent of the amount used during the same period in previous years, both as a result of expanding the uses of biogas at the facility. Late in the fall of 2010 the lab addition was put in service, increasing the amount of outside air to be heated. From Dec 2010 through March 2011 the new biogas burners in the boilers did not work reliably, but beginning in April 2011 the consumption of natural gas dropped to approximately the pre-addition amount and the biogas use increased a proportionate amount. Consumption remained at these levels through the entire heating season of 2011-2012, demonstrating the economic benefit of using biogas for building heating. Modifications of West Boise's primary scum handling system were put in service in October 2009 and have improved system performance and reduced energy use by eliminating heat tracing and energy needed for the scum pit heat exchangers. The Combined Heat and Power (CHP) project, aka cogeneration, has been under consideration since 2002, when an 80% design was completed for facilities at Lander Street and at West Boise. Project economics have always been marginal due to the significant capital and operating expenses of CHP systems and the low cost of electricity from the City's utility provider. Consolidation of gas production at West Boise was identified as a goal in the 2007 West Boise Digester Gas Utilization and Energy Management Master Plan. Since that time development of CHP has been started in several ways, including as a conventional CIP project, as a potential design/build project for ARRA stimulus funding, as an equipment lease. Then the CHP project objectives were pursued through an Energy Services Company contract with McKinstry. The final report from McKinstry was received May 20, 2011. Unfortunately, project economics and legal issues with annual appropriations made it necessary to terminate this work. West Boise WWTF’s combined heat and power (CHP) project development is currently included as part of the design for receiving food wastes and brown grease for the purpose of digestion and gas production. The predesign for this project will be complete in June of 2013. Digester gas from this facility as well as from the municipal sludge digesters could be treated and burned in a CHP system. A major new heating load is being designed at West Boise to use natural gas rather than biogas or heating loop hot water. The thickening and fermentation building will have an estimated peak load of one million BTUs per hour, about 20 percent of existing heating hot water loop capacity. New boilers would be required to heat the building with hot water. The heating system is being designed for easy conversion to hot water heating if the CHP project is implemented, since heat recovered from the CHP would effectively provide the additional heating capacity needed. West Boise’s UVD facility electrical consumption, which includes the W3 pumping system, decreased beginning in April 2009 because variable frequency drives were installed on two 150 hp W3 pumps. From March 2009 through July 2010 the apparent decrease in electrical use was 48 kW, an equivalent savings of 420,000 kWh per year, valued at about $20,000 per year with current electrical costs. Automated control of air supplied to Aeration Basin 2 at West Boise was put into service on October 23, 2009. A separate project that replicated these automated controls at the other three West Boise aeration basins was commissioned in September 2010. These changes have improved process control, but anticipated reductions in air demand and the electrical energy used by the Aeration Blowers did not materialize. Building lighting efficiency improvements were completed at West Boise and at Utilities Maintenance (UM) early in 2010. Similar improvements were completed at Lander Street in October 2010. Payback for most of the lighting projects is one year or less after the Idaho Power rebates are deducted from the

Wastewater Treatment Facilities Utility Energy Reduction Projects 13
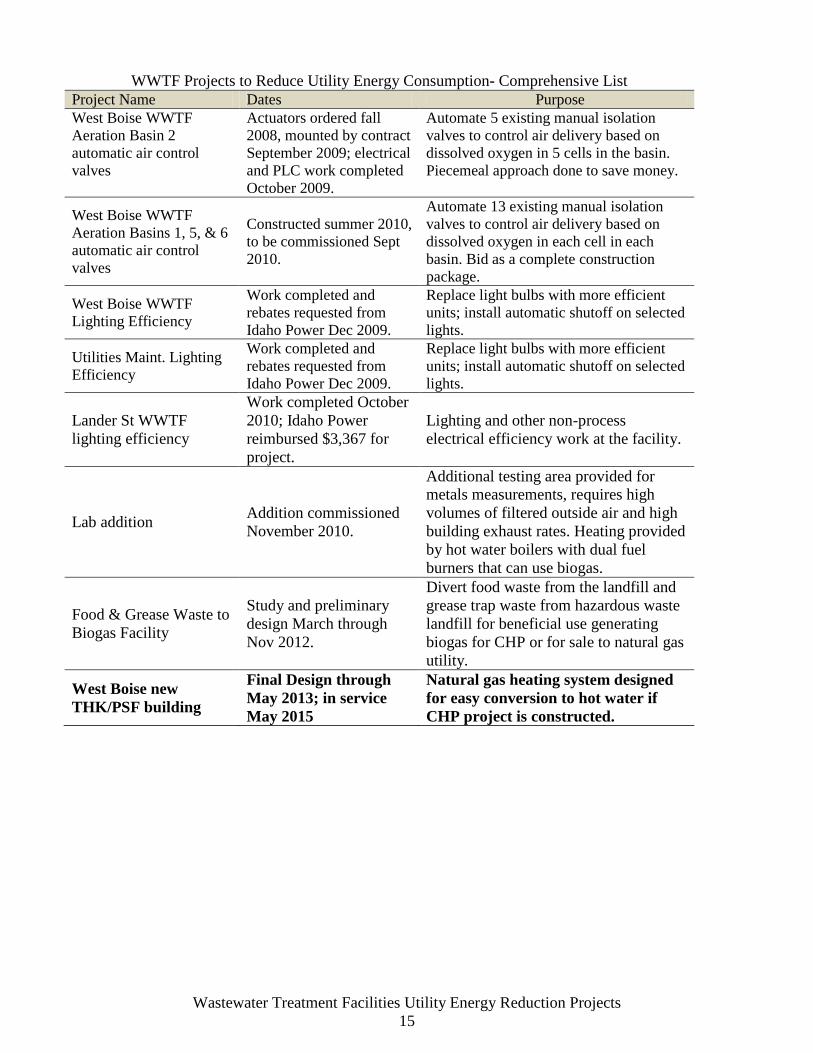
implementation costs. Building lighting efficiency savings are estimated at 180,000 kWh/year at West Boise, 25,000 kWh/year at UM, and 60,000 kWh/year at Lander Street. Work is nearing completion at the Lander Street WWTF on a permit-required project for chemically enhanced primary treatment. The new process will increase the sludge heating requirements. A few buildings have been constructed or remodeled that require space heating. The buildings were connected to the plant’s existing hot water heating system. The boilers used to provide process and space heat are fired using biogas produced by the treatment process. Heating these new structures is not expected to increase the natural gas use at the plant. A project is currently in the design phase to add a new dual-fuel boiler (biogas or natural gas) to the Lander Street hot water loop that will increase the system heating capacity and improve equipment redundancy. The following table is a comprehensive project list for the past decade showing project names, dates and a brief discussion of the project and its energy significance.
WWTF Projects to Reduce Utility Energy Consumption- Comprehensive List Project Name Dates Purpose Lander Street WWTF Digester Gas Cleaning Facility
Constructed and commissioned in 2004
Removes siloxanes from the gas; dries and removes particles from the gas.
Lander Street WWTF Ferrous Chloride system
Commissioned in August of 2007
See comments for West Boise system below.
Lander Street WWTF Burner Replacement for Boiler No. 2
Placed in service on May 11, 2006
Allow biogas to be burned in Boiler No. 2, the larger of two boilers at this facility. The smaller boiler has always burned biogas.
Lander Street WWTF Interim Improvements
Constructed and commissioned 2012, will be full operation starting 2013
Chemically Enhanced Primary Treatment for phosphorus removal required by the NPDES discharge permit. All new facilities constructed as part of this project will heated by the biogas powered hot water system.
Lander St. boiler addition
Design & install before fall 2013
Provide capacity and redundancy for new process and space heating loads
West Boise WWTF gas utilization study by B&C, with follow-up work by MWH and CH2M Hill
2001 to 2007; master plan final report issued in July 2007.
Evaluate methods for biogas cleaning, storage, and utilization. Provide recommendations to City managers for optimum gas uses. Gas treatment and gas distribution projects have been completed, co-generation using biogas-fueled engine-generators is recommended. Master plan consolidates previous work & develops implementation schedule.
West Boise WWTF Ferrous Chloride system
Put in service late in August 2005, stopped using July 2006, started again July 2007
When injected in the sludge before it enters the digesters, ferrous chloride chemically binds sulfides and greatly reduces the concentration of hydrogen sulfide in biogas. Concentrations drop from 1700 ppm to under 100 ppm.

Wastewater Treatment Facilities Utility Energy Reduction Projects 14
WWTF Projects to Reduce Utility Energy Consumption- Comprehensive List Project Name Dates Purpose West Boise WWTF biogas cleaning and storage system design
Construction NTP Oct 30, 2006, work commissioned in Aug 2007. 2nd boiler started on DG Nov 26, 2007.
Remove siloxanes, moisture and particles from gas. Make gas suitable for use in boilers, furnaces, and engines. Gas blower distributes gas to boilers and future equipment. Experienced some control difficulties and a heat exchanger failure in the spring 2009.
West Boise WWTF biogas distribution system design for space heating of some plant buildings
Part 1: Lab started burning DG in boiler on Feb 12, 2009. Hot water heating of dewatering building with DG-fire boilers started Nov 2008. Part 2: started design Jan 2008, project abandoned Mar 2008
Deliver cleaned gas to selected buildings, where it can be burned boilers, or deliver hot water from digester complex to heating coils in air handlers. Part 1: Lab and dewatering buildings Part 2: Galleries and Headworks Building abandoned because pre-design cost estimate was 3 times the master plan estimate & resulted in a negative net present value for the work
West Boise WWTF Combined Heat and Power (CHP, aka co-generation)
Pre-design review completed Sept 2008; design-build effort started January 2009 and canceled; CHP equipment lease RFP started May 2009 with proposals rejected Feb 2010; ESCo study delivered May 20, 2011. Project terminated.
Increase digester gas use; generate "green" electrical power for sale to Idaho Power Co.; use recovered heat to replace heat needed from boilers.
West Boise WWTF Digester No. 3
2-part project. 1st portion completed Nov 2006. 2nd portion completed April 2009
Increase solids handling capacity at West Boise, revise biogas piping system for code compliance.
West Boise WWTF ventilation reduction study
Study completed in Jan 2006. Design started in April, 2007, construction completed Oct 2008.
Report and staff recommend code-allowed ways to reduce ventilation rates under certain occupancy conditions and thereby reduce natural gas consumption.
West Boise WWTF W3 water system pumps
Study completed in Jan 2008. System started up March 10, 2009.
Install two variable speed drives on the pumping system to reduce electrical costs. Savings up to $9,000 per year are estimated, about two percent of the plant electrical use.
West Boise WWTF Primary Scum System Improvements
Bids opened Jan 2009, constr. substantially completed October 2009. Conc scum pump replaced June 2010.
Resolve operational difficulties with system and reduce energy consumption. Converting to unheated glass-lined piping system.
Wastewater Treatment Facilities Utility Energy Reduction Projects 15
WWTF Projects to Reduce Utility Energy Consumption- Comprehensive List Project Name Dates Purpose West Boise WWTF Aeration Basin 2 automatic air control valves
Actuators ordered fall 2008, mounted by contract September 2009; electrical and PLC work completed October 2009.
Automate 5 existing manual isolation valves to control air delivery based on dissolved oxygen in 5 cells in the basin. Piecemeal approach done to save money.
West Boise WWTF Aeration Basins 1, 5, & 6 automatic air control valves
Constructed summer 2010, to be commissioned Sept 2010.
Automate 13 existing manual isolation valves to control air delivery based on dissolved oxygen in each cell in each basin. Bid as a complete construction package.
West Boise WWTF Lighting Efficiency
Work completed and rebates requested from Idaho Power Dec 2009.
Replace light bulbs with more efficient units; install automatic shutoff on selected lights.
Utilities Maint. Lighting Efficiency
Work completed and rebates requested from Idaho Power Dec 2009.
Replace light bulbs with more efficient units; install automatic shutoff on selected lights.
Lander St WWTF lighting efficiency
Work completed October 2010; Idaho Power reimbursed $3,367 for project.
Lighting and other non-process electrical efficiency work at the facility.
Lab addition Addition commissioned November 2010.
Additional testing area provided for metals measurements, requires high volumes of filtered outside air and high building exhaust rates. Heating provided by hot water boilers with dual fuel burners that can use biogas.
Food & Grease Waste to Biogas Facility
Study and preliminary design March through Nov 2012.
Divert food waste from the landfill and grease trap waste from hazardous waste landfill for beneficial use generating biogas for CHP or for sale to natural gas utility.
West Boise new THK/PSF building
Final Design through May 2013; in service May 2015
Natural gas heating system designed for easy conversion to hot water if CHP project is constructed.

Wastewater Treatment Facilities Utility Energy Reduction Projects 16
Lander Street Electrical Monitoring Summary: Area of Plant
Month
Meter (billed) kWh for month To
tal s
ub-
met
ered
Aer
atio
n bl
ower
s
UV
di
sinf
ectio
n pl
us W
3 pu
mpi
ng
Raw
Sew
age
pu
mps
Inte
rmed
iate
pu
mps
RA
S pu
mps
Aug-09 737,695 57.2% 26.2% 23.1% 2.6% 2.0% 3.2% Sep-09 705,798 59.5% 27.2% 24.3% 2.7% 2.2% 3.2% Oct-09 758,318 57.5% 26.9% 23.3% 2.4% 2.0% 2.9%
Nov-09 753,068 58.2% 27.7% 23.8% 2.3% 1.8% 2.7% Dec-09 721,661 56.5% 22.5% 25.2% 4.8% 1.8% 2.2% Jan-10 642,473 57.7% 23.7% 25.6% 4.0% 1.9% 2.5% Feb-10 580,974 60.8% 26.9% 25.6% 3.5% 1.5% 3.4% Mar-10 610,860 52.7% 20.0% 26.1% 3.2% 1.3% 2.0% Apr-10 560,393 53.9% 20.8% 26.1% 3.1% 1.5% 2.5%
May-10 641,492 58.5% 27.9% 22.4% 2.8% 2.0% 3.4% Jun-10 647,664 61.4% 30.1% 22.2% 3.6% 2.0% 3.5% Jul-10 660,572 58.6% 29.4% 20.5% 2.7% 2.1% 3.9%
Aug-10 674,517 59.2% 29.5% 21.2% 2.8% 1.9% 3.8% Sep-10 689,764 62.1% 31.5% 20.8% 3.8% 2.0% 4.0% Oct-10 681,980 60.3% 29.7% 21.8% 2.9% 2.0% 4.0%
Nov-10 661,500 59.6% 28.2% 22.9% 2.7% 2.0% 3.8% Dec-10 666,173 54.9% 24.7% 23.0% 2.4% 1.8% 2.9% Jan-11 630,627 53.1% 22.8% 22.4% 2.5% 1.8% 3.5% Feb-11 569,820 54.6% 24.4% 22.2% 2.6% 1.7% 3.7% Mar-11 629,866 55.8% 26.3% 21.5% 2.7% 1.8% 3.3% Apr-11 615,238 59.8% 27.9% 23.5% 2.8% 2.1% 3.5%
May-11 657,169 60.1% 27.8% 22.9% 3.0% 2.5% 3.9% Jun-11 657,563 62.5% 30.2% 22.9% 3.1% 2.7% 3.6% Jul-11 685,830 61.1% 30.3% 22.0% 3.0% 2.3% 3.4%
Aug-11 693,825 60.2% 30.7% 20.7% 2.7% 2.3% 3.8% Sep-11 682,984 63.5% 31.8% 22.7% 2.8% 2.2% 4.0% Oct-11 703,704 59.6% 29.6% 21.3% 2.7% 2.2% 3.8%
Nov-11 658,336 60.1% 28.4% 22.8% 2.5% 2.2% 4.2% Dec-11 658,471 57.3% 25.9% 22.6% 2.4% 2.1% 4.2% Jan-12 661,337 57.9% 25.6% 23.0% 2.5% 2.4% 4.3% Feb-12 621,718 60.4% 28.5% 23.1% 2.4% 2.3% 4.1% Mar-12 672,812 60.6% 29.1% 22.3% 2.8% 2.4% 4.0% Apr-12 648,563 62.9% 31.2% 22.6% 2.8% 2.7% 3.6%
May-12 671,790 60.9% 30.5% 21.1% 2.6% 2.7% 4.0% Jun-12 652,291 63.4% 31.6% 22.5% 2.6% 2.3% 4.4% Jul-12 698,850 60.0% 30.0% 21.7% 2.3% 1.9% 4.1%
Aug-12 704,653 60.1% 29.4% 22.1% 2.5% 2.1% 3.9% Sept-12 639,678 62.2% 29.8% 23.1% 2.7% 2.4% 4.3% Oct-12 666,861 59.7% 27.5% 23.1% 2.6% 2.4% 4.2% Nov-12 678,196 23.0% 10.7% 8.7% 1.2% 0.8% 1.6% Dec-12 741,877 59.4% 29.6% 21.7% 2.1% 2.1% 3.9% Jan-13 734,741 52.0% 26.3% 19.5% 1.9% 1.1% 3.2%

Wastewater Treatment Facilities Utility Energy Reduction Projects 17
West Boise Electrical Monitoring Summary: Area of Plant
Month
Meter (billed) kWh for month To
tal s
ub-
met
ered
Aer
atio
n bl
ower
s
UV
di
sinf
ectio
n pl
us W
3 pu
mpi
ng
Hea
dwor
ks
with
influ
ent
pum
ping
Nor
th p
lant
ae
ratio
n w
ith
RA
S &
ML
pum
ping
A
ll so
uth
plan
t aer
atio
n lo
ads e
xcep
t R
AS
pum
ping
Oct-08 1,239,375 65.1% 27.8% 19.7% 17.5% no record no record Nov-08 1,230,794 65.4% 28.5% 18.8% 18.1% no record no record Dec-08 1,300,832 70.2% 25.2% 18.2% 17.8% 3.4% 5.5% Jan-09 1,308,168 68.0% 24.7% 17.3% 18.2% 3.4% 4.4% Feb-09 1,202,940 69.0% 27.4% 17.6% 17.0% 2.9% 4.1% Mar-09 1,310,800 71.1% 29.1% 17.5% 17.9% 2.2% 4.4% Apr-09 1,206,250 68.0% 30.2% 17.4% 15.6% 3.4% 1.4%
May-09 1,213,291 59.3% 22.6% 16.0% 14.5% 4.2% 2.0% Jun-09 1,189,944 67.9% 30.7% 15.5% 14.0% 5.8% 1.9% Jul-09 1,245,155 67.4% 30.2% 15.4% 13.5% 6.3% 1.9%
Aug-09 1,220,467 67.4% 28.9% 16.3% 14.2% 6.0% 2.0% Sep-09 1,126,249 66.2% 27.8% 17.0% 13.6% 5.8% 2.1% Oct-09 1,126,131 64.3% 26.2% 16.8% 13.6% 5.4% 2.3%
Nov-09 1,080,132 63.7% 25.3% 16.7% 14.8% 4.7% 2.3% Dec-09 1,266,280 65.5% 26.9% 16.1% 16.3% 4.4% 1.7% Jan-10 1,243,546 63.2% 27.0% 15.6% 15.1% 3.8% 1.6% Feb-10 1,094,075 69.0% 28.6% 18.1% 16.0% 4.5% 1.8% Mar-10 1,211,730 66.0% 28.2% 17.8% 14.3% 4.2% 1.6% Apr-10 1,204,125 65.4% 29.6% 17.0% 13.2% 3.9% 1.7%
May-10 1,227,222 70.8% 29.0% 17.1% 17.7% 5.0% 2.0% Jun-10 1,223,800 72.1% 31.0% 16.0% 17.9% 5.3% 1.9% Jul-10 1,242,470 71.9% 28.5% 18.0% 17.9% 5.5% 2.0%
Aug-10 1,206,140 71.1% 27.5% 17.2% 18.4% 6.0% 2.0% Sep-10 1,131,310 79.6% 31.3% 19.7% 20.4% 6.2% 1.9% Oct-10 1,201,061 70.8% 28.1% 18.4% 18.1% 4.8% 1.4%
Nov-10 1,220,279 69.0% 27.3% 17.3% 18.4% 4.4% 1.6% Dec-10 1,329,298 68.0% 26.9% 15.8% 19.3% 4.4% 1.7% Jan-11 1,346,072 65.4% 25.2% 15.3% 19.1% 4.2% 1.7% Feb-11 1,245,455 65.0% 25.1% 15.6% 18.6% 4.2% 1.6% Mar-11 1,367,784 67.1% 28.2% 16.3% 17.3% 3.9% 1.4% Apr-11 1,321,716 67.0% 27.3% 16.4% 17.6% 4.6% 1.1%
May-11 1,342,182 70.1% 28.8% 17.3% 18.1% 4.5% 1.3% Jun-11 1,343,267 70.8% 29.5% 18.2% 16.5% 5.0% 1.7% Jul-11 1,318,232 68.5% 26.8% 19.2% 16.8% 4.6% 1.1%
Aug-11 1,345,483 67.9% 27.0% 19.2% 16.1% 4.6% 1.1% Sep-11 1,253,490 68.7% 26.7% 19.9% 16.5% 4.5% 1.2% Oct-11 1,296,053 69.4% 28.2% 19.5% 16.4% 4.0% 1.3%
Nov-11 1,251,678 67.6% 26.3% 19.0% 16.8% 3.9% 1.6% Dec-11 1,328,749 66.6% 26.2% 18.3% 16.7% 3.6% 1.7% Jan-12 1,347,910 65.0% 25.2% 17.9% 16.4% 3.7% 1.8% Feb-12 1,228,306 64.9% 25.4% 17.4% 16.6% 3.7% 1.7% Mar-12 1,327,073 66.4% 27.8% 17.2% 16.2% 3.7% 1.4%

Wastewater Treatment Facilities Utility Energy Reduction Projects 18
West Boise Electrical Monitoring Summary: Area of Plant
Month
Meter (billed) kWh for month To
tal s
ub-
met
ered
Aer
atio
n bl
ower
s
UV
di
sinf
ectio
n pl
us W
3 pu
mpi
ng
Hea
dwor
ks
with
influ
ent
pum
ping
Nor
th p
lant
ae
ratio
n w
ith
RA
S &
ML
pum
ping
A
ll so
uth
plan
t aer
atio
n lo
ads e
xcep
t R
AS
pum
ping
Apr-12 1,292,426 57.5% 29.2% 6.9%* 17.1% 3.0% 1.2% May-12 1,356,590 69.5% 30.7% 18.0% 16.8% 3.0% 1.1% Jun-12 1,249,028 67.2% 29.2% 18.7% 15.0%* 3.1% 1.1% Jul-12 1,343,215 63.4% 28.6% 18.6% 11.9%* 3.1% 1.1%
Aug-12 1,460,090 67.4% 33.6% 17.6% 12.5% 3.0% 0.8% Sept-12 1,285,516 72.1% 31.8% 19.3% 16.4% 3.5% 1.2% Oct-12 1,336,352 68.7% 29.0% 18.3% 16.5% 3.6% 1.2% Nov-12 1,296,037 65.4% 27.3% 18.1% 16.7% 3.2% No data Dec-12 1,341,472 63.9% 26.4% 18.3% 15.8% 3.3% No data Jan-13 1,502,258 57.4% 24.4% 14.0% 15.9% 3.1% No data
* Replacement of hardware and problems with updated programming caused a loss of data for these readings