city of atlanta general employees pension fund …
TRANSCRIPT

DECEMBER 31, 2009
PERFORMANCE REPORTPERIOD ENDING
CITY OF ATLANTA GENERAL EMPLOYEESPENSION FUND
(678)805-0508
Gray & CompanyInvestment Management Consultants
7000 Peachtree-Dunwoody Road, Bldg. 5Atlanta, GA 30328
I. CAPITAL MARKETS REVIEW 1-9
II. PLAN PERFORMANCE AND ANALYSIS 1-16
Executive Overview 1Executive Summary - Total Plan Performance 2-5Asset Allocation - Actual Assets 6Asset Allocation - Investment Policy Index 7Fund Allocation by Manager 8Risk/Return Analysis - Total Fund 9-11Equity Analysis - Total Fund 12-13Fixed Income Analysis - Total Fund 14-15Market Sector Analysis- Total Fund 16
III. MANAGER PERFORMANCE AND ANALYSIS 1-35
Earnest Partners - Large Cap Value Equity 1-3Globalt - Large Cap Growth Equity 4-6New Amsterdam Partners - Large Cap Growth Equity 7-9Union Heritage Capital - Large Cap Value Equity 10-12M di S I t (NY Lif ) Mid C C E it 13 15
SECTION PAGE
TABLE OF CONTENTS
Madison Square Investors (NY Life) - Mid Cap Core Equity 13-15Ishares Russell - Mid Cap Value Equity 16-17Wellington Management - Mid Cap Core Equity 18-20Earnest Partners - Small Cap Value Equity 21-23Jennison - Small Cap Core Equity 24-26Atlanta Capital - Intermediate Fixed Income 27-29JPMorgan - Core Fixed Income 30-32Mesirow - Core Fixed Income 33-35
IV. APPENDICES
A. Commissions & Trades ReportsB. Explanation of BenchmarksC. Index DefinitionsD. Universe DefinitionsE. Definitions of Common Terms
This report was prepared by Gray & Company Investment Management Consulting using market index and universe data provided by the Wilshire Cooperative, as well as information provided by and received from the client. Past investment performance results are not indicative of future performance results. Gray & Co. does not warrant the accuracy of data provided to us by others, although we do take reasonable care to obtain and utilize only reliable information.

CAPITAL MARKET REVIEWFourth Quarter 2009
CAPITAL MARKET REVIEWFourth Quarter 2009
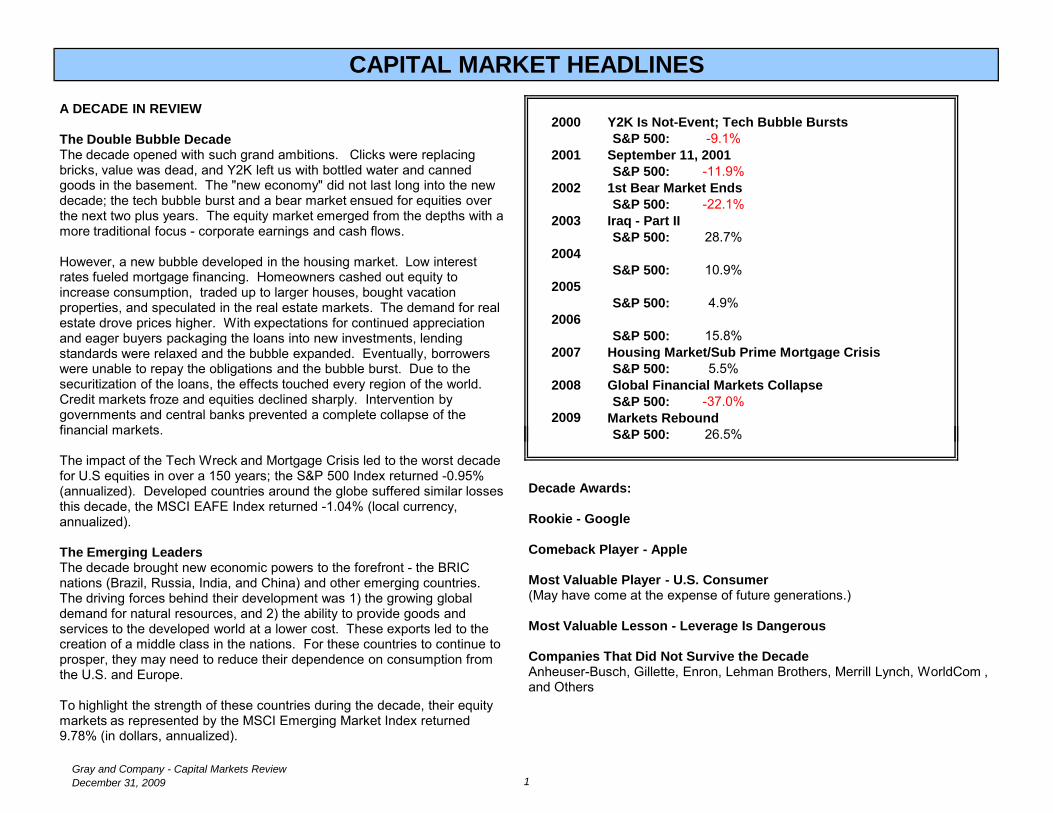
2000 Y2K Is Not-Event; Tech Bubble BurstsS&P 500: -9.1%
2001 September 11, 2001S&P 500: -11.9%
2002 1st Bear Market EndsS&P 500: -22.1%
2003 Iraq - Part IIS&P 500: 28.7%
2004S&P 500: 10.9%
2005S&P 500: 4.9%
2006S&P 500: 15.8%
2007 Housing Market/Sub Prime Mortgage CrisisS&P 500: 5.5%
2008 Global Financial Markets CollapseS&P 500: -37.0%
2009 Markets ReboundS&P 00 26 5%
CAPITAL MARKET HEADLINESA DECADE IN REVIEW
The Double Bubble DecadeThe decade opened with such grand ambitions. Clicks were replacing bricks, value was dead, and Y2K left us with bottled water and canned goods in the basement. The "new economy" did not last long into the new decade; the tech bubble burst and a bear market ensued for equities over the next two plus years. The equity market emerged from the depths with a more traditional focus - corporate earnings and cash flows.
However, a new bubble developed in the housing market. Low interest rates fueled mortgage financing. Homeowners cashed out equity to increase consumption, traded up to larger houses, bought vacation properties, and speculated in the real estate markets. The demand for real estate drove prices higher. With expectations for continued appreciation and eager buyers packaging the loans into new investments, lending standards were relaxed and the bubble expanded. Eventually, borrowers were unable to repay the obligations and the bubble burst. Due to the securitization of the loans, the effects touched every region of the world. Credit markets froze and equities declined sharply. Intervention by governments and central banks prevented a complete collapse of the financial markets. S&P 500: 26.5%
A DECADE IN REVIEW
The Double Bubble DecadeThe decade opened with such grand ambitions. Clicks were replacing bricks, value was dead, and Y2K left us with bottled water and canned goods in the basement. The "new economy" did not last long into the new decade; the tech bubble burst and a bear market ensued for equities over the next two plus years. The equity market emerged from the depths with a more traditional focus - corporate earnings and cash flows.
However, a new bubble developed in the housing market. Low interest rates fueled mortgage financing. Homeowners cashed out equity to increase consumption, traded up to larger houses, bought vacation properties, and speculated in the real estate markets. The demand for real estate drove prices higher. With expectations for continued appreciation and eager buyers packaging the loans into new investments, lending standards were relaxed and the bubble expanded. Eventually, borrowers were unable to repay the obligations and the bubble burst. Due to the securitization of the loans, the effects touched every region of the world. Credit markets froze and equities declined sharply. Intervention by governments and central banks prevented a complete collapse of the financial markets.
The impact of the Tech Wreck and Mortgage Crisis led to the worst decade for U.S equities in over a 150 years; the S&P 500 Index returned -0.95% (annualized). Developed countries around the globe suffered similar losses this decade, the MSCI EAFE Index returned -1.04% (local currency, annualized).
The Emerging LeadersThe decade brought new economic powers to the forefront - the BRIC nations (Brazil, Russia, India, and China) and other emerging countries. The driving forces behind their development was 1) the growing global demand for natural resources, and 2) the ability to provide goods and services to the developed world at a lower cost. These exports led to the creation of a middle class in the nations. For these countries to continue to prosper, they may need to reduce their dependence on consumption from the U.S. and Europe.
To highlight the strength of these countries during the decade, their equity markets as represented by the MSCI Emerging Market Index returned 9.78% (in dollars, annualized).
Decade Awards:
Rookie - Google
Comeback Player - Apple
Most Valuable Player - U.S. Consumer(May have come at the expense of future generations.)
Most Valuable Lesson - Leverage Is Dangerous
Companies That Did Not Survive the DecadeAnheuser-Busch, Gillette, Enron, Lehman Brothers, Merrill Lynch, WorldCom , and Others
Gray and Company - Capital Markets ReviewDecember 31, 2009 1

CAPITAL MARKET REVIEW
Heavy Dosage: A heavy dose of fiscal and monetary medicine moved the U.S. economy from the intensive care unit into recovery in 2009. The estimated government stimulus of 20% of GDP pushed the economy into positive growth territory. To put that 20% in perspective, since WWII the federal government has never used a level of stimulus that exceeded 2.9% of GDP. Now that the medicine has taken effect, the pundits are left to ponder whether growth can be sustained without the stimulus programs. Factors included in the debate are an anemic job growth environment, a debt laden federal government , and inflation potentially knocking at the front door.
The ever present inflation verses deflation battle continues. Producer prices followed commodity prices higher for the quarter but didn't appear to impact inflation, as CPI remained relatively flat. Shorter-term core inflation expectations are subdued in the wake of high unemployment, but headline inflation, which includes food and energy, is expected to push higher.
The Federal Reserve maintained the Fed Funds Rate at 0.25% during the quarter and reiterated their low rate intention for the foreseeable future. The current policy will likely remain in place until the economic recovery is well entrenched.
There has been a lot of talk this year about raising rates and the unwinding of several stimulus programs in the advent of the alphabet soup of government programs
t d t t bili th At i t th t t lk ill t t ti Whil3.0
4.0
5.0
6.0
7.0
eld
(%)
Historical Fed Funds Rate
0.33.0 2.4 2.62.30
4.713.26 3.26
9.03
18.91
-3.83
1.96
-5.0
0.0
5.0
10.0
15.0
20.0
25.0
3 Months 1 Year 3 Year 5 Year
% C
hang
e
Inflation IndicatorAs of December 31, 2009 CPI
PPI
DJ UBS CI
Heavy Dosage: A heavy dose of fiscal and monetary medicine moved the U.S. economy from the intensive care unit into recovery in 2009. The estimated government stimulus of 20% of GDP pushed the economy into positive growth territory. To put that 20% in perspective, since WWII the federal government has never used a level of stimulus that exceeded 2.9% of GDP. Now that the medicine has taken effect, the pundits are left to ponder whether growth can be sustained without the stimulus programs. Factors included in the debate are an anemic job growth environment, a debt laden federal government , and inflation potentially knocking at the front door.
The ever present inflation verses deflation battle continues. Producer prices followed commodity prices higher for the quarter but didn't appear to impact inflation, as CPI remained relatively flat. Shorter-term core inflation expectations are subdued in the wake of high unemployment, but headline inflation, which includes food and energy, is expected to push higher.
The Federal Reserve maintained the Fed Funds Rate at 0.25% during the quarter and reiterated their low rate intention for the foreseeable future. The current policy will likely remain in place until the economic recovery is well entrenched.
There has been a lot of talk this year about raising rates and the unwinding of several stimulus programs in the advent of the alphabet soup of government programs created to stabilize the economy. At some point that talk will turn to action. While it's not known if action will be taken in six months or twelve months or later, when it does occur it's a good bet that there will be a pullback in the markets.
In the meantime, the yield curve shifted upward from last quarter. Concerns surrounding the supply in Treasuries, inflation, and the hunt for higher yielding investments lessened demand for Treasuries.
0.0
1.0
2.0
3.0
4.0
5.0
6.0
7.0
1Q00 1Q01 1Q02 1Q03 1Q04 1Q05 2Q06 2Q07 2Q08 2Q09
Yiel
d (%
)
Historical Fed Funds Rate
0.0
1.0
2.0
3.0
4.0
5.0
0 5 10 15 20 25 30
Yiel
d (%
)
Years
Yield Curve
Dec-08Sep-09Dec-09
0.33.0 2.4 2.62.30
4.713.26 3.26
9.03
18.91
-3.83
1.96
-5.0
0.0
5.0
10.0
15.0
20.0
25.0
3 Months 1 Year 3 Year 5 Year
% C
hang
e
Inflation IndicatorAs of December 31, 2009 CPI
PPI
DJ UBS CI
Gray and Company - Capital Markets ReviewDecember 31, 2009 2

CAPITAL MARKET REVIEWA Return to Growth: Most major economies returned to positive GDP growth in the fourth quarter, with many developing countries experiencing sharp increases in economic activity. The equity and credit markets benefited from the positive news. Furthermore, the government programs have improved the liquidity and stability in the capital markets and mended the banking industry.
The equity markets posted another positive quarter, although somewhat muted in comparison to the double digit returns from the second and third quarters. Emerging markets continued to lead the equity recovery, rising over 75% in the past year. Volatility measures and country correlations are returning to pre-crisis levels.
The fixed income markets continued the rotation from low yielding assets (cash and government bonds) into corporate securities. Yield curves shifted higher and credit spreads narrowed around the globe, netting weak results for bond investors.
Prices in other asset classes appear to be stabilizing. Private equity and real estate has been impacted by the decline in the capital markets, expectations from existing investments are for lower returns and extended maturities.
Policy makers must develop strategies to extract the federal assistance from th k t ith t tti th i b l S t i bl i
6.0
3.9
2.2
8.6
0.2
-1.9
26.5
27.2
31.8
78.5
5.9
2.6
Standard & Poors 500
Russell 2000
MSCI EAFE (Net)
MSCI Emerging Markets (Net)
Barclays Aggregate
Citigroup Non-U.S. Govt Bond
Global Market PerformanceAs of December 31, 2009
3 Months
12 Months
A Return to Growth: Most major economies returned to positive GDP growth in the fourth quarter, with many developing countries experiencing sharp increases in economic activity. The equity and credit markets benefited from the positive news. Furthermore, the government programs have improved the liquidity and stability in the capital markets and mended the banking industry.
The equity markets posted another positive quarter, although somewhat muted in comparison to the double digit returns from the second and third quarters. Emerging markets continued to lead the equity recovery, rising over 75% in the past year. Volatility measures and country correlations are returning to pre-crisis levels.
The fixed income markets continued the rotation from low yielding assets (cash and government bonds) into corporate securities. Yield curves shifted higher and credit spreads narrowed around the globe, netting weak results for bond investors.
Prices in other asset classes appear to be stabilizing. Private equity and real estate has been impacted by the decline in the capital markets, expectations from existing investments are for lower returns and extended maturities.
Policy makers must develop strategies to extract the federal assistance from the markets without upsetting the economic balance. Sustainable economic growth will depend on the consumption of the private sector.
6.0
3.9
2.2
8.6
0.2
-1.9
0.0
0.3
26.5
27.2
31.8
78.5
5.9
2.6
0.2
3.0
-10 0 10 20 30 40 50 60 70 80 90
Standard & Poors 500
Russell 2000
MSCI EAFE (Net)
MSCI Emerging Markets (Net)
Barclays Aggregate
Citigroup Non-U.S. Govt Bond
91-Day T-Bills
CPI
Return (%)
Global Market PerformanceAs of December 31, 2009
3 Months
12 Months
Gray and Company - Capital Markets ReviewDecember 31, 2009 3
3 Months 1 Year 3 Years 5 Years
6.04 26.45 (5.62) 0.425.56 37.38 (1.83) 3.275.12 25.58 (4.79) 1.366.07 28.42 (5.36) 0.797.94 37.21 (1.88) 1.644.22 16.69 (8.96) (0.26)3.88 27.19 (6.06) 0.514.14 34.48 (4.00) 0.883.63 20.57 (8.22) (0.01)
3 Months 1 Year 3 Years 5 Years
5.57 14.05 (0.03) 10.357.32 47.86 (1.46) 3.285.40 20.88 (6.49) (1.13)8 92 41 05 (6 69) (1 90)
Russell 1000 GrowthRussell 1000 Value
Russell 1000
U.S. EQUITY MARKET
Standard & Poors 500S&P MidCap 400S&P SmallCap 600
Total Returns - Periods Ending December 31, 2009
Energy
Russell 2000 ValueRussell 2000 Growth
S&P 500 Sector Performance
Russell 2000
IndustrialsMaterials
C Di ti
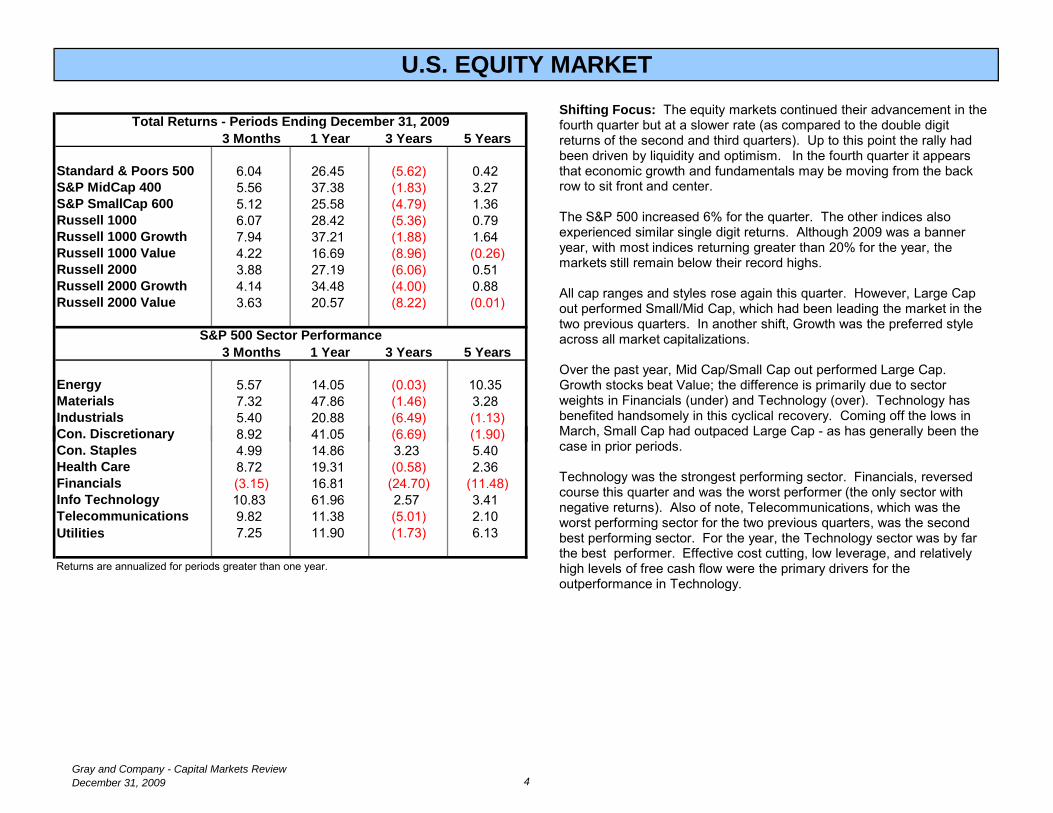
Shifting Focus: The equity markets continued their advancement in the fourth quarter but at a slower rate (as compared to the double digit returns of the second and third quarters). Up to this point the rally had been driven by liquidity and optimism. In the fourth quarter it appears that economic growth and fundamentals may be moving from the back row to sit front and center.
The S&P 500 increased 6% for the quarter. The other indices also experienced similar single digit returns. Although 2009 was a banner year, with most indices returning greater than 20% for the year, the markets still remain below their record highs.
All cap ranges and styles rose again this quarter. However, Large Cap out performed Small/Mid Cap, which had been leading the market in the two previous quarters. In another shift, Growth was the preferred style across all market capitalizations.
Over the past year, Mid Cap/Small Cap out performed Large Cap. Growth stocks beat Value; the difference is primarily due to sector weights in Financials (under) and Technology (over). Technology has benefited handsomely in this cyclical recovery. Coming off the lows in March, Small Cap had outpaced Large Cap - as has generally been the
i i i d8.92 41.05 (6.69) (1.90)4.99 14.86 3.23 5.408.72 19.31 (0.58) 2.36(3.15) 16.81 (24.70) (11.48)10.83 61.96 2.57 3.419.82 11.38 (5.01) 2.10
Utilities 7.25 11.90 (1.73) 6.13
Returns are annualized for periods greater than one year.
Con. Discretionary
TelecommunicationsInfo Technology
Health CareFinancials
Con. Staples
Shifting Focus: The equity markets continued their advancement in the fourth quarter but at a slower rate (as compared to the double digit returns of the second and third quarters). Up to this point the rally had been driven by liquidity and optimism. In the fourth quarter it appears that economic growth and fundamentals may be moving from the back row to sit front and center.
The S&P 500 increased 6% for the quarter. The other indices also experienced similar single digit returns. Although 2009 was a banner year, with most indices returning greater than 20% for the year, the markets still remain below their record highs.
All cap ranges and styles rose again this quarter. However, Large Cap out performed Small/Mid Cap, which had been leading the market in the two previous quarters. In another shift, Growth was the preferred style across all market capitalizations.
Over the past year, Mid Cap/Small Cap out performed Large Cap. Growth stocks beat Value; the difference is primarily due to sector weights in Financials (under) and Technology (over). Technology has benefited handsomely in this cyclical recovery. Coming off the lows in March, Small Cap had outpaced Large Cap - as has generally been the case in prior periods.
Technology was the strongest performing sector. Financials, reversed course this quarter and was the worst performer (the only sector with negative returns). Also of note, Telecommunications, which was the worst performing sector for the two previous quarters, was the second best performing sector. For the year, the Technology sector was by far the best performer. Effective cost cutting, low leverage, and relatively high levels of free cash flow were the primary drivers for the outperformance in Technology.
Gray and Company - Capital Markets ReviewDecember 31, 2009 4
U.S. EQUITY MARKET
-60.00
-50.00
-40.00
-30.00
-20.00
-10.00
0.00
10.00
20.00
30.00
40.00Russell 1000: Growth vs. Value
Rolling 1 Year Difference (%)
Rolling 3 Year Difference (%)
Advantage Growth
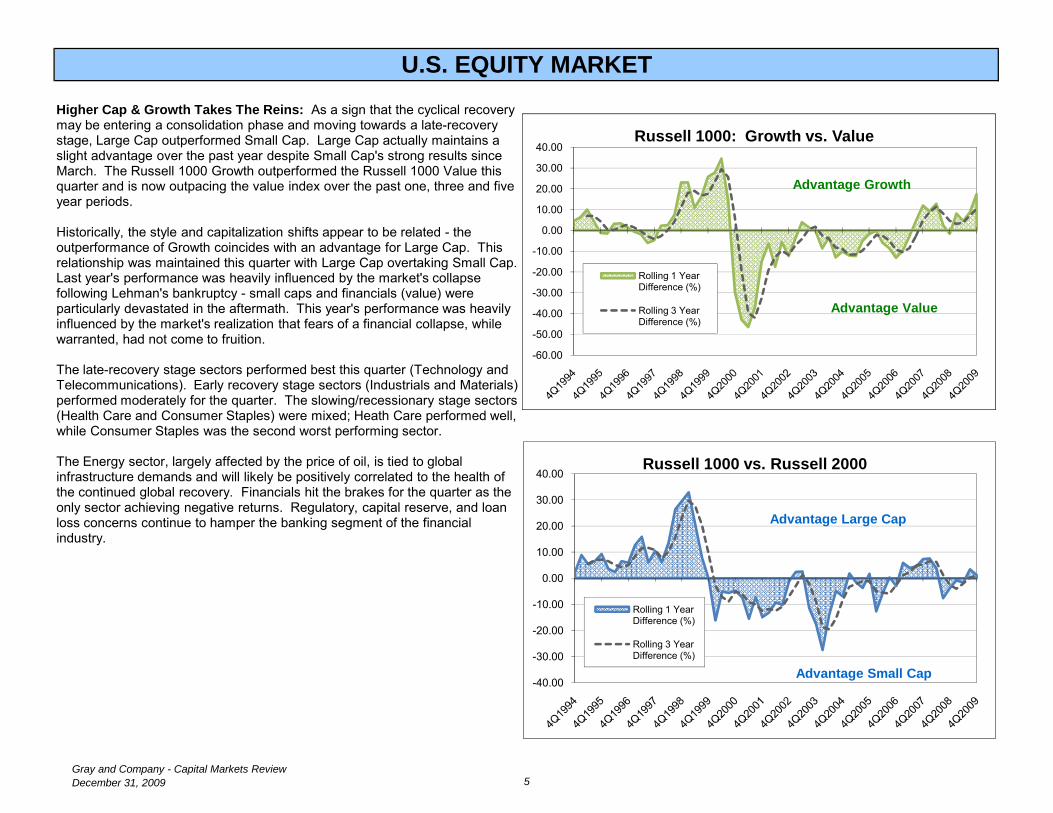
Higher Cap & Growth Takes The Reins: As a sign that the cyclical recovery may be entering a consolidation phase and moving towards a late-recovery stage, Large Cap outperformed Small Cap. Large Cap actually maintains a slight advantage over the past year despite Small Cap's strong results since March. The Russell 1000 Growth outperformed the Russell 1000 Value this quarter and is now outpacing the value index over the past one, three and five year periods.
Historically, the style and capitalization shifts appear to be related - theoutperformance of Growth coincides with an advantage for Large Cap. This relationship was maintained this quarter with Large Cap overtaking Small Cap. Last year's performance was heavily influenced by the market's collapse following Lehman's bankruptcy - small caps and financials (value) were particularly devastated in the aftermath. This year's performance was heavily influenced by the market's realization that fears of a financial collapse, while warranted, had not come to fruition.
The late-recovery stage sectors performed best this quarter (Technology and Telecommunications). Early recovery stage sectors (Industrials and Materials) performed moderately for the quarter. The slowing/recessionary stage sectors (Health Care and Consumer Staples) were mixed; Heath Care performed well, while Consumer Staples was the second worst performing sector.
Advantage Value
-40.00
-30.00
-20.00
-10.00
0.00
10.00
20.00
30.00
40.00Russell 1000 vs. Russell 2000
Rolling 1 Year Difference (%)
Rolling 3 Year Difference (%)
Advantage Large Cap
-60.00
-50.00
-40.00
-30.00
-20.00
-10.00
0.00
10.00
20.00
30.00
40.00Russell 1000: Growth vs. Value
Rolling 1 Year Difference (%)
Rolling 3 Year Difference (%)
Advantage Growth
Higher Cap & Growth Takes The Reins: As a sign that the cyclical recovery may be entering a consolidation phase and moving towards a late-recovery stage, Large Cap outperformed Small Cap. Large Cap actually maintains a slight advantage over the past year despite Small Cap's strong results since March. The Russell 1000 Growth outperformed the Russell 1000 Value this quarter and is now outpacing the value index over the past one, three and five year periods.
Historically, the style and capitalization shifts appear to be related - theoutperformance of Growth coincides with an advantage for Large Cap. This relationship was maintained this quarter with Large Cap overtaking Small Cap. Last year's performance was heavily influenced by the market's collapse following Lehman's bankruptcy - small caps and financials (value) were particularly devastated in the aftermath. This year's performance was heavily influenced by the market's realization that fears of a financial collapse, while warranted, had not come to fruition.
The late-recovery stage sectors performed best this quarter (Technology and Telecommunications). Early recovery stage sectors (Industrials and Materials) performed moderately for the quarter. The slowing/recessionary stage sectors (Health Care and Consumer Staples) were mixed; Heath Care performed well, while Consumer Staples was the second worst performing sector.
The Energy sector, largely affected by the price of oil, is tied to global infrastructure demands and will likely be positively correlated to the health of the continued global recovery. Financials hit the brakes for the quarter as the only sector achieving negative returns. Regulatory, capital reserve, and loan loss concerns continue to hamper the banking segment of the financial industry.
Advantage Small Cap
Advantage Value
Gray and Company - Capital Markets ReviewDecember 31, 2009 5
3 Months 1 Year 3 Years 5 Years
Barclays Aggregate 0.20 5.93 6.04 4.97Barclays Intm G/C 0.30 5.24 5.90 4.66Barclays G/C (0.21) 4.53 5.82 4.71Barclays Govt (1.00) (2.19) 6.10 4.87Barclays Credit 1.04 16.05 5.74 4.68Barclays Mortgage 0.56 5.89 7.00 5.75Barclays High Yield 6.20 58.21 5.98 6.47Barclays U.S TIPS 1.77 11.41 6.69 4.65Barclays 1-3 Yr Govt 0.08 1.41 5.03 4.18Barclays Long Govt (5.08) (12.18) 5.71 5.15
Sep-09 Dec-09 Change 10-Yr Avg.
81 55 (26) 79144 107 (37) 103
U.S. FIXED INCOME MARKET
Total Returns - Periods Ending December 31, 2009
Credit Spreads (in basis points)
AaaA
Returns are annualized for periods greater than one year.
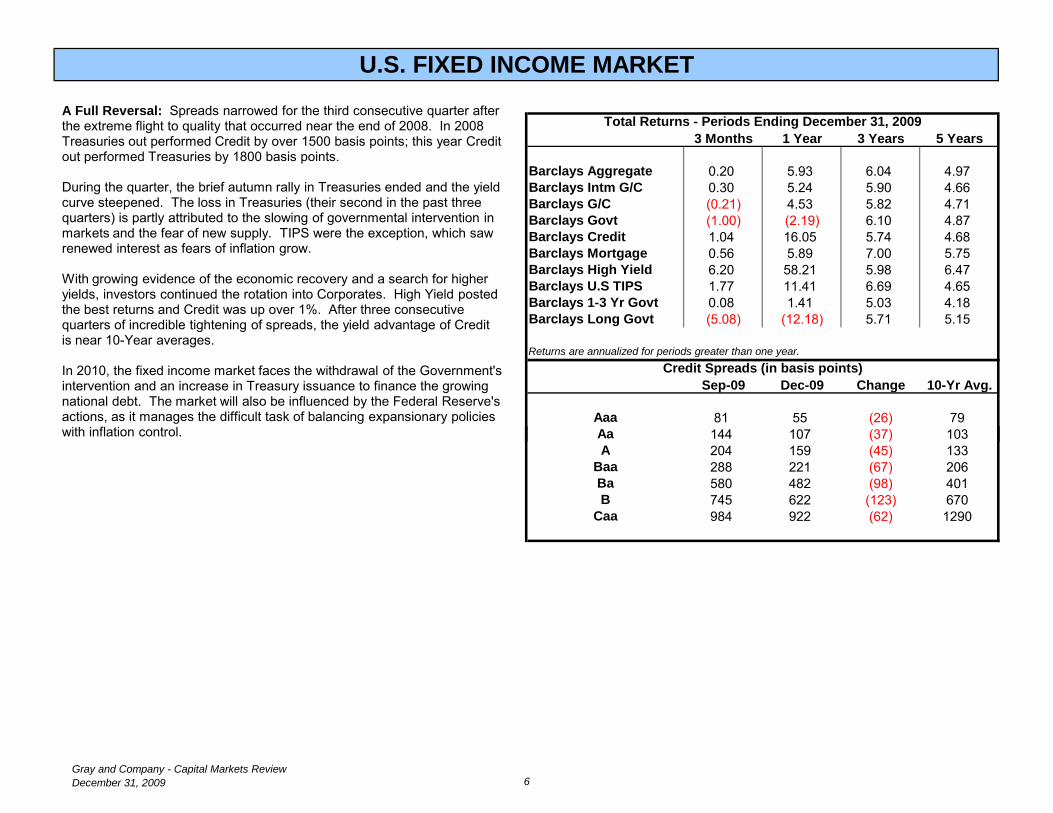
A Full Reversal: Spreads narrowed for the third consecutive quarter after the extreme flight to quality that occurred near the end of 2008. In 2008 Treasuries out performed Credit by over 1500 basis points; this year Credit out performed Treasuries by 1800 basis points.
During the quarter, the brief autumn rally in Treasuries ended and the yield curve steepened. The loss in Treasuries (their second in the past three quarters) is partly attributed to the slowing of governmental intervention in markets and the fear of new supply. TIPS were the exception, which saw renewed interest as fears of inflation grow.
With growing evidence of the economic recovery and a search for higher yields, investors continued the rotation into Corporates. High Yield posted the best returns and Credit was up over 1%. After three consecutive quarters of incredible tightening of spreads, the yield advantage of Credit is near 10-Year averages.
In 2010, the fixed income market faces the withdrawal of the Government's intervention and an increase in Treasury issuance to finance the growing national debt. The market will also be influenced by the Federal Reserve's actions, as it manages the difficult task of balancing expansionary policies with inflation control. 144 107 (37) 103
204 159 (45) 133288 221 (67) 206580 482 (98) 401745 622 (123) 670984 922 (62) 1290
BCaa
AaA
BaaBa
A Full Reversal: Spreads narrowed for the third consecutive quarter after the extreme flight to quality that occurred near the end of 2008. In 2008 Treasuries out performed Credit by over 1500 basis points; this year Credit out performed Treasuries by 1800 basis points.
During the quarter, the brief autumn rally in Treasuries ended and the yield curve steepened. The loss in Treasuries (their second in the past three quarters) is partly attributed to the slowing of governmental intervention in markets and the fear of new supply. TIPS were the exception, which saw renewed interest as fears of inflation grow.
With growing evidence of the economic recovery and a search for higher yields, investors continued the rotation into Corporates. High Yield posted the best returns and Credit was up over 1%. After three consecutive quarters of incredible tightening of spreads, the yield advantage of Credit is near 10-Year averages.
In 2010, the fixed income market faces the withdrawal of the Government's intervention and an increase in Treasury issuance to finance the growing national debt. The market will also be influenced by the Federal Reserve's actions, as it manages the difficult task of balancing expansionary policies with inflation control.
Gray and Company - Capital Markets ReviewDecember 31, 2009 6
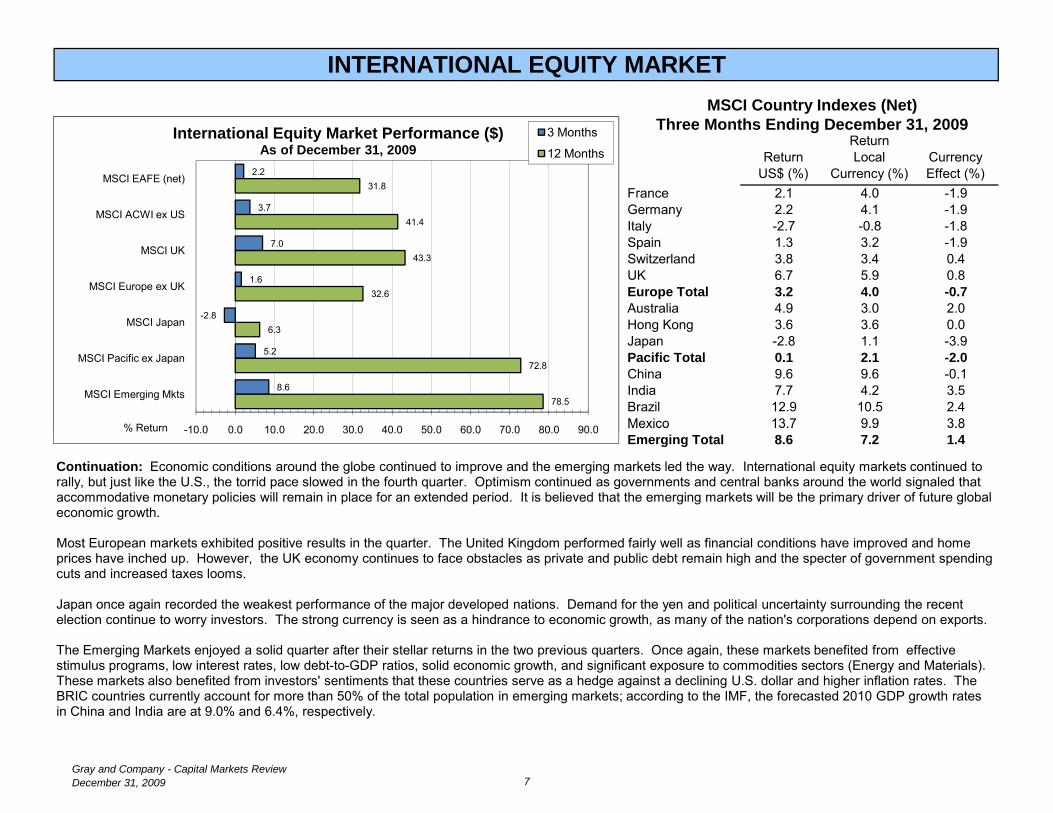
France 2.1 4.0 -1.9Germany 2.2 4.1 -1.9Italy -2.7 -0.8 -1.8Spain 1.3 3.2 -1.9Switzerland 3.8 3.4 0.4UK 6.7 5.9 0.8Europe Total 3.2 4.0 -0.7Australia 4.9 3.0 2.0Hong Kong 3.6 3.6 0.0Japan -2.8 1.1 -3.9Pacific Total 0.1 2.1 -2.0China 9.6 9.6 -0.1India 7.7 4.2 3.5Brazil 12.9 10.5 2.4Mexico 13.7 9.9 3.8
Return Local
Currency (%)Return
US$ (%)Currency Effect (%)
INTERNATIONAL EQUITY MARKETMSCI Country Indexes (Net)
Three Months Ending December 31, 2009
2.2
3.7
7.0
1.6
-2.8
5.2
8.6
31.8
41.4
43.3
32.6
6.3
72.8
78.5
-10 0 0 0 10 0 20 0 30 0 40 0 50 0 60 0 70 0 80 0 90 0
MSCI EAFE (net)
MSCI ACWI ex US
MSCI UK
MSCI Europe ex UK
MSCI Japan
MSCI Pacific ex Japan
MSCI Emerging Mkts
% Return
International Equity Market Performance ($)As of December 31, 2009
3 Months
12 Months
Mexico 13.7 9.9 3.8Emerging Total 8.6 7.2 1.4
Continuation: Economic conditions around the globe continued to improve and the emerging markets led the way. International equity markets continued to rally, but just like the U.S., the torrid pace slowed in the fourth quarter. Optimism continued as governments and central banks around the world signaled that accommodative monetary policies will remain in place for an extended period. It is believed that the emerging markets will be the primary driver of future global economic growth.
Most European markets exhibited positive results in the quarter. The United Kingdom performed fairly well as financial conditions have improved and home prices have inched up. However, the UK economy continues to face obstacles as private and public debt remain high and the specter of government spending cuts and increased taxes looms.
Japan once again recorded the weakest performance of the major developed nations. Demand for the yen and political uncertainty surrounding the recent election continue to worry investors. The strong currency is seen as a hindrance to economic growth, as many of the nation's corporations depend on exports.
The Emerging Markets enjoyed a solid quarter after their stellar returns in the two previous quarters. Once again, these markets benefited from effective stimulus programs, low interest rates, low debt-to-GDP ratios, solid economic growth, and significant exposure to commodities sectors (Energy and Materials). These markets also benefited from investors' sentiments that these countries serve as a hedge against a declining U.S. dollar and higher inflation rates. The BRIC countries currently account for more than 50% of the total population in emerging markets; according to the IMF, the forecasted 2010 GDP growth rates in China and India are at 9.0% and 6.4%, respectively.
2.2
3.7
7.0
1.6
-2.8
5.2
8.6
31.8
41.4
43.3
32.6
6.3
72.8
78.5
-10.0 0.0 10.0 20.0 30.0 40.0 50.0 60.0 70.0 80.0 90.0
MSCI EAFE (net)
MSCI ACWI ex US
MSCI UK
MSCI Europe ex UK
MSCI Japan
MSCI Pacific ex Japan
MSCI Emerging Mkts
% Return
International Equity Market Performance ($)As of December 31, 2009
3 Months
12 Months
Gray and Company - Capital Markets ReviewDecember 31, 2009 7

ReturnReturn Local Currency
US$ (%) Currency (%) Effect(%)Austria -1.5 0.4 -1.9Belgium -1.3 0.6 -1.9Denmark -1.9 -0.1 -1.8France -1.4 0.5 -1.9Germany -1.7 0.2 -1.8Ireland -1.9 -0.1 -1.8Italy -0.9 1.0 -1.9Netherlands -1.3 0.6 -1.9Spain -2.2 -0.3 -1.8Sweden -0.7 1.4 -2.1Switzerland 1.5 1.1 0.4UK -1.1 -2.1 1.0Europe Total -1.8 0.1 -1.8Japan -3.4 0.5 -3.8Australia 2.6 0.7 1.9
INTERNATIONAL BOND MARKETCitigroup World Government Bond IndexesThree Months Ending December 31, 2009
-2.2
0.1
-1.1-3.4
-1.7 -1.4
1.6
4.4
2.4
11.4
-1.8
5.26.3
15.7
-5.0
0.0
5.0
10.0
15.0
20.0
Citi Non US World Govt
Citi Non US World Govt
(hdgd)
Citi UK Citi Japan Citi Germany Citi France Citi Canada
Intl Fixed Income Market Performance ($)As of December 31, 2009
3 Months
12 Months
Australia 2.6 0.7 1.9Canada 1.6 -0.8 2.4
Yield Curves Rise and Spreads Tighten: A mixture of good and bad news affected the international fixed income markets. With the global recession ending, default expectations declined and investors rotated toward higher yielding corporate and emerging market securities. However, the fiscal policies, particularly in heavily indebted nations, weighed on governmental issues and yields rose.
With inflation under control, the European Central Bank (ECB) maintained their low rate/economic growth policies, holding the target rate at 1.0% and providing liquidity; however, pressure is growing for fiscal tightening. The major headline during the quarter was the downgrade of Greece, causing a sell off of their government bonds. The turmoil spread across the continent and impacted government bonds of most nations. In the U.K. economic data showed little improvement and inflation rose towards the 2.0% target set by the Bank of England. The central bank continued to be accommodative (and appears willing to be for some time), keeping the target rate at 0.5% and increasing the Asset Purchase program by £25 billion. Supply concerns pushed rates higher and the U.K was the worst performing government bond market this quarter. The Euro weakened against the dollar and the Pound Sterling appreciated.
Despite economic improvements in Japan, domestic consumption remained weak and consumer prices continued to decline. The government announced the nation was experiencing a deflationary period and the Bank of Japan reacted with a plan to inject over $100 billion into the system. Supply concerns to cover governmental stimulus programs initially drove yields higher, but yields declined by the end of the quarter to finish almost unchanged. The Yen appreciated during the Dubai crisis, but retreated by quarter-end amid intervention threats.
Emerging market bonds enjoyed another strong quarter relative to the developed markets, although the returns were varied by country. The JP Morgan EMBI ($ denominated debt) advanced 1.5%.
-2.2
0.1
-1.1-3.4
-1.7 -1.4
1.6
4.4
2.4
11.4
-1.8
5.26.3
15.7
-5.0
0.0
5.0
10.0
15.0
20.0
Citi Non US World Govt
Citi Non US World Govt
(hdgd)
Citi UK Citi Japan Citi Germany Citi France Citi Canada
Intl Fixed Income Market Performance ($)As of December 31, 2009
3 Months
12 Months
Gray and Company - Capital Markets ReviewDecember 31, 2009 8
US EQUITIESDow Jones Industrial Average 8.1 % 22.6 (3.1) 2.0 1.3Standard & Poors 500 6.0 26.5 (5.6) 0.4 (1.0)Russell 3000 5.9 28.3 (5.4) 0.8 (0.2)S&P MidCap 400 5.6 37.4 (1.8) 3.3 6.4Russell Mid-Cap 5.9 40.5 (4.6) 2.4 5.0S&P SmallCap 600 5.1 25.6 (4.8) 1.4 6.4Russell 2000 3.9 27.2 (6.1) 0.5 3.5Growth Stocks - Russell 3000 Growth 7.6 37.0 (2.1) 1.6 (3.8)Value Stocks - Russell 3000 Value 4.2 19.7 (8.9) (0.3) 2.9
US FIXED INCOMEBarclays Aggregate 0.2 % 5.9 6.0 5.0 6.3Barclays Intm Govt/Credit 0.3 5.2 5.9 4.7 5.9Barclays Govt/Credit (0.2) 4.5 5.8 4.7 6.3Barclays Government (1.0) (2.2) 6.1 4.9 6.2Barclays Credit 1.0 16.1 5.7 4.7 6.6Barclays Mortgage 0.6 5.9 7.0 5.8 6.4Barclays High Yield 6.2 58.2 6.0 6.5 6.7Barclays U.S TIPS 1.8 11.4 6.7 4.7 7.7Barclays 1 3 Yr Government 0 1 1 4 5 0 4 2 4 7
Ten Years
SELECTED INDEX RETURNS - PERIODS ENDING DECEMBER 31, 2009Quarter One Year Three Years Five Years
Barclays 1-3 Yr Government 0.1 1.4 5.0 4.2 4.7Barclays Long Government (5.1) (12.2) 5.7 5.2 7.7
INTERNATIONAL (Measured in US Dollars)MSCI EAFE (Net) 2.2 % 31.8 (6.0) 3.5 1.2MSCI ACWI ex U.S. (Net) 3.7 41.4 (3.5) 5.8 2.7MSCI Europe (Net) 3.2 35.8 (6.1) 3.9 2.0MSCI Pacific (Net) 0.1 24.2 (6.0) 2.7 (0.6)MSCI Emerging Markets (Net) 8.6 78.5 5.1 15.5 9.8Citigroup Non-U.S. Govt Bond (1.9) 2.6 8.1 4.5 6.6
REAL ESTATENAREIT Index 8.3 % 27.5 (13.1) (0.9) 10.2NCREIF Property Index
OTHER91-Day T-Bills 0.0 % 0.2 2.4 3.0 3.0Consumer Price Index (percent change) 0.3 3.0 2.4 2.6 2.6Producer Price Index (percent change) 2.3 4.7 3.3 3.3 2.8Note: Returns for periods longer than 12 months are annualized.
Gray and Company - Capital Markets ReviewDecember 31, 2009 9
PORTFOLIO EVALUATION PLAN RECONCILIATION
Beginning Market Value 962,398,150
Cash Flow In 21,211,213Intrafund Transfers -7,000,930Cash Flow Out -39,216,714
Net Cash Flow -25,006,431
INVESTMENT POLICY AND OBJECTIVES Investment Performance
Income 7,727,037Asset Value Changes 17,339,894
Gross Performance 25,066,931
OVERVIEW
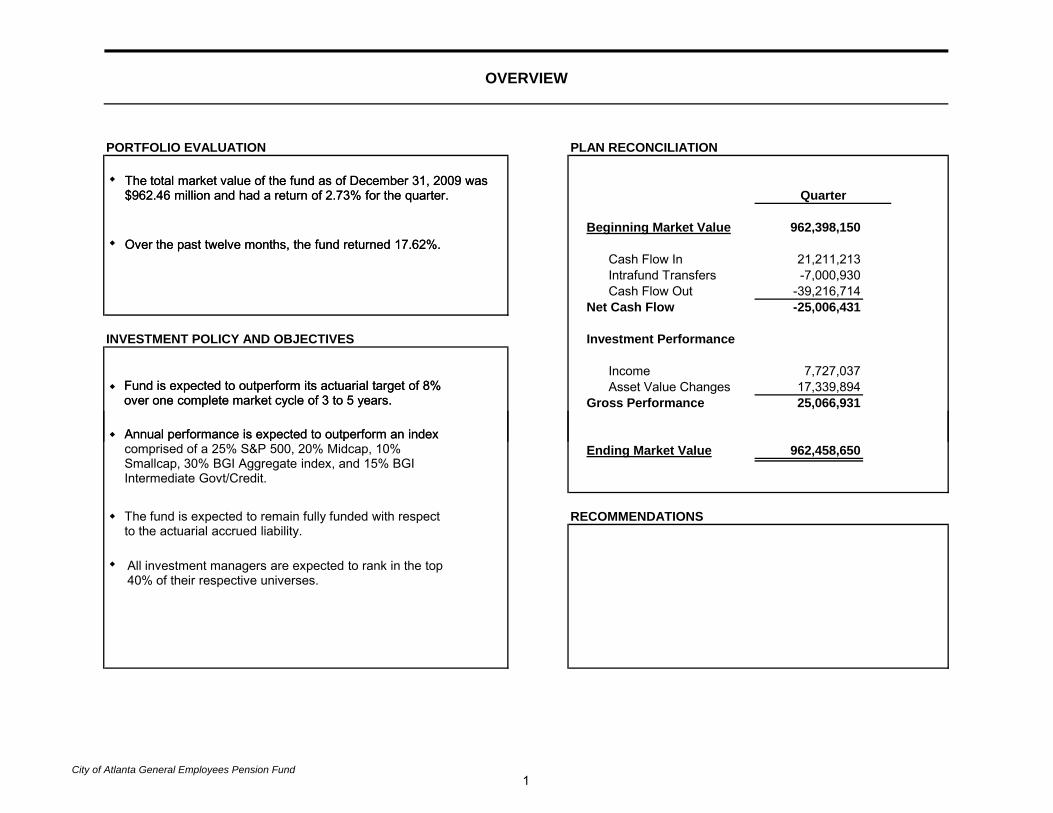
QuarterThe total market value of the fund as of December 31, 2009 was $962.46 million and had a return of 2.73% for the quarter.
Over the past twelve months, the fund returned 17.62%.
Fund is expected to outperform its actuarial target of 8% over one complete market cycle of 3 to 5 years.
Annual performance is expected to outperform an index Ending Market Value 962,458,650
RECOMMENDATIONS
The total market value of the fund as of December 31, 2009 was $962.46 million and had a return of 2.73% for the quarter.
Over the past twelve months, the fund returned 17.62%.
Fund is expected to outperform its actuarial target of 8% over one complete market cycle of 3 to 5 years.
Annual performance is expected to outperform an index comprised of a 25% S&P 500, 20% Midcap, 10% Smallcap, 30% BGI Aggregate index, and 15% BGI Intermediate Govt/Credit.
The fund is expected to remain fully funded with respect to the actuarial accrued liability.
All investment managers are expected to rank in the top 40% of their respective universes.
City of Atlanta General Employees Pension Fund1

Atlanta General Employees Pension FundExecutive Summary Table
Periods Ending December 31, 2009
2
Name
Value
$(000)
% of
Fund
Periods Ending 12/31/09
Cur Qtr 2 Qtrs 1 Year 2 Yrs 3 Yrs 5 Yrs 10 Yrs
Total Fund Composite
Policy Index
Large Cap Composite
Standard & Poors 500
EARNEST Partners Large Cap
Standard & Poors 500
GLOBALT Inc.
Standard & Poors 500
New Amsterdam Partners
Standard & Poors 500
Union Heritage Capital
Standard & Poors 500
Mid Cap Composite
S&P Midcap 400
Madison Square Investors
Russell MidCap
IShares Russell Mid Cap Value Fund
Russell MidCap Value
Wellington Mgmt
S&P Midcap 400
Small Cap Composite
Russell 2000
962,459
215,772
62,622
69,707
62,738
20,704
156,560
52,947
52,132
51,480
83,306
100.0
22.4
6.5
7.2
6.5
2.2
16.3
5.5
5.4
5.3
8.7
2.73
3.11
5.71
6.04
5.70
6.04
5.63
6.04
5.61
6.04
6.33
6.04
5.03
5.56
4.97
5.93
4.84
5.20
5.29
5.56
5.70
3.88
12.00
14.91
20.27
22.58
23.52
22.58
20.94
22.58
16.95
22.58
18.84
22.58
27.47
26.65
27.50
27.76
28.52
30.05
26.40
26.65
25.05
23.91
17.62
19.51
31.56
26.45
37.45
26.45
35.78
26.45
25.42
26.45
21.17
26.45
35.01
37.38
38.19
40.47
31.70
34.20
35.22
37.38
34.04
27.19
-1.17
-1.46
-8.83
-10.74
-9.95
-10.74
-7.31
-10.74
-10.70
-10.74
-5.49
-10.74
-10.31
-6.40
-9.93
-9.32
-10.45
-6.40
-6.74
-8.24
1.23
1.01
-3.87
-5.62
-5.25
-5.62
-1.43
-5.62
-5.71
-5.62
-0.51
-5.62
-6.52
-1.83
-4.93
-4.60
-5.57
-1.83
-3.41
-6.06
3.34
3.42
0.61
0.42
1.58
0.42
0.83
0.42
-0.15
0.42
1.52
0.42
-1.54
3.27
2.61
0.51
3.78
3.04
0.92
-0.95
1.30
-0.95
-1.96
-0.95
1.76
-0.95
2.57
-0.95
1.83
6.35
7.96
3.51
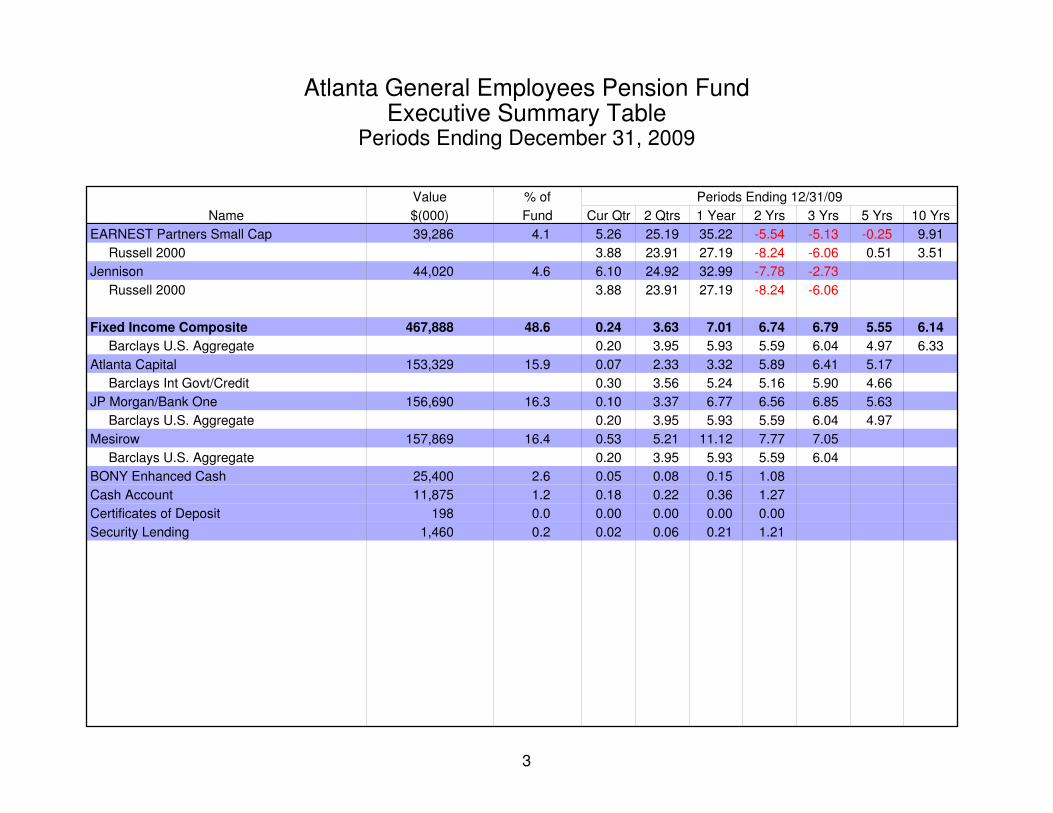
Atlanta General Employees Pension FundExecutive Summary Table
Periods Ending December 31, 2009
3
Name
Value
$(000)
% of
Fund
Periods Ending 12/31/09
Cur Qtr 2 Qtrs 1 Year 2 Yrs 3 Yrs 5 Yrs 10 Yrs
EARNEST Partners Small Cap
Russell 2000
Jennison
Russell 2000
Fixed Income Composite
Barclays U.S. Aggregate
Atlanta Capital
Barclays Int Govt/Credit
JP Morgan/Bank One
Barclays U.S. Aggregate
Mesirow
Barclays U.S. Aggregate
BONY Enhanced Cash
Cash Account
Certificates of Deposit
Security Lending
39,286
44,020
467,888
153,329
156,690
157,869
25,400
11,875
198
1,460
4.1
4.6
48.6
15.9
16.3
16.4
2.6
1.2
0.0
0.2
5.26
3.88
6.10
3.88
0.24
0.20
0.07
0.30
0.10
0.20
0.53
0.20
0.05
0.18
0.00
0.02
25.19
23.91
24.92
23.91
3.63
3.95
2.33
3.56
3.37
3.95
5.21
3.95
0.08
0.22
0.00
0.06
35.22
27.19
32.99
27.19
7.01
5.93
3.32
5.24
6.77
5.93
11.12
5.93
0.15
0.36
0.00
0.21
-5.54
-8.24
-7.78
-8.24
6.74
5.59
5.89
5.16
6.56
5.59
7.77
5.59
1.08
1.27
0.00
1.21
-5.13
-6.06
-2.73
-6.06
6.79
6.04
6.41
5.90
6.85
6.04
7.05
6.04
-0.25
0.51
5.55
4.97
5.17
4.66
5.63
4.97
9.91
3.51
6.14
6.33
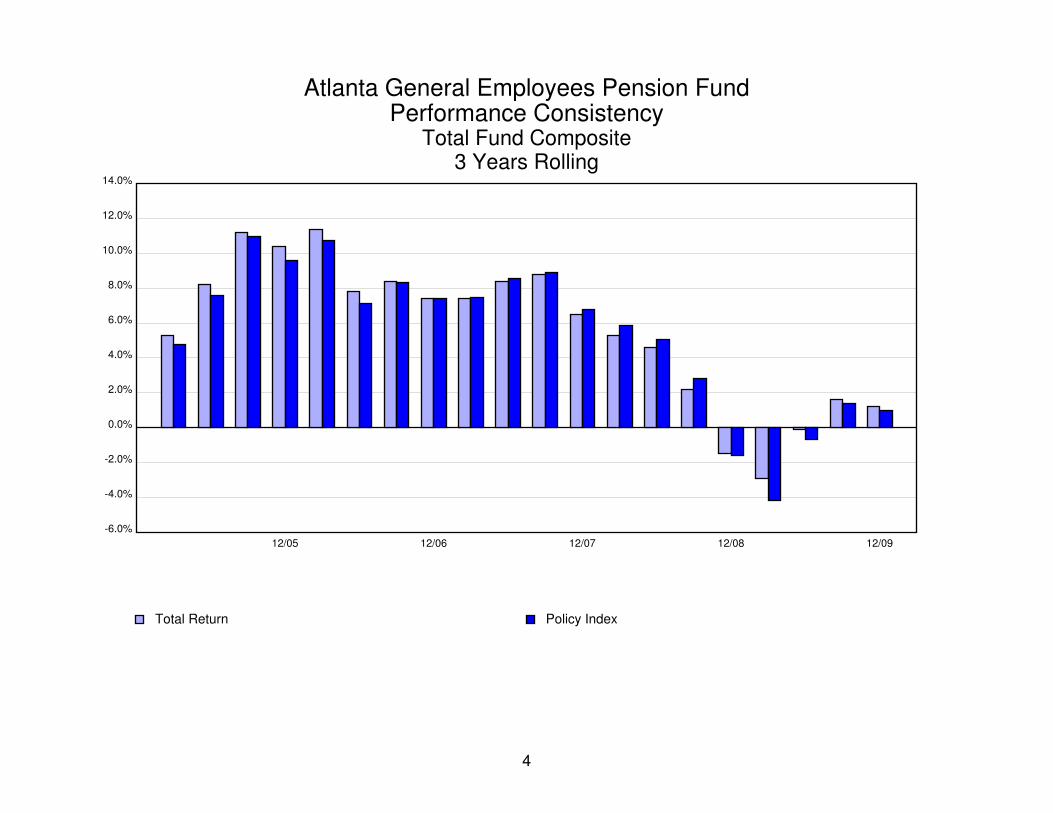
Atlanta General Employees Pension FundPerformance Consistency
Total Fund Composite3 Years Rolling
4
12/05 12/06 12/07 12/08 12/09
-6.0%
-4.0%
-2.0%
0.0%
2.0%
4.0%
6.0%
8.0%
10.0%
12.0%
14.0%
Total Return Policy Index

Atlanta General Employees Pension FundPerformance Consistency
Total Fund Composite3 Years Rolling
5
12/05 12/06 12/07 12/08 12/09
-4.0%
-2.0%
0.0%
2.0%
4.0%
6.0%
8.0%
10.0%
12.0%
14.0%
Total Return 8.0% Rate of Return

Atlanta General Employees Pension FundAsset And Policy Allocation
Total Fund Composite
6
December 31, 2009 $962,458,650
Intermediate$150,326,030 15.62%
Core$312,258,762 32.44%
Large Neutral$211,565,339 21.98%
Mid Neutral$103,301,621 10.73%
Cash & Equiv$53,396,713 5.55%Small Neutral$81,672,259 8.49%
Mid Value$49,937,925 5.19%

Atlanta General Employees Pension FundAsset And Policy Allocation
Total Fund Composite
7
December 31, 2009 Policy Index
S&P Midcap 40020.00%
Russell 200010.00%
Barclays Int Govt/Credit15.00%
Barclays U.S. Aggregate30.00%
Standard & Poors 50025.00%

Atlanta General Employees Pension FundTotal Fund Allocation By Manager
Total Fund Composite
8
December 31, 2009 $962,458,650
EARNEST Partners Large Cap$62,622,016 6.51%
EARNEST Partners Small Cap$39,286,495 4.08%
New Amsterdam Partners$62,738,004 6.52%
Madison Square Investors$52,947,493 5.50%
Atlanta Capital$153,329,399 15.93%
Mesirow$157,868,892 16.40%BONY Enhanced Cash$25,399,861 2.64%
IShares Russell Mid Cap Value Fund$52,132,101 5.42%
Certificates of Deposit$198,195 0.02%
Security Lending$1,459,593 0.15%Cash Account$11,875,385 1.23%
JP Morgan/Bank One$156,689,627 16.28%
Wellington Mgmt$51,480,107 5.35%
Union Heritage Capital$20,704,267 2.15%
Jennison$44,019,959 4.57%
GLOBALT Inc.$69,707,257 7.24%

Atlanta General Employees Pension FundQuarterly Total Return Market Line Analysis
Periods from 12/04 to 12/09
9
Annualiz
ed R
etu
rn
Variability (Historical Standard Deviation)
0.0 1.0 2.0 3.0 4.0 5.0 6.0 7.0 8.0 9.0 10.0 11.03.0
3.1
3.2
3.3
3.4
3.5
1
T
Total Fund Composite
1 Policy Index
T 91-Day Treasury Bill
Annualized
Return
Variability
Reward
Sharpe
Ratio
3.34
3.42
3.02
8.25
10.30
0.95
0.33
0.40
0.00
0.04
0.04
0.00
Sharpe Ratio = Reward / Variability

Atlanta General Employees Pension FundReturn vs Risk
Total Returns3 Years Ending 12/31/09
10
Annualiz
ed R
ate
of R
etu
rn
18.0 18.9 19.8 20.7 21.6 22.5 23.4 24.3 25.2 26.1 27.0-10.0
-9.1
-8.2
-7.3
-6.4
-5.5
-4.6
-3.7
-2.8
-1.9
-1.0
L
1
M
2
S
3
Index
Ris
k
Index
Return
Historical Standard Deviation of Return
Annualized Return Standard Deviation
L Large Cap Composite
1 Standard & Poors 500
M Mid Cap Composite
2 S&P Midcap 400
S Small Cap Composite
3 Russell 2000
Russell 3000
-3.87 20.57
-5.62 22.15
-6.52 26.54
-1.83 25.65
-3.41 25.17
-6.06 26.06
-5.43 22.81

Atlanta General Employees Pension FundReturn vs Risk
Total Returns5 Years Ending 12/31/09
11
Annualiz
ed R
ate
of R
etu
rn
14.0 15.0 16.0 17.0 18.0 19.0 20.0 21.0 22.0-3.0
-2.2
-1.5
-0.7
0.0
0.7
1.5
2.2
3.0
3.7
4.5
L 1
M
2
S
3
Index
Ris
k
Index
Return
Historical Standard Deviation of Return
Annualized Return Standard Deviation
L Large Cap Composite
1 Standard & Poors 500
M Mid Cap Composite
2 S&P Midcap 400
S Small Cap Composite
3 Russell 2000
Russell 3000
0.61 16.16
0.42 17.61
-1.54 20.51
3.27 20.25
2.61 20.27
0.51 21.68
0.77 18.15
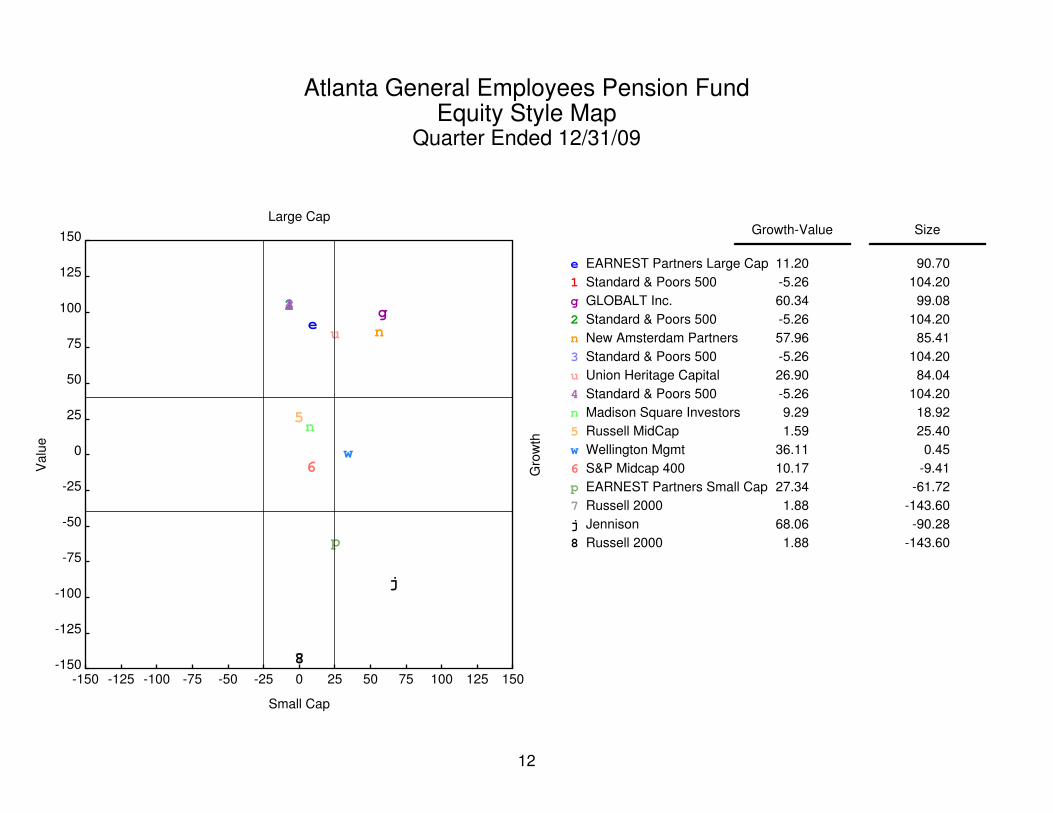
Atlanta General Employees Pension FundEquity Style Map
Quarter Ended 12/31/09
12
Valu
e
-150 -125 -100 -75 -50 -25 0 25 50 75 100 125 150-150
-125
-100
-75
-50
-25
0
25
50
75
100
125
150
e1 g2
n
3
u
4
n5
w6
p
7
j
8
Small Cap
Large Cap
Gro
wth
e EARNEST Partners Large Cap
1 Standard & Poors 500
g GLOBALT Inc.
2 Standard & Poors 500
n New Amsterdam Partners
3 Standard & Poors 500
u Union Heritage Capital
4 Standard & Poors 500
n Madison Square Investors
5 Russell MidCap
w Wellington Mgmt
6 S&P Midcap 400
p EARNEST Partners Small Cap
7 Russell 2000
j Jennison
8 Russell 2000
Growth-Value Size
11.20
-5.26
60.34
-5.26
57.96
-5.26
26.90
-5.26
9.29
1.59
36.11
10.17
27.34
1.88
68.06
1.88
90.70
104.20
99.08
104.20
85.41
104.20
84.04
104.20
18.92
25.40
0.45
-9.41
-61.72
-143.60
-90.28
-143.60
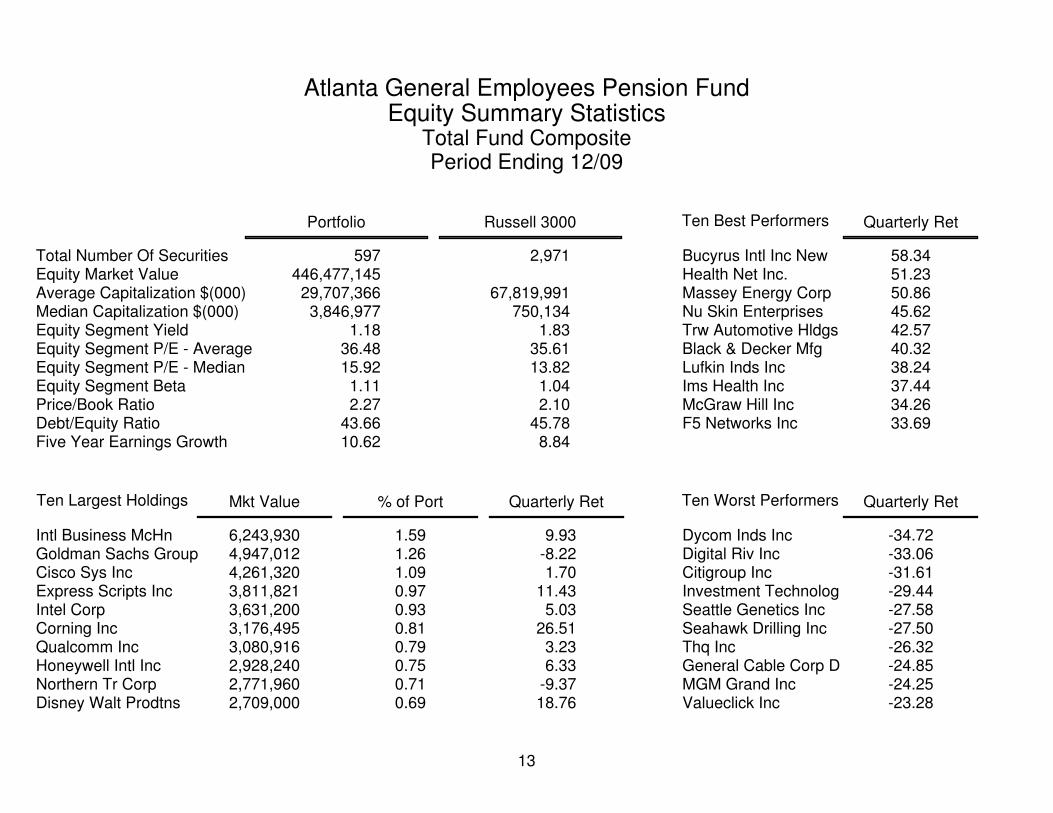
Atlanta General Employees Pension FundEquity Summary Statistics
Total Fund CompositePeriod Ending 12/09
13
Total Number Of SecuritiesEquity Market ValueAverage Capitalization $(000)Median Capitalization $(000)Equity Segment YieldEquity Segment P/E - AverageEquity Segment P/E - MedianEquity Segment BetaPrice/Book RatioDebt/Equity RatioFive Year Earnings Growth
Portfolio Russell 3000
597446,477,14529,707,3663,846,977
1.1836.4815.921.112.27
43.6610.62
2,971
67,819,991750,134
1.8335.6113.821.042.10
45.788.84
Ten Largest Holdings
Intl Business McHn Goldman Sachs Group Cisco Sys Inc Express Scripts Inc Intel Corp Corning Inc Qualcomm Inc Honeywell Intl Inc Northern Tr Corp Disney Walt Prodtns
Mkt Value % of Port Quarterly Ret
6,243,9304,947,0124,261,3203,811,8213,631,2003,176,4953,080,9162,928,2402,771,9602,709,000
1.591.261.090.970.930.810.790.750.710.69
9.93-8.221.70
11.435.03
26.513.236.33
-9.3718.76
Ten Best Performers
Bucyrus Intl Inc NewHealth Net Inc. Massey Energy Corp Nu Skin Enterprises Trw Automotive HldgsBlack & Decker Mfg Lufkin Inds Inc Ims Health Inc McGraw Hill Inc F5 Networks Inc
Quarterly Ret
58.3451.2350.8645.6242.5740.3238.2437.4434.2633.69
Ten Worst Performers
Dycom Inds Inc Digital Riv Inc Citigroup Inc Investment TechnologSeattle Genetics IncSeahawk Drilling IncThq Inc General Cable Corp DMGM Grand Inc Valueclick Inc
Quarterly Ret
-34.72-33.06-31.61-29.44-27.58-27.50-26.32-24.85-24.25-23.28

Atlanta General Employees Pension FundReturn vs Risk
Total Returns of Core Portfolios3 Years Ending 12/31/09
14
Annualiz
ed R
ate
of R
etu
rn
0.0 1.0 2.0 3.0 4.0 5.0 6.0 7.0 8.0 9.0 10.04.0
4.5
5.0
5.5
6.0
6.5
7.0
7.5
8.0
8.5
9.0
F
L
Media
n
Ris
k
Median
Return
Historical Standard Deviation of Return
Annualized Return Standard Deviation
Value Rank Value Rank
F Fixed Income Composite
L Barclays U.S. Aggregate
Median
6.79 32 3.43 23
6.04 62 3.67 33
6.27 4.38
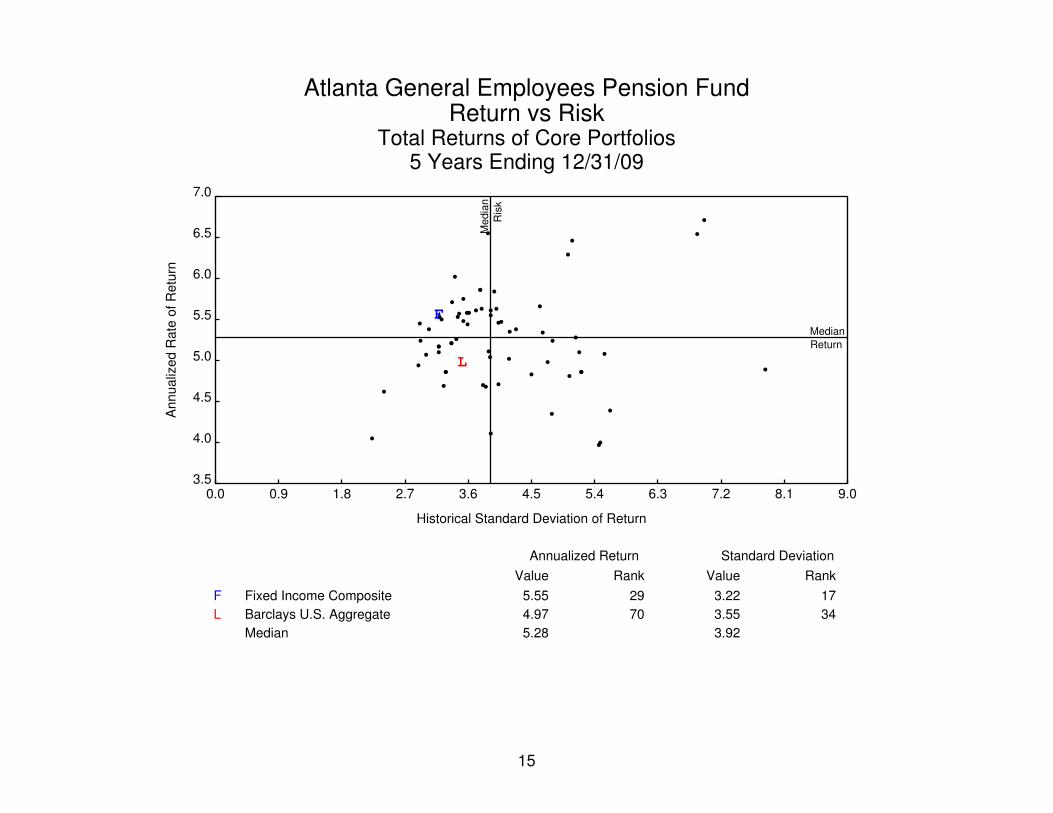
Atlanta General Employees Pension FundReturn vs Risk
Total Returns of Core Portfolios5 Years Ending 12/31/09
15
Annualiz
ed R
ate
of R
etu
rn
0.0 0.9 1.8 2.7 3.6 4.5 5.4 6.3 7.2 8.1 9.03.5
4.0
4.5
5.0
5.5
6.0
6.5
7.0
F
L
Media
n
Ris
k
Median
Return
Historical Standard Deviation of Return
Annualized Return Standard Deviation
Value Rank Value Rank
F Fixed Income Composite
L Barclays U.S. Aggregate
Median
5.55 29 3.22 17
4.97 70 3.55 34
5.28 3.92
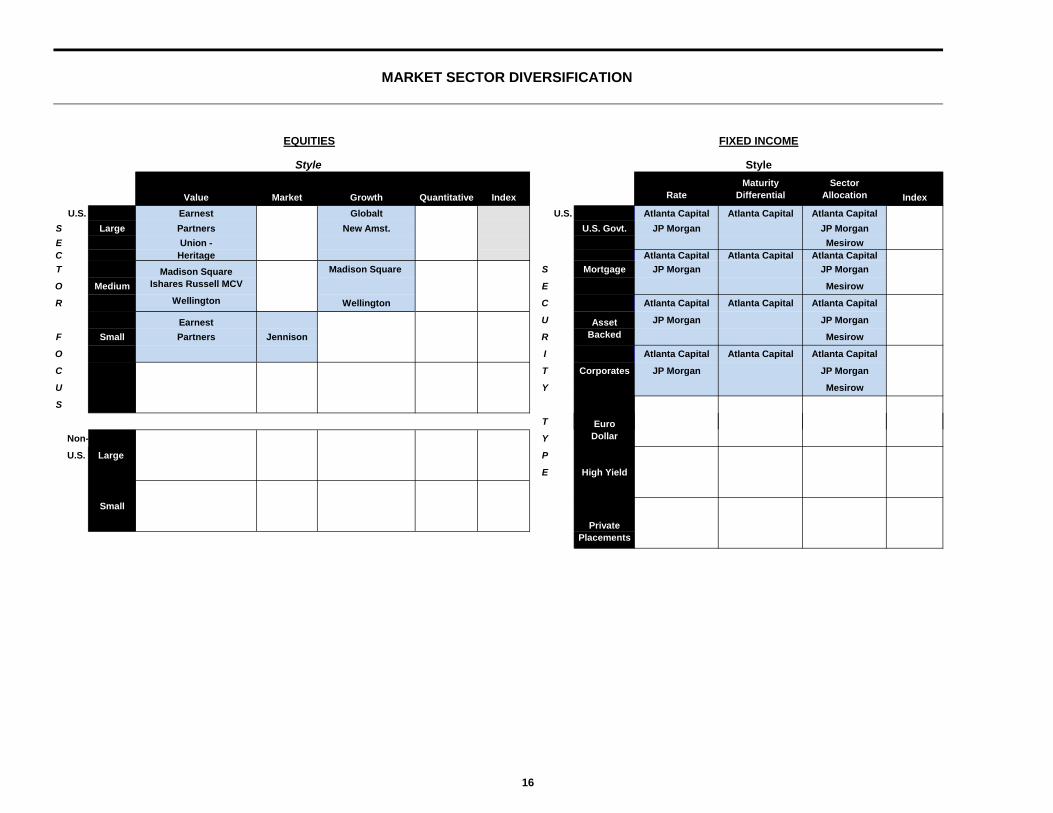
MARKET SECTOR DIVERSIFICATION
Maturity SectorValue Market Growth Quantitative Index Rate Differential Allocation Index
U.S. Earnest Globalt U.S. Atlanta Capital Atlanta Capital Atlanta CapitalS Large Partners New Amst. U.S. Govt. JP Morgan JP MorganE Union - MesirowC Heritage Atlanta Capital Atlanta Capital Atlanta CapitalT Madison Square Madison Square S Mortgage JP Morgan JP Morgan
O Medium Ishares Russell MCV E Mesirow
R Wellington Wellington C Atlanta Capital Atlanta Capital Atlanta Capital
Earnest U Asset JP Morgan JP Morgan
F Small Partners Jennison R Backed Mesirow
O I Atlanta Capital Atlanta Capital Atlanta Capital
C T Corporates JP Morgan JP Morgan
U Y Mesirow
S
T Euro
EQUITIES
Style
FIXED INCOME
Style
Non- Y Dollar
U.S. Large P
E High Yield
Small
PrivatePlacements
16
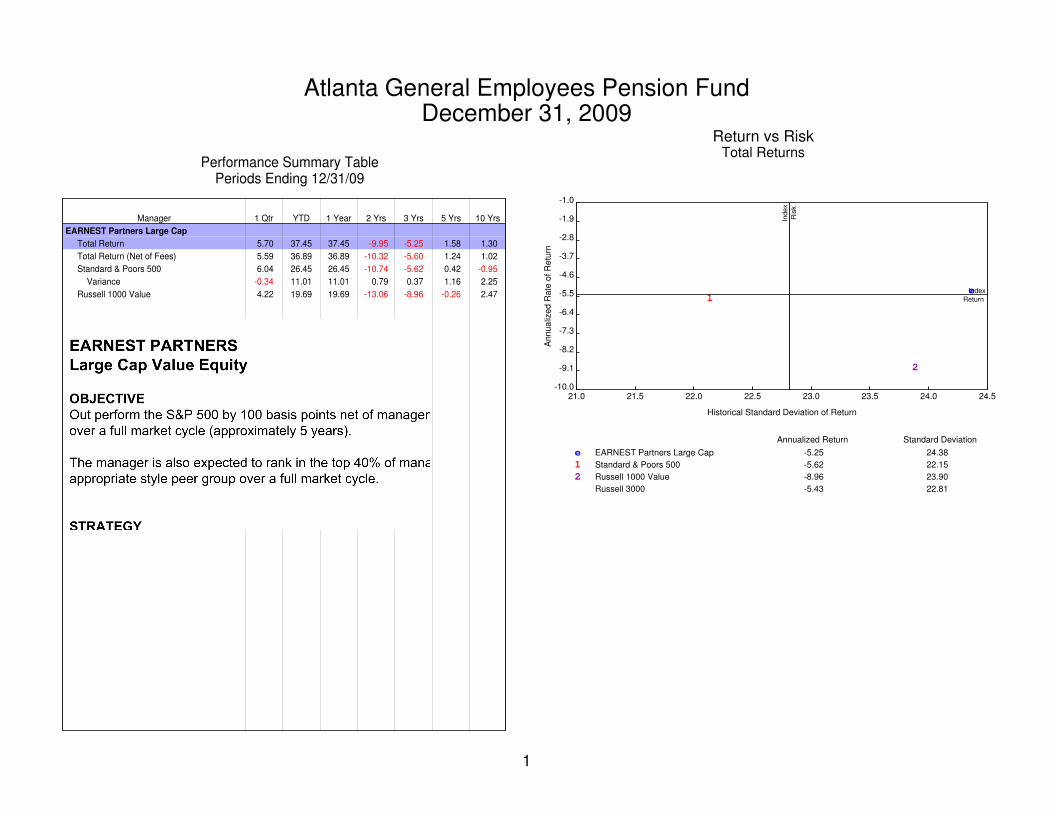
Atlanta General Employees Pension FundDecember 31, 2009
1
Performance Summary TablePeriods Ending 12/31/09
Manager 1 Qtr YTD 1 Year 2 Yrs 3 Yrs 5 Yrs 10 Yrs
EARNEST Partners Large Cap
Total Return
Total Return (Net of Fees)
Standard & Poors 500
Variance
Russell 1000 Value
5.70
5.59
6.04
-0.34
4.22
37.45
36.89
26.45
11.01
19.69
37.45
36.89
26.45
11.01
19.69
-9.95
-10.32
-10.74
0.79
-13.06
-5.25
-5.60
-5.62
0.37
-8.96
1.58
1.24
0.42
1.16
-0.26
1.30
1.02
-0.95
2.25
2.47
Return vs RiskTotal Returns
An
nua
lize
d R
ate
of
Retu
rn
21.0 21.5 22.0 22.5 23.0 23.5 24.0 24.5-10.0
-9.1
-8.2
-7.3
-6.4
-5.5
-4.6
-3.7
-2.8
-1.9
-1.0
e1
2
Ind
ex
Ris
k
Index
Return
Historical Standard Deviation of Return
Annualized Return Standard Deviation
e EARNEST Partners Large Cap
1 Standard & Poors 500
2 Russell 1000 Value
Russell 3000
-5.25 24.38
-5.62 22.15
-8.96 23.90
-5.43 22.81

Atlanta General Employees Pension FundLarge Value Cumulative Performance Comparisons
Total Returns of Equity PortfoliosPeriods Ending 12/09
2
-15%
-10%
-5%
0%
5%
10%
15%
20%
25%
30%
35%
40%
45%
e 12
e
1
2
e
1
2
e 12
e 1 2 e1
2
e12
(41)
(33)
(75)
(10)
(31)
(84)
(10)
(31)
(84)
(29)
(36)
(84)
(38)
(72)
(87)
(99)
(100)
(95)
5th Percentile 25th Percentile Median 75th Percentile 95th Percentile
LastQtr
12/09YTD
LastYear
Last 3Years
Last 5Years
Last 10Years
8.306.555.314.222.21
41.7328.0823.9220.5815.93
41.7328.0823.9220.5815.93
-0.54-5.00-6.66-8.18
-12.16
4.402.211.190.37
-1.76
7.704.934.233.232.56
EARNEST Partners Large Cap
Standard & Poors 500
Russell 1000 Value
5.70
6.04
4.22
37.45
26.45
19.69
37.45
26.45
19.69
-5.25
-5.62
-8.96
1.58
0.42
-0.26
1.30
-0.95
2.47
Returns for periods greater than one year are annualized.
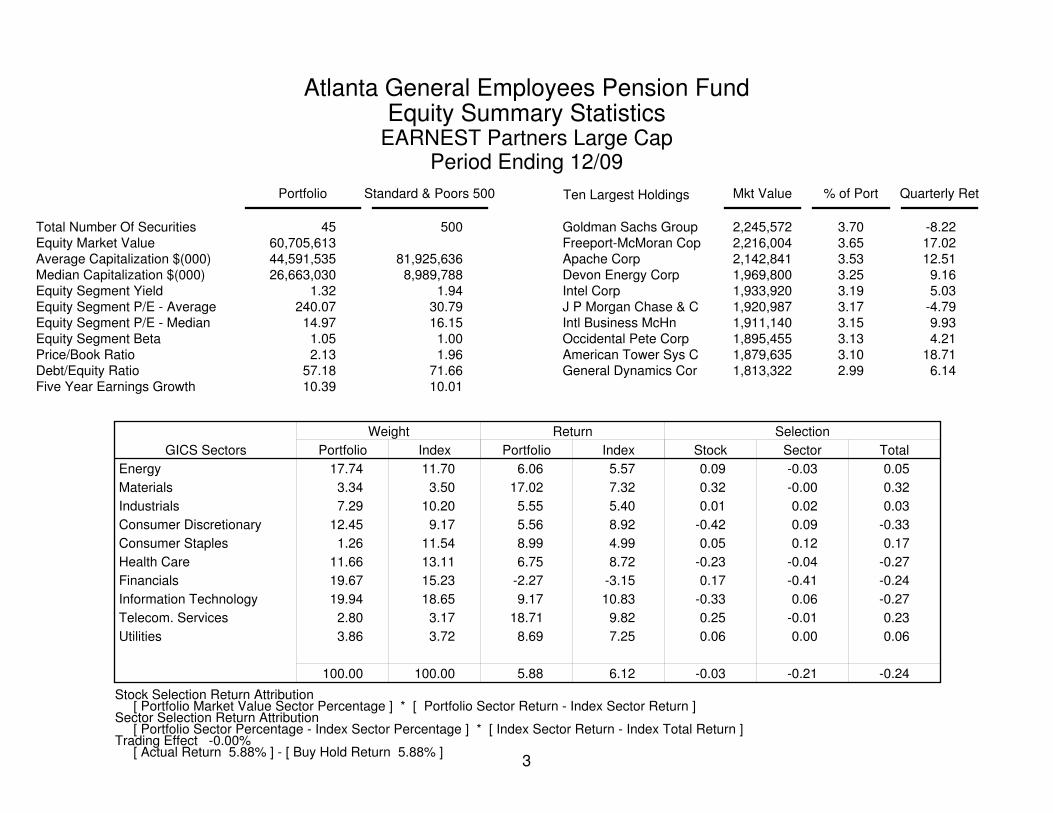
Atlanta General Employees Pension FundEquity Summary Statistics
EARNEST Partners Large CapPeriod Ending 12/09
3
Total Number Of SecuritiesEquity Market ValueAverage Capitalization $(000)Median Capitalization $(000)Equity Segment YieldEquity Segment P/E - AverageEquity Segment P/E - MedianEquity Segment BetaPrice/Book RatioDebt/Equity RatioFive Year Earnings Growth
Portfolio Standard & Poors 500
4560,705,61344,591,53526,663,030
1.32240.07
14.971.052.13
57.1810.39
500
81,925,6368,989,788
1.9430.7916.151.001.96
71.6610.01
GICS Sectors
Weight
Portfolio Index
Return
Portfolio Index
Selection
Stock Sector Total
Energy
Materials
Industrials
Consumer Discretionary
Consumer Staples
Health Care
Financials
Information Technology
Telecom. Services
Utilities
17.74
3.34
7.29
12.45
1.26
11.66
19.67
19.94
2.80
3.86
100.00
11.70
3.50
10.20
9.17
11.54
13.11
15.23
18.65
3.17
3.72
100.00
6.06
17.02
5.55
5.56
8.99
6.75
-2.27
9.17
18.71
8.69
5.88
5.57
7.32
5.40
8.92
4.99
8.72
-3.15
10.83
9.82
7.25
6.12
0.09
0.32
0.01
-0.42
0.05
-0.23
0.17
-0.33
0.25
0.06
-0.03
-0.03
-0.00
0.02
0.09
0.12
-0.04
-0.41
0.06
-0.01
0.00
-0.21
0.05
0.32
0.03
-0.33
0.17
-0.27
-0.24
-0.27
0.23
0.06
-0.24
Stock Selection Return Attribution [ Portfolio Market Value Sector Percentage ] * [ Portfolio Sector Return - Index Sector Return ]Sector Selection Return Attribution [ Portfolio Sector Percentage - Index Sector Percentage ] * [ Index Sector Return - Index Total Return ]Trading Effect -0.00% [ Actual Return 5.88% ] - [ Buy Hold Return 5.88% ]
Ten Largest Holdings
Goldman Sachs Group Freeport-McMoran CopApache Corp Devon Energy Corp Intel Corp J P Morgan Chase & CIntl Business McHn Occidental Pete CorpAmerican Tower Sys CGeneral Dynamics Cor
Mkt Value % of Port Quarterly Ret
2,245,5722,216,0042,142,8411,969,8001,933,9201,920,9871,911,1401,895,4551,879,6351,813,322
3.703.653.533.253.193.173.153.133.102.99
-8.2217.0212.519.165.03
-4.799.934.21
18.716.14

Atlanta General Employees Pension FundDecember 31, 2009
4
Performance Summary TablePeriods Ending 12/31/09
Manager 1 Qtr YTD 1 Year 2 Yrs 3 Yrs 5 Yrs 10 Yrs
GLOBALT Inc.
Total Return
Total Return (Net of Fees)
Standard & Poors 500
Variance
Russell 1000 Growth
5.63
5.53
6.04
-0.40
7.94
35.78
35.07
26.45
9.33
37.21
35.78
35.07
26.45
9.33
37.21
-7.31
-7.73
-10.74
3.43
-8.09
-1.43
-1.86
-5.62
4.19
-1.88
0.83
0.42
0.42
0.41
1.64
-1.96
-2.35
-0.95
-1.01
-3.98
Return vs RiskTotal Returns
An
nua
lize
d R
ate
of
Retu
rn
20.5 20.95 21.4 21.85 22.3 22.75 23.2 23.65 24.1 24.55 25.0-10.0
-9.1
-8.2
-7.3
-6.4
-5.5
-4.6
-3.7
-2.8
-1.9
-1.0
g
1
2 Ind
ex
Ris
k
Index
Return
Historical Standard Deviation of Return
Annualized Return Standard Deviation
g GLOBALT Inc.
1 Standard & Poors 500
2 Russell 1000 Growth
Russell 3000
-1.43 20.96
-5.62 22.15
-1.88 22.44
-5.43 22.81
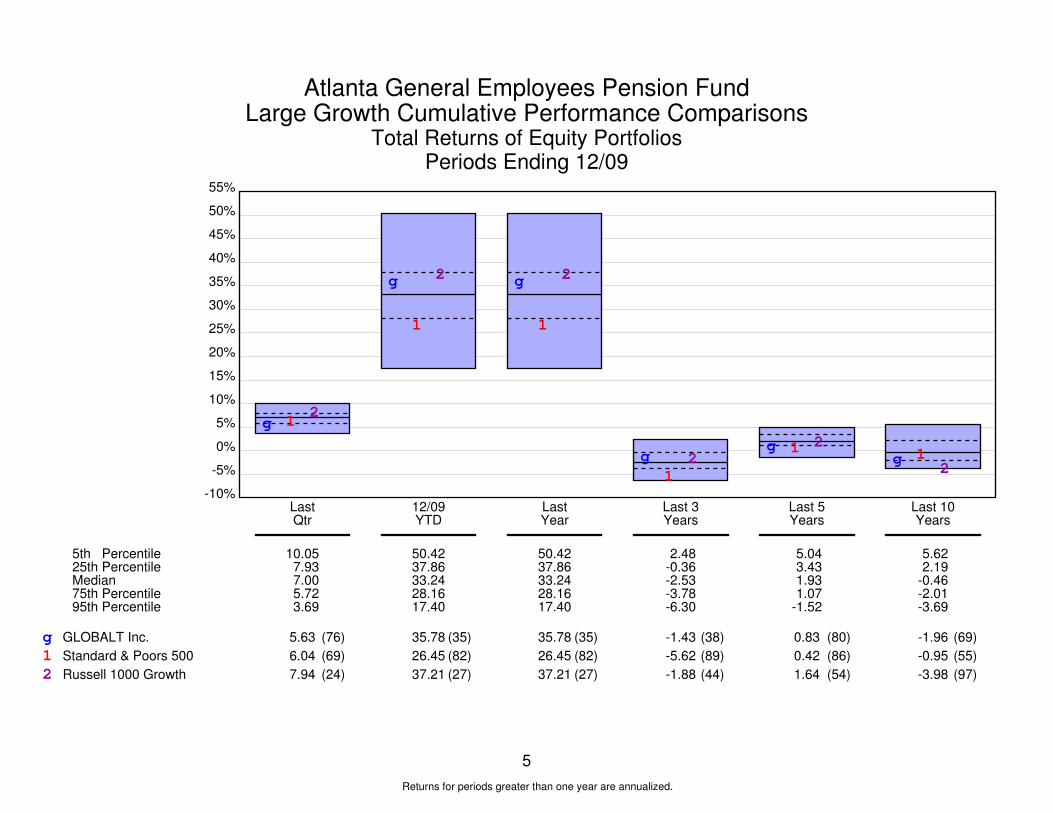
Atlanta General Employees Pension FundLarge Growth Cumulative Performance Comparisons
Total Returns of Equity PortfoliosPeriods Ending 12/09
5
-10%
-5%
0%
5%
10%
15%
20%
25%
30%
35%
40%
45%
50%
55%
g 12
g
1
2 g
1
2
g1
2g 1 2
g 12
g12
(76)
(69)
(24)
(35)
(82)
(27)
(35)
(82)
(27)
(38)
(89)
(44)
(80)
(86)
(54)
(69)
(55)
(97)
5th Percentile 25th Percentile Median 75th Percentile 95th Percentile
LastQtr
12/09YTD
LastYear
Last 3Years
Last 5Years
Last 10Years
10.057.937.005.723.69
50.4237.8633.2428.1617.40
50.4237.8633.2428.1617.40
2.48-0.36-2.53-3.78-6.30
5.043.431.931.07
-1.52
5.622.19
-0.46-2.01-3.69
GLOBALT Inc.
Standard & Poors 500
Russell 1000 Growth
5.63
6.04
7.94
35.78
26.45
37.21
35.78
26.45
37.21
-1.43
-5.62
-1.88
0.83
0.42
1.64
-1.96
-0.95
-3.98
Returns for periods greater than one year are annualized.
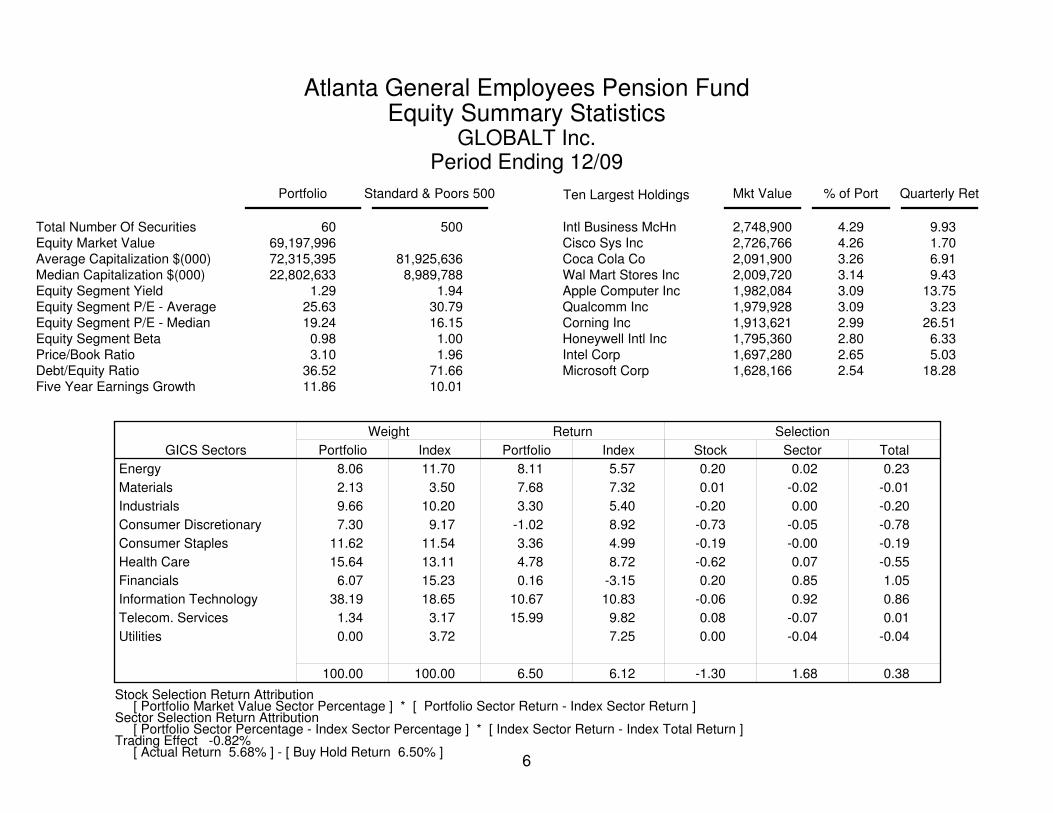
Atlanta General Employees Pension FundEquity Summary Statistics
GLOBALT Inc.Period Ending 12/09
6
Total Number Of SecuritiesEquity Market ValueAverage Capitalization $(000)Median Capitalization $(000)Equity Segment YieldEquity Segment P/E - AverageEquity Segment P/E - MedianEquity Segment BetaPrice/Book RatioDebt/Equity RatioFive Year Earnings Growth
Portfolio Standard & Poors 500
6069,197,99672,315,39522,802,633
1.2925.6319.240.983.10
36.5211.86
500
81,925,6368,989,788
1.9430.7916.151.001.96
71.6610.01
GICS Sectors
Weight
Portfolio Index
Return
Portfolio Index
Selection
Stock Sector Total
Energy
Materials
Industrials
Consumer Discretionary
Consumer Staples
Health Care
Financials
Information Technology
Telecom. Services
Utilities
8.06
2.13
9.66
7.30
11.62
15.64
6.07
38.19
1.34
0.00
100.00
11.70
3.50
10.20
9.17
11.54
13.11
15.23
18.65
3.17
3.72
100.00
8.11
7.68
3.30
-1.02
3.36
4.78
0.16
10.67
15.99
6.50
5.57
7.32
5.40
8.92
4.99
8.72
-3.15
10.83
9.82
7.25
6.12
0.20
0.01
-0.20
-0.73
-0.19
-0.62
0.20
-0.06
0.08
0.00
-1.30
0.02
-0.02
0.00
-0.05
-0.00
0.07
0.85
0.92
-0.07
-0.04
1.68
0.23
-0.01
-0.20
-0.78
-0.19
-0.55
1.05
0.86
0.01
-0.04
0.38
Stock Selection Return Attribution [ Portfolio Market Value Sector Percentage ] * [ Portfolio Sector Return - Index Sector Return ]Sector Selection Return Attribution [ Portfolio Sector Percentage - Index Sector Percentage ] * [ Index Sector Return - Index Total Return ]Trading Effect -0.82% [ Actual Return 5.68% ] - [ Buy Hold Return 6.50% ]
Ten Largest Holdings
Intl Business McHn Cisco Sys Inc Coca Cola Co Wal Mart Stores Inc Apple Computer Inc Qualcomm Inc Corning Inc Honeywell Intl Inc Intel Corp Microsoft Corp
Mkt Value % of Port Quarterly Ret
2,748,9002,726,7662,091,9002,009,7201,982,0841,979,9281,913,6211,795,3601,697,2801,628,166
4.294.263.263.143.093.092.992.802.652.54
9.931.706.919.43
13.753.23
26.516.335.03
18.28

Atlanta General Employees Pension FundDecember 31, 2009
7
Performance Summary TablePeriods Ending 12/31/09
Manager 1 Qtr YTD 1 Year 2 Yrs 3 Yrs 5 Yrs 10 Yrs
New Amsterdam Partners
Total Return
Total Return (Net of Fees)
Standard & Poors 500
Variance
Russell 1000 Growth
5.61
5.53
6.04
-0.43
7.94
25.42
25.04
26.45
-1.03
37.21
25.42
25.04
26.45
-1.03
37.21
-10.70
-10.96
-10.74
0.04
-8.09
-5.71
-5.99
-5.62
-0.09
-1.88
-0.15
-0.45
0.42
-0.57
1.64
1.76
1.46
-0.95
2.71
-3.98
Return vs RiskTotal Returns
An
nua
lize
d R
ate
of
Retu
rn
18.0 19.0 20.0 21.0 22.0 23.0 24.0 25.0 26.0 27.0 28.0-10.0
-9.1
-8.2
-7.3
-6.4
-5.5
-4.6
-3.7
-2.8
-1.9
-1.0
n 1
2 Ind
ex
Ris
k
Index
Return
Historical Standard Deviation of Return
Annualized Return Standard Deviation
n New Amsterdam Partners
1 Standard & Poors 500
2 Russell 1000 Growth
Russell 3000
-5.71 18.60
-5.62 22.15
-1.88 22.44
-5.43 22.81

Atlanta General Employees Pension FundLarge Growth Cumulative Performance Comparisons
Total Returns of Equity PortfoliosPeriods Ending 12/09
8
-10%
-5%
0%
5%
10%
15%
20%
25%
30%
35%
40%
45%
50%
55%
n 12
n 1
2
n 1
2
n 12 n 1 2 n
12
n12
(77)
(69)
(24)
(85)
(82)
(27)
(85)
(82)
(27)
(89)
(89)
(44)
(90)
(86)
(54)
(25)
(55)
(97)
5th Percentile 25th Percentile Median 75th Percentile 95th Percentile
LastQtr
12/09YTD
LastYear
Last 3Years
Last 5Years
Last 10Years
10.057.937.005.723.69
50.4237.8633.2428.1617.40
50.4237.8633.2428.1617.40
2.48-0.36-2.53-3.78-6.30
5.043.431.931.07
-1.52
5.622.19
-0.46-2.01-3.69
New Amsterdam Partners
Standard & Poors 500
Russell 1000 Growth
5.61
6.04
7.94
25.42
26.45
37.21
25.42
26.45
37.21
-5.71
-5.62
-1.88
-0.15
0.42
1.64
1.76
-0.95
-3.98
Returns for periods greater than one year are annualized.
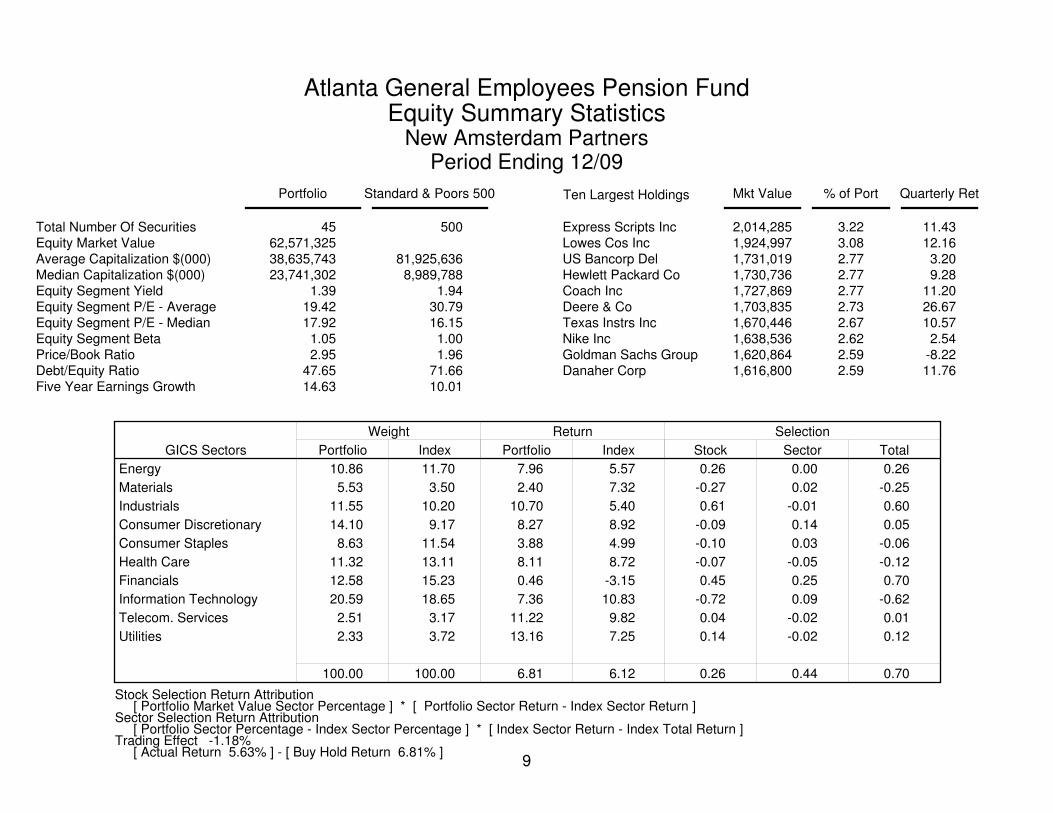
Atlanta General Employees Pension FundEquity Summary Statistics
New Amsterdam PartnersPeriod Ending 12/09
9
Total Number Of SecuritiesEquity Market ValueAverage Capitalization $(000)Median Capitalization $(000)Equity Segment YieldEquity Segment P/E - AverageEquity Segment P/E - MedianEquity Segment BetaPrice/Book RatioDebt/Equity RatioFive Year Earnings Growth
Portfolio Standard & Poors 500
4562,571,32538,635,74323,741,302
1.3919.4217.921.052.95
47.6514.63
500
81,925,6368,989,788
1.9430.7916.151.001.96
71.6610.01
GICS Sectors
Weight
Portfolio Index
Return
Portfolio Index
Selection
Stock Sector Total
Energy
Materials
Industrials
Consumer Discretionary
Consumer Staples
Health Care
Financials
Information Technology
Telecom. Services
Utilities
10.86
5.53
11.55
14.10
8.63
11.32
12.58
20.59
2.51
2.33
100.00
11.70
3.50
10.20
9.17
11.54
13.11
15.23
18.65
3.17
3.72
100.00
7.96
2.40
10.70
8.27
3.88
8.11
0.46
7.36
11.22
13.16
6.81
5.57
7.32
5.40
8.92
4.99
8.72
-3.15
10.83
9.82
7.25
6.12
0.26
-0.27
0.61
-0.09
-0.10
-0.07
0.45
-0.72
0.04
0.14
0.26
0.00
0.02
-0.01
0.14
0.03
-0.05
0.25
0.09
-0.02
-0.02
0.44
0.26
-0.25
0.60
0.05
-0.06
-0.12
0.70
-0.62
0.01
0.12
0.70
Stock Selection Return Attribution [ Portfolio Market Value Sector Percentage ] * [ Portfolio Sector Return - Index Sector Return ]Sector Selection Return Attribution [ Portfolio Sector Percentage - Index Sector Percentage ] * [ Index Sector Return - Index Total Return ]Trading Effect -1.18% [ Actual Return 5.63% ] - [ Buy Hold Return 6.81% ]
Ten Largest Holdings
Express Scripts Inc Lowes Cos Inc US Bancorp Del Hewlett Packard Co Coach Inc Deere & Co Texas Instrs Inc Nike Inc Goldman Sachs Group Danaher Corp
Mkt Value % of Port Quarterly Ret
2,014,2851,924,9971,731,0191,730,7361,727,8691,703,8351,670,4461,638,5361,620,8641,616,800
3.223.082.772.772.772.732.672.622.592.59
11.4312.163.209.28
11.2026.6710.572.54
-8.2211.76
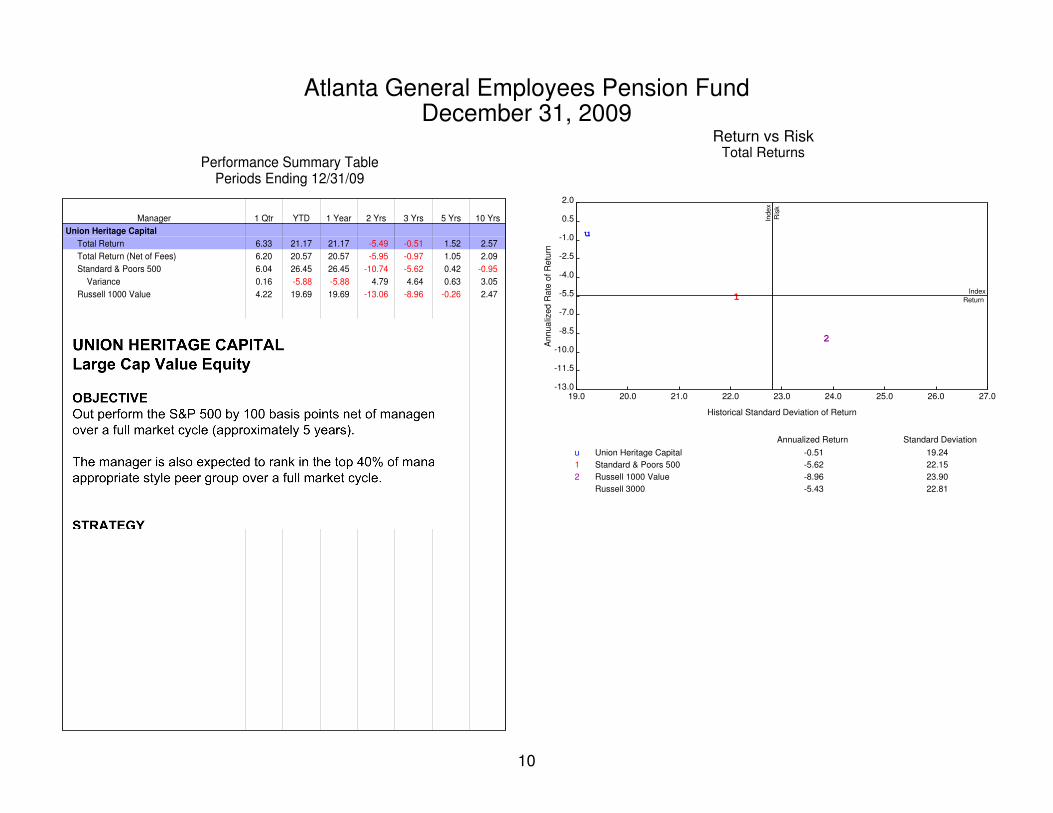
Atlanta General Employees Pension FundDecember 31, 2009
10
Performance Summary TablePeriods Ending 12/31/09
Manager 1 Qtr YTD 1 Year 2 Yrs 3 Yrs 5 Yrs 10 Yrs
Union Heritage Capital
Total Return
Total Return (Net of Fees)
Standard & Poors 500
Variance
Russell 1000 Value
6.33
6.20
6.04
0.16
4.22
21.17
20.57
26.45
-5.88
19.69
21.17
20.57
26.45
-5.88
19.69
-5.49
-5.95
-10.74
4.79
-13.06
-0.51
-0.97
-5.62
4.64
-8.96
1.52
1.05
0.42
0.63
-0.26
2.57
2.09
-0.95
3.05
2.47
Return vs RiskTotal Returns
An
nua
lize
d R
ate
of
Retu
rn
19.0 20.0 21.0 22.0 23.0 24.0 25.0 26.0 27.0-13.0
-11.5
-10.0
-8.5
-7.0
-5.5
-4.0
-2.5
-1.0
0.5
2.0
u
1
2
Ind
ex
Ris
k
Index
Return
Historical Standard Deviation of Return
Annualized Return Standard Deviation
u Union Heritage Capital
1 Standard & Poors 500
2 Russell 1000 Value
Russell 3000
-0.51 19.24
-5.62 22.15
-8.96 23.90
-5.43 22.81

Atlanta General Employees Pension FundLarge Value Cumulative Performance Comparisons
Total Returns of Equity PortfoliosPeriods Ending 12/09
11
-15%
-10%
-5%
0%
5%
10%
15%
20%
25%
30%
35%
40%
45%
u 12
u
1
2 u
1
2
u
12
u 1 2u
12
u12
(29)
(33)
(75)
(71)
(31)
(84)
(71)
(31)
(84)
(4)
(36)
(84)
(40)
(72)
(87)
(93)
(100)
(95)
5th Percentile 25th Percentile Median 75th Percentile 95th Percentile
LastQtr
12/09YTD
LastYear
Last 3Years
Last 5Years
Last 10Years
8.306.555.314.222.21
41.7328.0823.9220.5815.93
41.7328.0823.9220.5815.93
-0.54-5.00-6.66-8.18
-12.16
4.402.211.190.37
-1.76
7.704.934.233.232.56
Union Heritage Capital
Standard & Poors 500
Russell 1000 Value
6.33
6.04
4.22
21.17
26.45
19.69
21.17
26.45
19.69
-0.51
-5.62
-8.96
1.52
0.42
-0.26
2.57
-0.95
2.47
Returns for periods greater than one year are annualized.

Atlanta General Employees Pension FundEquity Summary Statistics
Union Heritage CapitalPeriod Ending 12/09
12
Total Number Of SecuritiesEquity Market ValueAverage Capitalization $(000)Median Capitalization $(000)Equity Segment YieldEquity Segment P/E - AverageEquity Segment P/E - MedianEquity Segment BetaPrice/Book RatioDebt/Equity RatioFive Year Earnings Growth
Portfolio Standard & Poors 500
3919,090,40665,390,82125,678,766
1.5618.1716.560.813.50
38.809.65
500
81,925,6368,989,788
1.9430.7916.151.001.96
71.6610.01
GICS Sectors
Weight
Portfolio Index
Return
Portfolio Index
Selection
Stock Sector Total
Energy
Materials
Industrials
Consumer Discretionary
Consumer Staples
Health Care
Financials
Information Technology
Telecom. Services
Utilities
9.13
0.00
7.14
19.39
17.41
16.36
12.34
16.23
0.00
2.00
100.00
11.70
3.50
10.20
9.17
11.54
13.11
15.23
18.65
3.17
3.72
100.00
4.96
4.81
4.55
7.18
8.16
-0.35
12.34
8.89
6.40
5.57
7.32
5.40
8.92
4.99
8.72
-3.15
10.83
9.82
7.25
6.12
-0.06
0.00
-0.04
-0.85
0.38
-0.09
0.35
0.24
0.00
0.03
-0.03
0.01
-0.04
0.02
0.29
-0.07
0.08
0.27
-0.11
-0.12
-0.02
0.32
-0.04
-0.04
-0.02
-0.56
0.32
-0.01
0.61
0.13
-0.12
0.01
0.28
Stock Selection Return Attribution [ Portfolio Market Value Sector Percentage ] * [ Portfolio Sector Return - Index Sector Return ]Sector Selection Return Attribution [ Portfolio Sector Percentage - Index Sector Percentage ] * [ Index Sector Return - Index Total Return ]Trading Effect 0.48% [ Actual Return 6.88% ] - [ Buy Hold Return 6.40% ]
Ten Largest Holdings
Autozone Inc Oracle Systems Corp Occidental Pete CorpMicrosoft Corp Apollo Group Inc Nike Inc Amphenol Corp New Kellogg Co Wal Mart Stores Inc Fiserv Inc
Mkt Value % of Port Quarterly Ret
774,543757,977740,285688,848666,380654,093646,520601,160587,950572,064
4.063.983.883.613.503.433.393.153.083.00
8.1018.044.21
18.28-17.77
2.5422.608.839.430.58

Atlanta General Employees Pension FundDecember 31, 2009
13
Performance Summary TablePeriods Ending 12/31/09
Manager 1 Qtr YTD 1 Year 2 Yrs 3 Yrs 5 Yrs 10 Yrs
Madison Square Investors
Total Return
Total Return (Net of Fees)
Russell MidCap
Variance
4.97
4.84
5.93
-0.96
38.19
37.54
40.47
-2.28
38.19
37.54
40.47
-2.28
-9.93
-10.36
-9.32
-0.61
-4.93
-5.34
-4.60
-0.33
Asset AllocationMadison Square Investors
December 31, 2009 $52,947,493
Cash & Equiv$116,653 0.22%
Domestic Equity$52,830,840 99.78%

Atlanta General Employees Pension FundMidcap Neutral Cumulative Performance Comparisons
Total Returns of Equity PortfoliosPeriods Ending 12/09
14
-20%
-10%
0%
10%
20%
30%
40%
50%
60%
70%
n 1
n 1 n 1
n 1n 1
n1
(61)
(32)
(45)
(32)
(45)
(32)
(75)
(65)
(75)
(65)
5th Percentile 25th Percentile Median 75th Percentile 95th Percentile
LastQtr
12/09YTD
LastYear
Last 2Years
Last 3Years
7.856.585.563.92
-0.12
63.8542.8337.4733.9719.23
63.8542.8337.4733.9719.23
4.01-2.11-6.42-9.87
-13.88
2.540.61
-2.27-4.87-7.17
Madison Square Investors
Russell MidCap
4.97
5.93
38.19
40.47
38.19
40.47
-9.93
-9.32
-4.93
-4.60
Returns for periods greater than one year are annualized.

Atlanta General Employees Pension FundEquity Summary Statistics
Madison Square InvestorsPeriod Ending 12/09
15
Total Number Of SecuritiesEquity Market ValueAverage Capitalization $(000)Median Capitalization $(000)Equity Segment YieldEquity Segment P/E - AverageEquity Segment P/E - MedianEquity Segment BetaPrice/Book RatioDebt/Equity RatioFive Year Earnings Growth
Portfolio Russell MidCap
22452,830,8405,521,2673,926,496
1.2767.0213.651.221.86
43.455.17
772
6,283,3143,465,303
1.5878.8715.801.191.96
50.155.92
GICS Sectors
Weight
Portfolio Index
Return
Portfolio Index
Selection
Stock Sector Total
Energy
Materials
Industrials
Consumer Discretionary
Consumer Staples
Health Care
Financials
Information Technology
Telecom. Services
Utilities
8.24
7.09
12.50
18.89
4.38
9.39
15.06
19.38
1.03
4.03
100.00
7.62
6.16
12.56
15.29
6.62
8.67
19.14
14.73
1.76
7.45
100.00
6.59
9.71
3.19
2.51
3.07
11.29
-0.83
9.77
10.84
-6.21
4.93
5.88
7.75
4.87
4.76
3.37
8.48
1.66
10.89
12.60
7.61
5.93
0.06
0.14
-0.21
-0.42
-0.01
0.26
-0.37
-0.22
-0.02
-0.56
-1.35
-0.00
0.02
0.00
-0.04
0.06
0.02
0.17
0.23
-0.05
-0.06
0.35
0.06
0.16
-0.21
-0.47
0.04
0.28
-0.20
0.01
-0.07
-0.61
-1.00
Stock Selection Return Attribution [ Portfolio Market Value Sector Percentage ] * [ Portfolio Sector Return - Index Sector Return ]Sector Selection Return Attribution [ Portfolio Sector Percentage - Index Sector Percentage ] * [ Index Sector Return - Index Total Return ]Trading Effect 0.03% [ Actual Return 4.96% ] - [ Buy Hold Return 4.93% ]
Ten Largest Holdings
Affiliated Computer Micron Technology InInternational Paper Western Digital CorpPublic Storage Inc Forest Labs Inc Quest Diagnostics InComputer Sciences CoHumana Inc Annaly Mtg Mgmt Inc
Mkt Value % of Port Quarterly Ret
1,358,186585,510561,898559,204540,828527,535517,940506,494496,528482,556
2.531.091.041.041.010.980.960.940.920.90
10.1928.7820.5920.869.029.07
15.699.14
17.67-0.33
Atlanta General Employees Pension FundDecember 31, 2009
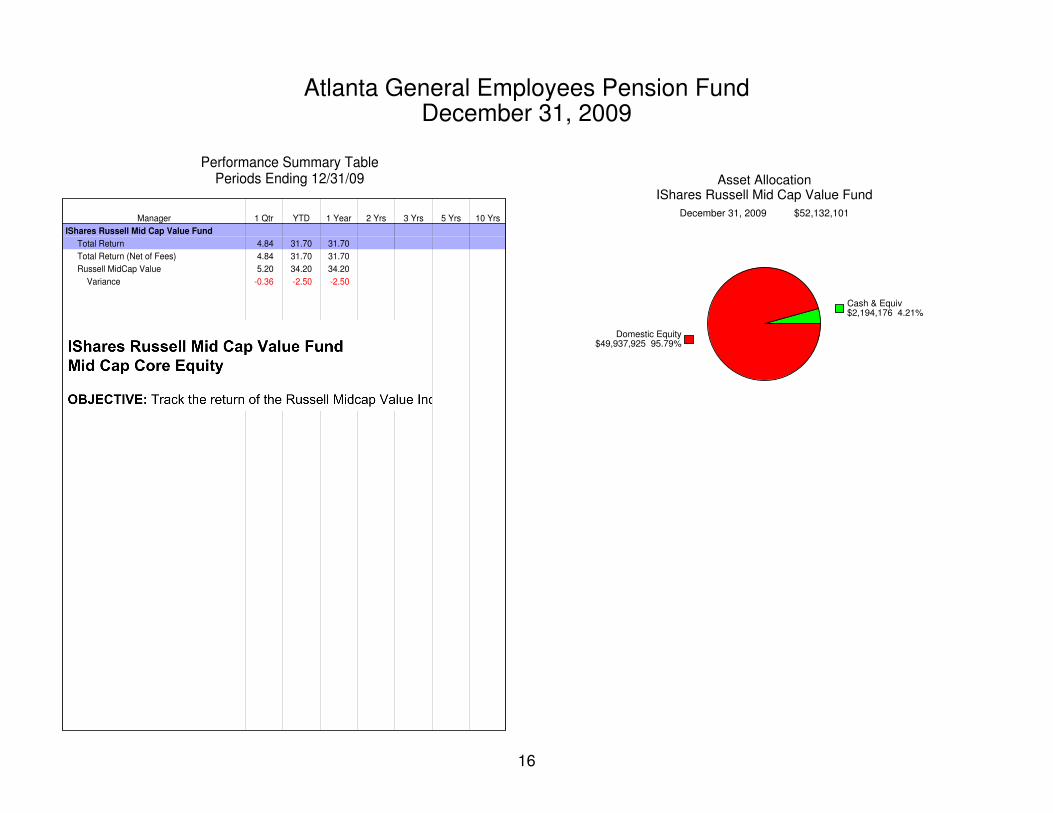
16
Performance Summary TablePeriods Ending 12/31/09
Manager 1 Qtr YTD 1 Year 2 Yrs 3 Yrs 5 Yrs 10 Yrs
IShares Russell Mid Cap Value Fund
Total Return
Total Return (Net of Fees)
Russell MidCap Value
Variance
4.84
4.84
5.20
-0.36
31.70
31.70
34.20
-2.50
31.70
31.70
34.20
-2.50
Asset AllocationIShares Russell Mid Cap Value Fund
December 31, 2009 $52,132,101
Cash & Equiv$2,194,176 4.21%
Domestic Equity$49,937,925 95.79%

Atlanta General Employees Pension FundMidcap Value Cumulative Performance Comparisons
Total Returns of Equity PortfoliosPeriods Ending 12/09
17
0%
5%
10%
15%
20%
25%
30%
35%
40%
45%
50%
55%
60%
65%
i 1
i1
i1
(70)
(62)
(79)
(50)
5th Percentile 25th Percentile Median 75th Percentile 95th Percentile
LastQtr
LastYear
7.486.645.274.411.21
61.8041.6435.7732.1628.10
IShares Russell Mid Cap Value F
Russell MidCap Value
4.84
5.20
31.70
34.20
Returns for periods greater than one year are annualized.

Atlanta General Employees Pension FundDecember 31, 2009
18
Performance Summary TablePeriods Ending 12/31/09
Manager 1 Qtr YTD 1 Year 2 Yrs 3 Yrs 5 Yrs 10 Yrs
Wellington Mgmt
Total Return
Total Return (Net of Fees)
S&P Midcap 400
Variance
5.29
5.29
5.56
-0.27
35.22
34.58
37.38
-2.16
35.22
34.58
37.38
-2.16
-10.45
-10.98
-6.40
-4.05
-5.57
-6.14
-1.83
-3.73
Asset AllocationWellington Mgmt
December 31, 2009 $51,480,107
Cash & Equiv$1,009,326 1.96%
Domestic Equity$50,470,781 98.04%

Atlanta General Employees Pension FundMidcap Neutral Cumulative Performance Comparisons
Total Returns of Equity PortfoliosPeriods Ending 12/09
19
-20%
-10%
0%
10%
20%
30%
40%
50%
60%
70%
w 1
w 1 w 1
w1 w
1
w1
(56)
(50)
(72)
(51)
(72)
(51)
(77)
(47)
(78)
(43)
5th Percentile 25th Percentile Median 75th Percentile 95th Percentile
LastQtr
12/09YTD
LastYear
Last 2Years
Last 3Years
7.856.585.563.92
-0.12
63.8542.8337.4733.9719.23
63.8542.8337.4733.9719.23
4.01-2.11-6.42-9.87
-13.88
2.540.61
-2.27-4.87-7.17
Wellington Mgmt
S&P Midcap 400
5.29
5.56
35.22
37.38
35.22
37.38
-10.45
-6.40
-5.57
-1.83
Returns for periods greater than one year are annualized.
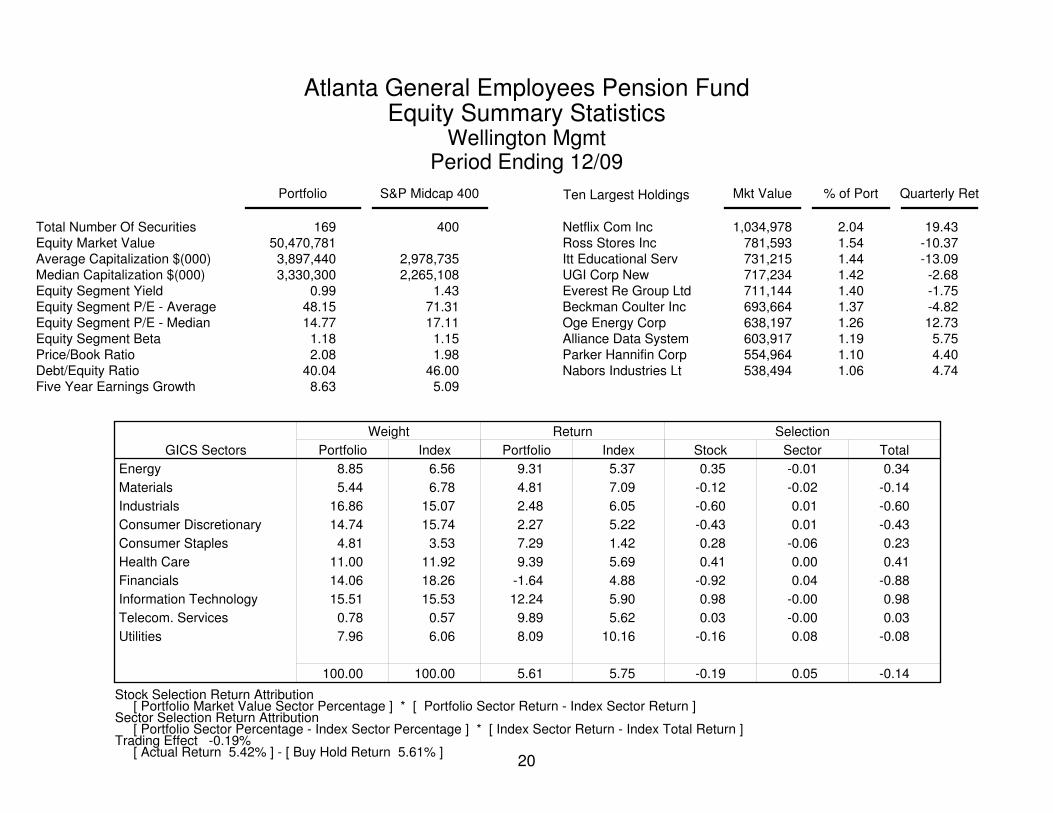
Atlanta General Employees Pension FundEquity Summary Statistics
Wellington MgmtPeriod Ending 12/09
20
Total Number Of SecuritiesEquity Market ValueAverage Capitalization $(000)Median Capitalization $(000)Equity Segment YieldEquity Segment P/E - AverageEquity Segment P/E - MedianEquity Segment BetaPrice/Book RatioDebt/Equity RatioFive Year Earnings Growth
Portfolio S&P Midcap 400
16950,470,7813,897,4403,330,300
0.9948.1514.771.182.08
40.048.63
400
2,978,7352,265,108
1.4371.3117.111.151.98
46.005.09
GICS Sectors
Weight
Portfolio Index
Return
Portfolio Index
Selection
Stock Sector Total
Energy
Materials
Industrials
Consumer Discretionary
Consumer Staples
Health Care
Financials
Information Technology
Telecom. Services
Utilities
8.85
5.44
16.86
14.74
4.81
11.00
14.06
15.51
0.78
7.96
100.00
6.56
6.78
15.07
15.74
3.53
11.92
18.26
15.53
0.57
6.06
100.00
9.31
4.81
2.48
2.27
7.29
9.39
-1.64
12.24
9.89
8.09
5.61
5.37
7.09
6.05
5.22
1.42
5.69
4.88
5.90
5.62
10.16
5.75
0.35
-0.12
-0.60
-0.43
0.28
0.41
-0.92
0.98
0.03
-0.16
-0.19
-0.01
-0.02
0.01
0.01
-0.06
0.00
0.04
-0.00
-0.00
0.08
0.05
0.34
-0.14
-0.60
-0.43
0.23
0.41
-0.88
0.98
0.03
-0.08
-0.14
Stock Selection Return Attribution [ Portfolio Market Value Sector Percentage ] * [ Portfolio Sector Return - Index Sector Return ]Sector Selection Return Attribution [ Portfolio Sector Percentage - Index Sector Percentage ] * [ Index Sector Return - Index Total Return ]Trading Effect -0.19% [ Actual Return 5.42% ] - [ Buy Hold Return 5.61% ]
Ten Largest Holdings
Netflix Com Inc Ross Stores Inc Itt Educational ServUGI Corp New Everest Re Group LtdBeckman Coulter Inc Oge Energy Corp Alliance Data SystemParker Hannifin CorpNabors Industries Lt
Mkt Value % of Port Quarterly Ret
1,034,978781,593731,215717,234711,144693,664638,197603,917554,964538,494
2.041.541.441.421.401.371.261.191.101.06
19.43-10.37-13.09
-2.68-1.75-4.8212.735.754.404.74

Atlanta General Employees Pension FundDecember 31, 2009
21
Performance Summary TablePeriods Ending 12/31/09
Manager 1 Qtr YTD 1 Year 2 Yrs 3 Yrs 5 Yrs 10 Yrs
EARNEST Partners Small Cap
Total Return
Total Return (Net of Fees)
Russell 2000
Variance
Russell 2000 Value
5.26
5.13
3.88
1.39
3.63
35.22
34.52
27.19
8.03
20.57
35.22
34.52
27.19
8.03
20.57
-5.54
-6.01
-8.24
2.70
-7.43
-5.13
-5.64
-6.06
0.93
-8.22
-0.25
-0.81
0.51
-0.76
-0.01
9.91
9.24
3.51
6.40
8.27
Return vs RiskTotal Returns
An
nua
lize
d R
ate
of
Retu
rn
18.0 19.0 20.0 21.0 22.0 23.0 24.0 25.0 26.0 27.0 28.0-10.0
-9.1
-8.2
-7.3
-6.4
-5.5
-4.6
-3.7
-2.8
-1.9
-1.0
p
1
2
Ind
ex
Ris
k
Index
Return
Historical Standard Deviation of Return
Annualized Return Standard Deviation
p EARNEST Partners Small Cap
1 Russell 2000
2 Russell 2000 Value
Russell 3000
-5.13 26.35
-6.06 26.06
-8.22 27.09
-5.43 22.81

Atlanta General Employees Pension FundSmall Value Cumulative Performance Comparisons
Total Returns of Equity PortfoliosPeriods Ending 12/09
22
-15%
-10%
-5%
0%
5%
10%
15%
20%
25%
30%
35%
40%
45%
50%
55%
60%
p 1 2
p
1
2
p
1
2
p 12
p 1 2
p
12
p12
(20)
(48)
(54)
(30)
(57)
(91)
(30)
(57)
(91)
(39)
(56)
(72)
(91)
(75)
(75)
(1)
(99)
(99)
5th Percentile 25th Percentile Median 75th Percentile 95th Percentile
LastQtr
12/09YTD
LastYear
Last 3Years
Last 5Years
Last 10Years
7.084.873.793.112.32
55.1935.8830.3425.3415.49
55.1935.8830.3425.3415.49
-0.64-2.94-5.48-8.31
-10.68
6.503.532.040.73
-0.52
9.709.269.138.708.70
EARNEST Partners Small Cap
Russell 2000
Russell 2000 Value
5.26
3.88
3.63
35.22
27.19
20.57
35.22
27.19
20.57
-5.13
-6.06
-8.22
-0.25
0.51
-0.01
9.91
3.51
8.27
Returns for periods greater than one year are annualized.
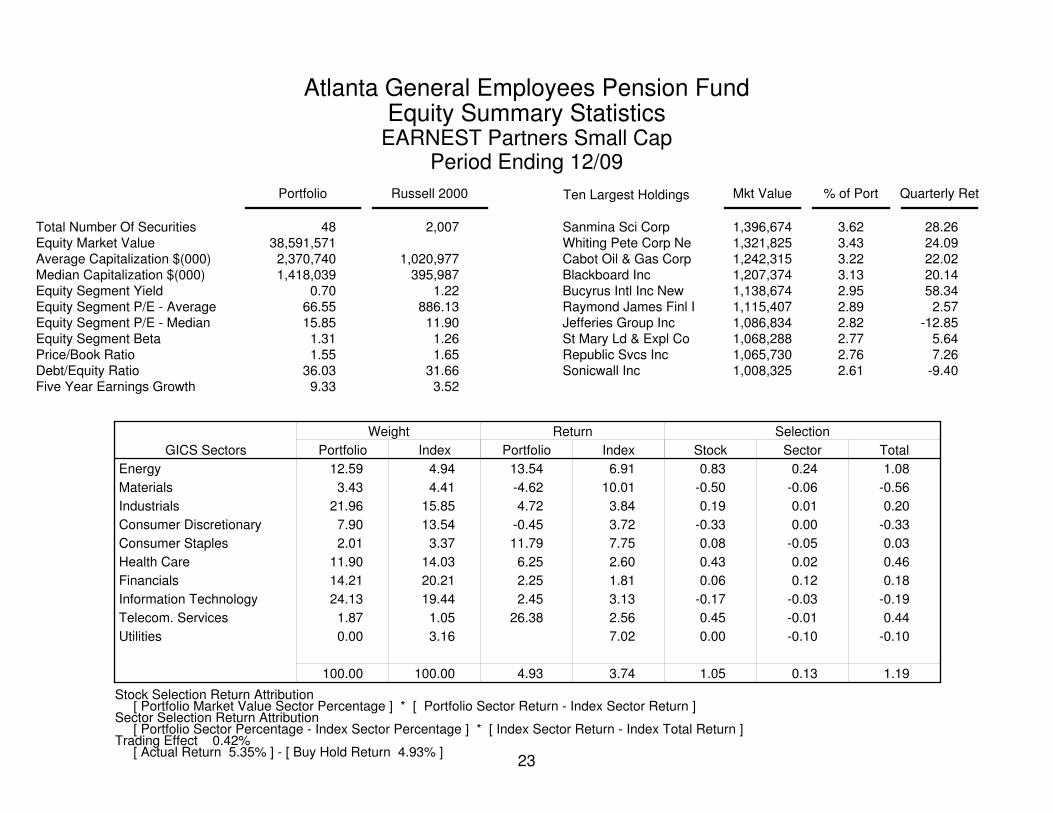
Atlanta General Employees Pension FundEquity Summary Statistics
EARNEST Partners Small CapPeriod Ending 12/09
23
Total Number Of SecuritiesEquity Market ValueAverage Capitalization $(000)Median Capitalization $(000)Equity Segment YieldEquity Segment P/E - AverageEquity Segment P/E - MedianEquity Segment BetaPrice/Book RatioDebt/Equity RatioFive Year Earnings Growth
Portfolio Russell 2000
4838,591,5712,370,7401,418,039
0.7066.5515.851.311.55
36.039.33
2,007
1,020,977395,987
1.22886.13
11.901.261.65
31.663.52
GICS Sectors
Weight
Portfolio Index
Return
Portfolio Index
Selection
Stock Sector Total
Energy
Materials
Industrials
Consumer Discretionary
Consumer Staples
Health Care
Financials
Information Technology
Telecom. Services
Utilities
12.59
3.43
21.96
7.90
2.01
11.90
14.21
24.13
1.87
0.00
100.00
4.94
4.41
15.85
13.54
3.37
14.03
20.21
19.44
1.05
3.16
100.00
13.54
-4.62
4.72
-0.45
11.79
6.25
2.25
2.45
26.38
4.93
6.91
10.01
3.84
3.72
7.75
2.60
1.81
3.13
2.56
7.02
3.74
0.83
-0.50
0.19
-0.33
0.08
0.43
0.06
-0.17
0.45
0.00
1.05
0.24
-0.06
0.01
0.00
-0.05
0.02
0.12
-0.03
-0.01
-0.10
0.13
1.08
-0.56
0.20
-0.33
0.03
0.46
0.18
-0.19
0.44
-0.10
1.19
Stock Selection Return Attribution [ Portfolio Market Value Sector Percentage ] * [ Portfolio Sector Return - Index Sector Return ]Sector Selection Return Attribution [ Portfolio Sector Percentage - Index Sector Percentage ] * [ Index Sector Return - Index Total Return ]Trading Effect 0.42% [ Actual Return 5.35% ] - [ Buy Hold Return 4.93% ]
Ten Largest Holdings
Sanmina Sci Corp Whiting Pete Corp NeCabot Oil & Gas CorpBlackboard Inc Bucyrus Intl Inc NewRaymond James Finl IJefferies Group Inc St Mary Ld & Expl CoRepublic Svcs Inc Sonicwall Inc
Mkt Value % of Port Quarterly Ret
1,396,6741,321,8251,242,3151,207,3741,138,6741,115,4071,086,8341,068,2881,065,7301,008,325
3.623.433.223.132.952.892.822.772.762.61
28.2624.0922.0220.1458.342.57
-12.855.647.26
-9.40

Atlanta General Employees Pension FundDecember 31, 2009
24
Performance Summary TablePeriods Ending 12/31/09
Manager 1 Qtr YTD 1 Year 2 Yrs 3 Yrs 5 Yrs 10 Yrs
Jennison
Total Return
Total Return (Net of Fees)
Russell 2000
Variance
6.10
6.10
3.88
2.22
32.99
32.99
27.19
5.81
32.99
32.99
27.19
5.81
-7.78
-7.78
-8.24
0.46
-2.73
-3.02
-6.06
3.33
Asset AllocationJennison
December 31, 2009 $44,019,959
Cash & Equiv$939,271 2.13%
Domestic Equity$43,080,689 97.87%

Atlanta General Employees Pension FundSmall Neutral Cumulative Performance Comparisons
Total Returns of Equity PortfoliosPeriods Ending 12/09
25
-15%
-10%
-5%
0%
5%
10%
15%
20%
25%
30%
35%
40%
45%
50%
55%
j1
j
1
j
1
j1
j1
(20)
(69)
(39)
(61)
(39)
(61)
(32)
(72)
5th Percentile 25th Percentile Median 75th Percentile 95th Percentile
LastQtr
12/09YTD
LastYear
Last 3Years
8.215.934.863.331.11
52.7536.9929.5123.5814.77
52.7536.9929.5123.5814.77
0.41-2.03-4.05-6.10-9.91
Jennison
Russell 2000
6.10
3.88
32.99
27.19
32.99
27.19
-2.73
-6.06
Returns for periods greater than one year are annualized.

Atlanta General Employees Pension FundEquity Summary Statistics
JennisonPeriod Ending 12/09
26
Total Number Of SecuritiesEquity Market ValueAverage Capitalization $(000)Median Capitalization $(000)Equity Segment YieldEquity Segment P/E - AverageEquity Segment P/E - MedianEquity Segment BetaPrice/Book RatioDebt/Equity RatioFive Year Earnings Growth
Portfolio Russell 2000
11143,080,6891,645,1921,243,941
0.8833.6518.751.222.27
43.7013.98
2,007
1,020,977395,987
1.22886.13
11.901.261.65
31.663.52
GICS Sectors
Weight
Portfolio Index
Return
Portfolio Index
Selection
Stock Sector Total
Energy
Materials
Industrials
Consumer Discretionary
Consumer Staples
Health Care
Financials
Information Technology
Telecom. Services
Utilities
7.57
2.40
14.38
12.02
6.00
14.64
13.20
21.15
6.36
2.27
100.00
4.94
4.41
15.85
13.54
3.37
14.03
20.21
19.44
1.05
3.16
100.00
11.60
0.38
4.47
6.77
9.70
6.34
0.53
5.29
18.46
9.21
6.43
6.91
10.01
3.84
3.72
7.75
2.60
1.81
3.13
2.56
7.02
3.74
0.35
-0.23
0.09
0.37
0.12
0.55
-0.17
0.46
1.01
0.05
2.59
0.08
-0.13
-0.00
0.00
0.11
-0.01
0.14
-0.01
-0.06
-0.03
0.09
0.44
-0.36
0.09
0.37
0.22
0.54
-0.03
0.45
0.95
0.02
2.68
Stock Selection Return Attribution [ Portfolio Market Value Sector Percentage ] * [ Portfolio Sector Return - Index Sector Return ]Sector Selection Return Attribution [ Portfolio Sector Percentage - Index Sector Percentage ] * [ Index Sector Return - Index Total Return ]Trading Effect -0.22% [ Actual Return 6.21% ] - [ Buy Hold Return 6.43% ]
Ten Largest Holdings
Stancorp Finl Group Wiley John & Sons InIntegra LifesciencesRbc Bearings Inc Anixter Intl Inc Concho Res Inc United Nat Foods IncNetgear Inc Berkley W R Corp Commscope Inc
Mkt Value % of Port Quarterly Ret
1,000,500999,676930,534878,313871,350835,140775,460775,005756,448753,452
2.322.322.162.042.021.941.801.801.761.75
1.2720.817.704.29
17.4323.6211.7918.20-2.29
-11.36
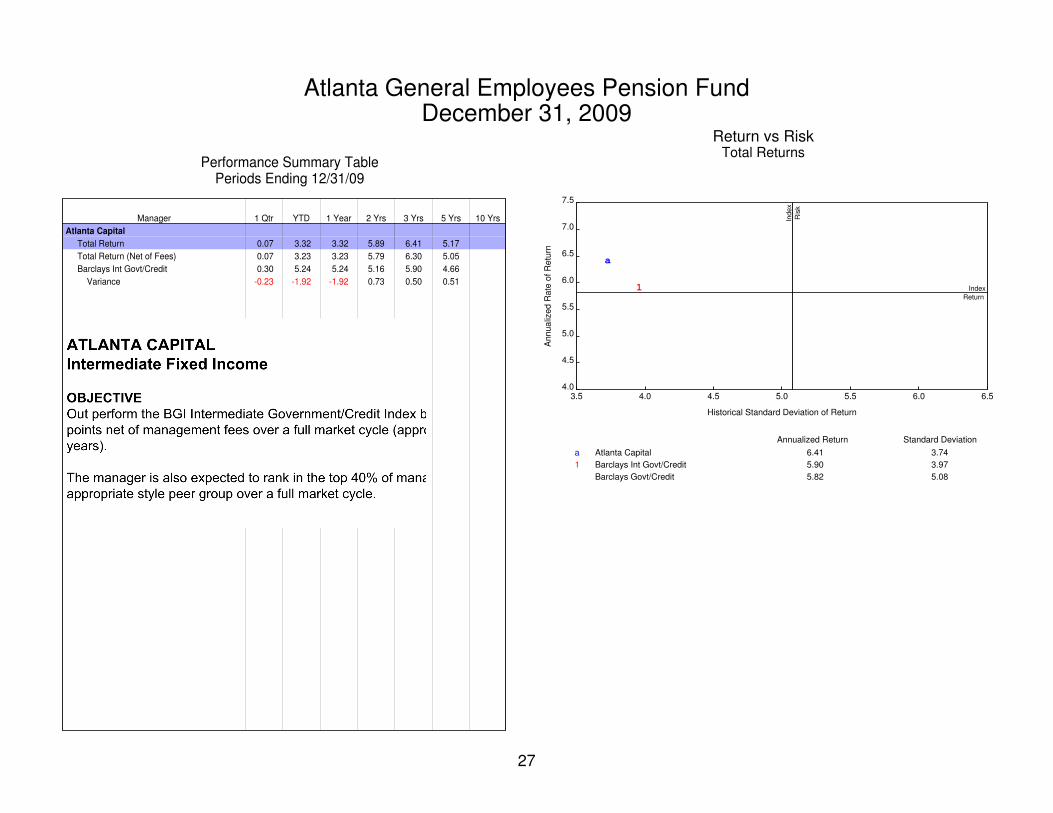
Atlanta General Employees Pension FundDecember 31, 2009
27
Performance Summary TablePeriods Ending 12/31/09
Manager 1 Qtr YTD 1 Year 2 Yrs 3 Yrs 5 Yrs 10 Yrs
Atlanta Capital
Total Return
Total Return (Net of Fees)
Barclays Int Govt/Credit
Variance
0.07
0.07
0.30
-0.23
3.32
3.23
5.24
-1.92
3.32
3.23
5.24
-1.92
5.89
5.79
5.16
0.73
6.41
6.30
5.90
0.50
5.17
5.05
4.66
0.51
Return vs RiskTotal Returns
An
nua
lize
d R
ate
of
Retu
rn
3.5 4.0 4.5 5.0 5.5 6.0 6.54.0
4.5
5.0
5.5
6.0
6.5
7.0
7.5
a
1
Ind
ex
Ris
k
Index
Return
Historical Standard Deviation of Return
Annualized Return Standard Deviation
a Atlanta Capital
1 Barclays Int Govt/Credit
Barclays Govt/Credit
6.41 3.74
5.90 3.97
5.82 5.08

Atlanta General Employees Pension FundIntermediate Term Cumulative Performance Comparisons
Total Returns of Fixed Income PortfoliosPeriods Ending 12/09
28
-2%
0%
2%
4%
6%
8%
10%
12%
14%
16%
18%
20%
22%
a 1
a
1
a
1 a1
a 1a 1
a1
(81)
(70)
(87)
(77)
(87)
(77)
(52)
(70)
(43)
(67)
(46)
(74)
5th Percentile 25th Percentile Median 75th Percentile 95th Percentile
LastQtr
12/09YTD
LastYear
Last 2Years
Last 3Years
Last 5Years
2.501.100.650.22
-0.50
20.1711.988.515.770.59
20.1711.988.515.770.59
8.296.915.974.883.12
7.936.996.245.544.15
6.365.595.134.634.08
Atlanta Capital
Barclays Int Govt/Credit
0.07
0.30
3.32
5.24
3.32
5.24
5.89
5.16
6.41
5.90
5.17
4.66
Returns for periods greater than one year are annualized.

Atlanta General Employees Pension FundFixed Income, Mortgage and Municipals Summary Statistics
Atlanta CapitalQuarter Ending 12/09
29
Total Number Of SecuritiesTotal Market ValueYield to MaturityTime to MaturityCurrent CouponDurationEffective ConvexityEffective DurationEffective Maturity
Portfolio Barclays Int Govt/Credit
55150,326,030
4.4513.144.564.19
-0.333.264.25
3,664
2.764.403.903.860.193.854.40
Yield to Maturity
9+ 9.1%
8 - 9 0.0%
7 - 8 0.2%
6 - 7 0.0%
5 - 6 0.3%
0 - 5 90.5%
Time to Maturity
10+ 44.6%
7 - 10 23.2%
5 - 7 7.4%
3 - 5 13.5%
1 - 3 8.4%
0 - 1 2.8%
Coupon
11+ 0.0%
9 - 11 0.0%
7 - 9 2.7%
5 - 7 43.7%
3 - 5 42.9%
0 - 3 10.7%
Quality
NR 1.4%
A 3.6%
AA 6.5%
AAA 9.9%
GOVT 78.5%
Duration
8+ 3.2%
6 - 8 12.9%
4 - 6 34.5%
3 - 4 12.2%
1 - 3 31.4%
0 - 1 5.8%
Effective Duration
8+ 0.2%
6 - 8 10.2%
4 - 6 12.8%
3 - 4 31.8%
1 - 3 34.2%
0 - 1 10.9%
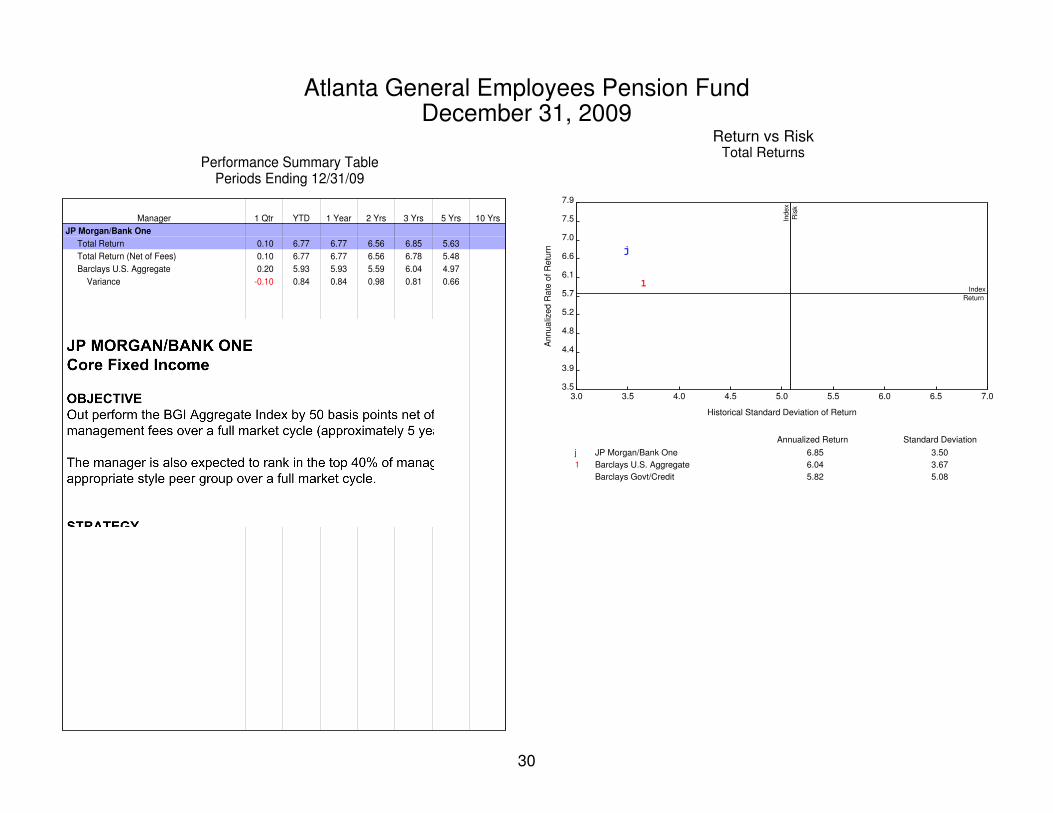
Atlanta General Employees Pension FundDecember 31, 2009
30
Performance Summary TablePeriods Ending 12/31/09
Manager 1 Qtr YTD 1 Year 2 Yrs 3 Yrs 5 Yrs 10 Yrs
JP Morgan/Bank One
Total Return
Total Return (Net of Fees)
Barclays U.S. Aggregate
Variance
0.10
0.10
0.20
-0.10
6.77
6.77
5.93
0.84
6.77
6.77
5.93
0.84
6.56
6.56
5.59
0.98
6.85
6.78
6.04
0.81
5.63
5.48
4.97
0.66
Return vs RiskTotal Returns
An
nua
lize
d R
ate
of
Retu
rn
3.0 3.5 4.0 4.5 5.0 5.5 6.0 6.5 7.03.5
3.9
4.4
4.8
5.2
5.7
6.1
6.6
7.0
7.5
7.9
j
1
Ind
ex
Ris
k
Index
Return
Historical Standard Deviation of Return
Annualized Return Standard Deviation
j JP Morgan/Bank One
1 Barclays U.S. Aggregate
Barclays Govt/Credit
6.85 3.50
6.04 3.67
5.82 5.08
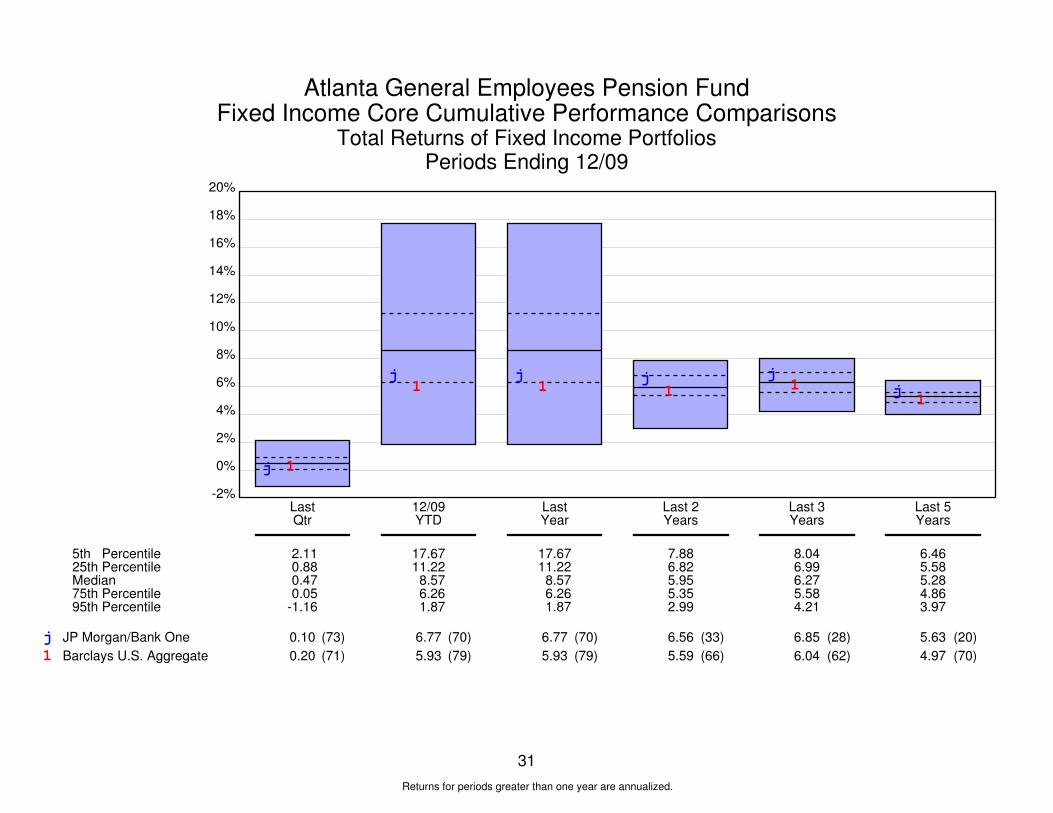
Atlanta General Employees Pension FundFixed Income Core Cumulative Performance Comparisons
Total Returns of Fixed Income PortfoliosPeriods Ending 12/09
31
-2%
0%
2%
4%
6%
8%
10%
12%
14%
16%
18%
20%
j 1
j1
j1
j1
j1 j
1
j1
(73)
(71)
(70)
(79)
(70)
(79)
(33)
(66)
(28)
(62)
(20)
(70)
5th Percentile 25th Percentile Median 75th Percentile 95th Percentile
LastQtr
12/09YTD
LastYear
Last 2Years
Last 3Years
Last 5Years
2.110.880.470.05
-1.16
17.6711.228.576.261.87
17.6711.228.576.261.87
7.886.825.955.352.99
8.046.996.275.584.21
6.465.585.284.863.97
JP Morgan/Bank One
Barclays U.S. Aggregate
0.10
0.20
6.77
5.93
6.77
5.93
6.56
5.59
6.85
6.04
5.63
4.97
Returns for periods greater than one year are annualized.

Atlanta General Employees Pension FundFixed Income, Mortgage and Municipals Summary Statistics
JP Morgan/Bank OneQuarter Ending 12/09
32
Total Number Of SecuritiesTotal Market ValueYield to MaturityTime to MaturityCurrent CouponDurationEffective ConvexityEffective DurationEffective Maturity
Portfolio Barclays U.S. Aggregate
524155,815,987
4.0313.055.415.450.154.285.91
8,373
3.686.844.685.01
-0.234.576.84
Yield to Maturity
9+ 1.1%
8 - 9 2.3%
7 - 8 2.7%
6 - 7 8.2%
5 - 6 10.2%
0 - 5 75.5%
Time to Maturity
10+ 49.5%
7 - 10 25.3%
5 - 7 9.6%
3 - 5 5.8%
1 - 3 8.3%
0 - 1 1.5%
Coupon
11+ 0.1%
9 - 11 0.5%
7 - 9 14.3%
5 - 7 59.3%
3 - 5 17.5%
0 - 3 8.4%
Quality
NR 1.8%
B 0.5%
BA 0.2%
BAA 7.1%
A 9.8%
AA 3.2%
AAA 9.5%
GOVT 68.0%
Duration
8+ 25.0%
6 - 8 13.4%
4 - 6 17.5%
3 - 4 9.8%
1 - 3 29.8%
0 - 1 4.4%
Effective Duration
8+ 14.2%
6 - 8 10.4%
4 - 6 12.9%
3 - 4 18.2%
1 - 3 30.6%
0 - 1 13.7%

Atlanta General Employees Pension FundDecember 31, 2009
33
Performance Summary TablePeriods Ending 12/31/09
Manager 1 Qtr YTD 1 Year 2 Yrs 3 Yrs 5 Yrs 10 Yrs
Mesirow
Total Return
Total Return (Net of Fees)
Barclays U.S. Aggregate
Variance
0.53
0.47
0.20
0.33
11.12
10.92
5.93
5.19
11.12
10.92
5.93
5.19
7.77
7.53
5.59
2.18
7.05
6.80
6.04
1.00
Asset AllocationMesirow
December 31, 2009 $157,868,892
Cash & Equiv$1,426,117 0.90%
Domestic Fixed$156,442,775 99.10%

Atlanta General Employees Pension FundFixed Income Core Cumulative Performance Comparisons
Total Returns of Fixed Income PortfoliosPeriods Ending 12/09
34
-2%
0%
2%
4%
6%
8%
10%
12%
14%
16%
18%
20%
m 1
m
1
m
1
m
1m
1
m1
(45)
(71)
(25)
(79)
(25)
(79)
(8)
(66)
(19)
(62)
5th Percentile 25th Percentile Median 75th Percentile 95th Percentile
LastQtr
12/09YTD
LastYear
Last 2Years
Last 3Years
2.110.880.470.05
-1.16
17.6711.228.576.261.87
17.6711.228.576.261.87
7.886.825.955.352.99
8.046.996.275.584.21
Mesirow
Barclays U.S. Aggregate
0.53
0.20
11.12
5.93
11.12
5.93
7.77
5.59
7.05
6.04
Returns for periods greater than one year are annualized.

Atlanta General Employees Pension FundFixed Income, Mortgage and Municipals Summary Statistics
MesirowQuarter Ending 12/09
35
Total Number Of SecuritiesTotal Market ValueYield to MaturityTime to MaturityCurrent CouponDurationEffective ConvexityEffective DurationEffective Maturity
Portfolio Barclays U.S. Aggregate
145156,442,775
4.8614.155.416.040.254.376.14
8,373
3.686.844.685.01
-0.234.576.84
Yield to Maturity
9+ 4.2%
8 - 9 3.8%
7 - 8 1.4%
6 - 7 11.0%
5 - 6 12.1%
0 - 5 67.6%
Time to Maturity
10+ 46.7%
7 - 10 21.3%
5 - 7 4.2%
3 - 5 16.4%
1 - 3 10.7%
0 - 1 0.6%
Coupon
11+ 0.0%
9 - 11 0.1%
7 - 9 9.4%
5 - 7 59.7%
3 - 5 28.7%
0 - 3 2.0%
Quality
NR 1.6%
B 0.6%
BAA 8.5%
A 20.9%
AA 4.9%
AAA 14.7%
GOVT 48.8%
Duration
8+ 19.8%
6 - 8 25.9%
4 - 6 13.0%
3 - 4 14.5%
1 - 3 23.9%
0 - 1 2.8%
Effective Duration
8+ 8.7%
6 - 8 19.1%
4 - 6 11.7%
3 - 4 14.7%
1 - 3 40.7%
0 - 1 5.0%

emailedMadison Square New Union
QUARTER Wellington Investors Globalt Large Cap Small Cap Amsterdam Heritage Jennison Total
Execution -$ 6,934$ 29,712$ -$ 520$ 6,308$ 1,356$ 13,518$ 58,348$ Research -$ 3,232$ -$ 1,019$ 427$ 4,622$ 548$ 6,878$ 16,726$
Client DirectedMagna Securities 69$ -$ -$ -$ 1,333$ 1,412$ -$ 2,814$ Bank Of New York 628$ 7,467$ 11,272$ -$ -$ 1,816$ -$ 3,534$ 24,717$ Commission Recapture 2,256$ 5,189$ 11,272$ -$ -$ 3,149$ 808$ 3,534$ 26,208$ Minority Directed/Georgia Brokers -$ 29,032$ -$ 235$ 10,931$ 604$ -$ 40,801$
Total 697$ 17,633$ 40,984$ 1,019$ 947$ 14,079$ 3,316$ 23,930$ 102,605$
Avg. cents per share $0.02 $0.02 $0.04 $0.04 $0.03 $0.03 $0.04 $0.03 $0.03% Minority Brokers/Georgia Brokers 0.0% 0.0% 70.8% 0.0% 0.0% 77.6% 18.2% 0.0% 39.8%
Madison Square New Union YTD Wellington Investors Globalt Large Cap Small Cap Amsterdam Heritage Jennison Total
APPENDIX A
EARNEST Partners
Earnest Partners
EQUITY COMMISSION REPORT
Execution 14,101$ 14,116$ 103,566$ 1,630$ 2,674$ 50,830$ 3,955$ 56,680$ 247,552$ Research 960$ 6,822$ -$ 4,822$ 6,313$ 15,119$ 1,784$ 18,062$ 53,881$
Client DirectedMagna Securities 215$ -$ -$ 7,065$ -$ 15,075$ 2,151$ -$ 24,506$ Bank of New York 1,284$ 7,467$ 40,740$ 1,750$ 13,527$ -$ 12,955$ 77,723$ Commission Recapture 3,132$ 7,480$ 40,740$ 3,393$ -$ 27,018$ 2,151$ 12,955$ 96,869$ Minority Directed/Georgia Brokers -$ 2,167$ 85,988$ 9,587$ 15,694$ 49,088$ 2,151$ -$ 164,674$
Total 16,560$ 38,052$ 144,306$ 15,267$ 8,987$ 94,551$ 7,889$ 87,697$ 413,309$
Avg. cents per share $0.02 $0.01 $0.04 $0.04 $0.03 $0.03 $0.04 $0.03 $0.03% Minority Brokers/Georgia Brokers 0.0% 5.7% 59.6% 34.5% 25.9% 51.9% 0.0% 0.0% 39.8%
*Note: Some brokers fall into multiple categories. Thus, the sum of categorized trading could be greater/less than the total commission dollars paid. Earnest Partners have combined values for LJR MAGNA.

Manager: Union Heritage Capital Management
Quarter Ending31-Dec-09 Minority
Person Firm Background*Execution 1,356$ Taino Roman Magna Securities 808$ AAResearch 548$ Jason Gatewood CAPIS 1,096$
Client Directed TradingMajority Directed 1,096$ Minority Directed 808$ Georgia Brokers -$
Commission Recapture 808$
Total Comm. Dollars Paid 1,904$ Avg. cents per share 0.04% Minority Brokers 18.21%
CommissionDollars
APPENDIX A
Commission Details
EQUITY COMMISSION DETAIL REPORT
* AA = African AmericanAS = Asian AmericanHS = Hispanic American
WM = Women
*Note: Some brokers fall into multiple categories. Thus, the sum of categorized trading could be greater/less than the total commission dollars paid.

Manager: GLOBALT, Inc.
Quarter Ending31-Dec-09 Minority
Person Firm Background*Execution 29,712$ Kandy Outlaw Jackson Securities $5,936 AAResearch -$ Jason Widener BNY Convergex 11,272$
Nathan Lewis Security Capital 4,656$ GA/AAClient Directed Trading Hollis Copeland Jr Williams Capital Group 7,848$ AA
Majority Directed -$ Minority Directed 18,440$ Georgia Brokers 10,592$
Commission Recapture 11,272$
Total Comm. Dollars Paid 29,712$ Avg. cents per share 0.04% Minority Brokers 70.8%
EQUITY COMMISSION DETAIL REPORT
Commission Details
CommissionDollars
APPENDIX A
* AA = African AmericanAS = Asian AmericanHS = Hispanic American
WM = Women
*Note: Some brokers fall into multiple categories. Thus, the sum of categorized trading could be greater/less than the total commission dollars paid.
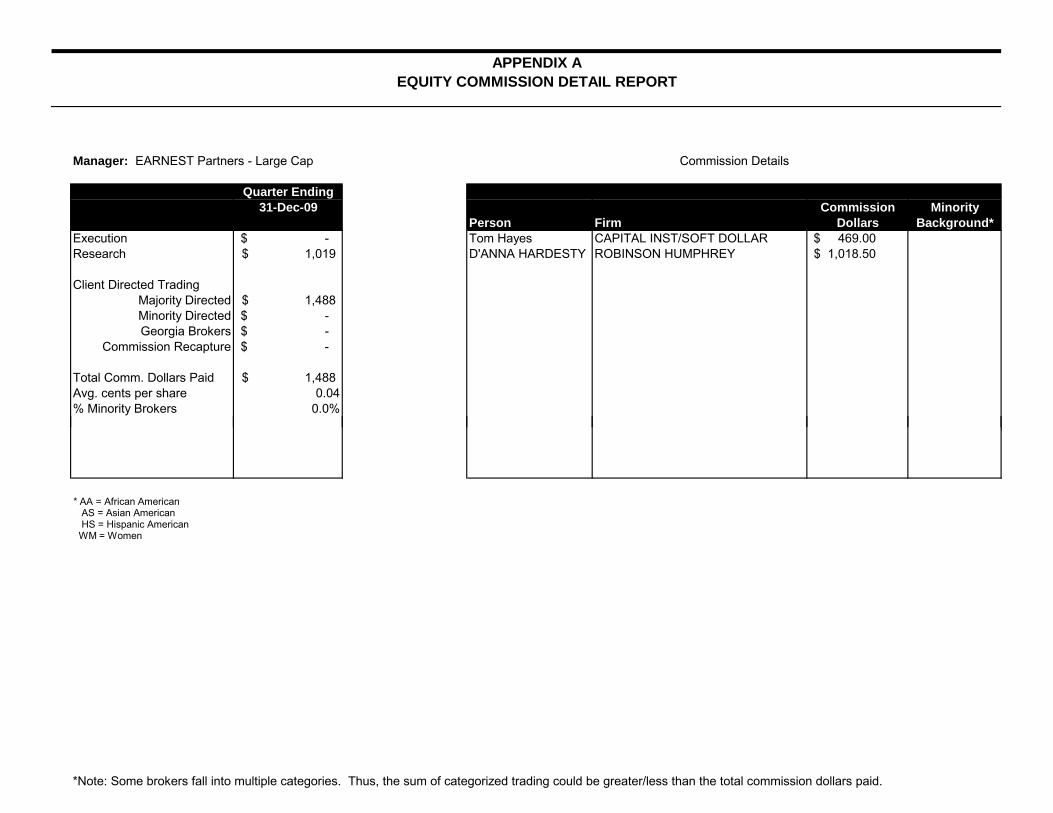
Manager: EARNEST Partners - Large Cap
Quarter Ending31-Dec-09 Minority
Person Firm Background*Execution -$ Tom Hayes CAPITAL INST/SOFT DOLLAR 469.00$ Research 1,019$ D'ANNA HARDESTY ROBINSON HUMPHREY 1,018.50$
Client Directed TradingMajority Directed 1,488$ Minority Directed -$ Georgia Brokers -$
Commission Recapture -$
Total Comm. Dollars Paid 1,488$ Avg. cents per share 0.04% Minority Brokers 0.0%
Dollars
APPENDIX AEQUITY COMMISSION DETAIL REPORT
Commission
Commission Details
* AA = African AmericanAS = Asian AmericanHS = Hispanic American
WM = Women
*Note: Some brokers fall into multiple categories. Thus, the sum of categorized trading could be greater/less than the total commission dollars paid.
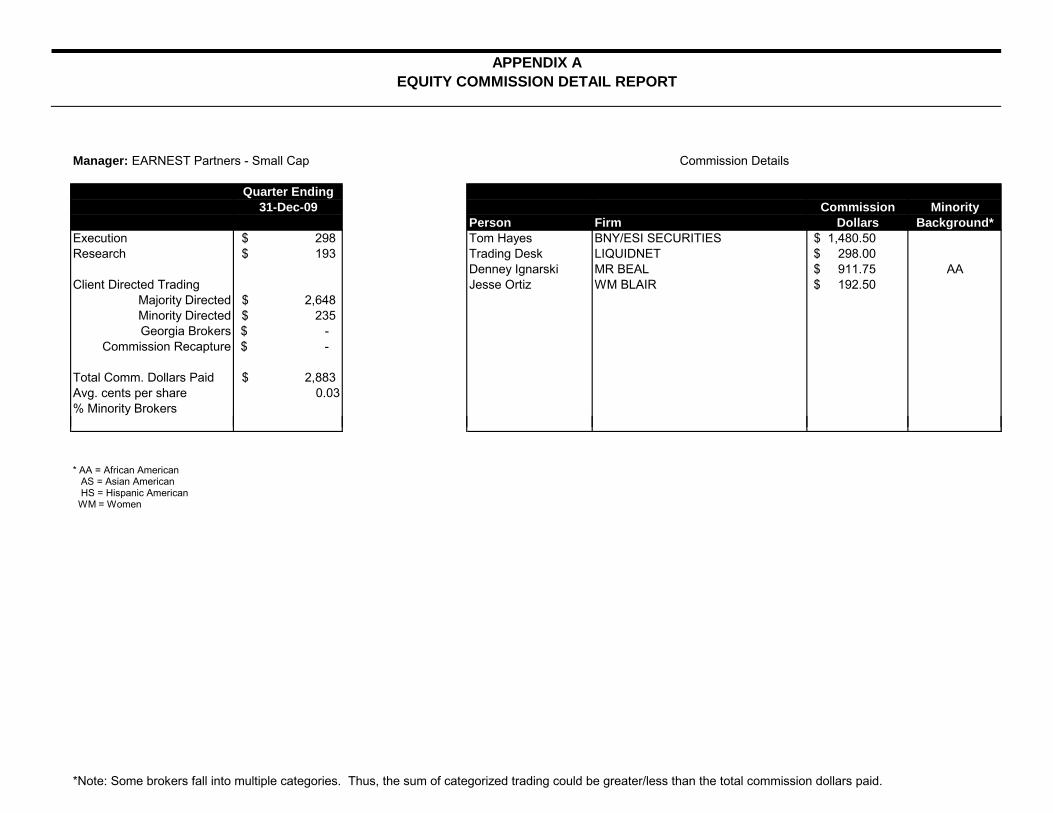
Manager: EARNEST Partners - Small Cap
Quarter Ending31-Dec-09 Minority
Person Firm Background*Execution 298$ Tom Hayes BNY/ESI SECURITIES 1,480.50$ Research 193$ Trading Desk LIQUIDNET 298.00$
Denney Ignarski MR BEAL 911.75$ AAClient Directed Trading Jesse Ortiz WM BLAIR 192.50$
Majority Directed 2,648$ Minority Directed 235$ Georgia Brokers -$
Commission Recapture -$
Total Comm. Dollars Paid 2,883$ Avg. cents per share 0.03% Minority Brokers
CommissionDollars
Commission Details
EQUITY COMMISSION DETAIL REPORTAPPENDIX A
* AA = African AmericanAS = Asian AmericanHS = Hispanic American
WM = Women
*Note: Some brokers fall into multiple categories. Thus, the sum of categorized trading could be greater/less than the total commission dollars paid.

Manager: Jennison
Quarter Ending31-Dec-09 Commission Minority
Person Firm Dollars Background*Execution 13,518$ N/A N/A N/A N/AResearch 6,878$
Client Directed TradingMajority DirectedMinority Directed -$ Georgia Brokers -$
Commission Recapture 3,534$
Total Comm. Dollars Paid 23,929$ Avg. cents per share 0.03% Minority Brokers 0.0
Commission Details
APPENDIX AEQUITY COMMISSION DETAIL REPORT
* AA = African AmericanAS = Asian AmericanHS = Hispanic American
WM = Women
*Note: Some brokers fall into multiple categories. Thus, the sum of categorized trading could be greater/less than the total commission dollars paid.

Manager: New Amsterdam Partners
Quarter Ending31-Dec-09 Commission Minority
Person Firm Dollars Background*Execution 6,308$ ADAM WHITE BAIRD (ROBERT W.) & CO 12$ Research 4,622$ SCOTT CALDWELL BNY CONVERGEX 2,744$
RICHARD DAY CANTOR FITGERLD & CO 30$ Client Directed Trading KATHY CHEEVERS CHEEVERS & CO 108$ WM
Majority Directed -$ DAVID ORLOFF GOLDMAN SACHS & CO 124$ Minority Directed -$ FRANK CAPPELLERI INSTINET (NIGHTHAWK) 84$ Georgia Brokers -$ SUJAL BHARUCHA ITG (POSIT) 118$
Commission Recapture 3,149$ KANDY OUTLAW JACKSON SECURITIES 1,880$ AASTACEY LEE LIQUIDNET 139$
Total Comm. Dollars Paid 10,931$ STACEY LEE LIQUIDNET SELECT 629$ Avg. cents per share 0.36 SCOTT CALDWELL LJR 1,816$ % Minority Brokers 60.9 TAINO ROMAN MAGNA SECURITIES CORP 1,333$ AA
FRED MACEACHERONMERRILL LYNCH ALGO TRADING 84$
Commission Details
EQUITY COMMISSION DETAIL REPORTAPPENDIX A
FRED MACEACHERONMERRILL LYNCH ALGO TRADING 84$ MICHAEL GILL MORGAN(JP SECURITIES) 308$ DON HACKMAN NYFIX/WESTMINISTER 6$ IRENE ELMORE SALOMON SMITH BARNEY 1,160$ WMMICHAEL DOLAN SANFORD BERNSTEIN & CO 80$ MATT WADE UBS PAINEWEBBER 276$
* AA = African AmericanAS = Asian AmericanHS = Hispanic American
WM = Women
*Note: Some brokers fall into multiple categories. Thus, the sum of categorized trading could be greater/less than the total commission dollars paid.
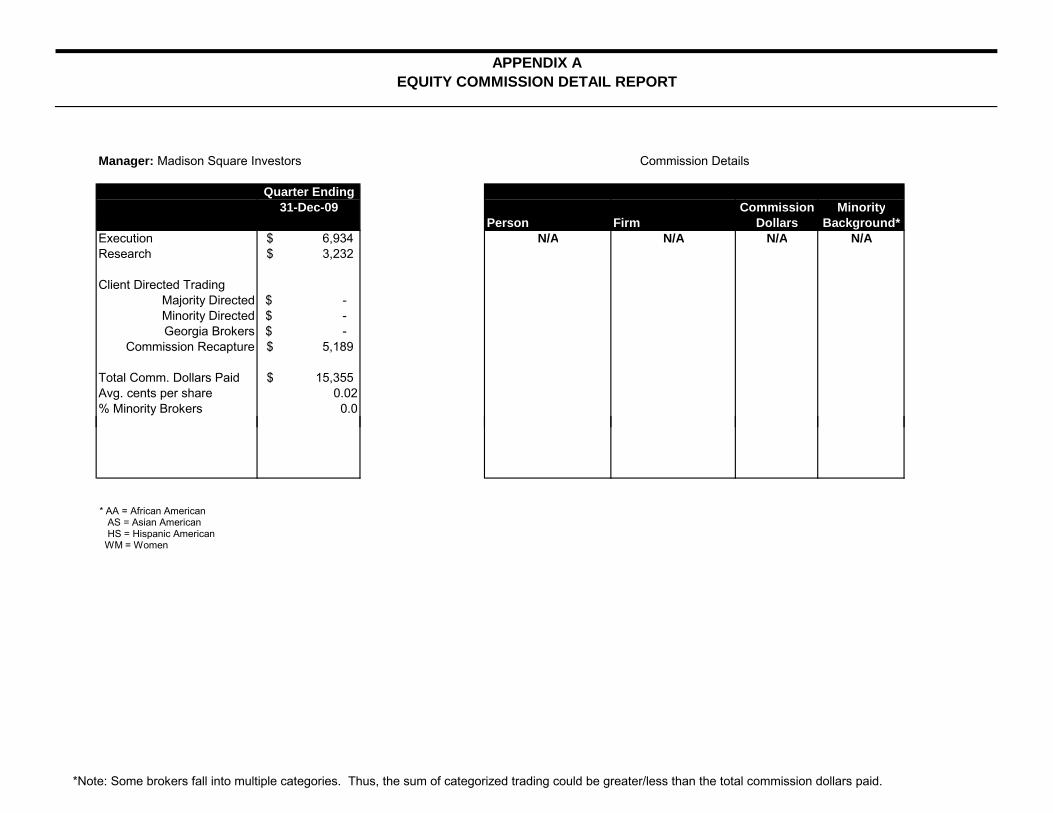
Manager: Madison Square Investors
Quarter Ending31-Dec-09 Commission Minority
Person Firm Dollars Background*Execution 6,934$ N/A N/A N/A N/AResearch 3,232$
Client Directed TradingMajority Directed -$ Minority Directed -$ Georgia Brokers -$
Commission Recapture 5,189$
Total Comm. Dollars Paid 15,355$ Avg. cents per share 0.02% Minority Brokers 0.0
Commission Details
APPENDIX AEQUITY COMMISSION DETAIL REPORT
* AA = African AmericanAS = Asian AmericanHS = Hispanic American
WM = Women
*Note: Some brokers fall into multiple categories. Thus, the sum of categorized trading could be greater/less than the total commission dollars paid.

Manager: Wellington
Quarter Ending31-Dec-09 Commission Minority
Person Firm Dollars Background*Execution -$ N/A N/A N/A N/AResearch -$
Client Directed TradingMajority DirectedMinority Directed -$ Georgia Brokers -$
Commission Recapture 2,256$
Total Comm. Dollars Paid 13,079$ Avg. cents per share 0.02% Minority Brokers 0.0
EQUITY COMMISSION DETAIL REPORT
Commission Details
APPENDIX A
Research Services utilized by Wellington Management are generated by broker/dealers who also provide execution services. The soft dollar commissions allocated to each broker for your fund are calculated based on the percent of the firmwide commissions applied to third-party research commission arrangements for each broker. The fund's total amount allocated in 3Q09 was $823. The fund's total amount allocated YTD 2009 was $2,500. Following applicable regulatory guidance, Wellington Management does not currently link proprietary research received from brokers to particular transactions. We are not aware of any definitive method or standards under bundled commission arrangements to either a) estimate the price or value of research received, or b) associate specific commission amounts with the value of research services received. As a result, the requested information would be estimated in ways that are non-standard and may not be comparable to other methods.
* AA = African AmericanAS = Asian AmericanHS = Hispanic American
WM = Women
*Note: Some brokers fall into multiple categories. Thus, the sum of categorized trading could be greater/less than the total commission dollars paid.
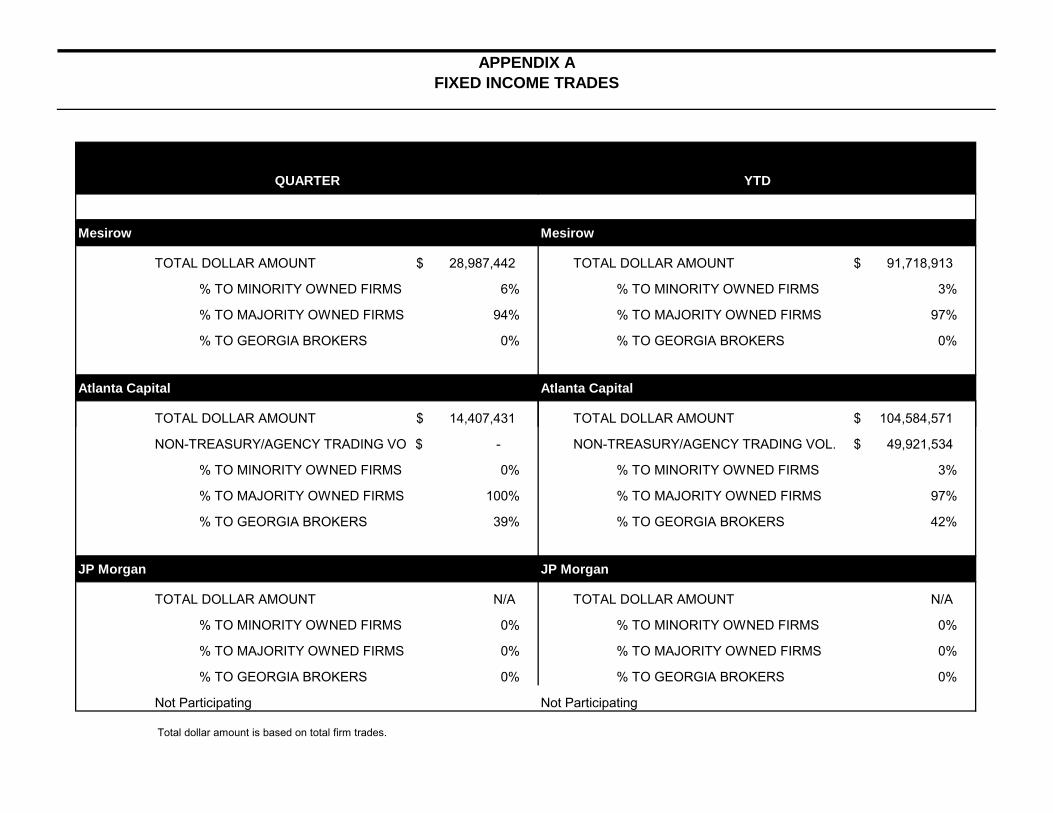
Mesirow Mesirow
TOTAL DOLLAR AMOUNT 28,987,442$ TOTAL DOLLAR AMOUNT 91,718,913$
% TO MINORITY OWNED FIRMS 6% % TO MINORITY OWNED FIRMS 3%
% TO MAJORITY OWNED FIRMS 94% % TO MAJORITY OWNED FIRMS 97%
% TO GEORGIA BROKERS 0% % TO GEORGIA BROKERS 0%
Atlanta Capital Atlanta Capital
TOTAL DOLLAR AMOUNT 14,407,431$ TOTAL DOLLAR AMOUNT 104,584,571$
FIXED INCOME TRADES
QUARTER YTD
APPENDIX A
NON-TREASURY/AGENCY TRADING VO -$ NON-TREASURY/AGENCY TRADING VOL. 49,921,534$
% TO MINORITY OWNED FIRMS 0% % TO MINORITY OWNED FIRMS 3%
% TO MAJORITY OWNED FIRMS 100% % TO MAJORITY OWNED FIRMS 97%
% TO GEORGIA BROKERS 39% % TO GEORGIA BROKERS 42%
JP Morgan JP Morgan
TOTAL DOLLAR AMOUNT N/A TOTAL DOLLAR AMOUNT N/A
% TO MINORITY OWNED FIRMS 0% % TO MINORITY OWNED FIRMS 0%
% TO MAJORITY OWNED FIRMS 0% % TO MAJORITY OWNED FIRMS 0%
% TO GEORGIA BROKERS 0% % TO GEORGIA BROKERS 0%
Not Participating Not Participating
Total dollar amount is based on total firm trades.

TARGET ASSET MIX
25% S&P 500, 20% Midcap, 10% Small Cap, 30% BGI Aggregate, 15% BGI Intermediate Govt/Credit*New Target benchmark as of 1q2007
Indexes used to calculate target benchmarks:
Fixed Income: Barclays Aggregate Bond IndexIntermediate Fixed Income Barclays Govt./Credit IntermediateLarge Cap. Equity: S&P 500 (formerly Wilshire S&P 500 Buy and Hold ex South Africa)Mid Cap. Equity: S&P MidcapSmall Cap: Russell 2000Cash: Salomon Brothers 90 T-Bill
COMPOSITE MEDIAN MANAGERA composite of median manager returns for each asset class weighted by the Target Asset Mix.
APPENDIX BEXPLANATIONS OF BENCHMARKS

Barclays Aggregate Bond Index Salomon Brothers 6- Month Certificate of Deposit Index
Standard & Poor’s 500 Index
Russell Midcap Index
INDEX DEFINITIONSAPPENDIX C
Composed of securities from Barclays Government/Corporate bond Index, Mortgage-Backed Securities index, and Yankee Bond Index. Total return comprises price appreciation/depreciation and income as a percentage of the original investment. Indexes are balanced monthly by market capitalization.
Made up of medium-sized companies falling within the market capitalization range of approximately $350 million to $3.25 billion. Composed of 800 companies from the Russell 3000 Index that fall within Russell’s medium to medium/small categories
Includes negotiable money-market securities certifying a six-month time deposit at a bank or thrift institution. The bank agrees to pay the amount deposited, plus interest, to the bearer on the date specified on the certificate. The minimum deposit is $100,000.
Covers 500 industrial, utility transportation and financial institutions in the US markets (mostly NYSE issues). The index represents about 75% of NYSE market capitalization and 30% of NYSE issues. It is a capitalization weighted index calculated on a total return basis with dividends reinvested.
Composed of securities from Barclays Government/Corporate bond Index, Mortgage-Backed Securities index, and Yankee Bond Index. Total return comprises price appreciation/depreciation and income as a percentage of the original investment. Indexes are balanced monthly by market capitalization.
Made up of medium-sized companies falling within the market capitalization range of approximately $350 million to $3.25 billion. Composed of 800 companies from the Russell 3000 Index that fall within Russell’s medium to medium/small categories.
Includes negotiable money-market securities certifying a six-month time deposit at a bank or thrift institution. The bank agrees to pay the amount deposited, plus interest, to the bearer on the date specified on the certificate. The minimum deposit is $100,000.
Covers 500 industrial, utility transportation and financial institutions in the US markets (mostly NYSE issues). The index represents about 75% of NYSE market capitalization and 30% of NYSE issues. It is a capitalization weighted index calculated on a total return basis with dividends reinvested.
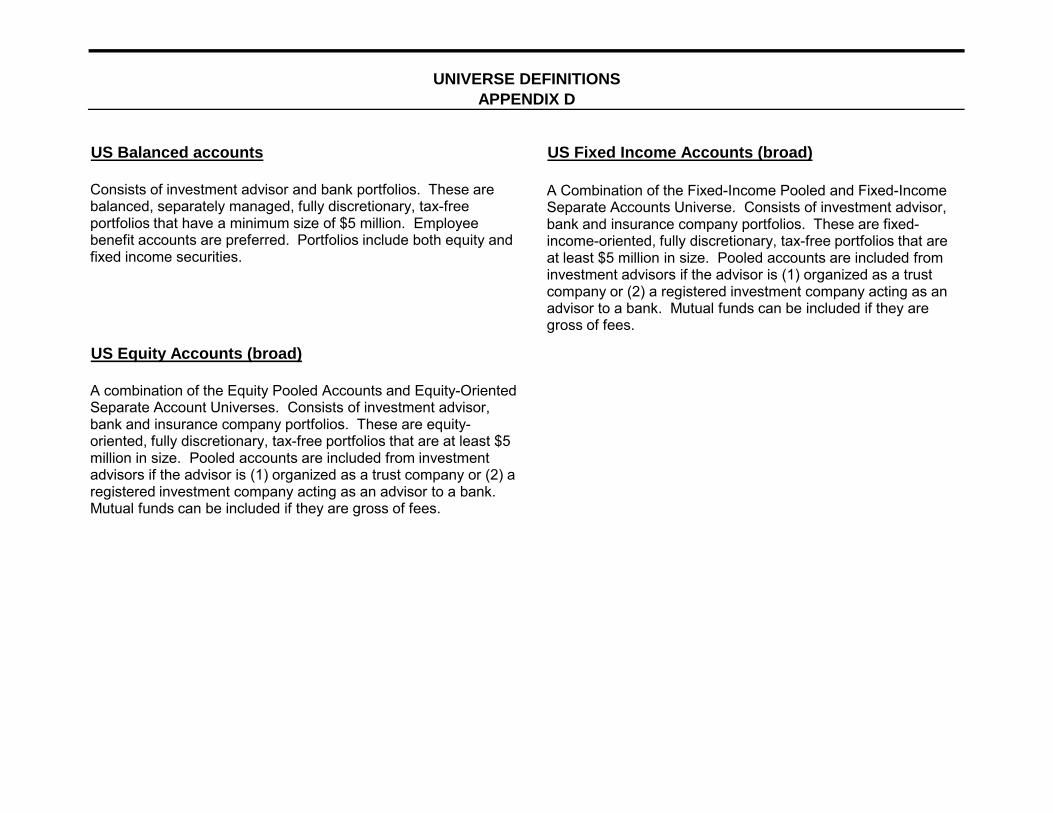
US Balanced accounts US Fixed Income Accounts (broad)
US Equity Accounts (broad)
UNIVERSE DEFINITIONSAPPENDIX D
Consists of investment advisor and bank portfolios. These are balanced, separately managed, fully discretionary, tax-free portfolios that have a minimum size of $5 million. Employee benefit accounts are preferred. Portfolios include both equity and fixed income securities.
A combination of the Equity Pooled Accounts and Equity-Oriented Separate Account Universes. Consists of investment advisor, bank and insurance company portfolios. These are equity-oriented, fully discretionary, tax-free portfolios that are at least $5
A Combination of the Fixed-Income Pooled and Fixed-Income Separate Accounts Universe. Consists of investment advisor, bank and insurance company portfolios. These are fixed-income-oriented, fully discretionary, tax-free portfolios that are at least $5 million in size. Pooled accounts are included from investment advisors if the advisor is (1) organized as a trust company or (2) a registered investment company acting as an advisor to a bank. Mutual funds can be included if they are gross of fees.
Consists of investment advisor and bank portfolios. These are balanced, separately managed, fully discretionary, tax-free portfolios that have a minimum size of $5 million. Employee benefit accounts are preferred. Portfolios include both equity and fixed income securities.
A combination of the Equity Pooled Accounts and Equity-Oriented Separate Account Universes. Consists of investment advisor, bank and insurance company portfolios. These are equity-oriented, fully discretionary, tax-free portfolios that are at least $5 million in size. Pooled accounts are included from investment advisors if the advisor is (1) organized as a trust company or (2) a registered investment company acting as an advisor to a bank. Mutual funds can be included if they are gross of fees.
A Combination of the Fixed-Income Pooled and Fixed-Income Separate Accounts Universe. Consists of investment advisor, bank and insurance company portfolios. These are fixed-income-oriented, fully discretionary, tax-free portfolios that are at least $5 million in size. Pooled accounts are included from investment advisors if the advisor is (1) organized as a trust company or (2) a registered investment company acting as an advisor to a bank. Mutual funds can be included if they are gross of fees.

Alpha Standard Deviation
Style
NYLIM
WELLINGTONUniverse
Relative Risk/Reward Ratio
DEFINITIONS OF COMMON TERMSAPPENDIX E
A measure of risk adjusted return. It is the y - intercept of the line based on ordinary least squares regression using the market’s quarterly return as the independent variable and the manager’s return as the dependent variable. Alpha measures the non-systematic return, which is the return which may not be attributable to the market. In simple terms, alpha is defined as the return earned by the manager over and above what the market earned.
A gauge of risk based on the volatility as measured by the dispersion of returns about their mean.
Description of the investment strategy used to determine the investment decisions within an asset class.
A group of comparable investment styles. A Broad Universe, such as Broad Equity, refers to all styles in the Equity asset class. Style-specific universes such as Pure
A measure of risk adjusted return. It is the y - intercept of the line based on ordinary least squares regression using the market’s quarterly return as the independent variable and the manager’s return as the dependent variable. Alpha measures the non-systematic return, which is the return which may not be attributable to the market. In simple terms, alpha is defined as the return earned by the manager over and above what the market earned.
A gauge of risk based on the volatility as measured by the dispersion of returns about their mean.
A measure of risk adjusted return relative to the market’s risk adjusted return. It is calculated by first dividing the manager’s return for the period by the manager’s standard deviation for the period. This quotient is the divided by the quotient of the market’s return for the period divided by the market’s standard deviation for the period. The measure represents the manager’s rate of return per unit of risk relative to the market’s rate of return per unit of risk. A ratio above 1.0 indicates positive relative performance and a ratio below 1.0 indicates a negative relative performance.
Description of the investment strategy used to determine the investment decisions within an asset class.
A group of comparable investment styles. A Broad Universe, such as Broad Equity, refers to all styles in the Equity asset class. Style-specific universes such as Pure Small Cap , includes only styles with a high correlation to a Small Cap Index and low correlation to a large Cap index