city logistics analysis of urban areas: an analytic
TRANSCRIPT

77
City Logistics Analysis of Urban Areas: An Analytic
Hierarchy Process Based Study
Dávid Lajos Sárdi 1 and Krisztián Bóna 1 1 Budapest University of Technology and Economics, Department of Material
Handling and Logistics Systems, Hungary
[email protected] (corresponding author) [email protected]
Abstract. Nowadays, the urban freight traffic is a very important research area
because of its significant effect on the urban sustainability, and the last period with
the COVID-19 pandemic highlighted its importance again, with the increasing of
share of the number of home deliveries in the crowded cities. In this field, we
should focus on the problems of the logistics systems of the so-called urban
concentrated sets of delivery locations (e.g. shopping malls or markets), as in their
case, it is needed to serve lots of stores in a very small area. Based on the results of
former research projects, it can be said, that it could be really important to develop
such a ranking model, which could rank the current city logistics state and the future
city logistics development potentials of these concentrated sets of delivery
locations and other urban zones with single delivery locations at the same time. In
this paper, we are going to present an Analytic Hierarchy Process based
multicriterial ranking model, which makes it possible to rank urban areas in a two-
dimensional system, where the first dimension is the current city logistics state, and
the second one is the future development potential. The main purpose of this
ranking is to mark urban zones in future city logistics projects those, which could
be well developed, and it is worthwhile to develop them. We are going to write
about our former related research results and about the formalization of the AHP-
based model. As we work and live in Budapest, our model was tested on this city,
for first, on 4 shopping malls. We are going to present the results of the tests, the
first results of the sensitivity analysis, and the next steps of the research. This paper
is a revised and expanded version of a paper entitled “AHP-based multicriterial
ranking model for the city logistics analysis of urban areas” presented online at
the 10th International Conference on Logistics, Informatics and Service Sciences
(LISS2020), on July 27, 2020.
Keywords: Logistics, city logistics, urban logistics, AHP, ranking model,
simulation, shopping mall.
ISSN 1816-6075 (Print), 1818-0523 (Online)
Journal of System and Management Sciences
Vol. 11(2021) No. 2, pp. 77-105
DOI:10.33168/JSMS.2021.0206

Sárdi and Bóna / Journal of System and Management Sciences Vol. 11 (2021) No. 2, pp. 77-105
78
1. Introduction
In the City Logistics Research Group of the Department of Material Handling and
Logistics Systems at the BME (Budapest University of Technology and Economics),
our research project was started in 2015 to examine the city logistics systems of the
so-called urban concentrated sets of delivery locations (BME-ALRT, 2020). For this
research, the urban delivery locations can be assigned to two groups (as it can be seen
on Figure 1): there are single delivery locations and concentrated sets of delivery
locations (referring to CSDL; these are basically, groups of single delivery locations)
(Bóna & Sárdi, 2018), they are in the focus of our research nowadays because of their
significant consolidation potentials. As it can be seen on Figure 1, in case of the
examined CSDLs two type of concentration can be defined: concentration with open
and with closed infrastructure. In case of open infrastructure, the set is defined by an
open area, so roads and squares can mark the borders of the set, like in case of a
shopping area/street or an open market. In case of closed infrastructure, the set is
defined by a closed area, which means in this case a building, like in case of shopping
malls, hypermarkets or duty-free areas of airports (Bóna & Sárdi, 2018). We also
defined special sets in case of closed infrastructure, as we recognized, that for
example the logistics properties of universities or hotels are really like the previously
examined concentrated sets of delivery locations.
Fig. 1: Groups of the examined delivery locations (extended with special CSDLs)
Despite the fact that the CSDLs have a significant goods traffic with significant
development potentials based on former city logistics projects, they are not in the
focus of logistics researches and at the planning phase of the CSDLs the logistics
aspects (such as sizing, modelling and optimization) are not as important as the
customer aspects (Bóna & Sárdi, 2019), mostly only some of their subsystems are
examined (e.g. only the loading areas of shopping malls). As a result of this, the City
Logistics Research Group started to examine these CSDLs, we collected data about

Sárdi and Bóna / Journal of System and Management Sciences Vol. 11 (2021) No. 2, pp. 77-105
79
their city logistics characteristics, developed some new system concepts and
developed mathematical, simulation and topological models (Bóna & Sárdi, 2019).
In this paper, such a multicriterial ranking model will be presented, which can rank
the current city logistics state and the future city logistics development potentials of
urban zones at the same time, but not only for these CSDLs, but for other urban zones
as well, which contain single delivery locations (and even smaller CSDLs too). In this
ranking model, we would like to examine the viewpoints of the current city logistics
systems, the regulations, the use of different transportation modes and combined
logistics solutions, the degree of concentration, and every relevant performance,
emission and cost parameters both for the current system and for the possible future
solution (green, consolidated and gateway-concept-based new city logistics solutions)
too. As an example, on Figure 2 an examined urban area can be seen.
Fig. 2: Example of an examined urban zone with 10 zones (Bóna & Sárdi, 2019)
The example above contains 10 zones: 4 simple urban zones with single delivery
locations, 3 shopping malls and 1 shopping area (which can be divided to 3 subzones,
as it has a bigger area with significant number of delivery locations). For this area,
the currently examined ranking model will be able to decide, which of the 10 zones
is currently in the best city logistics state and which one of them could be the best
developed in the future. Later, on Figure 4, the same zones are examined.
2. Multicriterial ranking models in city logistics
As a first step of the research, a literature research was performed, where we were
looking for the former ranking models and other multicriterial models in city logistics
and in other logistics fields. In this phase, 3 scientific databases were used:
ScienceDirect, ResearchGate, and Google Scholar.
We would like to highlight 3 of the examined ranking models. The first of them
deals with bigger supply chain networks and its main purpose is to rank logistics
centers with different functions and from different layers of the network (Antún &

Sárdi and Bóna / Journal of System and Management Sciences Vol. 11 (2021) No. 2, pp. 77-105
80
Alarcón, 2014). A similar model could be implemented for the junctions and even for
the zones of a city logistics network. One of the two other raking models ranks city
logistics projects (Patier & Browne, 2010), and the other one examines the operation
suitability of electromobility concepts for last mile delivery tasks (Teoh et. al., 2016),
so they have similar aspects as we needed for the evaluation of the city logistics
development potentials. In case of some other publications, different multicriterial
models were used for the evaluation of city logistics developments (Awasthi &
Chauhan, 2011) (Tadić et. al., 2017) and for the selection of the best concepts (Tadić
et. al., 2014). Above these, for several different purposes can the multicriterial
methods be used in city logistics: for the evaluation of the performance of city
logistics terminals (Gogas et. al., 2017), for urban sustainability aspects (Kara et. al.,
2019), for regulation evaluation (Janjevic et. al., 2019), for vehicle selection
(Wątróbski et. al., 2017) and for urban facility location problem solution as well
(Zhao et. al., 2018) (Awasthi et. al., 2010) (Uysalh & Kemal, 2014), but our two
purposes (to examine the current state and the development potentials in the same
time) were not examined together in these researches.
In the literature research, we were also looking for the possible multicriterial
models, they can be used for the current research. For this, sum 48 papers, books and
thesis about city logistics projects (and from other logistics fields as well) were
examined, and the results can be seen on Figure 3 (some of the researches used more
than 1 multicriterial methods). In the others category, we added the researches, which
used MAMCE, DEA, EDAS, ELECTRE, Fuzzy BOCR-GRA, MCE, PCA, MCA or
neural network-based solution.
Fig. 3: Multicriterial models in the examined logistics researches (Bóna & Sárdi, 2019)
The main results of the literature research can be seen below:

Sárdi and Bóna / Journal of System and Management Sciences Vol. 11 (2021) No. 2, pp. 77-105
81
• there are several different multicriterial ranking methods in the field of
city logistics (as it can be seen on the figure above), but none of them had
the same purposes as the current research, so the ranking model, which
examines the current city logistics state and the future development
potentials in the same time, will be an absolutely new application;
• the AHP (Analytic Hierarchy Process) method (Saaty, 1987) and its
subversions have significantly more documented application in city
logistics and in other logistics field (47% of the used methods in city
logistics and 52% in every logistics fields is AHP or fuzzy AHP) , than
any other method, so we can conclude that AHP is an appropriate method
for the evaluation of logistics systems, this method was used in the
currently examined research.
3. Previous research results
In this chapter, we would like to highlight our main research results (which research
project focused on concentrated sets of delivery locations), as they are going to be
very important input data in the application of the AHP-based ranking model in the
current paper and in the future research steps as well.
3.1. Data collection about CSDLs
In the first phase of the currently examined research, we had to collect data about the
stores of the examined CSDLs (from Budapest; we focused on this city as a first step),
as there was no available (and enough detailed) data about the city logistics
characteristics of them or about single delivery locations of any other urban zone. We
can say that the situation is similar in every other city, so always the available data is
the most important question in these projects. Between 2015 (September) and 2020
(August), 6 CSDLs from Budapest were examined (4 shopping malls, 1 market and
1 shopping area) and sum 630 stores of them (we interviewed sum 1,222 stores, so
the response rate was 51.55%). 24 people participated in the data collection, from the
City Logistics Research Group, several logistics engineer BSc and MSc students, and
some transportation engineer BSc students. The data collection was performed by use
of our own methodology, which contains a complex questionnaire with 31 questions
in case of shopping malls and markets, and 32 in case of shopping areas about all
important logistics parameters (e.g. general properties, delivery vehicles, logistics
units, delivery times, inverse logistics, IT systems, e-commerce) (Mészáros et. al.,
2016) (Mészáros et. al., 2017). The number of examined stores and the willingness
of the stores to participate in our research can be seen in the list below:
• 1st shopping mall (middle-sized, in the center of Budapest; 2016): 105 of
140 interviewed stores answered (75%);
• 2nd shopping mall (small-sized, in the center of Budapest; 2017): 51 of
75 interviewed stores answered (68%);

Sárdi and Bóna / Journal of System and Management Sciences Vol. 11 (2021) No. 2, pp. 77-105
82
• 3rd shopping mall (large-sized, in the center of Budapest; 2017): 171 of
308 interviewed stores answered (55.5%);
• “Váci utca” shopping area (biggest shopping area in the center of
Budapest, 2017-18): 163 of 422 interviewed stores answered (38.6%);
• 4th shopping mall (middle-sized, in an outer district of Budapest; 2019;
examined by a shortened version of the questionnaire for a project which
was focused on the possible use of the metro-network for city logistics
purposes): 50 of 120 interviewed stores answered (41.7%);
• 1st market with closed infrastructure (large-sized, in the center of
Budapest; 2020): 90 of 157 interviewed stores answered (57.3%).
Based on the results of the data collection (for 540 stores of 4 shopping malls and
1 shopping area, as the results related to the examined market are not analysed yet),
in the current city logistics system of the CSDLs, the deliveries are not synchronized
with each other, and this means that the big amount of goods is delivered in several
parts, in smaller vehicles (mostly in vans or in the passenger cars of the workers) with
low utilization. Based on the data collection, there is daily average 0.98 delivery per
store (so yearly average 357 delivery per store). In these deliveries, daily
approximately sum 3,900 pcs of boxes, 250 pallet unit loads, 3,000 clothes hanger
units and 1,300 other units are handled in the examined stores. This means daily more,
than 80 tons of goods, so yearly sum 30,000 tons of goods, only for the responder
stores from 5 CSDL from Budapest, where only in the CSDLs more, than 4,000 stores
can be found, and the sum number of retailers in the city was nearly 30,000 before
the pandemic. As it can be seen, huge volume of goods is handled, and the delivery
processes can be improved by organization (so-called gateway-based) solutions
(Sárdi & Bóna, 2019/c) (Sárdi & Bóna, 2019/b) (Sárdi & Bóna, 2017).
The results of the data collection clearly showed us, that the problems, we expected
are real in the examined city logistics system, and we also got some data about the
willingness of the storeowners to participate in new city logistics solutions. For them
not only the financial aspects, but also the green aspects are important, based on their
answers. In the next chapter, we would like to write about the simulation modelling
phase of our project, where the data collection phase provided the input data for this
research.
3.2. Simulation models of the logistics system of CSDLs
Next step of the research was to model the current city logistics system of the CSDLs
and some new concepts as well (Bóna & Sárdi, 2019). First, we developed the
mathematical model of the current and the new, consolidation-based system (Bóna &
Sárdi, 2018) (Sárdi & Bóna, 2019/c) (Sárdi & Bóna, 2019/b). Next, we developed the
mesoscopic, MS Excel based simulation model of the current and the new system,
first between the city borders and the logistics areas of the CSDLs (Sárdi & Bóna,

Sárdi and Bóna / Journal of System and Management Sciences Vol. 11 (2021) No. 2, pp. 77-105
83
2017) and then for the whole logistics process between the suppliers and the
customers of the CSDLs (Sárdi & Bóna, 2019/c) (Sárdi & Bóna, 2019/b).
Additionally, we developed the mathematical model of the cost structure (Bóna et.
al., 2018), the topological model of the CSDLs with open infrastructure (Sárdi &
Bóna, 2019/b), and the geometrical model based macroscopic simulation model of a
special cargo bike city logistics system (Sárdi & Bóna, 2018) (Sárdi & Bóna, 2019/a).
By use of the mesoscopic level MS Excel based simulation model (developed by us),
we received lots of interesting results, they showed us, that it is worth to examine this
special city logistics field. In the simulation, 217 stores of 4 shopping malls were
examined, as they provided the best, most detailed data in the questionnaires; the
currently examined AHP-based ranking model will be tested for these malls as well.
Based on the simulation results, in the current logistics system in one month, 1,759
tons of goods are handled (st. dev. 24.2 t), which generates monthly 3,990 delivery
transactions for the 217 examined stores (st. dev. 17,6) with additional empties
handling as well. For these deliveries, the sum monthly mileage is 780,022 km, which
generates for example 137.4 t/month CO2-emission. To compare with the current
system, two new city logistics concepts were examined, where a consolidation center
and cross docks were placed to the system, and the consolidated deliveries were
handled by bigger road vehicles or by cargo trams (Bóna & Sárdi, 2018) (Bóna &
Sárdi, 2019) (Sárdi & Bóna, 2019/b). In these concepts, based on the simulation the
modelled goods amount was 1,781 tons between the suppliers and the consolidation
center (st. dev. 88.7 t), and 1,750 tons between the center and the examined shopping
malls (st. dev. 51.7 t); the difference comes from the independent experiments, from
the different logistics processes and from the independent random number generation.
This amount generated between the suppliers and the center monthly 1,507 delivery
transactions (st. dev. 14.5); and additionally, between the center and the malls by use
of road vehicles 401 consolidated transactions (st. dev. 11), and by use of cargo trams
174 consolidated transactions (st. dev. 3.8). To handle these amounts, the sum
mileage in case of road vehicles was 376,736 km (which means 51,7% reduction),
and in case of cargo trams it was reduced to 371,963 km (52,3%). In the first case,
the sum CO2-emission is reduced to 55.5 t, in case of cargo trams the direct emissions
can be reduced even more.
We also evaluated the logistics costs in both cases, by use of our simulation model
(Sárdi & Bóna, 2019/b) (Bóna et. al., 2018). Based on the simulation runs, in the
current system for 217 stores of 4 shopping malls, the sum monthly sum logistics cost
is 450,666 € (st. dev. 14,664 €), and the delivery costs have the biggest share of this,
with monthly sum 359,747 €. In the new system, this amount can be reduced by 38,2%
in case of road vehicles, and by 44,3% in case of trams. This means in the first case
sum 270,556 € monthly logistics cost (st. dev. 9,139 €) and 250,839 € in the second
case (st. dev. 7,518 €) (Sárdi & Bóna, 2019/b). This means, that in the new logistics
system not only the performances and the emissions can be reduced, but also the costs

Sárdi and Bóna / Journal of System and Management Sciences Vol. 11 (2021) No. 2, pp. 77-105
84
of the daily operation. Of course, the examination of the investment costs is a very
important aspect in this project. These all data will be able to help a lot for the
evaluation of the current city logistics state of the examined urban zones and the
change of these parameters will provide very important input for the evaluation of the
future city logistics development potentials.
Based on the previous results, now we can examine the expected investment costs
of developing the cross docks of shopping malls or shopping areas (Bóna et. al., 2019).
The examination of loading areas of shopping areas is currently ongoing, and we
defined the consolidation center planning as basic warehouse planning tasks. It is also
important to highlight here, that the MS Excel-based simulation model became really
slow because of the huge amount of data, so we started to search for new simulation
solutions. A mesoscopic level pilot model in AnyLogic was already developed both
for the current system and the new, consolidation-based solution, and the
development of microscopic level, Python-based pilot model is currently ongoing too,
this one of the most important tasks in this research now (Sárdi & Bóna, 2020/b).
4. Development of the AHP-based ranking model
How to handle the two different purposes (to examine the current city logistics state
and the future city logistics development potentials in the same time), this was the
first important question in the development phase of the ranking model. It was
expected, that here will be some criteria, they will affect both (e.g. the current state
of the infrastructure or the current regulations, as they can give the basics of the future
developments as well) and they can have different weights in the cases, we decided
to use a two-dimensional solution, where two AHP-based models are used in the same
time. One of them will examine the current state and the other one will examine the
future development potentials. So, our ranking model will be able to handle both
purpose in the same time, and its result will show us, how developed is the examined
urban zone currently and how can it be developed in the future.
The expected results of the ranking can be seen on Figure 4 (with the same zones,
as on Figure 2 earlier), where the points show the ranking values of the zones, and
the zones are assigned to two groups. On this figure (and later, in the tests), the
intervals for the current state levels and for the future development potential levels
are the same: 33.33% and 66.67%. Some typical expected results of the evaluation
can be seen on this figure well:
• there are zones, they are not well-developed, but they can be developed well in the future, e.g. SM I. on Figure 4;
• there are zones, they are well-developed, but they can’t be developed well in the future, e.g. SM III. on Figure 4;
• there are zones, they are not well-developed, and they can’t be developed well in the future, e.g. Zone I. on Figure 4;

Sárdi and Bóna / Journal of System and Management Sciences Vol. 11 (2021) No. 2, pp. 77-105
85
• there are zones, they are well-developed, and they can be developed well in the future, e.g. Zone III/b on Figure 4.
Fig. 4: Example of the results of the two-dimensional AHP-based ranking
In the development process, first we formalized the two-dimensional AHP-based
model, then the criteria for both dimensions were defined, and finally, the criteria
were ranked by experts of the City Logistics Research Group and by some other
experts (Sárdi & Bóna, 2020/a).
4.1. AHP-based ranking model
The first step of the AHP-based ranking is to prepare the comparison matrices for the
evaluation of the current state and the development potentials (AP and AF matrices,
where P means Present and F means Future). In the matrices, APi, and AF
k are the
examined criteria. The so-defined two comparison matrices can be seen in Table 1.
and in Table 2., where wPi and wF
k are the weights of the criteria, i, j, k and l are
integer indexes (i, j = 1…n; k, l = 1…m).
Table 1: The comparison matrix for the evaluation of the current city logistics state
AP AP1 AP
2 … APj … AP
n
AP1 wP
1/wP1 wP
1/wP2 … wP
1/wPj … wP
1/wPn
AP2 wP
2/wP1 wP
2/wP2 … wP
2/wPj … wP
2/wPn
… … … … … … …
APi wP
i/wP1 wP
i/wP2 … wP
i/wPj … wP
i/wPn
… … … … … … …
APn wP
n/wP1 wP
n/wP2 … wP
n/wPj … wP
n/wPn

Sárdi and Bóna / Journal of System and Management Sciences Vol. 11 (2021) No. 2, pp. 77-105
86
Table 2: The comparison matrix for the evaluation of the future development potentials
AF AF1 AF
2 … AFl … AF
m
AF1 wF
1/wF1 wF
1/wF2 … wF
1/wFl … wF
1/wFm
AF2 wF
2/wF1 wF
2/wF2 … wF
2/wFl … wF
2/wFm
… … … … … … …
AFk wF
k/wF1 wF
k/wF2 … wF
k/wFl … wF
k/wFm
… … … … … … …
AFm wF
m/wF1 wF
m/wF2 … wF
m/wFl … wF
m/wFm
Based on this, it can be seen that aPi,j, and aF
k,l items of the matrices (they show us,
how more important is criterion “i” than criterion “j”, or criterion “k” than criterion
“l”, these values will come from the experts’ evaluation in this project) can be
calculated as in (1) and (2).
𝑎𝑖,𝑗𝑃 =
𝑤𝑖𝑃
𝑤𝑗𝑃 (1)
𝑎𝑘,𝑙𝐹 =
𝑤𝑘𝐹
𝑤𝑙𝐹 (2)
In this case, under and over the main diagonal the values are the reciprocals of each
other (as in (3) and (4)).
𝑎𝑖,𝑗𝑃 =
1
𝑎𝑗,𝑖𝑃 (3)
𝑎𝑘,𝑙𝐹 =
1
𝑎𝑙.𝑘𝐹 (4)
The next step of the formalization is to calculate the normalized comparison
matrices (A*P and A*F matrices), where first, it is necessary to sum the columns of
the comparison matrix and then every item should be divided by this sum, as in (5)
and (6). For these new matrices, it is always true, that the sum of the items in one
column is 1.
𝑎𝑖,𝑗∗𝑃 =
𝑎𝑖,𝑗𝑃
∑ 𝑎𝑖,𝑗𝑃𝑛
𝑖=1
(5)
𝑎𝑘,𝑙∗𝐹 =
𝑎𝑘,𝑙𝐹
∑ 𝑎𝑘,𝑙𝐹𝑚
𝑘=1
(6)
Next step is to calculate the weights of the criteria in the AHP model (WiP and Wk
F).
The main purpose of this is that the sum of the weights must be 1, as in (7) and (8).
∑ 𝑊𝑖𝑃 = 1𝑛
𝑖=1 (7)
∑ 𝑊𝑘𝐹 = 1𝑚
𝑘=1 (8)
We can calculate the weights from the following formula in (9) and (10).
(𝐴∗𝑃 − 𝜆𝑚𝑎𝑥𝑃 × 𝐸𝑛 ) × 𝑊𝑃 = 0 (9)
(𝐴∗𝐹 − 𝜆𝑚𝑎𝑥𝐹 × 𝐸𝑚) × 𝑊𝐹 = 0 (10)

Sárdi and Bóna / Journal of System and Management Sciences Vol. 11 (2021) No. 2, pp. 77-105
87
where:
• λmax is always the biggest eigenvalue,
• En is the n x n identity matrix,
• Em is the m x m identity matrix,
• WP and WF are the eigenvectors with the weights.
From this system of linear equations, it will be possible to get the WiP and Wk
F
weights.
In the currently examined model, we worked with an estimation method for this,
where the weights were calculated as the average of the values in the rows of the
matrices, as in (11) and (12).
𝑊𝑖𝑃 =
∑ 𝑎𝑖,𝑗∗𝑃𝑛
𝑗=1
𝑛 (11)
𝑊𝑘𝐹 =
∑ 𝑎𝑘,𝑙∗𝐹𝑚
𝑙=1
𝑚 (12)
Next step of the AHP-based ranking is to check the consistency of the matrices (so
the consistency of the comparison of the criteria). For this, first the P values, from
multiplying the row vectors of the original matrices (aiP and ak
F) by the column
vectors with the weights (WP and WF) and then dividing them by the given weights,
as in (13) and (14).
𝑃𝑖𝑃 =
𝑎𝑖𝑃∙𝑊𝑃
𝑊𝑖𝑃 (13)
𝑃𝑘𝐹 =
𝑎𝑘𝐹∙𝑊𝐹
𝑊𝑘𝐹 (14)
By use of these values, consistency index (CI) can be calculated, as in (15) and
(16).
𝐶𝐼𝑃 =
∑ 𝑃𝑖𝑃𝑛
𝑖=1𝑛
−𝑛
𝑛−1 (15)
𝐶𝐼𝐹 =
∑ 𝑃𝑘𝐹𝑚
𝑘=1𝑚
−𝑚
𝑚−1 (16)
Next step is to give a value to Saaty’s random indexes (RIP and RIF) (Sárdi & Bóna,
2020/a). In the application of our ranking model, we worked with the interpolation of
the Donegan-Dodd experimental results (Sárdi & Bóna, 2020/a) (Donegan & Dodd,
1991). Based on the RIP and RIF random indexes, the consistency ratios can be
calculated (CRP and CRF), as in (17) and (18).
𝐶𝑅𝑃 =𝐶𝐼𝑃
𝑅𝐼𝑃 (17)

Sárdi and Bóna / Journal of System and Management Sciences Vol. 11 (2021) No. 2, pp. 77-105
88
𝐶𝑅𝐹 =𝐶𝐼𝐹
𝑅𝐼𝐹 (18)
If the CR values are bigger than the experimental 0.1 value, than the examined
matrices are consistent. If based on this calculation, the examined matrix is not
consistent, it is necessary to make corrections in the comparison matrix.
Next step of the AHP-based ranking is to calculate the preference ratios from the
actual values. For this, it was necessary to collect the actual values (TP,zi and T
F,zk) of
the given criteria for all examined zones (Z1, Z2, … Zw, in case of „w” examined zones;
later, in our tests w = 4), where „z” is an integer index (z=1…w), which belongs to
the examined zone. Then, the preference ratios (Pz,iP and Pz,f
K) can be calculated with
this formula (in the default case, the smaller actual values is the bigger; if the bigger
value is the better one, it was needed to divide the actual value by the maximum of
the actual values), as in (19) and (20).
𝑃𝑧,𝑖𝑃 = 𝑊𝑖
𝑃 ∙𝑇𝑖,𝑀𝐼𝑁
𝑃
𝑇𝑖𝑃,𝑧 (19)
𝑃𝑧,𝑘𝐹 = 𝑊𝑘
𝐹 ∙𝑇𝑘,𝑀𝐼𝑁
𝐹
𝑇𝑘𝐹,𝑧 (20)
where:
• 𝑇𝑖,𝑀𝐼𝑁𝑃 = 𝑀𝐼𝑁{𝑇𝑖
𝑃,1; 𝑇𝑖𝑃,2; … ; 𝑇𝑖
𝑃,𝑤}
• 𝑇𝑘,𝑀𝐼𝑁𝐹 = 𝑀𝐼𝑁{𝑇𝑘
𝐹,1; 𝑇𝑘𝐹,2; … ; 𝑇𝑘
𝐹,𝑤}.
Last step of the ranking is to calculate the ranking values for all examined zones
(PzP and Pz
F), as in (21) and (22).
𝑃𝑧𝑃 = ∑ 𝑃𝑧,𝑖
𝑃𝑛𝑖=1 [%] (21)
𝑃𝑧𝐹 = ∑ 𝑃𝑧,𝑘
𝐹𝑚𝑘=1 [%] (22)
These ranking values will provide us the current city logistics state (PzP) and the
future development potential (PzF) of every examined zone. The bigger the calculated
value is, the better is the current state or the development potential of the given zone,
the minimum of the values is 0% and the is 100% (Sárdi & Bóna, 2020/a).
4.2. Criteria of the AHP-based ranking model
On Figure 5, the purposes of the ranking, the groups of the criteria, the criteria and
the examined zones can be seen for a general case. As it is marked on the figure, in
case of the current city logistics state, we worked with 43 criteria, and in case of the
development potentials with 56 criteria. Four main categories were defined for the
criteria (based on their sources and based on our former related research results):
• data from the data collection with our questionnaire;
• simulation-based data;

Sárdi and Bóna / Journal of System and Management Sciences Vol. 11 (2021) No. 2, pp. 77-105
89
• the properties of the logistics and transportation networks, and the related
regulations;
• the degree of concentration (we used this category only in case of ranking
the future development potentials).
Fig. 5: Decision tree of the AHP-based ranking model
The criteria, which are defined for the evaluation of the current city logistics state,
can be seen in the 1st appendix, where some criteria were grouped together, and the
numbers will show us, where we are talking about more than one criterion.
Additionally, italic letters show those cases, where the bigger value is the better, in
every other case, the default situation must be considered, so the smaller values are
the better. Where no units are defined, we worked with a scale for the evaluation. The
criteria for the evaluation of the future city logistics development potentials can be
seen in the 2nd appendix, where the notations are the same as in case of the current
state.
In the next step, we decided about the importance of these criteria with experts
from the field of city logistics and urban transportation.
4.3. Criteria evaluation by experts
For the definition of the importance of the criteria, 18 experts were asked, from the
Faculty of Transportation Engineering and Vehicle Engineering the Budapest
University of Technology and Economics, from the Clean Air Action Group (Levegő
Munkacsoport, 2020) and from the Centre for Budapest Transport (BKK, 2020). In
the first round of the evaluation, we received 13 answers, their weights were used in
the first tests (where only 35 and 51 criteria were defined in the ranking model). In

Sárdi and Bóna / Journal of System and Management Sciences Vol. 11 (2021) No. 2, pp. 77-105
90
this first round, we received some suggestions from the experts to add new criteria (8
for the current state and 5 for the development potentials), so these 18 experts were
asked again to weight the new criteria, and we received 11 answers. Based on these
answers, the final importance values could be calculated. In the evaluation phase, the
experts could choose the 4 categories below, for all criteria: 1 - Less important; 2 -
Middle important; 3 - Important; or 4 - Very important.
At the decision about the final importance of the criteria, the experience of the
experts in the field of city logistics and urban transportation was considered. For this,
we categorized the experts in a triple scale. 2 of the experts who answered, belong to
the most experienced category (category 3), 4 of them to the middle-experienced
category (category 2) and 7 of them to the less experienced category (category 1,
mostly students who work for the Research Group). Based on the answers and these
categories, we calculated ranking values for the criteria (with considering the
maximum sum value of the weights, where every answer is “4 - Very important”).
Based on these values, the criteria were ranked, and based on the shares of the answers,
we could decide about the final weights. For example, if the experts chose the “1 -
Less important” category in 10% of all the answers (weighted by their experience),
10% of all the criteria will belong to this category (in case of 50 examined criteria,
the 5 less important criteria). Then, if the “2 - Middle important” category is chosen
in 25% of all answers, the next 25% of the ranking will go to this category (so 35%
of all the answers will belong to category 1 and 2), etc. The occurrence of the final
categories can be seen on Figure 6 with bold letters, and the data with italic letters
shows the occurrence of the answers of the experts.
Fig. 6: Occurrence of the categories in the criteria evaluation phase
As it can be seen on Figure 6, the “1 - Less important” category is underrepresented,
as the experts chose in most of the cases category 2 (28% in case of the current state,
25.6% in case of the future potentials), 3 (35% and 39.3%) and 4 (25.2% and 28.7%).
5. Testing the model for shopping malls in Budapest
From our earlier research phases, we had data and a mesoscopic simulation model for
4 shopping malls from Budapest, so it was decided to test the ranking model on these
CSDLs. This means, that in the testing phase, these 4 shopping malls defined the 4
examined zones for us.

Sárdi and Bóna / Journal of System and Management Sciences Vol. 11 (2021) No. 2, pp. 77-105
91
5.1. The applications’ process
In the testing, the first step was to collect the necessary data for the ranking: we
performed analysis on database of the former data collection, we customized our
simulation model and performed the simulation runs after experiment design, and we
collected all other necessary data from other sources (from the documentation of our
researches, e.g. in case of the urban railways or brownfield lands; and from other
public databases, e.g. bike path network map or electric charging network databases).
These data were added to our ranking model as input data, the comparison matrices
were calculated based on the final importance categories of the criteria, then the
normalized matrices were calculated, the consistence was checked, and finally, the
preference ratios were calculated and the examined zones (shopping malls) were
ranked. The full process of the application of the AHP-based multicriterial ranking
model can be seen on Figure 7.
Fig. 7: Application process of the AHP-based ranking model
5.2. Test without a fictive zone
First, the tests were performed only for 3 examined shopping malls, with the original
criteria (so with the criteria, without the new ones suggested by the experts in the
evaluation phase). The results can be seen in Table 3.
Table 3: Results of the ranking without a fictive zone, for 3 shopping malls Current city logistics state Future city logistics development potentials
SM001 64,16% 82,21%
SM002 60,44% 71,12%
SM003 76,61% 69,53%
Based on the results of these tests, the examined zones have a middle or high
current city logistics state (with values between 60.4% and 76.6%), and all of them

Sárdi and Bóna / Journal of System and Management Sciences Vol. 11 (2021) No. 2, pp. 77-105
92
have high development potentials (with values between 69.5% and 82.2%). The main
problem with these results, that our data collection (Mészáros et. al., 2017) showed
earlier, that none of the examined malls is well developed (in the viewpoint of city
logistics), several development potentials were discovered, and none of the actual
regulations and the actual network is well developed in the zones of the examined
shopping malls. Based on these experiences, we can assume, that the middle category
would be the correct and real in case of the current state, with values between 50%
and 60%, but in case of the AHP models, the zones are compared only with each
other. So, in the currently examined case, the zones can be compared only to the best
one of the middle-developed zones, so the final results are distorted upwards. The
ranking sequence of the zones will be correct in this case as well, but the final values
won’t be realistic. As a result of this, we decided to add a so-called fictive zone for
the next test.
5.3. Test with a fictive zone
We added the fictive zone (in case of these tests basically a fictive shopping mall) to
the ranking model, to make it possible to compare the examined zones with a
theoretically well-developed zone, with high development potentials. The main
properties of the fictive zone were calculated with these approaches:
• in case of values on a scale, the best (the smallest or the biggest) value is
chosen;
• in case of percentage values with exact optimum, the best (0% or 100%)
value is chosen;
• in case of other values without an exact optimum (for example the
average mileage), that value is chosen, which is 10% better (smaller or
bigger) than the best one of the examined zones (later this value should
be optimized as well).
After adding the fictive zone, the AHP-based ranking was performed for 4 zones
first, the results of this test can be seen in Table 4, together with the results without a
fictive zone (which was already presented in Table III.). It is clear, that adding a
fictive zone had a significant effect, and we got more realistic results even for these
3 malls.
Table 4: Results of the ranking for 3 shopping malls, with a fictive zone
Current city logistics state Future city logistics development
potentials
Without a fictive
zone
With a fictive
zone
Without a fictive
zone
With a fictive
zone
SM001 64,16% 51,41% 82,21% 70,97%
SM002 60,44% 48,30% 71,12% 60,66%
SM003 76,61% 62,86% 69,53% 59,25%
Fictive
zone 100,00% 100,00%
Sárdi and Bóna / Journal of System and Management Sciences Vol. 11 (2021) No. 2, pp. 77-105
93
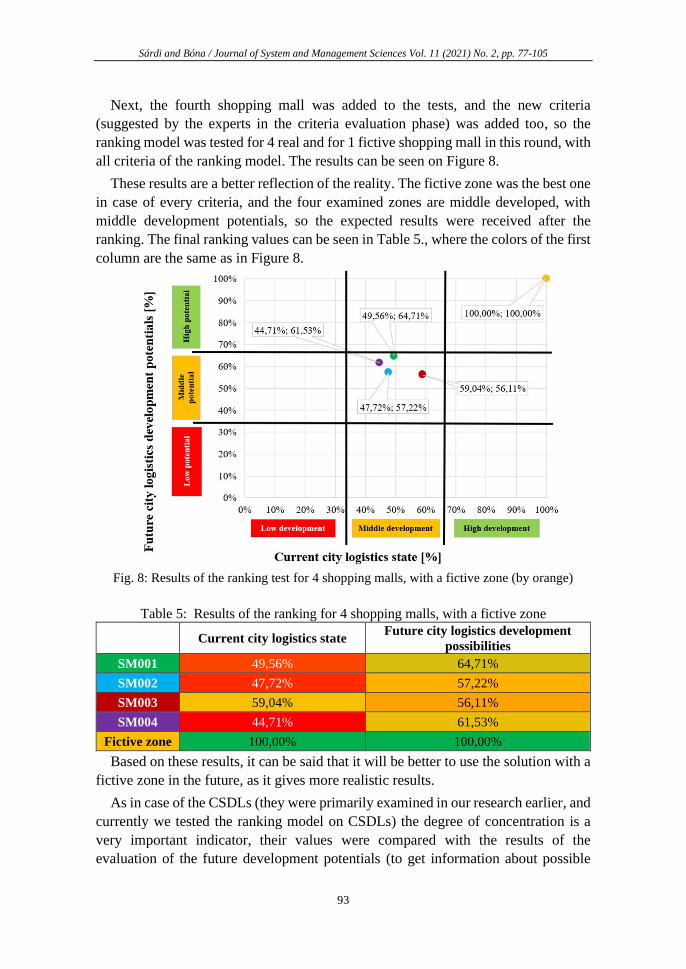
Next, the fourth shopping mall was added to the tests, and the new criteria
(suggested by the experts in the criteria evaluation phase) was added too, so the
ranking model was tested for 4 real and for 1 fictive shopping mall in this round, with
all criteria of the ranking model. The results can be seen on Figure 8.
These results are a better reflection of the reality. The fictive zone was the best one
in case of every criteria, and the four examined zones are middle developed, with
middle development potentials, so the expected results were received after the
ranking. The final ranking values can be seen in Table 5., where the colors of the first
column are the same as in Figure 8.
Fig. 8: Results of the ranking test for 4 shopping malls, with a fictive zone (by orange)
Table 5: Results of the ranking for 4 shopping malls, with a fictive zone
Current city logistics state Future city logistics development
possibilities
SM001 49,56% 64,71%
SM002 47,72% 57,22%
SM003 59,04% 56,11%
SM004 44,71% 61,53%
Fictive zone 100,00% 100,00%
Based on these results, it can be said that it will be better to use the solution with a
fictive zone in the future, as it gives more realistic results.
As in case of the CSDLs (they were primarily examined in our research earlier, and
currently we tested the ranking model on CSDLs) the degree of concentration is a
very important indicator, their values were compared with the results of the
evaluation of the future development potentials (to get information about possible

Sárdi and Bóna / Journal of System and Management Sciences Vol. 11 (2021) No. 2, pp. 77-105
94
correlation between them and the ranking values), this can be seen in Table 6. (the
meaning of DoC1 etc. is defined in the 2nd appendix). Based on the correlation indexes,
it is clear, that there is no significant connection and correlation between the
development potential and degree of concentration, only in case of the single degree
of concentration (with or without considering the multilevel concentrated sets of
delivery locations) goes it up to an absolute value of 30-40%.
Table 6: Comparison between the ranking results and the degree of concentration
(DoC) values
PzF
DoC1
[delivery
locations/km2]
DoC2
[delivery
locations/km2]
DoC3 [store
m2 /m2]
DoC4 [store
m2 /m2]
SM001 64,7% 5533,3 1383,3 1,6 0,4
SM002 57,2% 4261,4 1153,8 2,0 0,5
SM003 56,1% 6960,0 1871,0 1,0 0,3
SM004 61,5% 2413,8 804,6 0,9 0,3
Correlation -30,65% -40,68% 0,93% 11,75%
5.4. Sensitivity analysis
In this phase of the currently examined research project, we already performed some
sensitivity analysis, the effects of changing the importance (the weights) of the
criteria were analysed, on the results of the ranking, in four different cases:
• in case of constant importance values (all the importance values were the
same, there was no difference between the importance of the criteria);
• in case of random importance values with the original share of the four
categories;
• in case of random importance values with normal distribution;
• and in case of random importance values with uniform distribution.
In case of the random importance values, 10 different random sets were analysed,
and the average results were used for the further analysis. Based on the results of this
analysis, it is clear, that changing the importance values won’t affect significantly the
results:
• in case of the ranking values of the current city logistics state, the average
absolute change was 2.7%, with 1.8% standard deviation (the highest change
was 6.0%, the lowest one 0.5%);
• in case of the ranking values of the future city logistics development
potentials, the average absolute change was 0.5%, with 0.3% standard
deviation (the highest change was 1.2%, the lowest one 0.5%);

Sárdi and Bóna / Journal of System and Management Sciences Vol. 11 (2021) No. 2, pp. 77-105
95
• in case of the sequence of the current city logistics state, the average absolute
change was 0.04, with 0.05 standard deviation (the highest change was 0.1,
the lowest one 0);
• and in case of the sequence of the future city logistics development potentials,
the average absolute change was 0.08, with 0.10 standard deviation (the
highest change was 0.3, the lowest one 0).
As an example, Figure 9 shows the results of the sensitivity analysis for the current
city logistics state.
Fig. 9: Results of the sensitivity analysis for the current city logistics state
Next, the next steps of the previously presented research will be defined.
6. Future Study
In this project, we developed an AHP-based, two-dimensional ranking model to
evaluate the current city logistics state and the future city logistics development
potentials of urban zones, it was tested on 4 urban zones defined by 4 shopping malls
in Budapest, some sensitivity analysis were also performed, and we already defined
the next steps of this research.
First, it is planned to develop a multilevel criteria hierarchy, because of the
significant number of criteria in this ranking model. In this multilevel hierarchy, it
will be necessary to define the importance of the criteria groups first, and then the
importance of the criteria in each group. Next, we would like to implement to the
ranking model an algorithm, which makes it possible to calculate the exact, optimal
weights, based on the available input data. In the current version of the ranking model,
an estimation method was used, presented in (11) and (12). It is also possible, that
some new criteria will be added to the ranking model, as at our presentation at the
10th International Conference on Logistics, Informatics and Service Sciences
(LISS2020), it was suggested by the audience to add criteria related to the logistics
providers in the zone and criteria about the service level in examined zone. From
another research project we also got an idea to define the degree of consolidation and

Sárdi and Bóna / Journal of System and Management Sciences Vol. 11 (2021) No. 2, pp. 77-105
96
the potential degree of consolidation in this ranking model. In the next steps, we are
going to examine these possible new criteria.
It will be also very important to test the currently examined model on other urban
zones as well, as more experience is needed with its use. For this, it is planned to
examine the “Váci utca” shopping area from Budapest, because we have data about
the delivery locations of this area, its stores were examined by our questionnaire
between 2017, March and 2018, August, and a topological model was also developed
for the whole area (Sárdi & Bóna, 2019/b). The first step of this will be to develop
the simulation model of this area too. As the examined area is a bigger one with
several delivery locations, we plan to work with more subzones. The possible zones
of the area can be seen on Figure 10 (4 subzones as an example), but for the exact
definition of the subzones, it will be necessary to analyse the topology and the
logistics flows as well. Later, we also would like to add the previously examined
market with a closed infrastructure to the testing of our ranking model.
Fig. 10: Possible subzones of the “Váci utca” shopping area in Budapest, on The Google
Maps
If the simulation model of the logistics process of the new zones (so the expected
4 subzones of the shopping area and the zone defined by the market) will be ready,
we are going to be able to rank 4 shopping malls, 1 market with closed infrastructure
and presumably 4 subzones of a shopping area with our AHP-based model. On Figure
11, these 9 zones can be seen with other urban zones from Budapest (with only single
delivery locations), these 9 zones will be examined by the ranking model in the next
phase of the testing, if the necessary data processing and the simulation will be ready
for them. On the figure, the locations of the CSDLs with closed infrastructure are not
exact, due to anonymity reasons.

Sárdi and Bóna / Journal of System and Management Sciences Vol. 11 (2021) No. 2, pp. 77-105
97
Fig. 11: Model of the examined zones in Budapest
Naturally, as the investigation of the concentrated sets of delivery locations is in
the focus of the City Logistics Research Group of our Department, we have data and
simulation models about this kind of special delivery locations, these made it possible
to test the ranking model. In the future, we would like to add single urban zones with
single delivery locations to the model and test it with them too. For this, from some
other projects of the University, there is available data, but first, it will be necessary
to process them, and it will be also necessary to build simulation models for these
areas too.
It will be also a very important task in the future to perform some more sensitivity
analysis to examine the effects of changing the actual values for each criterion in our
AHP-based ranking model, as the effects of changing the actual values will be able
to show, what should be exactly developed, if we would like to increase the city
logistics state of the examined zone or we would like to increase the development
potentials of the zones.
In a longer term, there are also plans to develop such a tool, which will be able to
perform the ranking automatically for any number of zones, if the input files (the
actual values of the criteria and results of the experts’ evaluation) are available in a
standard form. In the current version, we need to customize the ranking file and the
input files for the given zones. For this, we plan to use Visual Basic by MS Excel or
Python.
7. Summary
In this paper, the main purpose was to present an AHP-based, two-dimensional
multicriterial ranking model, which makes it possible to evaluate the current city
logistics state and the future city logistics development potentials of urban zones. It

Sárdi and Bóna / Journal of System and Management Sciences Vol. 11 (2021) No. 2, pp. 77-105
98
is expected that this ranking model will be able to help future city logistics projects
with highlighting those urban zones, they should be developed at all and can be
developed well. For choosing the best multicriterial method, a complex literature
review was performed and based on that it was decided to use the AHP method, as it
is one of the most popular methods in city logistics and other logistics fields. The
literature review also showed that the two-dimensional purposes of our project are
completely new, there was no ranking model developed for these purposes in city
logistics.
In this project, we worked with some former results of our city logistics research,
we used the data, which was collected by our own data collection methodology, and
we worked with our mesoscopic simulation model too, which helped to examine the
current and a gateway-concept based new city logistics system, for urban zones,
which were defined by shopping malls, in Budapest. Based on these, four main
criteria groups were defined: questionnaire data, simulation-based data, degree of
concentration, and regulation and network properties. In this paper, the formalization
of the model and the evaluation of the criteria was presented as well. For the
evaluation of the importance of the criteria, 18 experts from the field of city logistics
and urban transportation were asked. In the first round of evaluation 13 of them
answered, then some new criteria were added based on their suggestions and opinion,
and in the second round 11 experts answered again about the importance of the new
criteria. Based on these answers and based on the level of experience of the experts,
the final weights of the criteria were calculated.
By use of these final weights and by use of all other input data, the tests of the
multicriterial model for 4 urban zones (4 shopping malls) were performed. In the first
tests, only these zones were examined, but the results were not appropriate based on
the previous data collection from our research, as the AHP compared the middle-
developed zones only with each other, and some of them became well-developed
because of this. As a result of this, a so-called fictive zone was added to the ranking,
with optimal and good properties, and this helped to get realistic results, the ranking
model showed correctly the current state and the development potentials too. We
already performed some sensitivity analysis, and based on this we can say, that
changing the weights won’t significantly affect the results of the ranking. At the end
of the paper, some tasks for the next steps of our research were presented too. It will
be very important to develop a multilevel criteria hierarchy, to implement the optimal
weight calculation and to test the ranking model on more zones to get more
experience with its use, but now we can clearly say, that we developed such a
multicriterial ranking model, which will be able to rank urban zones in case of future
city logistics projects.
8. Acknowledgements
The research project between September, 2019 and June, 2020: Supported by the

Sárdi and Bóna / Journal of System and Management Sciences Vol. 11 (2021) No. 2, pp. 77-105
99
ÚNKP-19-3 New National Excellence Program of the Ministry for Innovation and
Technology.
The research project after September, 2020: Supported by the ÚNKP-20-3 New
National Excellence Program of the Ministry for Innovation and Technology.
References
Antún, J. & Alarcón, R. (2014). Ranking Projects of Logistics Platforms: A
Methodology Based on the Electre Multicriteria Approach. Procedia - Social and
Behavioral Sciences, 160, 5-14.
Awasthi, A. & Chauhan S. (2011). A hybrid approach integrating Affinity Diagram,
AHP and fuzzy TOPSIS for sustainable city logistics planning. Applied Mathematical
Modelling, 36, 2, 573-584.
Awasthi, A., Chauhan, S. & Goyal, S. (2010). A multi-criteria decision making
approach for location planning for urban distribution centers under uncertainty.
Mathematical and Computer Modelling, 53, 1-2, 98-109.
BKK (2020). BKK in brief. Budapesti Közlekedési Központ. Available:
https://bkk.hu/en/main-page/bkk-in-brief/ [Accessed: 2020. 08. 10.]
BME-ALRT (2020). Website of the City Logistics Research Group of the Department
of Material Handling and Logistics Systems - A City Logisztikai Kutatócsoport
honlapja. Budapest Universityof Technology and Economics. Available:
https://www.logisztika.bme.hu/citylog/ [Accessed: 2020. 08. 07.]
Bóna, K. & Sárdi, D. L. (2018). Analysis and mesoscopic modelling of logistics
systems of concentrated urban delivery points - Koncentrált városi igénypontok
áruellátó logisztikai rendszereinek elemzése és mezoszkópikus szintű modellezése,
Logisztikai Évkönyv 2019, 121-130.
Bóna, K. & Sárdi, D. L. (2019). New concepts of logistics systems of the urban
concentrated sets of delivery points, by use of different transportation modes - A
városi koncentrált igénypont-halmazok áruellátási rendszerének új koncepciói a
különböző közlekedési alágazatok lehetőségeinek kihasználásával. XIII. IFFK
Conference (Innovation and Sustainable Surface Transport), Budapest, 2019.
Bóna, K., Róka, Á. & Sárdi, D. L. (2018). Mathematical Modelling of the Cost
Structure of the Logistics System of Shopping Malls in Budapest. Periodica
Polytechnica Transportation Engineering, 46, 3, 142-150.

Sárdi and Bóna / Journal of System and Management Sciences Vol. 11 (2021) No. 2, pp. 77-105
100
Bóna, K., Róka, Á. & Sárdi, D. L. (2019). Sizing of the cross docks of the urban
concentrated sets of delivery points in Budapest - Városi koncentrált igénypont-
halmazok áruforgalmi zsilipeinek méretezése Budapesten. XIII. IFFK Conference
(Innovation and Sustainable Surface Transport), Budapest, 2019.
Donegan H. & Dodd F. (1991). A note on saaty's random indexes. Mathematical and
Computer Modelling, 15, 10, 135-137.
Gogas, M., Adamos G. & Nathanail E. (2017). Assessing the performance of
intermodal city logistics terminals in Thessaloniki. Transportation Research
Procedia, 24, 17-24.
Janjevic, M., Knoppen, D. & Winkenbach, M. (2019). Integrated decision-making
framework for urban freight logistics policy-making. Transportation Research Part
D: Transport and Environment, 72, 333-357.
Kara, Y. (2019). Measuring the Sustainability of Cities in Turkey with the Analytic
Hierarchy Process. Open Journal of Social Sciences, 7, 322-334.
Levegő Munkapcsoport (2020). The Clean Air Action Group. Levegő Munkacsoport.
Available: https://www.levego.hu/en/about-us/achievements/ [Accessed: 2020. 08.
10.]
Mészáros, B., Sárdi, D. L. & Bóna, K. (2016). Developing and testing a methodology
for acquiring the logistical characteristics of shopping malls in Budapest, for city
logistical solutions. 5th IEEE International Conference on Advanced Logistics and
Transport, Krakow, 2016, 154-159.
Mészáros, B., Sárdi, D. L. & Bóna, K. (2017). Monitoring, measurement and
statistical analysis (MMSA) based methodology for improvement city logistics of
shopping malls in Budapest. World Review of Intermodal Transportation Research,
6, 4, 352-371.
Patier, D. & Browne, M. (2010). A methodology for the evaluation of urban logistics
innovations. Procedia - Social and Behavioral Sciences, 2, 3, 6229-6241.
Saaty, R. (1987). The Analytic Hierarchy Process – What It Is and How It Is Used.
Mathematical Modelling, 9, 3-5, 161-176.
Sárdi, D. L. & Bóna, K. (2017). Developing a mesoscopic simulation model for the
examination of shopping mall freight traffic in Budapest. Smart Cities Symposium
2017, Prague.

Sárdi and Bóna / Journal of System and Management Sciences Vol. 11 (2021) No. 2, pp. 77-105
101
Sárdi, D. L. & Bóna, K. (2018). Macroscopic simulation model of a multi-stage,
dynamic cargo bike-based logistics system in the supply of shopping malls in
Budapest. Smart Cities Symposium 2018, Prague.
Sárdi, D. L. & Bóna, K. (2019). Evaluation of the application possibilities of cargo
bikes in the logistics system of shopping malls, based on the geometrical structure of
the network - Cargo kerékpárok alkalmazási lehetőségeinek értékelése a
bevásárlóközpontok logisztikai rendszerében a hálózat geometriai struktúrája alapján.
Logisztikai Évkönyv 2020, 163-173.
Sárdi, D. L. & Bóna, K. (2019). Examination of the logistics systems of concentrated
sets of urban delivery points by simulation. The 21th International Conference on
Harbor, Maritime & Multimodal Logistics Modelling and Simulation, Lisbon, 2019,
1-10.
Sárdi, D. L. & Bóna, K. (2019). Simulation modelling in the sizing of city logistics
systems – a study for concentrated delivery points. International Journal of
Engineering and Management Sciences, 4, 1.
Sárdi, D. L. & Bóna, K. (2020). Developing and application of an AHP-based
multicriterial ranking model, for the city logistics analysis of urban areas - AHP alapú
multikritériumos minősítési modell kidolgozása és alkalmazása városi övezetek city
logisztikai szempontú értékelésére. International Conference on Transport Sciences,
Győr, 2020, unpublished.
Sárdi, D. L. & Bóna, K. (2020). Mesoscopic simulation model of the logistics system
of concentrated sets of urban delivery locations. International Journal of Simulation
and Process Modelling, under review.
Tadić, S., Zeevi, S. & Krstić, M. (2014). A novel hybrid MCDM model based on
fuzzy DEMATEL, fuzzy ANP and fuzzy VIKOR for city logistics concept selection.
Expert Systems with Applications, 41, 8112-8128.
Tadić, S., Zeevi, S. & Krstić, M. (2017). Sustainability of the city logistics initiatives.
3rd Logistics International Conference (LOGIC 2017), Belgrade, 2017.
Teoh, T., Kunze, O. & Teo C. (2016). Methodology to Evaluate the Operational
Suitability of Electromobility Systems for Urban Logistics Operations.
Transportation Research Procedia, 12, 288-300.

Sárdi and Bóna / Journal of System and Management Sciences Vol. 11 (2021) No. 2, pp. 77-105
102
Uysalh, T. & Kemal, U. (2014). Selection of Logistics Centre Location via
ELECTRE Method: A Case Study in Turkey. International Journal of Business and
Social Science, 5, 9.
Wątróbski, J., Małecki, K., Kijewska, K., Iwan, S., Karczmarczyk, A. & Thompson,
R. (2017). Multi-Criteria Analysis of Electric Vans for City Logistics. Sustainability,
9, 8, 1-34.
Zhao, L., Li, H., Li, M., Sun, Y., Hu, Q., Mao, S., Li, J. & Xue J. (2018). Location
selection of intra-city distribution hubs in the metro-integrated logistics system.
Tunnelling and Underground Space Technology, 80, 246-256.
9. Appendix
9.1. Criteria for the evaluation of the current city logistics state
Questionnaire data:
• 1. Compliance of the actual entry regulations by the delivery locations of the zone [%]
• 2. Number of different logistics units used by the delivery locations of the zone
• 3. Share of the delivery locations, which use unit loads in the zone [%]
• 4. Actual share of night deliveries in the zone [%]
• 5. Actual share of peak time deliveries in the zone [%]
• 6. Share of delivery location with cargo bike deliveries in the zone [%]
• 7. Average floor area of the warehouse areas in the examined zone [m2/delivery location]
• 8. Average time, which can be served from the full capacity of the delivery locations of the zone [day]
• 9. Share of outbound deliveries in the zone (except the home deliveries) [%]
• 10. Share of delivery locations with existing IT or ERP system [%]
• 11. Share of delivery locations with home deliveries in the examined zone [%]
• 12. Share of home deliveries from the delivery locations in the examined zone [%] (compared to all the goods in the zone)
Simulation-based data:
• 13. Number of arrival delivery transactions to the zone [delivery/time period]
• 14-15. Average mileage and delivery performance of a delivery location in the zone [km/location/time period; tkm/location/time period]

Sárdi and Bóna / Journal of System and Management Sciences Vol. 11 (2021) No. 2, pp. 77-105
103
• 16-20. Average CO2, CO, NOx, HC, and PM of a delivery location in the zone [kg/location/time period]
• 21. Average sum stock (in the whole supply system) of an average delivery location in the zone [t/location/time period]
• 22-23. Average sum logistics cost and delivery cost of an average delivery location in the zone [monetary unit/location/time period]
• 24. The sum operation cost of the logistics infrastructure in the zone [monetary unit/time period]
Network and regulation properties:
• 25. The existence of the entry regulations in the examined zone
• 26-27. Adequacy and enforceability of the actual entry regulations in the examined zone
• 28. Verifiability of the actual entry regulation in the examined zone
• 29. Loading possibilities in the examined zone [pcs of loading areas/location]
• 30. Average distance of the delivery locations from the loading areas in the zone [m]
• 31. State of the transportation infrastructure in the examined zone
• 32. Coverage provided by the electric charging network in the examined zone [pcs of chargers/km2]
• 33. Number of package pick points in the zone [pcs]
• 34. Density of the package pick points in the zone [pcs/km2]
• 35. Possibilities to include pedestrian couriers
• 36. Possibilities of cargo bike deliveries (availability of proper bike path network)
• 37-39. Share of railway, waterway and combined deliveries in the examined zone [%]
• 40-41. Share of autonomous delivery vehicles and cargo drones in the examined zone [%]
• 42-43. Possibilities of deliveries by autonomous delivery vehicles or cargo drones, based on the actual infrastructure and regulations
9.2. Criteria for the evaluation of the future city logistics development potentials
Questionnaire data:
• 1. Number of different logistics units used by the delivery locations of the zone [pcs]
• 2. Share of the delivery locations, which use unit loads in the zone [%]
• 3. Average number of “stock keeping units” (SKUs, goods) of a delivery location in the examined zone [pcs of SKUs]

Sárdi and Bóna / Journal of System and Management Sciences Vol. 11 (2021) No. 2, pp. 77-105
104
• 4. Number of groups of SKUs they can be merged in the examined zone [pcs of SKU groups]
• 5-6. Share of special and perishable/refrigerated goods at an average delivery location in the zone [%]
• 7. Actual share of night deliveries in the zone [%]
• 8. Share of delivery location with cargo bike deliveries in the zone [%]
• 9. Average floor area of the warehouse areas in the examined zone [m2/delivery location]
• 10. Average time, which can be served from the full capacity of the delivery locations of the zone [day]
• 11. Share of outbound deliveries in the zone (except the home deliveries) [%]
• 12. Share of delivery locations with existing IT or ERP system [%]
• 13-15. Average willingness of the delivery locations to participate in new city logistics systems; average importance of green aspects and average importance of urban transportation aspects for the delivery locations
Simulation-based data:
• 16. Expected reduction of the number of arrival delivery transactions to the zone [%]
• 17. Sum arrival amount of goods to the examined zone [t/time period]
• 18. Expected reduction of the sum mileage in the examined zone [%]
• 19. Expected growth of the sum delivery performance in the examined zone [%]
• 20-24. Expected reduction of the sum CO2, CO, NOx, HC, and PM emission in the zone [%]
• 25. Expected growth of the sum stock (in the whole supply system) of the examined zone [%]
• 26-27. Expected reduction of the sum logistics cost and delivery cost in the examined zone [%]
• 28. Expected operation cost of the logistics infrastructure in the examined zone [monetary unit]
• 29-30. Expected investment cost of the cross docks and the common loading areas of the examined zone [monetary unit]
Degree of concentration in the zone:
• 31. Degree of concentration of the examined zone [pcs of delivery locations/km2 floor area] (in Table VI.: DoC1)
• 32. Degree of concentration of the examined zone, with considering the multilevel concentrated sets of delivery locations [pcs of delivery locations/km2 sum available area] (in Table VI.: DoC2)

Sárdi and Bóna / Journal of System and Management Sciences Vol. 11 (2021) No. 2, pp. 77-105
105
• 33. Area proportional degree of concentration of the examined zone [m2 floor area of the delivery locations/m2 floor area] (in Table VI.: DoC3)
• 34. Area proportional degree of concentration of the examined zone, with considering the multilevel concentrated sets of delivery locations [m2 floor area of the delivery locations/m2 sum available area] (in Table VI.: DoC4)
Network and regulation properties:
• 35. The existence of the entry regulations in the examined zone
• 36-37. Adequacy and enforceability of the actual entry regulations in the examined zone
• 38. Loading possibilities in the examined zone [pcs of loading areas/location]
• 39. Average distance of the delivery locations from the loading areas in the zone [m]
• 40. State of the transportation infrastructure in the examined zone
• 41. Coverage provided by the electric charging network in the examined zone [pcs of chargers/km2]
• 42. Number of package pick points in the zone [pcs]
• 43. Density of the package pick points in the zone [pcs/km2]
• 44. Possibilities to include pedestrian couriers
• 45. Possibilities of cargo bike deliveries (availability of proper bike path network)
• 46-47. Possibilities of railway, waterway and combined deliveries in the examined zone
• 49-50. Possibilities of deliveries by autonomous delivery vehicles or cargo drones, based on the actual infrastructure and regulations
• 51-52. Average distance of the delivery locations from the railway and from the waterway network in the examined zone [km]
• 53-54. Number and sum floor area of possible brownfield lands for a cross dock in the examined zone [pcs of possible brownfield lands; m2 floor area of possible brownfield lands]
• 55. Average distance of the loading areas from the possible brownfield lands [km]
• 56. Number of transshipment points in the expected new city logistics system of the examined zone [pcs of transshipment points]