city agencies - san diego
TRANSCRIPT
City Agencies
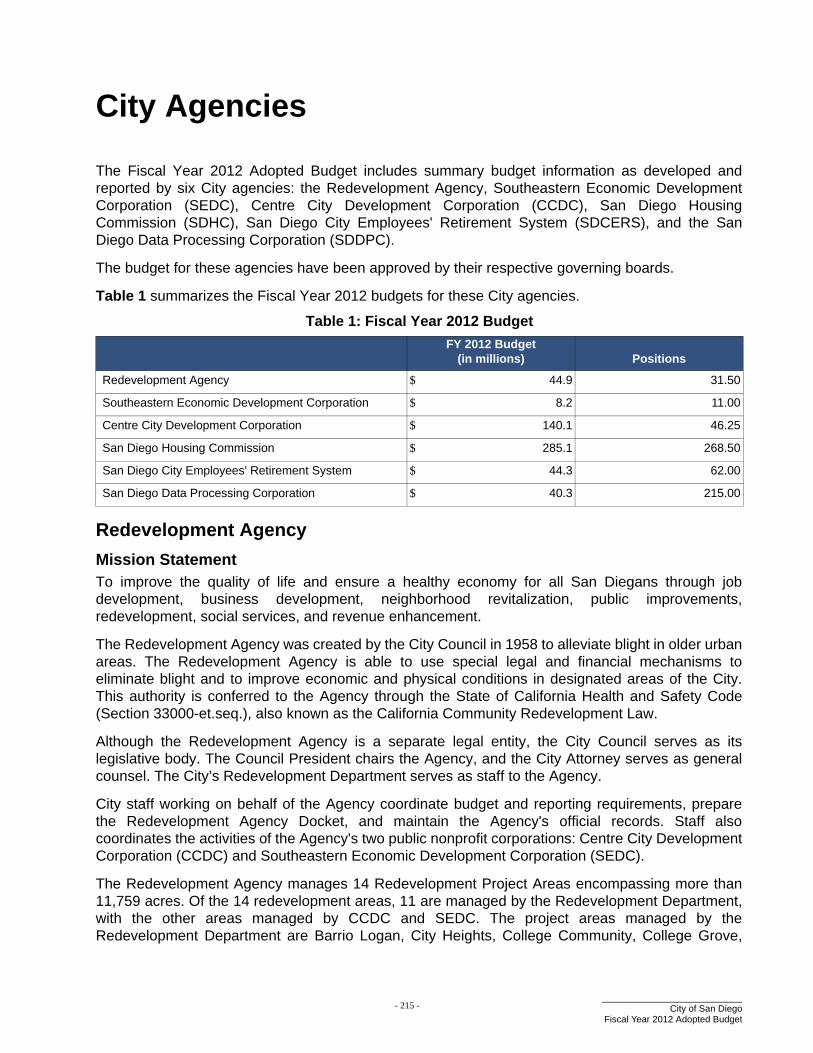
The Fiscal Year 2012 Adopted Budget includes summary budget information as developed and reported by six City agencies: the Redevelopment Agency, Southeastern Economic Development Corporation (SEDC), Centre City Development Corporation (CCDC), San Diego Housing Commission (SDHC), San Diego City Employees' Retirement System (SDCERS), and the San Diego Data Processing Corporation (SDDPC).
The budget for these agencies have been approved by their respective governing boards.
Table 1 summarizes the Fiscal Year 2012 budgets for these City agencies.
Table 1: Fiscal Year 2012 Budget FY 2012 Budget
(in millions) Positions
Redevelopment Agency $ 44.9 31.50
Southeastern Economic Development Corporation $ 8.2 11.00
Centre City Development Corporation $ 140.1 46.25
San Diego Housing Commission $ 285.1 268.50
San Diego City Employees' Retirement System $ 44.3 62.00
San Diego Data Processing Corporation $ 40.3 215.00
Redevelopment Agency Mission Statement To improve the quality of life and ensure a healthy economy for all San Diegans through job development, business development, neighborhood revitalization, public improvements, redevelopment, social services, and revenue enhancement.
The Redevelopment Agency was created by the City Council in 1958 to alleviate blight in older urban areas. The Redevelopment Agency is able to use special legal and financial mechanisms to eliminate blight and to improve economic and physical conditions in designated areas of the City. This authority is conferred to the Agency through the State of California Health and Safety Code (Section 33000-et.seq.), also known as the California Community Redevelopment Law.
Although the Redevelopment Agency is a separate legal entity, the City Council serves as its legislative body. The Council President chairs the Agency, and the City Attorney serves as general counsel. The City’s Redevelopment Department serves as staff to the Agency.
City staff working on behalf of the Agency coordinate budget and reporting requirements, prepare the Redevelopment Agency Docket, and maintain the Agency's official records. Staff also coordinates the activities of the Agency's two public nonprofit corporations: Centre City Development Corporation (CCDC) and Southeastern Economic Development Corporation (SEDC).
The Redevelopment Agency manages 14 Redevelopment Project Areas encompassing more than 11,759 acres. Of the 14 redevelopment areas, 11 are managed by the Redevelopment Department, with the other areas managed by CCDC and SEDC. The project areas managed by the Redevelopment Department are Barrio Logan, City Heights, College Community, College Grove,
- 215 - City of San Diego Fiscal Year 2012 Adopted Budget
-
-
City Agencies
Crossroads, Grantville, Linda Vista, Naval Training Center (NTC), North Bay, North Park, and San Ysidro.
The Redevelopment Department administers six Project Area Committees that advise the Agency regarding plan adoption and project implementation activities.
On February 28, 2011, the Redevelopment Agency and the City of San Diego entered into a Cooperation Agreement for Payment of Costs Associated with Certain Redevelopment Agency Funded Projects (Cooperation Agreement). Pursuant to this Cooperation Agreement, the Redevelopment Agency’s Fiscal Year 2012 budget includes payments to the City to fund certain redevelopment projects.
On June 30, 2011, Governor Brown signed ABX1 26 which eliminates redevelopment agencies, and ABX1 27 which allows redevelopment agencies to exist under specific conditions. The budget approved by the Redevelopment Agency Board on June 14, 2011 does not reflect the impact of the legislation signed by the Governor. The Redevelopment Agency budget may be amended by the Redevelopment Agency Board to reflect the new legislation.
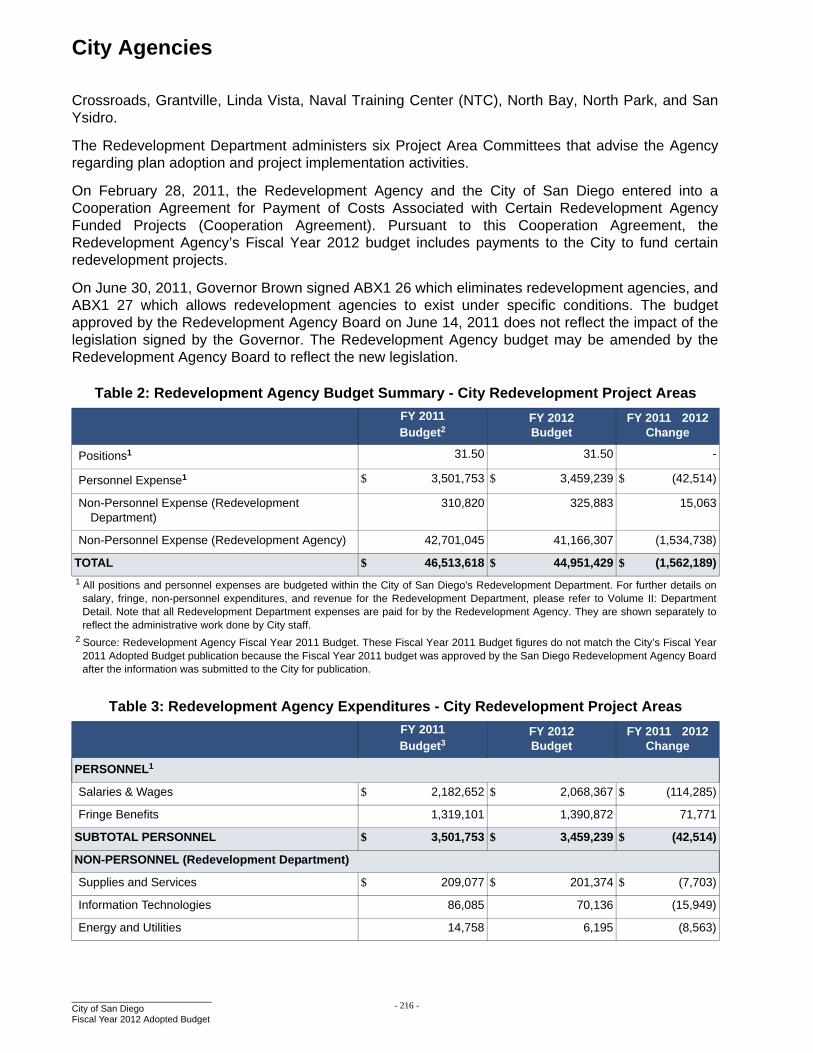
Table 2: Redevelopment Agency Budget Summary - City Redevelopment Project Areas FY 2011 Budget2
FY 2012 Budget
FY 2011 2012 Change
Positions1 31.50 31.50 -
Personnel Expense1 $ 3,501,753 $ 3,459,239 $ (42,514)
Non-Personnel Expense (Redevelopment Department)
310,820 325,883 15,063
Non-Personnel Expense (Redevelopment Agency) 42,701,045 41,166,307 (1,534,738)
TOTAL $ 46,513,618 $ 44,951,429 $ (1,562,189) 1 All positions and personnel expenses are budgeted within the City of San Diego's Redevelopment Department. For further details on
salary, fringe, non-personnel expenditures, and revenue for the Redevelopment Department, please refer to Volume II: Department Detail. Note that all Redevelopment Department expenses are paid for by the Redevelopment Agency. They are shown separately to reflect the administrative work done by City staff.
2 Source: Redevelopment Agency Fiscal Year 2011 Budget. These Fiscal Year 2011 Budget figures do not match the City’s Fiscal Year 2011 Adopted Budget publication because the Fiscal Year 2011 budget was approved by the San Diego Redevelopment Agency Board after the information was submitted to the City for publication.
Table 3: Redevelopment Agency Expenditures - City Redevelopment Project Areas FY 2011 Budget3
FY 2012 Budget
FY 2011 2012 Change
PERSONNEL1
Salaries & Wages $ 2,182,652 $ 2,068,367 $ (114,285)
Fringe Benefits 1,319,101 1,390,872 71,771
SUBTOTAL PERSONNEL $ 3,501,753 $ 3,459,239 $ (42,514)
NON-PERSONNEL (Redevelopment Department)
Supplies and Services $ 209,077 $ 201,374 $ (7,703)
Information Technologies 86,085 70,136 (15,949)
Energy and Utilities 14,758 6,195 (8,563)
- 216 -City of San Diego Fiscal Year 2012 Adopted Budget
-
-
City Agencies
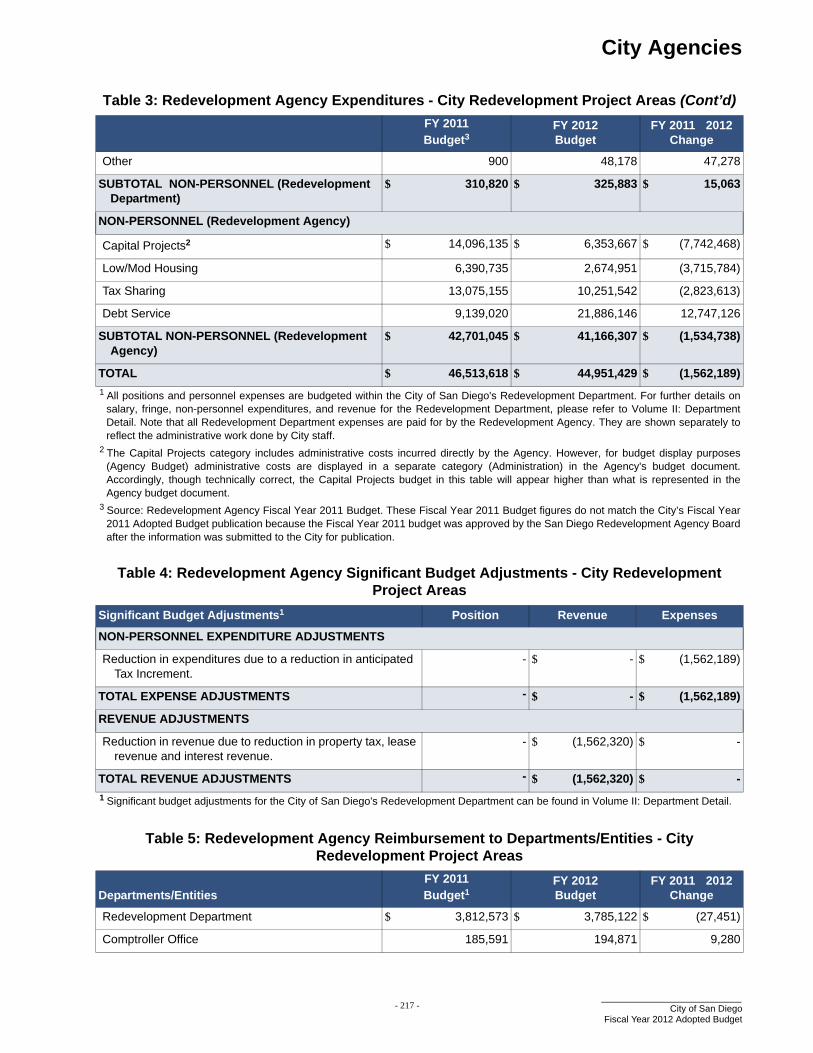
Table 3: Redevelopment Agency Expenditures - City Redevelopment Project Areas (Cont’d) FY 2011 Budget3
FY 2012 Budget
FY 2011 2012 Change
Other 900 48,178 47,278
SUBTOTAL NON-PERSONNEL (Redevelopment Department)
$ 310,820 $ 325,883 $ 15,063
NON-PERSONNEL (Redevelopment Agency)
Capital Projects2 $ 14,096,135 $ 6,353,667 $ (7,742,468)
Low/Mod Housing 6,390,735 2,674,951 (3,715,784)
Tax Sharing 13,075,155 10,251,542 (2,823,613)
Debt Service 9,139,020 21,886,146 12,747,126
SUBTOTAL NON-PERSONNEL (Redevelopment Agency)
$ 42,701,045 $ 41,166,307 $ (1,534,738)
TOTAL $ 46,513,618 $ 44,951,429 $ (1,562,189) 1 All positions and personnel expenses are budgeted within the City of San Diego's Redevelopment Department. For further details on
salary, fringe, non-personnel expenditures, and revenue for the Redevelopment Department, please refer to Volume II: Department Detail. Note that all Redevelopment Department expenses are paid for by the Redevelopment Agency. They are shown separately to reflect the administrative work done by City staff.
2 The Capital Projects category includes administrative costs incurred directly by the Agency. However, for budget display purposes (Agency Budget) administrative costs are displayed in a separate category (Administration) in the Agency's budget document. Accordingly, though technically correct, the Capital Projects budget in this table will appear higher than what is represented in the Agency budget document.
3 Source: Redevelopment Agency Fiscal Year 2011 Budget. These Fiscal Year 2011 Budget figures do not match the City’s Fiscal Year 2011 Adopted Budget publication because the Fiscal Year 2011 budget was approved by the San Diego Redevelopment Agency Board after the information was submitted to the City for publication.
Table 4: Redevelopment Agency Significant Budget Adjustments - City Redevelopment Project Areas
Significant Budget Adjustments1 Position Revenue Expenses
NON-PERSONNEL EXPENDITURE ADJUSTMENTS
Reduction in expenditures due to a reduction in anticipated Tax Increment.
- $ - $ (1,562,189)
TOTAL EXPENSE ADJUSTMENTS - $ - $ (1,562,189)
REVENUE ADJUSTMENTS
Reduction in revenue due to reduction in property tax, lease revenue and interest revenue.
- $ (1,562,320) $ -
TOTAL REVENUE ADJUSTMENTS - $ (1,562,320) $ -1 Significant budget adjustments for the City of San Diego's Redevelopment Department can be found in Volume II: Department Detail.
Table 5: Redevelopment Agency Reimbursement to Departments/Entities - City Redevelopment Project Areas
Departments/Entities FY 2011 Budget1
FY 2012 Budget
FY 2011 2012 Change
Redevelopment Department $ 3,812,573 $ 3,785,122 $ (27,451)
Comptroller Office 185,591 194,871 9,280
- 217 - City of San Diego Fiscal Year 2012 Adopted Budget
-
-
City Agencies
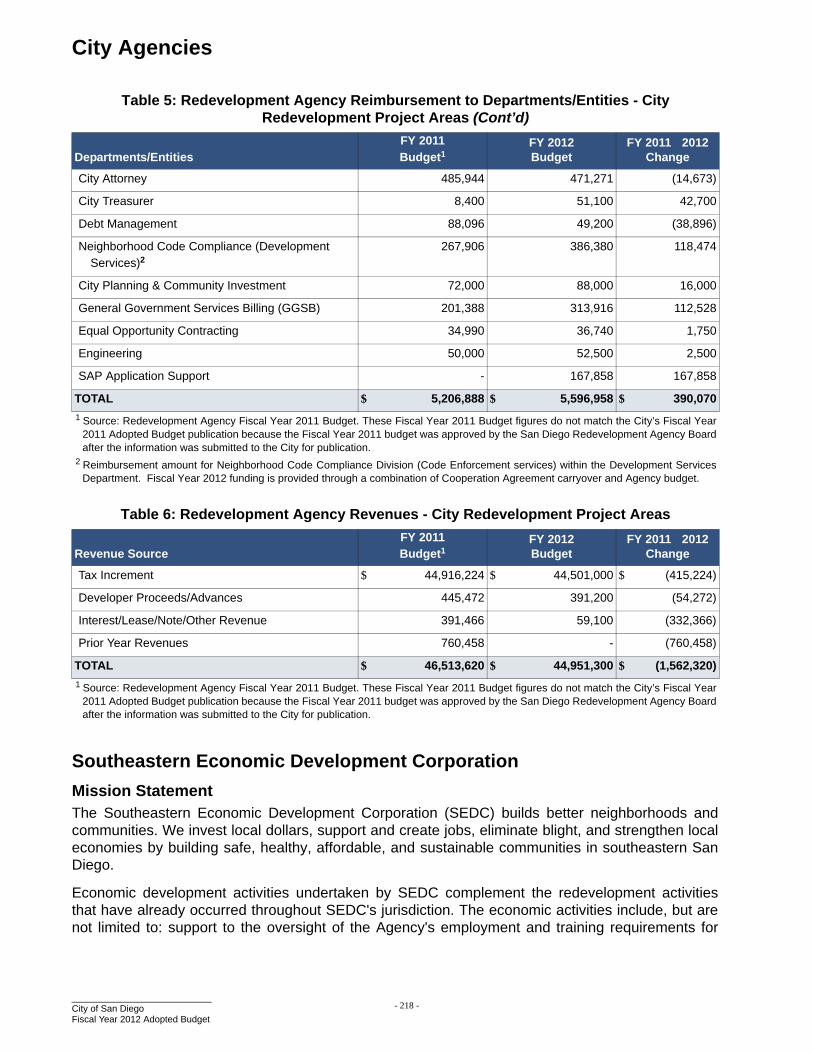
Table 5: Redevelopment Agency Reimbursement to Departments/Entities - City Redevelopment Project Areas (Cont’d)
Departments/Entities FY 2011 Budget1
FY 2012 Budget
FY 2011 2012 Change
City Attorney 485,944 471,271 (14,673)
City Treasurer 8,400 51,100 42,700
Debt Management 88,096 49,200 (38,896)
Neighborhood Code Compliance (Development Services)2
267,906 386,380 118,474
City Planning & Community Investment 72,000 88,000 16,000
General Government Services Billing (GGSB) 201,388 313,916 112,528
Equal Opportunity Contracting 34,990 36,740 1,750
Engineering 50,000 52,500 2,500
SAP Application Support - 167,858 167,858
TOTAL $ 5,206,888 $ 5,596,958 $ 390,070 1 Source: Redevelopment Agency Fiscal Year 2011 Budget. These Fiscal Year 2011 Budget figures do not match the City’s Fiscal Year
2011 Adopted Budget publication because the Fiscal Year 2011 budget was approved by the San Diego Redevelopment Agency Board after the information was submitted to the City for publication.
2 Reimbursement amount for Neighborhood Code Compliance Division (Code Enforcement services) within the Development Services Department. Fiscal Year 2012 funding is provided through a combination of Cooperation Agreement carryover and Agency budget.
Table 6: Redevelopment Agency Revenues - City Redevelopment Project Areas
Revenue Source FY 2011 Budget1
FY 2012 Budget
FY 2011 2012 Change
Tax Increment $ 44,916,224 $ 44,501,000 $ (415,224)
Developer Proceeds/Advances 445,472 391,200 (54,272)
Interest/Lease/Note/Other Revenue 391,466 59,100 (332,366)
Prior Year Revenues 760,458 - (760,458)
TOTAL $ 46,513,620 $ 44,951,300 $ (1,562,320) 1 Source: Redevelopment Agency Fiscal Year 2011 Budget. These Fiscal Year 2011 Budget figures do not match the City’s Fiscal Year
2011 Adopted Budget publication because the Fiscal Year 2011 budget was approved by the San Diego Redevelopment Agency Board after the information was submitted to the City for publication.
Southeastern Economic Development Corporation Mission Statement The Southeastern Economic Development Corporation (SEDC) builds better neighborhoods and communities. We invest local dollars, support and create jobs, eliminate blight, and strengthen local economies by building safe, healthy, affordable, and sustainable communities in southeastern San Diego.
Economic development activities undertaken by SEDC complement the redevelopment activities that have already occurred throughout SEDC's jurisdiction. The economic activities include, but are not limited to: support to the oversight of the Agency's employment and training requirements for
- 218 -City of San Diego Fiscal Year 2012 Adopted Budget
-
-
City Agencies
developers, the Entrepreneur Academy, technical assistance for small businesses, a water conservation campaign, and various business-related workshops.
SEDC is a public benefit, non-profit corporation responsible for all redevelopment activities within a seven-square-mile area immediately east of downtown San Diego. SEDC has a nine member Board of Directors appointed by the Mayor and the City Council. Established in 1981 by the City of San Diego, SEDC is responsible for an area bound by the Martin L. King, Jr. Freeway (State Route 94) to the north, Interstate 5 to the south and west, and 69th Street to the east. SEDC's sphere of influence covers 15 neighborhoods within the Southeastern San Diego Merged Project Area, comprised of component areas Central Imperial, Gateway Center West, Mount Hope, and Southcrest.
SEDC's corporate strategy integrates the best of both redevelopment and economic development. As a result, we have been successful in providing new residential, industrial, and commercial developments throughout our entire geographic sphere of influence. At the same time, our commitment to encourage and actively assist both new and existing enterprises is clear and unequivocal.
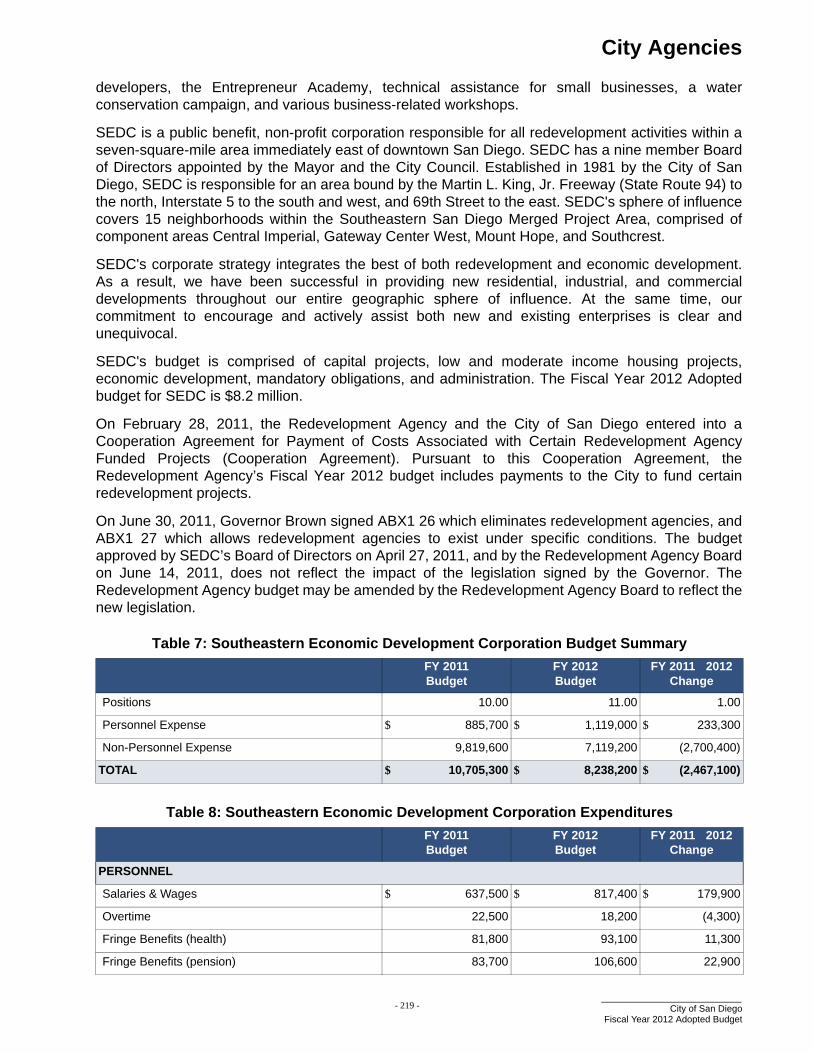
SEDC's budget is comprised of capital projects, low and moderate income housing projects, economic development, mandatory obligations, and administration. The Fiscal Year 2012 Adopted budget for SEDC is $8.2 million.
On February 28, 2011, the Redevelopment Agency and the City of San Diego entered into a Cooperation Agreement for Payment of Costs Associated with Certain Redevelopment Agency Funded Projects (Cooperation Agreement). Pursuant to this Cooperation Agreement, the Redevelopment Agency’s Fiscal Year 2012 budget includes payments to the City to fund certain redevelopment projects.
On June 30, 2011, Governor Brown signed ABX1 26 which eliminates redevelopment agencies, and ABX1 27 which allows redevelopment agencies to exist under specific conditions. The budget approved by SEDC’s Board of Directors on April 27, 2011, and by the Redevelopment Agency Board on June 14, 2011, does not reflect the impact of the legislation signed by the Governor. The Redevelopment Agency budget may be amended by the Redevelopment Agency Board to reflect the new legislation.
Table 7: Southeastern Economic Development Corporation Budget Summary FY 2011 Budget
FY 2012 Budget
FY 2011 2012 Change
Positions 10.00 11.00 1.00
Personnel Expense $ 885,700 $ 1,119,000 $ 233,300
Non-Personnel Expense 9,819,600 7,119,200 (2,700,400)
TOTAL $ 10,705,300 $ 8,238,200 $ (2,467,100)
Table 8: Southeastern Economic Development Corporation Expenditures FY 2011 Budget
FY 2012 Budget
FY 2011 2012 Change
PERSONNEL
Salaries & Wages $ 637,500 $ 817,400 $ 179,900
Overtime 22,500 18,200 (4,300)
Fringe Benefits (health) 81,800 93,100 11,300
Fringe Benefits (pension) 83,700 106,600 22,900
- 219 - City of San Diego Fiscal Year 2012 Adopted Budget
-
City Agencies
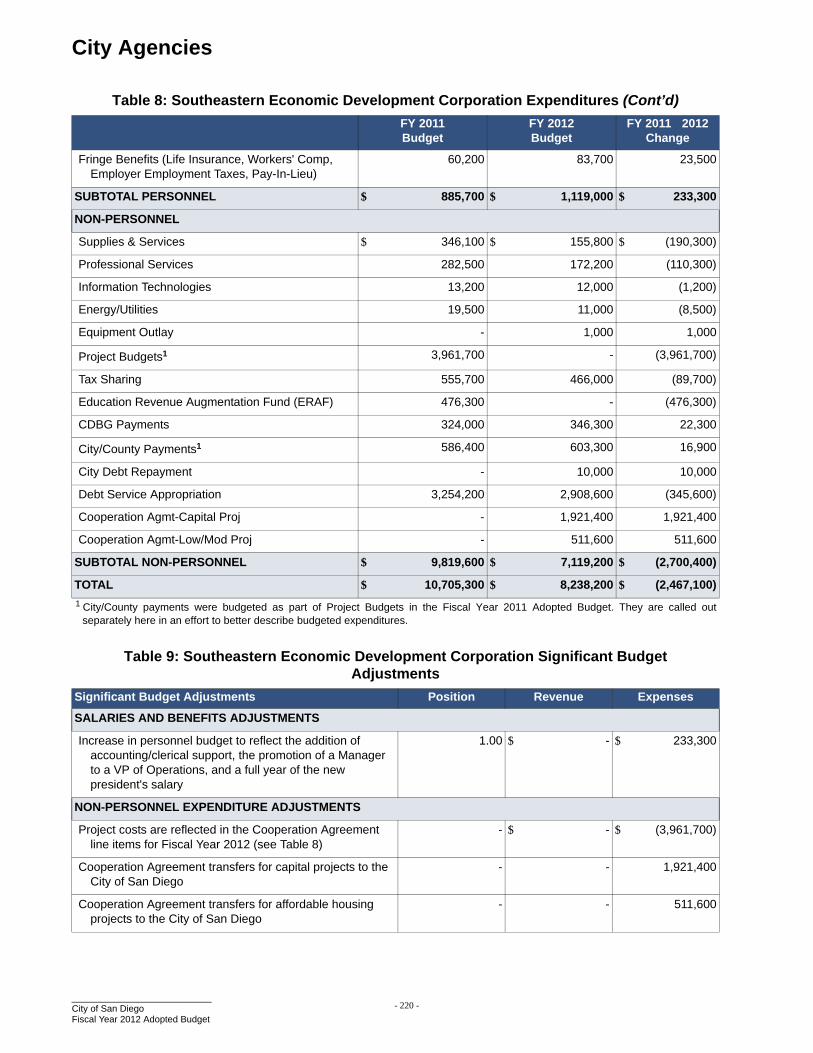
Table 8: Southeastern Economic Development Corporation Expenditures (Cont’d) FY 2011 Budget
FY 2012 Budget
FY 2011 2012 Change
Fringe Benefits (Life Insurance, Workers' Comp, Employer Employment Taxes, Pay-In-Lieu)
60,200 83,700 23,500
SUBTOTAL PERSONNEL $ 885,700 $ 1,119,000 $ 233,300
NON-PERSONNEL
Supplies & Services $ 346,100 $ 155,800 $ (190,300)
Professional Services 282,500 172,200 (110,300)
Information Technologies 13,200 12,000 (1,200)
Energy/Utilities 19,500 11,000 (8,500)
Equipment Outlay - 1,000 1,000
Project Budgets1 3,961,700 - (3,961,700)
Tax Sharing 555,700 466,000 (89,700)
Education Revenue Augmentation Fund (ERAF) 476,300 - (476,300)
CDBG Payments 324,000 346,300 22,300
City/County Payments1 586,400 603,300 16,900
City Debt Repayment - 10,000 10,000
Debt Service Appropriation 3,254,200 2,908,600 (345,600)
Cooperation Agmt-Capital Proj - 1,921,400 1,921,400
Cooperation Agmt-Low/Mod Proj - 511,600 511,600
SUBTOTAL NON-PERSONNEL $ 9,819,600 $ 7,119,200 $ (2,700,400)
TOTAL $ 10,705,300 $ 8,238,200 $ (2,467,100) 1 City/County payments were budgeted as part of Project Budgets in the Fiscal Year 2011 Adopted Budget. They are called out
separately here in an effort to better describe budgeted expenditures.
Table 9: Southeastern Economic Development Corporation Significant Budget Adjustments
Significant Budget Adjustments Position Revenue Expenses
SALARIES AND BENEFITS ADJUSTMENTS
Increase in personnel budget to reflect the addition of accounting/clerical support, the promotion of a Manager to a VP of Operations, and a full year of the new president's salary
1.00 $ - $ 233,300
NON-PERSONNEL EXPENDITURE ADJUSTMENTS
Project costs are reflected in the Cooperation Agreement line items for Fiscal Year 2012 (see Table 8)
- $ - $ (3,961,700)
Cooperation Agreement transfers for capital projects to the City of San Diego
- - 1,921,400
Cooperation Agreement transfers for affordable housing projects to the City of San Diego
- - 511,600
- 220 -City of San Diego Fiscal Year 2012 Adopted Budget
-
City Agencies
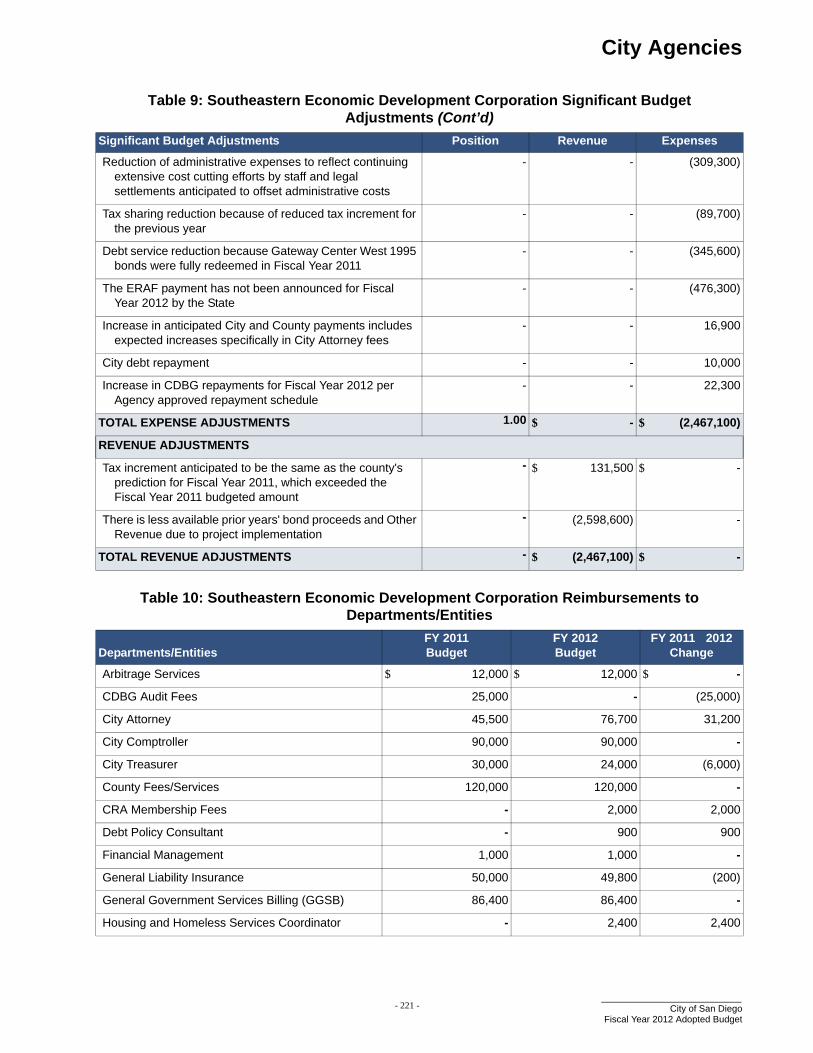
Table 9: Southeastern Economic Development Corporation Significant Budget Adjustments (Cont’d)
Significant Budget Adjustments Position Revenue Expenses
Reduction of administrative expenses to reflect continuing extensive cost cutting efforts by staff and legal settlements anticipated to offset administrative costs
- - (309,300)
Tax sharing reduction because of reduced tax increment for the previous year
- - (89,700)
Debt service reduction because Gateway Center West 1995 bonds were fully redeemed in Fiscal Year 2011
- - (345,600)
The ERAF payment has not been announced for Fiscal Year 2012 by the State
- - (476,300)
Increase in anticipated City and County payments includes expected increases specifically in City Attorney fees
- - 16,900
City debt repayment - - 10,000
Increase in CDBG repayments for Fiscal Year 2012 per Agency approved repayment schedule
- - 22,300
TOTAL EXPENSE ADJUSTMENTS 1.00 $ - $ (2,467,100)
REVENUE ADJUSTMENTS
Tax increment anticipated to be the same as the county's prediction for Fiscal Year 2011, which exceeded the Fiscal Year 2011 budgeted amount
- $ 131,500 $ -
There is less available prior years' bond proceeds and Other Revenue due to project implementation
- (2,598,600) -
TOTAL REVENUE ADJUSTMENTS - $ (2,467,100) $ -
Table 10: Southeastern Economic Development Corporation Reimbursements to Departments/Entities
Departments/Entities FY 2011 Budget
FY 2012 Budget
FY 2011 2012 Change
Arbitrage Services $ 12,000 $ 12,000 $ -
CDBG Audit Fees 25,000 - (25,000)
City Attorney 45,500 76,700 31,200
City Comptroller 90,000 90,000 -
City Treasurer 30,000 24,000 (6,000)
County Fees/Services 120,000 120,000 -
CRA Membership Fees - 2,000 2,000
Debt Policy Consultant - 900 900
Financial Management 1,000 1,000 -
General Liability Insurance 50,000 49,800 (200)
General Government Services Billing (GGSB) 86,400 86,400 -
Housing and Homeless Services Coordinator - 2,400 2,400
- 221 - City of San Diego Fiscal Year 2012 Adopted Budget
-
-
City Agencies
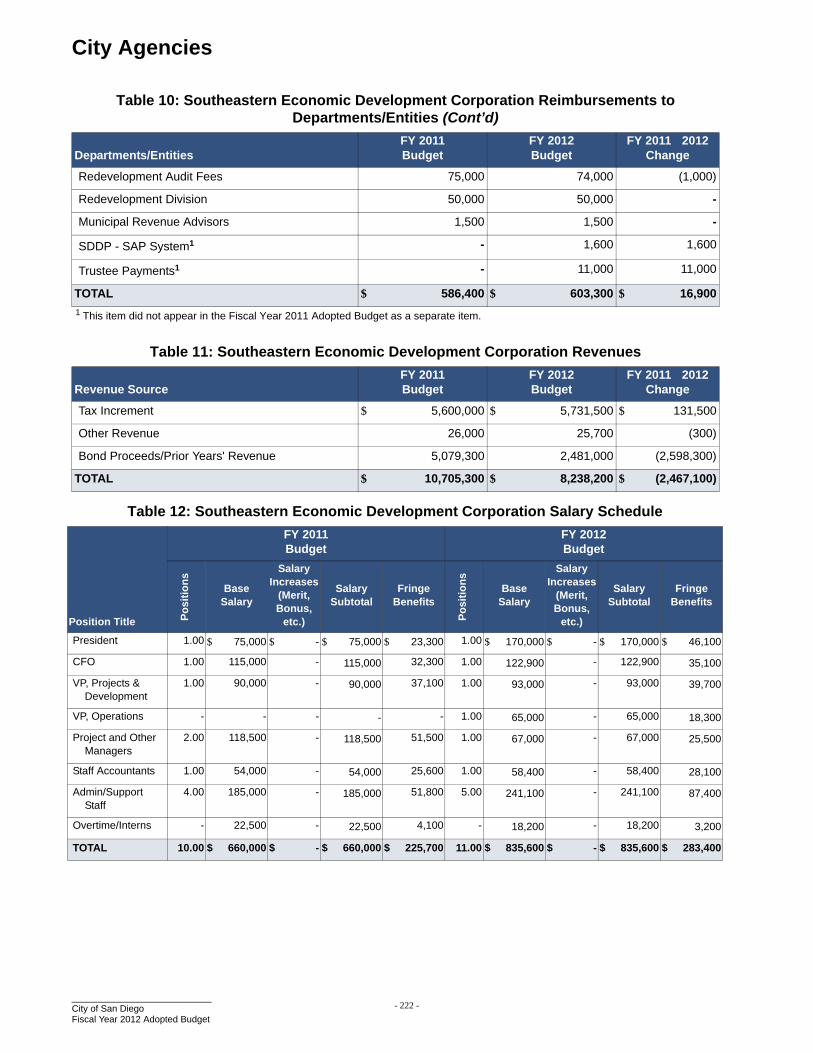
Table 10: Southeastern Economic Development Corporation Reimbursements to Departments/Entities (Cont’d)
Departments/Entities FY 2011 Budget
FY 2012 Budget
FY 2011 2012 Change
Redevelopment Audit Fees 75,000 74,000 (1,000)
Redevelopment Division 50,000 50,000 -
Municipal Revenue Advisors 1,500 1,500 -
SDDP - SAP System1 - 1,600 1,600
Trustee Payments1 - 11,000 11,000
TOTAL $ 586,400 $ 603,300 $ 16,900 1 This item did not appear in the Fiscal Year 2011 Adopted Budget as a separate item.
Table 11: Southeastern Economic Development Corporation Revenues
Revenue Source FY 2011 Budget
FY 2012 Budget
FY 2011 2012 Change
Tax Increment $ 5,600,000 $ 5,731,500 $ 131,500
Other Revenue 26,000 25,700 (300)
Bond Proceeds/Prior Years' Revenue 5,079,300 2,481,000 (2,598,300)
TOTAL $ 10,705,300 $ 8,238,200 $ (2,467,100)
Table 12: Southeastern Economic Development Corporation Salary Schedule
Position Title
FY 2011 Budget
FY 2012 Budget
Posi
tions Base
Salary
Salary Increases
(Merit, Bonus,
etc.)
Salary Subtotal
Fringe Benefits
Posi
tions Base
Salary
Salary Increases
(Merit, Bonus,
etc.)
Salary Subtotal
Fringe Benefits
President 1.00 $ 75,000 $ - $ 75,000 $ 23,300 1.00 $ 170,000 $ - $ 170,000 $ 46,100
CFO 1.00 115,000 - 115,000 32,300 1.00 122,900 - 122,900 35,100
VP, Projects & Development
1.00 90,000 - 90,000 37,100 1.00 93,000 - 93,000 39,700
VP, Operations - - - - - 1.00 65,000 - 65,000 18,300
Project and Other Managers
2.00 118,500 - 118,500 51,500 1.00 67,000 - 67,000 25,500
Staff Accountants 1.00 54,000 - 54,000 25,600 1.00 58,400 - 58,400 28,100
Admin/Support Staff
4.00 185,000 - 185,000 51,800 5.00 241,100 - 241,100 87,400
Overtime/Interns - 22,500 - 22,500 4,100 - 18,200 - 18,200 3,200
TOTAL 10.00 $ 660,000 $ - $ 660,000 $ 225,700 11.00 $ 835,600 $ - $ 835,600 $ 283,400
- 222 -City of San Diego Fiscal Year 2012 Adopted Budget
-
-
City Agencies
Centre City Development Corporation Mission Statement To act on behalf of the Redevelopment Agency of the City of San Diego to create a 24-hour livable, downtown community by eliminating blight, providing affordable housing, improving the public realm, facilitating public and private developments, stimulating economic development, and creating jobs.
Centre City Development Corporation (CCDC) was created by the City of San Diego in 1975 as an independent non-profit corporation, in order to plan, implement, and direct the redevelopment of San Diego's urban core. CCDC oversees the redevelopment of approximately 1,450 acres, an area that includes Centre City and Horton Plaza Redevelopment Project Areas.
CCDC has a nine member Board of Directors appointed by the City Council to manage the Corporation and its professional staff.
On February 28, 2011, the Redevelopment Agency and the City of San Diego entered into a Cooperation Agreement for Payment of Costs Associated with Certain Redevelopment Agency Funded Projects (Cooperation Agreement). Pursuant to this Cooperation Agreement, the Redevelopment Agency’s Fiscal Year 2012 budget includes payments to the City to fund certain redevelopment projects.
On June 30, 2011, Governor Brown signed ABX1 26 which eliminates redevelopment agencies, and ABX1 27 which allows redevelopment agencies to exist under specific conditions. The budget approved by the Agency Board on June 14, 2011 does not reflect the impact of the legislation signed by the Governor. The Redevelopment Agency budget may be amended by the Redevelopment Agency Board to reflect the new legislation.
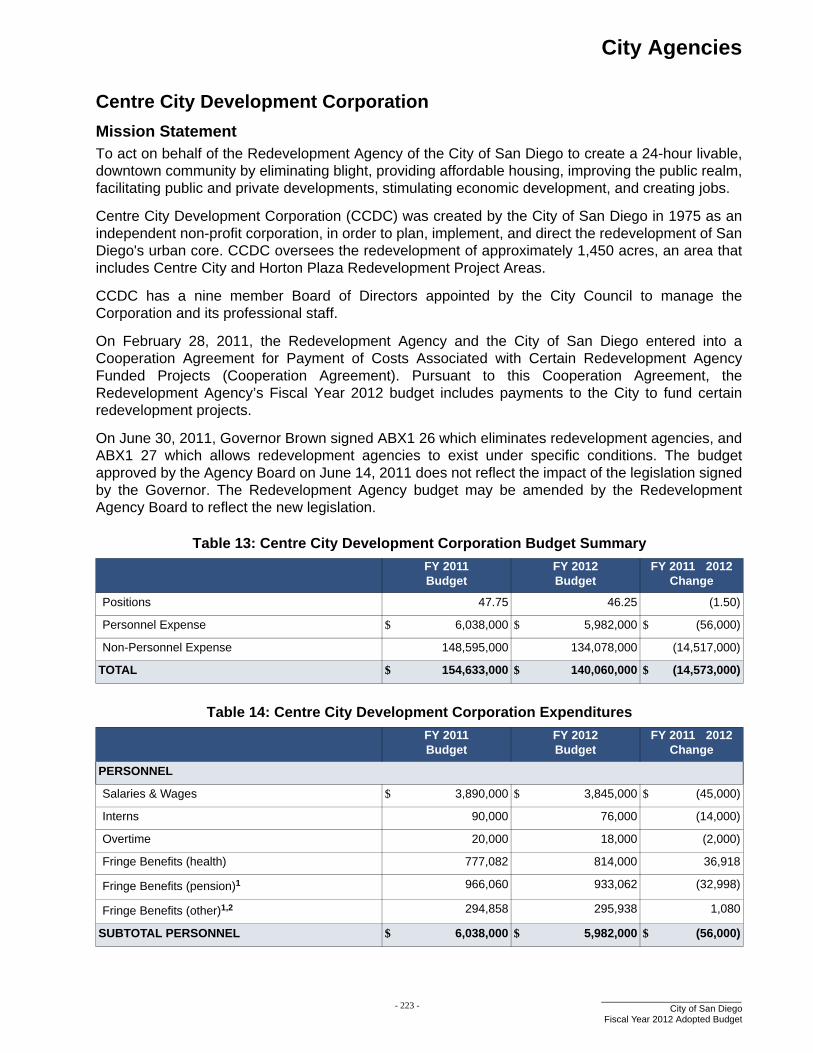
Table 13: Centre City Development Corporation Budget Summary FY 2011 Budget
FY 2012 Budget
FY 2011 2012 Change
Positions 47.75 46.25 (1.50)
Personnel Expense $ 6,038,000 $ 5,982,000 $ (56,000)
Non-Personnel Expense 148,595,000 134,078,000 (14,517,000)
TOTAL $ 154,633,000 $ 140,060,000 $ (14,573,000)
Table 14: Centre City Development Corporation Expenditures FY 2011 Budget
FY 2012 Budget
FY 2011 2012 Change
PERSONNEL
Salaries & Wages $ 3,890,000 $ 3,845,000 $ (45,000)
Interns 90,000 76,000 (14,000)
Overtime 20,000 18,000 (2,000)
Fringe Benefits (health) 777,082 814,000 36,918
Fringe Benefits (pension)1 966,060 933,062 (32,998)
Fringe Benefits (other)1,2 294,858 295,938 1,080
SUBTOTAL PERSONNEL $ 6,038,000 $ 5,982,000 $ (56,000)
- 223 - City of San Diego Fiscal Year 2012 Adopted Budget
-
City Agencies
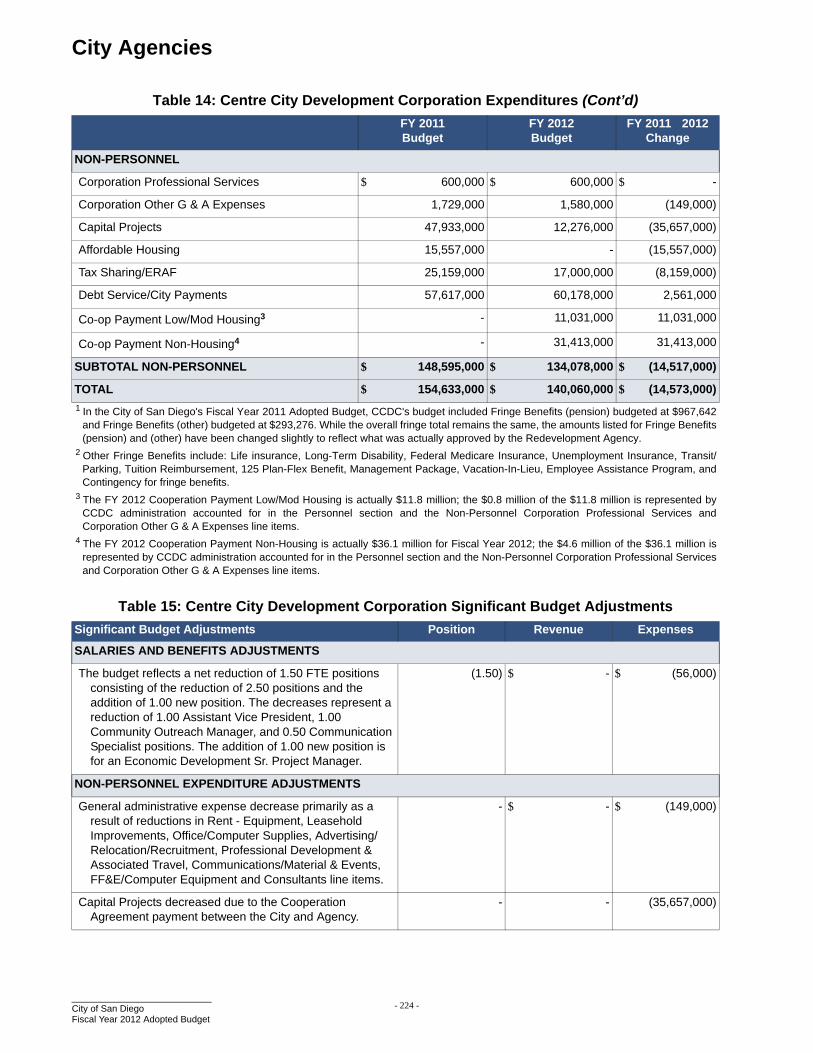
Table 14: Centre City Development Corporation Expenditures (Cont’d) FY 2011 Budget
FY 2012 Budget
FY 2011 2012 Change
NON-PERSONNEL
Corporation Professional Services $ 600,000 $ 600,000 $ -
Corporation Other G & A Expenses 1,729,000 1,580,000 (149,000)
Capital Projects 47,933,000 12,276,000 (35,657,000)
Affordable Housing 15,557,000 - (15,557,000)
Tax Sharing/ERAF 25,159,000 17,000,000 (8,159,000)
Debt Service/City Payments 57,617,000 60,178,000 2,561,000
Co-op Payment Low/Mod Housing3 - 11,031,000 11,031,000
Co-op Payment Non-Housing4 - 31,413,000 31,413,000
SUBTOTAL NON-PERSONNEL $ 148,595,000 $ 134,078,000 $ (14,517,000)
TOTAL $ 154,633,000 $ 140,060,000 $ (14,573,000) 1 In the City of San Diego's Fiscal Year 2011 Adopted Budget, CCDC's budget included Fringe Benefits (pension) budgeted at $967,642
and Fringe Benefits (other) budgeted at $293,276. While the overall fringe total remains the same, the amounts listed for Fringe Benefits (pension) and (other) have been changed slightly to reflect what was actually approved by the Redevelopment Agency.
2 Other Fringe Benefits include: Life insurance, Long-Term Disability, Federal Medicare Insurance, Unemployment Insurance, Transit/ Parking, Tuition Reimbursement, 125 Plan-Flex Benefit, Management Package, Vacation-In-Lieu, Employee Assistance Program, and Contingency for fringe benefits.
3 The FY 2012 Cooperation Payment Low/Mod Housing is actually $11.8 million; the $0.8 million of the $11.8 million is represented by CCDC administration accounted for in the Personnel section and the Non-Personnel Corporation Professional Services and Corporation Other G & A Expenses line items.
4 The FY 2012 Cooperation Payment Non-Housing is actually $36.1 million for Fiscal Year 2012; the $4.6 million of the $36.1 million is represented by CCDC administration accounted for in the Personnel section and the Non-Personnel Corporation Professional Services and Corporation Other G & A Expenses line items.
Table 15: Centre City Development Corporation Significant Budget Adjustments Significant Budget Adjustments Position Revenue Expenses
SALARIES AND BENEFITS ADJUSTMENTS
The budget reflects a net reduction of 1.50 FTE positions consisting of the reduction of 2.50 positions and the addition of 1.00 new position. The decreases represent a reduction of 1.00 Assistant Vice President, 1.00 Community Outreach Manager, and 0.50 Communication Specialist positions. The addition of 1.00 new position is for an Economic Development Sr. Project Manager.
(1.50) $ - $ (56,000)
NON-PERSONNEL EXPENDITURE ADJUSTMENTS
General administrative expense decrease primarily as a result of reductions in Rent - Equipment, Leasehold Improvements, Office/Computer Supplies, Advertising/ Relocation/Recruitment, Professional Development & Associated Travel, Communications/Material & Events, FF&E/Computer Equipment and Consultants line items.
- $ - $ (149,000)
Capital Projects decreased due to the Cooperation Agreement payment between the City and Agency.
- - (35,657,000)
- 224 -City of San Diego Fiscal Year 2012 Adopted Budget
-
City Agencies
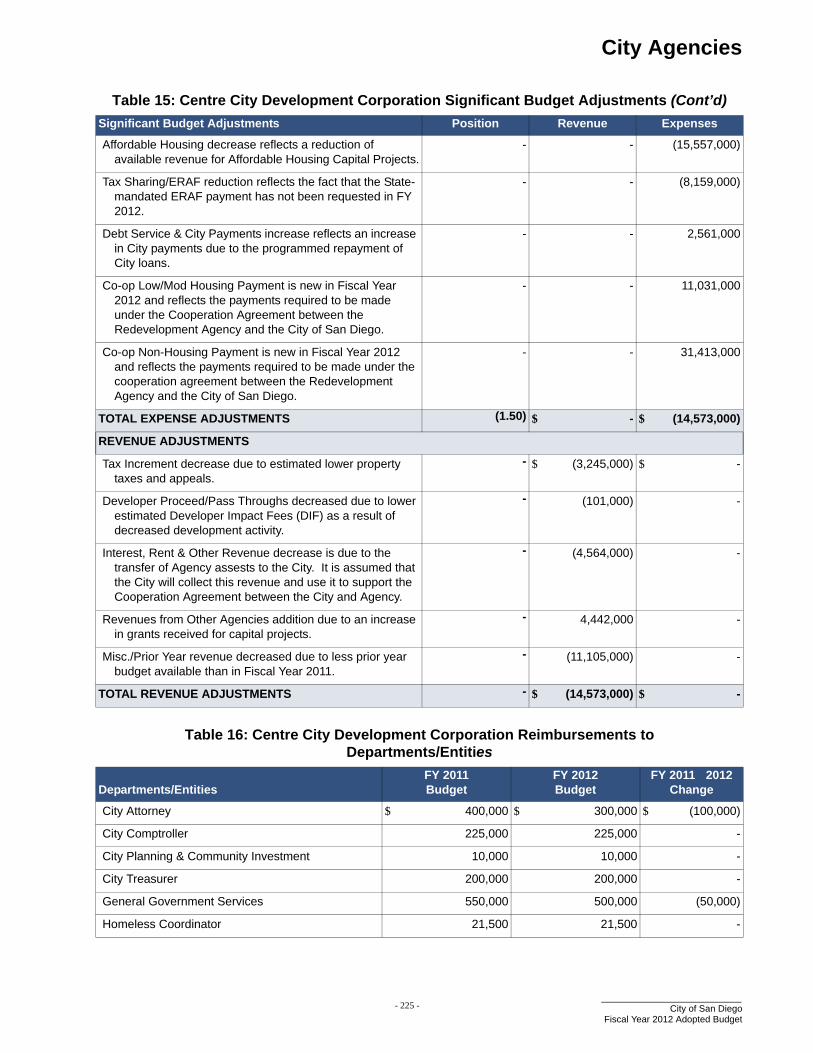
Table 15: Centre City Development Corporation Significant Budget Adjustments (Cont’d) Significant Budget Adjustments Position Revenue Expenses
Affordable Housing decrease reflects a reduction of available revenue for Affordable Housing Capital Projects.
- - (15,557,000)
Tax Sharing/ERAF reduction reflects the fact that the Statemandated ERAF payment has not been requested in FY 2012.
- - (8,159,000)
Debt Service & City Payments increase reflects an increase in City payments due to the programmed repayment of City loans.
- - 2,561,000
Co-op Low/Mod Housing Payment is new in Fiscal Year 2012 and reflects the payments required to be made under the Cooperation Agreement between the Redevelopment Agency and the City of San Diego.
- - 11,031,000
Co-op Non-Housing Payment is new in Fiscal Year 2012 and reflects the payments required to be made under the cooperation agreement between the Redevelopment Agency and the City of San Diego.
- - 31,413,000
TOTAL EXPENSE ADJUSTMENTS (1.50) $ - $ (14,573,000)
REVENUE ADJUSTMENTS
Tax Increment decrease due to estimated lower property taxes and appeals.
- $ (3,245,000) $ -
Developer Proceed/Pass Throughs decreased due to lower estimated Developer Impact Fees (DIF) as a result of decreased development activity.
- (101,000) -
Interest, Rent & Other Revenue decrease is due to the transfer of Agency assests to the City. It is assumed that the City will collect this revenue and use it to support the Cooperation Agreement between the City and Agency.
- (4,564,000) -
Revenues from Other Agencies addition due to an increase in grants received for capital projects.
- 4,442,000 -
Misc./Prior Year revenue decreased due to less prior year budget available than in Fiscal Year 2011.
- (11,105,000) -
TOTAL REVENUE ADJUSTMENTS - $ (14,573,000) $ -
Table 16: Centre City Development Corporation Reimbursements to Departments/Entities
Departments/Entities FY 2011 Budget
FY 2012 Budget
FY 2011 2012 Change
City Attorney $ 400,000 $ 300,000 $ (100,000)
City Comptroller 225,000 225,000 -
City Planning & Community Investment 10,000 10,000 -
City Treasurer 200,000 200,000 -
General Government Services 550,000 500,000 (50,000)
Homeless Coordinator 21,500 21,500 -
- 225 - City of San Diego Fiscal Year 2012 Adopted Budget
-
-
City Agencies
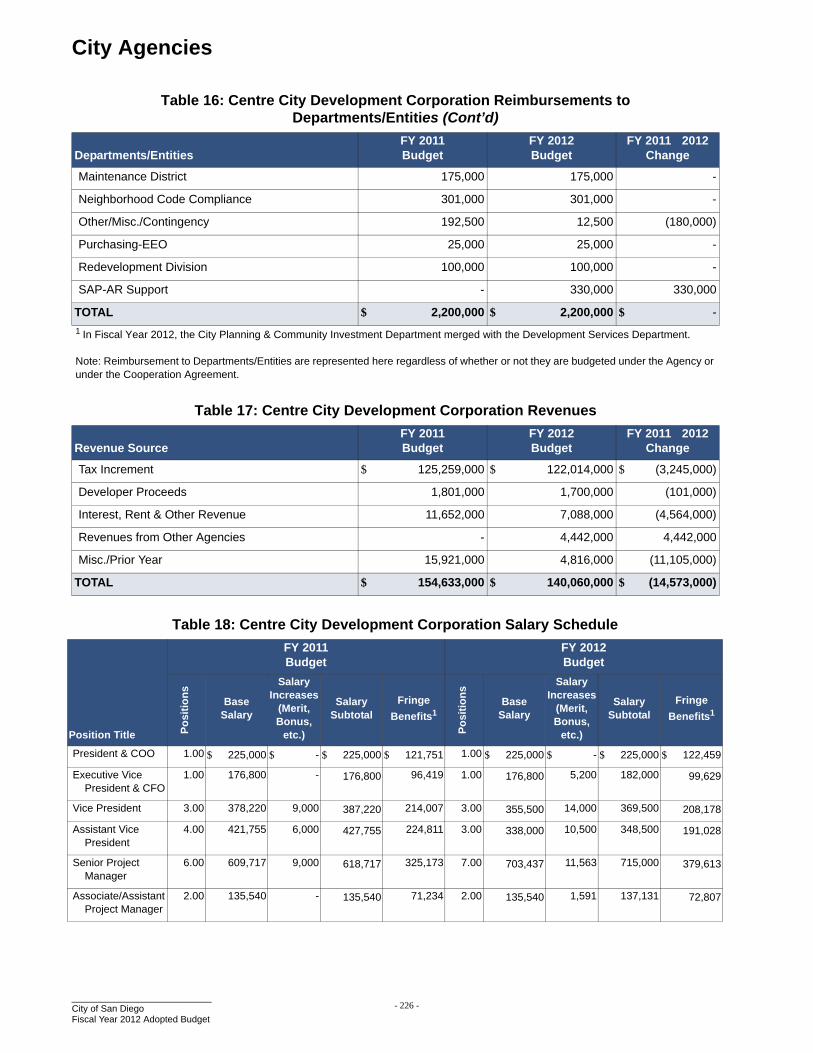
Table 16: Centre City Development Corporation Reimbursements to Departments/Entities (Cont’d)
Departments/Entities FY 2011 Budget
FY 2012 Budget
FY 2011 2012 Change
Maintenance District 175,000 175,000 -
Neighborhood Code Compliance 301,000 301,000 -
Other/Misc./Contingency 192,500 12,500 (180,000)
Purchasing-EEO 25,000 25,000 -
Redevelopment Division 100,000 100,000 -
SAP-AR Support - 330,000 330,000
TOTAL $ 2,200,000 $ 2,200,000 $ -1 In Fiscal Year 2012, the City Planning & Community Investment Department merged with the Development Services Department.
Note: Reimbursement to Departments/Entities are represented here regardless of whether or not they are budgeted under the Agency or under the Cooperation Agreement.
Table 17: Centre City Development Corporation Revenues
Revenue Source FY 2011 Budget
FY 2012 Budget
FY 2011 2012 Change
Tax Increment $ 125,259,000 $ 122,014,000 $ (3,245,000)
Developer Proceeds 1,801,000 1,700,000 (101,000)
Interest, Rent & Other Revenue 11,652,000 7,088,000 (4,564,000)
Revenues from Other Agencies - 4,442,000 4,442,000
Misc./Prior Year 15,921,000 4,816,000 (11,105,000)
TOTAL $ 154,633,000 $ 140,060,000 $ (14,573,000)
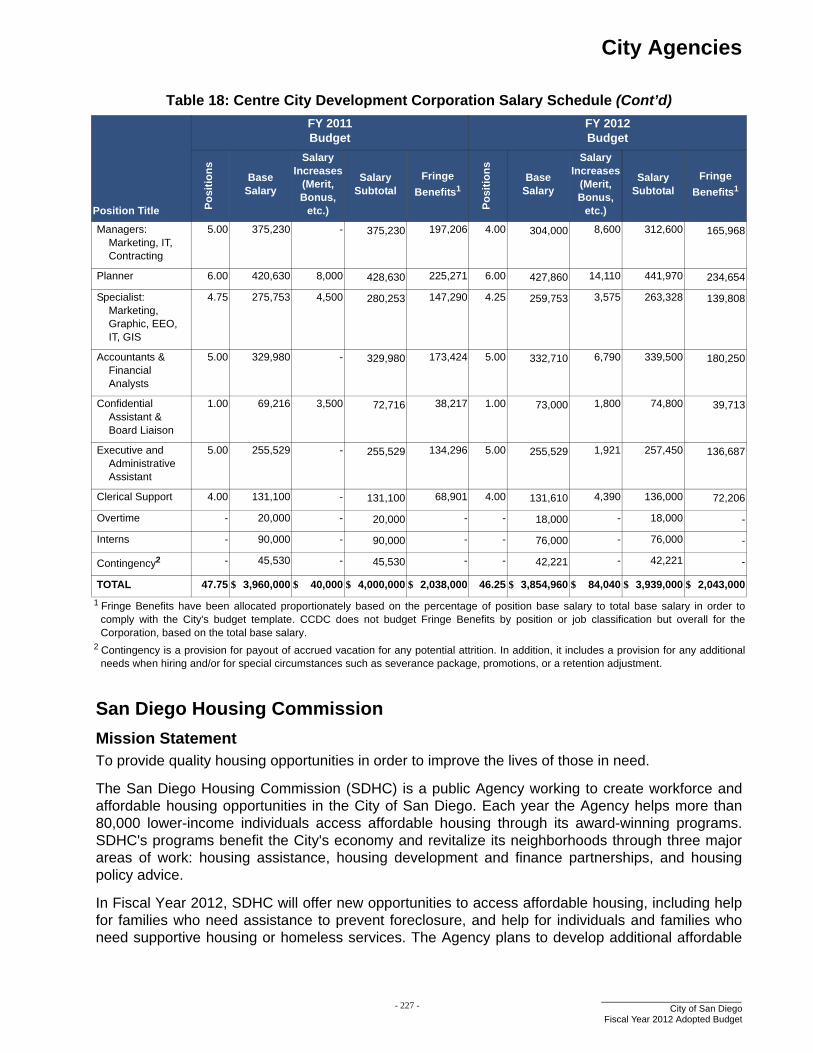
Table 18: Centre City Development Corporation Salary Schedule
Position Title
FY 2011 Budget
FY 2012 Budget
Posi
tions Base
Salary
Salary Increases
(Merit, Bonus,
etc.)
Salary Subtotal
Fringe Benefits1
Posi
tions Base
Salary
Salary Increases
(Merit, Bonus,
etc.)
Salary Subtotal
Fringe Benefits1
President & COO 1.00 $ 225,000 $ - $ 225,000 $ 121,751 1.00 $ 225,000 $ - $ 225,000 $ 122,459
Executive Vice President & CFO
1.00 176,800 - 176,800 96,419 1.00 176,800 5,200 182,000 99,629
Vice President 3.00 378,220 9,000 387,220 214,007 3.00 355,500 14,000 369,500 208,178
Assistant Vice President
4.00 421,755 6,000 427,755 224,811 3.00 338,000 10,500 348,500 191,028
Senior Project Manager
6.00 609,717 9,000 618,717 325,173 7.00 703,437 11,563 715,000 379,613
Associate/Assistant Project Manager
2.00 135,540 - 135,540 71,234 2.00 135,540 1,591 137,131 72,807
- 226 -City of San Diego Fiscal Year 2012 Adopted Budget
City Agencies
Table 18: Centre City Development Corporation Salary Schedule (Cont’d)
Position Title
FY 2011 Budget
FY 2012 Budget
Posi
tions Base
Salary
Salary Increases
(Merit, Bonus,
etc.)
Salary Subtotal
Fringe Benefits1
Posi
tions Base
Salary
Salary Increases
(Merit, Bonus,
etc.)
Salary Subtotal
Fringe Benefits1
Managers: Marketing, IT, Contracting
5.00 375,230 - 375,230 197,206 4.00 304,000 8,600 312,600 165,968
Planner 6.00 420,630 8,000 428,630 225,271 6.00 427,860 14,110 441,970 234,654
Specialist: Marketing, Graphic, EEO, IT, GIS
4.75 275,753 4,500 280,253 147,290 4.25 259,753 3,575 263,328 139,808
Accountants & Financial Analysts
5.00 329,980 - 329,980 173,424 5.00 332,710 6,790 339,500 180,250
Confidential Assistant & Board Liaison
1.00 69,216 3,500 72,716 38,217 1.00 73,000 1,800 74,800 39,713
Executive and Administrative Assistant
5.00 255,529 - 255,529 134,296 5.00 255,529 1,921 257,450 136,687
Clerical Support 4.00 131,100 - 131,100 68,901 4.00 131,610 4,390 136,000 72,206
Overtime - 20,000 - 20,000 - - 18,000 - 18,000 -
Interns - 90,000 - 90,000 - - 76,000 - 76,000 -
Contingency2 - 45,530 - 45,530 - - 42,221 - 42,221 -
TOTAL 47.75 $ 3,960,000 $ 40,000 $ 4,000,000 $ 2,038,000 46.25 $ 3,854,960 $ 84,040 $ 3,939,000 $ 2,043,000 1 Fringe Benefits have been allocated proportionately based on the percentage of position base salary to total base salary in order to
comply with the City's budget template. CCDC does not budget Fringe Benefits by position or job classification but overall for the Corporation, based on the total base salary.
2 Contingency is a provision for payout of accrued vacation for any potential attrition. In addition, it includes a provision for any additional needs when hiring and/or for special circumstances such as severance package, promotions, or a retention adjustment.
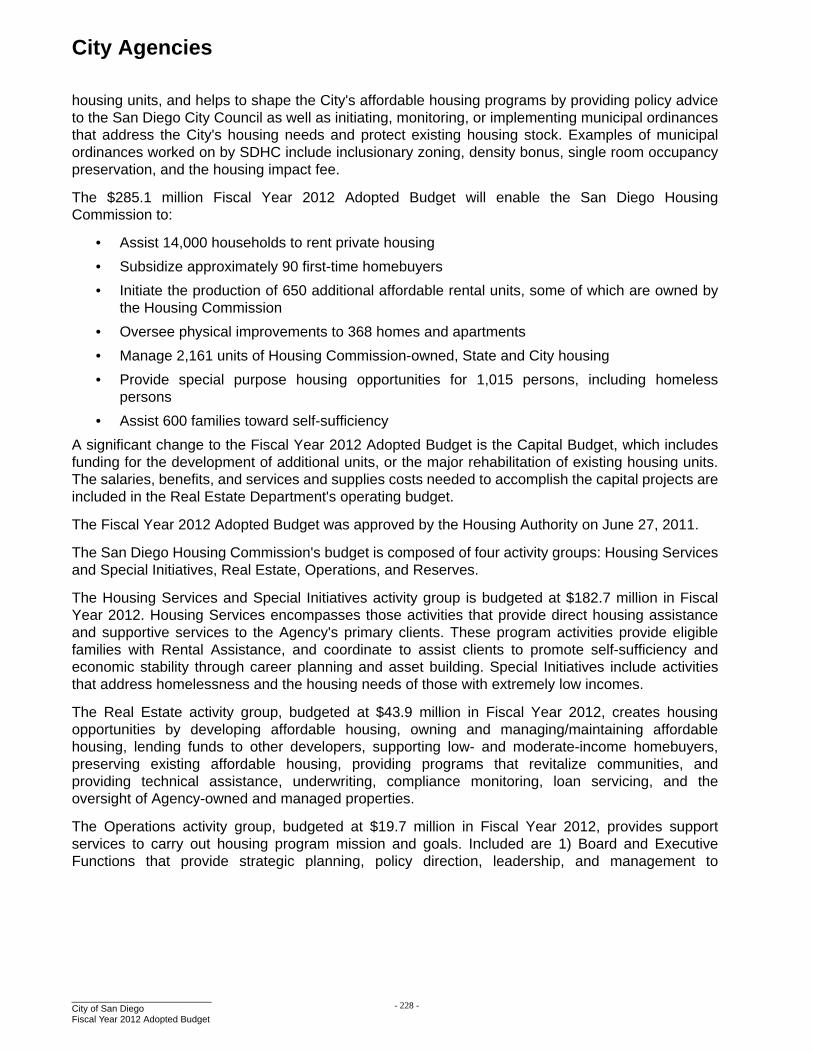
San Diego Housing Commission Mission Statement To provide quality housing opportunities in order to improve the lives of those in need.
The San Diego Housing Commission (SDHC) is a public Agency working to create workforce and affordable housing opportunities in the City of San Diego. Each year the Agency helps more than 80,000 lower-income individuals access affordable housing through its award-winning programs. SDHC's programs benefit the City's economy and revitalize its neighborhoods through three major areas of work: housing assistance, housing development and finance partnerships, and housing policy advice.
In Fiscal Year 2012, SDHC will offer new opportunities to access affordable housing, including help for families who need assistance to prevent foreclosure, and help for individuals and families who need supportive housing or homeless services. The Agency plans to develop additional affordable
- 227 - City of San Diego Fiscal Year 2012 Adopted Budget
City Agencies
housing units, and helps to shape the City's affordable housing programs by providing policy advice to the San Diego City Council as well as initiating, monitoring, or implementing municipal ordinances that address the City's housing needs and protect existing housing stock. Examples of municipal ordinances worked on by SDHC include inclusionary zoning, density bonus, single room occupancy preservation, and the housing impact fee.
The $285.1 million Fiscal Year 2012 Adopted Budget will enable the San Diego Housing Commission to:
• Assist 14,000 households to rent private housing • Subsidize approximately 90 first-time homebuyers • Initiate the production of 650 additional affordable rental units, some of which are owned by
the Housing Commission • Oversee physical improvements to 368 homes and apartments • Manage 2,161 units of Housing Commission-owned, State and City housing • Provide special purpose housing opportunities for 1,015 persons, including homeless
persons • Assist 600 families toward self-sufficiency
A significant change to the Fiscal Year 2012 Adopted Budget is the Capital Budget, which includes funding for the development of additional units, or the major rehabilitation of existing housing units. The salaries, benefits, and services and supplies costs needed to accomplish the capital projects are included in the Real Estate Department's operating budget.
The Fiscal Year 2012 Adopted Budget was approved by the Housing Authority on June 27, 2011.
The San Diego Housing Commission's budget is composed of four activity groups: Housing Services and Special Initiatives, Real Estate, Operations, and Reserves.
The Housing Services and Special Initiatives activity group is budgeted at $182.7 million in Fiscal Year 2012. Housing Services encompasses those activities that provide direct housing assistance and supportive services to the Agency's primary clients. These program activities provide eligible families with Rental Assistance, and coordinate to assist clients to promote self-sufficiency and economic stability through career planning and asset building. Special Initiatives include activities that address homelessness and the housing needs of those with extremely low incomes.
The Real Estate activity group, budgeted at $43.9 million in Fiscal Year 2012, creates housing opportunities by developing affordable housing, owning and managing/maintaining affordable housing, lending funds to other developers, supporting low- and moderate-income homebuyers, preserving existing affordable housing, providing programs that revitalize communities, and providing technical assistance, underwriting, compliance monitoring, loan servicing, and the oversight of Agency-owned and managed properties.
The Operations activity group, budgeted at $19.7 million in Fiscal Year 2012, provides support services to carry out housing program mission and goals. Included are 1) Board and Executive Functions that provide strategic planning, policy direction, leadership, and management to
- 228 -City of San Diego Fiscal Year 2012 Adopted Budget
-
-
City Agencies
implement housing programs; 2) Support Services, the internal operations needed to deliver housing program services and projects; and 3) Community Relations and Communications activities that serve to increase awareness and build support among all audiences for and about the Agency's goals, programs, accomplishments, offerings, and initiatives.
Finally, the Reserves activity group is budgeted at $38.8 million in Fiscal Year 2012, and contains funds budgeted in the current year to provide for a future event. The three types of reserves are: Program Reserves to provide for future personnel, services and supplies, and housing program expenditures; Contingency Reserves to provide for potential litigation, uninsured losses, and building reserves; and Unobligated Reserves, which include amounts available for any unanticipated housing purpose.
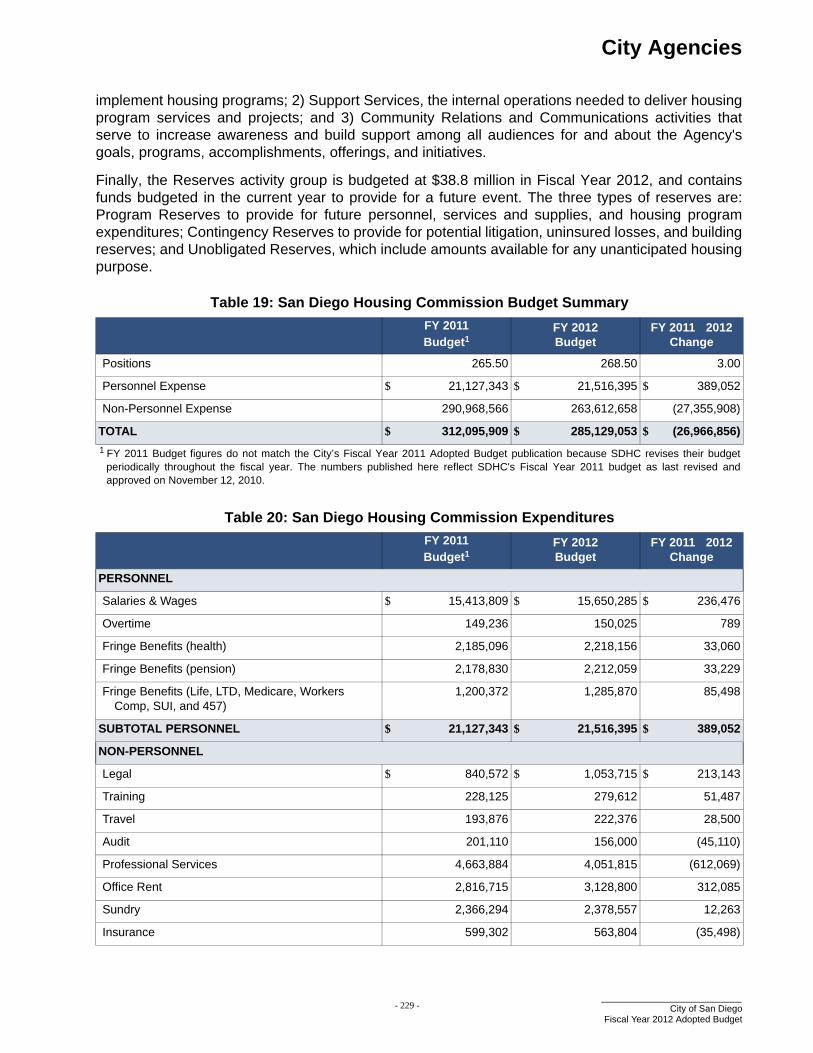
Table 19: San Diego Housing Commission Budget Summary FY 2011 Budget1
FY 2012 Budget
FY 2011 2012 Change
Positions 265.50 268.50 3.00
Personnel Expense $ 21,127,343 $ 21,516,395 $ 389,052
Non-Personnel Expense 290,968,566 263,612,658 (27,355,908)
TOTAL $ 312,095,909 $ 285,129,053 $ (26,966,856) 1 FY 2011 Budget figures do not match the City’s Fiscal Year 2011 Adopted Budget publication because SDHC revises their budget
periodically throughout the fiscal year. The numbers published here reflect SDHC's Fiscal Year 2011 budget as last revised and approved on November 12, 2010.
Table 20: San Diego Housing Commission Expenditures FY 2011 Budget1
FY 2012 Budget
FY 2011 2012 Change
PERSONNEL
Salaries & Wages $ 15,413,809 $ 15,650,285 $ 236,476
Overtime 149,236 150,025 789
Fringe Benefits (health) 2,185,096 2,218,156 33,060
Fringe Benefits (pension) 2,178,830 2,212,059 33,229
Fringe Benefits (Life, LTD, Medicare, Workers Comp, SUI, and 457)
1,200,372 1,285,870 85,498
SUBTOTAL PERSONNEL $ 21,127,343 $ 21,516,395 $ 389,052
NON-PERSONNEL
Legal $ 840,572 $ 1,053,715 $ 213,143
Training 228,125 279,612 51,487
Travel 193,876 222,376 28,500
Audit 201,110 156,000 (45,110)
Professional Services 4,663,884 4,051,815 (612,069)
Office Rent 2,816,715 3,128,800 312,085
Sundry 2,366,294 2,378,557 12,263
Insurance 599,302 563,804 (35,498)
- 229 - City of San Diego Fiscal Year 2012 Adopted Budget
-
City Agencies
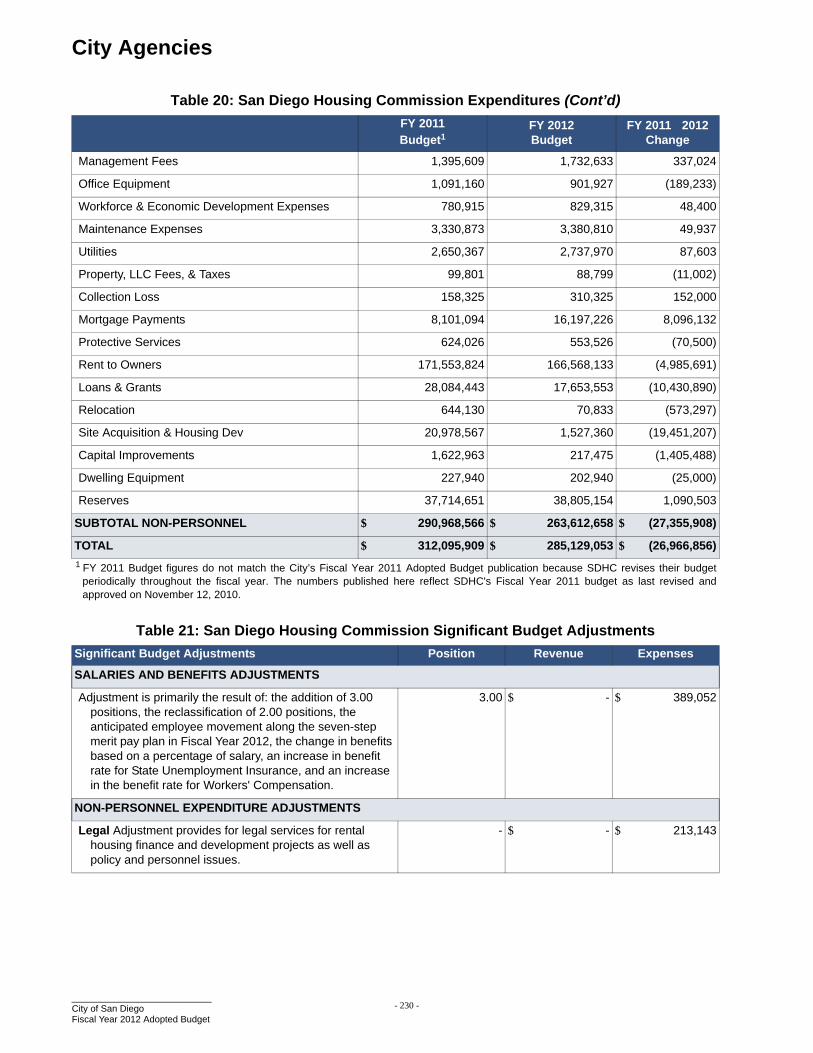
Table 20: San Diego Housing Commission Expenditures (Cont’d) FY 2011 Budget1
FY 2012 Budget
FY 2011 2012 Change
Management Fees 1,395,609 1,732,633 337,024
Office Equipment 1,091,160 901,927 (189,233)
Workforce & Economic Development Expenses 780,915 829,315 48,400
Maintenance Expenses 3,330,873 3,380,810 49,937
Utilities 2,650,367 2,737,970 87,603
Property, LLC Fees, & Taxes 99,801 88,799 (11,002)
Collection Loss 158,325 310,325 152,000
Mortgage Payments 8,101,094 16,197,226 8,096,132
Protective Services 624,026 553,526 (70,500)
Rent to Owners 171,553,824 166,568,133 (4,985,691)
Loans & Grants 28,084,443 17,653,553 (10,430,890)
Relocation 644,130 70,833 (573,297)
Site Acquisition & Housing Dev 20,978,567 1,527,360 (19,451,207)
Capital Improvements 1,622,963 217,475 (1,405,488)
Dwelling Equipment 227,940 202,940 (25,000)
Reserves 37,714,651 38,805,154 1,090,503
SUBTOTAL NON-PERSONNEL $ 290,968,566 $ 263,612,658 $ (27,355,908)
TOTAL $ 312,095,909 $ 285,129,053 $ (26,966,856) 1 FY 2011 Budget figures do not match the City’s Fiscal Year 2011 Adopted Budget publication because SDHC revises their budget
periodically throughout the fiscal year. The numbers published here reflect SDHC's Fiscal Year 2011 budget as last revised and approved on November 12, 2010.
Table 21: San Diego Housing Commission Significant Budget Adjustments Significant Budget Adjustments Position Revenue Expenses
SALARIES AND BENEFITS ADJUSTMENTS
Adjustment is primarily the result of: the addition of 3.00 positions, the reclassification of 2.00 positions, the anticipated employee movement along the seven-step merit pay plan in Fiscal Year 2012, the change in benefits based on a percentage of salary, an increase in benefit rate for State Unemployment Insurance, and an increase in the benefit rate for Workers' Compensation.
3.00 $ - $ 389,052
NON-PERSONNEL EXPENDITURE ADJUSTMENTS
Legal Adjustment provides for legal services for rental housing finance and development projects as well as policy and personnel issues.
- $ - $ 213,143
- 230 -City of San Diego Fiscal Year 2012 Adopted Budget
City Agencies
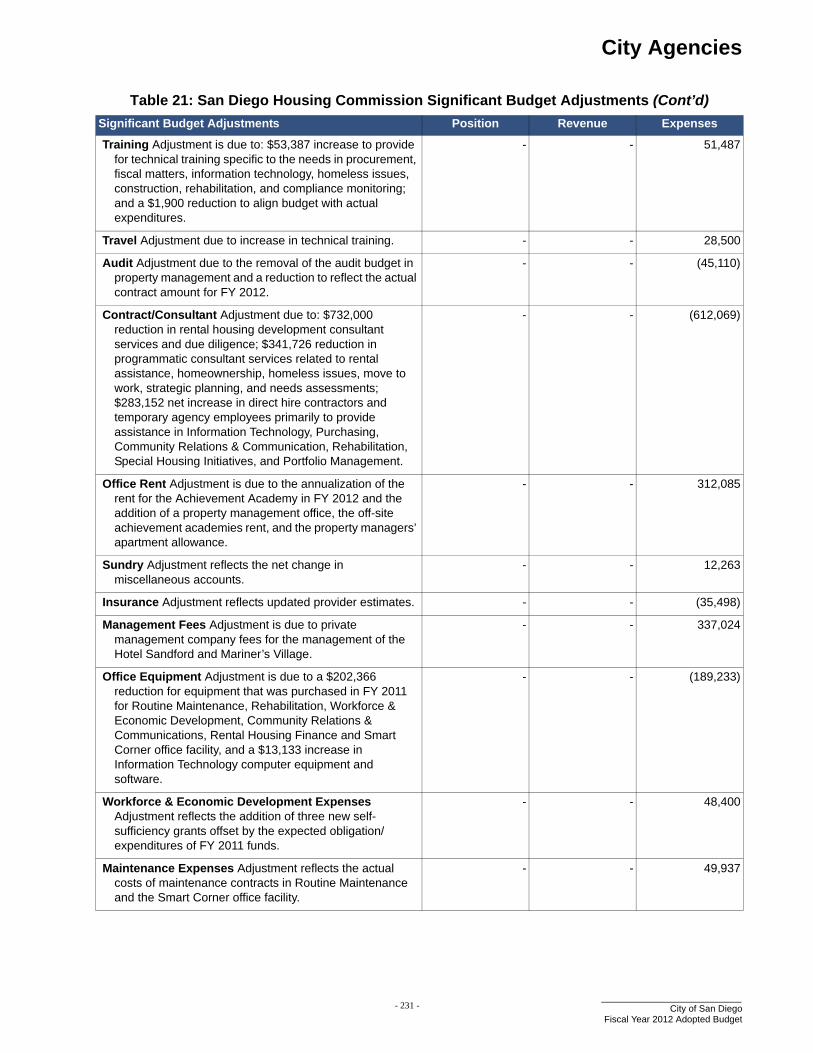
Table 21: San Diego Housing Commission Significant Budget Adjustments (Cont’d) Significant Budget Adjustments Position Revenue Expenses
Training Adjustment is due to: $53,387 increase to provide for technical training specific to the needs in procurement, fiscal matters, information technology, homeless issues, construction, rehabilitation, and compliance monitoring; and a $1,900 reduction to align budget with actual expenditures.
- - 51,487
Travel Adjustment due to increase in technical training. - - 28,500
Audit Adjustment due to the removal of the audit budget in property management and a reduction to reflect the actual contract amount for FY 2012.
- - (45,110)
Contract/Consultant Adjustment due to: $732,000 reduction in rental housing development consultant services and due diligence; $341,726 reduction in programmatic consultant services related to rental assistance, homeownership, homeless issues, move to work, strategic planning, and needs assessments; $283,152 net increase in direct hire contractors and temporary agency employees primarily to provide assistance in Information Technology, Purchasing, Community Relations & Communication, Rehabilitation, Special Housing Initiatives, and Portfolio Management.
- - (612,069)
Office Rent Adjustment is due to the annualization of the rent for the Achievement Academy in FY 2012 and the addition of a property management office, the off-site achievement academies rent, and the property managers’ apartment allowance.
- - 312,085
Sundry Adjustment reflects the net change in miscellaneous accounts.
- - 12,263
Insurance Adjustment reflects updated provider estimates. - - (35,498)
Management Fees Adjustment is due to private management company fees for the management of the Hotel Sandford and Mariner’s Village.
- - 337,024
Office Equipment Adjustment is due to a $202,366 reduction for equipment that was purchased in FY 2011 for Routine Maintenance, Rehabilitation, Workforce & Economic Development, Community Relations & Communications, Rental Housing Finance and Smart Corner office facility, and a $13,133 increase in Information Technology computer equipment and software.
- - (189,233)
Workforce & Economic Development Expenses Adjustment reflects the addition of three new selfsufficiency grants offset by the expected obligation/ expenditures of FY 2011 funds.
- - 48,400
Maintenance Expenses Adjustment reflects the actual costs of maintenance contracts in Routine Maintenance and the Smart Corner office facility.
- - 49,937
- 231 - City of San Diego Fiscal Year 2012 Adopted Budget
City Agencies
Table 21: San Diego Housing Commission Significant Budget Adjustments (Cont’d) Significant Budget Adjustments Position Revenue Expenses
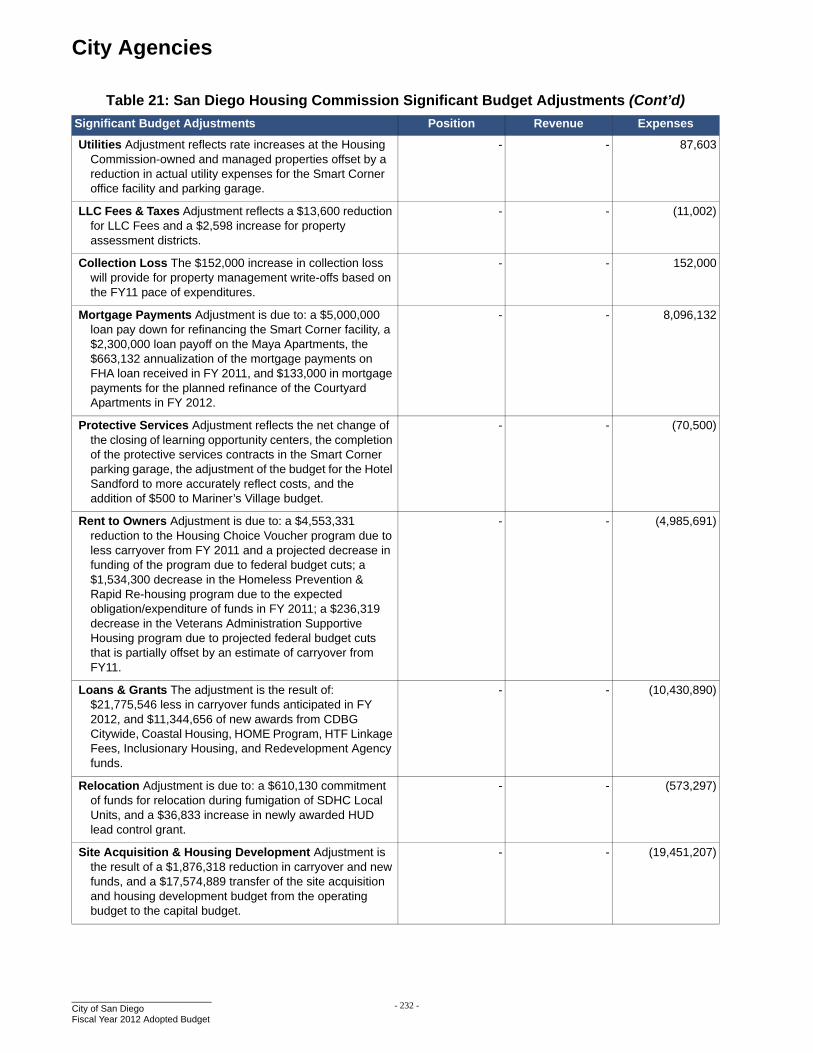
Utilities Adjustment reflects rate increases at the Housing Commission-owned and managed properties offset by a reduction in actual utility expenses for the Smart Corner office facility and parking garage.
- - 87,603
LLC Fees & Taxes Adjustment reflects a $13,600 reduction for LLC Fees and a $2,598 increase for property assessment districts.
- - (11,002)
Collection Loss The $152,000 increase in collection loss will provide for property management write-offs based on the FY11 pace of expenditures.
- - 152,000
Mortgage Payments Adjustment is due to: a $5,000,000 loan pay down for refinancing the Smart Corner facility, a $2,300,000 loan payoff on the Maya Apartments, the $663,132 annualization of the mortgage payments on FHA loan received in FY 2011, and $133,000 in mortgage payments for the planned refinance of the Courtyard Apartments in FY 2012.
- - 8,096,132
Protective Services Adjustment reflects the net change of the closing of learning opportunity centers, the completion of the protective services contracts in the Smart Corner parking garage, the adjustment of the budget for the Hotel Sandford to more accurately reflect costs, and the addition of $500 to Mariner’s Village budget.
- - (70,500)
Rent to Owners Adjustment is due to: a $4,553,331 reduction to the Housing Choice Voucher program due to less carryover from FY 2011 and a projected decrease in funding of the program due to federal budget cuts; a $1,534,300 decrease in the Homeless Prevention & Rapid Re-housing program due to the expected obligation/expenditure of funds in FY 2011; a $236,319 decrease in the Veterans Administration Supportive Housing program due to projected federal budget cuts that is partially offset by an estimate of carryover from FY11.
- - (4,985,691)
Loans & Grants The adjustment is the result of: $21,775,546 less in carryover funds anticipated in FY 2012, and $11,344,656 of new awards from CDBG Citywide, Coastal Housing, HOME Program, HTF Linkage Fees, Inclusionary Housing, and Redevelopment Agency funds.
- - (10,430,890)
Relocation Adjustment is due to: a $610,130 commitment of funds for relocation during fumigation of SDHC Local Units, and a $36,833 increase in newly awarded HUD lead control grant.
- - (573,297)
Site Acquisition & Housing Development Adjustment is the result of a $1,876,318 reduction in carryover and new funds, and a $17,574,889 transfer of the site acquisition and housing development budget from the operating budget to the capital budget.
- - (19,451,207)
- 232 -City of San Diego Fiscal Year 2012 Adopted Budget
City Agencies
Table 21: San Diego Housing Commission Significant Budget Adjustments (Cont’d) Significant Budget Adjustments Position Revenue Expenses
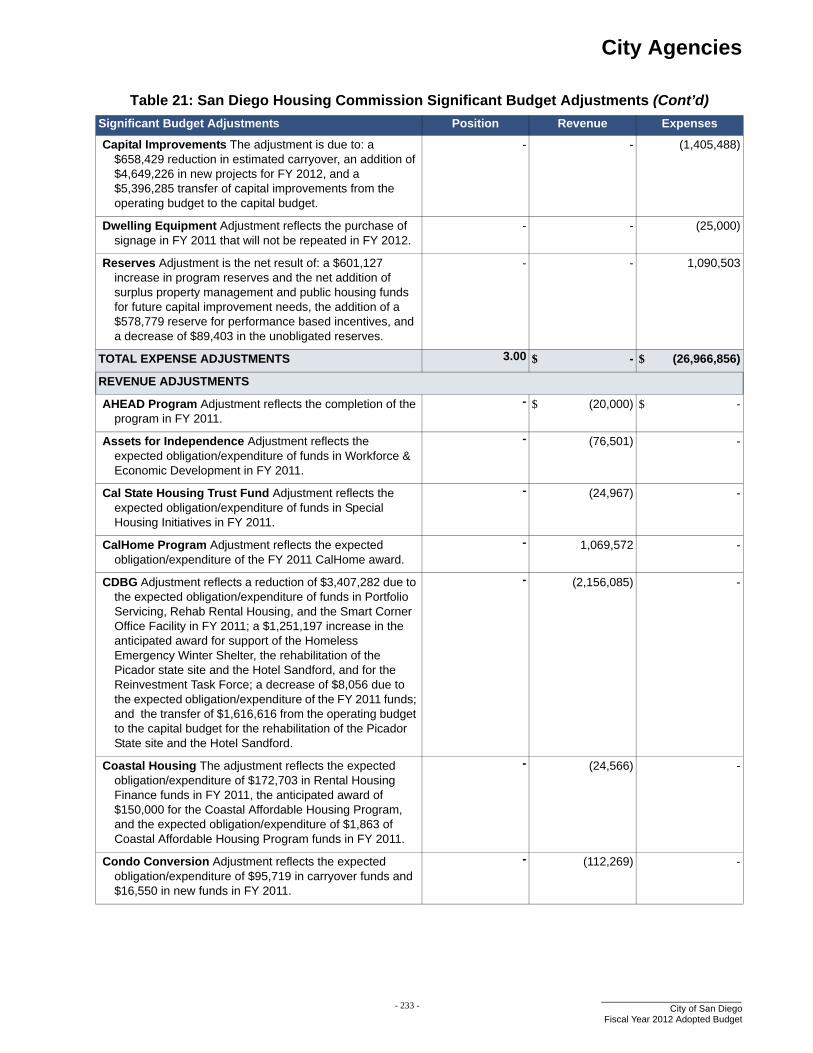
Capital Improvements The adjustment is due to: a $658,429 reduction in estimated carryover, an addition of $4,649,226 in new projects for FY 2012, and a $5,396,285 transfer of capital improvements from the operating budget to the capital budget.
- - (1,405,488)
Dwelling Equipment Adjustment reflects the purchase of signage in FY 2011 that will not be repeated in FY 2012.
- - (25,000)
Reserves Adjustment is the net result of: a $601,127 increase in program reserves and the net addition of surplus property management and public housing funds for future capital improvement needs, the addition of a $578,779 reserve for performance based incentives, and a decrease of $89,403 in the unobligated reserves.
- - 1,090,503
TOTAL EXPENSE ADJUSTMENTS 3.00 $ - $ (26,966,856)
REVENUE ADJUSTMENTS
AHEAD Program Adjustment reflects the completion of the program in FY 2011.
- $ (20,000) $ -
Assets for Independence Adjustment reflects the expected obligation/expenditure of funds in Workforce & Economic Development in FY 2011.
- (76,501) -
Cal State Housing Trust Fund Adjustment reflects the expected obligation/expenditure of funds in Special Housing Initiatives in FY 2011.
- (24,967) -
CalHome Program Adjustment reflects the expected obligation/expenditure of the FY 2011 CalHome award.
- 1,069,572 -
CDBG Adjustment reflects a reduction of $3,407,282 due to the expected obligation/expenditure of funds in Portfolio Servicing, Rehab Rental Housing, and the Smart Corner Office Facility in FY 2011; a $1,251,197 increase in the anticipated award for support of the Homeless Emergency Winter Shelter, the rehabilitation of the Picador state site and the Hotel Sandford, and for the Reinvestment Task Force; a decrease of $8,056 due to the expected obligation/expenditure of the FY 2011 funds; and the transfer of $1,616,616 from the operating budget to the capital budget for the rehabilitation of the Picador State site and the Hotel Sandford.
- (2,156,085) -
Coastal Housing The adjustment reflects the expected obligation/expenditure of $172,703 in Rental Housing Finance funds in FY 2011, the anticipated award of $150,000 for the Coastal Affordable Housing Program, and the expected obligation/expenditure of $1,863 of Coastal Affordable Housing Program funds in FY 2011.
- (24,566) -
Condo Conversion Adjustment reflects the expected obligation/expenditure of $95,719 in carryover funds and $16,550 in new funds in FY 2011.
- (112,269) -
- 233 - City of San Diego Fiscal Year 2012 Adopted Budget
City Agencies
Table 21: San Diego Housing Commission Significant Budget Adjustments (Cont’d) Significant Budget Adjustments Position Revenue Expenses
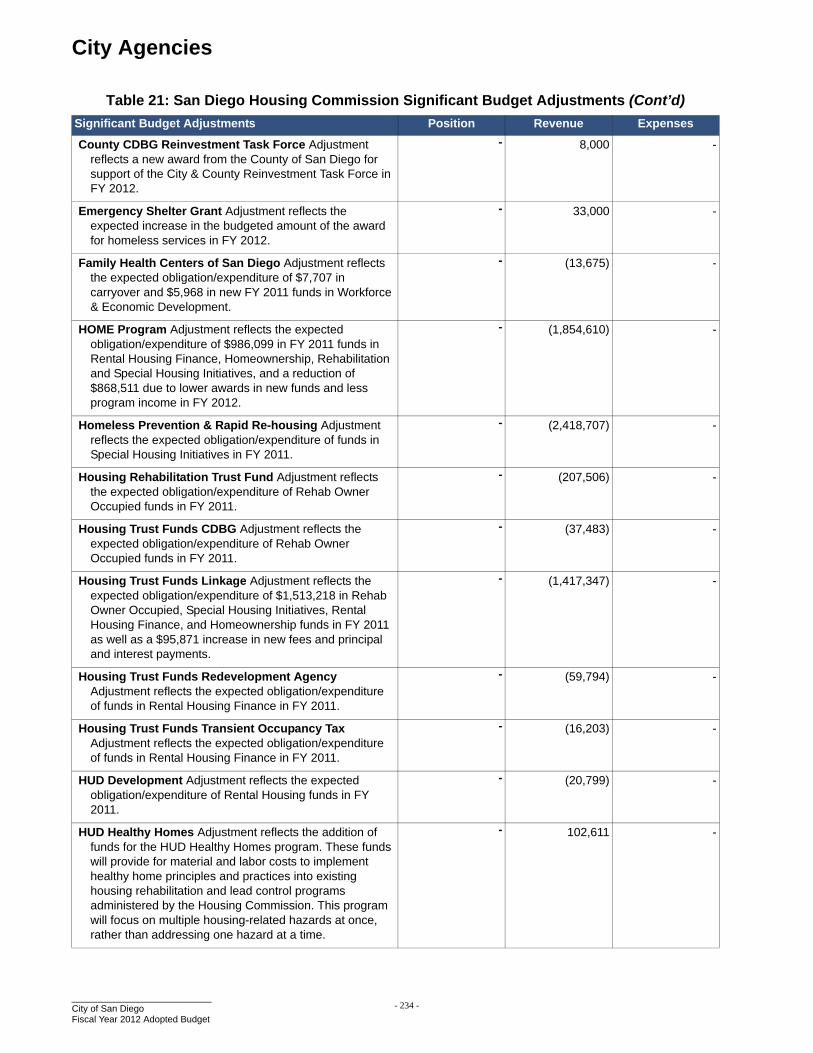
County CDBG Reinvestment Task Force Adjustment reflects a new award from the County of San Diego for support of the City & County Reinvestment Task Force in FY 2012.
- 8,000 -
Emergency Shelter Grant Adjustment reflects the expected increase in the budgeted amount of the award for homeless services in FY 2012.
- 33,000 -
Family Health Centers of San Diego Adjustment reflects the expected obligation/expenditure of $7,707 in carryover and $5,968 in new FY 2011 funds in Workforce & Economic Development.
- (13,675) -
HOME Program Adjustment reflects the expected obligation/expenditure of $986,099 in FY 2011 funds in Rental Housing Finance, Homeownership, Rehabilitation and Special Housing Initiatives, and a reduction of $868,511 due to lower awards in new funds and less program income in FY 2012.
- (1,854,610) -
Homeless Prevention & Rapid Re-housing Adjustment reflects the expected obligation/expenditure of funds in Special Housing Initiatives in FY 2011.
- (2,418,707) -
Housing Rehabilitation Trust Fund Adjustment reflects the expected obligation/expenditure of Rehab Owner Occupied funds in FY 2011.
- (207,506) -
Housing Trust Funds CDBG Adjustment reflects the expected obligation/expenditure of Rehab Owner Occupied funds in FY 2011.
- (37,483) -
Housing Trust Funds Linkage Adjustment reflects the expected obligation/expenditure of $1,513,218 in Rehab Owner Occupied, Special Housing Initiatives, Rental Housing Finance, and Homeownership funds in FY 2011 as well as a $95,871 increase in new fees and principal and interest payments.
- (1,417,347) -
Housing Trust Funds Redevelopment Agency Adjustment reflects the expected obligation/expenditure of funds in Rental Housing Finance in FY 2011.
- (59,794) -
Housing Trust Funds Transient Occupancy Tax Adjustment reflects the expected obligation/expenditure of funds in Rental Housing Finance in FY 2011.
- (16,203) -
HUD Development Adjustment reflects the expected obligation/expenditure of Rental Housing funds in FY 2011.
- (20,799) -
HUD Healthy Homes Adjustment reflects the addition of funds for the HUD Healthy Homes program. These funds will provide for material and labor costs to implement healthy home principles and practices into existing housing rehabilitation and lead control programs administered by the Housing Commission. This program will focus on multiple housing-related hazards at once, rather than addressing one hazard at a time.
- 102,611 -
- 234 -City of San Diego Fiscal Year 2012 Adopted Budget
City Agencies
Table 21: San Diego Housing Commission Significant Budget Adjustments (Cont’d) Significant Budget Adjustments Position Revenue Expenses
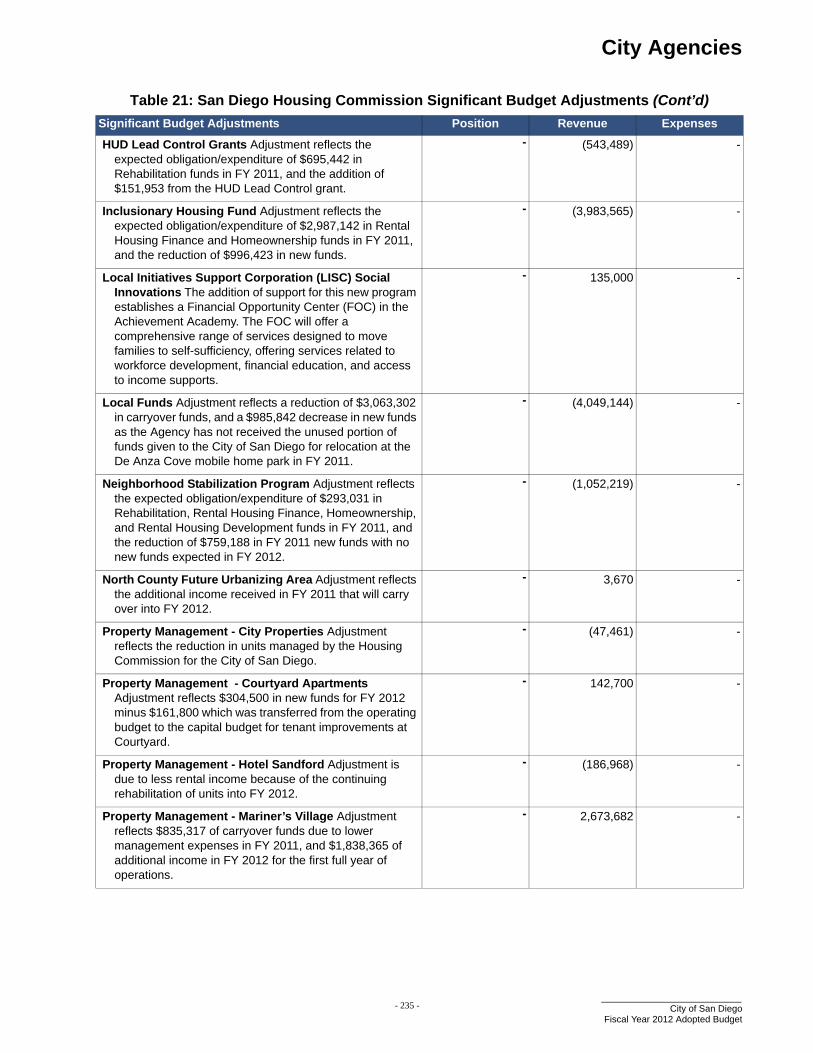
HUD Lead Control Grants Adjustment reflects the expected obligation/expenditure of $695,442 in Rehabilitation funds in FY 2011, and the addition of $151,953 from the HUD Lead Control grant.
- (543,489) -
Inclusionary Housing Fund Adjustment reflects the expected obligation/expenditure of $2,987,142 in Rental Housing Finance and Homeownership funds in FY 2011, and the reduction of $996,423 in new funds.
- (3,983,565) -
Local Initiatives Support Corporation (LISC) Social Innovations The addition of support for this new program establishes a Financial Opportunity Center (FOC) in the Achievement Academy. The FOC will offer a comprehensive range of services designed to move families to self-sufficiency, offering services related to workforce development, financial education, and access to income supports.
- 135,000 -
Local Funds Adjustment reflects a reduction of $3,063,302 in carryover funds, and a $985,842 decrease in new funds as the Agency has not received the unused portion of funds given to the City of San Diego for relocation at the De Anza Cove mobile home park in FY 2011.
- (4,049,144) -
Neighborhood Stabilization Program Adjustment reflects the expected obligation/expenditure of $293,031 in Rehabilitation, Rental Housing Finance, Homeownership, and Rental Housing Development funds in FY 2011, and the reduction of $759,188 in FY 2011 new funds with no new funds expected in FY 2012.
- (1,052,219) -
North County Future Urbanizing Area Adjustment reflects the additional income received in FY 2011 that will carry over into FY 2012.
- 3,670 -
Property Management - City Properties Adjustment reflects the reduction in units managed by the Housing Commission for the City of San Diego.
- (47,461) -
Property Management - Courtyard Apartments Adjustment reflects $304,500 in new funds for FY 2012 minus $161,800 which was transferred from the operating budget to the capital budget for tenant improvements at Courtyard.
- 142,700 -
Property Management - Hotel Sandford Adjustment is due to less rental income because of the continuing rehabilitation of units into FY 2012.
- (186,968) -
Property Management - Mariner’s Village Adjustment reflects $835,317 of carryover funds due to lower management expenses in FY 2011, and $1,838,365 of additional income in FY 2012 for the first full year of operations.
- 2,673,682 -
- 235 - City of San Diego Fiscal Year 2012 Adopted Budget
City Agencies
Table 21: San Diego Housing Commission Significant Budget Adjustments (Cont’d) Significant Budget Adjustments Position Revenue Expenses
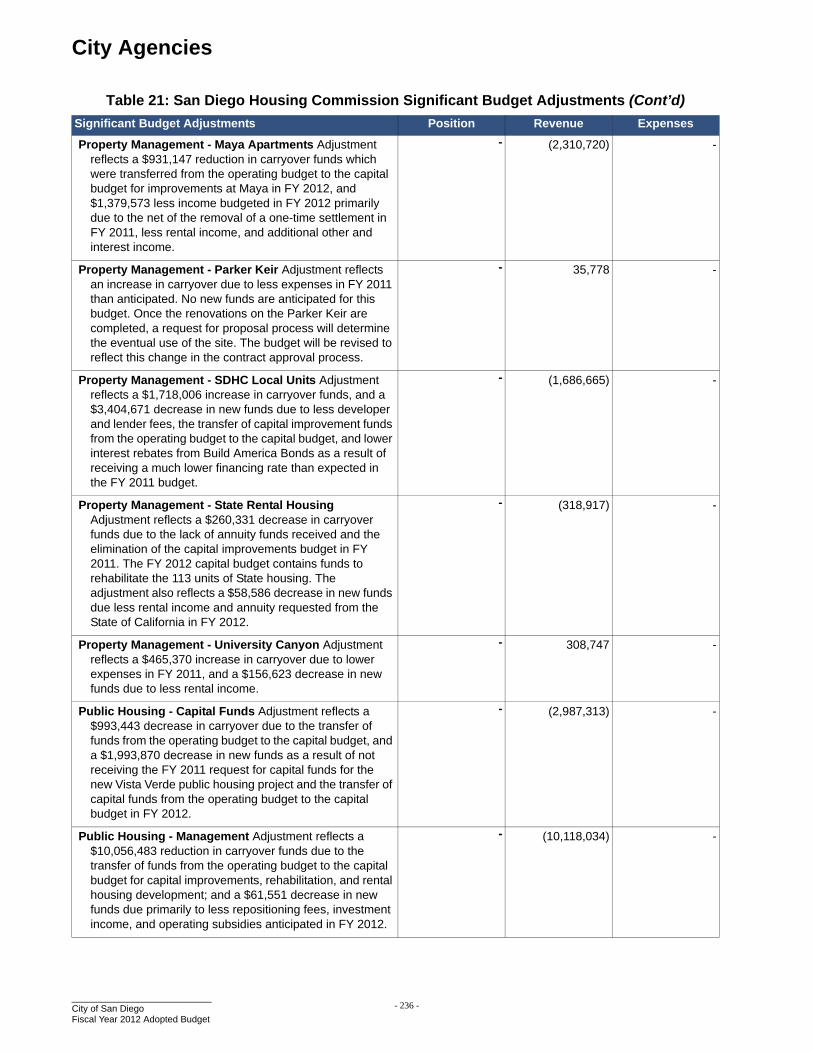
Property Management - Maya Apartments Adjustment reflects a $931,147 reduction in carryover funds which were transferred from the operating budget to the capital budget for improvements at Maya in FY 2012, and $1,379,573 less income budgeted in FY 2012 primarily due to the net of the removal of a one-time settlement in FY 2011, less rental income, and additional other and interest income.
- (2,310,720) -
Property Management - Parker Keir Adjustment reflects an increase in carryover due to less expenses in FY 2011 than anticipated. No new funds are anticipated for this budget. Once the renovations on the Parker Keir are completed, a request for proposal process will determine the eventual use of the site. The budget will be revised to reflect this change in the contract approval process.
- 35,778 -
Property Management - SDHC Local Units Adjustment reflects a $1,718,006 increase in carryover funds, and a $3,404,671 decrease in new funds due to less developer and lender fees, the transfer of capital improvement funds from the operating budget to the capital budget, and lower interest rebates from Build America Bonds as a result of receiving a much lower financing rate than expected in the FY 2011 budget.
- (1,686,665) -
Property Management - State Rental Housing Adjustment reflects a $260,331 decrease in carryover funds due to the lack of annuity funds received and the elimination of the capital improvements budget in FY 2011. The FY 2012 capital budget contains funds to rehabilitate the 113 units of State housing. The adjustment also reflects a $58,586 decrease in new funds due less rental income and annuity requested from the State of California in FY 2012.
- (318,917) -
Property Management - University Canyon Adjustment reflects a $465,370 increase in carryover due to lower expenses in FY 2011, and a $156,623 decrease in new funds due to less rental income.
- 308,747 -
Public Housing - Capital Funds Adjustment reflects a $993,443 decrease in carryover due to the transfer of funds from the operating budget to the capital budget, and a $1,993,870 decrease in new funds as a result of not receiving the FY 2011 request for capital funds for the new Vista Verde public housing project and the transfer of capital funds from the operating budget to the capital budget in FY 2012.
- (2,987,313) -
Public Housing - Management Adjustment reflects a $10,056,483 reduction in carryover funds due to the transfer of funds from the operating budget to the capital budget for capital improvements, rehabilitation, and rental housing development; and a $61,551 decrease in new funds due primarily to less repositioning fees, investment income, and operating subsidies anticipated in FY 2012.
- (10,118,034) -
- 236 -City of San Diego Fiscal Year 2012 Adopted Budget
City Agencies
Table 21: San Diego Housing Commission Significant Budget Adjustments (Cont’d) Significant Budget Adjustments Position Revenue Expenses
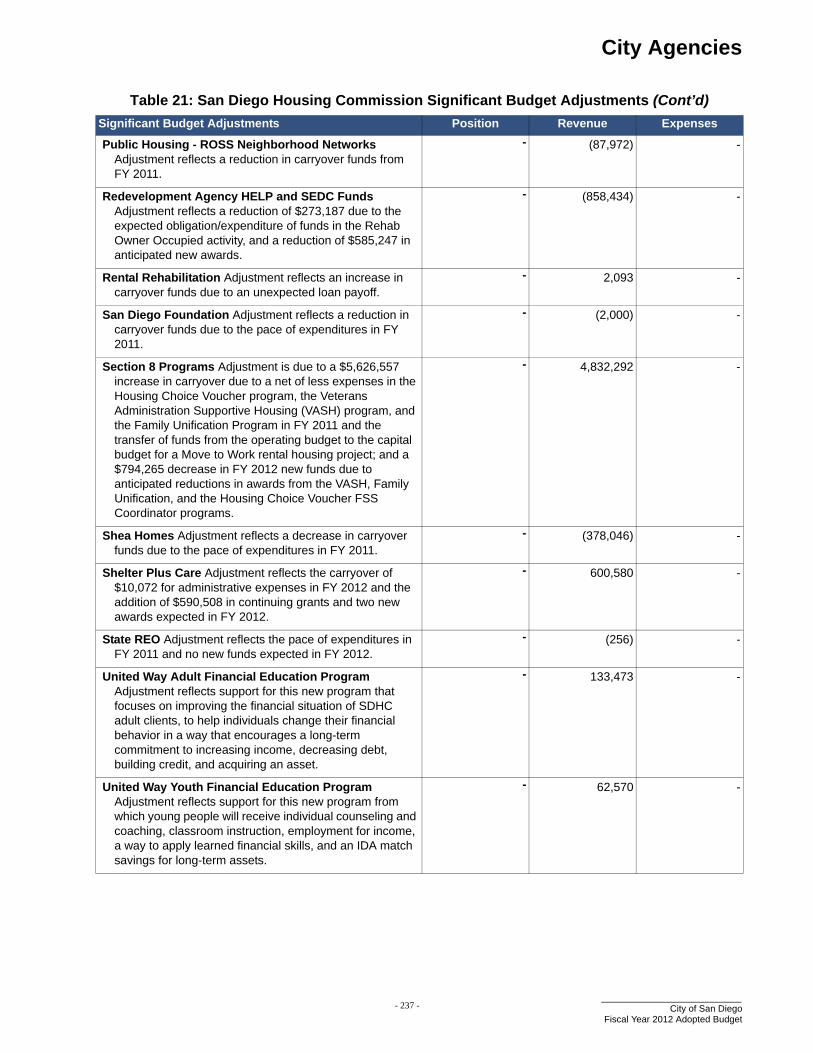
Public Housing - ROSS Neighborhood Networks Adjustment reflects a reduction in carryover funds from FY 2011.
- (87,972) -
Redevelopment Agency HELP and SEDC Funds Adjustment reflects a reduction of $273,187 due to the expected obligation/expenditure of funds in the Rehab Owner Occupied activity, and a reduction of $585,247 in anticipated new awards.
- (858,434) -
Rental Rehabilitation Adjustment reflects an increase in carryover funds due to an unexpected loan payoff.
- 2,093 -
San Diego Foundation Adjustment reflects a reduction in carryover funds due to the pace of expenditures in FY 2011.
- (2,000) -
Section 8 Programs Adjustment is due to a $5,626,557 increase in carryover due to a net of less expenses in the Housing Choice Voucher program, the Veterans Administration Supportive Housing (VASH) program, and the Family Unification Program in FY 2011 and the transfer of funds from the operating budget to the capital budget for a Move to Work rental housing project; and a $794,265 decrease in FY 2012 new funds due to anticipated reductions in awards from the VASH, Family Unification, and the Housing Choice Voucher FSS Coordinator programs.
- 4,832,292 -
Shea Homes Adjustment reflects a decrease in carryover funds due to the pace of expenditures in FY 2011.
- (378,046) -
Shelter Plus Care Adjustment reflects the carryover of $10,072 for administrative expenses in FY 2012 and the addition of $590,508 in continuing grants and two new awards expected in FY 2012.
- 600,580 -
State REO Adjustment reflects the pace of expenditures in FY 2011 and no new funds expected in FY 2012.
- (256) -
United Way Adult Financial Education Program Adjustment reflects support for this new program that focuses on improving the financial situation of SDHC adult clients, to help individuals change their financial behavior in a way that encourages a long-term commitment to increasing income, decreasing debt, building credit, and acquiring an asset.
- 133,473 -
United Way Youth Financial Education Program Adjustment reflects support for this new program from which young people will receive individual counseling and coaching, classroom instruction, employment for income, a way to apply learned financial skills, and an IDA match savings for long-term assets.
- 62,570 -
- 237 - City of San Diego Fiscal Year 2012 Adopted Budget
-
City Agencies
Table 21: San Diego Housing Commission Significant Budget Adjustments (Cont’d) Significant Budget Adjustments Position Revenue Expenses
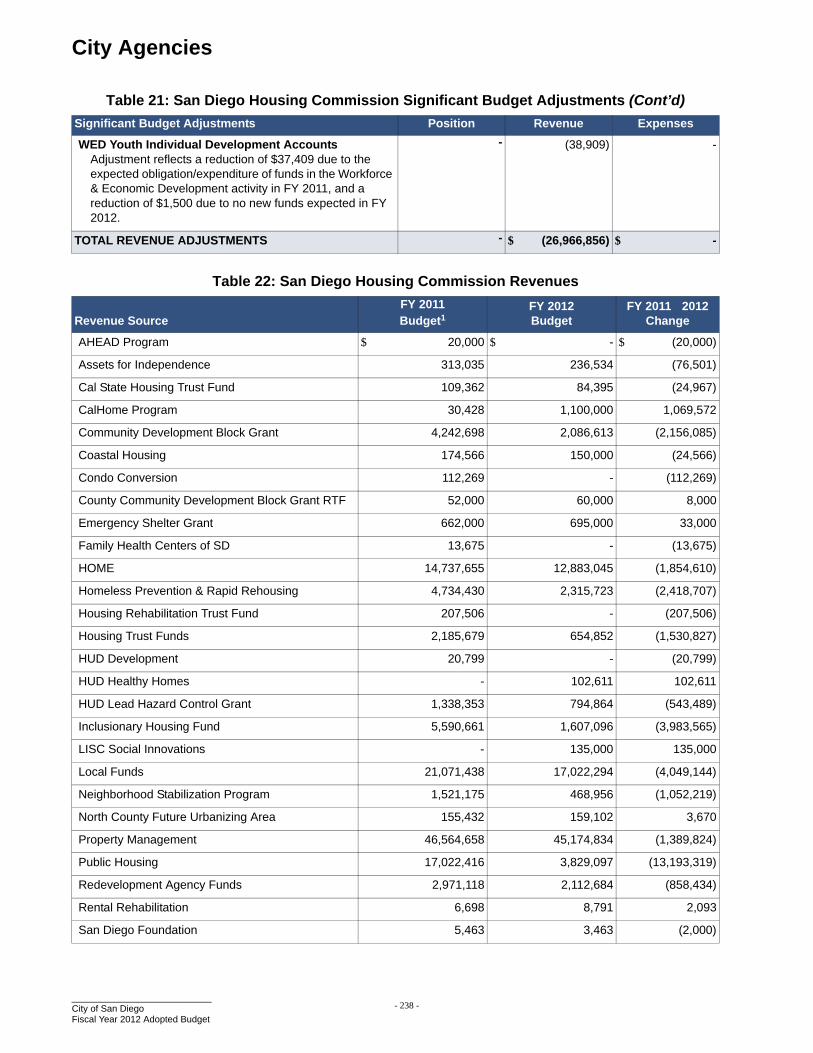
WED Youth Individual Development Accounts Adjustment reflects a reduction of $37,409 due to the expected obligation/expenditure of funds in the Workforce & Economic Development activity in FY 2011, and a reduction of $1,500 due to no new funds expected in FY 2012.
- (38,909) -
TOTAL REVENUE ADJUSTMENTS - $ (26,966,856) $ -
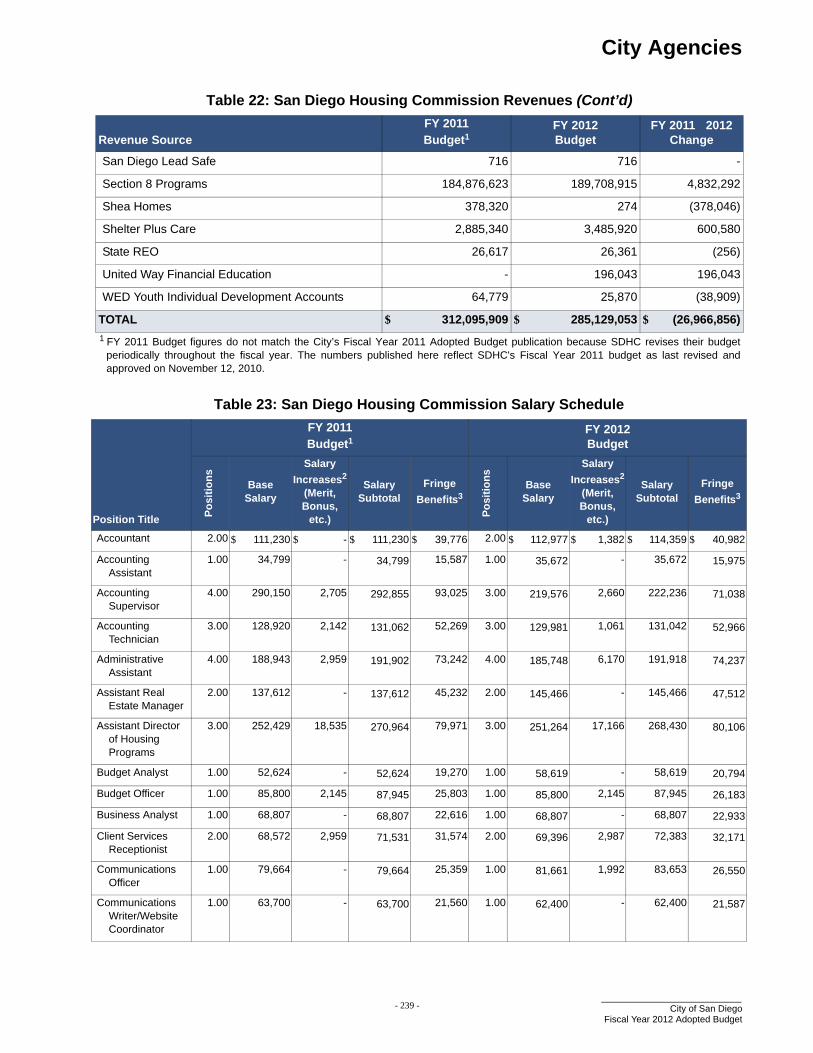
Table 22: San Diego Housing Commission Revenues
Revenue Source FY 2011 Budget1
FY 2012 Budget
FY 2011 2012 Change
AHEAD Program $ 20,000 $ - $ (20,000)
Assets for Independence 313,035 236,534 (76,501)
Cal State Housing Trust Fund 109,362 84,395 (24,967)
CalHome Program 30,428 1,100,000 1,069,572
Community Development Block Grant 4,242,698 2,086,613 (2,156,085)
Coastal Housing 174,566 150,000 (24,566)
Condo Conversion 112,269 - (112,269)
County Community Development Block Grant RTF 52,000 60,000 8,000
Emergency Shelter Grant 662,000 695,000 33,000
Family Health Centers of SD 13,675 - (13,675)
HOME 14,737,655 12,883,045 (1,854,610)
Homeless Prevention & Rapid Rehousing 4,734,430 2,315,723 (2,418,707)
Housing Rehabilitation Trust Fund 207,506 - (207,506)
Housing Trust Funds 2,185,679 654,852 (1,530,827)
HUD Development 20,799 - (20,799)
HUD Healthy Homes - 102,611 102,611
HUD Lead Hazard Control Grant 1,338,353 794,864 (543,489)
Inclusionary Housing Fund 5,590,661 1,607,096 (3,983,565)
LISC Social Innovations - 135,000 135,000
Local Funds 21,071,438 17,022,294 (4,049,144)
Neighborhood Stabilization Program 1,521,175 468,956 (1,052,219)
North County Future Urbanizing Area 155,432 159,102 3,670
Property Management 46,564,658 45,174,834 (1,389,824)
Public Housing 17,022,416 3,829,097 (13,193,319)
Redevelopment Agency Funds 2,971,118 2,112,684 (858,434)
Rental Rehabilitation 6,698 8,791 2,093
San Diego Foundation 5,463 3,463 (2,000)
- 238 -City of San Diego Fiscal Year 2012 Adopted Budget
-
City Agencies
Table 22: San Diego Housing Commission Revenues (Cont’d)
Revenue Source FY 2011 Budget1
FY 2012 Budget
FY 2011 2012 Change
San Diego Lead Safe 716 716 -
Section 8 Programs 184,876,623 189,708,915 4,832,292
Shea Homes 378,320 274 (378,046)
Shelter Plus Care 2,885,340 3,485,920 600,580
State REO 26,617 26,361 (256)
United Way Financial Education - 196,043 196,043
WED Youth Individual Development Accounts 64,779 25,870 (38,909)
TOTAL $ 312,095,909 $ 285,129,053 $ (26,966,856) 1 FY 2011 Budget figures do not match the City’s Fiscal Year 2011 Adopted Budget publication because SDHC revises their budget
periodically throughout the fiscal year. The numbers published here reflect SDHC's Fiscal Year 2011 budget as last revised and approved on November 12, 2010.
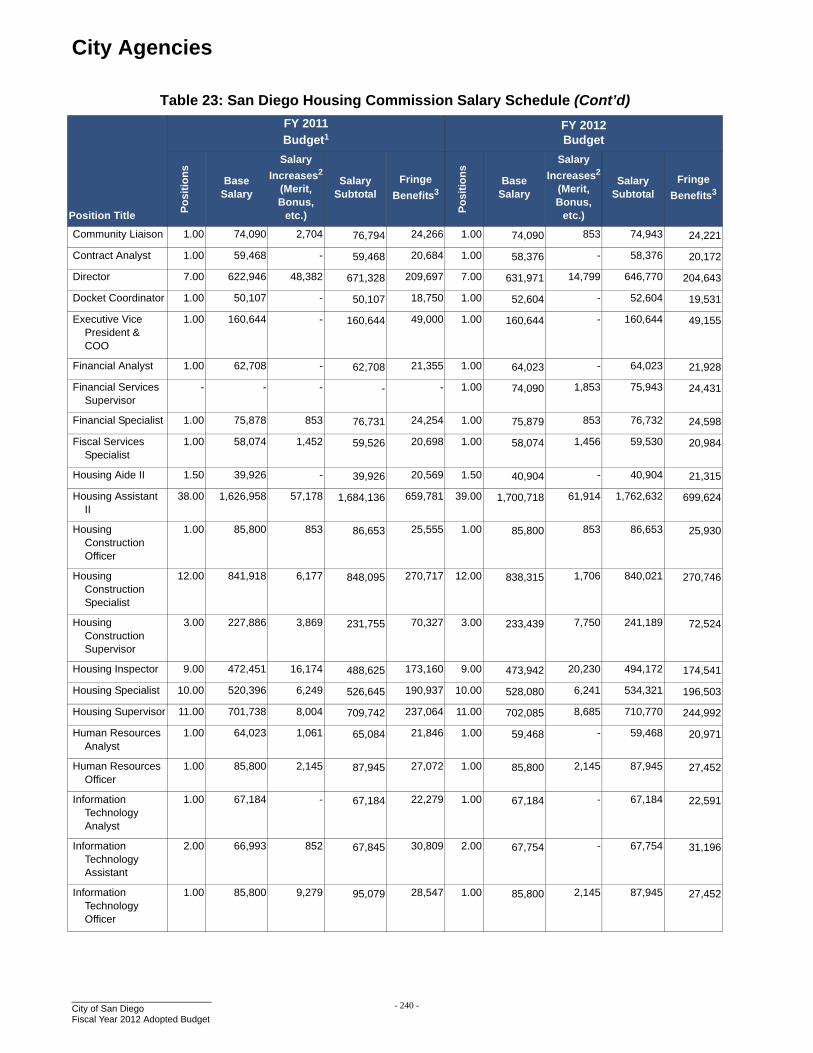
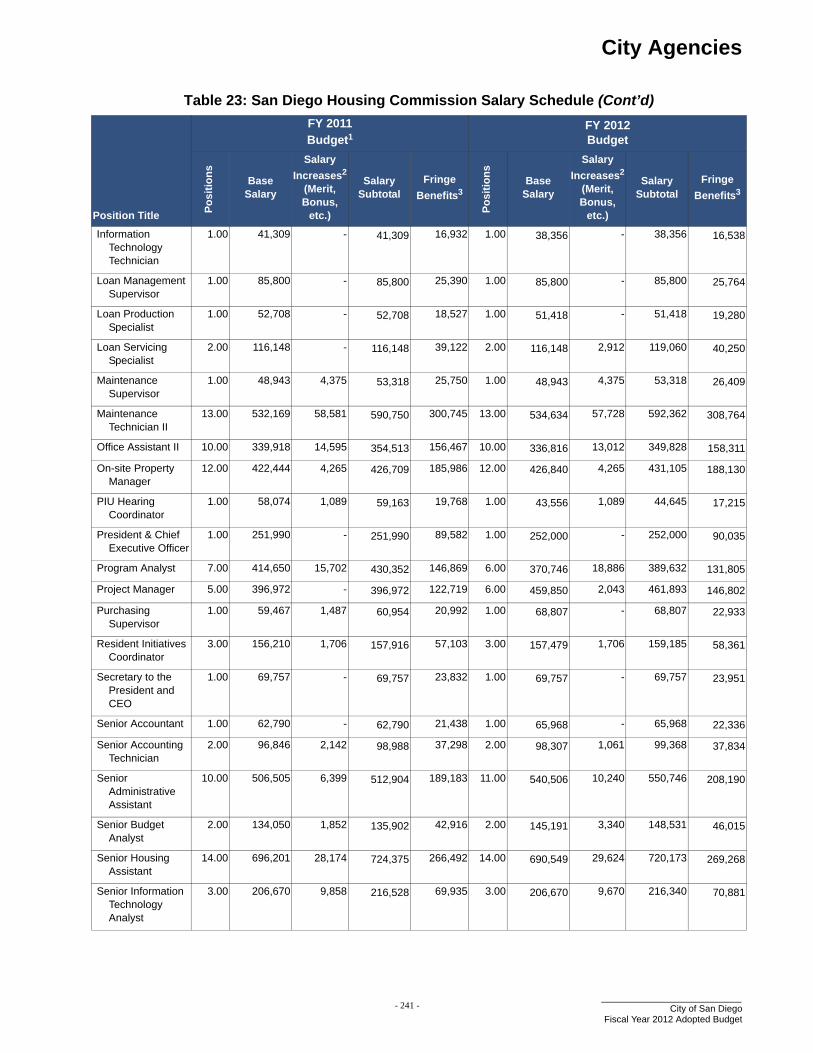
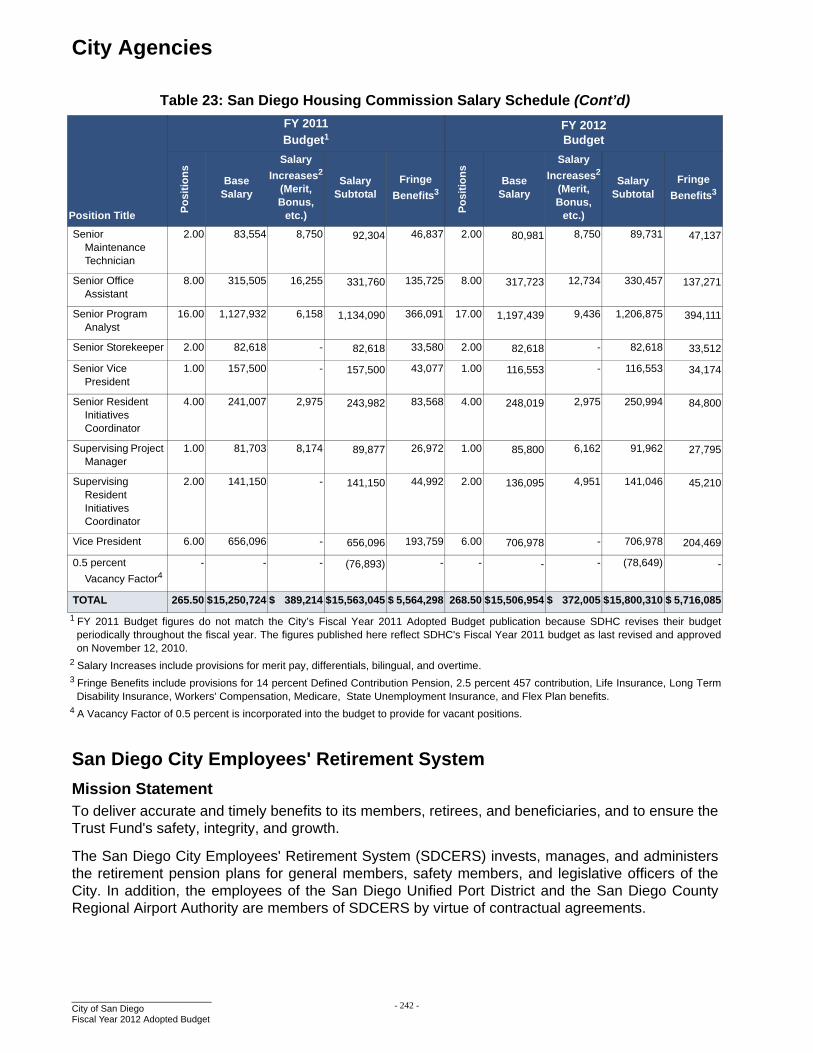
Table 23: San Diego Housing Commission Salary Schedule
Position Title
FY 2011 Budget1
FY 2012 Budget
Posi
tions Base
Salary
Salary Increases2
(Merit, Bonus,
etc.)
Salary Subtotal
Fringe Benefits3
Posi
tions Base
Salary
Salary Increases2
(Merit, Bonus,
etc.)
Salary Subtotal
Fringe Benefits3
Accountant 2.00 $ 111,230 $ - $ 111,230 $ 39,776 2.00 $ 112,977 $ 1,382 $ 114,359 $ 40,982
Accounting Assistant
1.00 34,799 - 34,799 15,587 1.00 35,672 - 35,672 15,975
Accounting Supervisor
4.00 290,150 2,705 292,855 93,025 3.00 219,576 2,660 222,236 71,038
Accounting Technician
3.00 128,920 2,142 131,062 52,269 3.00 129,981 1,061 131,042 52,966
Administrative Assistant
4.00 188,943 2,959 191,902 73,242 4.00 185,748 6,170 191,918 74,237
Assistant Real Estate Manager
2.00 137,612 - 137,612 45,232 2.00 145,466 - 145,466 47,512
Assistant Director of Housing Programs
3.00 252,429 18,535 270,964 79,971 3.00 251,264 17,166 268,430 80,106
Budget Analyst 1.00 52,624 - 52,624 19,270 1.00 58,619 - 58,619 20,794
Budget Officer 1.00 85,800 2,145 87,945 25,803 1.00 85,800 2,145 87,945 26,183
Business Analyst 1.00 68,807 - 68,807 22,616 1.00 68,807 - 68,807 22,933
Client Services Receptionist
2.00 68,572 2,959 71,531 31,574 2.00 69,396 2,987 72,383 32,171
Communications Officer
1.00 79,664 - 79,664 25,359 1.00 81,661 1,992 83,653 26,550
Communications Writer/Website Coordinator
1.00 63,700 - 63,700 21,560 1.00 62,400 - 62,400 21,587
- 239 - City of San Diego Fiscal Year 2012 Adopted Budget
City Agencies
Table 23: San Diego Housing Commission Salary Schedule (Cont’d)
Position Title
FY 2011 Budget1
FY 2012 Budget
Posi
tions Base
Salary
Salary Increases2
(Merit, Bonus,
etc.)
Salary Subtotal
Fringe Benefits3
Posi
tions Base
Salary
Salary Increases2
(Merit, Bonus,
etc.)
Salary Subtotal
Fringe Benefits3
Community Liaison 1.00 74,090 2,704 76,794 24,266 1.00 74,090 853 74,943 24,221
Contract Analyst 1.00 59,468 - 59,468 20,684 1.00 58,376 - 58,376 20,172
Director 7.00 622,946 48,382 671,328 209,697 7.00 631,971 14,799 646,770 204,643
Docket Coordinator 1.00 50,107 - 50,107 18,750 1.00 52,604 - 52,604 19,531
Executive Vice President & COO
1.00 160,644 - 160,644 49,000 1.00 160,644 - 160,644 49,155
Financial Analyst 1.00 62,708 - 62,708 21,355 1.00 64,023 - 64,023 21,928
Financial Services Supervisor
- - - - - 1.00 74,090 1,853 75,943 24,431
Financial Specialist 1.00 75,878 853 76,731 24,254 1.00 75,879 853 76,732 24,598
Fiscal Services Specialist
1.00 58,074 1,452 59,526 20,698 1.00 58,074 1,456 59,530 20,984
Housing Aide II 1.50 39,926 - 39,926 20,569 1.50 40,904 - 40,904 21,315
Housing Assistant II
38.00 1,626,958 57,178 1,684,136 659,781 39.00 1,700,718 61,914 1,762,632 699,624
Housing Construction Officer
1.00 85,800 853 86,653 25,555 1.00 85,800 853 86,653 25,930
Housing Construction Specialist
12.00 841,918 6,177 848,095 270,717 12.00 838,315 1,706 840,021 270,746
Housing Construction Supervisor
3.00 227,886 3,869 231,755 70,327 3.00 233,439 7,750 241,189 72,524
Housing Inspector 9.00 472,451 16,174 488,625 173,160 9.00 473,942 20,230 494,172 174,541
Housing Specialist 10.00 520,396 6,249 526,645 190,937 10.00 528,080 6,241 534,321 196,503
Housing Supervisor 11.00 701,738 8,004 709,742 237,064 11.00 702,085 8,685 710,770 244,992
Human Resources Analyst
1.00 64,023 1,061 65,084 21,846 1.00 59,468 - 59,468 20,971
Human Resources Officer
1.00 85,800 2,145 87,945 27,072 1.00 85,800 2,145 87,945 27,452
Information Technology Analyst
1.00 67,184 - 67,184 22,279 1.00 67,184 - 67,184 22,591
Information Technology Assistant
2.00 66,993 852 67,845 30,809 2.00 67,754 - 67,754 31,196
Information Technology Officer
1.00 85,800 9,279 95,079 28,547 1.00 85,800 2,145 87,945 27,452
- 240 -City of San Diego Fiscal Year 2012 Adopted Budget
City Agencies
Table 23: San Diego Housing Commission Salary Schedule (Cont’d)
Position Title
FY 2011 Budget1
FY 2012 Budget
Posi
tions Base
Salary
Salary Increases2
(Merit, Bonus,
etc.)
Salary Subtotal
Fringe Benefits3
Posi
tions Base
Salary
Salary Increases2
(Merit, Bonus,
etc.)
Salary Subtotal
Fringe Benefits3
Information Technology Technician
1.00 41,309 - 41,309 16,932 1.00 38,356 - 38,356 16,538
Loan Management Supervisor
1.00 85,800 - 85,800 25,390 1.00 85,800 - 85,800 25,764
Loan Production Specialist
1.00 52,708 - 52,708 18,527 1.00 51,418 - 51,418 19,280
Loan Servicing Specialist
2.00 116,148 - 116,148 39,122 2.00 116,148 2,912 119,060 40,250
Maintenance Supervisor
1.00 48,943 4,375 53,318 25,750 1.00 48,943 4,375 53,318 26,409
Maintenance Technician II
13.00 532,169 58,581 590,750 300,745 13.00 534,634 57,728 592,362 308,764
Office Assistant II 10.00 339,918 14,595 354,513 156,467 10.00 336,816 13,012 349,828 158,311
On-site Property Manager
12.00 422,444 4,265 426,709 185,986 12.00 426,840 4,265 431,105 188,130
PIU Hearing Coordinator
1.00 58,074 1,089 59,163 19,768 1.00 43,556 1,089 44,645 17,215
President & Chief Executive Officer
1.00 251,990 - 251,990 89,582 1.00 252,000 - 252,000 90,035
Program Analyst 7.00 414,650 15,702 430,352 146,869 6.00 370,746 18,886 389,632 131,805
Project Manager 5.00 396,972 - 396,972 122,719 6.00 459,850 2,043 461,893 146,802
Purchasing Supervisor
1.00 59,467 1,487 60,954 20,992 1.00 68,807 - 68,807 22,933
Resident Initiatives Coordinator
3.00 156,210 1,706 157,916 57,103 3.00 157,479 1,706 159,185 58,361
Secretary to the President and CEO
1.00 69,757 - 69,757 23,832 1.00 69,757 - 69,757 23,951
Senior Accountant 1.00 62,790 - 62,790 21,438 1.00 65,968 - 65,968 22,336
Senior Accounting Technician
2.00 96,846 2,142 98,988 37,298 2.00 98,307 1,061 99,368 37,834
Senior Administrative Assistant
10.00 506,505 6,399 512,904 189,183 11.00 540,506 10,240 550,746 208,190
Senior Budget Analyst
2.00 134,050 1,852 135,902 42,916 2.00 145,191 3,340 148,531 46,015
Senior Housing Assistant
14.00 696,201 28,174 724,375 266,492 14.00 690,549 29,624 720,173 269,268
Senior Information Technology Analyst
3.00 206,670 9,858 216,528 69,935 3.00 206,670 9,670 216,340 70,881
- 241 - City of San Diego Fiscal Year 2012 Adopted Budget
City Agencies
Table 23: San Diego Housing Commission Salary Schedule (Cont’d)
Position Title
FY 2011 Budget1
FY 2012 Budget
Posi
tions Base
Salary
Salary Increases2
(Merit, Bonus,
etc.)
Salary Subtotal
Fringe Benefits3
Posi
tions Base
Salary
Salary Increases2
(Merit, Bonus,
etc.)
Salary Subtotal
Fringe Benefits3
Senior Maintenance Technician
2.00 83,554 8,750 92,304 46,837 2.00 80,981 8,750 89,731 47,137
Senior Office Assistant
8.00 315,505 16,255 331,760 135,725 8.00 317,723 12,734 330,457 137,271
Senior Program Analyst
16.00 1,127,932 6,158 1,134,090 366,091 17.00 1,197,439 9,436 1,206,875 394,111
Senior Storekeeper 2.00 82,618 - 82,618 33,580 2.00 82,618 - 82,618 33,512
Senior Vice President
1.00 157,500 - 157,500 43,077 1.00 116,553 - 116,553 34,174
Senior Resident Initiatives Coordinator
4.00 241,007 2,975 243,982 83,568 4.00 248,019 2,975 250,994 84,800
Supervising Project Manager
1.00 81,703 8,174 89,877 26,972 1.00 85,800 6,162 91,962 27,795
Supervising Resident Initiatives Coordinator
2.00 141,150 - 141,150 44,992 2.00 136,095 4,951 141,046 45,210
Vice President 6.00 656,096 - 656,096 193,759 6.00 706,978 - 706,978 204,469
0.5 percent Vacancy Factor4
- - - (76,893) - - - - (78,649) -
TOTAL 265.50 $15,250,724 $ 389,214 $15,563,045 $ 5,564,298 268.50 $15,506,954 $ 372,005 $15,800,310 $ 5,716,085 1 FY 2011 Budget figures do not match the City’s Fiscal Year 2011 Adopted Budget publication because SDHC revises their budget
periodically throughout the fiscal year. The figures published here reflect SDHC's Fiscal Year 2011 budget as last revised and approved on November 12, 2010.
2 Salary Increases include provisions for merit pay, differentials, bilingual, and overtime. 3 Fringe Benefits include provisions for 14 percent Defined Contribution Pension, 2.5 percent 457 contribution, Life Insurance, Long Term
Disability Insurance, Workers' Compensation, Medicare, State Unemployment Insurance, and Flex Plan benefits. 4 A Vacancy Factor of 0.5 percent is incorporated into the budget to provide for vacant positions.
San Diego City Employees' Retirement System Mission Statement To deliver accurate and timely benefits to its members, retirees, and beneficiaries, and to ensure the Trust Fund's safety, integrity, and growth.
The San Diego City Employees' Retirement System (SDCERS) invests, manages, and administers the retirement pension plans for general members, safety members, and legislative officers of the City. In addition, the employees of the San Diego Unified Port District and the San Diego County Regional Airport Authority are members of SDCERS by virtue of contractual agreements.
- 242 -City of San Diego Fiscal Year 2012 Adopted Budget
-
-
City Agencies
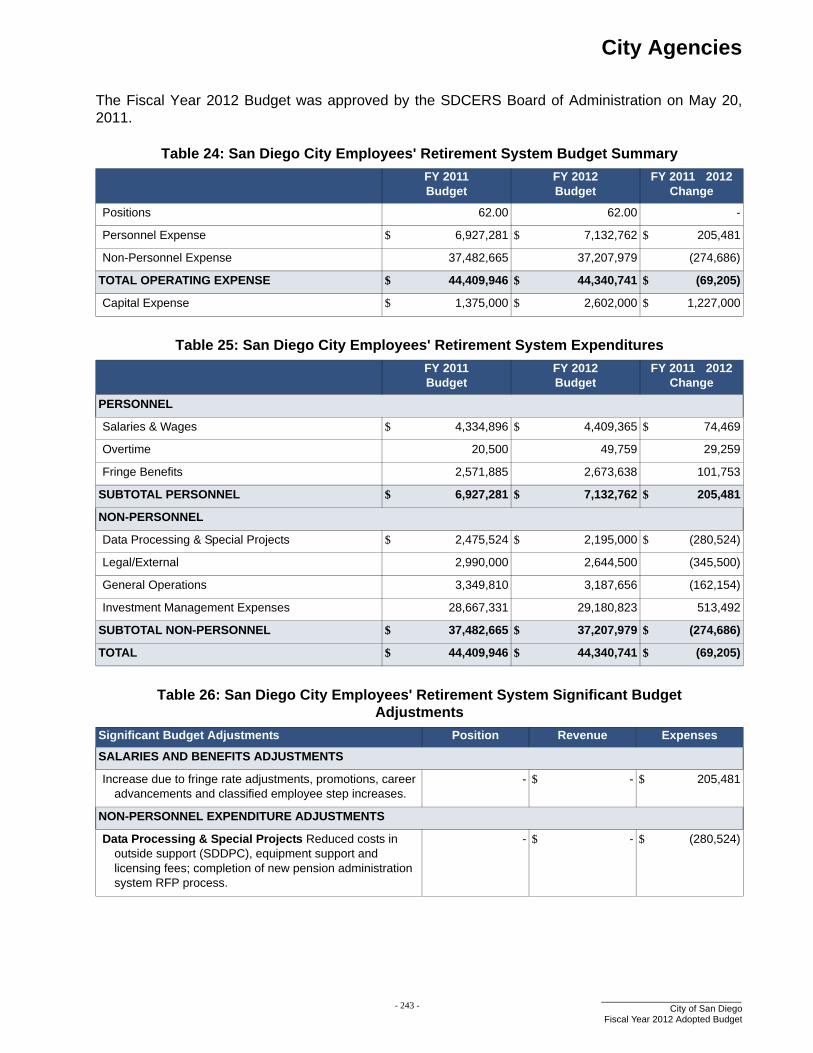
The Fiscal Year 2012 Budget was approved by the SDCERS Board of Administration on May 20, 2011.
Table 24: San Diego City Employees' Retirement System Budget Summary FY 2011 Budget
FY 2012 Budget
FY 2011 2012 Change
Positions 62.00 62.00 -
Personnel Expense $ 6,927,281 $ 7,132,762 $ 205,481
Non-Personnel Expense 37,482,665 37,207,979 (274,686)
TOTAL OPERATING EXPENSE $ 44,409,946 $ 44,340,741 $ (69,205)
Capital Expense $ 1,375,000 $ 2,602,000 $ 1,227,000
Table 25: San Diego City Employees' Retirement System Expenditures FY 2011 Budget
FY 2012 Budget
FY 2011 2012 Change
PERSONNEL
Salaries & Wages $ 4,334,896 $ 4,409,365 $ 74,469
Overtime 20,500 49,759 29,259
Fringe Benefits 2,571,885 2,673,638 101,753
SUBTOTAL PERSONNEL $ 6,927,281 $ 7,132,762 $ 205,481
NON-PERSONNEL
Data Processing & Special Projects $ 2,475,524 $ 2,195,000 $ (280,524)
Legal/External 2,990,000 2,644,500 (345,500)
General Operations 3,349,810 3,187,656 (162,154)
Investment Management Expenses 28,667,331 29,180,823 513,492
SUBTOTAL NON-PERSONNEL $ 37,482,665 $ 37,207,979 $ (274,686)
TOTAL $ 44,409,946 $ 44,340,741 $ (69,205)
Table 26: San Diego City Employees' Retirement System Significant Budget Adjustments
Significant Budget Adjustments Position Revenue Expenses
SALARIES AND BENEFITS ADJUSTMENTS
Increase due to fringe rate adjustments, promotions, career advancements and classified employee step increases.
- $ - $ 205,481
NON-PERSONNEL EXPENDITURE ADJUSTMENTS
Data Processing & Special Projects Reduced costs in outside support (SDDPC), equipment support and licensing fees; completion of new pension administration system RFP process.
- $ - $ (280,524)
- 243 - City of San Diego Fiscal Year 2012 Adopted Budget
City Agencies
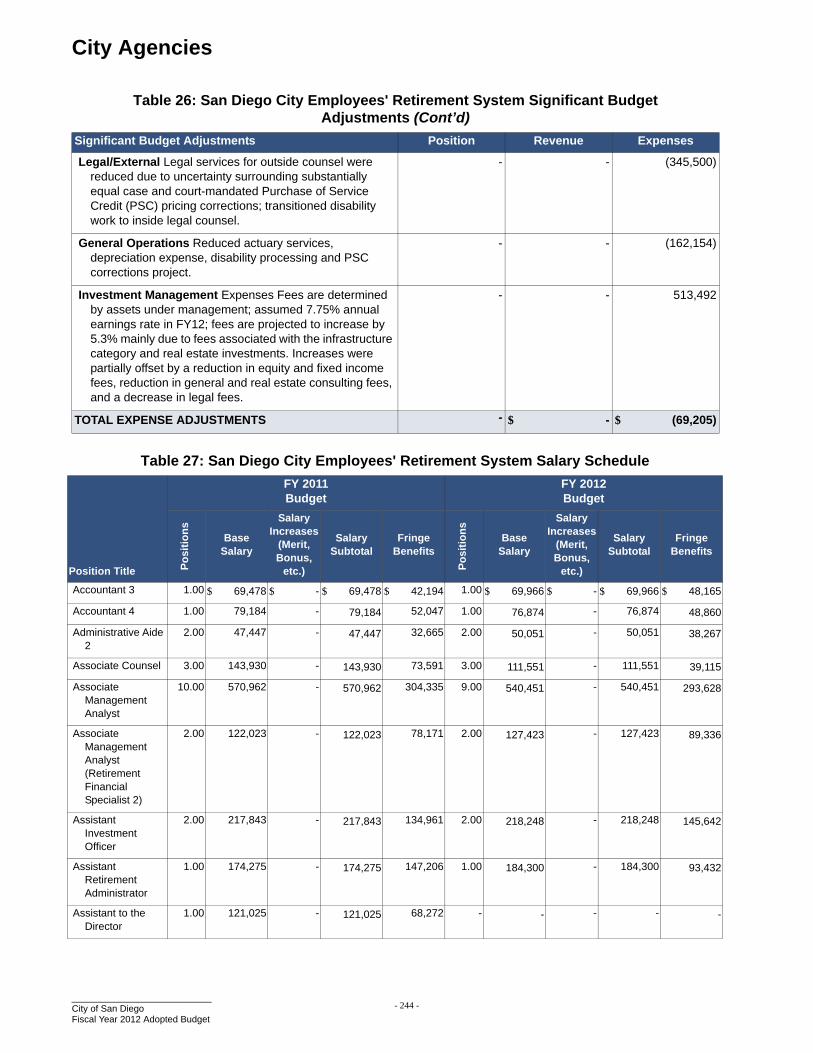
Table 26: San Diego City Employees' Retirement System Significant Budget Adjustments (Cont’d)
Significant Budget Adjustments Position Revenue Expenses
Legal/External Legal services for outside counsel were reduced due to uncertainty surrounding substantially equal case and court-mandated Purchase of Service Credit (PSC) pricing corrections; transitioned disability work to inside legal counsel.
- - (345,500)
General Operations Reduced actuary services, depreciation expense, disability processing and PSC corrections project.
- - (162,154)
Investment Management Expenses Fees are determined by assets under management; assumed 7.75% annual earnings rate in FY12; fees are projected to increase by 5.3% mainly due to fees associated with the infrastructure category and real estate investments. Increases were partially offset by a reduction in equity and fixed income fees, reduction in general and real estate consulting fees, and a decrease in legal fees.
- - 513,492
TOTAL EXPENSE ADJUSTMENTS - $ - $ (69,205)
Table 27: San Diego City Employees' Retirement System Salary Schedule
Position Title
FY 2011 Budget
FY 2012 Budget
Posi
tions Base
Salary
Salary Increases
(Merit, Bonus,
etc.)
Salary Subtotal
Fringe Benefits
Posi
tions Base
Salary
Salary Increases
(Merit, Bonus,
etc.)
Salary Subtotal
Fringe Benefits
Accountant 3 1.00 $ 69,478 $ - $ 69,478 $ 42,194 1.00 $ 69,966 $ - $ 69,966 $ 48,165
Accountant 4 1.00 79,184 - 79,184 52,047 1.00 76,874 - 76,874 48,860
Administrative Aide 2
2.00 47,447 - 47,447 32,665 2.00 50,051 - 50,051 38,267
Associate Counsel 3.00 143,930 - 143,930 73,591 3.00 111,551 - 111,551 39,115
Associate Management Analyst
10.00 570,962 - 570,962 304,335 9.00 540,451 - 540,451 293,628
Associate Management Analyst (Retirement Financial Specialist 2)
2.00 122,023 - 122,023 78,171 2.00 127,423 - 127,423 89,336
Assistant Investment Officer
2.00 217,843 - 217,843 134,961 2.00 218,248 - 218,248 145,642
Assistant Retirement Administrator
1.00 174,275 - 174,275 147,206 1.00 184,300 - 184,300 93,432
Assistant to the Director
1.00 121,025 - 121,025 68,272 - - - - -
- 244 -City of San Diego Fiscal Year 2012 Adopted Budget
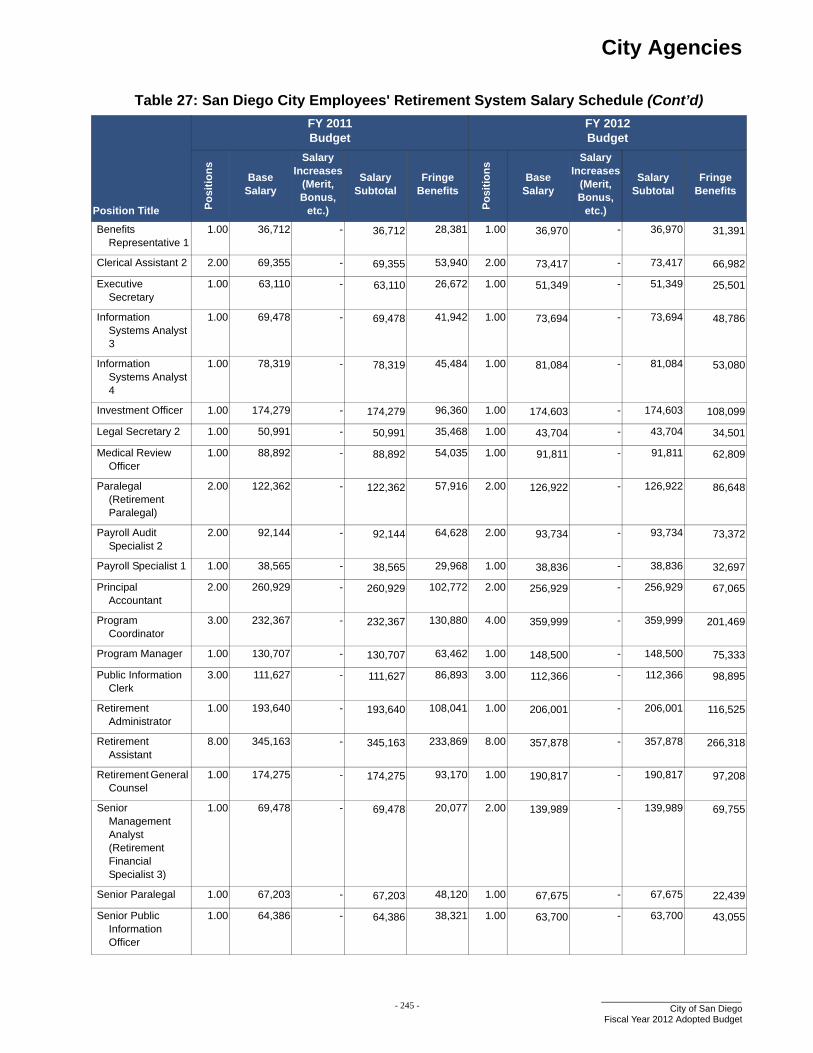
City Agencies
Table 27: San Diego City Employees' Retirement System Salary Schedule (Cont’d)
Position Title
FY 2011 Budget
FY 2012 Budget
Posi
tions Base
Salary
Salary Increases
(Merit, Bonus,
etc.)
Salary Subtotal
Fringe Benefits
Posi
tions Base
Salary
Salary Increases
(Merit, Bonus,
etc.)
Salary Subtotal
Fringe Benefits
Benefits Representative 1
1.00 36,712 - 36,712 28,381 1.00 36,970 - 36,970 31,391
Clerical Assistant 2 2.00 69,355 - 69,355 53,940 2.00 73,417 - 73,417 66,982
Executive Secretary
1.00 63,110 - 63,110 26,672 1.00 51,349 - 51,349 25,501
Information Systems Analyst 3
1.00 69,478 - 69,478 41,942 1.00 73,694 - 73,694 48,786
Information Systems Analyst 4
1.00 78,319 - 78,319 45,484 1.00 81,084 - 81,084 53,080
Investment Officer 1.00 174,279 - 174,279 96,360 1.00 174,603 - 174,603 108,099
Legal Secretary 2 1.00 50,991 - 50,991 35,468 1.00 43,704 - 43,704 34,501
Medical Review Officer
1.00 88,892 - 88,892 54,035 1.00 91,811 - 91,811 62,809
Paralegal (Retirement Paralegal)
2.00 122,362 - 122,362 57,916 2.00 126,922 - 126,922 86,648
Payroll Audit Specialist 2
2.00 92,144 - 92,144 64,628 2.00 93,734 - 93,734 73,372
Payroll Specialist 1 1.00 38,565 - 38,565 29,968 1.00 38,836 - 38,836 32,697
Principal Accountant
2.00 260,929 - 260,929 102,772 2.00 256,929 - 256,929 67,065
Program Coordinator
3.00 232,367 - 232,367 130,880 4.00 359,999 - 359,999 201,469
Program Manager 1.00 130,707 - 130,707 63,462 1.00 148,500 - 148,500 75,333
Public Information Clerk
3.00 111,627 - 111,627 86,893 3.00 112,366 - 112,366 98,895
Retirement Administrator
1.00 193,640 - 193,640 108,041 1.00 206,001 - 206,001 116,525
Retirement Assistant
8.00 345,163 - 345,163 233,869 8.00 357,878 - 357,878 266,318
Retirement General Counsel
1.00 174,275 - 174,275 93,170 1.00 190,817 - 190,817 97,208
Senior Management Analyst (Retirement Financial Specialist 3)
1.00 69,478 - 69,478 20,077 2.00 139,989 - 139,989 69,755
Senior Paralegal 1.00 67,203 - 67,203 48,120 1.00 67,675 - 67,675 22,439
Senior Public Information Officer
1.00 64,386 - 64,386 38,321 1.00 63,700 - 63,700 43,055
- 245 - City of San Diego Fiscal Year 2012 Adopted Budget
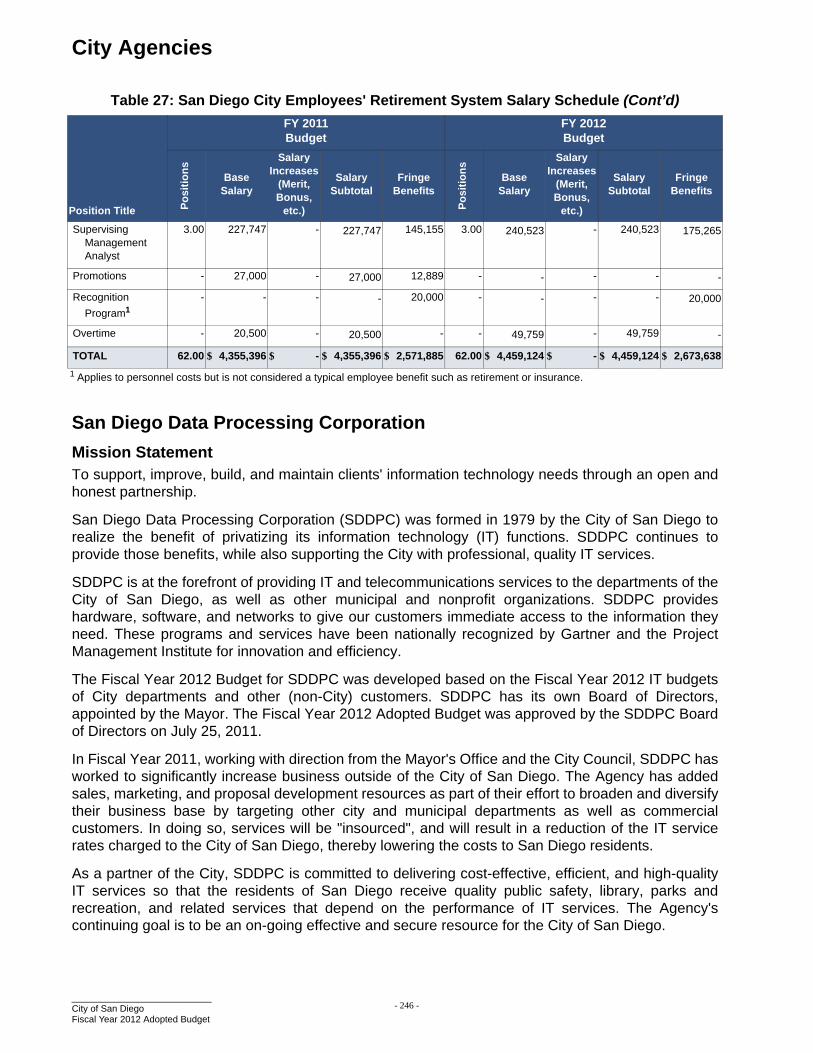
City Agencies
Table 27: San Diego City Employees' Retirement System Salary Schedule (Cont’d)
Position Title
FY 2011 Budget
FY 2012 Budget
Posi
tions Base
Salary
Salary Increases
(Merit, Bonus,
etc.)
Salary Subtotal
Fringe Benefits
Posi
tions Base
Salary
Salary Increases
(Merit, Bonus,
etc.)
Salary Subtotal
Fringe Benefits
Supervising Management Analyst
3.00 227,747 - 227,747 145,155 3.00 240,523 - 240,523 175,265
Promotions - 27,000 - 27,000 12,889 - - - - -
Recognition Program1
- - - - 20,000 - - - - 20,000
Overtime - 20,500 - 20,500 - - 49,759 - 49,759 -
TOTAL 62.00 $ 4,355,396 $ - $ 4,355,396 $ 2,571,885 62.00 $ 4,459,124 $ - $ 4,459,124 $ 2,673,638 1 Applies to personnel costs but is not considered a typical employee benefit such as retirement or insurance.
San Diego Data Processing Corporation Mission Statement To support, improve, build, and maintain clients' information technology needs through an open and honest partnership.
San Diego Data Processing Corporation (SDDPC) was formed in 1979 by the City of San Diego to realize the benefit of privatizing its information technology (IT) functions. SDDPC continues to provide those benefits, while also supporting the City with professional, quality IT services.
SDDPC is at the forefront of providing IT and telecommunications services to the departments of the City of San Diego, as well as other municipal and nonprofit organizations. SDDPC provides hardware, software, and networks to give our customers immediate access to the information they need. These programs and services have been nationally recognized by Gartner and the Project Management Institute for innovation and efficiency.
The Fiscal Year 2012 Budget for SDDPC was developed based on the Fiscal Year 2012 IT budgets of City departments and other (non-City) customers. SDDPC has its own Board of Directors, appointed by the Mayor. The Fiscal Year 2012 Adopted Budget was approved by the SDDPC Board of Directors on July 25, 2011.
In Fiscal Year 2011, working with direction from the Mayor's Office and the City Council, SDDPC has worked to significantly increase business outside of the City of San Diego. The Agency has added sales, marketing, and proposal development resources as part of their effort to broaden and diversify their business base by targeting other city and municipal departments as well as commercial customers. In doing so, services will be "insourced", and will result in a reduction of the IT service rates charged to the City of San Diego, thereby lowering the costs to San Diego residents.
As a partner of the City, SDDPC is committed to delivering cost-effective, efficient, and high-quality IT services so that the residents of San Diego receive quality public safety, library, parks and recreation, and related services that depend on the performance of IT services. The Agency's continuing goal is to be an on-going effective and secure resource for the City of San Diego.
- 246 -City of San Diego Fiscal Year 2012 Adopted Budget
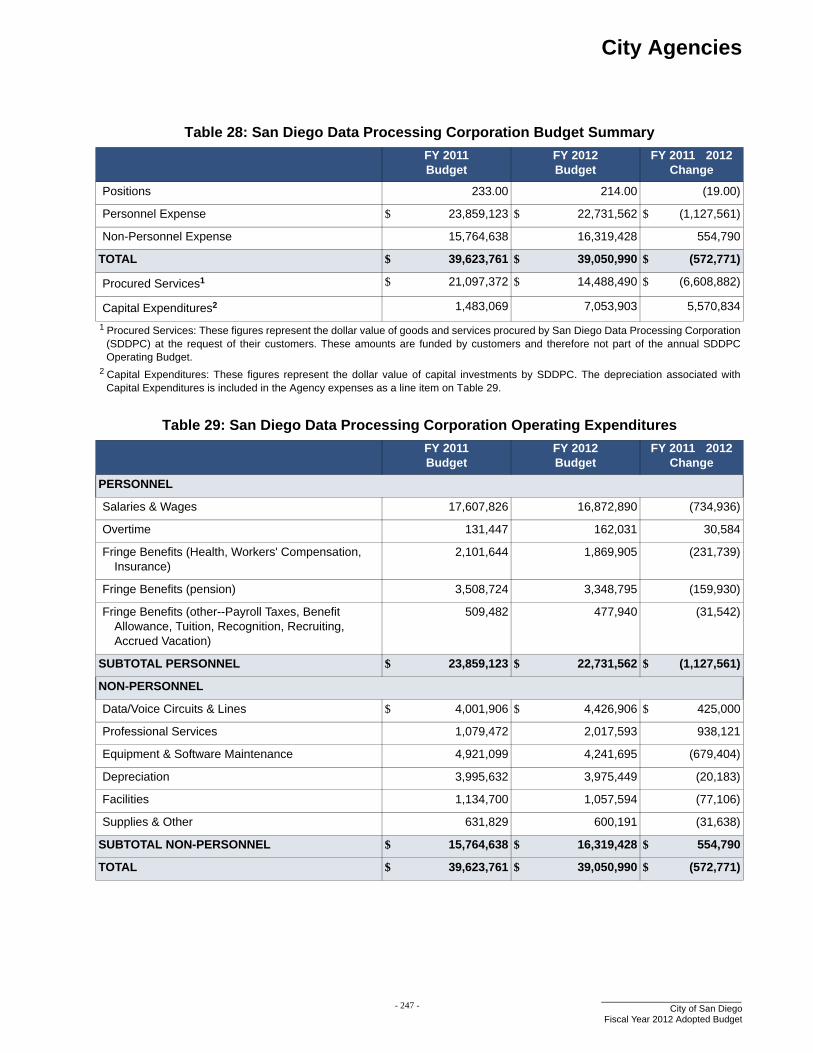
-
-
City Agencies
Table 28: San Diego Data Processing Corporation Budget Summary FY 2011 Budget
FY 2012 Budget
FY 2011 2012 Change
Positions 233.00 214.00 (19.00)
Personnel Expense $ 23,859,123 $ 22,731,562 $ (1,127,561)
Non-Personnel Expense 15,764,638 16,319,428 554,790
TOTAL $ 39,623,761 $ 39,050,990 $ (572,771)
Procured Services1 $ 21,097,372 $ 14,488,490 $ (6,608,882)
Capital Expenditures2 1,483,069 7,053,903 5,570,834 1 Procured Services: These figures represent the dollar value of goods and services procured by San Diego Data Processing Corporation
(SDDPC) at the request of their customers. These amounts are funded by customers and therefore not part of the annual SDDPC Operating Budget.
2 Capital Expenditures: These figures represent the dollar value of capital investments by SDDPC. The depreciation associated with Capital Expenditures is included in the Agency expenses as a line item on Table 29.
Table 29: San Diego Data Processing Corporation Operating Expenditures FY 2011 Budget
FY 2012 Budget
FY 2011 2012 Change
PERSONNEL
Salaries & Wages 17,607,826 16,872,890 (734,936)
Overtime 131,447 162,031 30,584
Fringe Benefits (Health, Workers' Compensation, Insurance)
2,101,644 1,869,905 (231,739)
Fringe Benefits (pension) 3,508,724 3,348,795 (159,930)
Fringe Benefits (other--Payroll Taxes, Benefit Allowance, Tuition, Recognition, Recruiting, Accrued Vacation)
509,482 477,940 (31,542)
SUBTOTAL PERSONNEL $ 23,859,123 $ 22,731,562 $ (1,127,561)
NON-PERSONNEL
Data/Voice Circuits & Lines $ 4,001,906 $ 4,426,906 $ 425,000
Professional Services 1,079,472 2,017,593 938,121
Equipment & Software Maintenance 4,921,099 4,241,695 (679,404)
Depreciation 3,995,632 3,975,449 (20,183)
Facilities 1,134,700 1,057,594 (77,106)
Supplies & Other 631,829 600,191 (31,638)
SUBTOTAL NON-PERSONNEL $ 15,764,638 $ 16,319,428 $ 554,790
TOTAL $ 39,623,761 $ 39,050,990 $ (572,771)
- 247 - City of San Diego Fiscal Year 2012 Adopted Budget
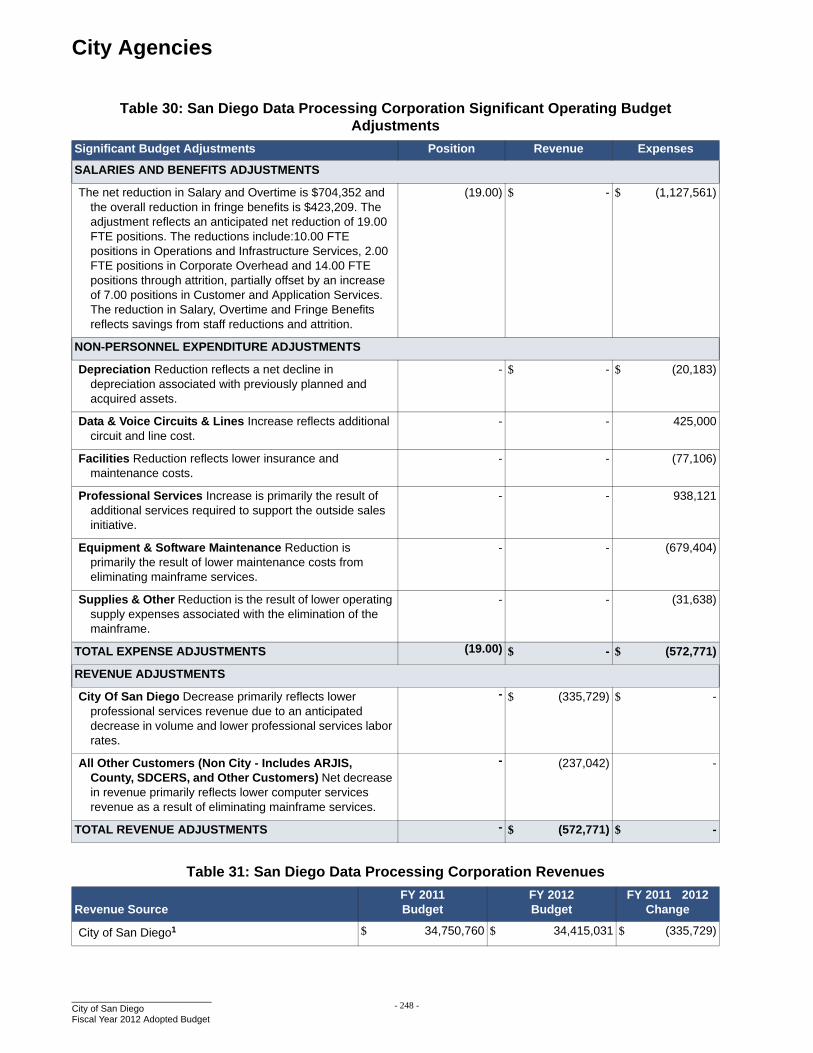
-
City Agencies
Table 30: San Diego Data Processing Corporation Significant Operating Budget Adjustments
Significant Budget Adjustments Position Revenue Expenses
SALARIES AND BENEFITS ADJUSTMENTS
The net reduction in Salary and Overtime is $704,352 and the overall reduction in fringe benefits is $423,209. The adjustment reflects an anticipated net reduction of 19.00 FTE positions. The reductions include:10.00 FTE positions in Operations and Infrastructure Services, 2.00 FTE positions in Corporate Overhead and 14.00 FTE positions through attrition, partially offset by an increase of 7.00 positions in Customer and Application Services. The reduction in Salary, Overtime and Fringe Benefits reflects savings from staff reductions and attrition.
(19.00) $ - $ (1,127,561)
NON-PERSONNEL EXPENDITURE ADJUSTMENTS
Depreciation Reduction reflects a net decline in depreciation associated with previously planned and acquired assets.
- $ - $ (20,183)
Data & Voice Circuits & Lines Increase reflects additional circuit and line cost.
- - 425,000
Facilities Reduction reflects lower insurance and maintenance costs.
- - (77,106)
Professional Services Increase is primarily the result of additional services required to support the outside sales initiative.
- - 938,121
Equipment & Software Maintenance Reduction is primarily the result of lower maintenance costs from eliminating mainframe services.
- - (679,404)
Supplies & Other Reduction is the result of lower operating supply expenses associated with the elimination of the mainframe.
- - (31,638)
TOTAL EXPENSE ADJUSTMENTS (19.00) $ - $ (572,771)
REVENUE ADJUSTMENTS
City Of San Diego Decrease primarily reflects lower professional services revenue due to an anticipated decrease in volume and lower professional services labor rates.
- $ (335,729) $ -
All Other Customers (Non City - Includes ARJIS, County, SDCERS, and Other Customers) Net decrease in revenue primarily reflects lower computer services revenue as a result of eliminating mainframe services.
- (237,042) -
TOTAL REVENUE ADJUSTMENTS - $ (572,771) $ -
Table 31: San Diego Data Processing Corporation Revenues
Revenue Source FY 2011 Budget
FY 2012 Budget
FY 2011 2012 Change
City of San Diego1 $ 34,750,760 $ 34,415,031 $ (335,729)
- 248 -City of San Diego Fiscal Year 2012 Adopted Budget
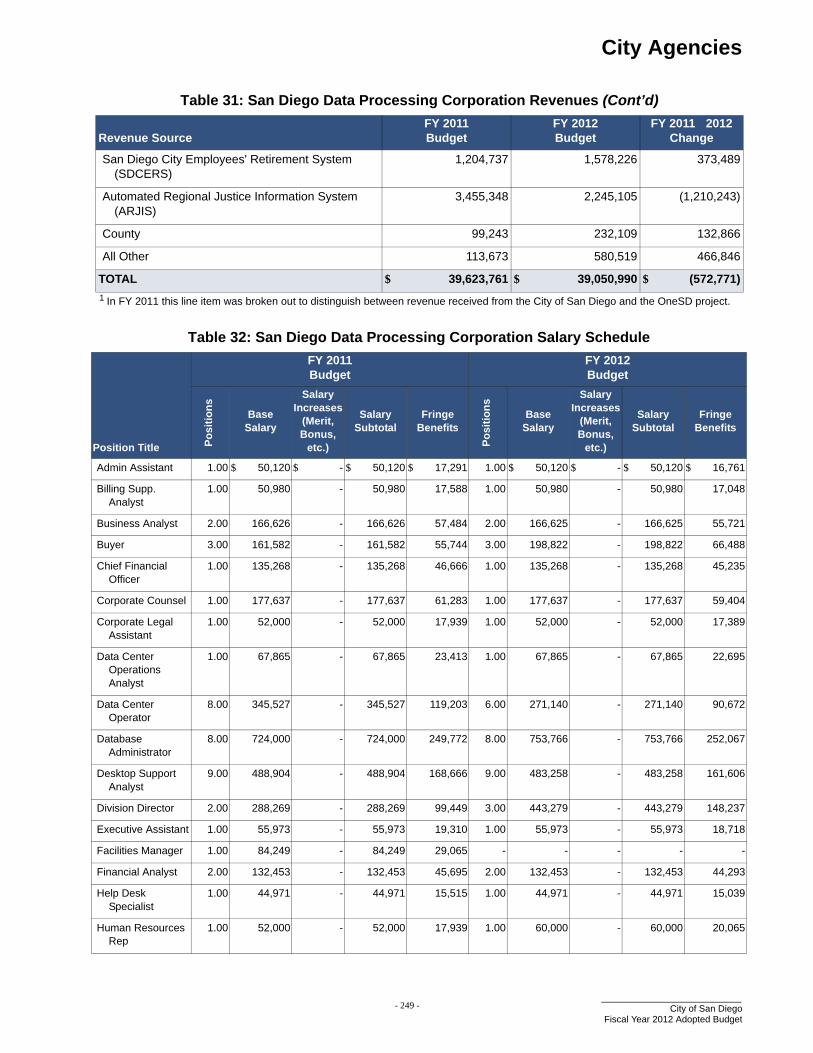
-
City Agencies
Table 31: San Diego Data Processing Corporation Revenues (Cont’d)
Revenue Source FY 2011 Budget
FY 2012 Budget
FY 2011 2012 Change
San Diego City Employees' Retirement System (SDCERS)
1,204,737 1,578,226 373,489
Automated Regional Justice Information System (ARJIS)
3,455,348 2,245,105 (1,210,243)
County 99,243 232,109 132,866
All Other 113,673 580,519 466,846
TOTAL $ 39,623,761 $ 39,050,990 $ (572,771) 1 In FY 2011 this line item was broken out to distinguish between revenue received from the City of San Diego and the OneSD project.
Table 32: San Diego Data Processing Corporation Salary Schedule
Position Title
FY 2011 Budget
FY 2012 Budget
Posi
tions Base
Salary
Salary Increases
(Merit, Bonus,
etc.)
Salary Subtotal
Fringe Benefits
Posi
tions Base
Salary
Salary Increases
(Merit, Bonus,
etc.)
Salary Subtotal
Fringe Benefits
Admin Assistant 1.00 $ 50,120 $ - $ 50,120 $ 17,291 1.00 $ 50,120 $ - $ 50,120 $ 16,761
Billing Supp. Analyst
1.00 50,980 - 50,980 17,588 1.00 50,980 - 50,980 17,048
Business Analyst 2.00 166,626 - 166,626 57,484 2.00 166,625 - 166,625 55,721
Buyer 3.00 161,582 - 161,582 55,744 3.00 198,822 - 198,822 66,488
Chief Financial Officer
1.00 135,268 - 135,268 46,666 1.00 135,268 - 135,268 45,235
Corporate Counsel 1.00 177,637 - 177,637 61,283 1.00 177,637 - 177,637 59,404
Corporate Legal Assistant
1.00 52,000 - 52,000 17,939 1.00 52,000 - 52,000 17,389
Data Center Operations Analyst
1.00 67,865 - 67,865 23,413 1.00 67,865 - 67,865 22,695
Data Center Operator
8.00 345,527 - 345,527 119,203 6.00 271,140 - 271,140 90,672
Database Administrator
8.00 724,000 - 724,000 249,772 8.00 753,766 - 753,766 252,067
Desktop Support Analyst
9.00 488,904 - 488,904 168,666 9.00 483,258 - 483,258 161,606
Division Director 2.00 288,269 - 288,269 99,449 3.00 443,279 - 443,279 148,237
Executive Assistant 1.00 55,973 - 55,973 19,310 1.00 55,973 - 55,973 18,718
Facilities Manager 1.00 84,249 - 84,249 29,065 - - - - -
Financial Analyst 2.00 132,453 - 132,453 45,695 2.00 132,453 - 132,453 44,293
Help Desk Specialist
1.00 44,971 - 44,971 15,515 1.00 44,971 - 44,971 15,039
Human Resources Rep
1.00 52,000 - 52,000 17,939 1.00 60,000 - 60,000 20,065
- 249 - City of San Diego Fiscal Year 2012 Adopted Budget
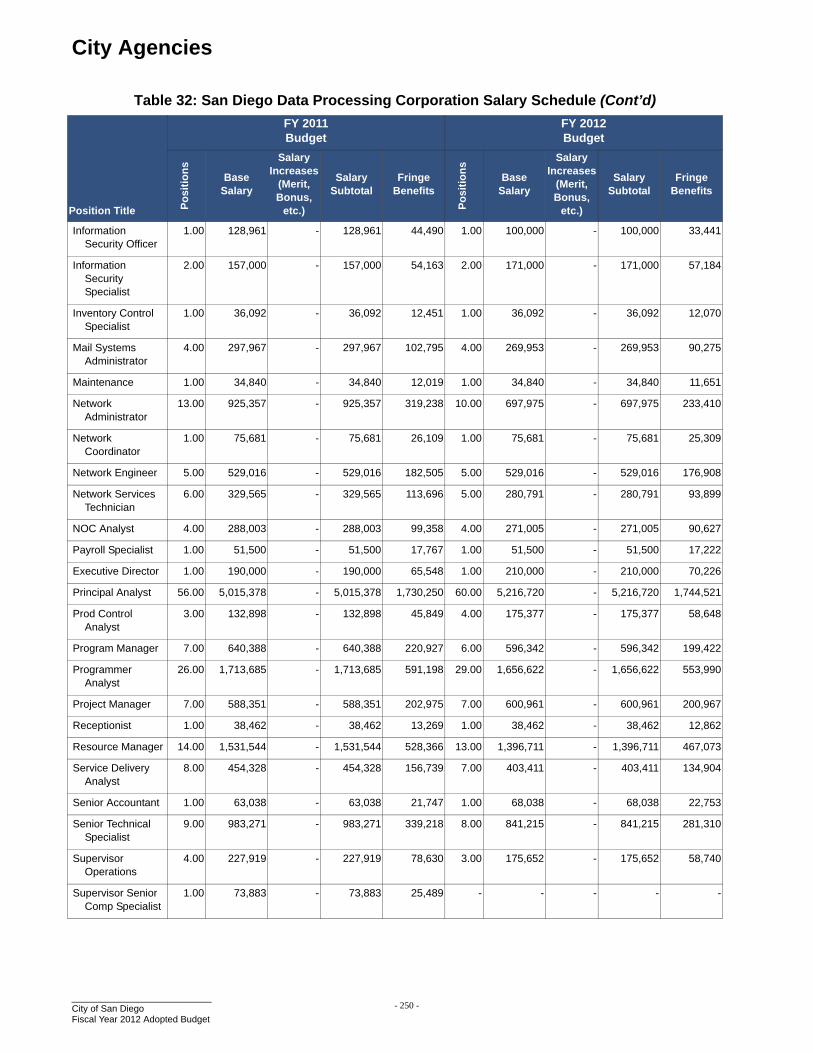
City Agencies
Table 32: San Diego Data Processing Corporation Salary Schedule (Cont’d)
Position Title
FY 2011 Budget
FY 2012 Budget
Posi
tions Base
Salary
Salary Increases
(Merit, Bonus,
etc.)
Salary Subtotal
Fringe Benefits
Posi
tions Base
Salary
Salary Increases
(Merit, Bonus,
etc.)
Salary Subtotal
Fringe Benefits
Information Security Officer
1.00 128,961 - 128,961 44,490 1.00 100,000 - 100,000 33,441
Information Security Specialist
2.00 157,000 - 157,000 54,163 2.00 171,000 - 171,000 57,184
Inventory Control Specialist
1.00 36,092 - 36,092 12,451 1.00 36,092 - 36,092 12,070
Mail Systems Administrator
4.00 297,967 - 297,967 102,795 4.00 269,953 - 269,953 90,275
Maintenance 1.00 34,840 - 34,840 12,019 1.00 34,840 - 34,840 11,651
Network Administrator
13.00 925,357 - 925,357 319,238 10.00 697,975 - 697,975 233,410
Network Coordinator
1.00 75,681 - 75,681 26,109 1.00 75,681 - 75,681 25,309
Network Engineer 5.00 529,016 - 529,016 182,505 5.00 529,016 - 529,016 176,908
Network Services Technician
6.00 329,565 - 329,565 113,696 5.00 280,791 - 280,791 93,899
NOC Analyst 4.00 288,003 - 288,003 99,358 4.00 271,005 - 271,005 90,627
Payroll Specialist 1.00 51,500 - 51,500 17,767 1.00 51,500 - 51,500 17,222
Executive Director 1.00 190,000 - 190,000 65,548 1.00 210,000 - 210,000 70,226
Principal Analyst 56.00 5,015,378 - 5,015,378 1,730,250 60.00 5,216,720 - 5,216,720 1,744,521
Prod Control Analyst
3.00 132,898 - 132,898 45,849 4.00 175,377 - 175,377 58,648
Program Manager 7.00 640,388 - 640,388 220,927 6.00 596,342 - 596,342 199,422
Programmer Analyst
26.00 1,713,685 - 1,713,685 591,198 29.00 1,656,622 - 1,656,622 553,990
Project Manager 7.00 588,351 - 588,351 202,975 7.00 600,961 - 600,961 200,967
Receptionist 1.00 38,462 - 38,462 13,269 1.00 38,462 - 38,462 12,862
Resource Manager 14.00 1,531,544 - 1,531,544 528,366 13.00 1,396,711 - 1,396,711 467,073
Service Delivery Analyst
8.00 454,328 - 454,328 156,739 7.00 403,411 - 403,411 134,904
Senior Accountant 1.00 63,038 - 63,038 21,747 1.00 68,038 - 68,038 22,753
Senior Technical Specialist
9.00 983,271 - 983,271 339,218 8.00 841,215 - 841,215 281,310
Supervisor Operations
4.00 227,919 - 227,919 78,630 3.00 175,652 - 175,652 58,740
Supervisor Senior Comp Specialist
1.00 73,883 - 73,883 25,489 - - - - -
- 250 -City of San Diego Fiscal Year 2012 Adopted Budget
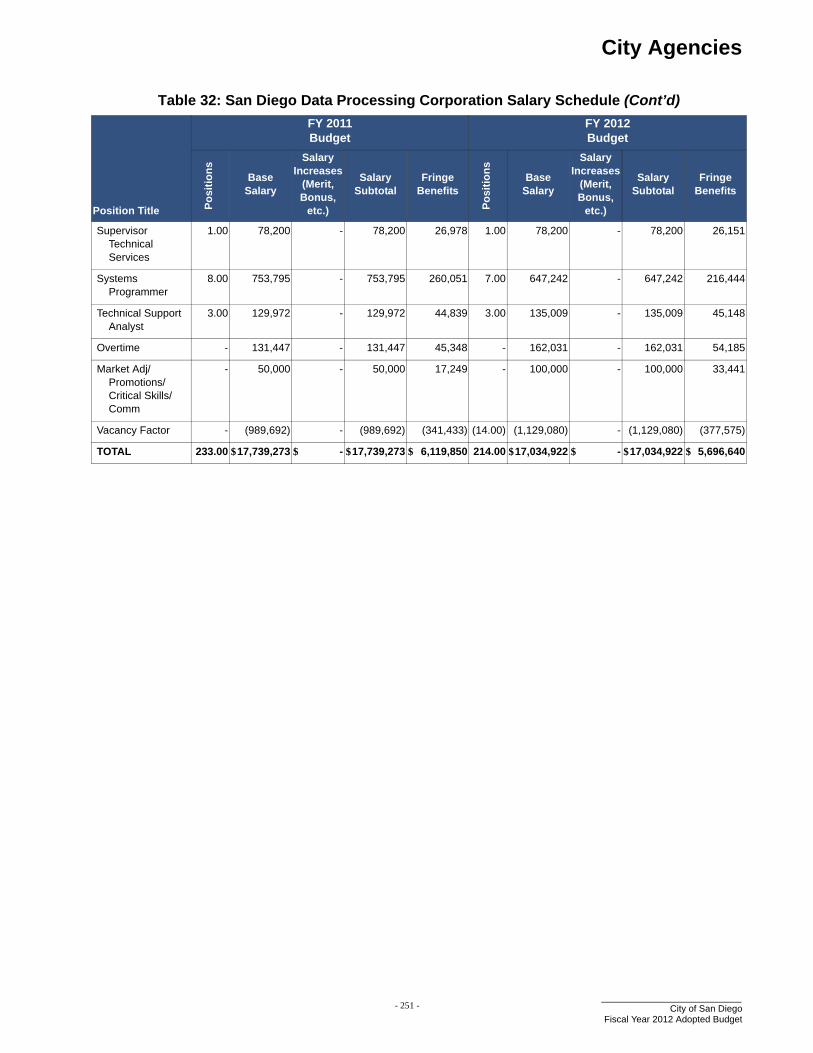
City Agencies
Table 32: San Diego Data Processing Corporation Salary Schedule (Cont’d)
Position Title
FY 2011 Budget
FY 2012 Budget
Posi
tions Base
Salary
Salary Increases
(Merit, Bonus,
etc.)
Salary Subtotal
Fringe Benefits
Posi
tions Base
Salary
Salary Increases
(Merit, Bonus,
etc.)
Salary Subtotal
Fringe Benefits
Supervisor Technical Services
1.00 78,200 - 78,200 26,978 1.00 78,200 - 78,200 26,151
Systems Programmer
8.00 753,795 - 753,795 260,051 7.00 647,242 - 647,242 216,444
Technical Support Analyst
3.00 129,972 - 129,972 44,839 3.00 135,009 - 135,009 45,148
Overtime - 131,447 - 131,447 45,348 - 162,031 - 162,031 54,185
Market Adj/ Promotions/ Critical Skills/ Comm
- 50,000 - 50,000 17,249 - 100,000 - 100,000 33,441
Vacancy Factor - (989,692) - (989,692) (341,433) (14.00) (1,129,080) - (1,129,080) (377,575)
TOTAL 233.00 $17,739,273 $ - $17,739,273 $ 6,119,850 214.00 $17,034,922 $ - $17,034,922 $ 5,696,640
- 251 - City of San Diego Fiscal Year 2012 Adopted Budget