citric acid and certain citrate salts from canada and china
TRANSCRIPT
U.S. International Trade CommissionPublication 4076 May 2009
Washington, DC 20436
Citric Acid and Certain Citrate Salts from Canada and China
Investigation Nos. 701-TA-456 and 731-TA-1151-1152 (Final)

U.S. International Trade Commission
COMMISSIONERS
Shara L. Aranoff, Chairman Daniel R. Pearson, Vice Chairman
Deanna Tanner Okun Charlotte R. Lane
Irving A. Williamson Dean A. Pinkert
Robert A. Rogowsky
Staff assigned
Address all communications to Secretary to the Commission
United States International Trade Commission Washington, DC 20436
Director of Operations
Christopher Cassise, Investigator Jeff Clark, Industry Analyst Amelia Preece, Economist
Justin Jee, Accountant Steve Hudgens, Senior Statistician
Mary Jane Alves, Attorney
George Deyman, Supervisory Investigator
U.S. International Trade CommissionWashington, DC 20436
www.usitc.gov
Publication 4076 May 2009
Citric Acid and Certain Citrate Salts from Canada and China
Investigation Nos. 701-TA-456 and 731-TA-1151-1152 (Final)

i
C O N T E N T S
Page
Determinations . . . . . . . . . . . . . . . . . . . . . . . . . . . . . . . . . . . . . . . . . . . . . . . . . . . . . . . . . . . . . . . . . 1Views of the Commission . . . . . . . . . . . . . . . . . . . . . . . . . . . . . . . . . . . . . . . . . . . . . . . . . . . . . . . . . 3Dissenting views of Chairman Shara L. Aranoff, Vice Chairman Daniel R. Pearson, and Commissioner Deanna Tanner Okun . . . . . . . . . . . . . . . . . . . . . . . . . . . . . . . . . . . . . . . . . . . . . . . 39
Part I: Introduction . . . . . . . . . . . . . . . . . . . . . . . . . . . . . . . . . . . . . . . . . . . . . . . . . . . . . . . . . . . . I-1Background . . . . . . . . . . . . . . . . . . . . . . . . . . . . . . . . . . . . . . . . . . . . . . . . . . . . . . . . . . . . . . . . . . I-1Statutory criteria and organization of the report . . . . . . . . . . . . . . . . . . . . . . . . . . . . . . . . . . . . . . I-2
Statutory criteria . . . . . . . . . . . . . . . . . . . . . . . . . . . . . . . . . . . . . . . . . . . . . . . . . . . . . . . . . . . I-2Organization of the report . . . . . . . . . . . . . . . . . . . . . . . . . . . . . . . . . . . . . . . . . . . . . . . . . . . . I-3
U.S. market summary . . . . . . . . . . . . . . . . . . . . . . . . . . . . . . . . . . . . . . . . . . . . . . . . . . . . . . . . . . I-3Summary data and data sources . . . . . . . . . . . . . . . . . . . . . . . . . . . . . . . . . . . . . . . . . . . . . . . . . . I-3Previous and related investigations . . . . . . . . . . . . . . . . . . . . . . . . . . . . . . . . . . . . . . . . . . . . . . . . I-4Nature and extent of sales at LTFV . . . . . . . . . . . . . . . . . . . . . . . . . . . . . . . . . . . . . . . . . . . . . . . I-4Nature of countervailable subsidies . . . . . . . . . . . . . . . . . . . . . . . . . . . . . . . . . . . . . . . . . . . . . . . I-6The subject merchandise . . . . . . . . . . . . . . . . . . . . . . . . . . . . . . . . . . . . . . . . . . . . . . . . . . . . . . . . I-7
Commerce’s scope . . . . . . . . . . . . . . . . . . . . . . . . . . . . . . . . . . . . . . . . . . . . . . . . . . . . . . . . . . I-7Tariff treatment . . . . . . . . . . . . . . . . . . . . . . . . . . . . . . . . . . . . . . . . . . . . . . . . . . . . . . . . . . . . I-7
The product . . . . . . . . . . . . . . . . . . . . . . . . . . . . . . . . . . . . . . . . . . . . . . . . . . . . . . . . . . . . . . . . . . I-8Description and applications . . . . . . . . . . . . . . . . . . . . . . . . . . . . . . . . . . . . . . . . . . . . . . . . . . I-8Manufacturing processes . . . . . . . . . . . . . . . . . . . . . . . . . . . . . . . . . . . . . . . . . . . . . . . . . . . . . I-10
Intermediate product . . . . . . . . . . . . . . . . . . . . . . . . . . . . . . . . . . . . . . . . . . . . . . . . . . . . . . . . . . . I-12Domestic like product issues . . . . . . . . . . . . . . . . . . . . . . . . . . . . . . . . . . . . . . . . . . . . . . . . . . . . I-13
Part II: Conditions of competition in the U.S. market . . . . . . . . . . . . . . . . . . . . . . . . . . . . . . . . II-1U.S. market segments . . . . . . . . . . . . . . . . . . . . . . . . . . . . . . . . . . . . . . . . . . . . . . . . . . . . . . . . . . II-1Channels of distribution . . . . . . . . . . . . . . . . . . . . . . . . . . . . . . . . . . . . . . . . . . . . . . . . . . . . . . . . II-2Supply and demand considerations . . . . . . . . . . . . . . . . . . . . . . . . . . . . . . . . . . . . . . . . . . . . . . . . II-3
U.S. supply . . . . . . . . . . . . . . . . . . . . . . . . . . . . . . . . . . . . . . . . . . . . . . . . . . . . . . . . . . . . . . . II-3U.S. demand . . . . . . . . . . . . . . . . . . . . . . . . . . . . . . . . . . . . . . . . . . . . . . . . . . . . . . . . . . . . . . II-8
Substitutability issues . . . . . . . . . . . . . . . . . . . . . . . . . . . . . . . . . . . . . . . . . . . . . . . . . . . . . . . . . . II-12Lead times . . . . . . . . . . . . . . . . . . . . . . . . . . . . . . . . . . . . . . . . . . . . . . . . . . . . . . . . . . . . . . . . II-12Response if subject imports were no longer available . . . . . . . . . . . . . . . . . . . . . . . . . . . . . . . II-13Factors affecting purchasing decisions . . . . . . . . . . . . . . . . . . . . . . . . . . . . . . . . . . . . . . . . . . II-14Comparisons of domestic products and subject imports . . . . . . . . . . . . . . . . . . . . . . . . . . . . . II-18
Elasticity estimates . . . . . . . . . . . . . . . . . . . . . . . . . . . . . . . . . . . . . . . . . . . . . . . . . . . . . . . . . . . . II-22U.S. supply elasticity . . . . . . . . . . . . . . . . . . . . . . . . . . . . . . . . . . . . . . . . . . . . . . . . . . . . . . . . II-23U.S. demand elasticity . . . . . . . . . . . . . . . . . . . . . . . . . . . . . . . . . . . . . . . . . . . . . . . . . . . . . . . II-23Substitution elasticity . . . . . . . . . . . . . . . . . . . . . . . . . . . . . . . . . . . . . . . . . . . . . . . . . . . . . . . II-23
Part III: U.S. producers’ production, shipments, and employment . . . . . . . . . . . . . . . . . . . . . . III-1U.S. producers . . . . . . . . . . . . . . . . . . . . . . . . . . . . . . . . . . . . . . . . . . . . . . . . . . . . . . . . . . . . . . . III-1U.S. capacity, production, and capacity utilization . . . . . . . . . . . . . . . . . . . . . . . . . . . . . . . . . . . III-2U.S. producers’ U.S. shipments and export shipments . . . . . . . . . . . . . . . . . . . . . . . . . . . . . . . . . III-3U.S. producers’ imports and purchases of imports . . . . . . . . . . . . . . . . . . . . . . . . . . . . . . . . . . . . III-5U.S. producers’ inventories . . . . . . . . . . . . . . . . . . . . . . . . . . . . . . . . . . . . . . . . . . . . . . . . . . . . . III-5U.S. employment, wages, and productivity . . . . . . . . . . . . . . . . . . . . . . . . . . . . . . . . . . . . . . . . . III-5

ii
C O N T E N T S
Page
Part IV: U.S. imports, apparent consumption, and market shares . . . . . . . . . . . . . . . . . . . . . . IV-1U.S. importers . . . . . . . . . . . . . . . . . . . . . . . . . . . . . . . . . . . . . . . . . . . . . . . . . . . . . . . . . . . . . . . . IV-1U.S. imports . . . . . . . . . . . . . . . . . . . . . . . . . . . . . . . . . . . . . . . . . . . . . . . . . . . . . . . . . . . . . . . . . IV-1Cumulation considerations . . . . . . . . . . . . . . . . . . . . . . . . . . . . . . . . . . . . . . . . . . . . . . . . . . . . . . IV-3
Fungibility . . . . . . . . . . . . . . . . . . . . . . . . . . . . . . . . . . . . . . . . . . . . . . . . . . . . . . . . . . . . . . . . IV-3Geographical markets . . . . . . . . . . . . . . . . . . . . . . . . . . . . . . . . . . . . . . . . . . . . . . . . . . . . . . . IV-5Simultaneous presence in the market . . . . . . . . . . . . . . . . . . . . . . . . . . . . . . . . . . . . . . . . . . . IV-5
Negligibility . . . . . . . . . . . . . . . . . . . . . . . . . . . . . . . . . . . . . . . . . . . . . . . . . . . . . . . . . . . . . . . . . IV-6Apparent U.S. consumption . . . . . . . . . . . . . . . . . . . . . . . . . . . . . . . . . . . . . . . . . . . . . . . . . . . . . IV-6U.S. market shares . . . . . . . . . . . . . . . . . . . . . . . . . . . . . . . . . . . . . . . . . . . . . . . . . . . . . . . . . . . . IV-8Ratio of imports to U.S. production . . . . . . . . . . . . . . . . . . . . . . . . . . . . . . . . . . . . . . . . . . . . . . . IV-8
Part V: Pricing and related information . . . . . . . . . . . . . . . . . . . . . . . . . . . . . . . . . . . . . . . . . . . . V-1Factors affecting prices . . . . . . . . . . . . . . . . . . . . . . . . . . . . . . . . . . . . . . . . . . . . . . . . . . . . . . . . . V-1
Raw material costs . . . . . . . . . . . . . . . . . . . . . . . . . . . . . . . . . . . . . . . . . . . . . . . . . . . . . . . . . . V-1Transportation costs to the U.S. market . . . . . . . . . . . . . . . . . . . . . . . . . . . . . . . . . . . . . . . . . . V-2U.S. inland transportation costs . . . . . . . . . . . . . . . . . . . . . . . . . . . . . . . . . . . . . . . . . . . . . . . . V-2Exchange rates . . . . . . . . . . . . . . . . . . . . . . . . . . . . . . . . . . . . . . . . . . . . . . . . . . . . . . . . . . . . . V-2
Pricing practices . . . . . . . . . . . . . . . . . . . . . . . . . . . . . . . . . . . . . . . . . . . . . . . . . . . . . . . . . . . . . . V-4Pricing methods . . . . . . . . . . . . . . . . . . . . . . . . . . . . . . . . . . . . . . . . . . . . . . . . . . . . . . . . . . . . V-4Sales terms and discounts . . . . . . . . . . . . . . . . . . . . . . . . . . . . . . . . . . . . . . . . . . . . . . . . . . . . V-10
Price data . . . . . . . . . . . . . . . . . . . . . . . . . . . . . . . . . . . . . . . . . . . . . . . . . . . . . . . . . . . . . . . . . . . V-11Price trends and comparisons . . . . . . . . . . . . . . . . . . . . . . . . . . . . . . . . . . . . . . . . . . . . . . . . . V-11
Lost sales and lost revenues . . . . . . . . . . . . . . . . . . . . . . . . . . . . . . . . . . . . . . . . . . . . . . . . . . . . . V-19
Part VI: Financial experience of U.S. producers . . . . . . . . . . . . . . . . . . . . . . . . . . . . . . . . . . . . . VI-1Background . . . . . . . . . . . . . . . . . . . . . . . . . . . . . . . . . . . . . . . . . . . . . . . . . . . . . . . . . . . . . . . . . . VI-1Operations on citric acid and certain citrate salts . . . . . . . . . . . . . . . . . . . . . . . . . . . . . . . . . . . . . VI-1Capital expenditures and research and development expenses . . . . . . . . . . . . . . . . . . . . . . . . . . . VI-8Assets and return on investment . . . . . . . . . . . . . . . . . . . . . . . . . . . . . . . . . . . . . . . . . . . . . . . . . . VI-8Capital and investment . . . . . . . . . . . . . . . . . . . . . . . . . . . . . . . . . . . . . . . . . . . . . . . . . . . . . . . . . VI-9
Part VII: Threat considerations and information on producers in nonsubject countries . . . . VII-1The industry in Canada . . . . . . . . . . . . . . . . . . . . . . . . . . . . . . . . . . . . . . . . . . . . . . . . . . . . . . . . . VII-2The industry in China . . . . . . . . . . . . . . . . . . . . . . . . . . . . . . . . . . . . . . . . . . . . . . . . . . . . . . . . . . VII-3Combined industry data for both subject countries . . . . . . . . . . . . . . . . . . . . . . . . . . . . . . . . . . . VII-6
U.S. importers’ inventories . . . . . . . . . . . . . . . . . . . . . . . . . . . . . . . . . . . . . . . . . . . . . . . . . . . . . . VII-6U.S. importers’ current orders . . . . . . . . . . . . . . . . . . . . . . . . . . . . . . . . . . . . . . . . . . . . . . . . . . . VII-8Antidumping and countervailing duty orders in third-country markets . . . . . . . . . . . . . . . . . . . . VII-8Information on producers in nonsubject countries . . . . . . . . . . . . . . . . . . . . . . . . . . . . . . . . . . . . VII-8
iii
C O N T E N T S
PageAppendixes
A. Federal Register notices . . . . . . . . . . . . . . . . . . . . . . . . . . . . . . . . . . . . . . . . . . . . . . . . . . . . . . . A-1B. Hearing witnesses . . . . . . . . . . . . . . . . . . . . . . . . . . . . . . . . . . . . . . . . . . . . . . . . . . . . . . . . . . . . B-1C. Summary data . . . . . . . . . . . . . . . . . . . . . . . . . . . . . . . . . . . . . . . . . . . . . . . . . . . . . . . . . . . . . . . C-1D. Largest purchasers’ data on bids and prices . . . . . . . . . . . . . . . . . . . . . . . . . . . . . . . . . . . . . . . . D-1
Note.--Information that would reveal confidential operations of individual concerns may not be publishedand therefore has been deleted from this report. Such deletions are indicated by asterisks.


1 The record is defined in sec. 207.2(f) of the Commission’s Rules of Practice and Procedure (19 CFR § 207.2(f)). 2 Chairman Shara L. Aranoff, Vice Chairman Daniel R. Pearson, and Commissioner Deanna Tanner Okundetermined that an industry in the United States is not materially injured or threatened with material injury by reasonof imports from Canada and China of citric acid and certain citrate salts.
1
UNITED STATES INTERNATIONAL TRADE COMMISSION
Investigation Nos. 701-TA-456 and 731-TA-1151-1152 (Final)
CITRIC ACID AND CERTAIN CITRATE SALTS FROM CANADA AND CHINA
DETERMINATIONS
On the basis of the record1 developed in the subject investigations, the United States InternationalTrade Commission (Commission) determines, pursuant to sections 705(b) and 735(b) of the Tariff Act of1930 (19 U.S.C. §§ 1671d(b) and 1673d(b)) (the Act), that an industry in the United States is materiallyinjured2 by reason of imports from Canada and China of citric acid and certain citrate salts, provided forin subheadings 2918.14.00, 2918.15.10, and 2918.15.50 of the Harmonized Tariff Schedule of the UnitedStates, that have been found by the Department of Commerce (Commerce) to be subsidized by theGovernment of China and to be sold in the United States at less than fair value (LTFV).
BACKGROUND
The Commission instituted these investigations effective April 14, 2008, following receipt of apetition filed with the Commission and Commerce by Archer Daniels Midland Co., Decatur, IL; Cargill,Inc., Wayzata, MN; and Tate & Lyle Americas, Inc., Decatur, IL. The final phase of the investigationswas scheduled by the Commission following notification of preliminary determinations by Commercethat imports of citric acid and certain citrate salts from China were being subsidized within the meaningof section 703(b) of the Act (19 U.S.C. § 1671b(b)) and that imports of citric acid and certain citrate saltsfrom Canada and China were being sold at LTFV within the meaning of section 733(b) of the Act (19U.S.C. § 1673b(b)). Notice of the scheduling of the final phase of the Commission’s investigations andof a public hearing to be held in connection therewith was given by posting copies of the notice in theOffice of the Secretary, U.S. International Trade Commission, Washington, DC, and by publishing thenotice in the Federal Register of December 4, 2008 (73 FR 73955). The hearing was held in Washington,DC, on April 7, 2009, and all persons who requested the opportunity were permitted to appear in personor by counsel.


1 Chairman Aranoff, Vice Chairman Pearson, and Commissioner Okun find that an industry in the United Statesis neither materially injured nor threatened with material injury by reason of imports of citric acid and certain citratesalts from Canada and China that Commerce found were sold at less than fair value and imports from China thatCommerce found were subsidized by the Government of China. Except as otherwise noted, they join the discussionand analysis in sections I to V.B of this opinion and provide the remainder of their analysis in separate views. SeeSeparate and Dissenting Views of Chairman Shara L. Aranoff, Vice Chairman Daniel R. Pearson, and CommissionerDeanna Tanner Okun. 2 ADM’s production facility is in Southport, North Carolina whereas Cargill’s production facility is in Eddyville,Iowa, and Tate & Lyle’s production facility is in Dayton, Ohio. See, e.g., Confidential Staff Report, Mem. INV-GG-036 at I-1, Table III-1 (Apr. 27, 2009), as amended by Mem. INV-GG-038 (May 7, 2009) (“CR”); Citric Acid andCertain Citrate Salts from Canada and China, Invs. Nos. 701-TA-456 and 731-TA-1151 to 1152 (Final), USITC Pub.4076 at I-1, Table III-1 (May 2009) (“PR”).
In December 1999, the same petitioners sought antidumping duty relief against imports of citric acid andsodium citrate from China. The Commission made a negative preliminary determination. At that time, theCommission found that imports from China were largely confined to the industrial segment and would not qualifyfor two to three years to supply the food and beverage segment, a segment that accounted for two-thirds of the U.S.market. The Commission also found that fairly traded non-subject imports (primarily from Israel and Austria)accounted for a majority of imports into the United States, had a significant and growing presence in the U.S.market, and were of equal quality to domestically produced products. See, e.g., Citric Acid and Sodium Citrate fromChina, Inv. No. 731-TA-863 (Prelim.), USITC Pub. 3277 (Feb. 2000). 3 These consisted of the following producers/exporters: Shandong TTCA Biochemistry Co., Ltd.; Yixing-UnionBiochemical Co., Ltd.; RZBC Group; Anhui BBCA Biochemical Co., Ltd.; Wiefang Ensign Industry Co., Ltd.;Huangshi Xinghua Biochemical Co., Ltd.; Huozhou Coal Electricity Shanxi Fenhe Biochemistry Co., Ltd.; ShiheziCity Changyun Biochemical Co., Ltd.; A.H.A. International Co., Ltd.; Laiwu Taihe Biochemistry Co., Ltd.; GansuXuejing Biochemical Co., Ltd.; Jiali International Corp.; Hunan Dongting Citric Acid Chemicals Co., Ltd.;Lianyungang Shuren Scientific Creation Import & Export Co., Ltd.; Jiangsu Gadot Nuobei Biochemical Co., Ltd.;and Changsha Glorysea Biochemicals Co., Ltd. (hereinafter “Chinese Respondents”).
3
VIEWS OF THE COMMISSION
Based on the record in the final phase of these investigations, we find that an industry in theUnited States is materially injured by reason of imports of citric acid and certain citrate salts from Canadaand the People’s Republic of China (“China”) that the U.S. Department of Commerce (“Commerce”)found to be sold at less than fair value and imports from China that Commerce found to be subsidized bythe Government of China.1
I. BACKGROUND
The petitions in these investigations were filed by the three known U.S. producers of citric acidand certain citrate salts: Archer Daniels Midland Company (“ADM”) of Decatur, IL; Cargill, Inc.(“Cargill”) of Wayzata, MN; and Tate & Lyle Americas, Inc. (“Tate & Lyle”) of Decatur, IL.2 Representatives from each petitioning company participated in the preliminary staff conference and in theCommission’s hearing accompanied by counsel. They filed joint postconference, prehearing andposthearing briefs and final comments.
In addition to petitioners, several respondents also participated in the staff conference and hearingand submitted post-conference, prehearing and posthearing briefs, and final comments. These include thefollowing: Jungbunzlauer Technology GmbH & Co. KG (“JBL Canada”), the only known producer ofsubject merchandise in Canada; a number of Chinese producers/exporters;3 and Procter & Gamble Co.(“P&G”), a U.S. purchaser and industrial user of citric acid ***. Representatives from and counsel forU.S. purchaser PepsiCo participated in the Commission’s hearing and submitted prehearing and

4 A representative of United Food Corporation, a distributor of various food products in the United States thatimports subject merchandise from China and purchases from the domestic industry, appeared at the staff conferencein the preliminary phase of these investigations. See, e.g., Transcript of May 7, 2008, Preliminary Staff Conference(“Confer. Tr.”) at 108 (Hsu for United Food Corporation). 5 See, e.g., CR at I-4. 6 See, e.g., CR at I-4. 7 See, e.g., CR at I-4. 8 See, e.g., CR at I-4. 9 19 U.S.C. § 1677(4)(A). 10 19 U.S.C. § 1677(4)(A). 11 19 U.S.C. § 1677(10). 12 See, e.g., Cleo, Inc. v. United States, 501 F.3d 1291, 1299 (Fed. Cir. 2007); NEC Corp. v. Department ofCommerce, 36 F. Supp. 2d 380, 383 (Ct. Int’l Trade 1998); Nippon Steel Corp. v. United States, 19 CIT 450, 455(1995); Torrington Co. v. United States, 747 F. Supp. 744, 749 n.3 (Ct. Int’l Trade 1990), aff’d, 938 F.2d 1278 (Fed.Cir. 1991) (“every like product determination ‘must be made on the particular record at issue’ and the ‘unique factsof each case’”). The Commission generally considers a number of factors, including the following: (1) physicalcharacteristics and uses; (2) interchangeability; (3) channels of distribution; (4) customer and producer perceptionsof the products; (5) common manufacturing facilities, production processes, and production employees; and, whereappropriate, (6) price. See Nippon, 19 CIT at 455 n.4; Timken Co. v. United States, 913 F. Supp. 580, 584 (Ct. Int’l
(continued...)
4
posthearing briefs as well as final comments. Representatives from and counsel for U.S. purchasersReckitt Benckiser (“Reckitt”) and Vertellus Specialties, Inc. (“Vertellus”) participated in theCommission’s hearing.4
Staff report data on the domestic industry are based on questionnaire responses of the threepetitioning domestic producers that accounted for all U.S. production of citric acid and certain citrate saltsin 2008.5 U.S. imports from Canada are based on JBL Canada’s importer questionnaire response ***. Canadian industry data are based on JBL Canada’s questionnaire response.6 U.S. imports from China andnon-subject countries are based on official Commerce statistics.7 Chinese industry data are based onusable foreign producer questionnaire responses of 14 companies that reported collectively accounting forapproximately 90 percent of Chinese exports to the United States in calendar years 2006, 2007, and 2008(the “period of investigation”).8
II. DOMESTIC LIKE PRODUCT
A. In General
In determining whether an industry in the United States is materially injured or threatened withmaterial injury by reason of imports of the subject merchandise, the Commission first defines the“domestic like product” and the “industry.”9 Section 771(4)(A) of the Tariff Act of 1930, as amended(“the Tariff Act”), defines the relevant domestic industry as the “producers as a whole of a domestic likeproduct, or those producers whose collective output of a domestic like product constitutes a majorproportion of the total domestic production of the product.”10 In turn, the Tariff Act defines “domesticlike product” as “a product which is like, or in the absence of like, most similar in characteristics and useswith, the article subject to an investigation.”11
The decision regarding the appropriate domestic like product/s in an investigation is a factualdetermination, and the Commission has applied the statutory standard of “like” or “most similar incharacteristics and uses” on a case-by-case basis.12 No single factor is dispositive, and the Commission
12 (...continued)Trade 1996). 13 See, e.g., S. Rep. No. 96-249 at 90-91 (1979). 14 Nippon, 19 CIT at 455; Torrington, 747 F. Supp. at 748-49; see also S. Rep. No. 96-249 at 90-91 (1979)(Congress has indicated that the like product standard should not be interpreted in “such a narrow fashion as topermit minor differences in physical characteristics or uses to lead to the conclusion that the product and article arenot ‘like’ each other, nor should the definition of ‘like product’ be interpreted in such a fashion as to preventconsideration of an industry adversely affected by the imports under consideration.”). 15 See, e.g., USEC, Inc. v. United States, 34 Fed. Appx. 725, 730 (Fed. Cir. 2002) (“The ITC may not modify theclass or kind of imported merchandise examined by Commerce.”); Algoma Steel Corp. v. United States, 688 F.Supp. 639, 644 (Ct. Int’l Trade 1988), aff’d, 865 F.3d 240 (Fed. Cir.), cert. denied, 492 U.S. 919 (1989). 16 Hosiden Corp. v. Advanced Display Mfrs., 85 F.3d 1561, 1568 (Fed. Cir. 1996) (the Commission may find asingle like product corresponding to several different classes or kinds defined by Commerce); Cleo, 501 F.3d at 1298n.1 (“Commerce’s {scope} finding does not control the Commission’s [like product] determination.”); Torrington,747 F. Supp. at 748-52 (affirming the Commission’s determination defining six like products in investigations inwhich Commerce found five classes or kinds). 17 See, e.g., CR at I-8 to I-9. Commerce explained that “Citric acid and sodium citrate are classifiable under2918.14.0000 and 2918.15.10000 of the Harmonized Tariff Schedule of the United States (“HTSUS”), respectively. Potassium citrate and calcium citrate are classifiable under 2918.15.5000 and 3824.90.9290 of the HTSUS. Blendsthat include citric acid, sodium citrate, and potassium citrate are classifiable under 3824.90.92.90 of the HTSUS.
(continued...)
5
may consider other factors it deems relevant based on the facts of a particular investigation.13 TheCommission looks for clear dividing lines among possible like products and disregards minor variations.14 Although the Commission must accept Commerce’s determination as to the scope of the importedmerchandise that is subsidized or sold at less than fair value,15 the Commission determines what domesticproduct is like the imported articles Commerce has identified.16
B. Product Description
Commerce defined the imported merchandise within the scope of these investigations as follows:
all grades and granulation sizes of citric acid, sodium citrate, and potassium citrate intheir unblended forms, whether dry or in solution, and regardless of packaging type. Thescope also includes blends of citric acid, sodium citrate, and potassium citrate; as well asblends with other ingredients, such as sugar, where the unblended form(s) of citric acid,sodium citrate, and potassium citrate constitute 40 percent or more, by weight, of theblend. The scope of the investigation also includes all forms of crude calcium citrate,including dicalcium citrate monohydrate, and tricalcium citrate tetrahydrate, which areintermediate products in the production of citric acid, sodium citrate, and potassiumcitrate. The scope of this investigation does not include calcium citrate that satisfies thestandards set forth in the United States Pharmacopeia and has been mixed with afunctional excipient, such as dextrose or starch, where the excipient constitutes at least 2percent, by weight, of the product. The scope of this investigation includes the hydrousand anhydrous forms of citric acid, the dihydrate and anhydrous forms of sodium citrate,otherwise known as citric acid sodium salt, and the monohydrate and monopotassiumforms of potassium citrate. Sodium citrate also includes both trisodium citrate andmonosodium citrate, which are also known as citric acid trisodium salt and citric acidmonosodium salt, respectively.17
17 (...continued)Although the HTSUS subheadings are provided for convenience and customs purposes, the written description of themerchandise is dispositive.” See, e.g., CR at I-9.
The Commission’s negative preliminary opinion in the 1999/2000 investigation defined the domestic likeproduct as citric acid and sodium citrate, as requested in that petition. See, e.g., USITC Pub. 3277 at 3-7. Unlike theprevious investigation, the scope of the instant investigations includes crude calcium citrate, an intermediate productresulting when one of three particular processes is used to produce citric acid. ***. See, e.g., CR at I-15. In otherparts of the world, crude calcium citrate is shipped elsewhere for conversion into its only possible use, citric acid. For that reason, petitioners included crude calcium citrate in the scope, although they are unaware of any crudecalcium citrate imports into the U.S. market at this time. See, e.g., Petitions, Vol. I at 8-9; Confer. Tr. at 58-59 (Ellisfor Petitioners), 86-87 (Oakley for ADM). The scope also includes certain blends, although petitioners are unawareof any domestic production or imports of these blends. See, e.g., Confer. Tr. at 61-63 (Ellis for Petitioners). Potassium citrate also was not included in the scope of the previous investigation, although the staff reportcorresponding to that investigation did include some information about potassium citrate. See, e.g., USITC Pub.3277 at I-2 to I-4, III-1, Table C-6. 18 See, e.g., CR at I-13 to I-16. 19 See, e.g., CR at I-13 to I-15, V-1; Petitioners’ Posthearing Br. at Exh. 2 at 4. 20 See, e.g., CR at I-13, I-14. During the lime sulfuric acid refining process ***, crude calcium citrate isproduced, but this product’s sole purpose is to be converted into citric acid. See, e.g., CR at I-11, I-15. 21 See, e.g., CR at I-16. 22 See, e.g., CR at I-16. 23 See, e.g., CR at III-2 at n.6. 24 See, e.g., CR at I-16. 25 See, e.g., Confer. Tr. at 23 (Oakley for ADM), 85 (Staloch for Cargill); CR at I-16, III-1 at n.1.
6
In the United States, citric acid, sodium citrate, and potassium citrate are produced at overlappingmanufacturing facilities by the same employees, at least for the early production stages.18 At the firstmanufacturing stage, domestic producers ferment a substrate (a starch or other sugary base such as cornstarch, molasses, dextrose, and/or high fructose corn syrup) into crude citric acid using a fermentingorganism (normally a specific mold or yeast) in a deep tank.19 At the second stage, domestic producersrecover the crude citric acid produced by fermentation and refine it by one of three processes: (i) the limesulfuric acid method; (ii) the solvent-extraction method; or (iii) the ion-exchange method.20 All threemethods yield citric acid dissolved in water, and manufacturers produce hydrous or anhydrous citric acidby adjusting the temperature of the crystallization process, using the same or separate equipment to doso.21 Citric acid can be sold as is or converted into “salts” such as sodium citrate or potassium citrate.22
Whereas, of the products covered by the scope of these investigations, Tate & Lyle only producescitric acid, both ADM and Cargill produce citric acid, sodium citrate, and potassium citrate.23 ADM andCargill produce sodium citrate and potassium citrate at the same plants used to produce citric acid. Toproduce sodium citrate, they divert a stream of crude citric acid slurry to a reactor for reaction withsodium hydroxide or sodium carbonate and then crystallization. Alternatively, the slurry is converted intopotassium citrate when reacted with potassium hydroxide or potassium carbonate.24 The same equipmentis used to produce both sodium citrate and potassium citrate, and petitioners report that only minimalcosts and a few hours are needed to switch the equipment from producing sodium to potassium citrate orvice versa. The capital equipment used to convert citric acid into sodium or potassium citrate is relativelyinexpensive. Independent converters can and do produce these citrates using finished citric acid as theinput.25
26 See, e.g., Liquid Sulfur Dioxide from Canada, Inv. No. 731-TA-1098 (Prelim.), USITC Pub. 3826 at 6 (Dec.2005) quoting Bulk Acetylsalicylic Acid (Aspirin) from China, Inv. No. 731-TA-828 (Final), USITC Pub. 3314 at 5-6 (June 2000); Sulfanilic Acid from Hungary and Portugal, Invs. Nos. 701-TA-426 and 731-TA-984 to 985 (Final),USITC Pub. 3554 at 7 n.34 (Nov. 2002); Barium Carbonate from China, Inv. No. 731-TA-1020 (Prelim.), USITCPub. 3561 at 7 n.28 (Nov. 2002). 27 See, e.g., Citric Acid and Certain Citrate Salts from Canada and China, Invs. Nos. 701-TA-456 and 731-TA-1151 to 1152 (Prelim.), USITC Pub. 4008 at 11-12 (June 2008). 28 See, e.g., Petitioners’ Prehearing Br. at 6. 29 See, e.g., Softwood Lumber from Canada, Invs. Nos. 701-TA-404 and 731-TA-928 (Final), USITC Pub. 3509at 6-15 (May 2002); Professional Electric Cutting and Sanding/Grinding Tools from Japan, Inv. No. 731-TA- 571(Final), USITC Pub. 2658 at 8-10, 49-51 (Jul. 1993) (Commission found two like products based on operatingelement – cutting tool and sanding/grinding tool – refusing to further subdivide more narrowly into 28 families oftools); Polyethylene Terephthalate Film, Sheet, and Strip from Japan and the Republic of Korea (“PET Film”), Invs.Nos. 731-TA-458 to 459 (Final), USITC Pub. 2383 at 8, 10 (May 1991) (“a continuum product without cleardividing lines between the multiple like products ... {a}lthough there are many distinct end uses for different types ofPET film ... essential characteristics are common to all PET Film”).
7
C. Analysis
Crude calcium citrate is an intermediate product in the production of citric acid, and citric acid isused to make both sodium citrate and potassium citrate. Thus, in the preliminary phase of theseinvestigations, the Commission considered whether there are clear lines dividing crude calcium citrate,citric acid, sodium citrate, and potassium citrate and/or dividing different grades and/or chemical orphysical forms of these products such that there are two or more domestic like products corresponding tothe scope of these investigations.26 In its preliminary determinations, the Commission defined a singledomestic like product that included crude calcium citrate, citric acid, potassium citrate, and sodiumcitrate.27 In the final phase of these investigations, no party advocated a different domestic like product.28
Based on the record evidence, we find no clear dividing lines among domestically producedproducts corresponding to the scope of these investigations based on chemical or physical form, grade, orproduct type.29 Whether in an intermediate form as crude calcium citrate, as citric acid, or transformedinto sodium citrate or potassium citrate, citric acid and its citrate salts come in a variety of chemical

30 Citric acid may be produced as citric acid anhydrous (C6H8O7) or as citric acid monohydrate (C6H8O7•H2O). Sodium citrate may be produced in an anhydrous or trisodium anhydrous form (Na3C6H5O7), in a dihydrate ortrisodium dihydrate form (Na3C6H5O7•2H2O), and as a monosodium (NaH2(C3H5O(COO)3). Potassium citrate maybe produced as potassium citrate monohydrate or tripotassium citrate monohydrate (K3C6H5O7•H2O) andmonopotassium citrate (KH2C6H5O7). Crude calcium citrate may be produced as tricalcium citrate (Ca3(C6H5O7)2),dicalcium citrate (Ca2H2(C3H5O)(COO)3•H2O), and tricalcium citrate tetrahydrate (Ca3(C6H5O7)2(COO)3•4H2O). See, e.g., Petitions, Vol. I at 6. 31 In their dry form as odorless, translucent crystals, citric acid, sodium citrate, and potassium citrate are sold asgranular or fine granular products, with only a very small amount sold as powder. See, e.g., Confer. Tr. at 17(Oakley for ADM). A water solution of citric acid (normally a 50-percent citric acid solution) is produced and soldin the United States, and the solution can be reversed to a dry form. See, e.g., Petitions, Vol. I at 6; CR at V-5. 32 In the United States, citric acid, sodium citrate, and potassium citrate must meet Food Chemical Codex(“FCC”) standards for use in beverage and food products and U.S. Pharmacopoeia (“USP”) standards for use inpharmaceutical products. See, e.g., CR at I-12. Non-conforming products, however, may be used in industrialapplications. See, e.g., CR at II-1. 33 See, e.g., Petitions, Vol. I at 6. 34 See, e.g., CR at I-11, I-16. 35 See, e.g., CR at I-12, II-1, II-15. 36 See, e.g., CR at I-12 to I-13, II-1, II-27, II-28. 37 Particular end users prefer citric acid in anhydrous or monohydrate form, others prefer citric acid in solutionform due to limitations in their production processes, while other purchasers such as P&G purchase citric acid inmonohydrate, anyhdrous, and solution forms but can only use particular forms for particular plants, and others havespecific granulation requirements. See, e.g., CR at II-26 to II-30, IV-8; CR/PR at Table II-3 (summarizingquestionnaire responses regarding interchangeability among forms); Confer. Tr. at 103, 105, 141-45 (Smith forP&G). 38 See, e.g., CR at I-11, II-4; CR/PR at Table II-1. 39 See, e.g., Petitioners’ Prehearing Br. at 6. 40 See, e.g., Petitions, Vol. I at 15.
8
forms,30 physical forms,31 and grades.32 Physical appearance varies accordingly but all have similarchemical composition.33
Crude calcium citrate is used only to produce citric acid, and some citric acid is used to producesodium citrate or potassium citrate.34 Although citric acid, sodium citrate, and potassium citrate are notsubstitutable in all applications, they are used in an overlapping manner in some of the same types of end-use products as buffers, acidulants, and preservatives.35 There are some limitations in interchangeabilityamong grades (such as for use in food, beverage, or pharmaceutical applications)36 and chemical orphysical forms.37
Most domestically produced citric acid, sodium citrate, and potassium citrate is sold to end users,although crude calcium citrate is solely consumed in the process of making citric acid.38 As for domesticproducer and customer perceptions, all domestic producers assert that citric acid, sodium citrate,potassium citrate, and crude calcium citrate are part of the same domestic like product.39 Citric acid,sodium citrate, and potassium citrate are treated as part of a single industry in studies such as the August2006 Chemical Economics Handbook Marketing Research Report on Citric Acid conducted by SRIConsulting.40 Some customers purchase more than one chemical or physical form, and others have
41 See, e.g., CR at II-26 to II-30, IV-8; CR/PR at Table II-3 (summarizing questionnaire responses regardinginterchangeability among forms), Table II-5 (summarizing importance of various purchase factors); Confer. Tr. at103, 105, 141-45 (Smith for P&G). 42 See, e.g., CR at I-13 to I-16. 43 Dry forms are typically packaged in 50-pound or 25-kilogram polyethylene lined bags or in super sack bagstypically containing 500 to 2,000 pounds. Citric acid sold in solution form is not packaged, but is instead shipped in200- to 275-pound drums, or in rail cars or tank trucks. See, e.g., CR at I-16. 44 Fine granular citric acid is priced somewhat higher than granular citric acid, and citric acid is somewhat higherpriced than sodium citrate but somewhat lower priced than potassium citrate. See, e.g., Confidential Staff Reportfrom Preliminary Phase, Mem. INV-FF-060 at Table V-1 (granular), Table V-2 (fine granular) (May 22, 2008);USITC Pub. 4008 at Table V-1 (granular), Table V-2 (fine granular); CR/PR at Table III-1. CR/PR at Tables V-4 toV-8. Citric acid sold in an industrial-grade solution that is 50 percent citric acid and 50 percent water is usuallypriced at about 50 percent of the equivalent dry price. See, e.g., CR at V-5. Anyhdrous citric acid costs about ninepercent more than the monohydrate form due to the presence of nine percent water in the monohydrate version. See,e.g., CR at V-5. 45 For convenience, we use the term “citric acid and certain citrate salts” hereinafter to refer to the collectivegrouping of citric acid (crude and finished), sodium citrate, and potassium citrate. 46 19 U.S.C. § 1677(4)(A). 47 See, e.g., CR at III-1. Although no party made any related party arguments in the preliminary or final phase ofthese investigations, the record indicates that domestic producer *** imported subject merchandise from ***. See,e.g., CR/PR at Table III-4. As such, *** is a related party. We do not, however, find appropriate circumstancesexist to exclude *** from the domestic industry. The company imported *** dry pounds of subject merchandisefrom ***. See, e.g., CR at III-6 n.8; CR/PR at Table III-4. In the preliminary phase of these investigations, ***reported that it ***. See, e.g., Mem. INV-FF-060 at Table III-4 n.1; USITC Pub. 4008 at Table III-4 n.1. ***imports from *** were relatively small, equivalent to *** percent of the subject merchandise imported from *** or*** percent of *** U.S. production ***. See, e.g., CR/PR at Table III-4, Table C-1. Its imports of subjectmerchandise were ***. See, e.g., CR/PR at Table III-4. For all of these reasons, we do not find appropriate
(continued...)
9
handling requirements developed over time but could switch between chemical or physical forms orgrades in some situations.41
In the United States, citric acid, sodium citrate, and potassium citrate are produced at overlappingmanufacturing facilities by the same employees, at least for the early production stages.42 There aredifferences in how the dry and solution forms are packaged.43 There are also some differences in pricebased on the chemical and physical form and grade.44
In light of these facts and in the absence of any contrary arguments, for purposes of the finalphase of these investigations, we define one domestic like product consisting of citric acid (whether incrude form as crude calcium citrate or in finished form), sodium citrate, and potassium citrate in allchemical and physical forms and grades.45
III. DOMESTIC INDUSTRY
The domestic industry is defined as the domestic “producers as a whole of a domestic likeproduct, or those producers whose collective output of a domestic like product constitutes a majorproportion of the total domestic production of the product.”46 In defining the domestic industry, theCommission’s general practice has been to include in the industry all producers of the domestic likeproduct, whether toll-produced, captively consumed, or sold in the domestic merchant market.
Consistent with our definition of the domestic like product, we define the domestic industry asconsisting of all domestic producers of citric acid and citrate salts (i.e., ADM, Cargill, and Tate & Lyle).47
47 (...continued)circumstances exist to exclude *** from the domestic industry as a related party. 48 Before reaching the issue of whether subject imports from Canada and China are negligible, the Commissionmust first decide which data to use to measure subject and non-subject imports into the U.S. market.
In the preliminary phase of these investigations, the Commission measured the volume of subject importsfrom Canada using importer questionnaire responses in response to respondents’ concern that official Census data onimports of citric acid in solution form from Canada reflected the weight of citric acid in solution rather than theanhydrous equivalent weight reported in the questionnaires. See, e.g., USITC Pub. 4008 at 14. In the final phase ofthese investigations, absent contrary party arguments, we again measure imports from Canada using importerquestionnaire responses. See, e.g., CR at I-4.
With respect to imports from China, in the preliminary phase of these investigations, respondents reportedthat at least some of the imports from China consisted of product in monohydrate form, and they were uncertainwhether the Census data reflected the monohydrate dry form or the anhydrous equivalent weight. See, e.g., Confer.Tr. at 128-31 (Lafave for P&G, Porter for Chinese Respondents). Petitioners argued that any imports ofmonohydrate form from China were limited and asked the Commission to measure imports from China using Censusdata rather than importer questionnaire responses that they contended under-reported imports from China. See, e.g.,Petitioners’ Postconf. Br. at 23-24, Exh. 1 at 4-5. The questionnaire data appear to understate subject imports fromChina, but any overstatement of subject imports from China by official import statistics appears to be limited due tothe minimal portion of imports from China consisting of monohydrate form. See, e.g., CR at VII-5 at n.5; CR/PR atTable IV-1, Table VII-2, Table C-1. Thus, absent contrary party arguments, in the final phase of these investigationswe again measure imports from China using official import statistics. See, e.g., CR at I-4, IV-1 at n.4.
Similarly, importer questionnaire responses appear to understate imports from non-subject countriescompared to official import statistics. We again measure imports from non-subject countries using official importstatistics and note that any overstatement due to imports of monohydrate form appears to be minimal, sincequestionnaire respondents reported only limited imports of monohydrate form from non-subject countries. See, e.g.,CR/PR at Table IV-1 (questionnaire data on non-subject imports), Table C-1 (official statistics on non-subjectimports); CR at IV-1 at n.4.
Based on these data, subject imports are not “negligible” within the meaning of 19 U.S.C. § 1677(24). Subject imports from Canada and China were well above three percent of total imports for the most recent 12-monthperiod preceding the April 14, 2008, filing of the petitions for which data are available (January through December2007). Subject imports from Canada accounted for *** percent, and subject imports from China accounted for ***percent, of total imports of citric acid and certain citrate salts in that period. See, e.g., CR at IV-12. 49 19 U.S.C. § 1677(7)(G)(i). 50 Commissioner Lane notes that, with respect to fungibility, her analysis does not require such similarity ofproducts that a perfectly symmetrical fungibility is required, and she notes that this factor would be better described
(continued...)
10
IV. CUMULATION48
A. Legal Framework
For purposes of evaluating the volume and price effects for a determination of material injury byreason of the subject imports, section 771(7)(G)(I) of the Act requires the Commission to cumulatesubject imports from all countries as to which petitions were filed and/or investigations self-initiated byCommerce on the same day, if such imports compete with each other and the domestic like product in theU.S. market.49 In assessing whether subject imports compete with each other and with the domestic likeproduct, the Commission has generally considered four factors, including the following:
(1) the degree of fungibility between the subject imports from different countries andbetween imports and the domestic like product, including consideration of specificcustomer requirements and other quality-related questions;50

50 (...continued)as an analysis of whether subject imports from each country and the domestic like product could be substituted foreach other. See Separate Views of Commissioner Charlotte R. Lane, Certain Lightweight Thermal Paper fromChina, Germany, and Korea, Invs. Nos. 701-TA-451 and 731-TA-1126 to 1128 (Prelim.), USITC Pub. 3964 (Nov.2007). 51 See Certain Cast-Iron Pipe Fittings from Brazil, the Republic of Korea, and Taiwan, Invs. Nos. 731-TA-278 to280 (Final), USITC Pub. 1845 (May 1986), aff’d, Fundicao Tupy, S.A. v. United States, 678 F. Supp. 898 (Ct. Int’lTrade), aff’d, 859 F.2d 915 (Fed. Cir. 1988). 52 See, e.g., Wieland Werke, AG v. United States, 718 F. Supp. 50 (Ct. Int’l Trade 1989). 53 The SAA states that “the new section will not affect current Commission practice under which the statutoryrequirement is satisfied if there is a reasonable overlap of competition.” SAA at 848 (citing Fundicao Tupy, S.A. v.United States, 678 F. Supp. 898, 902 (Ct. Int’l Trade 1988), aff’d, 859 F.2d 915 (Fed. Cir. 1988)); see also, e.g.,Goss Graphic Sys., Inc. v. United States, 33 F. Supp. 2d 1082, 1087 (Ct. Int’l Trade 1998) (“cumulation does notrequire two products to be highly fungible”); Wieland Werke, AG, 718 F. Supp. at 52 (“Completely overlappingmarkets are not required.”). 54 Petitioners argue that the Commission should cumulate subject imports from Canada and China because thereis a reasonable overlap of competition among these imports and the domestic like product. See, e.g., Petitioners’Postconf. Br. at 2-3, 6-15; Petitioners’ Prehearing Br. at 6-10, 40-44; Petitioners’ Posthearing Br. at Exh. 1 at 19-29,Exh. 2 at 13-15, Exh. 3 at 40-42. JBL Canada and purchaser P&G argue that the Commission should not cumulatesubject imports from Canada and China based on what they assert are differences in fungibility, channels ofdistribution, simultaneous presence, and other differences that limit competition. See, e.g., P&G’s Postconf. Br. at 4,25-30; P&G’s Prehearing Br. at 64-70; JBL’s Postconf. Br. at 2, 9, 10; Confer. Tr. at 12 (Waite for JBL), 162-64,166-67 (Waite); JBL’s Prehearing Br. at 20-29. Chinese Respondents argued against cumulation in the preliminaryphase of these investigations; in the final phase, they contend that they have no basis to argue against cumulation forpurposes of the Commission’s present material injury or threat of material injury determinations. See, e.g., Confer.Tr. at 14-15 (Porter), 152-53; Chinese Respondents’ Postconf. Br. at 2, 6-13; Hearing Tr. at 256 (Cameron); ChineseRespondents’ Posthearing Br. at Exh. A at 24-25. 55 We note that JBL Canada also asserts that differences in *** are another reason not to cumulate subjectimports from Canada and China. While data obtained in investigating *** relates to causation issues more than thecumulation issue of whether there is a “reasonable overlap of competition.” See Fundicao Tupy, 678 F. Supp. at 902(“the operation of the cumulation provision does not involve a specific causation finding with respect to each
(continued...)
11
(2) the presence of sales or offers to sell in the same geographic markets of subjectimports from different countries and the domestic like product;
(3) the existence of common or similar channels of distribution for subject importsfrom different countries and the domestic like product; and
(4) whether the subject imports are simultaneously present in the market.51
While no single factor is necessarily determinative, and the list of factors is not exclusive, these factorsare intended to provide the Commission with a framework for determining whether the subject importscompete with each other and with the domestic like product.52 Only a “reasonable overlap” ofcompetition is required.53 Subject imports from Canada and China are eligible for cumulation because thepetitions concerning these subject countries were filed on the same day and none of the statutoryexceptions to cumulation applies.
B. Analysis
We now examine whether there is a reasonable overlap of competition among the domestic likeproduct, subject imports from Canada, and subject imports from China.54 55
55 (...continued)country ... .”); USX Corp. v. United States, 682 F. Supp. 60, 73 (Ct. Int’l Trade 1988) (“a decision to cumulatecannot be predicated on a determination that imports from a particular source are by themselves a cause of materialinjury.”); Bingham & Taylor Division, Virginia Industries v. United States, 627 F. Supp. 793, 796 (Ct. Int’l Trade1986) (“Congress broadly required cumulation of the injurious effects of ‘simultaneous unfair acts or practice’ ifcertain conditions are met. Congress’ rejection of the concept of ‘contributing effect’ underscores its intent thatcumulation be broadly applied, even where the impact of unfairly traded imports from one source may be minimal,‘but the combined impact is injurious.’”). 56 See, e.g., CR/PR at Table V-4 to Table V-6, Table C-2. 57 Compare, e.g., CR/PR at Table C-2 (citric acid) with, e.g., CR/PR at Table C-1 (citric acid and certain citratesalts). 58 JBL Canada does not produce sodium citrate or potassium citrate, but the domestic industry and Chineseproducers both sold sodium citrate and potassium citrate in the U.S. market. See, e.g., CR at VII-2; CR/PR at TableV-7 (sodium citrate), Table V-8 (potassium citrate). 59 See, e.g., CR at I-12, II-1, II-15. 60 See, e.g., CR at IV-7 & n.12 (indicating that *** percent of JBL Canada’s U.S. shipments in 2008 were inanhydrous form compared to *** percent for ADM, *** percent for Cargill, and *** percent for Tate & Lyle); CR atIV-1 at n.4 (imports in anhydrous form account for approximately *** percent of subject imports from Chinaaccording to questionnaire responses). 61 The relatively limited volume of subject imports of citric acid in monohydrate form from China competes in amore limited fashion with subject imports from Canada and the domestic like product. Imports of citric acid inmonohydrate form accounted for a small percentage (***) percent of subject imports from China. See, e.g., CR atIV-1 at n.4. The domestic industry and the Canadian producer do not supply citric acid in monohydrate form,although the domestic industry says it could supply monohydrate form to the few customers that want it. See, e.g.,CR at IV-7; Confer. Tr. at 67 (Christiansen for Cargill), 89-90 (Oakley for ADM, Staloch for Cargill, Ellis forPetitioners), 103-05 (Smith for P&G), 116 (Waite for JBL); JBL’s Postconf. Br. at 11 n.42; Petitioners’ PosthearingBr. at Exh. 6. Petitioners also caution that it would be easy to use citric acid in monohydrate form for a wide rangeof applications, so the limited current use of monohydrate does not mean that it could not be substituted in a fargreater amount in applications and end uses currently using citric acid in anhydrous or solution form. See, e.g.,Confer. Tr. at 90 (Anderson for Petitioners); Petitioners’ Posthearing Br. at Exh. 6 at 1-3; CR at I-16 at n.61.
12
1. Fungibility
There is considerable overlap in the chemical forms supplied to the U.S. market by the domesticindustry and producers in the subject countries, despite some differences. The domestic industry andsubject producers in both Canada and China supplied large quantities of citric acid to the U.S. marketthroughout the period of investigation.56 Citric acid accounts for the vast majority of sales of citric acidand certain citrate salts whereas sodium citrate and potassium citrate account for a small share of the U.S.market.57 With respect to the sales of the more limited quantities of sodium citrate and potassium citrate,overlap was more limited.58 Although there are some applications or end uses where sodium citrate orpotassium citrate are preferred, there are a number of applications and end uses where citric acid could beused instead of sodium citrate or potassium citrate.59
In terms of physical form, the domestic industry, the subject producer in Canada, and subjectproducers in China all at least predominantly supplied anhydrous citric acid to the U.S. market during theperiod of investigation.60 Direct overlap for sales of citric acid in monohydrate and solution forms wasmore limited. Unlike producers in Canada and the United States, Chinese producers supply limitedquantities of citric acid in monohydrate form to the U.S. market,61 and do not supply citric acid in solution
62 See, e.g., CR at IV-7 (indicating that *** U.S. importers reported importing subject product in solution formfrom China in 2008). 63 See, e.g., CR at IV-7 & nn.11-12 (indicating that *** percent of JBL Canada’s U.S. imports were in solutionform in 2008 compared to *** percent for ADM, *** percent for Cargill, and *** percent for Tate & Lyle); CR/PRat Table V-6 (pricing data for citric acid in solution form). 64 See, e.g., CR at I-10, II-27 to II-30, II-32 to II-34; CR/PR at Table II-3, Table II-5, Table II-8. There appearsto be some overlap among the domestic like product and subject imports from China and Canada for sales to P&Gfor detergent applications, notwithstanding differences in the forms of citric acid supplied from these sources to theU.S. market. See, e.g., Confer. Tr. at 103-05 (Smith), 142-44 (Smith); P&G’s Postconf. Br. at 28-29. 65 See, e.g., Petitioners’ Posthearing Br. at 8; CR at II-1, II-11, II-27, II-32 to II-37; CR/PR at Table II-2, TableII-8, Table IV-3. 66 See, e.g., CR at II-25 to II-37. U.S. and Canadian products are made from genetically modified organisms(“GMO”) whereas Chinese products are not, but the portion of the U.S. market that requires non-GMO products issmall. See, e.g., Petitioners’ Posthearing Br. at Exh. 1 at 26-27, Exh. 4 at 18; JBL’s Posthearing Br. at Exh. 8(estimating that it accounts for less than *** percent of the U.S. market and that the world-wide range is *** to ***percent). 67 See, e.g., CR/PR at Table II-6. 68 See, e.g., CR at II-28 to II-30; PepsiCo’s Prehearing Br. at 12-13. 69 See, e.g., CR/PR at Table II-3, Table IV-3; Petitioners’ Posthearing Br. at Exh. 3 at 1-2. 70 Based on data reported by questionnaire respondents on their 2008 U.S. shipments by end-use marketsegment, which understate U.S. shipments of subject merchandise from China, *** percent of all U.S. shipments ofcitric acid and certain citrate salts were for food and beverage applications (*** percent for soft drinks); *** percentwere for industrial applications (*** percent for household detergents and cleaners); *** percent were forpharmaceutical applications (*** percent for beauty and oral hygiene/cosmetics); and *** percent were for all otheror unknown applications. (Derived from CR/PR at Table IV-3). These data are consistent with data in ***, whichreported that U.S. consumption of citric acid and citrate salts in 2005 fell into four major categories: food andbeverages (*** percent); household detergent and cleaners (*** percent); pharmaceuticals (*** percent); andindustrial or other (*** percent). See, e.g., CR at II-15.
13
due to the transportation costs associated with ocean shipment.62 Due to its geographical proximity toU.S. customers, JBL Canada does supply citric acid in solution form to the U.S. market in rail cars andthus competes with the domestic industry in that respect.63 Although some end users prefer to use citricacid in monohydrate, anhydrous, or in solution form due to constraints in their production facilities and/orproduction processes, they may be able to convert the dry forms into solution, or have third parties do theconversion for them.64
We also considered quality and other non-price differences among the three sources. Producersin the United States, Canada, and China manufacture citric acid and certain citrate salts that meet qualityrequirements for sale as FCC/USP products.65 Although questionnaire respondents reported some non-price differences such as product quality among sources,66 the vast majority reported that subject importsfrom Canada and China are at least frequently if not always interchangeable with one another and withthe domestic like product.67 Although caking was reported more frequently as a problem for subjectimports from China,68 Chinese product was nevertheless sold in substantial quantities even to the highlydemanding soft drink sector, as discussed below.69
We also examined whether products produced in the United States, Canada, and China were soldfor overlapping end-use applications. The largest end-use segment of the U.S. market is food andbeverage applications (particularly for soft drink beverages), followed by industrial applications(particularly for household detergents and cleaners) and pharmaceutical applications (including for beautyand oral hygiene/cosmetics).70 The record in the final phase of these investigations shows that U.S.,

71 See, e.g., CR/PR at Table IV-3, reflecting the following overlap: Food and beverage – *** percent of thedomestic industry’s U.S. shipments in 2008 were to the food and beverage market segment (*** percent for softdrinks and *** percent for food) as compared to *** percent of U.S. shipments of subject imports from Canada (***percent for soft drinks and *** percent for food) and *** percent of reported U.S. shipments of subject imports fromChina (*** percent for soft drinks and *** percent for food); Industrial – *** percent of the domestic industry’s U.S.shipments in 2008 (*** percent for household detergents and cleaners), as compared to *** percent of U.S.shipments of subject imports from Canada (*** percent for household detergents and cleaners), and *** percent ofreported U.S. shipments of subject imports from China (*** percent for household detergents and cleaners);Pharmaceutical – *** percent of the domestic industry’s U.S. shipments in 2008 as compared to *** percent of U.S.shipments of subject imports from Canada and *** percent of reported U.S. shipments of subject imports fromChina. Petitioners note that ***. See, e.g., Petitioners’ Prehearing Br. at 35; Petitioners’ Posthearing Br. at Exh. 1 at20-21, Exh. 2 at 13-14, Exh. 4 at 19. 72 See, e.g., CR/PR at Table IV-3. 73 See, e.g., CR/PR at Table II-2 (reporting, inter alia, that during the period of investigation *** purchasedproducts made in the United States, Canada, and China, as did ***). The top purchasers of citric acid and certaincitrate salts during the period of investigation were ***, each of which reported purchasing more than *** poundsduring that period. *** pounds. See, e.g., CR at II-3 to II-5; see also, e.g., Petitioners’ Prehearing Br. at Exh. 8;Petitioners’ Posthearing Br. at Exh. 21 (showing sales of domestically produced products to purchasers of a widerange of sizes). Thus, the record refutes Chinese Respondents’ argument in the preliminary phase of theseinvestigations that subject imports from China predominantly served the smaller “mom and pop” establishments inthe United States that domestic producers do not bother or declined to serve. See, e.g., Confer. Tr. at 112-14 (Hsufor United Food Corp.); Chinese Respondents’ Postconf. Br. at 3, 10-13. 74 See, e.g., CR at II-2. 75 See, e.g., CR at II-2, IV-11. 76 See, e.g., CR at IV-11; JBL’s Postconf. Br. at 11.
14
Canadian, and Chinese products were sold for overlapping end uses.71 The only area with no reportedoverlap was for sales in a *** end-use category that accounted for about *** percent of total reportedU.S. shipments in 2008 (***), where there were sales of products from ***.72 Indeed, products producedin the United States, Canada, and China were sold to some of the same customers during the period ofinvestigation.73
In short, although there are some differences in terms of the chemical and physical forms andgrades sold by domestic, Canadian, and Chinese producers in the U.S. market, there is also considerableoverlap, particularly for anhydrous citric acid. Moreover, all three sources competed for sales of food,beverage, pharmaceutical, and industrial-grade products, including for soft-drink applications, and even tosome of the same customers. Thus, the record in the final phase of these investigations supports a findingthat U.S., Canadian, and Chinese products are fungible with one another.
2. Overlapping Geographical Markets
Petitioners sell citric acid and certain citrate salt products nationwide.74 Imports of subjectmerchandise from China entered multiple U.S. ports of entry and dispersed across the nation.75 AlthoughCanadian-produced citric acid is imported primarily through Buffalo and Detroit due to the location ofJBL Canada’s production facility, it is transported by truck or rail and competes nationwide with productsproduced in the United States and China.76 Thus, we find that the U.S., Canadian, and Chinese productsare sold in overlapping geographical markets.

77 See, e.g., CR/PR at Table II-1 (showing that for all U.S. shipments between 2006 and 2008, the portion of thedomestic industry’s shipments sent to distributors was *** percent in 2006, *** percent in 2007, and *** percent in2008 whereas the portion of the Canadian imports’ shipments sent to distributors was *** percent in 2006, ***percent in 2007, and *** percent in 2008 and the portion of the Chinese imports’ shipments sent to distributors was*** percent in 2006, *** percent in 2007, and *** percent in 2008). According to the pricing data, U.S. shipmentsof citric acid products to distributors in 2008 were only somewhat higher for products manufactured in Canada (***percent) and China (14.0) percent than in the United States (5.0 percent). See, e.g., CR at II-3. Sales of citrate saltstended to be somewhat less concentrated in sales to end users and somewhat more concentrated in sales todistributors. Based on the pricing data, the domestic industry sold *** percent of its citrate salts to end users and*** percent to distributors whereas 76.9 percent of subject imports from China were sold to end users and 23.1percent were sold to distributors. There were no U.S. sales of citrate salts made in Canada because JBL Canada doesnot produce citrate salts. See, e.g., CR at II-3. 78 See, e.g., CR at IV-11; CR/PR at Tables V-4 to V-8. 79 Chairman Aranoff, Vice Chairman Pearson, and Commissioner Okun find that an industry in the United Statesis neither materially injured nor threatened with material injury by reason of subject imports from Canada and China. Except as otherwise noted, they join the discussion and analysis in sections V.A and V.B and provide the remainderof their analysis in separate views. See Separate and Dissenting Views of Chairman Shara L. Aranoff, ViceChairman Daniel R. Pearson, and Commissioner Deanna Tanner Okun. 80 19 U.S.C. §§ 1671d(b), 1673d(b).
15
3. Channels of Distribution
Citric acid products manufactured in the United States, Canada, and China were soldpredominantly to end users but also to distributors.77 Because products produced in the United States,Canada, and China are sold to end users and distributors and, as noted above, even to some of the sameend users and distributors, we find an overlap in the channels of distribution for subject imports fromCanada and China and the domestic like product.
4. Simultaneous Presence
U.S., Canadian, and Chinese products were each present in the U.S. market in every month of theperiod of investigation.78 Thus, we find that this criterion is also met.
C. Conclusion
For the reasons discussed above, we conclude that there is a reasonable overlap of competitionbetween subject imports from Canada and China and between subject imports and the domestic likeproduct. We therefore cumulatively assess the volume and effects of subject imports from Canada andChina for our analysis of present material injury by reason of subject imports.
V. MATERIAL INJURY BY REASON OF CUMULATED SUBJECT IMPORTS79
A. Legal Standards
In the final phase of antidumping and countervailing duty investigations, the Commissiondetermines whether an industry in the United States is materially injured or threatened with materialinjury by reason of the imports under investigation.80 In making this determination, the Commission mustconsider the volume of subject imports, their effect on prices for the domestic like product, and theirimpact on domestic producers of the domestic like product, but only in the context of U.S. production

81 19 U.S.C. § 1677(7)(B)( i). The Commission “may consider such other economic factors as are relevant to thedetermination” but shall “identify each {such} factor ... and explain in full its relevance to the determination.” 19 U.S.C. § 1677(7)(B). 82 19 U.S.C. § 1677(7)(A). 83 19 U.S.C. § 1677(7)(C)(iii). 84 19 U.S.C. § 1677(7)(C)(iii). 85 19 U.S.C. §§ 1671d(a), 1673d(a). 86 Angus Chemical Co. v. United States, 140 F.3d 1478, 1484-85 (Fed. Cir. 1998) (“{T}he statute does not‘compel the commissioners’ to employ {a particular methodology}.”), aff’g 944 F. Supp. 943, 951 (Ct. Int’l Trade1996). 87 The Federal Circuit, in addressing the causation standard of the statute, observed that “{a}s long as its effectsare not merely incidental, tangential, or trivial, the foreign product sold at less than fair value meets the causationrequirement.” Nippon Steel Corp. v. USITC, 345 F.3d 1379, 1384 (Fed. Cir. 2003). This was further ratified inMittal Steel Point Lisas Ltd. v. United States, 542 F.3d 867, 873 (Fed. Cir. 2008), where the Federal Circuit, quotingGerald Metals, Inc. v. United States, 132 F.3d 716, 722 (Fed. Cir. 1997), stated that “this court requires evidence inthe record ‘to show that the harm occurred “by reason of” the LTFV imports, not by reason of a minimal ortangential contribution to material harm caused by LTFV goods.’” See also Nippon Steel Corp. v. United States,458 F.3d 1345, 1357 (Fed. Cir. 2006); Taiwan Semiconductor Industry Ass’n v. USITC, 266 F.3d 1339, 1345 (Fed.Cir. 2001). 88 Statement of Administrative Action (“SAA”) on Uruguay Round Agreements Act (“URAA”), H.R. Rep. 103-316, Vol. I at 851-52 (1994) (“{T}he Commission must examine other factors to ensure that it is not attributinginjury from other sources to the subject imports.”); S. Rep. 96-249 at 75 (1979) (the Commission “will considerinformation which indicates that harm is caused by factors other than less-than-fair-value imports.”); H.R. Rep. 96-317 at 47 (1979) (“in examining the overall injury being experienced by a domestic industry, the ITC will take intoaccount evidence presented to it which demonstrates that the harm attributed by the petitioner to the subsidized ordumped imports is attributable to such other factors;” those factors include “the volume and prices of nonsubsidized
(continued...)
16
operations.81 The statute defines “material injury” as “harm which is not inconsequential, immaterial, orunimportant.”82 In assessing whether the domestic industry is materially injured by reason of subjectimports, we consider all relevant economic factors that bear on the state of the industry in the UnitedStates.83 No single factor is dispositive, and all relevant factors are considered “within the context of thebusiness cycle and conditions of competition that are distinctive to the affected industry.”84
Although the statute requires the Commission to determine whether the domestic industry is“materially injured by reason of” unfairly traded imports,85 it does not define the phrase “by reason of,”indicating that this aspect of the injury analysis is left to the Commission’s reasonable exercise of itsdiscretion.86 In identifying a causal link, if any, between subject imports and material injury to thedomestic industry, the Commission examines the facts of record that relate to the significance of thevolume and price effects of the subject imports and any impact of those imports on the condition of thedomestic industry. This evaluation under the “by reason of” standard must ensure that subject imports aremore than a minimal or tangential cause of injury and that there is a sufficient causal, not merely atemporal, nexus between subject imports and material injury.87
In many investigations, there are other economic factors at work, some or all of which may alsobe having adverse effects on the domestic industry. Such economic factors might include non-subjectimports; changes in technology, demand, or consumer tastes; competition among domestic producers; ormanagement decisions by domestic producers. The legislative history explains that the Commission mustexamine factors other than subject imports to ensure that it is not attributing injury from other factors tothe subject imports, thereby inflating an otherwise tangential cause of injury into one that satisfies thestatutory material injury threshold.88 In performing its examination, however, the Commission need not

88 (...continued)imports or imports sold at fair value, contraction in demand or changes in patterns of consumption, trade restrictivepractices of and competition between the foreign and domestic producers, developments in technology and theexport performance and productivity of the domestic industry”); accord Mittal Steel, 542 F.3d at 877. 89 SAA at 851-52 (“{T}he Commission need not isolate the injury caused by other factors from injury caused byunfair imports.”); Taiwan Semiconductor Industry Ass’n v. USITC, 266 F.3d 1339, 1345 (Fed. Cir. 2001) (“{T}heCommission need not isolate the injury caused by other factors from injury caused by unfair imports ... . Rather, theCommission must examine other factors to ensure that it is not attributing injury from other sources to the subjectimports.” (emphasis in original)); Asociacion de Productores de Salmon y Trucha de Chile AG v. United States, 180F. Supp. 2d 1360, 1375 (Ct. Int’l Trade 2002) (“{t}he Commission is not required to isolate the effects of subjectimports from other factors contributing to injury” or make “bright-line distinctions” between the effects of subjectimports and other causes.); see also Softwood Lumber from Canada, Invs. Nos. 701-TA-414 and 731-TA-928(Remand), USITC Pub. 3658 at 100-01 (Dec. 2003) (Commission recognized that “{i}f an alleged other factor isfound not to have or threaten to have injurious effects to the domestic industry, i.e., it is not an ‘other causal factor,’then there is nothing to further examine regarding attribution to injury”), citing Gerald Metals, Inc. v. United States,132 F.3d 716, 722 (Fed. Cir. 1997) (the statute “does not suggest that an importer of LTFV goods can escapecountervailing duties by finding some tangential or minor cause unrelated to the LTFV goods that contributed to theharmful effects on domestic market prices.”). 90 S. Rep. 96-249 at 74-75; H.R. Rep. 96-317 at 47. 91 See Nippon Steel Corp., 345 F.3d at 1381 (“an affirmative material-injury determination under the statuterequires no more than a substantial-factor showing. That is, the ‘dumping’ need not be the sole or principal cause ofinjury.”). 92 Mittal Steel, 542 F.3d at 877-78; see also id. at 873 (“While the Commission may not enter an affirmativedetermination unless it finds that a domestic industry is materially injured ‘by reason of’ subject imports, theCommission is not required to follow a single methodology for making that determination ... {and has} broaddiscretion with respect to its choice of methodology.”) citing United States Steel Group v. United States, 96 F.3d1352, 1362 (Fed. Cir. 1996) and S. Rep. 96-249 at 75. 93 Commissioner Pinkert does not join this paragraph or the following four paragraphs. He points out that theFederal Circuit, in Bratsk, 444 F.3d 1369, and Mittal, held that the Commission is required, in certain circumstances,to undertake a particular kind of analysis of non-subject imports. Mittal explains as follows:
What Bratsk held is that “where commodity products are at issue and fairly traded, price-competitive, non-subject imports are in the market,” the Commission would not fulfill its obligation to consider an importantaspect of the problem if it failed to consider whether non-subject or non-LTFV imports would havereplaced LTFV subject imports during the period of investigation without a continuing benefit to thedomestic industry. 444 F.3d at 1369. Under those circumstances, Bratsk requires the Commission toconsider whether replacement of the LTFV subject imports might have occurred during the period ofinvestigation, and it requires the Commission to provide an explanation of its conclusion with respect tothat factor.
542 F.3d at 878.
17
isolate the injury caused by other factors from injury caused by unfairly traded imports.89 Nor does the“by reason of” standard require that unfairly traded imports be the “principal” cause of injury orcontemplate that injury from unfairly traded imports be weighed against other factors, such as non-subjectimports, which may be contributing to overall injury to an industry.90 It is clear that the existence ofinjury caused by other factors does not compel a negative determination.91
Assessment of whether material injury to the domestic industry is “by reason of” subject imports“does not require the Commission to address the causation issue in any particular way” as long as “theinjury to the domestic industry can reasonably be attributed to the subject imports” and the Commission“ensure{s} that it is not attributing injury from other sources to the subject imports.”92 93 Indeed, the
94 Nucor Corp. v. United States, 414 F.3d 1331, 1336, 1341 (Fed. Cir. 2005); see also Mittal Steel, 542 F.3d at879 (“Bratsk did not read into the antidumping statute a Procrustean formula for determining whether a domesticinjury was ‘by reason’ of subject imports.”). 95 Mittal Steel, 542 F.3d at 875-79. 96 Mittal Steel, 542 F.3d at 873 (quoting from Gerald Metals, 132 F.3d at 722), 875-79 & n.2 (recognizing theCommission’s alternative interpretation of Bratsk as a reminder to conduct a non-attribution analysis). 97 Commissioner Lane also refers to her dissenting views in Polyethylene Terephthalate Film, Sheet, and Stripfrom Brazil, China, Thailand, and the United Arab Emirates, Invs. Nos. 731-TA-1131 to 1134 (Final), USITC Pub.4040 (Oct. 2008), for further discussion of Mittal Steel. 98 To that end, after the Federal Circuit issued its decision in Bratsk, the Commission began to present publishedinformation or send out information requests in final phase investigations to producers in non-subject countries thataccounted for substantial shares of U.S. imports of subject merchandise (if, in fact, there were large non-subjectimport suppliers). In order to provide a more complete record for the Commission’s causation analysis, theserequests typically seek information on capacity, production, and shipments of the product under investigation in themajor source countries that export to the United States. The Commission plans to continue utilizing published orrequested information in final phase investigations in which there are substantial levels of non-subject imports. 99 We provide in our respective discussions of volume, price effects, and impact a full analysis of other factorsalleged to have caused any material injury experienced by the domestic industry. 100 Mittal Steel, 542 F.3d at 873; Nippon Steel Corp., 458 F.3d at 1350, citing U.S. Steel Group, 96 F.3d at 1357;S. Rep. 96-249 at 75 (“The determination of the ITC with respect to causation is ... complex and difficult, and is amatter for the judgment of the ITC.”).
18
Federal Circuit has examined and affirmed various Commission methodologies and has disavowed “rigidadherence to a specific formula.”94
The Federal Circuit’s decisions in Gerald Metals, Bratsk, and Mittal Steel all involved caseswhere the relevant “other factor” was the presence in the market of significant volumes of price-competitive non-subject imports. The Commission interpreted the Federal Circuit’s guidance in Bratsk asrequiring it to apply a particular additional methodology following its finding of material injury in casesinvolving commodity products and a significant market presence of price-competitive non-subjectimports.95 The additional “replacement/benefit” test looked at whether non-subject imports might havereplaced subject imports without any benefit to the U.S. industry. The Commission applied that specificadditional test in subsequent cases, including the Carbon and Certain Alloy Steel Wire Rod from Trinidadand Tobago determination that underlies the Mittal Steel litigation.
Mittal Steel clarifies that the Commission’s interpretation of Bratsk was too rigid and makes clearthat the Federal Circuit does not require the Commission to apply an additional test nor any one specificmethodology; instead, the court requires the Commission to have “evidence in the record” to “show thatthe harm occurred ‘by reason of’ the LTFV imports,” and requires that the Commission not attributeinjury from non-subject imports or other factors to subject imports.96 Accordingly, we do not considerourselves required to apply the replacement/benefit test that was included in Commission opinionssubsequent to Bratsk.
The progression of Gerald Metals, Bratsk, and Mittal Steel clarifies that, in cases involvingcommodity products where price-competitive non-subject imports are a significant factor in the U.S.market, the Court will require the Commission to give full consideration, with adequate explanation, tonon-attribution issues when it performs its causation analysis.97 98
The question of whether the material injury threshold for subject imports is satisfiednotwithstanding any injury from other factors is factual, subject to review under the substantial evidencestandard.99 Congress has delegated this factual finding to the Commission because of the agency’sinstitutional expertise in resolving injury issues.100

101 See, e.g., CR at II-14 to II-20. 102 See, e.g., CR at II-15; CR/PR at Table IV-3. 103 See, e.g., CR at II-22. 104 See, e.g., CR at II-21 to II-22. 105 See, e.g., CR/PR at Table C-1. 106 See, e.g., CR/PR at Table C-1. 107 See, e.g., CR at II-16 to II-18. 108 See, e.g., CR at II-17. The record reflected increased use of citric acid in laundry detergents to replacephosphate-based formulations and because of sales growth for ultra-concentrated liquid detergents, which containmore citric acid than powdered detergents. Others reported increased demand for potassium citrate due to increaseddemand for low-sodium food and beverages. See, e.g., CR at II-17. Other questionnaire respondents reported thepotential for increased demand for citric acid and certain citrate salts to replace phthalate plasticizers and to replacePortland cement with green cement. See, e.g., CR at II-17 to II-18. ***. See, e.g., CR at II-18. 109 See, e.g., CR/PR at Table II-1; CR at II-3. 110 See, e.g., CR at II-3.
19
B. Conditions of Competition and the Business Cycle
The following conditions of competition inform our analysis of whether there is material injury orthreat of material injury by reason of subject imports from Canada and China.
1. Demand Conditions
Demand for citric acid and certain citrate salts is derived from the demand for the products inwhich they are ultimately incorporated.101 As discussed above, the largest end-use segment of the U.S.market is food and beverage applications (particularly for soft drink beverages), followed by industrialapplications (particularly for household detergents and cleaners) and pharmaceutical applications(including for beauty and oral hygiene/cosmetics).102 Citric acid and certain citrate salts account for arelatively low share of the cost of the products in which they are used.103 There are relatively fewsubstitutes for citric acid and certain citrate salts.104
The demand for citric acid and certain citrate salts in the United States was strong and grew byapproximately *** percent between 2006 and 2008.105 During the period of investigation, demand, asmeasured by total apparent U.S. consumption (the sum of the domestic industry’s U.S. shipments andimports from subject and non-subject countries of citric acid and certain citrate salts) increased from ***dry pounds in 2006 to *** dry pounds in 2007 and *** dry pounds in 2008.106
Questionnaire respondents generally agreed that demand for citric acid and certain citrate saltsincreased during the period of investigation.107 Reasons for the increased demand included economicgrowth; citric acid’s relatively low cost; reformulation of downstream products to increase use of citricacid; increased use in detergents; sodium-reduction initiatives; new products; and increased demand forthe end-use products in which citric acid and certain citrate salts are used.108
Products manufactured in the United States and imported from Canada and China were all soldmore frequently to end users than to distributors, although domestic producers shipped a somewhat highershare of their products to end users than did importers.109 Nonetheless, some of the largest distributors ofdomestically produced products are also importers of Chinese products.110

111 See, e.g., Petitioners’ Prehearing Br. at 25-27, 37-38, Exh. 8; Petitioners’ Posthearing Br. at Exh. 1 at 21, Exh.2 at 15-17, 26-32, 38-39, Exh. 3 at 7-10, Exh. 21; JBL’s Posthearing Br. at Exh. 7; Hearing Tr. at 269 (Cameron);Confer. Tr. at 112-14 (Hsu). Sixty-nine purchasers responded to the Commission’s purchaser questionnaires, ofwhich 41 were end users and 28 were distributors. See, e.g., CR at II-3 to II-5. 112 See, e.g., CR at II-2. 113 See, e.g., CR at II-2; CR/PR at Tables II-2 and IV-5. 114 See, e.g., CR at II-4 to II-5; CR/PR at Table II-2. 115 See, e.g., CR at II-4. 116 See, e.g., CR at II-16. Fifty-three of 68 responding purchasers reported that the quantity of their purchasesvaried over the course of a year. See, e.g., CR at II-16. Twenty-five of these purchasers reported that seasonalityaccounted for these variations. See, e.g., CR at II-16. Other factors noted were sourcing customer requirements,product demand, price, and availability. See, e.g., CR at II-16. 117 (derived from CR/PR at Table IV-3). 118 See, e.g., CR at II-28 to II-30. 119 See, e.g., CR at V-11. According to the pricing data for pricing products 1 to 3, the domestic industry made*** percent of its sales pursuant to contracts compared to *** percent of its sales pursuant to spot sales. (derivedfrom CR/PR at Tables V-4 to V-6). 120 See, e.g., CR at V-6. 121 Cargill reported selling *** percent of its citric acid and citrate salt products on long-term contracts, Tate &Lyle *** percent, and ADM *** percent on long-term contracts. JBL Canada reported selling *** percent of itsproducts using long-term contracts. Seven importers of Chinese product reported using long-term contracts; five ofthese reported selling half or more of their products using long-term contracts. See, e.g., CR at V-7.
20
The parties agree that purchasers of citric acid and certain citrate salts number in the hundreds butthat the top purchasers account for a substantial portion of total purchases.111 The five largest purchasersthat provided questionnaire responses accounted for 48.3 percent of apparent U.S. consumption between2006 and 2008.112 The 12 largest purchasers accounted for 98.7 percent of purchases reported bypurchasers in these investigations and 66.9 percent of apparent U.S. consumption between 2006 and2008.113 The top purchasers based on quantities purchased are ***, each of which reported purchasingmore than *** pounds during the period of investigation. *** dry pounds, respectively.114 All otherpurchasers reported purchasing less than *** pounds of citric acid and citrate salts during the three-yearperiod from 2006 to 2008.115
Demand by beverage manufacturers peaks between April and August of each year.116 Sales tobeverage manufacturers accounted for over one-quarter of combined U.S. shipments of products producedin the United States, Canada, and China.117 Respondents and some responding purchasers asserted thatdue to limitations in their manufacturing equipment, beverage manufacturers, particularly soft-drinkmanufacturers, required anhydrous citric acid that did not “cake” or clog their machinery.118
Domestic producers report contracting for a large portion of their sales in the final quarter of eachyear for shipments the following year; Cargill estimated that domestic producers contract forapproximately 80 percent of their output in November and December each year to a few very largepurchasers.119 Responding purchasers generally agreed that long-term contracts, which are typically 12months in duration in this industry, are common.120 Although there were differences in the percentage ofsales made under long-term contracts, a large portion of sales by the domestic industry, JBL Canada, andimporters of Chinese product were made through long-term contracts.121
122 See, e.g., CR at V-12. 123 See, e.g., CR at V-12. 124 See, e.g., CR at V-12. 125 See, e.g., CR at V-12. 126 See, e.g., CR at V-12. Eleven importers of Chinese products reported using short-term contracts, with threeof these reporting that 60 to 100 percent of their sales were made using short-term contracts and eight firms reportingthat 10 to 40 percent of their sales were made using short-term contracts. The duration for short-term contractsranged from 1 to 9 months. See, e.g., CR at V-12. 127 See, e.g., CR at V-13. Between 2006 and 2008, the percentages of spot sales made by ADM, Cargill, andTate & Lyle were ***, ***, and *** percent, respectively. See, e.g., CR at V-13. JBL Canada reported selling ***percent of the Canadian product on a spot basis. Six of the 16 importers of Chinese product reported selling all citricacid and certain citrate salts on a spot basis, four reported that spot sales accounted for 10 to 40 percent of sales, fivereported these were 60 to 80 percent of sales, and one indicated that spot sales accounted for 85 percent of its totalsales. See, e.g., CR at V-13. 128 See, e.g., CR/PR at Table C-1. 129 See, e.g., CR/PR at Table C-1. 130 See, e.g., CR/PR at Table C-1. 131 See, e.g., Petitions, Vol. I at 2; CR at III-4 at n.6. Petitioners ADM, Cargill, and Tate & Lyle each submittedproducer questionnaire responses, so domestic industry data reflect 100 percent of the domestic industry’sproduction. See, e.g., CR at III-1.
21
Short-term contracts ranged in duration from 1 to 9 months.122 The food and beverage industrieswere the most commonly reported end users purchasing using short-term contracts.123 Purchaserstypically reported entering into these contracts on an as-needed or quarterly basis.124 *** U.S. producers,15 importers, and 20 purchasers reported using short-term contracts for citric acid and certain citratesalts.125 JBL Canada reported selling *** percent of the Canadian product using short-term contracts.126
Although 47 of the 65 responding purchasers reported spot purchases between 2006 and 2008,the largest end users were less likely to purchase citric acid and certain citrate salts on a spot basis.127
2. Supply Conditions
There are three sources of supply in the U.S. market: domestic production, imports of subjectmerchandise from Canada and China, and imports from non-subject countries. During the period ofinvestigation, the domestic industry held the largest share of the market followed by cumulated subjectimports from Canada and China and then imports from non-subject countries. The domestic industry’sshare of the U.S. market, by quantity, fluctuated from year to year and declined from *** percent in 2006to *** percent in 2008.128 Cumulated subject imports’ share of the U.S. market, by quantity, increasedfrom *** percent in 2006 to *** percent in 2008.129 During the period of investigation, non-subjectimports’ share of the U.S. market, by quantity, decreased from *** percent in 2006 to *** percent in2008.130
a. Domestic Production
As previously stated, whereas, of the products covered by the scope of these investigations, Tate& Lyle produces only citric acid, both ADM and Cargill produce citric acid, sodium citrate, andpotassium citrate.131 All three U.S. producers are global companies that produce and sell agricultural-

132 See, e.g., Hearing Tr. at 33-34 (Poulos). 133 See, e.g., Hearing Tr. at 22 (Baroni). ADM acquired a plant in Ireland as part of that transaction, but assertsthat it had to close that facility due to competition with Chinese imports into the E.U. market. See, e.g., id. 134 See, e.g., Hearing Tr. at 33-34 (Poulos). Tate & Lyle previously operated citric acid plants in Selby, Englandand Cuernevaca, Mexico, but contended that it was forced to close the U.K. plant due to competition from unfairlytraded Chinese citric acid imports into the E.U. market. See, e.g., id. 135 See, e.g., CR/PR at Table III-1 at n.2. 136 See, e.g., CR/PR at Table III-2. 137 See, e.g., Petitioners’ Prehearing Br. at 18-19, 79-81; CR at II-7, VI-9 at n.15. 138 See, e.g., CR at VII-2. 139 See, e.g., CR at VII-2. 140 See, e.g., Confer. Tr. at 116 (Waite for JBL); JBL’s Postconf. Br. at 1-2; CR at VII-3. 141 See, e.g., Confer. Tr. at 117-18 (Waite for JBL); Hearing Tr. at 167-68 (Rainville for JBL); JBL’s PosthearingBr. at Exh. 5 at 1-2; CR at VII-3. 142 See, e.g., CR at VII-2. 143 See, e.g., CR/PR at Table VII-7. 144 See, e.g., CR at VII-5. Data regarding the Chinese industry are based on questionnaire responses from 14foreign producers that are believed to account for approximately 90 percent of Chinese export shipments to theUnited States in 2008. See, e.g., CR at VII-5. Sixteen foreign producers/exporters of subject merchandise in Chinasubmitted questionnaire responses. Two reported that they did not export subject merchandise to the United States
(continued...)
22
based products in many different countries around the world.132 ADM entered the citric acid business in1990 when it purchased the business from Pfizer.133 In addition to its Dayton, Ohio facility, Tate & Lylealso produces citric acid in Brazil and Colombia.134 Cargill ***.135 The three domestic producers have*** production capacity, with ***.136
We find that this high fixed cost, capital-intensive industry is dependent on continuousproduction of an organic product in a tightly controlled and sanitary fermentation process that cannoteasily be slowed or stopped. Slowdowns affect yields and shutdowns engender lengthy flushing andsterilization operations prior to resumption of production. Furthermore, the physical design of a moderncitric acid production facility makes it difficult to engage in incremental capacity expansion. Back-end(refining and recovery) capacity increases cannot be done in small increments whereas any increase in thefront end (fermentation) must be accompanied by increases on the back end.137
b. Imports of Subject Merchandise from Canada and China
Canada: Only one producer, JBL Canada, produces subject merchandise in Canada.138 JBLCanada is wholly owned by the Swiss firm Jungbunzlauer AG.139 Jungbunzlauer AG has been sellingcitric acid in the U.S. market since the 1970s when it supplied the market from its plant in Vienna,Austria. In 1999, it built a plant in Canada in order to supply its customers in the United States andWestern Hemisphere from a facility located closer to those markets.140 After the Canadian facilitybecame operational in 2002, JBL ceased shipping citric acid to the U.S. market from Austria and replacedthose shipments with Canadian products.141 JBL Canada produces only food-grade citric acid at itsfacility in Canada (no citrate salts).142
China: The Chinese citric acid industry is the largest in the world.143 The five largest reportingChinese producers, ***, accounted for the vast majority of reported 2008 production.144

144 (...continued)during the period of investigation, ***. See, e.g., CR at VII-5 & n.4. Chinese Respondents argue that theGovernment of China’s recent environmental protection policies caused rapid consolidation of producers of citricacid and citrate salts in China, with the number of producers falling from over 100 to below 20. See, e.g., Confer.Tr. at 131 (Porter for Chinese Respondents); Chinese Respondents’ Postconf. Br. at 1; CR at VII-5 & n.6. According to ***. See, e.g., CR at VII-7 at n.7. 145 See, e.g., CR/PR at Table IV-2. 146 See, e.g., CR at IV-4. 147 See, e.g., CR at I-13 to I-15, V-1; Petitioners’ Posthearing Br. at Exh. 2 at 4. 148 See, e.g., CR at I-13 to I-15, V-1; Petitioners’ Posthearing Br. at Exh. 2 at 4. 149 See, e.g., CR at V-1. 150 See, e.g., CR at V-1; CR/PR at Figure V-1. 151 See, e.g., CR at V-1. 152 Chairman Aranoff, Vice Chairman Pearson, and Commissioner Okun do not join the remainder of thisopinion. See Separate and Dissenting Views of Chairman Shara L. Aranoff, Vice Chairman Daniel R. Pearson, andCommissioner Deanna Tanner Okun. 153 19 U.S.C. § 1677(7)(C)(i).
23
c. Non-Subject Imports
Non-subject imports represent a declining share of the U.S. market and a declining share of totalimports. As a share of total imports into the U.S. market, non-subject imports declined from *** percentin 2006 to *** percent in 2007 and *** percent in 2008.145 In descending order of import volume in2008, non-subject sources included Israel, Colombia, Germany, Thailand, Austria, and Belgium.146
3. Raw Material Costs
The principal raw materials used to produce citric acid and certain citrate salts consist of thesubstrate (such as corn starch, molasses, dextrose and/or high fructose corn syrup) and chemicals(including calcium carbonate and sulfuric acid). Energy, including electricity and the cost of producingsteam, are other significant components of the cost of producing citric acid.147 U.S. and Canadianproducers use corn (and sometimes other feedstocks such as molasses) as the substrate.148 Chineseproducers, on the other hand, use a variety of substrates including sweet potato powder, tapioca, wheat,and corn.149 The costs of both substrates and energy generally rose since January 2006 but declined sincemid-2008.150 The prices of electric-power generation, transmission, and distribution rose by 10.6 percentfrom January 2006 to December 2008.151 152
C. Volume of the Cumulated Subject Imports
In evaluating the volume of subject imports, section 771(7)(C)(i) of the Tariff Act provides thatthe “Commission shall consider whether the volume of imports of the merchandise, or any increase in thatvolume, either in absolute terms or relative to production or consumption in the United States, issignificant.”153
Subject imports had a large and growing presence in the U.S. market during the period ofinvestigation. In absolute terms, the volume of cumulated subject imports from Canada and China

154 See, e.g., CR/PR at Table C-1. 155 See, e.g., CR/PR at Table C-1. 156 See, e.g., CR/PR at Table C-1. 157 See, e.g., CR/PR at Table C-1. 158 See, e.g., CR/PR at Table C-1. 159 See, e.g., CR/PR at Table C-1. 160 See, e.g., CR/PR at Table C-1. 161 See, e.g., CR/PR at Table C-1; see also, e.g., CR/PR at Tables V-4 to V-6 (showing ***); Petitioners’Prehearing Br. at Exh. 8 (showing ***). 162 See, e.g., CR/PR at Table C-1. 163 See, e.g., CR/PR at Table C-1. 164 See, e.g., CR/PR at Table IV-6.
24
increased from *** dry pounds in 2006 to *** dry pounds in 2007 and *** dry pounds in 2008.154 Incontrast, imports from non-subject countries had a smaller and declining presence in the U.S. market. The volume of imports from non-subject countries declined in absolute terms from 68.6 million drypounds in 2006 to 65.6 million dry pounds in 2007 and 55.6 million dry pounds in 2008.155 The domesticindustry’s U.S. shipments of citric acid and certain citrate salts increased from 369.5 million dry poundsin 2006 to 399.6 million dry pounds in 2007 and 402.5 million dry pounds in 2008.156
As discussed earlier, apparent U.S. consumption was strong and increasing throughout the periodof investigation, increasing by *** percent between 2006 and 2007 and by *** percent between 2007 and2008, for an overall increase of *** percent during the period of investigation.157
Cumulated subject imports grew at a faster pace than demand, increasing by *** percent between2006 and 2007 and by *** percent between 2007 and 2008, for an overall increase of *** percent.158 Asa result, cumulated subject imports captured an increasing share of the U.S. market, first at the expense ofnon-subject imports and by 2008 at the expense of the U.S. industry. Cumulated subject importsincreased their share of the U.S. market, by quantity, from *** percent in 2006 to *** percent in 2007 and*** percent in 2008.159 Non-subject imports’ share of the U.S. market declined progressively from ***percent in 2006 to *** percent in 2007 and *** percent in 2008.160 The domestic industry’s market shareincreased marginally from *** percent in 2006 to *** percent in 2007 and then decreased to *** percentin 2008.161 Thus, despite strong and increasing apparent U.S. consumption, the domestic industry’s U.S.shipments grew at a much slower rate than U.S. consumption between 2006 and 2008, as the domesticindustry’s U.S. shipments increased by 9.0 percent while apparent U.S. consumption increased by ***percent.162
The domestic industry’s production increased from 475.4 million dry pounds in 2006 to 488.4million dry pounds in 2007 and 507.9 million dry pounds in 2008.163 Despite this growth in domesticproduction, the ratio of cumulated subject imports from Canada and China to domestic productionincreased from *** percent in 2006 to *** percent in 2007 and *** percent in 2008.164
In summary, subject imports held between one-third and one-half of the domestic marketthroughout the period of investigation. Their quantity and market share grew steadily. The domesticindustry’s shipments and production rose at a pace well below the rate at which consumption increased;thus, the domestic industry was unable to take full advantage of exceptionally strong demand conditions. As discussed below in Section V.D (Price Effects), the large and growing subject import volume stifledthe domestic producers’ ability to obtain price increases necessary to compensate for increased productioncosts.
165 19 U.S.C. § 1677(7)(C)(ii). 166 See, e.g., Petitioners’ Prehearing Br. at 11-12; Petitioners’ Posthearing Br. at 8; Hearing Tr. at 22 (Baroni), 34(Poulos); Chinese Respondents’ Postconf. Br. at 38; Hearing Tr. at 17-18, 20, 287 (Cameron). 167 See, e.g., CR at II-22. There are relatively few substitutes for citric acid and certain citrate salts, andquestionnaire respondents reported that the prices of these substitutes did not affect the price of citric acid andcertain citrate salts. See, e.g., CR at II-21 to II-22. 168 See, e.g., CR/PR at Table II-4. 169 See, e.g., CR/PR at Table V-4 to V-6, Table V-2. Citric acid in solution form *** imported from China,although U.S. and Canadian producers sold citric acid in solution form to the U.S. market. Nevertheless, the recordreflects that end users can convert dry forms into solution or have third parties perform that function for them, asdiscussed above. 170 See, e.g., CR at II-28 to II-30; PepsiCo’s Prehearing Br. at 12-13. 171 See, e.g., Petitioners’ Posthearing Br. at Exh. 3 at 1-2; CR/PR at Table II-2, Table IV-3. 172 See, e.g., Petitioners’ Posthearing Br. at 8; CR at II-1, II-11, II-27, II-32 to II-37; CR/PR at Table II-2, TableII-8, Table IV-3.
25
On this basis, we find that the volume of cumulated subject imports is significant, both absolutelyand relative to consumption and production in the United States. Moreover, we find that, during theperiod of investigation, the *** percent increase in the volume of subject imports is significant relative tothe *** percent increase in apparent U.S. consumption.
D. Price Effects of the Cumulated Subject Imports
In evaluating the price effects of the subject imports, section 771(7)(C)(ii) of the Tariff Actprovides that the Commission shall consider whether –
(I) there has been significant price underselling by the imported merchandise ascompared with the price of domestic like products of the United States, and
(II) the effect of imports of such merchandise otherwise depresses prices to a significantdegree or prevents price increases, which otherwise would have occurred, to a significantdegree.165
The record indicates that citric acid and certain citrate salts are commodities.166 Although theseproducts account for a small portion of the total cost of the products in which they are used,167 price is animportant consideration to purchasers, who also reported quality and availability to be importantconsiderations.168
In evaluating price effects, we considered quality and other non-price differences among thedomestic like product and subject imports from Canada and China. As discussed above, there wasconsiderable overlap in the chemical and physical forms of products supplied to the U.S. market by thedomestic industry and producers in the subject countries, and all three sources sold large quantities ofanhydrous citric acid.169 Although caking was reported more frequently as a problem for subject importsfrom China,170 Chinese product was nevertheless sold in substantial quantities for the same end-useapplications, to many of the same purchasers, and even to the highly demanding soft drink sector, asdiscussed above.171 Producers in the United States, Canada, and China manufacture products that meetquality requirements for sale as FCC/USP products.172 Despite some non-price differences among
173 See, e.g., CR at II-25 to II-37. 174 See, e.g., CR/PR at Table II-8. 175 See, e.g., CR/PR at Table II-6, Table II-7, Table II-8. 176 See, e.g., CR at V-17; CR/PR at Tables V-4 to V-8, Table C-1. 177 See, e.g., CR at II-14 to II-37, V-1 to V-2, V-5 to V-16; CR/PR at Tables II-2 to II-8, Table IV-3, Table V-2,Table V-3. 178 See, e.g., CR/PR at Tables V-4 to V-10 (traditional pricing data); CR at II-14 to II-37, V-1 to V-2, V-5 to V-16; CR/PR at Tables II-2 to II-8, Table IV-3, Table V-2, Table V-3 (narrative data from purchasers). 179 See, e.g., CR at II-5 at n.14; CR/PR at D-3 to D-10 and Table D-1 (bid data); CR/PR at Tables D-2 to D-4(purchaser pricing data). 180 These products are as follows: (1) citric acid, granular, in dry form in 25 kilogram and 50 pound bags,excluding all product packaged and sold as fine granular product; (2) citric acid, granular, in dry form packed in bulksacks (“supersacks”), excluding all product packaged and sold as fine granular product; (3) citric acid, in 48 to 52percent solution form; (4) sodium citrate, granular, in dry form in 25-kilogram and 50-pound bags; and (5) potassiumcitrate, granular, in dry form in 25-kilogram and 50-pound bags. See, e.g., CR at V-17. 181 See, e.g., CR at V-17. 182 The data show 139 instances of underselling at margins that ranged from less than 0.5 percent to 31.7 percentand averaged 12.7 percent, compared to 92 instances of overselling at margins that ranged from 0.4 percent to 55.7percent and averaged 15.0 percent. See, e.g., CR/PR at Table V-10. We note that higher margins of overselling
(continued...)
26
sources,173 products manufactured in the United States, Canada, and China are generally of similarquality.174 Questionnaire respondents generally reported that subject imports from Canada and China aresubstitutable for one another and for the domestic like product.175 Because producers in the United States,Canada, and China supply a product of acceptable quality and all sold large quantities to the U.S. market,we find that they competed primarily on price.
In the final phase of these investigations, the Commission tailored its collection of pricing data toreflect more precisely the conditions of competition in this industry as revealed during the preliminaryphase. Specifically, the Commission requested that importers and domestic producers report sales pricesas follows: on a delivered basis to control for differences in transportation costs; to end users anddistributors separately; for citric acid sold in solution form; and for spot and contract sales separately forthree citric acid pricing products that accounted for a large portion of the U.S. market.176 In the final-phase questionnaires, the Commission also asked a number of questions, particularly of purchasers, abouthow the U.S. market works, the negotiation process, and the role of the various players in the market.177 In addition to collecting traditional pricing data and narrative data from purchasers,178 the Commissionalso requested pricing data and bid data on the largest annual bids from those purchasers that purchasedmore than 20 million pounds of citric acid and certain citrate salts in 2006, 2007, or 2008.179 As discussedbelow, we find that these more comprehensive data portray a very different picture than the more limiteddata from the preliminary phase.
The Commission obtained usable quarterly delivered pricing data for five products sold tounrelated customers from three domestic producers, *** of subject merchandise from Canada, and 21importers of subject merchandise from China.180 Pricing data reported in the final phase of theseinvestigations by these firms accounted for approximately 56.3 percent of the domestic industry’s U.S.shipments of citric acid and certain citrate salts, *** percent of U.S. shipments of subject imports fromCanada, and 60.0 percent of U.S. shipments of subject imports from China in 2008.181
Taken as a whole, these pricing data show mixed under- and over-selling, with undersellingoccurring in *** percent of all observations.182 183 Because the domestic industry’s sales were highly

182 (...continued)occurred after the first quarter of 2008 following the filing of the petition, and the range of overselling through thefirst quarter of 2008 was much narrower, particularly for contract sales. See, e.g., CR/PR at Figures V-3 and V-4. 183 Commissioner Lane and Commissioner Pinkert note that, in the preliminary phase of these investigations themore limited pricing data collected indicated that: “subject imports were consistently priced higher than the domesticlike product in the U.S. market, at substantial margins ... .” USITC Pub. 4008 at 35. In the preliminary phase, therewas underselling in only 12 of 104 price comparisons, accompanied by considerable overselling margins (as high as120.6 percent, and at least ten percent in 32 quarters for subject imports from China). USITC Pub. 4008 at 35. Instark contrast to the limited pricing data in the preliminary phase, the additional and more detailed pricing data in thefinal phase of these investigations show underselling in 139 of 231 comparisons, with much smaller margins ofoverselling, particularly in the contracts categories and for prices through the first quarter of 2008. See, e.g., CR/PRat Tables V-4 to V-8 and Table V-10. 184 (derived from CR/PR at Table V-4 to Table V-6). 185 (derived from CR/PR at Table V-4 to Table V-6) (indicating that 77.7 percent of the domestic industry’s salesof pricing products 1 to 3, by quantity, were oversold by subject imports from either China or Canada and that 58.9percent of sales of pricing products 1 to 3 imported from Canada oversold the domestic like product compared to58.4 percent of sales of pricing products 1 to 3 imported from China). 186 See, e.g., CR/PR at Tables V-4 to Table V-6 showing the following price increases:
* * * * * * *
See also, e.g., Hearing Tr. at 15 (Ellis), 55 (Lorusso), 114 (Szamosszegi), 139, 158 (Anderson). 187 Overall, the data show underselling in 44 percent of comparisons, representing 45 percent of subject importquantities and 30 percent of the domestic industry’s quantities for contract sales of pricing products 1 to 3. Forsubject imports from China alone, underselling occurred in 64 percent of comparisons, representing 58 percent ofsubject import quantities from China and 53 percent of the domestic industry’s quantities for contract sales of pricingproducts 1 to 3 where there were comparisons. (derived from CR/PR at Tables V-4 to V-6). 188 19 U.S.C. § 1677(I). Although we have separately analyzed the pricing data from before and following thefiling of the petitions, we do not discount the data beginning in late 2007, as requested by petitioners. 189 See, e.g., CR/PR at Tables V-4 to V-6.
27
concentrated in contract transactions, we have paid particular attention to those data. Like the data as awhole, those data show a mixed picture of underselling and overselling, with 31 instances of undersellingand 51 instances of overselling.184 Most of the volume of reported import and domestic contract sales wasassociated with overselling comparisons.185
In addition, the record indicates that the filing of the petitions in April 2008 affected prices in theU.S. market; subject import prices, even for contract sales (particularly for China), rose substantially overthe course of 2008.186 We note that the relative instances of overselling and underselling changed afterthe filing of the petitions in the first quarter of 2008, and that underselling was much more prevalent priorto that time. Again paying particular attention to the contract transactions, breaking down the above-cited31 instances of underselling and 51 instances of overselling, the data reveals that through the first quarterof 2008, the contract transactions reflected 28 instances of underselling and 35 instances of overselling,which is more balanced.187 In the last three quarters of 2008, contract transactions reflected only 3instances of underselling and 16 instances of overselling.188 Moreover, the margins of overselling, whichhad been fairly small through the first quarter of 2008 and, as we explain below, had been acting as a capor ceiling on domestic prices, tended to widen during the last three quarters of 2008.189 This widening ofmargins or raising of the ceiling on domestic prices after the filing of the petitions did not benefit thedomestic industry in 2008 as much as might be expected, due to the portion of the domestic industry’s

190 We note that prices for the domestic like product increased by much less than prices of subject imports in2008 because most domestic sales are subject to annual fixed-price contracts whose prices are set in the final quarterof the preceding year whereas a larger proportion of sales of subject imports are made pursuant to short-termcontracts, long-term contracts set at less regular intervals, and spot sales. See, e.g., CR at V-11 to V-13. Moreover,some purchasers indicated that Chinese suppliers are less likely to adhere to contract price terms. See, e.g., CR at V-6. As a result, the prices of subject imports reacted sooner to the April 2008 filing of the petitions in theseinvestigations than prices of the domestic like product. 191 See, e.g., CR/PR at Table II-8 (for those purchasers reporting subject imports to be higher or lower-pricedthan the domestic like product, more (33 purchasers) reported subject imports to be lower priced than reporteddomestically produced products to be lower priced (14 purchasers)). 192 We have also examined data submitted by purchasers (predominantly large purchasers) on the prices theypaid for citric acid products produced in the United States and imported from the subject countries. See, e.g., CR/PRat Table D-2 to D-4. These data show mostly underselling by the subject imports and thus, if anything, furthersupport a finding of significant underselling. We recognize that the purchaser pricing data must be taken intoaccount carefully, because the purchaser pricing data on subject imports is not precisely comparable to the purchaserpricing data on the domestic like product.
We have also examined data submitted by purchasers on their largest annual bids during the period ofinvestigation. See, e.g., CR/PR at Table D-1; CR at D-9 to D-10. These data are consistent with our analysis to theextent that they also show that subject imports from Canada and China were priced at similar levels to, and competedfor, sales to large purchasers against domestically produced citric acid and certain citrate salt products. See, e.g., id. 193 See, e.g., CR/PR at Tables V-4 to V-8. 194 See, e.g., CR at V-1. 195 See, e.g., CR/PR at Table C-1. 196 The domestic industry’s average unit net sales value was $0.44 in 2006, $0.44 in 2007, and $0.53 in 2008compared to average unit COGS of $0.44 in 2006, $0.46 in 2007, and $0.52 in 2008. See, e.g., CR/PR at Table C-1.
28
sales that were under annual contracts.190 Finally, we observe that most purchasers considered subjectimports to be lower-priced than the domestic like product.191
Overall, we find that the pricing data present a varied picture that is consistent with a finding ofsignificant underselling, particularly for a commodity-type product for which large price differenceswould not be expected. Moreover, as is evident from Figures V-3 through V-5 of the Staff Report,subject import prices and domestic prices for contract sales to end users, which accounted for a majorityof the domestic and import volume, were nearly the same and tracked closely. As discussed below, theimport prices were sufficiently low to prevent price increases needed by the domestic industry tocompensate for increased costs.192 Subject import pricing acted essentially as a cap or ceiling on the pricelevels that could be obtained by domestic producers. The underselling that occurred was significantbecause it established the cap or ceiling at low levels.
Prices of the domestic like product and subject merchandise from Canada and China weregenerally stable in the earlier portion of the period of investigation and were higher at the end of theperiod of investigation.193 Accordingly, we do not find that cumulated subject imports from Canada andChina significantly depressed prices of the domestic like product in the U.S. market.
We have also considered whether cumulated subject imports from Canada and China suppressedprices of the domestic like product to a significant degree. Consistent with increasing substrate andenergy costs,194 the domestic industry’s average unit cost of goods sold (“COGS”) increased from $0.44per dry pound in 2006 to $0.46 per dry pound in 2007 and $0.52 per dry pound in 2008.195 During thistime, the domestic industry’s average unit sales value was only slightly, if at all, higher than its unitCOGS, not even factoring in selling, general, and administrative costs.196 Although market demand wasstrong and increasing, the domestic industry was not able to increase its prices to levels that weresufficient to cover the increase in its costs. Consequently, the domestic industry experienced a cost-price
197 See, e.g., CR/PR at Table C-1. 198 Commissioner Lane notes that, in the preliminary phase of these investigations, COGS as a share of net saleswas 96.3 percent in 2005 and 101.1 percent in 2007, but improved significantly to 92.8 percent in the first quarter of2008. Based on that information, Commissioner Lane found that there was only “some indication of pricesuppression.” USITC Pub. 4008 at 36. The complete record for the final phase of these investigations, however,shows COGS as a share of net sales was 98.6 percent in 2006, 103.6 percent in 2007, and 97.9 percent in 2008. Thus, it is now clear that the domestic industry experienced a significant cost-price squeeze from 2006 to 2007 andwas not able to raise prices in 2008 to sufficiently cover costs such that it could operate at a reasonable level ofprofitability. 199 See, e.g., CR/PR at Table V-4 to V-8. 200 See, e.g., CR/PR at Figure V-1. 201 Compare, e.g., Mem. INV-FF-060 at Table C-1 with, e.g., CR/PR at Table C-1. 202 See, e.g., CR/PR at Table V-4 (pricing product 1) (contract sales to end users, Oct.-Dec. 2006: Canada $***,China $***, U.S. in Jan.-Mar. 2007: $***); Table V-5 (pricing product 2) (contract sales to end users, Oct.-Dec.2006: Canada $***, China $0.39, U.S. in Jan.-Mar. 2007: $0.47); Table V-6 (pricing product 3) (contract sales toend users, Oct.-Dec. 2006: Canada $***, U.S. in Jan.-Mar. 2007: $0.44). 203 See, e.g., CR/PR at Table C-1 (showing ratio of COGS to net sales of *** percent in 2007).
29
squeeze, as its unit COGS as a share of unit net sales was very high throughout the period of investigationand increased from 98.6 percent in 2006 to 103.6 percent in 2007 before declining to 97.9 percent in2008.197 198
We next examined the extent to which subject imports played a role in the cost-price squeezeexperienced by the industry. In particular, we considered price and market developments that contributedto the industry’s contract price levels for 2007 and 2008, the most recent contract years within the periodof investigation. As described above, in the fourth quarter of each year the domestic industry negotiatesannual fixed-price contracts for nearly all of its sales volumes for the upcoming year.
The domestic industry’s contract prices for 2007 were relatively unchanged from 2006.199 Theflat price levels occurred despite the fact that the price of corn, which represents the industry’s largestsingle cost item, increased by more than 50 percent from September 2006 to November 2006.200 The flatindustry prices were a key reason for the spike in the COGS/net sales ratio experienced by the domesticindustry in 2007.
We find that the domestic industry’s inability to obtain higher prices in 2007, despite the largeincrease in corn prices and growing demand for citric acid, was due in significant part to the large andgrowing presence of relatively low-priced subject imports. Subject imports had increased in market shareby *** percentage points from 2005 to 2006.201 Subject import prices in late 2006 for contract sales, andeven certain spot sales, were frequently near, at, or below the low levels that domestic producers obtainedfor their 2007 contracts.202 The increased presence of low-priced subject imports left the domesticindustry in no position to demand 2007 prices sufficient to offset surging corn costs. Had the domesticindustry insisted on higher prices reflective of its increasing raw materials costs, its prices would haveexceeded the prices of subject imports. Even though many of the resulting subject import prices for the2007 contracts were at, or somewhat above, domestic prices, the pricing pressure from the large andincreasing volume of cumulated subject imports made it impracticable for the domestic industry toincrease its prices to the degree that would have been required to recover its increasing productioncosts.203
We do not agree with respondent’s position that the domestic industry was unable to recover itsincreasing raw material costs in 2007 because of contracts negotiated near the end of 2006 that did not

204 See, e.g., Chinese Respondents’ Prehearing Br. at 44; P&G’s Prehearing Br. at 42-43. 205 See, e.g., CR/PR at Figure V-1. 206 See, e.g., CR/PR at Figure I-1, Tables V-4 to V-8, Tables D-1 to D-4. 207 See, e.g., CR/PR at Table V-4 (pricing product 1) (contract sales to end users, Oct.-Dec. 2007: Canada $***,China $***, U.S. $***; U.S. in Jan.-Mar. 2008: $***); Table V-5 (pricing product 2) (contract sales to end users,Oct.-Dec. 2007: Canada $***, China $***, U.S. $***; U.S. in Jan.-Mar. 2008: $0.52); Table V-6 (pricing product3) (contract sales to end users, Oct.-Dec. 2007: Canada $***, U.S. $0.44; U.S. in Jan.-Mar. 2008: $0.51). 208 See, e.g., CR/PR at Tables V-4 to V-6. Per-pound prices for contracts to end users from fourth quarter 2007to first quarter 2008: pricing product 1 – U.S. $*** to $***, Canada $*** to $***, China $*** to $0.57; pricingproduct 2 – U.S. $0.47 to $0.52, Canada $*** to $***, China $*** to $***; pricing product 3 – U.S. $0.44 to $0.51,Canada $*** to $***. 209 See, e.g., CR/PR at Table C-1. 210 See, e.g., CR/PR at Table C-1. 211 See, e.g., Petitioners’ Prehearing Br. at 67-68; Petitioners’ Posthearing Br. at 4-5.
30
account for an unexpected and significant increase in corn prices in 2007.204 In fact, corn prices rosesubstantially in the latter part of 2006. Although corn prices remained relatively flat and low during thefirst nine months of 2006, prices increased by 28 percent between September 2006 and October 2006, andanother 21 percent in November 2006. The October 2006 spot price for Central Illinois yellow corn was33 percent higher than the average price over the first nine months of 2006. By November 2006 the spotprice was a startling 61 percent higher than the average price over the first nine months of 2006.205 Thus,the prospects for increases in corn prices above the average 2006 levels were not unknown to thedomestic citric acid industry in the last quarter of 2006 when it was negotiating its 2007 contracts. Yetthe domestic industry was unable to secure adequate price increases to recover the 2007 increase in rawmaterial costs.
With regard to the 2008 contracts, after an extended period of high corn prices in 2007 anddeeper operating losses, the domestic industry was able to secure meaningful but inadequate priceincreases from its customers.206 We find that subject imports, whose volume continued to grow sharply in2008 (by *** percent) and to take more market share (*** percentage points), played a large role inkeeping U.S. producers from obtaining sufficient price increases both to recover the cost increases of2007/2008 and to increase net operating income to more reasonable levels. Although certain subjectimport prices were rising toward the end of 2007, the prices generally remained at or near domestic pricesand were low in comparison with the domestic industry’s negotiated contract prices for 2008.207 Theincreases that the domestic industry was able to negotiate for 2008 mirrored, to a significant degree,contemporaneous increases in prices for subject imports.208 Thus, for the 2008 contract year, it appearsthat subject imports continued to establish prices that had a suppressing effect on the ability of thedomestic industry to obtain reasonable profits. At these prices, the domestic industry continued to havehigh COGS to net sales ratios and to experience significant losses, as discussed below.209 Remarkably,the domestic industry’s high COGS to net sales ratios occurred in a time of strong and increasingdemand.210
Our finding of significant price suppression is buttressed by the fact that the domestic industryobtained significantly higher prices for its 2009 contracts negotiated in the final quarter of 2008.211 Thesenegotiations took place after the filing of the petitions and after Commerce had issued its affirmativepreliminary antidumping and countervailing duty determinations. The domestic price increases that

212 See, e.g., EDIS Doc No. 402203. Purchaser input, overall, tends to confirm the price-dampening effects ofsubject imports, particularly imports from China. Most purchasers reported that the availability of Chinese producttended to reduce contract prices. See, e.g., CR at V-8 to V-10; CR/PR at Table V-1, Table V-2. In conversationswith staff regarding lost sales and lost revenue allegations, purchasers also reported price-based competition fromsubject imports from Canada and China and that the domestic industry lost sales and/or revenues to price-competitive subject imports from Canada and China, although there were relatively few fully confirmed lost salesand lost revenue allegations. See, e.g., CR at V-38 to V-52; CR/PR at Table V-11, Table V-12. 213 Commissioners Lane and Pinkert add their finding that, under the specific conditions of competition for thisindustry (whereby a large percentage of the domestic industry’s sales occur pursuant to annual contracts that areentered into well in advance), the existence and availability of significant subject producer capacity, production, andinventories enhanced the price-dampening effects of subject imports in the U.S. market. CR/PR at Table VII-4. They note in this regard that there was extensive testimony at the hearing as to the leverage enjoyed by purchasersduring contract negotiations as a result of the overhang of subject producer capacity. Hearing Tr. at 44(Christiansen), 77-78, 108-09 (Baroni), 314 (Ellis).
Commissioners Lane and Pinkert find further that the record of the final phase investigations reflectssignificantly increased interest in 2008 on the part of Chinese producers in the U.S. market (relative to the interestthat was evident during the preliminary investigation). Although the record of the preliminary investigationindicated a steady decrease in exports from China to the United States as a share of the Chinese industry’s totalshipments (as well as projections of a further year-over-year decrease from 9.3 percent in 2007 to 7.3 percent for2008), the final-phase record shows exports from China to the United States increasing as a share of total shipmentsfrom 9.4 percent in 2007 to 10.0 percent in 2008. CR/PR at Table VII-3.
Similarly, during the preliminary phase of these investigations, subject producer end-of-period inventories(which were primarily from China) were projected to be *** million pounds for 2008, but the record in the finalphase shows that subject end-of-period inventories turned out to be *** million pounds for 2008. Compare, e.g.,Mem. INV-FF-060 at Tables VII-1 and VII-2 with, e.g., CR/PR at Tables VII-1, VII-3 and VII-4. Although it is notnecessary for them to determine whether the domestic industry is imminently threatened with material injury,Commissioners Lane and Pinkert note that the increase in the immediate availability of subject imports is indicativeof such threat. 214 (derived from domestic producers’ questionnaire responses). 215 Commissioner Lane and Commissioner Pinkert note that the evidence on the record of the preliminaryinvestigations did not support a finding of a reasonable indication of significant pricing pressure from subjectimports because the pricing data showed overwhelming overselling at large margins as well as significant cost-pricegains in the first quarter of 2008. However, the evidence on the record of the final investigations, in stark contrast tothe preliminary record, shows significant underselling of substantial volumes of the domestic like product, ameaningful but inadequate cost-price gain in full-year 2008, and a causal nexus between subject imports and thedomestic industry’s poor performance, as discussed below in section V.E (Impact). Thus, it is clear that subjectimports exerted significant pricing pressure on the domestic industry throughout the period of investigation.
31
followed the retreat of subject imports from the market confirm the dampening effects of the imports ondomestic prices in 2006, 2007, and 2008.212 213
We have considered respondents’ contention that low prices obtained by the domestic industrywere due to intra-industry competition among the three domestic producers. The record does reflect that***, which ***,214 ***. Moreover, purchasers indicated that some lost sales and revenues allegationsactually reflected competition among domestic producers. Thus we find that intra-industry competitionplayed a role in the inadequate price levels obtained by domestic producers. This does not call intoquestion the record evidence showing significant pricing pressure from cumulated subject imports fromCanada and China, as described above.215 The share of purchasers reporting that the market presence ofsubject imports tended to reduce contract prices was much larger than the share reporting that the
216 According to purchasers, subject imports, in particular those from China, tended to bring prices down innegotiations, whereas the presence of competing U.S. products had a more mixed effect on negotiations, sometimescausing prices to decrease and sometimes to increase. Purchasers were asked whether the presence of U.S.,Canadian, or Chinese sellers in contract negotiations increased prices, reduced prices, or had no impact on price atall. Most purchasers, 76.9 percent, reported that the presence of Chinese products reduced the price, as compared to42.6 percent for U.S. products and 38.1 percent for Canadian products. A significant share of purchasers, 22.2percent, also reported that the presence of U.S. sellers tends to raise prices, as compared to 9.5 percent for Canadaand zero for China. These data further support our conclusion that subject imports put downward pricing pressureon domestic prices in contract negotiations. (derived from CR/PR at Table V-2). 217 In its final determinations, Commerce calculated a 23.21 percent weighted-average ad valorem dumpingmargin for Canadian producer JBL and all other Canadian producers. Commerce calculated the following marginsfor Chinese producers: 94.61 percent (Yixing Union Biochemical Co., Ltd.); 129.08 percent (Shandong TTCABiochemistry Co., Ltd.); and 111.85 (various named exporter/producer combinations); and 156.87 percent (allothers). See, e.g., CR at I-6 and I-7. Commerce also made affirmative countervailing duty determinations regardingsubject imports from China. It assigned the following ad valorem margins: 3.60 percent (Yixing Union BiochemicalCo., Ltd. and Yixing Union Cogeneration Co., Ltd.); 12.68 percent (Shandong TTCA Biochemistry Co., Ltd.);118.95 percent (Anhui BBCA Biochemical Co., Ltd.); and 8.14 percent (all others). See, e.g., CR at I-7 to I-8. 218 19 U.S.C. § 1677(7)(C)(iii); see also SAA at 851 and 885 (“In material injury determinations, theCommission considers, in addition to imports, other factors that may be contributing to overall injury. While thesefactors, in some cases, may account for the injury to the domestic industry, they also may demonstrate that anindustry is facing difficulties from a variety of sources and is vulnerable to dumped or subsidized imports.”). 219 19 U.S.C. § 1677(7)(C)(iii); see also SAA at 851, 885; Live Cattle from Canada and Mexico, Inv. Nos. 701-TA-386, 731-TA-812-813 (Prelim.), USITC Pub. 3155 at 25 n.148 (Feb. 1999). 220 As noted above, apparent U.S. consumption increased from *** dry pounds in 2006 to *** dry pounds in2007 and *** dry pounds in 2008. See, e.g., CR/PR at Table C-1.
32
presence of competing U.S. products tended to reduce such prices.216 Moreover, the competition betweenthe three domestic producers continued in 2008 (as 2009 contracts were being negotiated) and did notprevent the industry from obtaining significant price increases as the presence of subject imports in theU.S. market diminished.
For all of these reasons, we find that the large and increasing volume of subject imports have hadsignificant adverse effects on prices of the domestic like product.
E. Impact of the Cumulated Subject Imports on the Domestic Industry217
In examining the impact of subject imports, section 771(7)(C)(iii) of the Tariff Act provides thatthe Commission “shall evaluate all relevant economic factors which have a bearing on the state of theindustry.”218 These factors include output, sales, inventories, ability to raise capital, research anddevelopment, and factors affecting domestic prices. No single factor is dispositive and all relevant factorsare considered “within the context of the business cycle and conditions of competition that are distinctiveto the affected industry.”219
We have examined the performance indicia for the domestic industry producing citric acid andcertain citrate salts. Overall, the record in the final phase of these investigations indicates that a numberof the domestic industry’s performance indicators improved between 2006 and 2007 but slowed ordeclined between 2007 and 2008 notwithstanding strong and increasing demand in the U.S. marketthroughout the three-year period between 2006 and 2008.220 Moreover, improvements in output or salesvolumes are of limited benefit to the domestic industry if it is unable to raise prices sufficiently toproduce a reasonable positive operating income, net income, and cash flow. The domestic industry was

221 The domestic industry’s operating income was negative $10.7 million in 2006, negative $21.6 million in2007, and negative $7.5 million in 2008. Its net income was negative $18.6 million in 2006, negative $26.1 millionin 2007, and negative $53.2 million in 2008. Its cash flow was negative $3.1 million in 2006, negative $11.9 millionin 2007, and negative $41.7 million in 2008. See, e.g., CR/PR at Table VI-1. We note that the net loss for 2008 wasimpacted by large non-operating expenses representing ***. See, e.g., CR at VI-3 at nn.7-8. These items representapplication of proper accounting principles for determining net income, but may not represent current cash outflow. However, even without these non-operating expense items, in addition to negative operating income, the domesticindustry would have had negative net income and negative cash flow in 2008. 222 See, e.g., Hearing Tr. at 18 (Cameron), 193 (Hoffman), 204 (Bloom), 228 (Cameron), 265-66 (Cameron). 223 See, e.g., CR/PR at Table C-1. 224 See, e.g., CR/PR at Table C-1. 225 U.S. export shipments of citric acid and certain citrate salts increased from 96.7 million dry pounds in 2006 to114.3 million dry pounds in 2007 but then decreased to 113.0 million dry pounds in 2008. See, e.g., CR/PR at TableC-1. These shipments accounted for a fairly stable percentage of total industry shipments, of between 21 and 22percent. (derived from CR/PR at Table C-1). 226 See, e.g., CR/PR at Table C-1. 227 See, e.g., CR/PR at Table C-1. 228 The domestic industry’s capacity utilization levels increased from 85.8 percent in 2006 to 88.2 percent in2007 and 91.7 percent in 2008. See, e.g., CR/PR at Table C-1.
33
unable to do this, as evidenced by the fact that it had substantial operating losses, negative net income,and negative cash flow throughout the period of investigation.221
We find that the domestic industry benefitted from purchasers’ preference for a U.S. supplier222 tothe extent that many of its production indicators remained positive, but the large and increasing presenceof cumulated subject imports put pressure on the prices that the domestic industry received for its sales. Despite strong and increasing demand, it was unable to raise prices adequately to improve its operatingincome while meeting rising costs for raw materials and energy, and its financial performance continuedto suffer. By the end of the period of investigation, cumulated subject imports, which had previouslygained market share at the expense of non-subject imports, began taking market share from the domesticindustry, as discussed above, with significant adverse effects on the domestic industry’s performance.
As previously stated, the domestic industry’s output rose from 2006 through 2008. The domesticindustry’s 6.8 percent increase in production quantity, however, did not match the much greater increasein apparent U.S. consumption of *** percent. The domestic industry’s production of citric acid andcertain citrate salts increased from 475.4 million dry pounds in 2006 to 488.4 million dry pounds in 2007and 507.9 million dry pounds in 2008.223 The domestic industry’s U.S. shipments of citric acid andcertain citrate salts increased from 369.5 million dry pounds in 2006 to 400.0 million dry pounds in 2007and 402.5 million dry pounds in 2008.224 These data represented an increase in U.S. shipments of 9.0percent, which did not keep pace with the *** percent increase in apparent U.S. consumption. Exports,which were an appreciable share of the domestic industry’s total shipments, increased overall, as domesticproducers sought to maintain high capacity-utilization levels.225
The domestic industry’s end-of-period inventories of citric acid and certain citrate salts decreasedfrom 77.6 million dry pounds in 2006 to 52.3 million dry pounds in 2007 and 44.6 million dry pounds in2008.226 The domestic industry’s average production capacity remained stable at 553.9 million drypounds between 2006 and 2008.227 The domestic industry’s capacity-utilization levels improved over theperiod of investigation.228
Industry productivity increased by 11.8 percent between 2006 and 2008 and per-unit labor costsdropped by 10.1 percent. Although these labor-related production indicators should have improved thedomestic industry’s bottom line, such improvements were not sufficient to allow the domestic industry to

229 See, e.g., Hearing Tr. at 29 (Warner for ADM), 99 (Baroni for ADM). 230 See, e.g., CR/PR at Table C-1. 231 See, e.g., CR/PR at Table C-1. Net sales, by quantity, increased from 466.1 million dry pounds in 2006 to513.9 million dry pounds in 2007 and 515.5 million dry pounds in 2008. Id. 232 See, e.g., CR/PR at Table C-1. Commissioner Lane and Commissioner Pinkert note that, in the preliminaryphase of these investigations, data through first quarter 2008 showed that the domestic industry’s market share hadimproved to *** percent, up from 2007; however, in the final phase of these investigations, the data for full-year2008 indicate the opposite (i.e., the domestic industry’s market share declined from *** percent in 2007 to ***percent in 2008). Compare, e.g., Mem. INV-FF-060 at Table C-1 with, e.g., CR/PR at Table C-1. 233 See, e.g., CR/PR at Table C-1. 234 The domestic industry’s average unit net sales value was $0.44 in 2006, $0.44 in 2007, and $0.53 in 2008compared to average unit COGS of $0.44 in 2006, $0.46 in 2007, and $0.52 in 2008. See, e.g., CR/PR at Table C-1. 235 See, e.g., CR/PR at Table C-1. 236 See, e.g., CR/PR at Table C-1. 237 See, e.g., CR/PR at Table C-1. 238 See, e.g., CR at VI-12, VI-14 to VI-15; CR/PR at Table VI-5. 239 See, e.g., CR at VI-12; CR/PR at Table VI-5.
34
produce reasonable positive financial results. In addition, the domestic industry testified that theincreased productivity was not necessarily, in and of itself, a positive for the industry as it was partiallyaccomplished by foregoing plant maintenance.229 Moreover, the improvements came at the expense of theemployees in the industry. From 2006 to 2008, the number of production-related jobs fell by 4.6 percentand hours worked fell by 4.5 percent. Overall, wage expenses fell by 4.0 percent as the average hourlywages increased by only 0.5 percent.230
The domestic industry’s net sales increased by 10.6 percent from 2006 to 2008, when measuredby quantity, and increased by 32.0 percent over the same period, when measured by value.231 Althoughthe domestic industry’s net sales and production volumes increased, they did not increase proportionallyto demand, so the domestic industry’s market share fell. The domestic industry’s share of the U.S.market, by quantity, increased from *** percent in 2006 to *** percent in 2007 but then decreased to ***percent in 2008.232
The domestic industry’s average unit COGS increased from $0.44 per dry pound in 2006 to $0.46per dry pound in 2007 and $0.52 per dry pounds in 2008.233 During this time, the domestic industry’saverage unit COGS was equal to or within pennies of its average unit net sales value.234 Despite strongand growing demand, the domestic industry’s price increases were not always sufficient to coverincreases in its cost of production and were not sufficient to avert operating losses. Consequently, thedomestic industry experienced a cost-price squeeze to the extent that its COGS as a share of net sales wasvery high throughout the period of investigation and increased from 98.6 percent in 2006 to 103.6 percentin 2007 before declining to 97.9 percent in 2008.235
The domestic industry posted operating losses in each full year from 2006 to 2008. The domesticindustry’s $10.7 million operating loss in 2006 deteriorated to a $21.6 million operating loss in 2007before improving somewhat, but still remaining significant, as the industry posted a $7.5 millionoperating loss in 2008.236 The domestic industry’s operating income margin declined from negative 5.2percent in 2006 to negative 9.5 percent in 2007 before improving somewhat to negative 2.8 percent in2008.237 Capital expenditures were low and less than depreciation in every period, an indication that thedomestic industry was not expanding or improving its productive facilities, but at best maintainingthem.238 The overall level of research and development expenditures was also low.239

240 With respect to the analysis required by the Federal Circuit in Bratsk, Commissioner Pinkert finds that thefirst triggering factor is satisfied, as citric acid is a commodity product for these purposes, but that the secondtriggering factor is not satisfied, because price-competitive non-subject imports are not a significant factor in theU.S. market. Non-subject imports decreased over the period of investigation, and, at their highest level, onlyaccounted for *** percent of the U.S. market. CR/PR at Table IV-5. 241 See, e.g., Chinese Respondents’ Prehearing Br. at 12-24, 32; PepsiCo’s Prehearing Br. at 1-6; ; JBL’sPrehearing Br. at 12-13; P&G’s Prehearing Br. at 16-28; JBL’s Posthearing Br. at 1-4; Hearing Tr. at 75-76(Hodges), 183-84 (Smith), 189-90 (Taylor), 193-94 (Hofmann), 199-200 (Pensak), 203-04 (Bloom); ChineseRespondents’ Posthearing Br. at Exh. A at 46-51; PepsiCo’s Posthearing Br. at 3-5. 242 See, e.g., Softwood Lumber from Canada, Invs. Nos. 701-TA-414 and 731-TA-928 (Article 1904 NAFTARemand), USITC Pub. 3658 at 108, n.310 (Dec. 2003); see also Small-Diameter Graphite Electrodes from China,Inv. No. 731-TA-1143 (Final), USITC Pub. 4062 at 22-23 (Feb. 2009); Sodium Hexametaphosphate from China,Inv. No. 731-TA-1110 (Final), USITC Pub. 3984 at 27, n.109 (Mar. 2008); Electrolytic Manganese Dioxide fromChina and Australia, Invs. Nos. 731-TA-1124 and 1125 (Prelim.), USITC Pub. 3955 at 18, n.122 (Oct. 2007);Certain Lined Paper School Supplies from China, India, and Indonesia, Invs. Nos. 701-TA-442 to 443 and 731-TA-1095 to 1097 (Final), USITC Pub. 3884 at 25, n.192 and 58, n.49 (Sept. 2006). 243 See, e.g., CR at II-8 to II-10, II-21. 244 See, e.g., CR at III-2 (indicating that ***).
35
We conclude that cumulated subject imports had a material adverse impact on the condition of thedomestic industry. We find that there is a sufficient causal nexus between the subject imports and thedomestic industry’s poor performance during the period of investigation to attribute significant adverseeffects on the domestic industry to subject imports. Specifically, we find that the volume of cumulatedsubject imports from Canada and China was significant both absolutely and relative to production andconsumption and increased significantly relative to consumption. Cumulated subject imports, which werealready large, increased faster than demand, first taking market share from non-subject imports and thenthe domestic industry. As the domestic industry’s costs increased, the significant and increasing volumeof cumulated subject imports put downward pressure on prices, precluding the domestic industry fromreaping the price benefits of the increasing demand. The large and growing volume of subject importsthat suppressed prices of the domestic like product to a significant degree caused poor financial operatingperformance by the domestic industry during the period of investigation.
We have considered whether there are other factors that have had an impact on the domesticindustry. Non-subject imports were a small and declining portion of the U.S. market during the period ofinvestigation. The presence of non-subject imports does not undermine our finding of significant adverseeffects due to cumulated subject imports because non-subject imports were priced higher and were nottaking sales from the domestic industry.240
Respondents contend that the domestic industry had inadequate capacity to supply the entire U.S.market, and they claim that purchasers needed additional sources due to concerns about the domesticindustry’s reliability. They assert that larger purchasers needed to multi-source because the magnitude oftheir demand was greater than any individual supplier could reliably supply.241 Contrary to theimplication of respondents’ argument, the fact that the domestic industry may not be able to supply all ofdemand does not mean that the domestic industry cannot be materially injured or threatened with materialinjury by reason of subject imports.242 Moreover, we find that respondents’ claims concerning thereliability of the domestic industry are exaggerated. Although there is some evidence that shipments fromthe domestic industry were delayed or that domestic producers were unable to meet certain customers’requests for products or supplemental quantities,243 ***.244 Finally, respondents’ arguments fail to take

245 We note that the domestic industry’s exports, some of which are to affiliated companies, fell in 2009 asdomestic producers were able to divert some of these sales back to the U.S. market once prices began to improve. See, e.g., Petitioners’ Posthearing Br. at Exh. 2 at 17, Exh. 3 at 6-7; 19 U.S.C. § 1677(I). Furthermore, many of thepurchaser complaints about lack of supply pertain to 2008 and 2009, after our period of investigation and/or afterimposition of the requirement for antidumping and countervailing duty deposits on subject imports. See, e.g.,Hearing Tr. at 45-46 (Christiansen), 60-61 (Anderson), 193-95 (Hofmann), 199-201 (Pensak), 315 (Ellis); CR at II-9. It is not surprising that the market would experience a period of adjustment when the supply of subject importshas fallen off substantially. See, e.g., EDIS Doc No. 402203; EDIS Doc. No. 402231; Petitioners’ Posthearing Br. atExh. 33. 246 See, e.g., CR at VI-10; CR/PR at Table VI-4 (indicating that a variance analysis illustrates that from 2006 to2008, the decrease in the domestic industry’s losses resulted from a positive price variance ($44.1 million; unitrevenues increased), in spite of a negative cost/expense variance (negative $39.8 million; unit total costs increased)). 247 See, e.g., Chinese Respondents’ Prehearing Br. at 54-64; P&G’s Prehearing Br. at 34-39; ChineseRespondents’ Posthearing Br. at Exh. A at 6-10. 248 Moreover, ***. See, e.g., CR at VI-13 at n.18. 249 See, e.g., Petitioners’ Posthearing Br. at 6-8, Exhs. 1 to 4, Exh. 20 (as revised). 250 See, e.g., CR at V-1, VI-8. 251 See, e.g., CR at VI-1 to VI-2. 252 Derived from domestic producer supplemental questionnaire responses. Moreover, even if they couldsuccessfully hedge against significant adverse price movements in the cost of raw materials by locking in future rawmaterial prices, such hedging could not protect the domestic producers against operating losses if they were unableto reflect current raw material costs.
36
into consideration that purchasers seeking multiple sources have three domestic producers from which tochoose, provided that they are willing to pay domestic prices.245
We have addressed above in our price effects analysis respondents’ arguments concerning thedomestic industry’s practice of entering into fixed-price contracts for a large portion of its sales as well asrising corn costs during the period of investigation. Although corn prices did rise during the period ofinvestigation, they began rising in 2006, well before the domestic industry’s average COGS exceeded itsaverage net sales value in 2007. The domestic industry was unable to secure adequate price increases forits 2007 contracts in the final quarter of 2006 due to pricing pressure from the large and increasingvolume of subject imports from Canada and China.246
Respondents claim that the industry’s poor aggregate financial performance resulted to asignificant degree from ***.247 We reject this argument for several reasons. First, although ***.248 Second, as directed by the statute, the Commission focuses on the domestic industry “as a whole,” not onindividual firms in the industry; there will inevitably be differences between members of the domesticindustry in regard to cost structure and profits. Third, we do not find the hedging practices of *** or anyother domestic producer to be inadequate. At the Commission’s request, domestic producers provideddetailed information on their costs and hedging practices.249 All domestic producers hedged their cornprices to some degree.250 The Commission also verified the data reported by ***.251 Contrary torespondents’ contention, ***.252
Finally, we also reject respondents’ contention that any problems the domestic industry hasexperienced are due to competition among the three domestic producers. As discussed in detail above insection V.D (Price Effects), record evidence shows significant pricing pressure from cumulated subjectimports from Canada and China. Despite intra-industry competition among the three domestic producers,the domestic industry was able to negotiate significant price increases for 2009 contracts after thediscipline of Commerce’s preliminary margins diminished the subject imports’ pricing pressure. Thus,we have not attributed injury from intra-industry competition to the subject imports.
37
Consequently, the record in these investigations indicates a sufficient causal nexus between thesubject imports and the condition of the domestic industry and thus demonstrates material injury byreason of subject imports. We therefore conclude that subject imports have had a significant adverseimpact on the domestic industry.
CONCLUSION
For the reasons stated above, we find that an industry in the United States is materially injured byreason of imports of citric acid and certain citrate salts from Canada and China that Commerce found tobe sold at less than fair value and imports from China that Commerce found to be subsidized by theGovernment of China.


1 We join the Commission’s Views with respect to domestic like product, domestic industry, negligibility,cumulation for purposes of the Commission’s material injury analysis, and conditions of competition. 2 CR at II-2, PR at II-2. 3 CR/PR at Table II-2. 4 For subject imports from Canada, *** percent were sold to end users under contract, as were 60.4 percent ofsubjects from China. CR at V-7, PR at V-5. 5 CR at V-7, PR at V-5. 6 CR at V-7, PR at V-5. Among industry participants, the share of total sales made by long-term contract variedsomewhat. Cargill reported selling *** percent of its citric acid by long-term contract, Tate & Lyle reported ***percent, and ADM *** percent. Id. 7 CR at V-7, PR at V-5.
39
SEPARATE AND DISSENTING VIEWS OF CHAIRMAN SHARA L.ARANOFF, VICE CHAIRMAN DANIEL R. PEARSON, AND COMMISSIONER
DEANNA TANNER OKUN
Based on the record in these final phase investigations, we find that an industry in the UnitedStates is not materially injured or threatened with material injury by reason of imports of citric acid andcertain citrate salts from Canada and China that have been found to be sold in the United States at lessthan fair value (“LTFV”) and imports of citric acid and certain citrate salts from China that have beenfound to be subsidized by the Government of China.
I. NO MATERIAL INJURY BY REASON OF THE SUBJECT IMPORTS FROM CANADAAND CHINA1
A. Additional Conditions of Competition
The U.S. market. The U.S. market for citric acid is relatively concentrated and dominated by endusers. The five largest responding purchasers *** accounted for 48.3 percent, and the 17 largestpurchasers accounted for 66.9 percent, of apparent U.S. consumption between 2006 and 2008.2 Four ofthe top five, and eight of the top ten, leading purchasers were end users rather than distributors. Food andbeverage producers dominate the ranks of the high-volume end user purchasers.3 Nearly 95 percent of thedomestic industry’s sales were made to end users, virtually all by long-term contract, with the remainingfive percent sold to distributors generally under contract. While the majority of subject import sales byvolume also were made to end users, a significant volume of subject imports from China were sold to endusers on the spot market compared with either the sales for the domestic product or subject imports fromCanada.4 Only nonsubject imports were more likely to be sold to distributors and to be sold on the spotmarket as well.5
Domestic sales of citric acid by the domestic industry were overwhelmingly made by long-termcontracts, typically 12 months in duration coinciding with the calendar year. For the U.S. industry as awhole, long-term contract sales accounted for approximately 99 percent of the quantity of citric acidpricing products 1, 2, and 3 sold over the period of investigation.6 While the majority of subject importswere sold by contract – *** percent for subject imports from Canada, and 60 percent for imports fromChina – the terms of these contracts were both short-term (reportedly 1 to 9 months) and long-term (12months or longer).7
Negotiations for the high-volume long-term contracts typically occur in the last quarter of theprevious year. Domestic producers prefer to book as much of their productive capacity into these

8 CR at V-11, citing Tr. at 28-29, PR at V-7. 9 CR at V-11, PR at V-7. 10 CR at II-20 and II-21, PR at II-; see also CR/PR at Table D-1 (Major U.S. Purchasers’ Bid Information whichprovides information on multiple sourcing and domestic competition for large contracts). 11 JBL prehearing brief at 31-32. 12 CR/PR at Table VII-7. 13 CR at VII-5, n. 6 and Table VII-7. Respondents argue that the Government of China’s recent environmentalprotection policies caused rapid consolidation of producers of citric acid and citrate salts in China. See, e.g., Conf.Tr. at 131; Chinese Respondents’ Postconference Br. at 1. 14 CR/PR at Table VII-7. 15 CR at VII-14, PR at VII-9. 16 CR at VII-14, PR at VII-9. 17 CR at VII-15, PR at VII-9. 18 CR at II-8 - II-10, V-43 ***, V-45 ***, V-47-V-49 ***, PR at II-4-II-5, V-19; see also Domestic producers’posthearing brief at Exh. 3, pp. 29-31. 19 19 U.S.C. § 1677(7)(C)(i).
40
contracts as possible, and domestic producers regard these high-volume customers as having “tremendousnegotiating leverage.”8 The members of the domestic industry compete fiercely for these contracts.9
The high-volume end users generally prefer buying from domestic producers but all divide theirpurchases among multiple sources.10 These high-volume end user purchasers also exhibit markedpreferences for buying product under contracts of a year or more. ***.11
Citric acid supply. Over the last several years the worldwide citric acid industry has gonethrough some fairly significant changes. The vast majority of the world’s citric acid productive capacity isin China, the European Union (EU), and the United States.12 While the total capacity in China increasedsignificantly over the period of investigation, the Chinese industry has been substantially consolidatedsince 2002, with the number of firms allegedly falling from over 100 to 20.13 Nonetheless, Chinesecapacity utilization remained at relatively high levels over the period of investigation and reportedly was88.3 percent in 2008.14 In the EU, Tate & Lyle closed a citric acid facility in the United Kingdom in2007, and ADM closed a facility in Ireland in 2005.15 All of the citric acid capacity in Central and SouthAmerica is controlled by the petitioners.16 Finally, the industry in Japan is now ***.17
Citric acid rarely accounts for a significant portion of the finished products in which it’s used, butit is a vital component, and end users cannot afford significant interruptions in supply. While the partiesare divided, the record suggests that the citric acid market experienced tightness of supply during theperiod of investigation, particularly in 2008.18 Domestic producers claim that there was no shortness ofsupply apart from disruptions caused by reactions to the antidumping duty investigation filed in the EU in2007 and by reactions to this action. Respondents argue that the global market for citric acid has beentight regardless of any of these investigations.
B. Volume of the Subject Imports
Section 771(7)(C)(i) of the Act provides that the “Commission shall consider whether the volumeof imports of the merchandise, or any increase in that volume, either in absolute terms or relative toproduction or consumption in the United States, is significant.”19
We concur with the Commission majority that the absolute volume of cumulated subject importsis significant. Subject imports were in the U.S. market in substantial volumes throughout the period ofinvestigation, never accounting for less than *** of the market. While the increase in the volume of

20 CR/PR at Table C-1. 21 CR/PR at Table C-1. 22 CR/PR at Table C-1. 23 CR at V-7, PR at V-5. Only five percent of domestic industry sales were to distributors whereas *** percent oftotal sales of subject imports from Canada and 14.0 percent of total sales of subject imports from China were todistributors. Id. 24 19 U.S.C. § 1677(7)(C)(ii). 25 CR/PR at Table II-7. 26 CR/PR at Table II-7. Less than half of responding importers thought that non-price factors were neversignificant, and a majority of those responding indicated that non-price differences were always or frequentlysignificant when comparing the domestic like product to subject imports from China or subject imports from Canadato subject imports from China. Purchasers were also far less likely than domestic producers to report non-pricedifferences as being never important. Purchasers, like importers, were more likely to find non-price differencesalways or frequently important when comparing the domestic like product to subject imports from China and when
(continued...)
41
subject imports was at a rate higher than the increase in apparent U.S. consumption, market share gainedby subject imports came largely at the expense of nonsubject imports rather than the domestic product. Subject imports’ market share increased from *** percent in 2006 to *** percent in 2008 while thedomestic industry’s market share declined only from *** percent in 2006 to *** percent in 2008.20 Theincrease in subject import volume, therefore, occurred at a time when demand was increasing and thedomestic industry was itself increasing both production and shipments, and substantially reducing its end-of-period inventories in absolute terms and as a share of shipments.21 By 2008, the domestic industry wasoperating at 91.7 percent capacity utilization.22 The record suggests that the industry was operating closeto its practical capacity in 2008, and apparently suffering some capacity constraints, as customers beganto experience delays and the domestic industry declined to take on additional business.
The record also suggests some separation in the markets served by the domestic industry and thesubject imports. The domestic industry focused its marketing efforts on securing high-volume contractswith the largest end user purchasers in order to fill its capacity with as few customers as possible. Thisstrategy meant that the domestic industry devoted very little of its production to distributor sales, a nichefilled by subject and nonsubject imports.23
For these reasons, we find that the volume of subject imports is significant both in absolute termsand relative to consumption and production in the United States.
C. Price Effects of the Subject Imports
Section 771(C)(ii) of the Act provides that, in evaluating the price effects of subject imports, the Commission shall consider whether – (I) there has been significant price undersellingby the imported merchandise as compared with the price of domestic like products of theUnited States, and (II) the effect of imports of such merchandise otherwise depressesprices to a significant degree or prevents price increases, which otherwise would haveoccurred, to a significant degree.24
Producers and importers gave mixed responses as to the importance of price in purchasingdecisions. All three domestic producers responded that factors other than price were never a significantfactor in their sales of subject product.25 However, a majority of responding importers and purchasersindicated that non-price differences were always or frequently significant when comparing the domesticlike product to subject imports from China or subject imports from Canada to subject imports fromChina.26
26 (...continued)comparing subject imports from Canada to subject imports from China. Id. 27 See, e.g., Citric Acid and Certain Citrate Salts from Canada and China, Invs. Nos. 701-TA-456 and 731-TA-1151-1152 (Preliminary), USITC Pub. 4008 at 26-28 (June 2008). In the preliminary phase of these investigations,product-specific pricing data were gathered for five products, but the gathered data were not divided by method ofsale or type of customer. The product-specific data covered a significant share of shipments in the U.S. market overthe period of investigation, including 57.6 percent of domestic shipments, *** percent of shipments of subjectimports from Canada, and 58.4 percent of subject imports from China in 2007. The product-specific pricing datagathered in the preliminary phase showed subject imports underselling the domestic like product in only 12 of 92quarterly comparisons. Margins of overselling by subject imports were significant, ranging from five percent to over120 percent, while underselling margins for subject imports were modest. 28 In the final phase of these investigations, quarterly pricing data was collected on the following five products: two dry citric acid products, one citric acid in solution product, one sodium citrate product, and one potassium citrateproduct. The citric acid products for which specific quarterly pricing data were gathered in these final investigationsare not the same as those surveyed in the preliminary phase. The preliminary data included no solution products; thefinal phase data included one solution product but excluded all fine granular products. CR at V-17 and n.34, PR atV-11 and n.34. 29 CR at V-17, PR at V-11. 30 Calculated from CR/PR at Tables V-4-V-6. 31 Calculated from CR/PR at Tables V-4-V-6. There were no reported sales of subject imported product 3 bycontract to distributors. Id. at CR/PR at Table V-6.
42
The product-specific pricing data gathered in the final phase of these investigations show moreindividual instances of underselling by subject imports than did the preliminary data.27 The data,however, also reveal that most underselling by subject imports occurred in segments where domestic salesvolumes were generally modest.
In the final phase of these investigations, staff gathered quarterly pricing data on five products.28 For products 1-3, the pricing data were gathered by spot sales to end users, contract sales to end users,spot sales to distributors, and contract sales to distributors. For products 4 and 5, data were gathered bysales to end users and sales to distributors. As in the preliminary phase, these surveyed productsaccounted for a significant share of shipments. These five products accounted for approximately 56.3percent of domestic shipments, *** percent of U.S. shipments of subject imports from Canada, and 60.0percent of U.S. shipments of subject imports from China.29
Aggregating the pricing data for these products yielded 231 quarterly comparisons, with subjectimports underselling in 139, or 60 percent, of those comparisons. But aggregating the quarterlycomparison results obscures some significant differences in volume and underselling. Splitting pricingdata for products 1-3 into four categories yielded far more quarterly comparisons and also moreunderselling. Subject imports were significantly more likely to undersell the domestic like product inspot sales than in contract sales. For product 1 spot sales to end users, subject imports undersold thedomestic like product in 18 of 24 quarterly comparisons. But for sales of product 1 made under contractto end users, subject imports undersold the domestic like product in only four of 24 quarterlycomparisons.30 Similar disparities were present when comparing spot and contract sales to distributors aswell.31
More striking, however, were the differences in the volumes in the different channels ofdistribution. Subject imports consistently undersold the domestic like product in product 1 sales on thespot market to end users and consistently oversold the domestic like product in contract sales to end users. But the volume of sales in these markets was quite disparate, particularly for the domestic like product. The domestic industry reported pricing information for *** pounds of product sold to end users over theperiod of investigation. The vast majority of product 1 end user sales reported by the domestic industry,
32 Calculated from CR/PR at Table V-4. 33 Calculated from CR/PR at Table V-4. There was also a significant difference in concentration in this segment. Sales on the spot market to distributors accounted for only *** percent of domestically produced product 1 sold todistributors, while spot sales to distributors accounted for *** percent of reported sales of subject imported product 1from Canada and *** percent of subject imported product 1 from China. Id. 34 Calculated from CR/PR at Tables V-5 and V-6. 35 Calculated from CR/PR at Tables V-7 and V-8. 36 Domestic producers’ posthearing brief at Exh. 1, pp. 5-6. 37 CR at V-11 and Table D-1, PR at V-7 and Table D-1. 38 Domestic producers’ posthearing brief at Exh. 1, pp. 5-6. 39 Domestic producers’ volume arguments could be extended to explain underselling in the spot market, wheresubject import volumes sometimes exceeded the volume of domestic sales. For example, for sales of product 1 toend users on the spot market, total reported domestic sales were *** pounds over the period of investigation, versus*** million pounds of subject imports. Calculated from CR/PR at Table V-4. 40 Domestic producers’ posthearing brief at Exh. 1, p.5.
43
*** percent, were sold under contract, a market segment wherein subject imports were priced above thedomestic product in 20 of 24 comparisons. For end user sales on the spot market, reported domestic saleswere only *** pounds, *** percent of reported product 1 sales to end users. This market segment,accounting for such a minuscule share of product 1 domestic shipments, much less total reported product-specific shipments, nonetheless accounted for a significant portion of underselling instances, withunderselling by subject imports in 18 of 24 quarters.32
Similar patterns and disparities can be seen in other product/channel segments as well. Forproduct 1 sales to distributors, reported shipments by the domestic industry were heavily concentrated bycontract (***), but most of the reported underselling by subject imports occurred in sales on the spotmarket (23 of 24 quarters).33 For products 2 and 3 as well, instances of underselling by subject importsoccurred most frequently in the spot market, but domestic sales volumes were concentrated in the contractsales market.34 Product-specific pricing data for products 4 and 5 were not reported by contract and spot,but domestic shipments were concentrated in the end user segment while most underselling occurred inthe distributor segment.35
Domestic producers have put forward several arguments as to why the significant overselling bysubject imports in the contract sales segment should be ignored. Domestic producers point out that theaverage volume sold by the domestic industry to the largest producers was *** pounds, while the averagevolume sold by importers to the largest producers was ***, and even this figure overstates the averagevolume of imports sold to the largest customers, which is actually closer to ***.36 As discussed above,domestic producers prefer these high-volume contracts to end users but they also indicate that thesepurchasers have “tremendous negotiating leverage” and that the domestic producers compete fiercely forthese contracts.37 The larger volumes sold in these contracts may affect the price and thus skew thispricing data reducing the U.S. prices relative to that of imports.38 The smaller volumes of subject importsin these segments and the frequency of lower prices by the domestic industry suggest that purchasers inthese market segments prefer domestic product and that much of the competition in these segments isbetween the domestic producers.39
Domestic producers have also argued that most underselling by subject imports occurred in 2008,and that underselling margins prior to 2008 were too small to draw conclusions.40 In a market asdescribed by domestic producers, however, where citric acid is largely a commodity product with intenseprice competition, we would be hesitant to entirely dismiss even modest margins. Here, however, theaverage underselling margin by subject imports was 12.7 percent, while the average overselling margin

41 CR/PR at Table V-10. 42 Domestic producers have argued that the pricing data for 2005, gathered during the preliminary phase of theseinvestigations, ought to be considered as well. We decline to do so, as the data were not gathered for the sameproducts at the same level of detail. 43 Commission staff also gathered product-specific pricing data from purchasers, CR/PR at Tables D-2-D-4, aswell as information on specific bids and awards, CR/PR at Table D-1. The purchaser pricing data suggest morefrequent underselling, even in contract sales, than is apparent in the producer/importer pricing data. We havereviewed these data and found them useful. However, we do not rely on the purchasing pricing data in drawingconclusions about underselling or overselling. Here, we have good coverage of the market through ourproducer/importer pricing data, and better coverage than is available in the purchaser pricing data. Theproducer/importer pricing dataset has also benefitted from careful review and revision by Commission staff and theparties to ensure that only appropriate sales were included in the dataset; time and resources preclude such review toensure that only the appropriate products at the appropriate level of trade were included in the purchaser pricing data. 44 Domestic producers’ posthearing brief at Exh. 1, pp. 5-6. 45 We note that the product-specific pricing data for domestic sales to end users show very little movement inprice within a given calendar year. See CR/PR at Tables V-4-V-8. 46 Domestic producers have conjectured that the pendency of the EU petition prompted concerns that similaractions would be filed in the United States. However, there is no evidence on the record that such concerns changedbehavior on the part of importers or purchasers. Import volume increases in 2008 were similar to volume importincreases in 2007 and there is no other record evidence that volumes [or prices] were reacting to the EU petition. 47 CR/PR at Table C-1 (AUVs for subject imports) and Tables V-4, V-5, and V-7. 48 In 2008, *** percent of Canada’s total shipments of citric acid were exported to the United States, *** percentof its shipments were to its home market, and *** percent of its shipments were exported to other countries,principally to ***. CR/PR at Table VII-1.
44
was 15.0 percent.41 Moreover, in the segments of the market with the highest volumes, such as product 1contract sales to end users, overselling by subject imports tended to be spread out throughout the periodof investigation and not concentrated in the later quarters of the period of investigation.42 43 Based on therecord evidence in the final phase investigation, we find that there has not been significant underselling ofthe domestic like product by subject imports.
We do not see evidence of price depression. All parties agree that prices for both the domesticlike product and subject imports rose significantly in 2008. Domestic producers argue that the 2008 priceincreases should be discounted, in part because of the pendency of these investigations and because theantidumping duty investigation in the EU inflated U.S. prices.44 Although the statute permits us todiscount the significance of post-petition data, given the facts of record, we decline to attribute the 2008price increases to the pendency of these investigations. These petitions were filed in April 2008. Giventhat the significant majority of all domestic sales are made under long-term contract with pricesnegotiated in the fourth quarter of the preceding year, these investigations were not pending at the timethat 2008 prices received by the domestic industry were largely determined.45 Nor is there evidence onthe record that the possibility of these petitions being filed was known or discussed within the industry.46 Domestic producers have also argued that price increases reflect the filing of an EU antidumping dutyinvestigation in 2007, and should be discounted. But product-specific data show price increases in 2007,and, because of the preponderance of long-term contracts in the market, most of these 2007 priceincreases would have been negotiated in 2006, well before the EU action began.47 Furthermore, we seelittle evidence that the EU investigation significantly affected the volume or pricing of imports into theUnited States, particularly since volume and pricing for subject imports from Canada, exempt from theEU investigation and not likely to replace Chinese imports in the EU market, followed trends similar tosubject imports from China.48

49 Compare Domestic prehearing brief at 55. 50 CR/PR at Table C-1. 51 Domestic producers’ posthearing brief at Exh. 7, pp. 1-2, and Exh. 20. 52 CR/PR at V-1 and V-2. Petitioners reported that their contracts did not include price escalation clauses duringthe 2006 to 2008 period and that until 2007, when raw material costs increased dramatically, the lack of escalationshad not been a problem. ***. Id. 53 Domestic producers have argued that substantial price increases gained for 2009 contracts indicate that subjectimports have suppressed prices and that only the pendency of these investigations allowed the industry to win suchsubstantial price increases. We are hesitant to draw significant conclusions on the basis of pricing data alone, but wealso note that we found price increases occurring over most of the period of investigation, though, because of themarket’s own contract cycle, at a lag from price increases. We view the 2009 price increases as consistent with thepattern that emerged in 2007 and 2008.
We also note that the domestic industry has continued to devote a significant portion of its shipments toexport markets. AUVs for its exports increased over the period of investigation at essentially the same rate as AUVsfor its domestic shipments, and the industry apparently expects continued increases in this market. This patternindicates that the domestic industry finds increased citric acid prices to be a market-wide phenomenon rather thanone local to the U.S. market and caused largely by these investigations. 54 ***. 55 CR/PR at Table D-1.
45
We find that while there is evidence of price suppression, the record does not indicate that subjectimports were the reason for the industry’s inability to raise prices more rapidly.49 The industry’s unit costof goods sold jumped by 5.1 percent between 2006 and 2007, unit sales values were flat, and theindustry’s COGS/sales ratio went from 98.6 percent in 2006 to 103.6 percent in 2007. The industry wasable to raise prices in 2008, but its COGS/sales ratio remained at an anemic rate of 97.9 percent.50 Asnoted above, prices for a significant portion of the domestic industry’s sales are set as much as a quarterbefore the beginning of the calendar year, and prices for those contract sales show very little movementduring the calendar year. The record suggests that the rapid increase in raw materials costs was notadequately anticipated or prepared for at the time 2007 contracts were negotiated.51 By the time 2008contracts were negotiated, the run-up in corn prices was widely known and domestic producers changedtheir contracts to incorporate price escalation clauses.52 For 2008 calendar year sales, before thesepetitions were filed, the domestic industry was able to gain significant price increases despite the presenceof increased volumes of subject imports in the U.S. market, and prices for subject imports rose as well.53
In considering price suppression, we have also considered the effect of intra-industry competitionin preventing price increases. ***.54
Commission staff were able to gather data on specific bids and awards for citric acid from someof the U.S. market’s ***.55 The bidding data indicate that large purchasers sought bids from multiplesources on these contracts and not infrequently sought additional rounds of bidding. But the bidding dataalso show that the lowest bidder rarely secured the total volume of a contract. *** split each of its threelargest purchases between two suppliers, *** split its largest purchase between two sources, ***, and ***split its largest purchase among four suppliers. The general practice among these high-volume purchaserswas to divide up the contract purchases relatively evenly, rather than awarding a significant majority tothe lowest bidder. The contract data also show that domestic producers were participants in most of thebidding processes, that they competed strongly for these contracts, and underbid both each other andsubject imports.
56 CR/PR at Tables V-11 and V-12. 57 See, e.g., CR at V-45 and V-46 (***). 58 See, e.g., CR at V-43 (***), V-44 (***), V-47 (***) and V-48 (***). 59 CR/PR at Table D-1. 60 Commerce estimated a dumping margin of 23.21 percent for Canadian respondent JBL and all others, andmargins ranging from 94.61 percent to 129.08 percent for named China respondents, as well as a margin of 156.87for all others. CR at I-6-I-7, PR at I-4-I-5. 61 19 U.S.C. § 1677(7)(C)(iii); see also SAA at 851 and 885 (“In material injury determinations, the Commissionconsiders, in addition to imports, other factors that may be contributing to overall injury. While these factors, insome cases, may account for the injury to the domestic industry, they also may demonstrate that an industry is facingdifficulties from a variety of sources and is vulnerable to dumped or subsidized imports.”) SAA at 885. 62 19 U.S.C. § 1677(7)(C)(iii); see also SAA at 851, 885; Live Cattle from Canada and Mexico, Inv. Nos. 701-TA-386, 731-TA-812-813 (Preliminary), USITC Pub. 3155 at 25 n.148 (Feb. 1999). 63 CR/PR at Table C-1.
46
We have also considered the allegations of lost sales and lost revenues.56 Purchaser responses tothese allegations were generally not supportive.57 Some purchasers did indicate that imports were low-priced players in the U.S. market or that they switched to imports for price-based reasons.58 But otherresponses also indicated that purchasers had in fact switched from one domestic producer to another orhad struggled with domestic availability, particularly in 2008.
The record indicates that overselling by subject imports, not underselling, was the norm in themarket segments most important to the domestic industry; that prices began to rise even before any unfairtrade investigations were begun either in the United States or in the EU; that the industry’s apparent price-cost squeeze was not well correlated with trends in import volumes, pricing, or underselling; thatcompetition is intense among the domestic industry for high-volume contracts to end users and shifts bythese purchasers from one domestic producer to another were not uncommon during the period ofinvestigation.59 For these reasons, we do not find that subject imports had significant adverse effects ondomestic prices.
D. Impact of the Subject Imports60
Section 771(7)(C)(iii) provides that the Commission, in examining the impact of the subjectimports on the domestic industry, “shall evaluate all relevant economic factors which have a bearing onthe state of the industry.”61 These factors include output, sales, inventories, capacity utilization, marketshare, employment, wages, productivity, profits, cash flow, return on investment, ability to raise capital,research and development, and factors affecting domestic prices. No single factor is dispositive and allrelevant factors are considered “within the context of the business cycle and conditions of competitionthat are distinctive to the affected industry.”62
The domestic industry saw improvement in several key metrics over the period of investigation. Production increased by 6.8 percent between 2006 and 2008; capacity utilization rose from 85.8 percentto 91.7 percent over the same period; U.S. shipments increased by 9.0 percent and export shipments by16.8 percent. Inventories at the end of 2008 were down 42.5 percent from the end of 2006. The numberof production and related workers declined by 4.6 percent, but productivity rose by 11.8 percent. Grossprofit in 2008 was nearly double that in 2006.63
Despite these improvements, the industry’s financial position was weak over the period ofinvestigation. The industry recorded losses at the operating level in each of the three years, though losses
64 CR/PR at Table C-1. 65 CR/PR at Tables VI-5 and VI-6. 66 Domestic producers’ posthearing brief at Exh. 7. 67 Subject imports gained *** percentage points of U.S. market share from 2006 to 2008 whereas the domesticindustry lost *** percentage points and non-subject imports lost *** percentage points of U.S. market share for thesame period. CR/PR at Table C-1. 68 CR/PR at Table C-1. 69 CR/PR at Table VI-2. 70 Calculated from CR/PR at Table VI-2. 71 Calculated from CR/PR at Table VI-2.
47
in 2008 were significantly smaller.64 The industry’s capital expenditures in 2008 were lower than in 2006or 2007, and it has consistently had negative returns on its assets.65 Moreover, we recognize that theselosses have occurred at a time when import volume increased.
Nevertheless, we do not find a sufficient causal link between the presence and behavior of subjectimports in the market and the current condition of the domestic industry. As an initial matter, we notethat, according to information submitted by domestic producers, this is an industry that has been markedby falling prices and returns for at least a decade, well before significant volumes of subject importsentered the U.S. market.66 Focusing on the period of investigation, we do not find clear correlationsbetween trends in subject import volumes and prices and the performance of the domestic industry. Asdemand increased over the period of investigation, subject import volume increased as did the domesticindustry’s shipments and production. Increases in subject imports’ market share were largely at theexpense of nonsubject imports.67 Moreover, by 2008, the domestic industry was operating at *** percentcapacity utilization, with evidence that it was experiencing some capacity constraints (e.g., delays inshipments and declining to take on additional business).
We recognize that subject import volume and market share rose from 2006 to 2007 (*** percentand *** percentage points, respectively), when the domestic industry suffered its worst losses of theperiod of investigation.68 However, subject import volume and market share increased again from 2007to 2008 (*** percent and *** percentage points, respectively), as the domestic industry recordedincreased production, capacity utilization, sales, and prices and its best financial performance of theperiod of investigation.
We have also noted some differences in market concentrations and the general trend of subjectimports overselling, not underselling, the domestic like product in the domestic industry’s preferredmarket segments. Prices for the domestic like product rose in tandem with rising import volumes. Therecord suggests that the domestic industry might have suffered a cost-price squeeze in 2007, but theindustry’s situation improved in 2008 even as import volume rose.
As discussed above, the record indicates that all three domestic producers are concentrated in thesame portion of the market: high-volume sales by contract to major end users. While we consider theindustry as a whole, variations in individual market participants’ sales and performance demonstrate thatthe overall industry’s performance was affected by intra-industry competition. Domestic producersrationally seek to fill as much as their productive capacity as possible through as few contracts as possiblewith high volume purchasers with fairly predictable needs. ***.69 ***.
***.70 ***.71 The record suggests that concentration by the domestic industry in end user contract sales, the
contract cycle particular to this industry, and price leverage on the part of high-volume end userpurchasers made it difficult for the domestic industry to raise prices quickly enough to keep pace with thesignificant increase in raw material costs. Moreover, these increases in raw material costs wereunanticipated and not prepared for during 2007 contract negotiations which did not contain price

72 19 U.S.C. §1677(7)(F)(ii). 73 19 U.S.C. §1677(7)(F)(ii). 74 19 U.S.C. §1677(7)(F)(ii). Statutory threat factors (VII) is inapplicable, as no imports of agricultural factorsare involved. Id. 75 19 U.S.C. § 1677(7)(H).
48
escalation clauses. The industry’s general difficulties were compounded by ***. But the record alsoindicates that the industry was able to begin recouping its higher costs. By the start of the 2008 contractcycle, before these petitions had been filed and while subject import volumes were still rising, thedomestic industry had won significant price increases along with increases in shipment volumes thatrepresented a peak for this investigation period and significantly decreased inventory levels.
We find that the record does not indicate a causal nexus between subject import trends and thedomestic industry’s performance. Therefore, we do not find that the domestic industry is materiallyinjured by reason of subject imports.
II. NO THREAT OF MATERIAL INJURY BY REASON OF SUBJECT IMPORTS FROMCANADA AND CHINA
A. Legal Standards
Section 771(7)(F) of the Act directs the Commission to determine whether the U.S. industry isthreatened with material injury by reason of the subject imports by analyzing whether “further dumped orsubsidized imports are imminent and whether material injury by reason of imports would occur unless anorder is issued or a suspension agreement is accepted.”72 The Commission may not make such adetermination “on the basis of mere conjecture or supposition,” and considers the threat factors “as awhole” in making its determination whether dumped or subsidized imports are imminent and whethermaterial injury by reason of subject imports would occur unless an order is issued.73 In making ourdetermination, we consider all statutory threat factors that are relevant to this investigation.74
B. Cumulation
For purposes of determining if a threat of material injury exists, cumulation is discretionary. Under section 771(7)(H) of the Act, the Commission may cumulatively assess the volume and priceeffects of subject imports from all countries as to which petitions were filed on the same day if therequirements for cumulation for material injury analysis are satisfied.75
As we have already found in our material injury cumulation analysis, in which we joined theCommission’s Majority Views, none of the cumulation exceptions apply to these investigations, and thereis a reasonable overlap of competition among subject imports from Canada and China and the domesticlike product.
In addition to that analysis, for purposes of assessing whether we should cumulate subject importsfrom Canada and China for purposes of our threat of material injury analysis, we have considered thevolume and pricing trends exhibited by the subject imports. We find sufficient similarities in thosetrends. Subject imports from both Canada and China increased over the period of investigation andgained market share. As for pricing trends, AUVs for imports from both countries increased over theperiod of investigation, and product-specific pricing data showed increases across most products over theperiod of investigation. We exercise our discretion to cumulate subject imports from Canada and Chinafor purposes of our threat of material injury analysis.

76 CR/PR at Table VII-1. 77 CR/PR at Table VII-1. Exports to the U.S. market as a share of total Canadian shipments were *** 2009 and2010. 78 CR/PR at Table VII-3. Chinese industry data are based on usable foreign producer questionnaire responses of14 companies that reported collectively accounting for approximately 90 percent of Chinese exports to the UnitedStates during the period of investigation. CR at I-4. 79 CR/PR at Table VII-3. Chinese shipments to its home market as a share of its total shipments were 27.8percent in 2008 whereas Chinese exports to the U.S. market as a share of China’s total shipments were 10.0 percentin 2008. Id.
49
C. Analysis of Statutory Threat Factors
We have found the volume of subject imports in the U.S. market to be significant absolutely, butwe do not find a substantial increase in subject imports in the imminent future likely. Subject importvolume increased at a time when overall demand was increasing, and the domestic industry’s U.S. marketshare remained large and only slightly changed over the period of investigation.
Moreover, we do not find that the capacity and export trends of the industries in the subjectcountries suggest a significant increase in subject import volume in the imminent future. The industry inCanada reported *** increase in capacity over the period of investigation and ***. The industry operated*** increasing capacity utilization rates throughout the period of investigation and ***, ***.76 The U.S.market has been the primary focus of the industry in Canada and ***.77 Moreover, the share of shipmentsexported to the United States has been *** over the period of investigation. Inventories were *** higherat the end of 2008, but the increase in inventories was *** to overall shipments.
While the industry in China experienced significant increases in capacity over the period ofinvestigation, more modest increases are projected for the near future.78 Furthermore, Chinese capacityutilization rates were relatively high over the period of investigation, at a reported 88.3 percent in 2008. Inventories have grown significantly over the period of investigation and, at the end of 2008, were higherthan total shipments to the United States that year. The industry in China differs from the industry inCanada in that the United States is not, and never has been, its primary market. The citric acid producersin China serve a significant domestic market, where by 2008, shipments to the home market exceededshipments to the United States by a nearly 3-to-1 margin.79 This market is expected to continue to grow ata high rate in the near future. Even with a strong home market, the industry in China exports significantportions of its production. The EU has long been the industry’s primary export market. The recent EUinvestigation limited access to this important market throughout the latter portion of the period ofinvestigation. However, recent data suggest that producers in China have been able to export to the EUand obtain prices above those specified in the price undertaking. Unlike producers in the United Statesand Canada, the industry in China does not use genetically modified organisms in its citric acidproduction, and as such it has an advantage in shipping to the EU, where citric acid capacity remains wellshort of demand.
We recognize that combined, these two industries have available capacity and inventoriesrelatively significant to total shipments to the United States. Production capacity in the U.S. market iswell short of demand, and imports will continue to be necessary to meet or fill that demand. Imports fromCanada and China have long been part of the U.S. market and at significant volumes.
The conditions of competition in this market also suggest that it would be difficult for subjectimports to gain significant additional volume in the U.S. market that would bring significant competitionwith the domestic industry. As noted, the high-volume, end user contract sales are set in a relativelynarrow time frame, and this is the portion of the market where the domestic industry concentrates most ofits energy. The domestic industry already devotes virtually all of its domestic shipments to this share ofthe market. Given current high levels of production, the domestic industry has little available additional
50
capacity for new customers and little motivation to increase its penetration of the markets that subjectimports currently dominate, namely spot sales and distributor sales.
We have already found that subject imports have not significantly impacted domestic prices. Subject imports generally oversold the domestic like product in the market segments dominated by thedomestic industry. Prices for subject imports rose along with raw material prices, as did prices for thedomestic like product. Prices for the domestic like product did not initially rise quickly enough to keepup with significant raw material cost increases, leaving the industry in a cost-price squeeze in 2007, butthe record indicates that prices rose significantly in 2008, despite the presence of an increased volume ofsubject imports. Intra-industry competition also has affected prices in the U.S. market. Pricing data from2007 and 2008 indicate that the market has been adjusting to increased raw material costs and an apparenttightness in supply, and the pricing adjustments have occurred despite increases in import volume andapparent available capacity and inventories in the subject countries.
Accordingly, based on the record, we determine that the domestic industry producing citric acidand certain citrate salts is not threatened with material injury by reason of subject imports from Canadaand China.
III. CONCLUSION
For the reasons stated above, we find that the domestic industry producing citric acid and certaincitrate salts is not materially injured or threatened with material injury by reason of subject imports fromCanada and China sold at LTFV and subject imports from China subsidized by the Government of China.

1 A complete description of the imported product subject to these investigations is presented in the sectionentitled The Subject Merchandise located in Part I of this report. 2 Federal Register notices cited in the tabulation after the Commission’s scheduling of its final investigations arepresented in app. A.
I-1
PART I: INTRODUCTION
BACKGROUND
These investigations result from a petition filed on April 14, 2008, by Archer Daniels MidlandCo. of Decatur, IL (“ADM”); Cargill, Inc. of Wayzata, MN (“Cargill”); and Tate & Lyle Americas, Inc.of Decatur, IL (“Tate & Lyle”), alleging that an industry in the United States is materially injured and isthreatened with material injury by reason of imports from Canada and China of citric acid and certaincitrate salts1 that are allegedly sold in the United States at less than fair value (“LTFV”) and subsidized bythe government of China. Information relating to the background of these investigations is providedbelow.2
Effective date Action
April 14, 2008Petition filed with Commerce and the Commission; Commission institutes investigations(73 FR 21650, April 22, 2008)
May 13, 2008 Commerce’s notice of initiation (73 FR 27492)
May 28, 2008 Commission’s preliminary determinations (73 FR 33115, June 11, 2008)
September 19, 2008 Commerce’s preliminary countervailing duty determination (73 FR 54367)
November 20, 2008Commerce’s preliminary antidumping duty determinations (73 FR 70324)(Canada) and (73FR 70328)(China)
November 20, 2008Commission’s scheduling of its final phase investigations (73 FR 73955, December 4,2008)
April 13, 2009Commerce’s final antidumping and countervailing duty determinations (74 FR 16836,16838, and 16843)
April 7, 2009 Commission’s hearing1
May 8, 2009 Commission’s vote
May 22, 2009 Commission’s determinations and views transmitted to Commerce
1 A list of witnesses that appeared at the hearing is in app. B.
I-2
STATUTORY CRITERIA AND ORGANIZATION OF THE REPORT
Statutory Criteria
Section 771(7)(B) of the Tariff Act of 1930 (the “Act”) (19 U.S.C. § 1677(7)(B)) provides that inmaking its determinations of injury to an industry in the United States, the Commission--
shall consider (I) the volume of imports of the subjectmerchandise, (II) the effect of imports of that merchandise onprices in the United States for domestic like products, and (III)the impact of imports of such merchandise on domesticproducers of domestic like products, but only in the context ofproduction operations within the United States; and . . . mayconsider such other economic factors as are relevant to thedetermination regarding whether there is material injury byreason of imports.
Section 771(7)(C) of the Act (19 U.S.C. § 1677(7)(C)) further provides that--
In evaluating the volume of imports of merchandise, theCommission shall consider whether the volume of imports of themerchandise, or any increase in that volume, either in absoluteterms or relative to production or consumption in the UnitedStates is significant.. . .In evaluating the effect of imports of such merchandise onprices, the Commission shall consider whether . . . (I) there hasbeen significant price underselling by the imported merchandiseas compared with the price of domestic like products of theUnited States, and (II) the effect of imports of such merchandiseotherwise depresses prices to a significant degree or preventsprice increases, which otherwise would have occurred, to asignificant degree.. . .In examining the impact required to be considered undersubparagraph (B)(i)(III), the Commission shall evaluate (withinthe context of the business cycle and conditions of competitionthat are distinctive to the affected industry) all relevanteconomic factors which have a bearing on the state of theindustry in the United States, including, but not limited to. . . (I) actual and potential declines in output, sales, market share,profits, productivity, return on investments, and utilization ofcapacity, (II) factors affecting domestic prices, (III) actual andpotential negative effects on cash flow, inventories, employment,wages, growth, ability to raise capital, and investment, (IV)actual and potential negative effects on the existing developmentand production efforts of the domestic industry, including effortsto develop a derivative or more advanced version of the domestic

3 ***. JBL Canada, the sole Canadian producer, did not produce sodium citrate or potassium citrate during theperiod of investigation. 4 Appendix C, table C-2 displays data compiled regarding the U.S. citric acid market, table C-3 displays dataregarding the U.S. sodium citrate market, and table C-4 displays data regarding the U.S. potassium citrate market. 5 ***.
I-3
like product, and (V) in {an antidumping investigation}, themagnitude of the margin of dumping.
Organization of the Report
Information on the subject merchandise, margins of dumping and subsidies, and domestic likeproduct is presented in Part I. Information on conditions of competition and other relevant economicfactors is presented in Part II. Part III presents information on the condition of the U.S. industry,including data on capacity, production, shipments, inventories, and employment. The volume and pricingof imports of the subject merchandise are presented in Parts IV and V, respectively. Part VI presentsinformation on the financial experience of U.S. producers. Information obtained for use in theCommission’s consideration of the question of threat of material injury is presented in Part VII.
U.S. MARKET SUMMARY
The U.S. market for citric acid and certain citrate salts totaled *** dry pounds and approximately*** in 2008. Currently, three firms produce citric acid and certain citrate salts in the United States. These firms are the petitioners, ADM, Cargill, and Tate & Lyle. ***, Jungbunzlauer Technology GmbH& Co. (“JBL”) *** imported citric acid from Canada in 2008.3 At least 31 firms have reported importingcitric acid and/or certain citrate salts from China since 2006.
U.S. producers’ U.S. shipments of citric acid and certain citrate salts totaled 403 million drypounds valued at $215 million in 2008, and accounted for *** percent of apparent U.S. consumption byquantity (*** percent by value). U.S. imports from Canada totaled *** dry pounds valued at *** in 2008,and accounted for *** percent of apparent U.S. consumption by quantity (*** percent by value). U.S.imports from China totaled 194 million dry pounds valued at $118.3 million in 2008, and accounted for*** percent of apparent U.S. consumption by quantity (*** percent by value). U.S. imports from allother sources combined totaled 55.6 million dry pounds valued at $41.1 million in 2008, and accountedfor *** percent of apparent U.S. consumption by quantity (*** percent by value). Citric acid and certaincitrate salts are generally used as an acidulant, preservative, and flavor enhancer in food and beverage enduses as well as an ingredient in many household and industrial detergents and cleaners.
SUMMARY DATA AND DATA SOURCES
A summary of data collected in these investigations is presented in appendix C, table C-1.4 U.S.industry data are based on the questionnaire responses of the three petitioning firms that accounted for allU.S. production of citric acid and certain citrate salts in 2008. Data for U.S. imports from Canada arecompiled using the reported U.S. imports of JBL, the U.S. importer of Canadian product which accountedfor *** U.S. imports from Canada, ***.5 Data for U.S. imports from China and nonsubject countries arecompiled using official Commerce statistics. Data regarding the Canadian industry are based on theforeign producer questionnaire response of Jungbunzlauer Technology GmbH & Co. (“JBL Canada”),which accounted for all Canadian export shipments to the United States in 2008. Data regarding theChinese industry are based on 14 foreign producer questionnaires. The responding foreign producers

6 The scope of the 2000 investigation consisted of citric acid and sodium citrate. The current investigations’broader scope consists of those products, potassium citrate, and crude calcium citrate. 7 Citric Acid and Sodium Citrate From China, Inv. No. 731-TA-863 (Preliminary), USITC Publication 3277,February 2000, p. 1. 8 Ibid., at p. 12. 9 Ibid., pp. 14-15. 10 Ibid., pp. 16-17. 11 Also mentioned in the Commission’s prior investigation was a price-fixing conspiracy in the citric acid industrythat took place in the 1990s. ADM and Haarmann & Reimer pled guilty in October 1996 and January 1997,respectively, to participation, along with two European producers, in a price-fixing conspiracy which the U.S. JusticeDepartment found to be in place as early as 1991. The guilty plea resulted in total fines of $100 million for the fourfirms. ***. Also, several U.S. civil class action law suits were filed in 1996 and 1997 in which ADM agreed to pay$85 million and Haarmann & Reimer agreed to pay $46 million to bottlers and food processors. In all, fines paid outon the cases totaled over $200 million. In 1998, Haarmann & Reimer sold its entire worldwide citric acid businessto Tate & Lyle. Ibid., p. III-1, fn. 3. The Commission explicitly stated that it gave the price fixing “little weight” inits determination “as it may have affected prices only for the early part of the investigation.” Ibid., p. 13, fn. 88. 12 Notice of Final Determination of Sales at Less Than Fair Value: Citric Acid and Certain Citrate Salts fromCanada; 74 FR 16843, April 13, 2009. 13 Citric Acid and Certain Citrate Salts from the People’s Republic of China: Final Determination of Sales atLess Than Fair Value; 74 FR 16838, April 13, 2009.
I-4
estimate that they collectively accounted for approximately 90 percent of Chinese export shipments to theUnited States during the period for which data were collected in the investigations.
PREVIOUS AND RELATED INVESTIGATIONS
Citric acid and certain citrate salts have been the subject of a previous Commission investigation.6 In 2000, in investigation No. 731-TA-863 (Preliminary), the Commission determined that there was noreasonable indication that an industry in the United States was materially injured or threatened withmaterial injury by reason of imports from China that were allegedly sold at LTFV.7 The Commissiondetermined that the volume of U.S. imports from China was not significant, stating that “Chinese importshave not made significant inroads into sales made by the domestic industry to U.S. food and beveragemanufacturers {by far the largest market segment in the United States at the time}. Rather, the largemajority of subject imports compete with the domestic product only in the industrial use market, wherethe subject imports have already increased their market share without a significant adverse impact on theindustry.”8 Further, the Commission determined that the record did not indicate price depression orsuppression and that the U.S. industry was not adversely impacted by reason of U.S. imports from China.9 Finally, the Commission determined that there was no reasonable indication that the U.S. industry wasthreatened with material injury by reason of the subject imports, noting that “Chinese producers of citricacid and sodium citrate are currently operating at a high capacity utilization level” and that “Chinesehome market and third country market shipments have risen each year since 1996.”10 11
NATURE AND EXTENT OF SALES AT LTFV
On April 13, 2009, Commerce published notices in the Federal Register setting forth its finaldeterminations with regard to its antidumping investigations on citric acid and certain citrate salts fromCanada12 and China.13 The estimated weighted-average dumping margins (in percent ad valorem), asreported by Commerce are summarized in the tabulation below:

I-5
Exporter ProducerMargin
(percent)
Canada
Jungbunzlauer Technology GmbH & Co. KG 23.21
All others 23.21
China
TTCA Co., Ltd. (a.k.a. Shandong TTCABiochemistry Co., Ltd.)
TTCA Co., Ltd. (a.k.a. Shandong TTCABiochemistry Co., Ltd.)
129.08
Yixing Union Biochemical Co., Ltd. Yixing Union Biochemical Co., Ltd. 94.61
Anhui BBCA Biochemical Co., Ltd. Anhui BBCA Biochemical Co., Ltd. 111.85
Anhui BBCA Biochemical Co., Ltd. China BBCA Maanshan Biochemical Corp. 111.85
A.H.A. International Co., Ltd. Yixing Union Biochemical Co., Ltd. 111.85
A.H.A. International Co., Ltd. Nantong Feiyu Fine Chemical Co., Ltd. 111.85
High Hope International Group JiangsuNative Produce IMP & EXP Co., Ltd.
Yixing Union Biochemical Co., Ltd. 111.85
Huangshi Xinghua Biochemical Co., Ltd. Huangshi Xinghua Biochemical Co., Ltd. 111.85
Lianyungang JF International Trade Co., Ltd. TTCA Co., Ltd. (a.k.a. Shandong TTCABiochemistry Co., Ltd.)
111.85
Laiwu Taihe Biochemistry Co., Ltd. Laiwu Taihe Biochemistry Co., Ltd. 111.85
Lianyungang Shuren Scientific CreationImport & Export Co., Ltd.
Lianyungang Great Chemical Industry Co.,Ltd.
111.85
Penglai Marine Bio-Tech Co. Ltd. Penglai Marine Bio-Tech Co. Ltd. 111.85
RZBC Imp & Exp. Co., Ltd./ RZBC Co., Ltd./RZBC (Juxian) Co., Ltd.
RZBC Co., Ltd. 111.85
RZBC Imp & Exp. Co., Ltd./ RZBC Co., Ltd./RZBC (Juxian) Co., Ltd.
RZBC (Juxian) Co., Ltd. 111.85
RZBC Imp & Exp. Co., Ltd./ RZBC Co., Ltd./RZBC (Juxian) Co., Ltd.
Lianyungang Great Chemical Industry Co.,Ltd.
111.85
Shihezi City Changyun Biochemical Co., Ltd. Shihezi City Changyun Biochemical Co., Ltd. 111.85
Weifang Ensign Industry Co., Ltd. Weifang Ensign Industry Co., Ltd. 111.85
All others 156.87
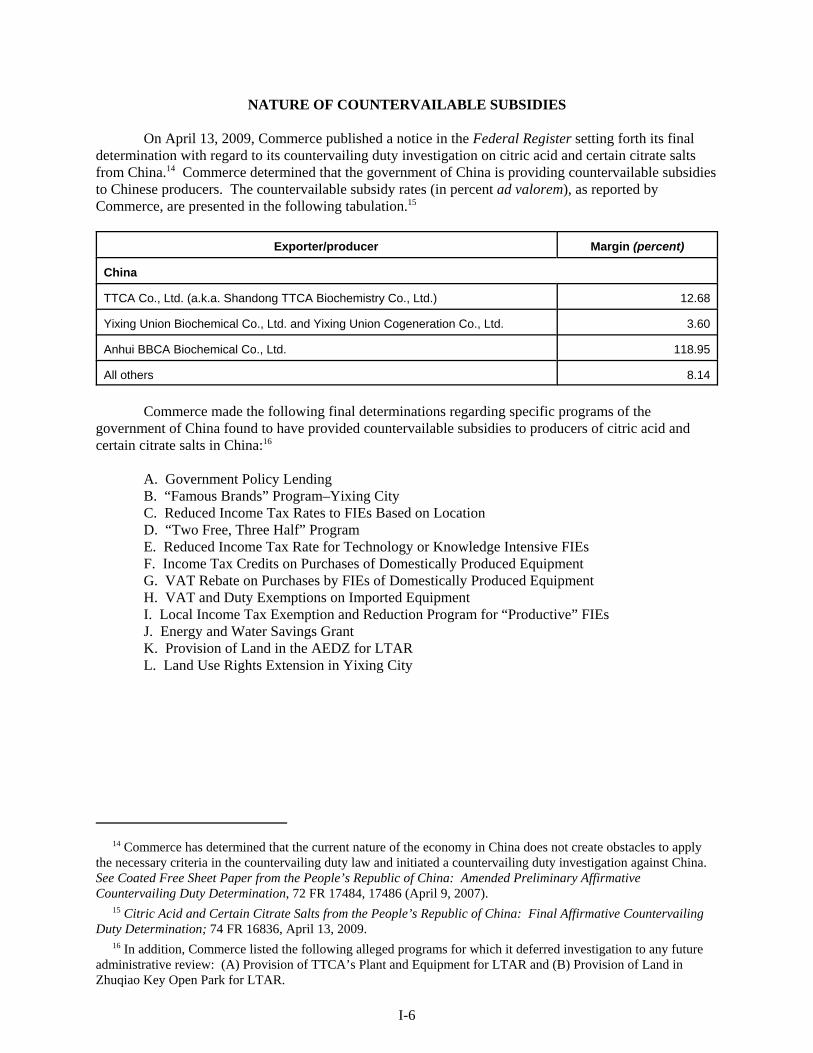
14 Commerce has determined that the current nature of the economy in China does not create obstacles to applythe necessary criteria in the countervailing duty law and initiated a countervailing duty investigation against China. See Coated Free Sheet Paper from the People’s Republic of China: Amended Preliminary AffirmativeCountervailing Duty Determination, 72 FR 17484, 17486 (April 9, 2007). 15 Citric Acid and Certain Citrate Salts from the People’s Republic of China: Final Affirmative CountervailingDuty Determination; 74 FR 16836, April 13, 2009. 16 In addition, Commerce listed the following alleged programs for which it deferred investigation to any futureadministrative review: (A) Provision of TTCA’s Plant and Equipment for LTAR and (B) Provision of Land inZhuqiao Key Open Park for LTAR.
I-6
NATURE OF COUNTERVAILABLE SUBSIDIES
On April 13, 2009, Commerce published a notice in the Federal Register setting forth its finaldetermination with regard to its countervailing duty investigation on citric acid and certain citrate saltsfrom China.14 Commerce determined that the government of China is providing countervailable subsidiesto Chinese producers. The countervailable subsidy rates (in percent ad valorem), as reported byCommerce, are presented in the following tabulation.15
Exporter/producer Margin (percent)
China
TTCA Co., Ltd. (a.k.a. Shandong TTCA Biochemistry Co., Ltd.) 12.68
Yixing Union Biochemical Co., Ltd. and Yixing Union Cogeneration Co., Ltd. 3.60
Anhui BBCA Biochemical Co., Ltd. 118.95
All others 8.14
Commerce made the following final determinations regarding specific programs of thegovernment of China found to have provided countervailable subsidies to producers of citric acid andcertain citrate salts in China:16
A. Government Policy Lending B. “Famous Brands” Program–Yixing CityC. Reduced Income Tax Rates to FIEs Based on Location D. “Two Free, Three Half” ProgramE. Reduced Income Tax Rate for Technology or Knowledge Intensive FIEs F. Income Tax Credits on Purchases of Domestically Produced Equipment G. VAT Rebate on Purchases by FIEs of Domestically Produced Equipment H. VAT and Duty Exemptions on Imported Equipment I. Local Income Tax Exemption and Reduction Program for “Productive” FIEs J. Energy and Water Savings GrantK. Provision of Land in the AEDZ for LTARL. Land Use Rights Extension in Yixing City
I-7
THE SUBJECT MERCHANDISE
Commerce’s Scope
Commerce has defined the scope of these investigations as follows:
All grades and granulation sizes of citric acid, sodium citrate, and potassium citrate intheir unblended forms, whether dry or in solution, and regardless of packaging type. Thescope also includes blends of citric acid, sodium citrate, and potassium citrate; as well asblends with other ingredients, such as sugar, where the unblended form(s) of citric acid,sodium citrate, and potassium citrate constitute 40 percent or more, by weight, of theblend.
The scope of these investigations also includes all forms of crude calcium citrate,including dicalcium citrate monohydrate, and tricalcium citrate tetrahydrate, which areintermediate products in the production of citric acid, sodium citrate, and potassiumcitrate.
The scope of these investigations does not include calcium citrate that satisfies thestandards set forth in the United States Pharmacopeia and has been mixed with afunctional excipient, such as dextrose or starch, where the excipient constitutes at least 2percent, by weight, of the product.
The scope of these investigations includes the hydrous and anhydrous forms of citricacid, the dihydrate and anhydrous forms of sodium citrate, otherwise known as citric acidsodium salt, and the monohydrate and monopotassium forms of potassium citrate. Sodium citrate also includes both trisodium citrate and monosodium citrate, which arealso known as citric acid trisodium salt and citric acid monosodium salt, respectively.
Citric acid and sodium citrate are classifiable under 2918.14.0000 and 2918.15.1000 ofthe Harmonized Tariff Schedule of the United States (“HTSUS”), respectively. Potassium citrate and crude calcium citrate are classifiable under 2918.15.5000 and3824.90.9290 of the HTSUS, respectively. Blends that include citric acid, sodium citrate,and potassium citrate are classifiable under 3824.90.9290 of the HTSUS. Although theHTSUS subheadings are provided for convenience and customs purposes, the writtendescription of the merchandise is dispositive.
Tariff Treatment
During the period of investigation, citric acid has been classifiable in the Harmonized TariffSchedule of the United States (“HTS”) under subheading 2918.14.00, sodium citrate under HTS

17 Although HTS subheading 2918.15.50 is a residual or “basket” subheading covering salts and esters of citricacid other than sodium citrate, during the preliminary phase of these investigations, petitioners contended that thevast majority of U.S. imports entering under it are potassium citrate. In the event that crude calcium citrate wereimported into the United States, it may be classified under this subheading. However, the parties to theseinvestigations are unaware of any U.S. imports of crude calcium citrate. Conference transcript, p. 54 (Ellis). 18 The scope of these investigations also included blends of citric acid and certain citrate salts classifiable in HTSsubheading 3824.90.92. This is a residual subheading for the heading “Prepared binders for foundry molds or cores;chemical products and preparations of the chemical or allied industries (including those consisting of mixtures ofnatural products), not elsewhere specified or included.” During the preliminary phase of these investigations,petitioners reported that they were unaware of any product within the scope of these investigations imported underthis subheading, but included it in the scope language in order to prevent circumvention. See Citric Acid andCertain Citrate Salts from Canada and China, Inv. Nos. 701-TA-456 and 731-TA-1151-1152 (Preliminary), USITCPublication 4008, June 2008, p. 13, fn. 79. 19 During the preliminary phase of these investigations, crude calcium citrate was referred to as “unrefinedcalcium citrate.” An interested party requested that Commerce clarify the definition and rename this product “crudecalcium citrate” in its scope language. See Citric Acid and Certain Citrate Salts from the People’s Republic ofChina: Preliminary Affirmative Countervailing Duty Determination and Alignment of Final Countervailing DutyDetermination with Final Antidumping Duty Determination; 73 FR 54367, September 19, 2008. 20 Petition, pp. 5-6. 21 Petition, p. 6.
I-8
subheading 2918.15.10, and potassium citrate under HTS subheading 2918.15.50.17 Table I-1 depicts theHTS subheadings under which citric acid and certain citrate salts are classified and their tariff treatment.18
Table I-1Citric acid and certain citrate salts: Tariff treatment, 2009
HTS provision Article descriptionGeneral1 Special2 Column 23
Rates (percent ad valorem)2918
2918.14.00
2918.15 2918.15.10 2918.15.50
Carboxylic acids with additional oxygen function and theiranhydrides, halides, peroxides and peroxyacids; their halogenated,sulfonated, nitrated or nitrosated derivatives:
Citric acid........................................
Salts and esters of citric acid: Sodium citrate............................. Other..........................................
6.0
6.53.7
Free
FreeFree
39.5
42.025.0
1 Normal trade relations, formerly known as the most-favored-nation duty rate, applicable to China. 2 Special rates are applicable to originating goods of Canada under the NAFTA. Other special rates apply to nonsubjectcountries. China is not eligible for the special rates. 3 Applies to imports from a small number of countries that do not enjoy normal trade relations duty status.
Source: Harmonized Tariff Schedule of the United States (2009).
THE PRODUCT
Description and Applications
The imported products subject to these investigations are citric acid and certain citrate salts,specifically sodium citrate, potassium citrate, and crude calcium citrate (“CCC”).19
Citric acid, sodium citrate, and potassium citrate are all available as odorless, translucentcrystals.20 These crystals are normally sold in three granulations: granular, fine granular, and powder.21

22 Petition, p. 6. 23 Petition, p. 6. 24 Petition, p. 6. 25 Petition, p. 8. 26 Petition, pp. 8-9. 27 Petition, p. 6. 28 Conference transcript, p. 65 (Poulos and Christiansen). 29 Petition, p. 6. 30 Conference transcript, p. 60 (Anderson). 31 Petition, p. 9. 32 Petition, p. 12. 33 Petition, p. 12. 34 Petition, p. 7. 35 Conference transcript, p. 18 (Oakley). 36 Petition, p. 8.
I-9
Citric acid is also available in solution.22 Purchasers can buy the dry product and put it into solution orhave an independent converter do it.23 Petitioners argue that the products have only minor moleculardifferences which do not significantly alter their essential characteristics or uses.24
CCC is an intermediate form in the production of citric acid via the lime/sulfuric acid process.25
CCC can be shipped to another facility for further processing into refined citric acid.26
Citric acid is produced and sold in the U.S. market in both its dry and solution forms, and can beeasily and reversibly converted between these two forms. Whether dry or dissolved in water, theproduct’s chemical properties are the same.27 The petitioners stated that the bulk of their shipments are inthe dry form, but they do ship as much as 25 percent in solution.28 Sodium citrate and potassium citrateare sold in dry forms.29 According to the petitioners, the three products are used basically for the samepurposes, sold in the same markets, and produced in the same production facilities.30
Citric acid is produced as a white granular or crystalline powder with a strong acidic taste. It isproduced by the fermentation of glucose from a substrate such as corn, molasses, sweet potato, tapioca, orwheat.31 Citric acid is produced both in anhydrous form and as a monohydrate. Both forms are isolatedand purified through successive recrystallizations.
Sodium citrate is a white, granular crystalline powder with a pleasant acidic taste. Sodium citrateis produced by mixing citric acid slurry with sodium hydroxide (or sodium carbonate) and thencrystallizing the resulting sodium citrate.32 Potassium citrate is produced by reacting citric acid slurrywith potassium hydroxide (or potassium carbonate).33
Citric acid, sodium citrate, and potassium citrate are chemical products used in the production andformulation of a wide variety of foods, beverages, pharmaceuticals, and cosmetics as well as commercialand household products including detergents and metal cleaners, and in textile finishing treatments andother industrial applications. Citric acid is used in the food and beverage industry as an acidulant,preservative, and flavor enhancer because of its tart flavor, high solubility, acidity, and bufferingcapabilities.34 It is commonly used in carbonated and non-carbonated drinks, dry powdered beverages,wines and wine coolers, jams, jellies, preserves, gelatin desserts, candies, frozen foods, and canned fruitsand vegetables.35 The use of citric acid in laundry detergents has increased because it has replacedphosphate-based formulations and because more concentrated liquid detergents, which are increasing inpopularity, require more citric acid than do powdered detergents.36

37 Petition, p. 8. 38 Petition, p. 8. 39 Petition, p. 8. 40 Petition, p. 7. 41 Conference transcript, p. 161 (Hsu). 42 Conference transcript, p. 171 (Hsu). 43 Petition, p. 12. 44 Conference transcript, pp. 84-85 (Oakley and Staloch).
I-10
Sodium citrate, in addition to similar applications as citric acid, is used in cheese and dairyproducts to improve emulsifying properties, texture, and melting properties and to act as a preservativeand aging agent.37 It also has pharmaceutical applications such as a diuretic and an expectorant in coughsyrup.38
Potassium citrate is used as an antacid, a diuretic, an expectorant, and as a systemic and urinaryalkalizer. In industrial applications, potassium citrate can be used in electropolishing and as a bufferingagent. In food and beverage applications, potassium citrate has been replacing sodium citrate as a meansof reducing sodium content in low- or no-salt products.39
Both petitioners and respondents state that citric acid and certain citrate salts are produced tomeet very high purity U.S. Pharmacopoeia (“USP”) or Food Chemical Codex (“FCC”) standards. TheCanadian and Chinese producers sometimes certify their products as complying with the BritishPharmacopoeia (“BP”) standards, which are very similar to those of the USP.40 The products must meetthese standards to be used in food and beverage or pharmaceutical applications. Both petitioners andrespondents stated that most of the world-class producers try to produce the highest quality product sothat it will pass USP or FCC standards since some of the largest customers are in the food and beveragebusiness. A respondent stated that in addition to high purity standards, other quality factors in the productsuch as color, acidity level, consistency of pH level, and granulation or clumping play an important rolein the sale of the product. According to this witness, these factors, in addition to the FCC and USPstandards, determine in what market segment the subject product will be used.41 At the staff conference,both petitioners and respondents referred to quality tiers in end-use markets for citric acid and certaincitrate salts. End uses in foods, beverages, and pharmaceuticals constitute an upper tier, while detergentformulation and industrial uses make up a lower tier.
JBL Canada, the sole Canadian producer, manufactures only citric acid at its plant in Canada. Itdoes not produce any of the salts. It ships citric acid in both dry and solution forms.
The Chinese producers manufacture primarily citric acid. A witness at the conference stated thatChina’s limited resources of the sodium and potassium compounds used to make the subject salts renderChinese-produced salts less competitive in the U.S. market.42
Manufacturing Processes
Citric acid is produced in a two-stage process. In the first stage, sugars are fermented using afermenting organism such as molds or yeasts. In the second stage, the crude citric acid is recovered andrefined. Sodium citrate and potassium citrate are produced by reacting citric acid slurry with a solutioncontaining certain sodium or potassium compounds (e.g., sodium hydroxide or potassium hydroxide).43 The domestic producers stated during the conference that they produce sodium citrate and potassiumcitrate using some of the same equipment and workers that are used for citric acid.44
45 “Citric acid,” Kirk-Othmer Encyclopedia of Chemical Technology (John Wiley & Sons, New York, 1979),Vol. 6, pp. 156-159. 46 Petition, p. 9. 47 Petition, p. 9. 48 Petition, exh. I-2, Chemical Economics Handbook, “Citric Acid,” August 2006, pp. 10-11. 49 Petition, p. 9. 50 Petition, p. 10. 51 Petition, p. 10. Staff telephone interview with ***. Email from ***. 52 “Citric acid,” Kirk-Othmer Encyclopedia of Chemical Technology (John Wiley & Sons, New York, 1979),Vol. 6, pp. 156-157. 53 Petition, p. 10. 54 Petition, p. 9. 55 Petition, p. 9. 56 Petition, p. 10. 57 Petition, pp. 10-11; Petitioners’ posthearing brief, exh. 2, p. 9.
I-11
Modern, large-scale production of citric acid is achieved through fermentation.45 Thefermentation process involves the action of specific strains of organisms such as the Aspergillus nigermold or the Candida lipolytica or Candida guilliermondii yeast upon a substrate.46 Once the substrate isturned into glucose, it is fermented into crude citric acid by the organism.47 The yield of citric acid can beoptimized through the careful control of fermentation conditions, such as temperature, acidity oralkalinity, dissolved air or oxygen, and the rate of stirring of the mixture. Each fermentation reaction isdone in batch in large tanks which hold several thousand gallons and takes approximately *** to achievea citric acid yield of *** percent, based on the weight of the sugar.48
Producers ferment the substrate by one of three different methods: “shallow pan,” “deep tank,”or solid-state.49 Citric acid was originally produced using a shallow pan or liquid surface culturetechnology, where microbial fermentation occurred on the surface of the liquid. Some smaller, olderChinese plants may still use this technology.50 Most modern production of citric acid uses a deep tank ora submerged culture process, where the reaction is constantly agitated or stirred with air in order to allowthe organism to grow throughout the mixture. The petitioners use only the deep tank method ***.51 Thesubmerged culture process is favored due to the economics of increased yields, although reactionconditions must be more tightly controlled.52 According to petitioners, solid-state fermentation is usedonly in Japan.53
Corn starch is the principal substrate in the United States, Canada, and China. U.S. producersalso use molasses.54 Some Chinese producers also use cassava, sweet potato, or wheat.55
The second stage of production, recovery and refining, is normally performed by one of threecommon processes: the lime/sulfuric acid method, the solvent extraction method, or the ion exchangemethod. All three of these processes are compatible with either the shallow pan or deep tank fermentationprocesses.56
In the lime/sulfuric acid refining process, calcium hydroxide (lime) is added to the fermentationbroth to precipitate out calcium citrate slurry, the CCC that is also part of the scope. After the calciumcitrate is separated by filtration, it is washed to remove soluble impurities. The citrate is then mixed withsulfuric acid to produce a citric acid/charcoal slurry and gypsum (calcium sulfate). The citric acid is thenpurified through evaporation, crystallization, centrifugation, and drying. This process is used by ***most Chinese producers.57
The second common refining method, used by ***, is the solvent extraction process. Thisprocess does not involve the production of calcium citrate or gypsum. Instead, solvents separate the citric
58 Petition, p. 11; Petitioners’ posthearing brief, exh. 2, p. 9. 59 Staff telephone interview with ***. E-mail from ***. 60 Petition, p. 11. 61 During the preliminary phase of these investigations, at least one purchaser claimed that monosodium citrate isnot made by the U.S. producers and questioned why it is covered in the scope of these investigations. Petitionersacknowledged that they do not produce monosodium citrate, but stated that they are able to do so. They also statedthat monosodium citrate can substitute for citric acid and trisodium citrate, and that the conversion frommonosodium citrate to either citric acid or trisodium citrate involves a relatively simple and inexpensive process. Petitioners’ posthearing brief, exh. 6, pp. 1-3. 62 Petition, p. 12. 63 Petition, p. 13. 64 Conference transcript, pp. 23-24 (Oakley). 65 During the preliminary phase of these investigations, crude calcium citrate was referred to as “unrefinedcalcium citrate.” An interested party requested that Commerce clarify the definition and rename this product “crudecalcium citrate” in its scope language. See Citric Acid and Certain Citrate Salts from the People’s Republic ofChina: Preliminary Affirmative Countervailing Duty Determination and Alignment of Final Countervailing DutyDetermination with Final Antidumping Duty Determination; 73 FR 54367, September 19, 2008. 66 Conference transcript, p. 19 (Oakley). 67 Conference transcript, p. 19 (Oakley) and p. 87 (Ellis).
I-12
acid slurry from spent biomass. The subsequent processes of evaporation, crystallization, centrifugation,and drying are similar to those used in the lime/sulfuric acid process.
The third refining method, ion exchange, is a recent development. In this method, the slurry ispassed through a bed of polymer-based resin. Ionic mineral elements such as calcium and magnesiumadhere to the resin, thus removing them from the citric acid slurry. The subsequent steps are similar tothe other two processes.58 *** use the ion exchange method. ***.59
All three refining methods produce citric acid that is dissolved in water. The temperature usedfor the crystallization process determines whether the anhydrous or hydrous form is produced.60
Producers can either sell the citric acid or convert it into salts. Petitioners produce dihydratesodium citrate and anhydrous sodium citrate by diverting some of the citric acid slurry to a line dedicatedto citric salt production, where the slurry is reacted with sodium hydroxide or sodium carbonate.61 Similarly, potassium citrate is produced by reacting citric acid slurry with potassium hydroxide orpotassium carbonate.62
The dry forms of the subject merchandise are packaged in polyethylene-lined paper bags,typically holding 50 pounds or 25 kilograms. “Super sacks” containing 500 to 2,000 pounds are alsoused. When preferred in solution form, the subject product is shipped in drums, railcars, or tank trucks. Drums are usually 200 to 275 pounds.63
Sodium citrate and potassium citrate can also be produced by some distributors that are known as“converters.” Converters can provide either citric acid as purchased from the manufacturer, or have theequipment on hand to blend sodium hydroxide or potassium hydroxide with citric acid, thus producingsodium citrate or potassium citrate, respectively.64
INTERMEDIATE PRODUCT
Crude calcium citrate (“CCC”)65 is an intermediate product of producers that use the lime/sulfuricacid refining method.66 During the preliminary phase of these investigations, petitioners asserted thatCCC has only one function - to be converted into citric acid.67 Respondents did not contradict thisassertion. Petitioners stated that there is not a separate CCC market in the United States or anywhere else

68 Conference transcript, pp. 19 and 87 (Oakley). 69 Conference transcript, p. 54 (Ellis). 70 Conference transcript, p. 59 (Ellis). 71 Petitioners’ postconference brief, p. 4. 72 Ibid., exh. 1, p. 2. 73 E.g., Chinese respondents’ postconference brief, p. 6; conference transcript, p. 137 (Porter, Waite). 74 Citric Acid and Certain Citrate Salts from Canada and China, Inv. Nos. 701-TA-456 and 731-TA-1151-1152(Preliminary), USITC Publication 4008, June 2008, pp. 11-12. In the Commission’s 2000 investigation, the scope ofwhich included only citric acid and sodium citrate, the Commission defined a single domestic like product thatincluded both, finding that “although specific end product formulations limit the actual interchangeability of citricacid and sodium citrate, the record indicates that they are physically and chemically similar, are sold through thesame channels of distribution at similar prices and share the same manufacturing processes, as well as commonproduction facilities and employees . . . even though there are a few end uses unique to each of them, citric acid andsodium citrate can be used for similar purposes in a wide variety of food, beverage and industrial products.” CitricAcid and Sodium Citrate from China, Inv. No. 731-TA-863 (Preliminary), USITC Publication 3277, February 2000,p. 7. The scope of these investigations includes citric acid, sodium citrate, and additionally, potassium citrate. 75 Citric Acid and Certain Citrate Salts from Canada and China, Inv. Nos. 701-TA-456 and 731-TA-1151-1152(Preliminary), USITC Publication 4008, June 2008, p. 11. 76 Petitioners’ prehearing brief, p. 6.
I-13
around the globe, but they have been aware of instances when CCC was shipped from one country toanother for further processing.68 Although there are no known imports of CCC,69 petitioners said thatthey included it in the scope of the subject product to avoid circumvention.70 The parties have not raisedissues with regard to CCC during the final phase of these investigations.
DOMESTIC LIKE PRODUCT ISSUES
During the preliminary phase of these investigations, the petitioners contended that theCommission should find one domestic like product that is co-extensive with the scope of merchandisesubject to the investigations as identified by Commerce.71 They claim that potassium citrate, much likesodium citrate, has many of the same end uses as citric acid, is derived from the citric molecule, producedin the same production facilities, and sold in the same markets.72 During the preliminary phase,respondents agreed with petitioners’ proposed definition of the domestic like product.73
The Commission preliminarily determined that the domestic like product should be defined in thesame manner as the scope defined by Commerce.74 Based on the preliminary record, the Commissionstated that “there is a continuum of domestically produced products corresponding to the scope of theseinvestigations, and no clear dividing lines based on chemical or physical form, grade, or product type. Whether in an intermediate form as unrefined calcium citrate, as citric acid, or transformed into sodiumcitrate or potassium citrate, citric acid and its citrate salts come in a variety of chemical and physicalforms and grades for a variety of end uses, and physical appearance varies accordingly. All have similarchemical composition.”75
In the final phase of these investigations, petitioners urge the Commission to continue to hold theposition they took in the preliminary phase, calling for a single domestic like product coextensive with thescope as determined by Commerce.76 No respondent has raised an issue with regard to the domestic likeproduct in the final phase of these investigations.


1 See Part IV for data on the relative sizes of these markets. 2 Petition, p. 7. 3 Petition, p. 12, and conference transcript, p. 20 (Oakley). 4 Conference transcript, p. 54 (Staloch). 5 Petitioners’ posthearing brief exh. 1, p. 7. Staff notes that ***. 6 Conference transcript, pp. 8-9 (Ellis). 7 Hearing transcript, pp. 169-170 (Rainville). 8 *** also reported difficulty using Chinese product due to caking problems, and added that ***. See Part IV formore details. 9 Conference transcript, pp. 110-114 (Hsu). 10 Hearing transcript, pp. 215-216 (Rainville, Mendoza). 11 *** U.S. producers submitted both producers’ and importers’ questionnaires in these investigations. Theiranswers were the same for both questionnaires submitted by their firm, thus, in this chapter, their responses havebeen counted only among producers.
II-1
PART II: CONDITIONS OF COMPETITION IN THE U.S. MARKET
U.S. MARKET SEGMENTS
Citric acid and certain citrate salts have three primary end-use markets: foods and beverages(especially carbonated beverages and health drinks), industrial (detergents and cleaners), andpharmaceuticals.1
In the food and beverage segment, citric acid and certain citrate salts must meet the puritystandards of the U.S. Food and Drug Administration’s (“FDA”) Food Chemical Codex (“FCC”) for salein the U.S. market. Likewise, in the pharmaceutical segment, citric acid and certain citrate salts mustmeet the standards of the U.S. Pharmacopoeia (“USP”).2 Citric acid and certain citrate salts that meetFCC and USP standards are called “food grade,” a standard higher than that required for the industrialsegment. However, U.S. producers typically manufacture citric acid and certain citrate salts to meet thesame FCC/USP standards regardless of end use, and they sell “food grade” product to the industrialsegment as well as to the food and drug segment.3 JBL Canada, the Canadian producer, reports that all ofits product is food grade. Petitioners stated that there is no price premium for product sold into the foodand beverage segment.4 ***. ***.5
Petitioners stated that subject imports from both Canada and China compete with the U.S. productacross all the market segments for citric acid and certain citrate salts.6 JBL Canada asserts that its productis mainly sold in the food and beverage segment of the market; it also sells to the pharmaceutical segment,but sells relatively limited amounts to the industrial segment.7 Although importer United Foods statedthat the Chinese product does not compete in the soft drink segment8 ***. United Foods also reportedthat the Chinese product is more available in the smaller food product segment, where the smallervolumes make the market less interesting to U.S. producers accustomed to larger shipment volumes.9 JBL and the Chinese producers report that they do not know the ultimate market of much of the productthey sell through distributors.10
*** sell citric acid and/or certain citrate salts throughout the United States.11 Among otherimporters, 15 of the 26 responding sold to a national market, two sold to six regions, two sold to tworegions, and seven sold to only one region. Sales to the Midwest and the Southeast regions were mostcommon, reported by five or six importers.
12 Conference transcript, pp. 74-75 (Oakley).
II-2
CHANNELS OF DISTRIBUTION
Petitioners stated that all major domestic and foreign producers compete for critical large volumeaccounts across the food, beverage, and detergent industries. The largest four end users that providedpurchaser questionnaires accounted for 38.6 percent of U.S. citric acid and certain citrate saltsconsumption between 2006 and 2008, while the largest 12 end users accounted for 49.8 percent. Petitioners report that citric acid and certain citrate salts are not sold to end users or distributors based onwhat end use is intended for the product, but rather on volume, with smaller-volume purchasers buyingfrom distributors and larger end users buying directly from producers and importers.12
Table II-1 presents information on channels of distribution for U.S. producers as well as for U.S.importers of subject product from Canada, China, and product from nonsubject countries. U.S. productand subject imports were consistently sold to end users more frequently than to distributors, although U.S.producers ship a higher share of their product to end users than importers do. Nonetheless, some of thelargest distributors of domestic product are also importers of Chinese product; thus, an end userpurchasing from a single distributor/importer may be reported as purchasing from a distributor fordomestic product and directly from an importer for Chinese product.
Table II-1Citric acid and certain citrate salts: U.S. producers’ and U.S. importers’ reported U.S. shipments ofsubject product, by channels of distribution, 2006-2008
* * * * * * *
The pricing data provided by the U.S. producers and the importers, detailed in Part V, alsoprovides information on the channels of distribution. Almost 95 percent of U.S. citric acid products forwhich price data were reported was sold to end users. Subject imports were more likely to be sold todistributors in spite of the fact that the largest importers also frequently act as distributors for domesticproduct. Sales of citrate salts tend to be somewhat less concentrated in sales to end users, as shown in thefollowing tabulation.
Product Type of purchaser U.S. Canada China
Citric acid
End users 94.9 *** 86.0
Distributors 5.0 *** 14.0
Citrate salts
End users *** -- 76.9
Distributors *** -- 23.1
Purchasers
Sixty-nine purchasers responded to the Commission’s purchasers’ questionnaire, of which 41were end users and 28 were distributors. While there are many end users for citric acid and related citratesalts, purchases tend to be relatively concentrated. The top purchasers in order of size are ******, each of which reported purchasing more than *** pounds of citric acid and related citrate salts overthe three years 2006-2008. *** pounds of citric acid and related citrate salts (including its imports). Allother purchasers each report purchasing less than *** pounds of citric acid and related citrate salts

13 These purchases include some imports and there may be some double-counting if any of these purchaserspurchased from any of the listed distributors. 14 Purchasers who had purchased more than 20 million pounds of citric acid and salts in 2006, 2007, or 2008 werealso requested to provide additional price data; details of their purchases and negotiations are in app. D. 15 ***. 16 Petition, p. 10. 17 Conference transcript, p. 35 (Poulos). 18 ***. 19 Petitioners’ prehearing brief, pp. 79-82.
II-3
products over the three years. Many purchasers reported more than one end use for their citric acid. Information on the top purchasers of citric acid is presented in table II-2. These 17 large purchasersreported purchasing a total of *** billion pounds of citric acid between 2006 and 2008.13 All 17 firmsreported purchasing U.S. product (two purchased U.S. product only); 9 purchased Canadian product; 13purchased Chinese product; and 10 purchased nonsubject product.14
Table II-2Citric acid and certain citrate salts: Major reporting purchasers of citric acid and certain citratesalts, 2006-2008, by industry, total amount purchased, and country sources
* * * * * * *
SUPPLY AND DEMAND CONSIDERATIONS
U.S. Supply
Domestic Production
Based on available information, U.S. citric acid and certain citrate salts producers have the abilityto respond to changes in demand with moderate-to-small changes in the quantity of shipments of U.S.-produced citric acid and certain citrate salts to the U.S. market. Factors which constrain supplyresponsiveness include no production of alternate products using the same equipment used to producecitric acid and certain citrate salts, high capacity utilization, and overall capacity has not increased fromthe 2006 levels.15 However, the existence of alternative markets and inventories may increase the supplyresponsiveness.
Industry capacity
U.S. producers use deep tank fermentation to produce citric acid and certain citrate salts. Thismethod is reportedly more productive and has lower labor costs than the shallow pan process that may be used by some Chinese plants, but has higher energy costs.16 U.S. producers stated that because of thehigh fixed costs in the industry, reducing production has “substantial” costs.17
Overall U.S. capacity is unchanged since 2006. Capacity utilization was relatively high andincreased steadily from 85.8 percent in 2006 to 91.7 percent in 2008. According to ***.18 Petitionersassert that the domestic industry has not been able to make the “lumpy” types of capital investmentneeded to build additional capacity because of the recent poor financial returns.19
20 Conference transcript, p. 77 (Anderson). Petitioners’ posthearing brief, exh. 2, p. 17. 21 P&G’s prehearing brief, p. 32. Petitioners report that their export AUVs were higher than AUVs of domesticshipments in 2008. Petitioners’ posthearing brief, exh. 3, p. 7. 22 P&G’s prehearing brief, p. 33. 23 Hearing transcript, p. 60 (Anderson). 24 Hearing transcript, pp. 140-141 (Oakley and Poulous). 25 Hearing transcript, pp. 51-52 (Satloch). 26 PepsiCo’s prehearing brief, pp. 4, 8.
II-4
Among U.S. producers, *** stated that there had been no changes in the product range ormarketing of citric acid and certain citrate salts since January 1, 2005. ***, however, stated thatmarketing had become more price-focused because of large volumes of available imported material.
Alternative markets
Between January 2006 and December 2008, U.S. producers exported between 20.7 percent ofproduction (in 2006) and 22.2 percent of production (in 2007). U.S. producers reported that they coulddivert export shipments to the U.S. market if circumstances warrant and plan to shift almost *** of their2008 exports to the U.S. market.20
Respondent P&G does not believe there is much ability for U.S. producers to increase productionor willingness on their part to shift product to the U.S. market. It cited as evidence of unwillingness toshift product to the U.S. market the inability of the U.S. producers to provide all the product purchasersrequested while the producers continued to export despite the AUVs for exports being lower than thosefor U.S. shipments throughout the period for which data were collected in this investigation.21 P&G alsoasserts that by 2008 the U.S. producers were “effectively operating at 100 percent of capacity.”22
Inventory levels
U.S. producers’ inventories fell steadily from 16.6 percent of shipments in 2006 to 8.7 percent in2008. However, at this level, U.S. producers have some ability to use inventories as a means to increasesupply.
Production alternatives
U.S. producers reported that they did not produce any other products on the equipment used toproduce citric acid and certain citrate salts. However, the main input in citric acid production, corn, isused in the production of other products, including ethanol; ***.
Supply availability
Petitioners report that the claims of shortages are overwhelmingly related to 2008 and areindicative of the petition’s effects.23 ADM and Tate & Lyle reported that they met all their contractualobligations in 2008.24 Cargill reported that for the year 2008, it was able to meet its contractualagreements with all but one major customer, in spite of a plant disruption that caused the loss of about oneweek of production.25
Respondent PepsiCo reports that the “domestic producers are unable (and apparently unwilling)to satisfy United States demand for citric acid,” ***.26 ***. P&G reported that in 2008, its shipmentsfrom one producer declined by 30 percent at the producer’s request, one U.S. producer supplied under
27 Hearing transcript, pp. 183-184 (Smith). Petitioners report that ***. Petitioners’ posthearing brief, ex 3, p. 25. 28 Hearing transcript, p. 220 (Smith). 29 Hearing transcript, pp. 193-195 (Hofmann). 30 Hearing transcript, pp. 199-201 (Pensak). 31 Hearing transcript, pp. 205-206 (Bloom). 32 P&G’s posthearing brief, p. 11. 33 ***. ***.
II-5
half of its agreed volume, and the third producer had no material available to meet any of the shortfalls ofthe other U.S. producers.27 As a result, it reported, only one of the U.S. producers met its contractualrequirement, and the other two did not meet contractual requirements both in terms of timing andvolume.28 Reckitt Benckiser reported that in 2007 it began to purchase from JBL Canada “only after U.S.producers refused to offer sufficient quantities to us.” It reported that it was unable to contract for all theproduct it wanted from U.S. producers in 2009. U.S. producers, it reported, have little interest in meetingthe needs of small to mid-sized purchasers, preferring “to focus on large food and beverage purchasers.”29 Vertellus reported that in 2008, Tate & Lyle’s delivery lead times grew from 1 week to 10 weeks; thisforced it to purchase Chinese product on the spot market to maintain supply. According to Vertellus, Tate& Lyle refused to contract to supply it in 2009, in spite of a “20-year relationship with Tate & Lyle,” andthe other U.S. producers also refused to supply it in 2009. Vertellus reported that U.S. producers refusedto supply it in spite of having capacity to produce what Vertellus needed since the U.S. producers reportthat they are not producing at full capacity.30 FBC reported that although Tate & Lyle had supplied it in2008, all three U.S. producers refused to contract to supply it in 2009.31 P&G also reported that worlddemand is at *** percent of world supply, indicating that the citric acid market is tight worldwide.32
Purchasers were asked a number of questions about the availability of citric acid and certaincitrate salts. Forty-eight of 65 responding purchasers (including ***) reported that the spike in cornprices had not affected the availability of citric acid and certain citrate salts. Twenty-nine of 69responding purchasers reported that they had been put on allocation or had limits put on the amount ofcitric acid and certain citrate salts that they could purchase since January 2006. All three U.S. producers,JBL, and some importers of Chinese product were reported to have limited supply. ***.33 According topurchasers, reasons for limits on supply included: ***; U.S. manufacturers and their distributors refusingto quote from the end of 2008 to the time questionnaires were filled out; Tate & Lyle, JBL, ADM, andCargill were sold out from January 2007 to 2008, forcing purchasers to use spot purchases; ***; Canadianproduct was redirected to the U.S. beverage market in 2007, causing the purchaser to use more Chineseproduct; and reduced supply of Chinese product due to the Olympics.
Twenty-four of 69 responding purchasers reported that some suppliers were unable to supplysome or all of their requirements. Sources from which purchasers were not able to obtain sufficientsupply included U.S. producers, JBL, importers of Chinese product, and importers of product from Israel. *** reported that individual U.S. producers had been unable to meet their requirements.
Subject Imports
Canada
Based on available information, JBL Canada, the Canadian producer, has the ability to respond tochanges in demand with moderate changes in the quantity of shipments of citric acid and certain citratesalts to the U.S. market. It has *** inventories, *** exports but a *** share of exports going to countriesother than the United States, and *** capacity utilization. JBL Canada increased its capacity from 2006

34 *** to produce citric acid and certain citrate salts. *** an ion-exchange method of refining (rather than thesolvent extraction ***). Petition, pp. 10-11. 35 U.S. Census data on the landed duty paid value of U.S. imports for consumption show that, over the last tenyears, U.S. imports of Austrian product fell from a high of $22.6 million in 2001 to $2.8 million in 2003, and roseslowly to $4.3 million in 2008. U.S. imports of Canadian product rose from $0.1 million in 2001 to $26.6 million in2003 and then $68.9 million in 2008. 36 Conference transcript, pp. 117-119 (Waite). 37 Official Journal of the European Union, December 3, 2008.
II-6
to 2008, and reported that it had not observed any changes in the *** of citric acid and certain citratesalts.
Industry capacity
JBL Canada is the only known Canadian producer of citric acid.34 Its capacity increased from*** pounds in 2006 to *** pounds in 2008. JBL Canada projects that its capacity ***. Capacityutilization increased from *** percent in 2006 to *** percent in 2008.
JBL Canada produces only citric acid, not certain citrate salts, in its Canadian plant. It reportedthat it chose its Canadian location because of the proximity to customers, its main raw material supplier(Corn Products International), and its water supply. It also said that it has replaced supplying the U.S.market citric acid from its Austrian plant with production from its Canadian plant.35 It added that all of itsCanadian citric acid is food grade.36
Alternative markets
JBL Canada’s exports to markets other than the United States accounted for *** percent of itstotal shipments in 2006, *** percent in 2007, and *** percent in 2008. Sales to the Canadian homemarket were ***, falling from *** percent in 2006 to *** percent of shipments in 2008.
Inventory levels
JBL Canada’s inventories were ***, accounting for *** in 2008.
China
Based on available information, Chinese producers have the ability to respond to changes indemand with moderate-to-large changes in the quantity of shipments of citric acid and certain citrate saltsto the U.S. market. The main contributing factors to the high degree of responsiveness of supply are theincrease in capacity, the existence of alternate markets, and the availability of inventories. The December2008 decision by the EU to address Chinese dumping via the imposition of antidumping duties and/or theacceptance of price undertakings on product from China may also contribute to some degree to Chineseresponsiveness.37
Industry capacity
Petitioners stated their belief that large Chinese producers use the deep tank fermentationproduction process (also used by U.S. producers ***), but that some smaller and older Chinese producers

38 Petition, p. 10. 39 Conference transcript, p. 25 (Oakley). 40 Conference transcript, p. 43 (Anderson). 41 Petition, pp. 33-34. 42 Hearing transcript, pp. 163-164 (Shao). 43 Chinese respondents’ prehearing brief, p. 72. The petitioners report that ***. Petitioners’ posthearing brief,exh. 1, p. 38. 44 Chinese respondents’ prehearing brief, p. 73. 45 Chinese respondents’ prehearing brief, p. 80. 46 Chinese respondents’ prehearing brief, p. 80. 47 Hearing transcript, p. 166 (Shao). 48 Petitioners’ posthearing brief, exh. 4, pp. 1-5.
II-7
may still use the shallow pan production process.38 Petitioners described the equipment used by the fivelargest Chinese producers as “world class.”39 Petitioners also stated that most Chinese product isanhydrous now (unlike during the previous investigation in 2000).40 Petitioners also described Chinesecapacity as having undergone massive expansion (that they claim was subsidized by the Chinesegovernment) in order to increase exports, as the Chinese market for citric acid is much smaller thanChinese capacity to produce citric acid.41
Chinese producers representing the vast majority of Chinese production responded to theCommission’s foreign producer questionnaires. Reported overall capacity increased from 1.4 billionpounds in 2006 to 2.0 billion pounds in 2008.
Chinese respondents report that the Chinese citric acid industry has been consolidating since2002, and by 2008, 15 Chinese producers were approved for exports.42 Chinese respondents report thatChinese producer ***.43 In addition, they report that DSM, a Chinese producer with a reported capacityof 110 million pounds, has discontinued production in China, has closed its factory, and does not plan torebuild capacity in China.44
Alternative markets
Exports of Chinese citric acid and certain citrate salts to the United States accounted for 11.2percent of China’s reported shipments in 2006, 9.4 percent in 2007, and 10.0 percent in 2008. Shipmentsof Chinese citric acid and certain citrate salts to the Chinese home market (including internalconsumption) were 26.2 percent of total shipments in 2006, 28.6 percent in 2007, and 28.9 percent in2008. Most shipments between 2006 and 2008 were to non-U.S., non-Chinese markets; shipments tothese alternative markets accounted for between 61.2 and 62.6 percent of total Chinese shipments.
Exports of citric acid to the EU are subject to a December 2008 price undertaking. The Chineserespondents report that the EU expected imports from China to “remain at a substantial level, appearingsufficient to guarantee the security of supply in the EU.”45 With this price undertaking in place, theycontend that “the Chinese producers can maintain their traditional reliance on the EU as their primaryexport market.”46 In addition, demand within China is expected to grow.47 The petitioners contend thatdemand is at best stable and likely to decline; they noted that predictions of growth were made before theglobal recession began and are no longer relevant.48
49 Conference transcript, pp. 73-74 (Ellis and Anderson). 50 P&G reported that it has contemplated replacing phosphates with citric acid in dishwasher detergent but lack ofavailability of domestic supply may force it to look to other formulations or technologies. Hearing transcript, pp.185-186 (Smith). ***. 51 Petition, p. 8. 52 Petition, p. 8. 53 *** and staff calculations. 54 Conference transcript, pp. 118-119 (Waite).
II-8
Inventory levels
Inventories of Chinese citric acid and certain citrate salts accounted for 6.2 percent of their totalshipments in 2006 and 2007, but then more than doubled to 13.1 percent in 2008.
Nonsubject Imports
Citric acid and certain citrate salts have been imported into the United States from Israel,Colombia, Germany, Thailand, Austria, and Belgium, listed in descending order of 2008 volume. Petitioners described Belgium as producing substantially less than Canada and China, and all othernonsubject countries produce less than Belgium.49
U.S. Demand
Based on the available information, it is likely that changes in the price level of citric acid andcertain citrate salts will result in a small change in the quantity of citric acid and certain citrate saltsdemanded. The main contributing factor to the small degree of responsiveness of demand is the low costshare of citric acid and certain citrate salts in most of their end uses. Contributing to some extent is (1) increases in price and supply uncertainty are likely to inhibit demand growth as firms formulate newproducts so that they do not include citric acid and certain citrate salts and (2) experimental uses such asgreen cement become less competitive.50
End Uses
In the food and beverage industry, citric acid is used as an acidulate, a preservative, and a flavorenhancer, especially in beverages (including carbonated, non-carbonated, dry powdered, and wine), jams,desserts, frozen foods, and canned fruits and vegetables. Citric acid is also used in pharmaceuticals andcosmetics, as well as in household laundry detergents, metal finishers, cleaners, textile treatments, andother industrial applications.51
Sodium citrate is used in the same products (and for the same reasons) as citric acid, but hasadditional uses in cheese and other dairy products, household cleaner products, and pharmaceuticals.Potassium citrate is used in pharmaceutical products as an antacid, a diuretic, and an expectorant. It isalso used in “electro polishing” and as a buffering agent, and can be used in place of sodium citrate infood and beverage products when it is important to reduce the sodium content.52
***, U.S. consumption of citric acid in 2005 was ***.53 JBL Canada estimated that, on a globalbasis, demand for citric acid was 40 percent for beverage end uses, 20 percent for food end uses, 25percent for detergent end uses, and the remainder for pharmaceuticals.54

55 P&G’s posthearing brief, p. 11 and exh. 6. 56 Conference transcript, p. 122 (Waite). 57 ***. 58 Petition, p. 8. 59 Conference transcript, p. 61 (Staloch), and petitioners’ postconference brief, exh.1, p. 29. 60 Chinese respondents’ prehearing brief, pp. 7-8. 61 Hearing transcript, p. 211 (Smith).
II-9
Demand Characteristics
*** reported that U.S. consumption of citric acid and salts was *** metric tons (*** pounds) in2005 and that world consumption of citric acid and salts was *** metric tons (*** pounds). *** projectedthat U.S. consumption of citric acid and salts will rise to *** metric tons (*** pounds) in 2010. ***estimates place the United States market as smaller than that of *** but larger than that of ***. P&Greports that in 2008 demand was expected to increase by ***.55
Demand from beverage manufacturers is highest from April to August of each year.56 However, alarge portion of contracting is performed near the end of each year (see Part V for details on length ofcontracts and timing of these agreements).
Fifty-three of the 68 responding purchasers reported that the quantity of their purchases variesover the year. Seasonality was reported to account for this variation by 25 of these purchasers; otherfactors noted include sourcing customer requirements, product demand, price, and availability. ***.
Demand Trends
Increasing U.S. demand since 2006 was reported by all three producers and by 21 of 26responding importers. Four importers reported that demand was unchanged and one reported that demandhad fallen with the economic downturn. Reasons for increased demand included economic growth; citricacid is a relatively inexpensive product; downstream products were reformulated to increase use of citricacid; increased use in detergents; sodium reduction initiatives; and new products.
Purchasers who were end users were asked if demand for their end products which incorporatecitric acid and related citrate salts had changed since January 2006. Twenty of the 41 respondingpurchasers reported increased demand for their products; 16 of the 20 reported that this had increasedtheir demand for citric acid and related citrate salts while 4 stated that it had not. Five firms reported thatdemand for end product had decreased; four of these firms reported that this had affected the demand forcitric acid and related citrate salts. Nine purchasers reported that demand had fluctuated, with sixreporting that it had affected demand for citric acid and related citrate salts. Seven purchasers reportedthat the demand for their end products was unchanged.
Petitioners ***57 reported that the use of citric acid in laundry detergents has increased as citricacid has replaced phosphate-based formulations and because of the growth in sales of ultra-concentratedliquid detergents, which contain more citric acid than powdered detergents.58 Petitioners also describeddemand for potassium citrate as increasing due to the increased demand for low-sodium food andbeverages, but later characterized detergent manufacturers as not having yet switched their formulas toincorporate citric acid.59 Chinese respondents reported that demand for citric acid remains strong in spiteof the economic downturn.60 Respondents predicted the increased use of citric acid because dishwashingdetergent will be required to no longer use phosphates after July 1, 2001;61 plasticizers will attempt to

62 Hearing transcript, p. 198 (Pensak). 63 Chinese respondents’ prehearing brief, pp. 8-10. ***. 64 ***. 65 Petitioners’ posthearing brief, exh. 4, pp. 2-3. 66 Hearing transcript, pp. 37-38 (Poulos). 67 Petitioners’ posthearing brief, exh. 4, pp. 3-4. 68 Hearing transcript, p. 74 (Anderson). 69 Petitioners’ posthearing brief, exh. 4, p. 5. 70 Petitioners’ posthearing brief, exh. 8. 71 Petitioners’ prehearing brief, exh. 16. “DSM announces closure of its citric acid manufacturing plant in Wuxi(China).” 72 Hearing transcript, p. 171 (Button). 73 Hearing transcript, p. 191 (Taylor). 74 Hearing transcript, p. 185 (Smith). 75 Hearing transcript, p. 187 (Smith). 76 Hearing transcript, p. 194 (Hofmann).
II-10
replace phthalate plasticizers;62 and there is potential for replacing Portland cement with green cement, allpotentially increasing use of citric acid and related citrate salts.63
*** reported that the main driver for citric acid demand growth is ***.64
Future demand
Petitioners predict that demand will fall with the current economic downturn. They stated that thedecline was not felt in 2008 because the recession only began to have an impact late in 2008.65 Petitioners also predicted that, for developing markets, citric acid demand will stagnate or decline;although economic development in the developing markets would lead to increased per-capitaconsumption, developing countries have been worse hit by the economic downturn. According to thePetitioners, China’s consumption has already fallen and its inventories have increased, so petitionersexpect product to flood the U.S. market if duties are not imposed.66 In addition, Petitioners reported thatdemand for products using citric acid is also declining in the EU.67 They report that in spite of P&G’sstatements that it does not expect its demand for citric acid to decline, P&G reported substantial drops involume; in addition, falling sales in other countries will increase the Chinese product available for sale tothe United States.68 New uses are speculative.69 ***.70 Moreover, structural overcapacity is expected toremain in the world market.71
On the whole, respondents expected demand for citric acid to not decline significantly during thecurrent recession.72 PepsiCo reported anticipating “flatter, slightly declining volume for its beverageproducts in the current economic environment,” but expects demand to rise in the longer run.73 P&Greported that its sales fell 4 percent in its fabric and household care business during October to December2008, but that “this reduction was primarily caused by P&G’s customers reducing their inventories” andthese inventory reductions are expected to be temporary, as orders are already increasing.74 P&G reportedthat it estimated “global demand to be between 92 and 95 percent of global producers’ effective capacityto produce citric acid,” and as a result is talking with producers to increase the supply dedicated to P&G’suse.75 Reckitt Benckiser reported estimating “global operating capacity rate at above 90 percent andmarket growth at 6 to 8 percent annually even in today’s adverse economy.”76 Reckitt Benckiser reportedthat it will be eliminating phosphates from dishwashing detergents after July 1, 2010, requiring a newformulation that increases use of trisodium citrate, thus increasing its volume of purchases “roughly

77 Hearing transcript, pp. 196-197 (Hofmann). 78 Hearing transcript, p. 210 (Hofmann). 79 Hearing transcript, pp. 197-198, 213 (Pensak). 80 Petitioners do not expect demand to increase significantly in large scale applications including green cement,dishwashing detergents, while the increased demand for oil sands will be depressed with the price of crude. Petitioners’ posthearing brief, exh. 9, pp. 2-3. 81 Respondent P&G’s posthearing brief, p. 11. 82 Hearing transcript, pp. 175-176 (Smith). 83 Hearing transcript, pp. 188-190 (Taylor). 84 Hearing transcript, pp. 193-194 (Hofmann). 85 Petitioners’ prehearing brief, pp. 23-24, 28-29.
II-11
fourfold.”77 It also reported that the EU is considering banning phosphates in dishwashing detergents, andthat such a change in Europe would increase global demand by 10 percent.78 Vertellus reported that itexpects demand to increase despite the recession because of health and safety restrictions on the use ofsome phthalates which could be replaced by citrate esters.79 80 Respondents characterize global supply astight with world demand *** percent of world supply.81
Changing Purchase Patterns
Twenty-three of the 69 responding purchasers reported that they had changed purchasing patternsof citric acid and certain citrate salts in the last 3 years. Most of these reported that increased sales hadresulted in increased purchases, but three reported that shortages or lack of domestic supply had causedpurchasing patterns to change, increasing imports. Thirty-seven of 68 responding purchasers reportedchanging suppliers; a number of these shifted purchases among importers. ***.
Variation in Sources Used Within a Year
Forty-three of the 68 responding purchasers reported that the source of their product varies withina year. Factors affecting sourcing were customer requirements, product specifications, product demand,price, availability, and required volume above that contracted. ***.
Reasons Purchasers Use of Multiple Sources
P&G reported that it diversifies its sources of supply among producers both inside and outside theUnited States in order to ensure reliability of supply and minimize the risk of plant disruptions.82 Similarly, PepsiCo reported diversifying its supply to ensure that quality product is available to maintainand increase production.83 In contrast, Reckitt Benckiser reported that it prefers to use only material fromU.S. sources for security and planning reasons, but that in 2007 it purchased from JBL because U.S.producers refused to offer it sufficient quantities.84 Petitioners report that there were no problems withavailability during 2006 and 2007, and any such problems in 2008 were caused by the filing of thepetition.85

86 Hearing transcript, pp. 185-186 (Smith). 87 The Soap and Detergent Association, letter to the Commission, March 25, 2009.
II-12
Substitute Products
*** responding U.S. producers, 9 of the 28 responding importers, but only 10 of the 63responding purchasers, reported substitutes for citric acid and certain citrate salts. Substitutes listedinclude acetic acid, azocarbonamide, EDTA (ethylenediaminetetraacetic acid), fumaric acid, HCA(hydroxycitric acid), lactic acid, malic acid, phosphoric acid, potassium chloride, potassium phosphate,sodium bicarbonate, sulfuric acid, and tartaric acid. *** reported no substitutes for citric acid. P&Greported that in replacing phosphates in dishwasher detergent it is considering both citric acid and “otherformulations or technologies,” reflecting that these are potential substitutes for citric acid, at least at thetime of formulation of new products.86 The Soap and Detergent Association reports that antidumpingduties would force its members to reformulate their products where possible to reduce the use of citricacid, indicating that some substitutes (even if less effective) exist.87
Substitution depends on the customer’s applications. For example, HCA can be used a substituteto lower the pH of a solution, while lactic acid, acetic acid, fumaric acid, malic acid, phosphoric acid, andtartaric acid can be used as substitutes in food and beverage additives, and sulfuric acid can be used as anindustrial acidulate.
*** U.S. producers, nine of the 10 responding importers, and all 10 of the responding purchasersreported that the prices of these substitutes did not affect the price of citric acid and certain citrate salts. The other importer responded that the prices of substitutes did affect the price of citric acid.
Cost Share
Thirty-six purchasers reported the cost share of citric acid and certain citrate salts in one or moreend products, with a total of 75 end-product responses. There were 47 instances where purchasersreported that cost shares were less than 6 percent; 15 instances in which cost shares ranged from 6 percentto less than 25 percent, 5 instances in which cost shares ranged from 25 to less than 50 percent; and 8instances in which cost shares were 50 percent and above. ***.
Eight importers estimated that citric acid and certain citrate salts’ share of the cost of downstreamproducts ranged from 1 to 50 percent for ***, with 11 of the 16 products having cost shares under 6percent. U.S. producers estimated that citric acid and certain citrate salts’ share of the cost of downstreamproducts was relatively low, ranging from under 1 percent to ***.
SUBSTITUTABILITY ISSUES
Purchasers were asked how frequently they purchased citric acid and certain citrate salts at thelowest price. Four reported that they always purchase the lowest-priced product, 27 reported that theyusually purchased the lowest-priced product, 34 sometimes purchased the lowest-priced product, and 4never purchase the lowest-priced product. ***.
Lead Times
Among U.S. producers, *** stated that *** percent of sales were from inventory with a lead timeof ***, while *** sold *** and *** percent respectively from inventory with a lead time of *** days.

88 Petitioners report that lead times normally vary over the year, increasing during periods of high demand. Petitioners’ posthearing brief, exh. 4, pp. 23-24. 89 One additional purchaser did not explain why it would purchase less. 90 One firm reported that if Canadian product were not available it would purchase more Chinese product. Twofirms did not explain their answers.
II-13
The remainder was produced to order with lead times of ***.88 For imports from Canada, JBL reportedselling *** of its product from inventory with a *** lead time.
Thirteen importers reported selling Chinese product from inventory; nine of these sold 90 to 100percent from inventory and the remaining four sold 30 to 50 percent from inventory. Twelve importersreported selling Chinese product on a produced-to-order basis, five of which sold all their citric acid andcertain citrate salts produced to order. Lead times for produced-to-order products ranged from 4 to 63days, with eleven of these firms reporting lead times of 40 days or more.
Response if Subject Imports were No Longer Available
Purchasers were asked if they had purchased product from the subject countries since January2006, and those who had were asked what they would do if this product were not available. Responsesare in the following tabulation.
Source
Purchasedproduct fromthis sourcesince 2006
If product from this country were not available, firm wouldpurchase--
Less productoverall
More U.S.product
More nonsubject-country product
Yes No Yes No Yes No
Canada 27 3 24 18 8 20 6
China 52 12 32 35 12 35 9
Two firms which reported that they would reduce their purchases if the Canadian product were notavailable stated that some of their customers’ specifications allowed only JBL Canada’s product and thatif JBL Canada reduced the amount of product available, these purchasers would buy less.89 Three of thefirms reporting that they would not purchase more U.S. material if less Canadian product were availablereported that there are limited supplies of U.S. material.90 *** reported that U.S. producers had limitedtheir supply, forcing it to look overseas. Two firms reported that they would not reduce their purchases,would increase their purchases of U.S. product, and not purchase overseas. One of these firms, ***,reported that customer demand dictates need, and that domestic supply was likely to be available.
Of the 12 purchasers of Chinese product that reported that if Chinese product were not availablethey would purchase less product overall, seven gave explanations. *** reported that it relies heavily onChinese producers because domestic supply lines have collapsed. *** stated that if Chinese material werenot available, it would have to use other sources or exit the market completely because it did not have thesame variety of U.S. and non-Chinese import options; if its purchases of Chinese material fell it wouldreduce purchases due to lack of supply. *** reported that it was not approved to buy from U.S.producers. *** firm reported that it would buy as long as it could sell to the market based on cost. ***reported that it would try to replace Chinese volume with product from another country. *** reportedthat U.S. producers will not sell to small distributors. *** reported that U.S. product is far too costly touse on a regular basis. Other firms that explained why they would not purchase more U.S. product if

91 Purchasers were asked to report other factors beyond the top three that they considered in deciding from whomto purchase. One purchaser reported that U.S. producers would not sell to it because it was too small, one reportedthat consolidating purchases with those of other ingredients was a factor, and one reported that its purchases areinfluenced by ***.
II-14
Chinese supply were limited mainly reported problems with U.S. supply. *** reported that U.S.producers have limited how much it could buy, forcing it to look overseas. *** reported that the U.S.producers do not make enough product for U.S. needs, therefore it needs to source elsewhere. ***. ***.
Factors Affecting Purchasing Decisions
Purchasers, importers, and producers were asked if the various forms of citric acid (anhydrous,monohydrate, dihydrate, and solution) were always, frequently, sometimes, or never interchangeable(table II-3).
Table II-3Citric acid: Perceived interchangeability between forms, as reported by producers, importers, andpurchasers
Types of citric acid
Number of U.S. producers reporting
Number of U.S.importersreporting
Number of U.S.purchasersreporting
A F S N A F S N A F S N
Anhydrous and monohydrate *** *** 0 0 2 4 8 5 2 3 9 19
Anhydrous and dihydrate1 0 0 0 0 1 1 5 5 1 3 4 17
Anhydrous and solution *** *** 0 0 3 2 9 3 4 2 11 18
Monohydrate and dihydrate1 0 0 0 0 2 1 3 6 1 3 3 17
Monohydrate and solution *** *** 0 0 4 3 5 5 2 3 5 14
Dihydrate and solution1 0 0 0 0 2 1 5 4 1 3 3 15
1 All U.S. producers reported that citric acid did not occur in dihydrate form.
Note.--A = Always, F = Frequently, S = Sometimes, N = Never. Answers from firms that are both producers andimporters are included only with producers. Answers from firms that are both importers and purchasers areincluded with purchasers if they do not sell citric acid in the form in which they purchase it, otherwise they areincluded with importers.
Source: Compiled from data submitted in response to Commission questionnaires.
Major Factors in Purchasing
Purchasers were asked to identify the three major factors considered by their firm in decidingfrom whom to purchase citric acid and certain citrate salts (table II-4). Quality was reported by thelargest number of purchasers as the most important factor. Availability was reported by the largestnumber of firms as the second most important factor. Price was reported by the largest number of firmsas the third most important factor, but was also the factor most reported as being in the top three factors.Other factors reported by more than one purchaser were approved supplier/traditional supplier/contract,consistency, reliability of supply or supplier, product meets specifications, delivery terms,service/technical support, and packaging.91
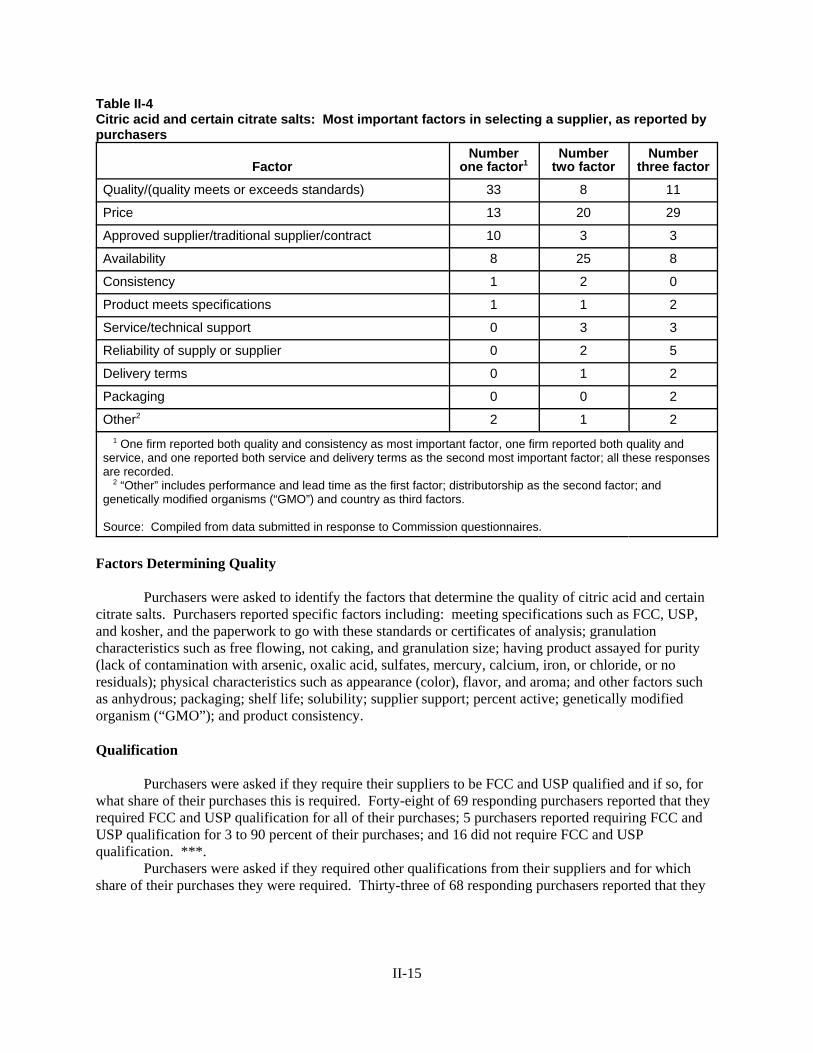
II-15
Table II-4Citric acid and certain citrate salts: Most important factors in selecting a supplier, as reported bypurchasers
FactorNumber
one factor1Number
two factorNumber
three factor
Quality/(quality meets or exceeds standards) 33 8 11
Price 13 20 29
Approved supplier/traditional supplier/contract 10 3 3
Availability 8 25 8
Consistency 1 2 0
Product meets specifications 1 1 2
Service/technical support 0 3 3
Reliability of supply or supplier 0 2 5
Delivery terms 0 1 2
Packaging 0 0 2
Other2 2 1 2
1 One firm reported both quality and consistency as most important factor, one firm reported both quality andservice, and one reported both service and delivery terms as the second most important factor; all these responsesare recorded. 2 “Other” includes performance and lead time as the first factor; distributorship as the second factor; andgenetically modified organisms (“GMO”) and country as third factors.
Source: Compiled from data submitted in response to Commission questionnaires.
Factors Determining Quality
Purchasers were asked to identify the factors that determine the quality of citric acid and certaincitrate salts. Purchasers reported specific factors including: meeting specifications such as FCC, USP,and kosher, and the paperwork to go with these standards or certificates of analysis; granulationcharacteristics such as free flowing, not caking, and granulation size; having product assayed for purity(lack of contamination with arsenic, oxalic acid, sulfates, mercury, calcium, iron, or chloride, or noresiduals); physical characteristics such as appearance (color), flavor, and aroma; and other factors suchas anhydrous; packaging; shelf life; solubility; supplier support; percent active; genetically modifiedorganism (“GMO”); and product consistency.
Qualification
Purchasers were asked if they require their suppliers to be FCC and USP qualified and if so, forwhat share of their purchases this is required. Forty-eight of 69 responding purchasers reported that theyrequired FCC and USP qualification for all of their purchases; 5 purchasers reported requiring FCC andUSP qualification for 3 to 90 percent of their purchases; and 16 did not require FCC and USPqualification. ***.
Purchasers were asked if they required other qualifications from their suppliers and for whichshare of their purchases they were required. Thirty-three of 68 responding purchasers reported that they
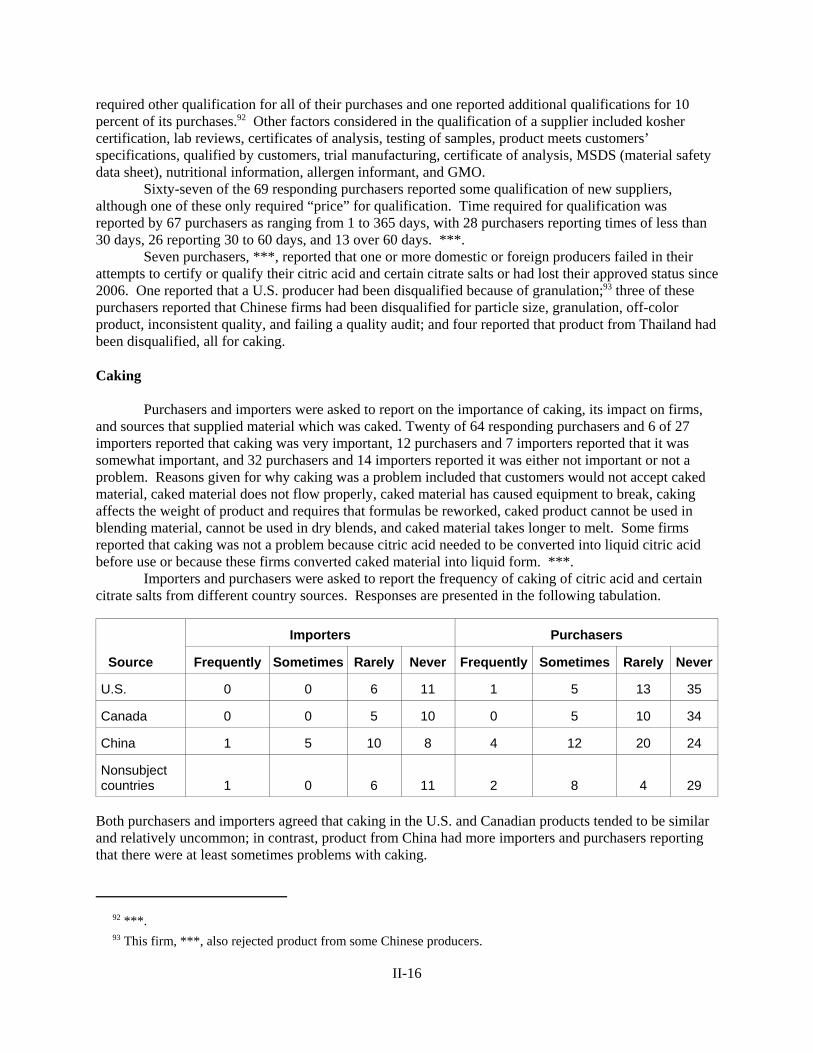
92 ***. 93 This firm, ***, also rejected product from some Chinese producers.
II-16
required other qualification for all of their purchases and one reported additional qualifications for 10percent of its purchases.92 Other factors considered in the qualification of a supplier included koshercertification, lab reviews, certificates of analysis, testing of samples, product meets customers’specifications, qualified by customers, trial manufacturing, certificate of analysis, MSDS (material safetydata sheet), nutritional information, allergen informant, and GMO.
Sixty-seven of the 69 responding purchasers reported some qualification of new suppliers,although one of these only required “price” for qualification. Time required for qualification wasreported by 67 purchasers as ranging from 1 to 365 days, with 28 purchasers reporting times of less than30 days, 26 reporting 30 to 60 days, and 13 over 60 days. ***.
Seven purchasers, ***, reported that one or more domestic or foreign producers failed in theirattempts to certify or qualify their citric acid and certain citrate salts or had lost their approved status since2006. One reported that a U.S. producer had been disqualified because of granulation;93 three of thesepurchasers reported that Chinese firms had been disqualified for particle size, granulation, off-colorproduct, inconsistent quality, and failing a quality audit; and four reported that product from Thailand hadbeen disqualified, all for caking.
Caking
Purchasers and importers were asked to report on the importance of caking, its impact on firms,and sources that supplied material which was caked. Twenty of 64 responding purchasers and 6 of 27importers reported that caking was very important, 12 purchasers and 7 importers reported that it wassomewhat important, and 32 purchasers and 14 importers reported it was either not important or not aproblem. Reasons given for why caking was a problem included that customers would not accept cakedmaterial, caked material does not flow properly, caked material has caused equipment to break, cakingaffects the weight of product and requires that formulas be reworked, caked product cannot be used inblending material, cannot be used in dry blends, and caked material takes longer to melt. Some firmsreported that caking was not a problem because citric acid needed to be converted into liquid citric acidbefore use or because these firms converted caked material into liquid form. ***.
Importers and purchasers were asked to report the frequency of caking of citric acid and certaincitrate salts from different country sources. Responses are presented in the following tabulation.
Source
Importers Purchasers
Frequently Sometimes Rarely Never Frequently Sometimes Rarely Never
U.S. 0 0 6 11 1 5 13 35
Canada 0 0 5 10 0 5 10 34
China 1 5 10 8 4 12 20 24
Nonsubjectcountries 1 0 6 11 2 8 4 29
Both purchasers and importers agreed that caking in the U.S. and Canadian products tended to be similarand relatively uncommon; in contrast, product from China had more importers and purchasers reportingthat there were at least sometimes problems with caking.

II-17
Twenty-four purchasers and 13 importers reported that they had purchased caked material. Fourteen purchasers and 10 importers had taken measures to address caking. Six purchasers and sevenimporters reported that the cost of these measures was less than 1 percent of the cost of the citric acid,three purchasers reported that costs were 1 to 2 percent, four purchasers and two importers reported 2 to 5percent, and three purchasers reported that these steps would cost 5 percent or more of the costs of citricacid and certain citrate salts.
Six purchasers and seven importers reported purchasing equipment or implementing a practice toreduce caking or clumping. ***. Other responses included not buying more material from sourcesproviding caked material, returning caked material, not buying product manufactured from July throughSeptember, “solutionizing” equipment, and the special handling of caked material.
Importance of 24 Specified Purchase Factors
Purchasers were asked to rate the importance of 24 factors in their purchasing decisions (table II-5). Factors that were reported as “very important” by half or more of the responding firms wereavailability and availability as citric acid (64 firms), product consistency (62 firms), reliability of supply(61 firms), price (57 firms), availability as anhydrous form (54 firms), quality meets FCC/USP standards(52 firms), delivery time (42 firms), size of granulation (41 firms), and delivery terms and availability assodium citrate (34 firms).
Purchases from Specific Producers and Countries
Purchasers were asked how frequently they and their customers were aware that the citric acidand certain citrate salts they purchased were produced in the United States or imported, and howfrequently they knew the manufacturer. The following tabulation summarizes the responses.
Purchaser/customer decision Always Usually Sometimes Never
Purchaser aware of country of origin . . . . . . . . . . . . . . . . . . . . . . . . . 54 11 1 0
Purchaser aware of manufacturer . . . . . . . . . . . . . . . . . . . . . . . . . . . . 47 16 5 0
Purchaser’s customer aware of country of origin . . . . . . . . . . . . . . . . 26 14 17 10
Blending Product from Different Countries
Most purchasers report that they did not blend citric acid and certain citrate salts from differentcountries, with 50 of 69 responding purchasers reporting that they never blended material from differentsources. ***. Of the 26 responding distributors, only three reported blending material from differentcountries. ***. Blending of material from different sources by distributors was limited because of theimportance of tracing material used in food.
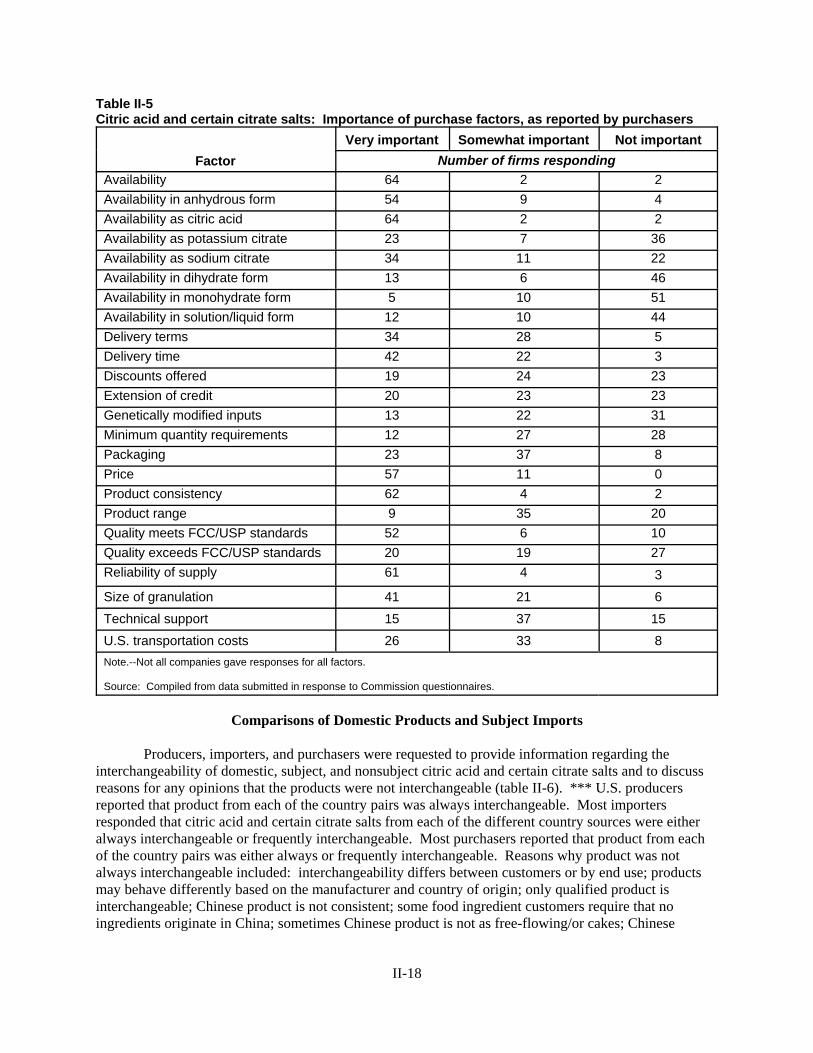
II-18
Table II-5Citric acid and certain citrate salts: Importance of purchase factors, as reported by purchasers
FactorVery important Somewhat important Not important
Number of firms respondingAvailability 64 2 2Availability in anhydrous form 54 9 4Availability as citric acid 64 2 2Availability as potassium citrate 23 7 36Availability as sodium citrate 34 11 22Availability in dihydrate form 13 6 46Availability in monohydrate form 5 10 51Availability in solution/liquid form 12 10 44Delivery terms 34 28 5Delivery time 42 22 3Discounts offered 19 24 23Extension of credit 20 23 23Genetically modified inputs 13 22 31Minimum quantity requirements 12 27 28Packaging 23 37 8Price 57 11 0Product consistency 62 4 2Product range 9 35 20Quality meets FCC/USP standards 52 6 10Quality exceeds FCC/USP standards 20 19 27Reliability of supply 61 4 3Size of granulation 41 21 6Technical support 15 37 15U.S. transportation costs 26 33 8Note.--Not all companies gave responses for all factors.
Source: Compiled from data submitted in response to Commission questionnaires.
Comparisons of Domestic Products and Subject Imports
Producers, importers, and purchasers were requested to provide information regarding theinterchangeability of domestic, subject, and nonsubject citric acid and certain citrate salts and to discussreasons for any opinions that the products were not interchangeable (table II-6). *** U.S. producersreported that product from each of the country pairs was always interchangeable. Most importersresponded that citric acid and certain citrate salts from each of the different country sources were eitheralways interchangeable or frequently interchangeable. Most purchasers reported that product from eachof the country pairs was either always or frequently interchangeable. Reasons why product was notalways interchangeable included: interchangeability differs between customers or by end use; productsmay behave differently based on the manufacturer and country of origin; only qualified product isinterchangeable; Chinese product is not consistent; some food ingredient customers require that noingredients originate in China; sometimes Chinese product is not as free-flowing/or cakes; Chinese
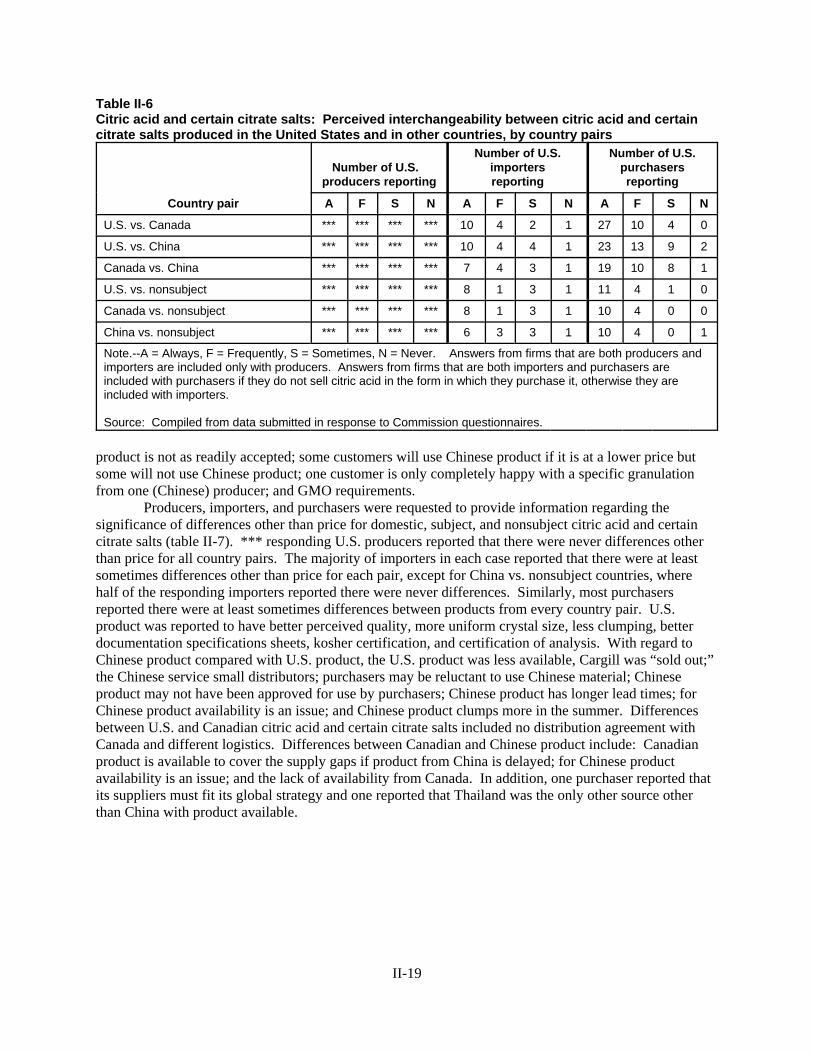
II-19
Table II-6Citric acid and certain citrate salts: Perceived interchangeability between citric acid and certaincitrate salts produced in the United States and in other countries, by country pairs
Country pair
Number of U.S. producers reporting
Number of U.S.importersreporting
Number of U.S.purchasersreporting
A F S N A F S N A F S N
U.S. vs. Canada *** *** *** *** 10 4 2 1 27 10 4 0
U.S. vs. China *** *** *** *** 10 4 4 1 23 13 9 2
Canada vs. China *** *** *** *** 7 4 3 1 19 10 8 1
U.S. vs. nonsubject *** *** *** *** 8 1 3 1 11 4 1 0
Canada vs. nonsubject *** *** *** *** 8 1 3 1 10 4 0 0
China vs. nonsubject *** *** *** *** 6 3 3 1 10 4 0 1
Note.--A = Always, F = Frequently, S = Sometimes, N = Never. Answers from firms that are both producers andimporters are included only with producers. Answers from firms that are both importers and purchasers areincluded with purchasers if they do not sell citric acid in the form in which they purchase it, otherwise they areincluded with importers.
Source: Compiled from data submitted in response to Commission questionnaires.
product is not as readily accepted; some customers will use Chinese product if it is at a lower price butsome will not use Chinese product; one customer is only completely happy with a specific granulationfrom one (Chinese) producer; and GMO requirements.
Producers, importers, and purchasers were requested to provide information regarding thesignificance of differences other than price for domestic, subject, and nonsubject citric acid and certaincitrate salts (table II-7). *** responding U.S. producers reported that there were never differences otherthan price for all country pairs. The majority of importers in each case reported that there were at leastsometimes differences other than price for each pair, except for China vs. nonsubject countries, wherehalf of the responding importers reported there were never differences. Similarly, most purchasersreported there were at least sometimes differences between products from every country pair. U.S.product was reported to have better perceived quality, more uniform crystal size, less clumping, betterdocumentation specifications sheets, kosher certification, and certification of analysis. With regard toChinese product compared with U.S. product, the U.S. product was less available, Cargill was “sold out;”the Chinese service small distributors; purchasers may be reluctant to use Chinese material; Chineseproduct may not have been approved for use by purchasers; Chinese product has longer lead times; forChinese product availability is an issue; and Chinese product clumps more in the summer. Differencesbetween U.S. and Canadian citric acid and certain citrate salts included no distribution agreement withCanada and different logistics. Differences between Canadian and Chinese product include: Canadianproduct is available to cover the supply gaps if product from China is delayed; for Chinese productavailability is an issue; and the lack of availability from Canada. In addition, one purchaser reported thatits suppliers must fit its global strategy and one reported that Thailand was the only other source otherthan China with product available.
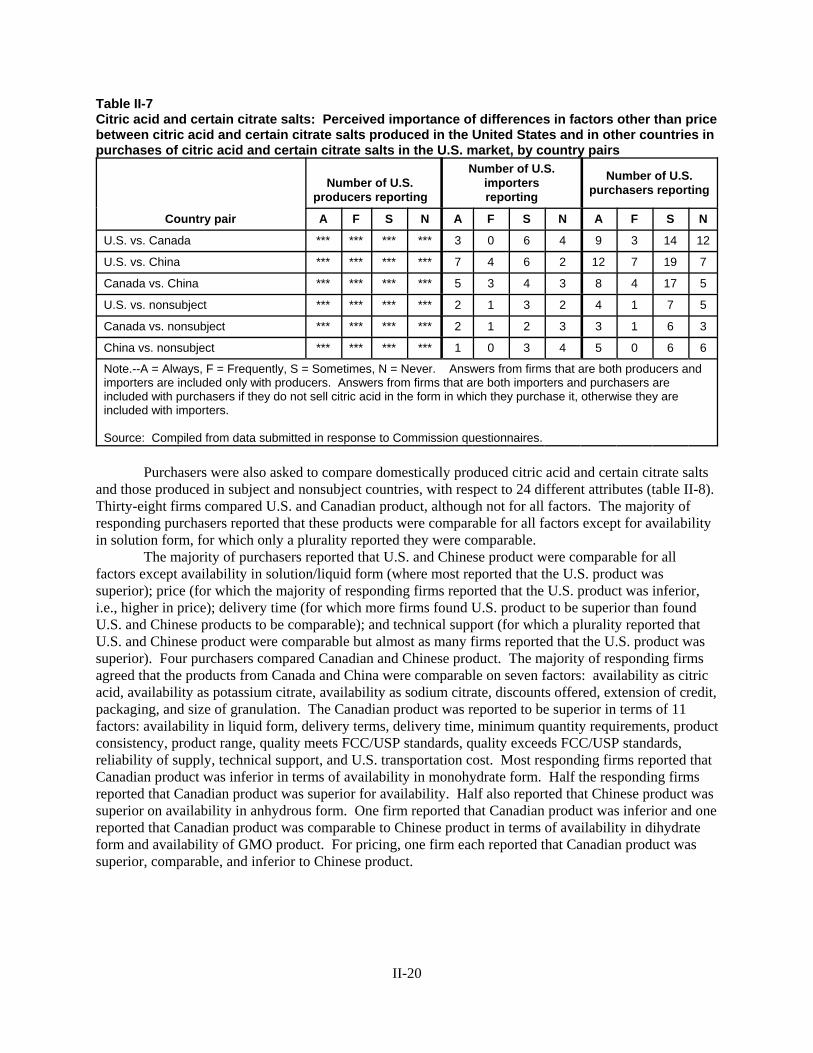
II-20
Table II-7Citric acid and certain citrate salts: Perceived importance of differences in factors other than pricebetween citric acid and certain citrate salts produced in the United States and in other countries inpurchases of citric acid and certain citrate salts in the U.S. market, by country pairs
Country pair
Number of U.S. producers reporting
Number of U.S.importersreporting
Number of U.S.purchasers reporting
A F S N A F S N A F S N
U.S. vs. Canada *** *** *** *** 3 0 6 4 9 3 14 12
U.S. vs. China *** *** *** *** 7 4 6 2 12 7 19 7
Canada vs. China *** *** *** *** 5 3 4 3 8 4 17 5
U.S. vs. nonsubject *** *** *** *** 2 1 3 2 4 1 7 5
Canada vs. nonsubject *** *** *** *** 2 1 2 3 3 1 6 3
China vs. nonsubject *** *** *** *** 1 0 3 4 5 0 6 6
Note.--A = Always, F = Frequently, S = Sometimes, N = Never. Answers from firms that are both producers andimporters are included only with producers. Answers from firms that are both importers and purchasers areincluded with purchasers if they do not sell citric acid in the form in which they purchase it, otherwise they areincluded with importers.
Source: Compiled from data submitted in response to Commission questionnaires.
Purchasers were also asked to compare domestically produced citric acid and certain citrate saltsand those produced in subject and nonsubject countries, with respect to 24 different attributes (table II-8). Thirty-eight firms compared U.S. and Canadian product, although not for all factors. The majority ofresponding purchasers reported that these products were comparable for all factors except for availabilityin solution form, for which only a plurality reported they were comparable.
The majority of purchasers reported that U.S. and Chinese product were comparable for allfactors except availability in solution/liquid form (where most reported that the U.S. product wassuperior); price (for which the majority of responding firms reported that the U.S. product was inferior,i.e., higher in price); delivery time (for which more firms found U.S. product to be superior than foundU.S. and Chinese products to be comparable); and technical support (for which a plurality reported thatU.S. and Chinese product were comparable but almost as many firms reported that the U.S. product wassuperior). Four purchasers compared Canadian and Chinese product. The majority of responding firmsagreed that the products from Canada and China were comparable on seven factors: availability as citricacid, availability as potassium citrate, availability as sodium citrate, discounts offered, extension of credit,packaging, and size of granulation. The Canadian product was reported to be superior in terms of 11factors: availability in liquid form, delivery terms, delivery time, minimum quantity requirements, productconsistency, product range, quality meets FCC/USP standards, quality exceeds FCC/USP standards,reliability of supply, technical support, and U.S. transportation cost. Most responding firms reported thatCanadian product was inferior in terms of availability in monohydrate form. Half the responding firmsreported that Canadian product was superior for availability. Half also reported that Chinese product wassuperior on availability in anhydrous form. One firm reported that Canadian product was inferior and onereported that Canadian product was comparable to Chinese product in terms of availability in dihydrateform and availability of GMO product. For pricing, one firm each reported that Canadian product wassuperior, comparable, and inferior to Chinese product.

II-21
Table II-8Citric acid and certain citrate salts: Comparisons of imported and U.S. product, as reported bypurchasers1
Factor
U.S. vs. Canada
U.S. vs. China
Canadavs.
ChinaU.S. vs.
nonsubjectCanada vs.nonsubject
China vs.nonsubject
S C I S C I S C I S C I S C I S C IAvailability 5 26 7 10 25 14 2 1 1 1 5 2 0 0 1 1 2 0Availability in anhydrous form 4 28 6 2 39 7 1 1 2 1 5 1 0 0 1 1 2 0Availability as citric acid 4 28 5 6 34 7 0 3 1 0 6 1 0 0 1 1 2 0Availability as potassium citrate 5 21 2 6 26 3 0 1 0 1 4 1 0 0 0 0 1 1Availability as sodium citrate 5 23 3 7 28 6 0 2 1 1 4 3 0 0 1 1 2 0Availability in dihydrate form 2 17 2 3 19 3 0 1 1 1 2 1 0 0 1 1 1 0Availability in monohydrate form 3 15 3 3 18 7 0 1 2 0 4 1 0 0 1 1 2 0Availability in solution/liquidform 9 12 3 15 10 4 2 1 0 4 0 0 1 0 0 0 1 1Delivery terms 6 29 1 15 29 2 3 1 0 2 6 0 0 1 0 0 2 1Delivery time 9 26 1 23 22 4 3 0 0 5 4 0 1 0 0 0 2 1Discounts offered 3 26 2 4 31 7 0 3 0 0 7 0 0 1 0 0 3 0Extension of credit 4 24 3 9 28 3 1 2 0 1 6 0 0 1 0 0 3 0Genetically modified inputs 2 23 2 2 24 9 0 1 1 0 2 2 0 0 0 0 2 0Minimum quantity requirements 2 34 1 5 39 4 2 1 0 0 9 0 0 1 0 0 3 0Packaging 2 36 0 5 43 0 0 4 0 1 7 0 0 1 0 0 3 0Price2 6 19 9 8 13 24 1 1 1 1 3 4 1 0 0 1 2 0Product consistency 4 34 0 13 35 1 3 1 0 1 7 0 0 1 0 0 2 1Product range 3 29 1 12 29 1 3 0 0 3 4 0 0 1 0 0 2 1Quality meets FCC/USPstandards 2 36 0 5 41 1 3 1 0 1 8 0 0 1 0 0 2 1Quality exceeds FCC/USPstandards 2 29 0 7 33 0 2 1 0 1 6 0 0 1 0 0 2 1Reliability of supply 4 29 4 10 32 7 3 0 0 1 6 1 0 1 0 0 2 1Size of granulation 3 35 0 6 41 1 1 2 0 1 7 1 0 1 0 0 2 1Technical support 3 31 2 20 21 4 3 0 0 2 6 0 0 1 0 0 2 1U.S. transportation costs2 9 24 0 15 29 1 2 1 0 4 4 0 0 1 0 0 3 0 1 Some firms reported answers for multiple nonsubject countries. 2 A rating of superior means that the price or cost is generally lower. For example, if a firm reported “U.S. superior,” it meantthat the price of the U.S. product was generally lower than the price of the imported product.
Note.--S=first listed country’s product is superior; C=both countries’ products are comparable; I=first listed country’s product isinferior. Not all firms gave responses for all factors.
Source: Compiled from data submitted in response to Commission questionnaires.
94 Hearing transcript, pp. 22-24 (Baroni). 95 Hearing transcript, p. 54 (Lorusso). 96 Hearing transcript, p. 170 (Rainville). 97 Hearing transcript, pp. 176-177 (Smith), 188 (Taylor). 98 Hearing transcript, pp. 177-178 (Smith), 190 (Taylor). 99 Hearing transcript, pp. 181-183 (Smith). 100 Hearing transcript, p. 193 (Hofmann).
II-22
Nine purchasers compared U.S. product to nonsubject-country product. The majority ofresponding purchasers reported that these products were comparable for 17 of the 24 specified factors. For availability in solution/liquid form and delivery time, most responding purchasers reported that theU.S. product was superior. For price, half of the responding firms reported that U.S. product was inferior(i.e., higher in price); for availability as sodium citrate, availability in dihydrate form, geneticallymodified inputs, and U.S. transportation costs, half the firms reported that U.S. and nonsubject-countryproduct were comparable.
One firm compared Canadian and nonsubject product, reporting that the products were comparablefor 13 factors; Canadian product was superior for availability in solution/liquid form, delivery time, andprice, and the Canadian product was inferior for availability, availability in anhydrous form, availability ascitric acid, availability as sodium citrate, availability in dihydrate form, and availability in monohydrateform.
Three purchasers compared Chinese product with that from nonsubject countries for the 24 factors. For 21 factors, the majority of responding purchasers reported that products from China and nonsubjectcountries were comparable. For availability in dihydrate form, one firm each reported that the Chineseproduct was superior and comparable, and for availability in solution/liquid form and availability aspotassium citrate, one each reported that the Chinese product was comparable and inferior.
Petitioners report that citric acid and certain citrate salts is a true commodity product and as suchprice is a paramount factor in sales negotiations. “The only real issue to work out in our annualnegotiations with our customers is price.”94 Petitioners also report that all major world producers,including the Chinese, produce the same quality of citric acid.95
JBL reported that it uses non-price factors in its sales, including premium product, the shortest leadtime, dependable delivery, and customer service. These factors reportedly allow it to sell at premiumprices.96 P&G and PepsiCo reported they must diversify their supply base to reduce the risk of plantdisruptions.97 P&G reported non-price differences between the Canadian and Chinese product, theavailability in solution form and shorter lead times which reduced possibility of delays, and the requirement to hold costly inventories.98 In addition, P&G contended that its delivered price for domesticproduct was lower than the price for imported product from both Canada and China.99 Reckitt Benckiserreported that it preferred purchasing domestic product for security and planning.100
ELASTICITY ESTIMATES
This section discusses elasticity estimates. Elasticity estimates were provided in the prehearingreport. The petitioners disagreed with the estimate of the elasticity of substitution in their prehearing andposthearing briefs. No other party provided any comments in its briefs.
101 A supply function is not defined in the case of a non-competitive market. 102 Petitioners’ prehearing brief, exh. 20, p. 10 and petitioners’ posthearing brief, exh. 1, pp. 27-28.
II-23
U.S. Supply Elasticity101
The domestic supply elasticity for citric acid and certain citrate salts measures the sensitivity of thequantity supplied by U.S. producers to changes in the U.S. market price of citric acid and certain citratesalts. The elasticity of domestic supply depends on factors such as the availability of inputs, the level ofexcess capacity, the level of inventories, and the availability of alternate markets for domesticallyproduced citric acid and certain citrate salts. Analysis of these factors indicates that the U.S. industry hassomewhat limited excess capacity, relatively low levels of inventories, and a moderate level of exportshipments which could be used to increase domestic shipments in response to price increases. A supplyelasticity in the range of 1 to 3 is suggested.
U.S. Demand Elasticity
The U.S. demand elasticity for citric acid and certain citrate salts measures the sensitivity of theoverall quantity demanded to a change in the U.S. market price of citric acid and certain citrate salts. Thissensitivity depends on the availability and viability of substitute products as well as on the componentshare of citric acid and certain citrate salts in the production of downstream products. Demand isestimated to be inelastic and is likely to be in the -0.2 to -0.7 range.
Substitution Elasticity
The elasticity of substitution depends on the extent of product differentiation between the domesticand imported products. Product differentiation depends on factors such as the range of products produced,quality, availability, and reliability of supply. In the prehearing report, the elasticity ofsubstitution for imports from the subject countries was estimated to be in the range of 2 to 6, with theChinese product more likely to be at the lower end of this range and the Canadian product at the higherend.
The petitioners report that in view of the price sensitivity of citric acid and the increases in themarket share of the Chinese industry in both the U.S. and world markets, a substitution elasticity of 2 istoo low. They report that the minimum elasticity of substitution for Chinese product should be at least 4. Petitioners also did not believe that the elasticities of substitution differ much between Chinese andCanadian product.102
The petitioners’ estimates of elasticity of substitution are within those proposed by staff. They,however, propose interpreting the worldwide growth in Chinese sales as resulting mainly from price ratherthan any other reason. Staff continues believe that an estimate for the elasticity of substitution rangingbetween 2 to 6 percent is reasonable.

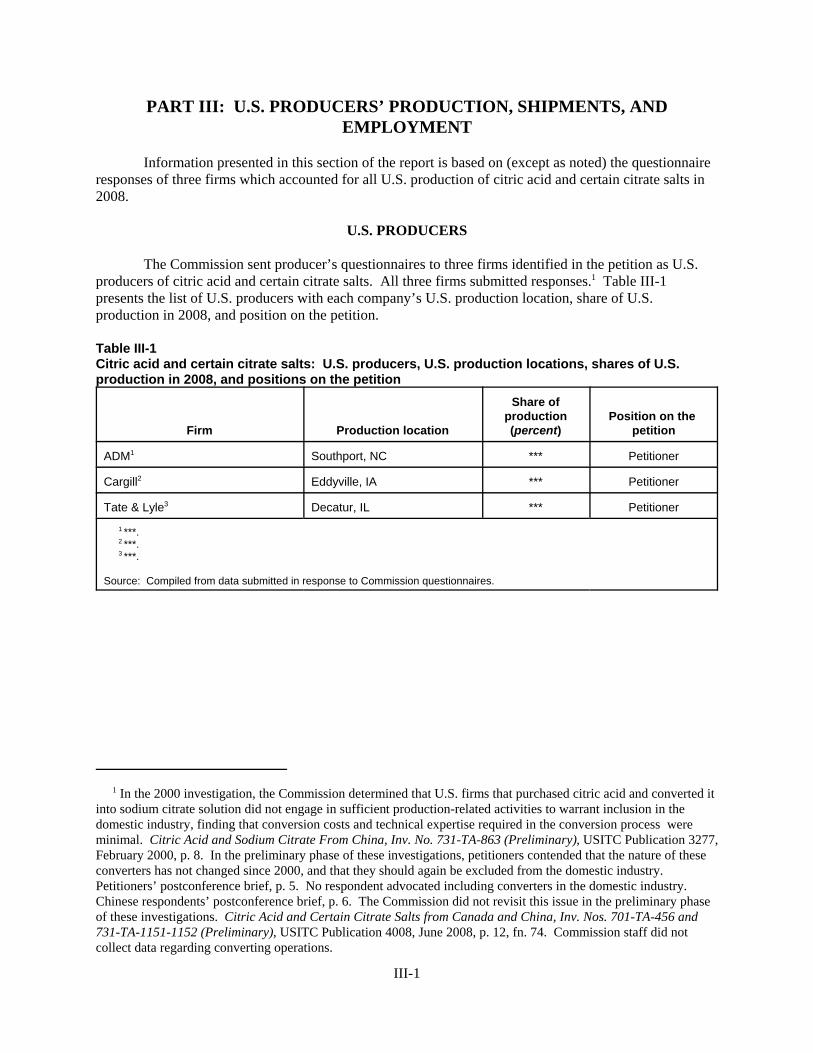
1 In the 2000 investigation, the Commission determined that U.S. firms that purchased citric acid and converted itinto sodium citrate solution did not engage in sufficient production-related activities to warrant inclusion in thedomestic industry, finding that conversion costs and technical expertise required in the conversion process wereminimal. Citric Acid and Sodium Citrate From China, Inv. No. 731-TA-863 (Preliminary), USITC Publication 3277,February 2000, p. 8. In the preliminary phase of these investigations, petitioners contended that the nature of theseconverters has not changed since 2000, and that they should again be excluded from the domestic industry. Petitioners’ postconference brief, p. 5. No respondent advocated including converters in the domestic industry. Chinese respondents’ postconference brief, p. 6. The Commission did not revisit this issue in the preliminary phaseof these investigations. Citric Acid and Certain Citrate Salts from Canada and China, Inv. Nos. 701-TA-456 and731-TA-1151-1152 (Preliminary), USITC Publication 4008, June 2008, p. 12, fn. 74. Commission staff did notcollect data regarding converting operations.
III-1
PART III: U.S. PRODUCERS’ PRODUCTION, SHIPMENTS, ANDEMPLOYMENT
Information presented in this section of the report is based on (except as noted) the questionnaireresponses of three firms which accounted for all U.S. production of citric acid and certain citrate salts in2008.
U.S. PRODUCERS
The Commission sent producer’s questionnaires to three firms identified in the petition as U.S.producers of citric acid and certain citrate salts. All three firms submitted responses.1 Table III-1presents the list of U.S. producers with each company’s U.S. production location, share of U.S.production in 2008, and position on the petition.
Table III-1Citric acid and certain citrate salts: U.S. producers, U.S. production locations, shares of U.S.production in 2008, and positions on the petition
Firm Production location
Share ofproduction(percent)
Position on the petition
ADM1 Southport, NC *** Petitioner
Cargill2 Eddyville, IA *** Petitioner
Tate & Lyle3 Decatur, IL *** Petitioner
1 ***. 2 ***. 3 ***.
Source: Compiled from data submitted in response to Commission questionnaires.
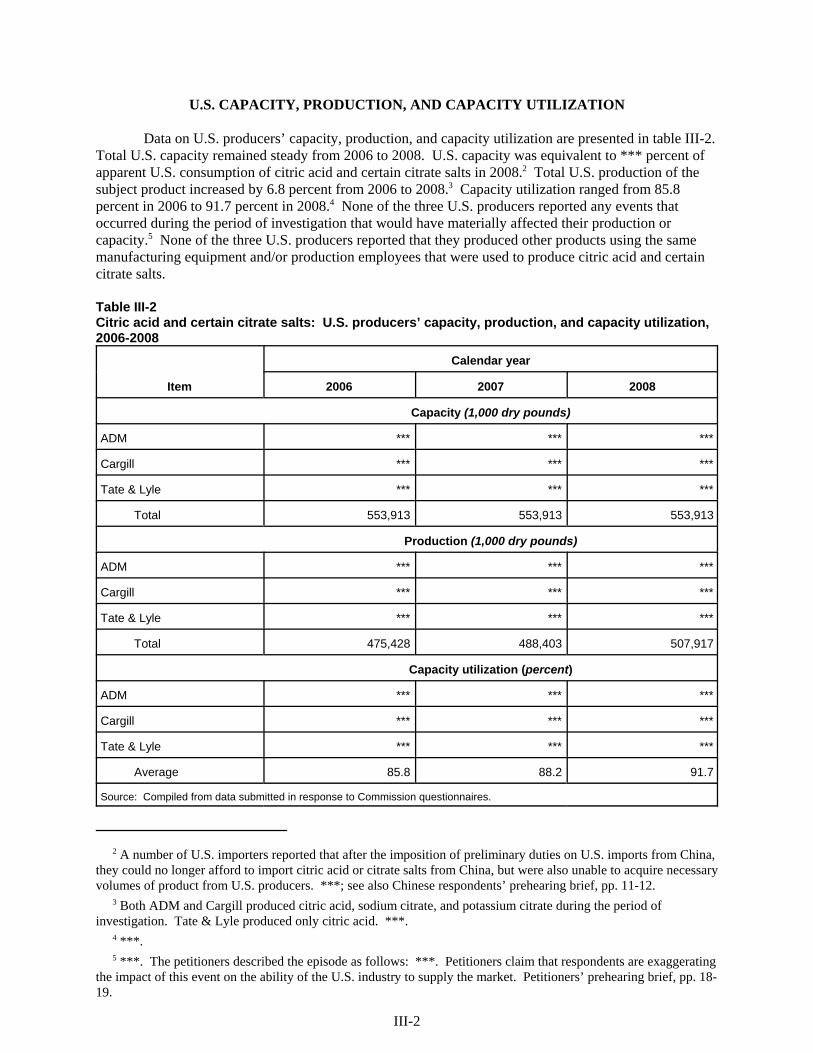
2 A number of U.S. importers reported that after the imposition of preliminary duties on U.S. imports from China,they could no longer afford to import citric acid or citrate salts from China, but were also unable to acquire necessaryvolumes of product from U.S. producers. ***; see also Chinese respondents’ prehearing brief, pp. 11-12. 3 Both ADM and Cargill produced citric acid, sodium citrate, and potassium citrate during the period ofinvestigation. Tate & Lyle produced only citric acid. ***. 4 ***. 5 ***. The petitioners described the episode as follows: ***. Petitioners claim that respondents are exaggeratingthe impact of this event on the ability of the U.S. industry to supply the market. Petitioners’ prehearing brief, pp. 18-19.
III-2
U.S. CAPACITY, PRODUCTION, AND CAPACITY UTILIZATION
Data on U.S. producers’ capacity, production, and capacity utilization are presented in table III-2. Total U.S. capacity remained steady from 2006 to 2008. U.S. capacity was equivalent to *** percent ofapparent U.S. consumption of citric acid and certain citrate salts in 2008.2 Total U.S. production of thesubject product increased by 6.8 percent from 2006 to 2008.3 Capacity utilization ranged from 85.8percent in 2006 to 91.7 percent in 2008.4 None of the three U.S. producers reported any events thatoccurred during the period of investigation that would have materially affected their production orcapacity.5 None of the three U.S. producers reported that they produced other products using the samemanufacturing equipment and/or production employees that were used to produce citric acid and certaincitrate salts.
Table III-2Citric acid and certain citrate salts: U.S. producers’ capacity, production, and capacity utilization,2006-2008
Item
Calendar year
2006 2007 2008
Capacity (1,000 dry pounds)
ADM *** *** ***
Cargill *** *** ***
Tate & Lyle *** *** ***
Total 553,913 553,913 553,913
Production (1,000 dry pounds)
ADM *** *** ***
Cargill *** *** ***
Tate & Lyle *** *** ***
Total 475,428 488,403 507,917
Capacity utilization (percent)
ADM *** *** ***
Cargill *** *** ***
Tate & Lyle *** *** ***
Average 85.8 88.2 91.7
Source: Compiled from data submitted in response to Commission questionnaires.
6 ***. 7 Petitioners project a *** in exports in 2009, with a shift of almost *** of their 2008 exports to the U.S. marketin 2009. Petitioners’ posthearing brief, Responses to Questions from Commissioner Lane, p. 17.
III-3
U.S. PRODUCERS’ U.S. SHIPMENTS AND EXPORT SHIPMENTS
As detailed in table III-3, the volume of U.S. producers’ U.S. shipments of citric acid and certaincitrate salts increased by 9.0 percent from 2006 to 2008.6 The value of U.S. shipments also increased by30.1 percent during the same time period. ***. *** volumes that were transfers to related firms duringthe period of investigation. ***. *** reported export shipments ***. Export shipments from U.S.producers increased by 16.8 percent, by quantity, and 40.2 percent, by value, from 2006 to 2008.7 ***.*** reported export shipments to ***. *** reported export shipments to ***.

III-4
Table III-3Citric acid and certain citrate salts: U.S. producers’ shipments, by types, 2006-2008
Item
Calendar year
2006 2007 2008
Quantity (1,000 dry pounds)
Commercial shipments *** *** ***
Internal consumption *** *** ***
Transfers to related firms *** *** ***
U.S. shipments 369,451 399,578 402,518
Export shipments 96,709 114,348 112,996
Total shipments 466,160 513,926 515,514
Value ($1,000)1
Commercial shipments *** *** ***
Internal consumption *** *** ***
Transfers to related firms *** *** ***
U.S. shipments 165,013 180,132 214,641
Export shipments 41,042 47,381 57,541
Total shipments 206,055 227,513 272,182
Unit value (per dry pound)
Commercial shipments $*** $*** $***
Internal consumption *** *** ***
Transfers to related firms *** *** ***
U.S. shipments 0.45 0.45 0.53
Export shipments 0.42 0.41 0.51
Average 0.44 0.44 0.53
Share of shipment quantity (percent)
Commercial shipments *** *** ***
Internal consumption *** *** ***
Transfers to related firms *** *** ***
U.S. shipments 79.3 77.8 78.1
Export shipments 20.7 22.2 21.9
Total 100.0 100.0 100.0
1 F.o.b. U.S. point of shipment.
Source: Compiled from data submitted in response to Commission questionnaires.

8 ***. 9 ***.
III-5
U.S. PRODUCERS’ IMPORTS AND PURCHASES OF IMPORTS
*** U.S. producers, ***, reported that it directly imported or purchased from U.S. importerscitric acid or certain citrate salts from Canada or China during the period of investigation. Table III-4presents *** direct imports of subject product from ***, its U.S. production, and the ratio of its U.S.imports to its U.S. production.8
Table III-4Citric acid and certain citrate salts: U.S. producers’ subject imports and purchases of subjectimports, 2006-2008
* * * * * * *
U.S. PRODUCERS’ INVENTORIES
Data on end-of-period inventories of citric acid and certain citrate salts for the period ofinvestigation are presented in table III-5.
Table III-5Citric acid and certain citrate salts: U.S. producers’ end-of-period inventories, 2006-2008
ItemCalendar year
2006 2007 2008
Inventories (1,000 dry pounds) 77,606 52,316 44,638
Ratio to production (percent) 16.3 10.7 8.8
Ratio to U.S. shipments (percent) 21.0 13.1 11.1
Ratio to total shipments (percent) 16.6 10.2 8.7
Source: Compiled from data submitted in response to Commission questionnaires.
U.S. EMPLOYMENT, WAGES, AND PRODUCTIVITY
Data provided by U.S. producers on the number of production and related workers (“PRWs”)engaged in the production of citric acid and certain citrate salts, the total hours worked by such workers,and wages paid to such PRWs during the period for which data were collected in these investigations arepresented in table III-6. From 2006 to 2008, the number of PRWs decreased by 4.6 percent,9 hours workeddecreased by 4.5 percent, wages paid decreased by 4.0 percent, hourly wages increased by 0.5 percent,productivity increased by 11.8 percent, and unit labor costs decreased by 10.1 percent.
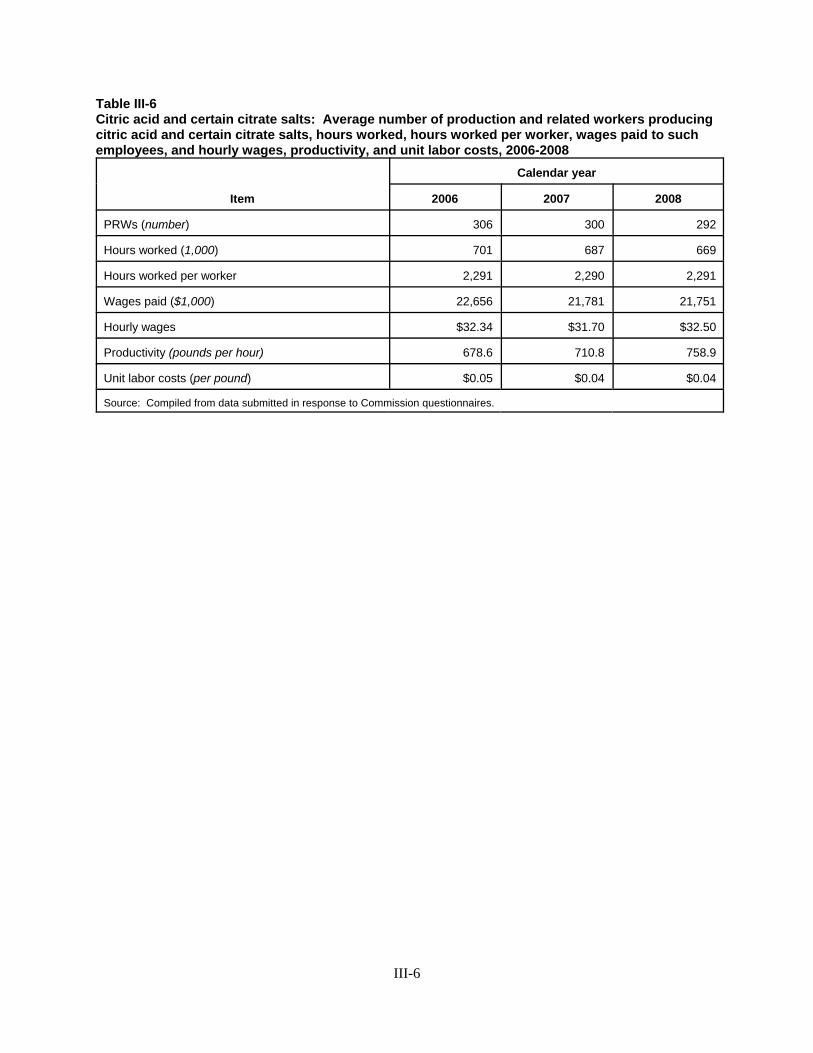
III-6
Table III-6Citric acid and certain citrate salts: Average number of production and related workers producingcitric acid and certain citrate salts, hours worked, hours worked per worker, wages paid to suchemployees, and hourly wages, productivity, and unit labor costs, 2006-2008
Item
Calendar year
2006 2007 2008
PRWs (number) 306 300 292
Hours worked (1,000) 701 687 669
Hours worked per worker 2,291 2,290 2,291
Wages paid ($1,000) 22,656 21,781 21,751
Hourly wages $32.34 $31.70 $32.50
Productivity (pounds per hour) 678.6 710.8 758.9
Unit labor costs (per pound) $0.05 $0.04 $0.04
Source: Compiled from data submitted in response to Commission questionnaires.

1 The Commission sent questionnaires to those firms identified in the petition, along with firms that, based on areview of data provided by U.S. Customs and Border Protection (“Customs”), may have imported citric acid orcertain citrate salts since 2006. The Commission also identified potential U.S. importers or purchasers from U.S.customer lists provided by questionnaire respondents in the preliminary phase of these investigations. 2 In addition to the 30 usable responses (those respondents are shown in table IV-1), the Commission receivedresponses from *** indicating that they did not import citric acid or certain citrate salts during the period ofinvestigation. A number of the firms listed above are purchasers of the subject product and did submit U.S.purchasers’ questionnaires. 3 ***. 4 Data for U.S. imports from China and nonsubject imports are compiled using HTS subheadings 2918.14.00(citric acid), 2918.15.10 (sodium citrate), and 2918.15.50 (potassium citrate). During the preliminary phase of theseinvestigations, petitioners stated that they were unaware of any U.S. imports of blends of citric acid or crude calciumcitrate during the period of investigation. See Citric Acid and Certain Citrate Salts from Canada and China, Inv.nos. 701-TA-456 and 731-TA-1151-1152 (Preliminary), USITC Publication 4008, June 2008, p. 13, fn. 79.
U.S. imports from China and nonsubject countries may be somewhat overstated on a dry-weight basis. Asmall volume (approximately 7 percent) of such imports consist of citric acid in the monohydrate form, whichcontains only approximately 92 percent of citric acid by weight.
IV-1
PART IV: U.S. IMPORTS, APPARENT CONSUMPTION, ANDMARKET SHARES
U.S. IMPORTERS
The Commission sent importer questionnaires to 158 firms believed to be U.S. importers or U.S.purchasers of citric acid and certain citrate salts, as well as to all three U.S. producers.1 Usablequestionnaire responses were received from 31 firms, which accounted for 100 percent of U.S. importsfrom Canada, 86.5 percent of U.S. imports from China, and 55.9 percent of U.S. imports from nonsubjectcountries in 2008.2 Data for U.S. imports from Canada are compiled using the reported U.S. imports ofJungbunzlauer Technology GmbH & Co. (“JBL”), the U.S. importer of Canadian product whichaccounted for *** U.S. imports from Canada, ***.3 Data for U.S. imports from China and nonsubjectcountries are compiled using official Commerce statistics.4
Table IV-1 lists all responding U.S. importers of citric acid and certain citrate salts from Canadaand China, their U.S. locations, and their quantities of imports, by source, in 2008.
Table IV-1Citric acid and certain citrate salts: Reported U.S. imports, by importers and by sources ofimports, 2008
* * * * * * *
U.S. IMPORTS
Table IV-2 shows that the volume of U.S. imports of citric acid and certain citrate salts fromCanada increased by *** percent from 2006 to 2008. The value of U.S. imports from Canada increasedby *** percent during the same period. The volume of U.S. imports of citric acid and certain citrate saltsfrom China increased by 21.9 percent from 2006 to 2008. The value of U.S. imports from Chinaincreased by 80.6 percent during the same period. The volume of U.S. imports from nonsubject countriesdecreased by 18.9 percent from 2006 to 2008. The value of U.S. imports from nonsubject countriesincreased by 4.8 percent during the same period. The following countries, listed in descending order ofreported import volume, accounted for approximately 94 percent of U.S. imports from nonsubjectcountries in 2008: Israel, Colombia, Germany, Thailand, Austria, and Belgium.

IV-2
Table IV-2Citric acid and certain citrate salts: U.S. imports, by sources, 2006-2008
Source
Calendar year
2006 2007 2008
Quantity (1,000 dry pounds)
Canada *** *** ***
China 158,906 180,108 193,727
Subtotal *** *** ***
All others 68,584 65,634 55,594
Total *** *** ***
Value ($1,000)1
Canada *** *** ***
China 65,542 76,571 118,342
Subtotal *** *** ***
All others 39,174 38,802 41,058
Total *** *** ***
Unit value (per dry pound)
Canada $*** $*** $***
China 0.41 0.43 0.61
Average *** *** ***
All others 0.57 0.59 0.74
Average *** *** ***
Share of quantity (percent)
Canada *** *** ***
China *** *** ***
Subtotal *** *** ***
All others *** *** ***
Total 100.0 100.0 100.0
Share of value (percent)
Canada *** *** ***
China *** *** ***
Subtotal *** *** ***
All others *** *** ***
Total 100.0 100.0 100.0
1 Landed, duty-paid.
Source: U.S. imports from Canada are compiled from U.S. importer questionnaires. U.S. imports from China and nonsubject countries arecompiled from official Commerce statistics.

5 Petitioners’ prehearing brief, pp. 6-10; Petitioners posthearing brief, exh. 1, p. 19. 6 JBL Canada’s prehearing brief, pp. 19-30; JBL Canada’s posthearing brief, p. 7 (addressing cumulation in thecontext of the Commission’s threat of material injury analysis). 7 Citric Acid and Certain Citrate Salts from Canada and China, Inv. Nos. 701-TA-456 and 731-TA-1151-1152(Preliminary), USITC Publication 4008, June 2008, p. 20. 8 Chinese respondents’ posthearing brief, app. A, pp. 24-25 (addressing cumulation in the context of theCommission’s threat of material injury analysis). In the preliminary phase of these investigations, Chineserespondents argued that the Commission should not cumulate U.S. imports from Canada and China. Chineserespondents’ postconference brief, p. 6. 9 Petitioners’ prehearing brief, pp. 6-10. 10 JBL Canada’s prehearing brief, pp. 19-30. 11 A direct rail line between JBL’s production facility and P&G’s production facilities in Lima, OH andAlexandria, LA, allows JBL to economically ship citric acid in solution form. P&G claims that shipping citric acidin solution form from China would be economically unfeasible due to high transportation costs. P&G’s prehearingbrief, p. 70. P&G stated that it also purchases and uses citric acid in monohydrate and anhydrous forms in theproduction of its detergents; however, it must first convert them to solutions, requiring additional time and cost. Conference transcript, p. 103 (Smith). 12 ***.
IV-3
CUMULATION CONSIDERATIONS
Petitioners argued that the Commission should cumulate U.S. imports from Canada and China.5 JBL Canada urged the Commission not to cumulate these imports.6 The Commission preliminarilydetermined that there was a reasonable overlap of competition among subject imports and the domesticlike product, and therefore, cumulatively assessed the volume and price effects of Canada and China.7 Inthe final phase of these investigations, Chinese respondents state that they believe there is no grounds toreverse the Commission’s preliminary findings with regard to cumulation.8
In assessing whether imports should be cumulated, the Commission determines whether U.S.imports from the subject countries compete with each other and with the domestic like product and hasgenerally considered four factors: (1) fungibility, (2) presence of sales or offers to sell in the samegeographical market, (3) common or similar channels of distribution, and (4) simultaneous presence in themarket. Issues concerning channels of distribution are addressed in Part II of this report. The remainingfactors are addressed below.
Fungibility
Petitioners argued that citric acid and certain citrate salts whether originating from Canada,China, or the United States are a very fungible, commodity product produced to the same grades andstandards.9 JBL Canada argued that U.S. imports from Canada are not fungible with those from Chinabecause despite being a commodity product, certain characteristics prevented the two products fromactually being interchangeable in various end use market segments in the United States.10 Among thesecharacteristics, JBL Canada cited the fact that the proximity of its production facility to the United Statesallowed it to ship citric acid in solution form with short lead times to large customers such as P&G, whichuses citric acid solution in its production of detergents.11 JBL reported that in 2008, *** percent of itsU.S. imports were in solution form while *** percent were in anhydrous form. *** U.S. importerreported importing subject product in solution form from China. U.S. producers reported that in 2008,*** percent of their U.S. commercial shipments consisted of anhydrous and dihydrate citric acid or citratesalts while *** percent of 2008 commercial shipments consisted of citric acid in solution form.12
13 JBL Canada’s prehearing brief, pp. 21-23. Both citric acid from Canada and China generally meet theFCC/USP standards; however, JBL argued that its consistency both in quality product and customer service make its“brand” a premium one. See also Conference transcript, p. 124 (Waite). Petitioners argue that reported pricing dataand purchaser perceptions of Canadian product undermine Canadian respondent’s claim of a premium “brand”product. Petitioners’ prehearing brief, p. 16. 14 P&G’s prehearing brief, pp. 68-69. 15 Petitioners’ posthearing brief, exh. 1, p. 26; JBL’s posthearing brief, exh. 8, p. 1. JBL estimates that *** to ***percent of the global market for citric acid is for non-GMO citric acid. Ibid. 16 Chinese respondents’ postconference brief, pp. 9-10. See also Chinese respondents’ prehearing brief, pp. 28-29. Asked at the preliminary conference, a witness for Chinese respondents had no knowledge of any shippingmethods that would prevent the caking of anhydrous citric acid. Conference transcript, p. 132 (Hsu). Petitionersargued that the caking issue was being greatly exaggerated by respondents and would not occur with properpackaging, such as packing at correct temperatures and moisture levels into bags with proper moisture barriers. Petitioners’ postconference brief, exh. 1, p. 23 & exh. 13 (statement of L. Martin Hurt, Senior Product Manager,Tate & Lyle); Petitioners’ prehearing brief, p. 9 (“caking is not a common occurrence”). 17 PepsiCo’s prehearing brief, pp. 12-13. PepsiCo reported that ***. Ibid. 18 For an extensive discussion of U.S. purchasers reported experiences with “caking,” please see the sectionentitled “Caking” in Part II of this report. 19 Citric Acid and Certain Citrate Salts from Canada and China, Inv. Nos. 701-TA-456 and 731-TA-1151-1152(Preliminary), USITC Publication 4008, June 2008, p. 19.
IV-4
JBL Canada claimed that its product did not compete with U.S. imports from China because itsproducts are perceived in the U.S. market as a “premium product” in terms of purity, color, grade, andcustomer and technical assistance relative to the Chinese product and, unlike product from China,Canadian product is currently *** in the U.S. food and beverage market, especially ***, as opposed to theU.S. industrial market where *** of the Chinese product is used.13
P&G argued that U.S. imports from Canada and China are not fungible because a number of endusers prefer Chinese product as it is produced with non-genetically modified (“GMO”) corn whereas U.S.and Canadian product are made with GMO corn.14 Petitioner and Canadian respondent estimate thatapproximately *** percent of the U.S. citric acid market is non-GMO citric acid.15
Chinese respondents argued that U.S. imports from China, although not entirely excluded fromthe large U.S. food and beverage market, are effectively excluded from the large U.S. soft drink marketbecause product shipped from China in anhydrous (dry powder) form will generally “cake” by the time itreaches the U.S. market as a result of the moisture it absorbs from its trans-Pacific shipping.16 PepsiCostated that ***.17 A number of U.S. purchasers of citric acid and certain citrate salts have reported“caking” issues with Chinese products.18 There was no reported caking of U.S.-produced citric acid orcitric acid imported from Canada (*** percent of which was shipped in solution form in 2008).
In the preliminary phase of these investigations, the Commission determined that there wassufficient fungibility among the products to cumulate, stating “although there are some differences interms of chemical and physical forms and grades sold by domestic, Canadian, and Chinese producers inthe U.S. market, there is also at least some overlap, particularly for anhydrous citric acid. Moreover, allthree sources competed for sales of food, beverage, pharmaceutical, and industrial-grade products in theU.S. market during the period of investigation (including for soft drink applications).”19
End-Use Market Segments
Table IV-3 shows estimated 2008 U.S. shipment data grouped by end-use market segment. Thedomestic industry reported that *** percent of its U.S. shipments in 2008 were estimated to be used in thefood and beverage market segment (*** percent for the soft drink sub-segment), *** percent to the

20 Petitioners’ postconference brief, exh. 15 and p. 12. 21 Ibid.; Respondent JBL’s postconference brief, p. 11. There is a direct rail line between JBL Canada’sproduction facility and P&G’s production facilities in Lima, OH and Alexandria, LA. Respondent P&G’spostconference brief, p. 28. 22 Petitioners’ prehearing brief, p. 10. 23 JBL’s prehearing brief, p. 25; JBL’s posthearing brief, p. 9.
IV-5
industrial segment, *** percent to the pharmaceutical segment, and *** percent were unknown or weresold to general distributors. For U.S. shipments of imports from Canada, *** percent were estimated tobe used in the food and beverage segment (*** percent for the soft drink sub-segment), *** percent to theindustrial segment, *** percent to the pharmaceutical segment, and *** percent were unknown or weresold to general distributors. For U.S. shipments of imports from China, *** percent were estimated to beused in the food and beverage segment, (*** percent for the soft drink sub-segment), *** percent to theindustrial segment, *** percent to the pharmaceutical segment, and *** percent were unknown or weresold to general distributors.
Table IV-3Citric acid and certain citrate salts: Estimated 2008 U.S. commercial shipments, by end-usemarket segment, and by firm
* * * * * * *
Geographical Markets
With regard to geographical market overlap, U.S. imports of citric acid and certain citrate saltsfrom China entered multiple U.S. ports of entry, dispersed across the nation. The five U.S. ports of entrywith the most volume were: (1) Los Angeles, CA; (2) New Orleans, LA; (3) Chicago, IL; (4) SanFrancisco, CA; and (5) New York, NY. Petitioners argue that the Chinese product is availablenationwide.20
U.S. imports of citric acid and certain citrate salts from Canada generally enter the United Statesthrough one of two ports of entry, namely Buffalo, NY or Detroit, MI, because of their proximity to JBLCanada’s manufacturing facility in Port Colborne, Ontario. During the preliminary phase of theseinvestigations, petitioners and respondent JBL Canada both observed that although product from Canadaenters through two U.S. ports of entry, when transported by freight or rail, it competes nationwide withU.S. and Chinese product.21
Simultaneous Presence in the Market
With regard to simultaneous presence in the market, petitioners state that imported citric acid andcertain citrate salts from both Canada and China have been simultaneously present in the U.S. marketalong with domestic product during the period of investigation.22 The Canadian respondent stated thatCanadian and Chinese product are not simultaneously present in the same markets because the use of eachproduct in different market segments (by end use and customer type) attenuates competition betweenproduct from Canada and product from China.23 Commerce statistics and pricing data submitted to theCommission show that imports from Canada and China entered the United States in every month of theperiod of investigation.

24 19 U.S.C. § 1677(24)(A)(ii).
IV-6
NEGLIGIBILITY
The Tariff Act of 1930 provides for the termination of an investigation if imports of the subjectproduct from a country are less than 3 percent of total imports, or, if there is more than one such country,their combined share is less than or equal to 7 percent of total imports, during the most recent 12 monthsfor which data are available preceding the filing of the petition.24 The shares (in percent) of the totalquantity of U.S. imports from Canada and China for the period of January 2007 through December 2007using U.S. import data compiled from the Commission’s questionnaire responses (in the case of U.S.imports from Canada) and data compiled from Commerce statistics (in the case of China and nonsubjectcountries) were *** percent and *** percent, for Canada and China, respectively, well above the 3percent negligibility threshold.
APPARENT U.S. CONSUMPTION
Data on apparent U.S. consumption of citric acid and certain citrate salts are presented in tableIV-4. The quantity of apparent U.S. consumption of the subject product increased by *** percent from2006 to 2008. The value of apparent U.S. consumption increased by *** percent during the same period.

IV-7
Table IV-4Citric acid and certain citrate salts: U.S. shipments of domestic product, U.S. imports by sources,and apparent U.S. consumption, 2006-2008
Item
Calendar year
2006 2007 2008
Quantity (1,000 dry pounds)
U.S. producers’ U.S. shipments 369,451 399,578 402,518
U.S. imports from--
Canada *** *** ***
China 158,906 180,108 193,727
Subtotal *** *** ***
All other countries 68,584 65,634 55,594
Total imports *** *** ***
Apparent U.S. consumption *** *** ***
Value ($1,000)
U.S. producers’ U.S. shipments 165,013 180,132 214,641
U.S. imports from--
Canada *** *** ***
China 65,542 76,571 118,342
Subtotal *** *** ***
All other countries 39,174 38,802 41,058
Total imports *** *** ***
Apparent U.S. consumption *** *** ***
Note.–U.S. import data are on a landed, duty-paid basis, whereas U.S. producers’ shipments consist of U.S. producers’ f.o.b.shipments to their customers. Accordingly, the two sets of data are for different levels of trade.
Source: Data regarding the U.S. industry are compiled from data submitted in response to Commission questionnaires. U.S.imports from Canada are compiled from U.S. importer questionnaires. U.S. imports from China and nonsubject countries arecompiled from official Commerce statistics.

IV-8
U.S. MARKET SHARES
Data on U.S. market shares for citric acid and certain citrate salts are presented in table IV-5. From 2006 to 2008, U.S. producers lost *** percentage points of market share based on quantity and ***percentage points based on value. U.S. imports from Canada gained *** percentage points of U.S.market share from 2006 to 2008, based on quantity, and *** percentage points based on value. U.S.imports from China gained *** percentage points of U.S. market share from 2006 to 2008, based onquantity, and *** percentage points based on value. From 2006 to 2008, U.S. imports from nonsubjectcountries lost *** percentage points of U.S. market share based on quantity and *** percentage pointsbased on value.
Table IV-5Citric acid and certain citrate salts: Apparent U.S. consumption and market shares, 2006-2008
* * * * * * *
RATIO OF IMPORTS TO U.S. PRODUCTION
Data on the ratio of imports to U.S. production of citric acid and certain citrate salts are presentedin table IV-6.
Table IV-6Citric acid and certain citrate salts: U.S. production, U.S. imports, and ratios of imports toproduction, 2006-2008
Item
Calendar year
2006 2007 2008
Quantity (1,000 dry pounds)
U.S. production 475,428 488,403 507,917
U.S. imports from--
Canada *** *** ***
China 158,906 180,108 193,727
Subtotal *** *** ***
All other countries 68,584 65,634 55,594
Total imports *** *** ***
Ratio of imports to U.S. production (percent)
U.S. imports from--
Canada *** *** ***
China 33.4 36.9 38.1
Subtotal *** *** ***
All other countries 14.4 13.4 10.9
Total imports *** *** ***
Source: Data regarding the U.S. industry are compiled from data submitted in response to Commission questionnaires. U.S.imports from Canada are compiled from U.S. importer questionnaires. U.S. imports from China and nonsubject countries arecompiled from official Commerce statistics.
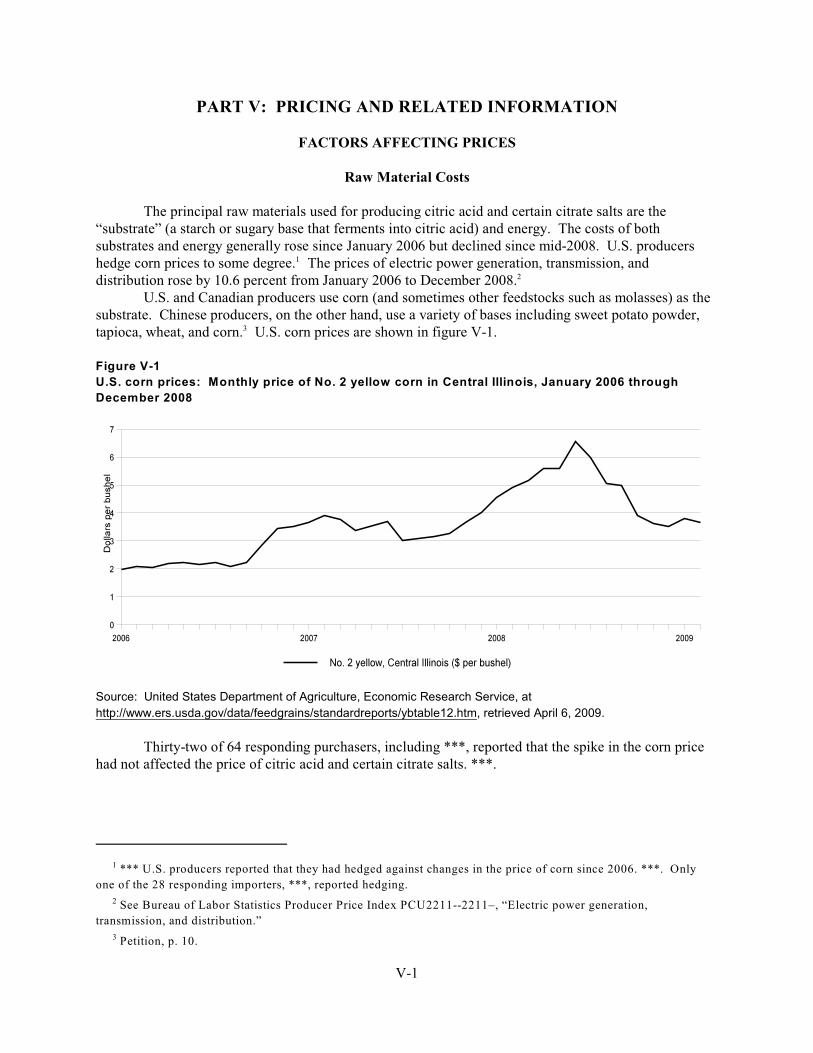
*** U.S. producers reported that they had hedged against changes in the price of corn since 2006. ***. Only1
one of the 28 responding importers, ***, reported hedging.
See Bureau of Labor Statistics Producer Price Index PCU2211--2211–, “Electric power generation,2
transmission, and distribution.”
Petition, p. 10. 3
V-1
PART V: PRICING AND RELATED INFORMATION
FACTORS AFFECTING PRICES
Raw Material Costs
The principal raw materials used for producing citric acid and certain citrate salts are the“substrate” (a starch or sugary base that ferments into citric acid) and energy. The costs of bothsubstrates and energy generally rose since January 2006 but declined since mid-2008. U.S. producershedge corn prices to some degree. The prices of electric power generation, transmission, and1
distribution rose by 10.6 percent from January 2006 to December 2008. 2
U.S. and Canadian producers use corn (and sometimes other feedstocks such as molasses) as thesubstrate. Chinese producers, on the other hand, use a variety of bases including sweet potato powder, tapioca, wheat, and corn. U.S. corn prices are shown in figure V-1.3
Figure V-1
U.S. corn prices: Monthly price of No. 2 yellow corn in Central Illinois, January 2006 through
December 2008
Source: United States Department of Agriculture, Economic Research Service, at
http://www.ers.usda.gov/data/feedgrains/standardreports/ybtable12.htm, retrieved April 6, 2009.
Thirty-two of 64 responding purchasers, including ***, reported that the spike in the corn pricehad not affected the price of citric acid and certain citrate salts. ***.

4 The only importer that reported using corn futures prices reported that the Chinese supplier will pass the cornprice increase on to the importer. 5 Petitioners’ posthearing brief, exh. 2, pp. 18-19. 6 *** submitted both producers’ and importers’ questionnaires in these investigations. For purposes of thischapter, their answers (with the exception of pricing data and lost sales/lost revenues allegations) were the same forboth questionnaires submitted by their firm. Thus, in this chapter, their responses have been counted only amongproducers. 7 The remaining two reporting shipping costs reported that transportation costs were 15 and 64 percent of totalcosts.
V-2
*** U.S. producers and 29 of 30 responding importers reported that they did not use corn futuresprices in determining the contract prices of citric acid and certain citrate salts.4 Sixteen of 62 respondingpurchasers reported that negotiations of contract prices are affected by the price of corn futures. The mostcommon reason given by these purchasers was that higher corn future prices reflected higher future costsfor the producers of citric acid and certain citrate salts. ***.
Petitioners report that their contracts did not include price escalator clauses during the 2006 to2008 period; however, ***. Petitioners assert that until 2007, when prices increased dramatically, thelack of escalators was not a problem.5
Transportation Costs to the U.S. Market
Transportation costs for citric acid and certain citrate salts from Canada to the United States(excluding U.S. inland costs) are estimated to be approximately 4.0 percent of the total cost for citric acidand certain citrate salts. For China, transportation costs for citric acid and certain citrate salts areestimated to be approximately 13.0 percent of the total cost for citric acid and certain citrate salts. Theseestimates are derived from official import data and represent the transportation and other charges onimports valued on a c.i.f. basis, as compared with customs value.
U.S. Inland Transportation Costs
Among U.S. producers,6 U.S. inland transportation costs ranged from *** to *** percent. ***U.S. producers reported that they arrange transportation for their customers. U.S. producers reported thatbetween *** and *** percent of their sales were to customers located between 100 and 1,000 miles oftheir production facilities; *** to *** percent were more than 1,000 miles from their production facilities,and *** to *** percent of their sales were within 100 miles of their production facilities.
Eighteen of the 20 responding importers indicated that U.S. inland transportation costs rangedbetween 1 to 10 percent.7 Twenty-three of the 26 responding importers reported that they arrangedtransportation for their customers, while three reported that their customers arrange transportation. Thirteen of the 24 responding importers reported selling half or more of their product between 0 and 100miles from their U.S. points of shipment, 11 reported selling half or more of their product between 101and 1,000 miles from their U.S. points of shipment, and one reported selling most of their product over1,000 miles from its U.S. point of shipment.
Exchange Rates
The nominal and real values of the Canadian dollar and the nominal value of the Chinese yuanrelative to the U.S. dollar are presented in figure V-2.
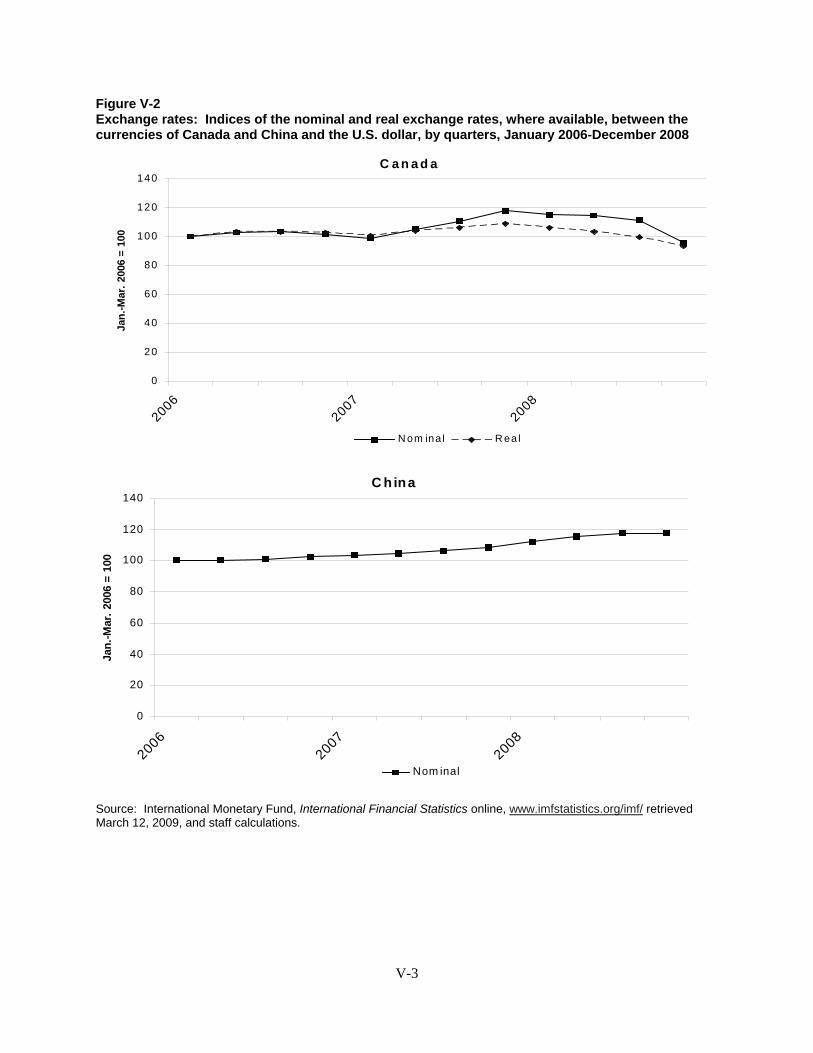
V-3
Figure V-2Exchange rates: Indices of the nominal and real exchange rates, where available, between thecurrencies of Canada and China and the U.S. dollar, by quarters, January 2006-December 2008
Source: International Monetary Fund, International Financial Statistics online, www.imfstatistics.org/imf/ retrievedMarch 12, 2009, and staff calculations.
C hina
0
20
40
60
80
100
120
140
20062007
2008
Jan.
-Mar
. 200
6 =
100
Nom inal
C a n a d a
0
20
40
60
80
100
120
140
20062007
2008
Jan.
-Mar
. 200
6 =
100
N om ina l R ea l

8 ***. 9 Conference transcript, pp. 103-104 (Smith). P&G reported that sales of liquid citric acid can reduce productioncosts by eliminating the need to fully dry the product and by making solution from output that does not meet industrystandards for particle sizes. This enables producers to dry batches faster in spite of the increased amount of non-standard sized material this creates. Hearing transcript, pp. 178-179 (Smith). 10 Staff conversation with ***; and petition, p. 9. 11 ***. 12 JBL *** contends that it is not true for ***. JBL’s prehearing brief, p. 10.
V-4
PRICING PRACTICES
Pricing Methods
Citric acid is sold dry in powder, fine granulated, and granulated forms. ***.8 As a liquid, citricacid can be sold in an industrial grade that is 50 percent citric acid and 50 percent water, with the priceusually being about 50 percent of the equivalent dry price.9 Similarly, anhydrous material costs about 9percent less than monohydrate due to the presence of 9 percent more water in the monohydrate version.10
Price Determination
Among producers, *** reported using customer-by-customer negotiations to determine price,while *** reported determining price by “what the market will bear.” *** reported using price lists fortheir sales of citric acid and certain citrate salts. Similarly, importers reported using a variety of methodsincluding transaction-by-transaction negotiations and contracts for multiple shipments. Six importersreported using a cost-plus method, adding profits of 3 to 10 percent to costs to determine the price. Threeother importers reported basing prices on what competitors were charging or what the market would bear. Among importers, only *** reported using a price list.11
Purchasers were asked if contract negotiations differed between suppliers of U.S. citric acid andcertain citrate salts and suppliers of citric acid and certain citrate salts from other countries. No purchaserreported that negotiations differed between U.S. and Canadian suppliers, seven firms reported thatnegotiations differed between the U.S. and Chinese suppliers, and four firms reported that negotiationsdiffered between the U.S. and nonsubject suppliers. Differences reported by the purchasers included: U.S. producers honor their obligations whereas Chinese suppliers are less likely to do so; U.S. producerstend to have a set price for distributors and usually give notice on price increases, while Chinese andnonsubject suppliers change prices order-to-order without notice; Chinese sales are volume andrelationship driven while domestic prices are based on market conditions and return on investment;domestic suppliers typically give a general distribution price or a price determined by competitive activityat their customers’ level and agree to supply a certain volume, whereas Chinese and nonsubject suppliersjust quote a price; U.S. producers prefer annual negotiations with “take it or leave it” prices, whileChinese firms’ prices are subject to re-negotiation; U.S. product is sold on contracts while Chineseproduct is sold in spot sales; Chinese and other suppliers are more apt than U.S. producers to negotiatespot sales; and the Canadian supplier “prefers annual bids but will not typically firm a price all year.”12 ***.
Long-Term Contracts
Most contracts are annual and U.S. producers report that in this industry 12-month contracts areconsidered to be long-term. *** U.S. producers, all 10 responding importers, and all 39 responding
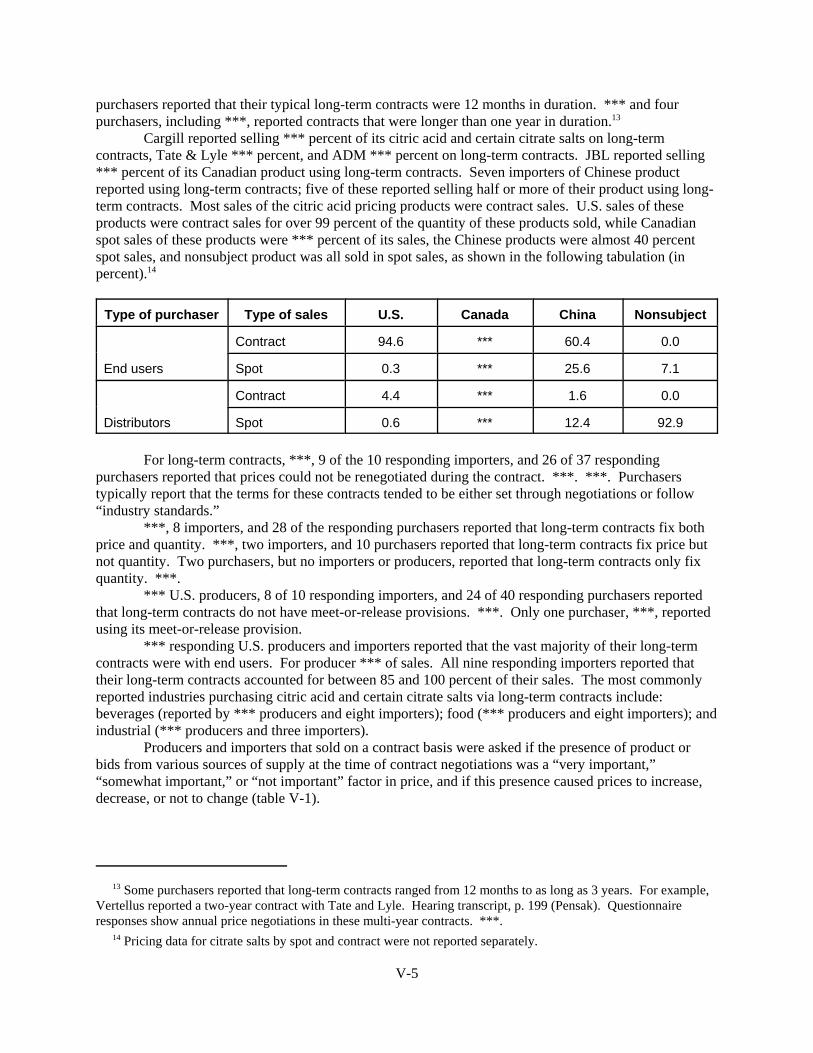
13 Some purchasers reported that long-term contracts ranged from 12 months to as long as 3 years. For example,Vertellus reported a two-year contract with Tate and Lyle. Hearing transcript, p. 199 (Pensak). Questionnaireresponses show annual price negotiations in these multi-year contracts. ***. 14 Pricing data for citrate salts by spot and contract were not reported separately.
V-5
purchasers reported that their typical long-term contracts were 12 months in duration. *** and fourpurchasers, including ***, reported contracts that were longer than one year in duration.13
Cargill reported selling *** percent of its citric acid and certain citrate salts on long-termcontracts, Tate & Lyle *** percent, and ADM *** percent on long-term contracts. JBL reported selling*** percent of its Canadian product using long-term contracts. Seven importers of Chinese productreported using long-term contracts; five of these reported selling half or more of their product using long-term contracts. Most sales of the citric acid pricing products were contract sales. U.S. sales of theseproducts were contract sales for over 99 percent of the quantity of these products sold, while Canadianspot sales of these products were *** percent of its sales, the Chinese products were almost 40 percentspot sales, and nonsubject product was all sold in spot sales, as shown in the following tabulation (inpercent).14
Type of purchaser Type of sales U.S. Canada China Nonsubject
End users
Contract 94.6 *** 60.4 0.0
Spot 0.3 *** 25.6 7.1
Distributors
Contract 4.4 *** 1.6 0.0
Spot 0.6 *** 12.4 92.9
For long-term contracts, ***, 9 of the 10 responding importers, and 26 of 37 respondingpurchasers reported that prices could not be renegotiated during the contract. ***. ***. Purchaserstypically report that the terms for these contracts tended to be either set through negotiations or follow“industry standards.”
***, 8 importers, and 28 of the responding purchasers reported that long-term contracts fix bothprice and quantity. ***, two importers, and 10 purchasers reported that long-term contracts fix price butnot quantity. Two purchasers, but no importers or producers, reported that long-term contracts only fixquantity. ***.
*** U.S. producers, 8 of 10 responding importers, and 24 of 40 responding purchasers reportedthat long-term contracts do not have meet-or-release provisions. ***. Only one purchaser, ***, reportedusing its meet-or-release provision.
*** responding U.S. producers and importers reported that the vast majority of their long-termcontracts were with end users. For producer *** of sales. All nine responding importers reported thattheir long-term contracts accounted for between 85 and 100 percent of their sales. The most commonlyreported industries purchasing citric acid and certain citrate salts via long-term contracts include: beverages (reported by *** producers and eight importers); food (*** producers and eight importers); andindustrial (*** producers and three importers).
Producers and importers that sold on a contract basis were asked if the presence of product orbids from various sources of supply at the time of contract negotiations was a “very important,”“somewhat important,” or “not important” factor in price, and if this presence caused prices to increase,decrease, or not to change (table V-1).

15 Hearing transcript, pp. 181-182 (Smith). 16 *** reported that “***.” 17 *** stated that “***.”
V-6
Table V-1Citric acid and certain citrate salts: Number of producers and importers reporting the impact ofcontract prices from different sources by the importance they place on the presence of productfrom these sources
Importance on pricesU.S. producers Importers
Up Neutral Down Up Neutral Down
Presence of U.S. product
Not important 0 *** *** 0 4 0
Somewhat important 0 *** *** 1 7 4
Very important 0 *** *** 2 1 1
Presence of Canadian product
Not important 0 *** *** 0 8 0
Somewhat important 0 *** *** 2 3 1
Very important 0 *** *** 1 1 4
Presence of Chinese product
Not important 0 *** *** 0 3 0
Somewhat important 0 *** *** 0 6 3
Very important 0 *** *** 1 1 6
Presence of nonsubject product
Not important 0 *** *** 0 11 0
Somewhat important 0 *** *** 0 4 2
Very important 0 *** *** 0 1 1
Source: Compiled from data submitted in response to Commission questionnaires.
Purchasers were asked their opinion of the impact on price that the existence of other sellers inthe market has at the time of their contract negotiations (table V-2). Most purchasers reported that theavailability of Chinese and nonsubject product tends to reduce prices, while most reported that theavailability of Canadian product had no impact on price. Purchasers were more divided on the effect ofthe availability of U.S. product; the largest number reported that the presence of U.S. product reducesprice. Purchasers who generally reported that multiple sources only reduced price or had no impactfrequently reported that this was because more sources created greater supply or competition-reducingprices. A number of others reported that Chinese prices were lower than U.S. prices. P&G reported thatU.S. producers offered it lower average delivered prices for citric acid than for product from Canada andChina for every year between 2005 and 2008.15 ***.16 ***.17 ***.
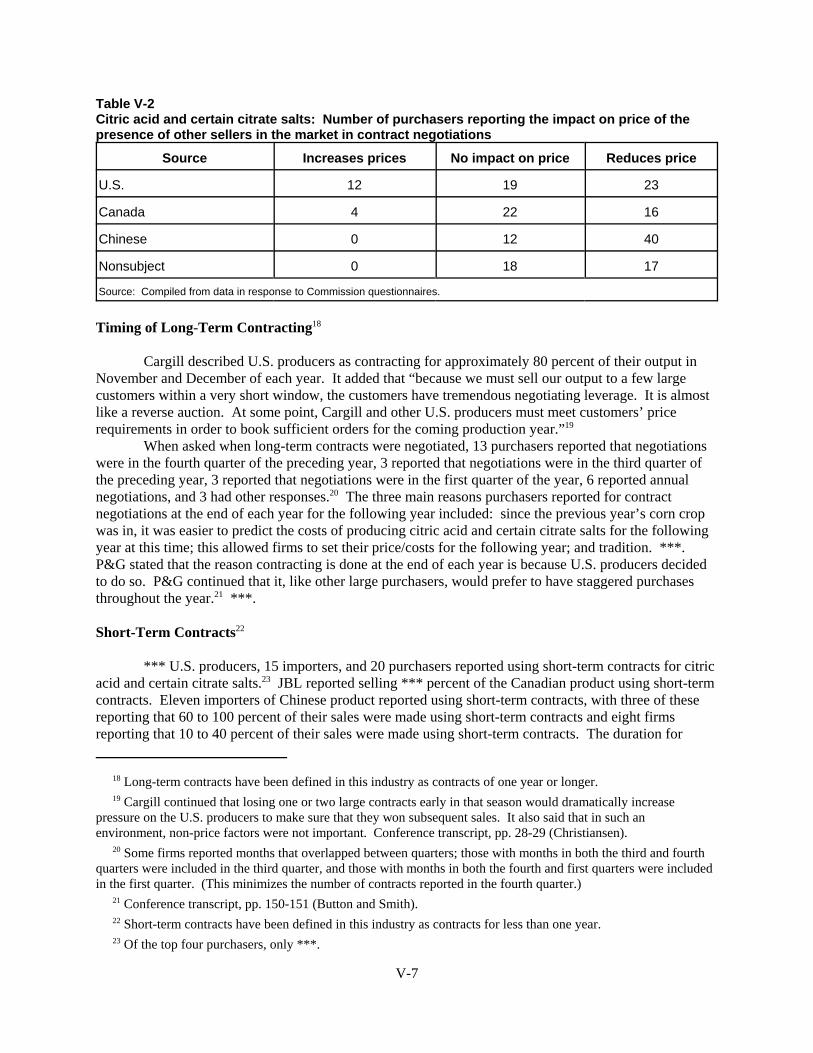
18 Long-term contracts have been defined in this industry as contracts of one year or longer. 19 Cargill continued that losing one or two large contracts early in that season would dramatically increasepressure on the U.S. producers to make sure that they won subsequent sales. It also said that in such anenvironment, non-price factors were not important. Conference transcript, pp. 28-29 (Christiansen). 20 Some firms reported months that overlapped between quarters; those with months in both the third and fourthquarters were included in the third quarter, and those with months in both the fourth and first quarters were includedin the first quarter. (This minimizes the number of contracts reported in the fourth quarter.) 21 Conference transcript, pp. 150-151 (Button and Smith). 22 Short-term contracts have been defined in this industry as contracts for less than one year. 23 Of the top four purchasers, only ***.
V-7
Table V-2Citric acid and certain citrate salts: Number of purchasers reporting the impact on price of the presence of other sellers in the market in contract negotiations
Source Increases prices No impact on price Reduces price
U.S. 12 19 23
Canada 4 22 16
Chinese 0 12 40
Nonsubject 0 18 17
Source: Compiled from data in response to Commission questionnaires.
Timing of Long-Term Contracting18
Cargill described U.S. producers as contracting for approximately 80 percent of their output inNovember and December of each year. It added that “because we must sell our output to a few largecustomers within a very short window, the customers have tremendous negotiating leverage. It is almostlike a reverse auction. At some point, Cargill and other U.S. producers must meet customers’ pricerequirements in order to book sufficient orders for the coming production year.”19
When asked when long-term contracts were negotiated, 13 purchasers reported that negotiationswere in the fourth quarter of the preceding year, 3 reported that negotiations were in the third quarter ofthe preceding year, 3 reported that negotiations were in the first quarter of the year, 6 reported annualnegotiations, and 3 had other responses.20 The three main reasons purchasers reported for contractnegotiations at the end of each year for the following year included: since the previous year’s corn cropwas in, it was easier to predict the costs of producing citric acid and certain citrate salts for the followingyear at this time; this allowed firms to set their price/costs for the following year; and tradition. ***. P&G stated that the reason contracting is done at the end of each year is because U.S. producers decidedto do so. P&G continued that it, like other large purchasers, would prefer to have staggered purchasesthroughout the year.21 ***.
Short-Term Contracts22
*** U.S. producers, 15 importers, and 20 purchasers reported using short-term contracts for citricacid and certain citrate salts.23 JBL reported selling *** percent of the Canadian product using short-termcontracts. Eleven importers of Chinese product reported using short-term contracts, with three of thesereporting that 60 to 100 percent of their sales were made using short-term contracts and eight firmsreporting that 10 to 40 percent of their sales were made using short-term contracts. The duration for

24 Hearing transcript, p. 179 (Smith). 25 Conference transcript, p. 153 (Hsu). 26 Conference transcript, pp. 153 and 176 (Hsu).
V-8
short-term contracts ranged from 1 to 9 months. Sixteen purchasers and 15 importers reported theduration of their short-term contracts. ***. Twelve importers, including ***, and five purchasersreported contracts that were 3 months in duration. Thirteen importers and 16 purchasers reported thatshort-term contracts fix both price and quantity, one purchaser reported that these contracts fix only price,and one importer reported that these contracts fix neither price nor quantity. Nine importers and eightpurchasers reported that these contracts did not contain meet-or-release provisions, while six importersand six purchasers reported that meet-or-release provisions were contained in short-term contracts. Twoimporters, ***, and one purchaser, ***, reported invoking meet-or-release provisions. Eight importersreported that all sales under short-term contracts were purchased by end users, one importer reported thatits short-term contract sales were only to distributors, and the remaining four importers sold from 20 to 98percent of their short-term contracts to distributors, with the rest to end users. The food and the beverageindustries were the most commonly reported end users purchasing using short-term contracts, mentionedby five importers each. Purchasers typically reported that these contracts were entered into on an as-needed or quarterly basis.
Spot Sales/Purchases
*** reported selling some product using spot sales; between 2006 and 2008, the percentages ofspot sales made by ADM, Cargill, and Tate & Lyle were ***, ***, and *** percent, respectively. JBLreported selling *** of the Canadian product on a spot basis. Six of the 16 importers of Chinese productreported selling all citric acid and certain citrate salts on a spot basis, four reported that spot salesaccounted for 10 to 40 percent of sales, five reported these were 60 to 80 percent of sales, and oneindicated that spot sales accounted for 85 percent of its total sales. While 47 of the 65 respondingpurchasers reported spot purchases between 2006 and 2008, the largest end users were less likely topurchase citric acid and certain citrate salts on a spot basis. ***. P&G reported using spot purchases onlyif an emergency arises.24 Purchasers reported that spot purchases tended to be on an as-needed basis, withprices reported to be set either by negotiation, the market, or quotes from suppliers.
United Foods stated that smaller customers buy on a spot basis only.25 It added that smallercustomers will buy from distributors that sell citric acid and certain citrate salts along with a pallet ofdifferent products that may influence the price of the citric acid and certain citrate salts as well.26
Producers, importers, and purchasers were asked the importance of citric acid and certain citratesalts from different sources on their spot prices and if product from different sources tended to causeprices to increase, decrease, or have a neutral impact (table V-3).
Other Sales/Purchase Conditions
Most responding purchasers, 53 of the 69, did not purchase citric acid and certain citrate saltstogether with other products. Some purchasers reported buying mixed truckloads from U.S. producers,the Canadian producer, or distributors, and one reported buying hundreds of products from the same
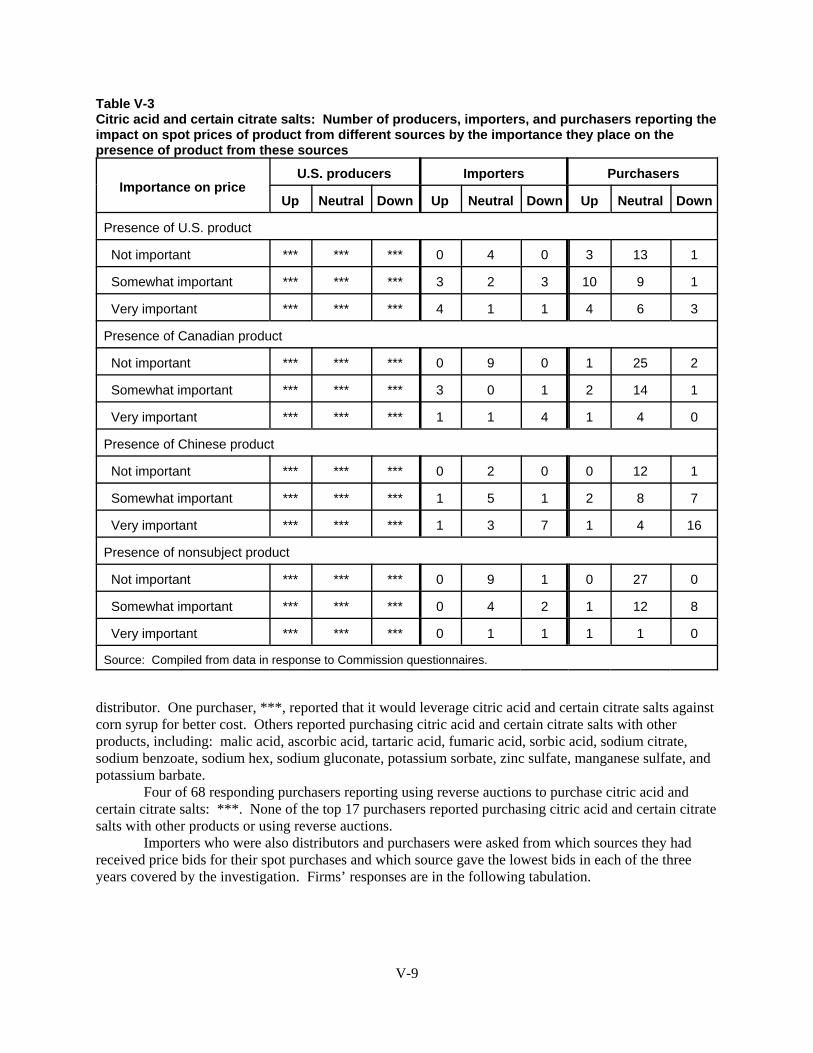
V-9
Table V-3Citric acid and certain citrate salts: Number of producers, importers, and purchasers reporting theimpact on spot prices of product from different sources by the importance they place on thepresence of product from these sources
Importance on priceU.S. producers Importers Purchasers
Up Neutral Down Up Neutral Down Up Neutral Down
Presence of U.S. product
Not important *** *** *** 0 4 0 3 13 1
Somewhat important *** *** *** 3 2 3 10 9 1
Very important *** *** *** 4 1 1 4 6 3
Presence of Canadian product
Not important *** *** *** 0 9 0 1 25 2
Somewhat important *** *** *** 3 0 1 2 14 1
Very important *** *** *** 1 1 4 1 4 0
Presence of Chinese product
Not important *** *** *** 0 2 0 0 12 1
Somewhat important *** *** *** 1 5 1 2 8 7
Very important *** *** *** 1 3 7 1 4 16
Presence of nonsubject product
Not important *** *** *** 0 9 1 0 27 0
Somewhat important *** *** *** 0 4 2 1 12 8
Very important *** *** *** 0 1 1 1 1 0
Source: Compiled from data in response to Commission questionnaires.
distributor. One purchaser, ***, reported that it would leverage citric acid and certain citrate salts againstcorn syrup for better cost. Others reported purchasing citric acid and certain citrate salts with otherproducts, including: malic acid, ascorbic acid, tartaric acid, fumaric acid, sorbic acid, sodium citrate,sodium benzoate, sodium hex, sodium gluconate, potassium sorbate, zinc sulfate, manganese sulfate, andpotassium barbate.
Four of 68 responding purchasers reporting using reverse auctions to purchase citric acid andcertain citrate salts: ***. None of the top 17 purchasers reported purchasing citric acid and certain citratesalts with other products or using reverse auctions.
Importers who were also distributors and purchasers were asked from which sources they hadreceived price bids for their spot purchases and which source gave the lowest bids in each of the threeyears covered by the investigation. Firms’ responses are in the following tabulation.

27 Conference transcript, pp. 95 (Oakley) and 146 (Waite). 28 Hearing transcript, pp. 77-78 (Beroni). 29 Hearing transcript, pp. 79-80 (Lorusso). 30 Hearing transcript, p. 81 (Oakley, Anderson). 31 Hearing transcript, p. 246 (Button). 32 Hearing transcript, p. 247 (Cameron). 33 However, at the conference, petitioners clarified that while they do not offer volume-based discounts or rebates,volume does play a role in price negotiations. Conference transcript, p. 97 (Anderson).
V-10
Source
Importer/distributors Purchasers
Number ofreporting bids
by source
Lowest bid Number ofreporting bids
by source
Lowest bid
2006 2007 2008 2006 2007 2008
U.S. 2 0 0 0 26 7 6 9
Canada 2 0 0 0 17 4 3 3
China 7(1) 9 9 9 40 36 38 34
Nonsubject 3 0 0 0 15 0 0 0
1 Two importers did not report the sources of product they purchased, but reported the sources of their lowestbids.
Source: Compiled from data in response to Commission questionnaires.
Producers and importers agreed that they learn about competitors’ pricing not through beingshown competing offers directly, but rather from intelligence gathered during the negotiating process withpurchasers.27 Petitioners report that since the price of citric acid is not determined by traders in an openmarket they do not know the price at any given time. Customers tell them the price that they want and“they may be telling us that our prices have to be lower than the prices they’ve actually been given byother competitors.”28 Pricing information also comes from distributors, particularly if price supports (i.e.,discounts) are used in order to compete with spot sales.29 Petitioners also report that they are not treateddifferently than imports by purchasers.30 Respondents report that spot prices are an indicator of markettrends. When spot prices are higher, as in the citric acid market during this period, this indicates that themarket is tight, and contract negotiations should result in higher prices to reflect this.31 Respondents alsostate that spot and contract markets are separate markets and that spot sales do not take business awayfrom contract sales.32
Sales Terms and Discounts
*** and 22 importers stated that their typical sales terms were net 30 days delivered. Of those 22importers, nine quoted prices on a delivered basis, nine quoted prices on an f.o.b. warehouse basis, andfour used some combination of delivered and f.o.b. warehouse quotations. Two importers had sales termsof net 60 days delivered. One additional importer reported “no” sales terms, but stated that it quotedprices on a delivered basis.
*** reported that they did not have a discount policy, although ***.33 Among importers, sixreported offering discounts, with five of those basing discounts on volume and one basing discounts on

34 The questionnaire requested data for granular product, and some firms included fine granular which had been aseparate product in the preliminary phase questionnaire. It was unclear how fine granular should be treated in thefinal phase questionnaire. Prices were reported to differ between normal granular and fine granular product;therefore, it was decided to limit products 1 and 2 to exclude fine granular. All firms were contacted and requestedto make any necessary adjustments in their data. All importers that reported any price data for fine granular productin the preliminary phase of the investigations were checked; some had not included fine granular in their responsesto the final phase questionnaires, and the others either removed fine granular data or reported that they charge thesame price for fine granular as for regular granular. The U.S. producers excluded fine granular from their pricingdata in their responses to the final phase questionnaire. 35 ***. *** of Canadian product reporting price data ***. 36 Importers of Chinese product reporting price data were: ***.
V-11
competitive conditions. Nineteen importers reported that they do not offer discounts on their sales ofcitric acid and certain citrate salts.
PRICE DATA
The Commission requested U.S. producers and importers of citric acid and certain citrate salts toprovide quarterly data for the total quantity and net f.o.b. value of citric acid and certain citrate salts thatwere shipped to unrelated customers in the U.S. market. Data were requested for the period January2006-December 2008, and values and quantities were requested on an anhydrous-equivalent basis. Theproducts for which pricing data were requested are as follows:
Product 1.—Citric acid, granular, in dry form in 25-kilogram and 50-pound bags.Excluding all product packaged and sold as fine granular product.34
Product 2.—Citric acid, granular, in dry form packed in bulk sacks (“supersacks”).Excluding all product packaged and sold as fine granular product.
Product 3.—Citric acid, in 48 to 52 percent solution form.
Product 4.—Sodium citrate, granular, in dry form in 25-kilogram and 50-pound bags.
Product 5.—Potassium citrate, granular, in dry form in 25-kilogram and 50-pound bags.
Pricing data were requested separately for sales to end users and distributors for all 5 pricing products; inaddition, prices for citric acid products 1 through 3 were requested separately for spot sales and contractsales.
Three U.S. producers, *** of Canadian product,35 and 21 importers of Chinese product36 providedusable pricing data for sales of the requested products, although not all firms reported pricing for allproducts for all quarters. Pricing data reported by these firms accounted for approximately 56.3 percentof U.S. producers’ U.S. shipments of citric acid and certain citrate salts, *** percent of U.S. shipments ofsubject imports from Canada, and 60.0 percent of U.S. shipments of subject imports from China in 2008.
Price Trends and Comparisons
Producers’ and importers’ pricing data by sales to end users vs. distributors and by spot sales vs.contract sales are presented in tables V-4 to V-8 and figures V-3 to V-7. A summary of pricing data is

V-12
Table V-4Citric acid and certain citrate salts: Weighted-average delivered prices and quantities of domesticand imported product 1,1 and margins of (overselling)/underselling by spot and contract sales, bytype of purchaser and by quarters, January 2006-December 2008
Period
United States Canada ChinaPrice(per
pound)
Quantity(1,000 drypounds)
Price(per
pound)
Quantity(1,000 drypounds)
Margin(percent)
Price(per
pound)
Quantity(1,000 drypounds)
Margin(percent)
Spot sales to end users2006: Jan.-Mar. $*** *** $*** *** *** $0.54 4,803 *** Apr.-June *** *** *** *** *** 0.54 5,324 *** July-Sept. *** *** *** *** *** 0.53 4,731 *** Oct.-Dec. *** *** *** *** *** 0.57 3,304 ***2007: Jan.-Mar. *** *** *** *** *** 0.54 4,411 *** Apr.-June *** *** *** *** *** 0.55 4,653 *** July-Sept. *** *** *** *** *** 0.53 4,845 *** Oct.-Dec. *** *** *** *** *** 0.56 4,260 ***2008: Jan.-Mar. *** *** *** *** *** 0.59 6,421 *** Apr.-June *** *** *** *** *** 0.69 8,004 *** July-Sept. *** *** *** *** *** 0.86 6,590 *** Oct.-Dec. *** *** *** *** *** 0.99 4,580 ***
Contract sales to end users2006: Jan.-Mar. *** *** *** *** *** 0.52 3,868 *** Apr.-June *** *** *** *** *** *** *** *** July-Sept. *** *** *** *** *** *** *** *** Oct.-Dec. *** *** *** *** *** *** *** ***2007: Jan.-Mar. *** *** *** *** *** *** *** *** Apr.-June *** *** *** *** *** *** *** *** July-Sept. *** *** *** *** *** *** *** *** Oct.-Dec. *** *** *** *** *** *** *** ***2008: Jan.-Mar. *** *** *** *** *** 0.57 5,955 *** Apr.-June 0.55 13,428 *** *** *** 0.66 7,332 (18.8) July-Sept. 0.54 11,299 *** *** *** 0.77 5,362 (42.7) Oct.-Dec. 0.56 8,107 *** *** *** 0.83 4,075 (46.2) 1 Citric acid, granular, in dry form in 25-kilogram and 50-pound bags sold.
Table continued on next page.
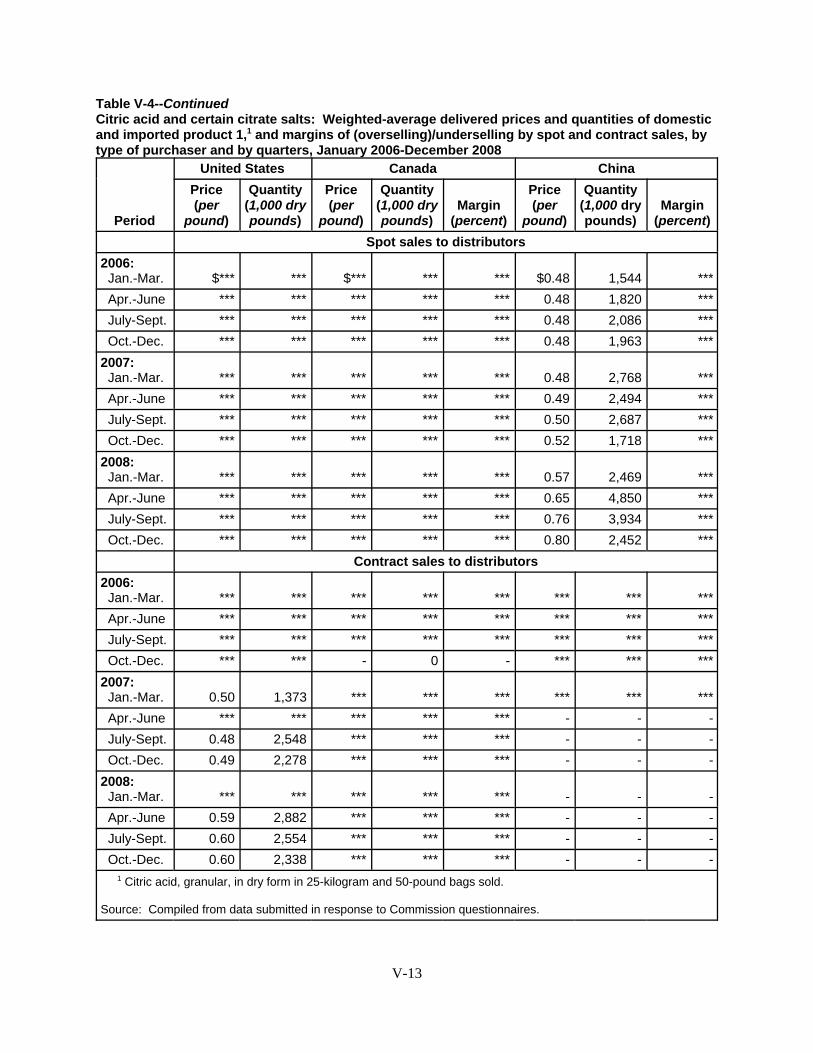
V-13
Table V-4--ContinuedCitric acid and certain citrate salts: Weighted-average delivered prices and quantities of domesticand imported product 1,1 and margins of (overselling)/underselling by spot and contract sales, bytype of purchaser and by quarters, January 2006-December 2008
Period
United States Canada ChinaPrice(per
pound)
Quantity(1,000 drypounds)
Price(per
pound)
Quantity(1,000 drypounds)
Margin(percent)
Price(per
pound)
Quantity(1,000 drypounds)
Margin(percent)
Spot sales to distributors2006: Jan.-Mar. $*** *** $*** *** *** $0.48 1,544 *** Apr.-June *** *** *** *** *** 0.48 1,820 *** July-Sept. *** *** *** *** *** 0.48 2,086 *** Oct.-Dec. *** *** *** *** *** 0.48 1,963 ***2007: Jan.-Mar. *** *** *** *** *** 0.48 2,768 *** Apr.-June *** *** *** *** *** 0.49 2,494 *** July-Sept. *** *** *** *** *** 0.50 2,687 *** Oct.-Dec. *** *** *** *** *** 0.52 1,718 ***2008: Jan.-Mar. *** *** *** *** *** 0.57 2,469 *** Apr.-June *** *** *** *** *** 0.65 4,850 *** July-Sept. *** *** *** *** *** 0.76 3,934 *** Oct.-Dec. *** *** *** *** *** 0.80 2,452 ***
Contract sales to distributors2006: Jan.-Mar. *** *** *** *** *** *** *** *** Apr.-June *** *** *** *** *** *** *** *** July-Sept. *** *** *** *** *** *** *** *** Oct.-Dec. *** *** - 0 - *** *** ***2007: Jan.-Mar. 0.50 1,373 *** *** *** *** *** *** Apr.-June *** *** *** *** *** - - - July-Sept. 0.48 2,548 *** *** *** - - - Oct.-Dec. 0.49 2,278 *** *** *** - - -2008: Jan.-Mar. *** *** *** *** *** - - - Apr.-June 0.59 2,882 *** *** *** - - - July-Sept. 0.60 2,554 *** *** *** - - - Oct.-Dec. 0.60 2,338 *** *** *** - - - 1 Citric acid, granular, in dry form in 25-kilogram and 50-pound bags sold.
Source: Compiled from data submitted in response to Commission questionnaires.

V-14
Table V-5Citric acid and certain citrate salts: Weighted-average delivered prices and quantities of domesticand imported product 2,1 and margins of (overselling)/underselling by spot and contract sales, bytype of purchaser and by quarters, January 2006-December 2008
Period
United States Canada ChinaPrice(per
pound)
Quantity(1,000 drypounds)
Price(per
pound)
Quantity(1,000 drypounds)
Margin(percent)
Price(per
pound)
Quantity(1,000 drypounds)
Margin(percent)
Spot sales to end users2006: Jan.-Mar. $*** *** $*** *** *** $*** *** *** Apr.-June *** *** *** *** *** *** *** *** July-Sept. *** *** - 0 - *** *** *** Oct.-Dec. *** *** *** *** *** *** *** ***2007: Jan.-Mar. *** *** *** *** *** *** *** *** Apr.-June *** *** *** *** *** *** *** *** July-Sept. *** *** *** *** *** *** *** *** Oct.-Dec. *** *** - 0 - *** *** ***2008: Jan.-Mar. *** *** *** *** *** 0.56 499 *** Apr.-June *** *** - 0 - 0.61 429 *** July-Sept. *** *** - 0 - *** *** *** Oct.-Dec. *** *** *** *** *** *** *** ***
Contract sales to end users2006: Jan.-Mar. 0.47 6,468 *** *** *** *** *** *** Apr.-June 0.47 13,539 *** *** *** *** *** *** July-Sept. 0.47 14,961 *** *** *** 0.39 9,280 16.1 Oct.-Dec. 0.48 5,950 *** *** *** 0.39 5,392 17.52007: Jan.-Mar. 0.47 10,010 *** *** *** *** *** *** Apr.-June 0.47 14,264 *** *** *** *** *** *** July-Sept. 0.47 11,213 *** *** *** *** *** *** Oct.-Dec. 0.47 11,015 *** *** *** *** *** ***2008: Jan.-Mar. 0.52 9,218 *** *** *** *** *** *** Apr.-June 0.53 13,602 *** *** *** *** *** *** July-Sept. 0.54 12,679 *** *** *** 0.71 22,659 (31.0) Oct.-Dec. 0.53 11,803 *** *** *** *** *** *** 1 Citric acid, granular, in dry form packed in bulk sacks ("supersacks").
Source: Compiled from data submitted in response to Commission questionnaires.
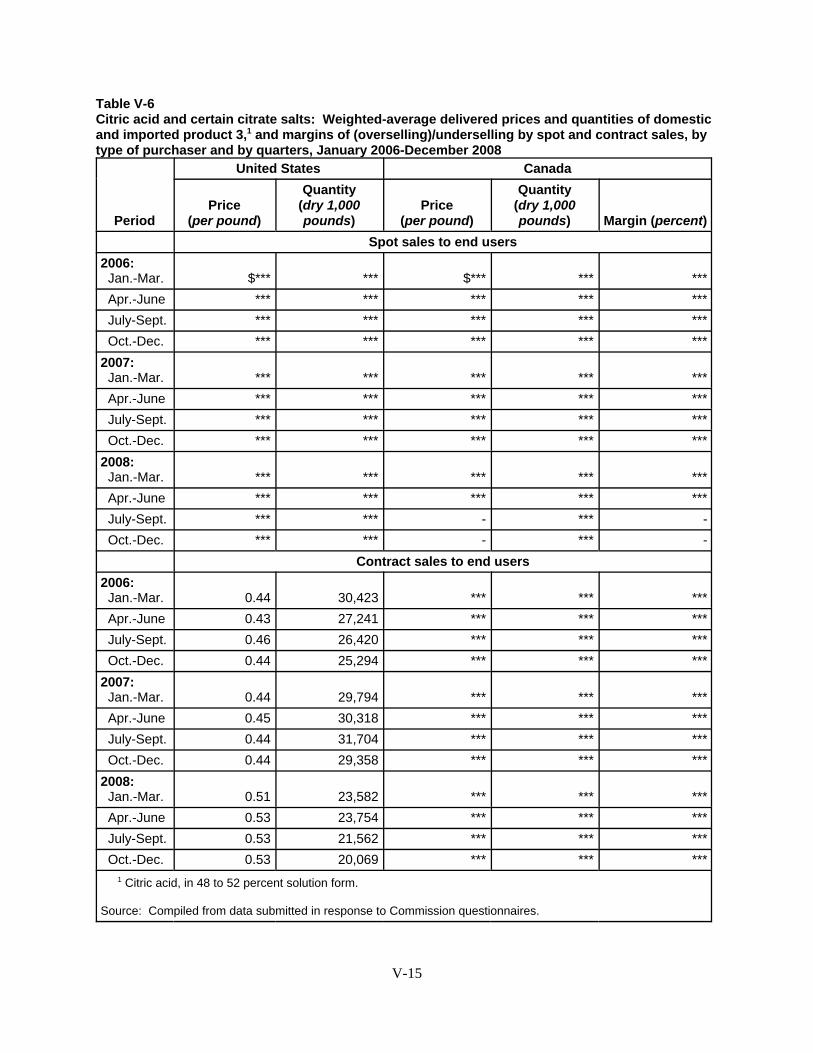
V-15
Table V-6Citric acid and certain citrate salts: Weighted-average delivered prices and quantities of domesticand imported product 3,1 and margins of (overselling)/underselling by spot and contract sales, bytype of purchaser and by quarters, January 2006-December 2008
Period
United States Canada
Price(per pound)
Quantity(dry 1,000pounds)
Price(per pound)
Quantity(dry 1,000pounds) Margin (percent)
Spot sales to end users2006: Jan.-Mar. $*** *** $*** *** *** Apr.-June *** *** *** *** *** July-Sept. *** *** *** *** *** Oct.-Dec. *** *** *** *** ***2007: Jan.-Mar. *** *** *** *** *** Apr.-June *** *** *** *** *** July-Sept. *** *** *** *** *** Oct.-Dec. *** *** *** *** ***2008: Jan.-Mar. *** *** *** *** *** Apr.-June *** *** *** *** *** July-Sept. *** *** - *** - Oct.-Dec. *** *** - *** -
Contract sales to end users2006: Jan.-Mar. 0.44 30,423 *** *** *** Apr.-June 0.43 27,241 *** *** *** July-Sept. 0.46 26,420 *** *** *** Oct.-Dec. 0.44 25,294 *** *** ***2007: Jan.-Mar. 0.44 29,794 *** *** *** Apr.-June 0.45 30,318 *** *** *** July-Sept. 0.44 31,704 *** *** *** Oct.-Dec. 0.44 29,358 *** *** ***2008: Jan.-Mar. 0.51 23,582 *** *** *** Apr.-June 0.53 23,754 *** *** *** July-Sept. 0.53 21,562 *** *** *** Oct.-Dec. 0.53 20,069 *** *** ***
1 Citric acid, in 48 to 52 percent solution form.
Source: Compiled from data submitted in response to Commission questionnaires.

V-16
Table V-7Citric acid and certain citrate salts: Weighted-average delivered prices and quantities of domesticand imported product 4,1 and margins of (overselling)/underselling by type of purchaser and byquarters, January 2006-December 2008
Period
United States China
Price(per pound)
Quantity(1,000 drypounds)
Price(per pound)
Quantity(1,000 drypounds) Margin (percent)
Sales to end users2006: Jan.-Mar. $*** *** $0.50 1,238 *** Apr.-June *** *** 0.50 1,545 *** July-Sept. *** *** 0.51 1,482 *** Oct.-Dec. *** *** 0.50 1,145 ***2007: Jan.-Mar. *** *** 0.50 1,508 *** Apr.-June *** *** 0.50 1,804 *** July-Sept. *** *** 0.51 1,547 *** Oct.-Dec. *** *** 0.50 1,263 ***2008: Jan.-Mar. *** *** 0.56 1,470 *** Apr.-June *** *** 0.62 1,956 *** July-Sept. *** *** 0.75 1,707 *** Oct.-Dec. *** *** 0.80 1,839 ***
Sales to distributors2006: Jan.-Mar. *** *** 0.42 149 *** Apr.-June *** *** *** *** *** July-Sept. *** *** 0.45 110 *** Oct.-Dec. *** *** *** *** ***2007: Jan.-Mar. *** *** 0.46 168 *** Apr.-June *** *** 0.41 249 *** July-Sept. *** *** 0.42 563 *** Oct.-Dec. *** *** 0.42 309 ***2008: Jan.-Mar. *** *** 0.51 480 *** Apr.-June *** *** 0.60 1,085 *** July-Sept. *** *** *** *** *** Oct.-Dec. *** *** 0.78 292 *** 1 Sodium citrate, granular, in dry form in 25-kilogram and 50-pound bags.
Source: Compiled from data submitted in response to Commission questionnaires.

V-17
Table V-8Citric acid and certain citrate salts: Weighted-average delivered prices and quantities of domesticand imported product 5, and margins of (overselling)/underselling by type of purchaser and byquarters, January 2006-December 2008
* * * * * * *
Figure V-3Citric acid: Weighted-average delivered selling prices to distributors and end users via spot andcontract sales, as reported by U.S. producers and importers of product 1, by quarters, January2006-December 2008
* * * * * * *
Figure V-4Citric acid: Weighted-average delivered selling prices to distributors and end users via spot andcontract sales, as reported by U.S. producers and importers of product 2, by quarters, January2006-December 2008
* * * * * * *
Figure V-5Citric acid: Weighted-average delivered. selling prices to distributors and end users via spot andcontract sales, as reported by U.S. producers and importers of product 3, by quarters, January2006-December 2008
* * * * * * *
Figure V-6Citric acid: Weighted-average delivered selling prices to distributors and end users, as reportedby U.S. producers and importers of product 4, by quarters, January 2006-December 2008
* * * * * * *
Figure V-7Citric acid: Weighted-average delivered. selling prices to distributors and end users, as reportedby U.S. producers and importers of product 5, by quarters, January 2006-December 2008
* * * * * * *
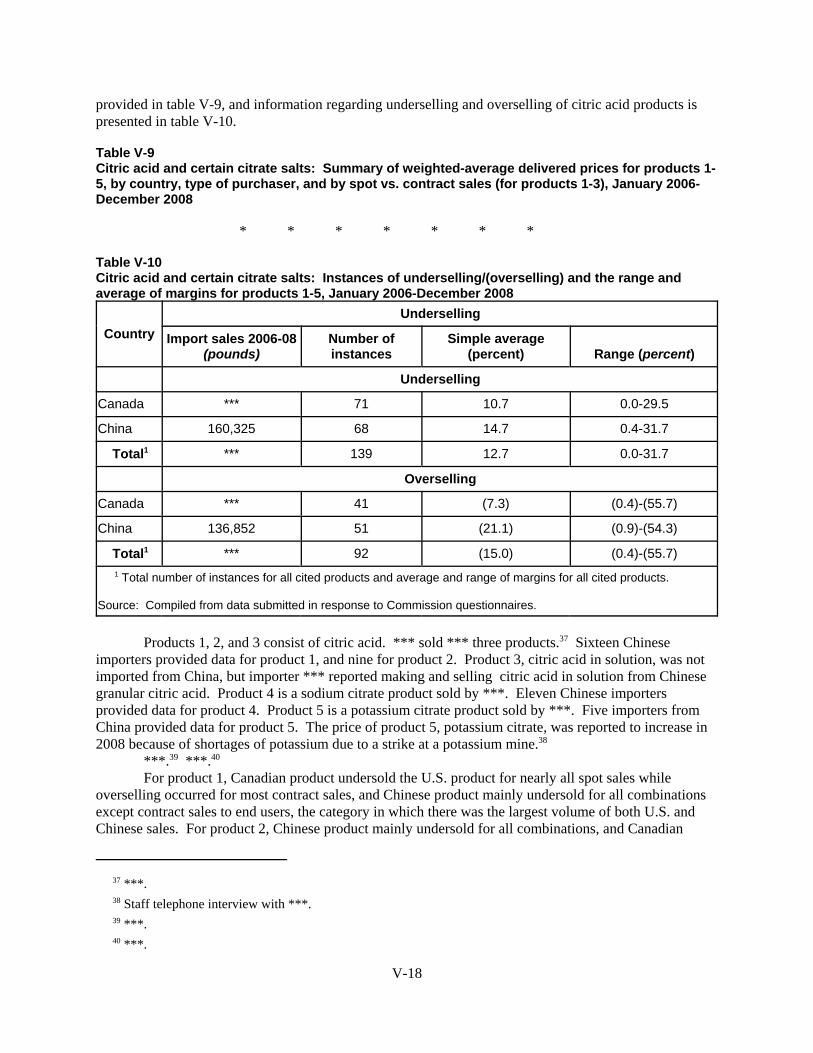
37 ***. 38 Staff telephone interview with ***. 39 ***. 40 ***.
V-18
provided in table V-9, and information regarding underselling and overselling of citric acid products ispresented in table V-10.
Table V-9Citric acid and certain citrate salts: Summary of weighted-average delivered prices for products 1-5, by country, type of purchaser, and by spot vs. contract sales (for products 1-3), January 2006-December 2008
* * * * * * *
Table V-10Citric acid and certain citrate salts: Instances of underselling/(overselling) and the range andaverage of margins for products 1-5, January 2006-December 2008
CountryUnderselling
Import sales 2006-08(pounds)
Number ofinstances
Simple average(percent) Range (percent)
Underselling
Canada *** 71 10.7 0.0-29.5
China 160,325 68 14.7 0.4-31.7
Total1 *** 139 12.7 0.0-31.7
Overselling
Canada *** 41 (7.3) (0.4)-(55.7)
China 136,852 51 (21.1) (0.9)-(54.3)
Total1 *** 92 (15.0) (0.4)-(55.7)
1 Total number of instances for all cited products and average and range of margins for all cited products.
Source: Compiled from data submitted in response to Commission questionnaires.
Products 1, 2, and 3 consist of citric acid. *** sold *** three products.37 Sixteen Chineseimporters provided data for product 1, and nine for product 2. Product 3, citric acid in solution, was notimported from China, but importer *** reported making and selling citric acid in solution from Chinesegranular citric acid. Product 4 is a sodium citrate product sold by ***. Eleven Chinese importersprovided data for product 4. Product 5 is a potassium citrate product sold by ***. Five importers fromChina provided data for product 5. The price of product 5, potassium citrate, was reported to increase in2008 because of shortages of potassium due to a strike at a potassium mine.38
***.39 ***.40 For product 1, Canadian product undersold the U.S. product for nearly all spot sales while
overselling occurred for most contract sales, and Chinese product mainly undersold for all combinationsexcept contract sales to end users, the category in which there was the largest volume of both U.S. andChinese sales. For product 2, Chinese product mainly undersold for all combinations, and Canadian
41 Purchasers reporting U.S. product pricing information were: ***. Purchasers reporting Canadian product pricedata were: ***. Purchasers reporting Chinese product price data were: ***. The only purchaser reportingnonsubject product price data was ***. Pricing data reported by these firms accounted for approximately 36.3percent of U.S. producers' U.S. shipments of citric acid and certain citrate salts, 44.5 percent of U.S. shipments ofsubject imports from Canada, and 30.6 percent of U.S. shipments of subject imports from China in 2008. 42 No new allegations were reported in the final phase questionnaires. The allegations included in this reportdiffer slightly from those included in the preliminary phase staff report, since allegations from 2004 are not included,nor are two lost sales allegations for purchasers located in Canada.
V-19
product undersold for nearly all spot sales to end users and distributors but oversold half the time forcontract sales to end users. For product 3, Canadian product mainly undersold for spot sales to end usersand distributors, and mainly oversold for contract sales to end users, the category for which there was themost U.S. ***. *** Canadian data were reported for products 2 or 3, contract sales to distributors. Forproducts 4 and 5, Chinese product oversold the domestic product in all sales to end users, which are thecategories with the most U.S. and Chinese sales. Domestically produced product 4 sold to distributorswas mainly undersold by the Chinese product and domestically produced product 5 sold to distributorswas undersold half the time by the Chinese product.
In addition, purchasers that purchased over 20 million pounds of citric acid and certain citratesalts were requested to provide purchase price data for the five listed products. Pricing was requested forpurchases pursuant to contracts and spot purchases for products 1-3; prices for products 4 and 5 combinedcontract and spot purchases. Eight purchasers provided pricing data for U.S. product, four for Canadianproduct, six for Chinese product, and one for nonsubject product.41 For product 1, both spot and contractpurchase prices were available. Canadian prices were below U.S. prices in 22 of the 23 pricecomparisons and Chinese prices were below U.S. prices in 14 of the 15 price comparisons. For product 2contract purchases, Canadian prices were below U.S. prices in 3 of the 12 price comparisons and Chineseprices were below U.S. prices in 10 of the 12 price comparisons. For product 3 contract purchases,Canadian prices were above U.S. prices for all 12 quarters. Chinese prices were below U.S. prices in 7 ofthe 10 price comparisons for product 4 and all price comparisons for product 5.
LOST SALES AND LOST REVENUES
The Commission requested U.S. producers of citric acid and certain citrate salts to report anyinstances of lost sales or revenues they experienced due to competition from imports of citric acid andcertain citrate salts from Canada or China during January 2005 to March 2008. All three U.S. producersreported that they had to either reduce prices or roll back announced price increases. The 60 lost salesallegations42 totaled $*** and involved *** pounds of citric acid; the 27 lost revenue allegations totaled$*** and involved *** pounds of citric acid. Staff contacted the listed purchasers, and 36 purchasers,covering 51 allegations, responded. A summary of the information obtained follows in tables V-11 andV-12 and the text descriptions below.
* * * * * * *
Table V-11Citric acid and certain citrate salts: U.S. producers’ lost sales allegations
* * * * * * *
43 ***. 44 ***.
V-20
Table V-12Citric acid and certain citrate salts: U.S. producers’ lost revenue allegations
* * * * * * *
* * * * * * *.43 44
1 These related party transfers are to *** foreign affiliates. Since the trade (shipment) section of the U.S.producer questionnaire instructs producers to report *** shipments, *** are properly classified as *** and not *** inPart III. 2 February 24, 2009 e-mail from ***. 3 February 25, 2009 e-mail from ***. 4 Commission staff conducted a verification of ADM’s questionnaire response on March 31-April 2, 2009. 5 Petitioners contended that the increase in profitability was the result of a decrease in imports from China whichwas in turn the result of a European Union antidumping investigation and the filing of the U.S. cases (hearing transcript, pp. 15 (Ellis) and 44-45 (Christiansen)).
VI-1
PART VI: FINANCIAL EXPERIENCE OF U.S. PRODUCERS
BACKGROUND
All three U.S. producers provided useable financial data. ADM’s fiscal year ends on June 30 and Cargill’s fiscal year ends on May 31, while Tate & Lyle’s fiscal year ends on March 31. However, thefinancial data of all three producers were submitted on a calendar-year basis. Consistent with thepresentation in other parts of this report, the only data presented in this section are the producers’combined operations on citric acid and certain citrate salts; separate data on citric acid, sodium citrate, and potassium citrate are presented in appendix C.
In addition to commercial sales, *** reported transfers to related parties, and *** reportedinternal consumption. These transfers and internal consumption1 accounted for approximately ***percent and *** percent, respectively, of the industry’s 2008 sales values. The unit sales values of ***2
***. The unit sales values of ***3 ***.The questionnaire data of ADM were verified with company records at its plant facilities.4 All
verification adjustments were incorporated into this report. The financial data of ADM were revised forall periods to ***. The revisions resulted in ***. A part of non-recurring charges related to ***.
OPERATIONS ON CITRIC ACID AND CERTAIN CITRATE SALTS
Aggregate income-and-loss data for the producers on their total operations producing/selling citric acid and certain citrate salts are presented in table VI-1. Despite increases in net sales quantities andvalues from period to period, the domestic industry incurred much greater losses in 2007 than in 2006. From 2007 to 2008, net sales value and per-unit sales values increased by approximately 20 percent whilesales quantities were relatively unchanged. Even though profitability at the gross and operating profitlevels improved, the gross profit margin was 2.1 percent and there were still losses at the operatingincome level. The decrease in the operating loss between 2007 and 2008 resulted from the $0.085 perpound increase in unit sales values, which was $0.027 per pound higher than the $0.058 per poundincrease in unit total costs – the unit cost of goods sold (“COGS”) increased by $0.058 per pound (led bythe increase of raw material costs) while unit selling, general and administrative (“SG&A”) expensesdecreased by $0.001 per pound, for a net total cost (COGS and SG&A expenses combined) increase of$0.058 per pound.5

6 *** based on the Statement of Financial Accounting Standards (SFAS) No. 143, “Accounting for assetsretirement obligations” (February 24, 2009 e-mail from ***). The statement applies to legal obligations associatedwith the retirement of long-lived assets that result from the acquisition, construction, development and (or) thenormal operation of a long-lived asset. This statement requires that the fair value of a liability for an asset retirementobligation be recognized in the period in which it is incurred if a reasonable estimate of fair value can be made. Since financial data should be based on the U.S. domestic production and sales operations only, ***. 7 ***. 8 ***. Refer to the e-mail from ***. Restructuring charges and impairment losses on long-lived assets to be heldand used shall be reported as components of income from continuing operations, according to GAAP (Statement ofFinancial Accounting Standards (SFAS) No. 144, “Accounting for the impairment or disposal of long-lived assets”),with appropriate footnote disclosure. 9 See table III-2. 10 See page II-1, ***.
VI-2
In addition, *** producers reported *** amounts of other expenses; ***;6 ***;7 and ***.8 Theseexpenses were reported below the operating income (loss) line as other expenses.
Selected company-by-company data are presented in table VI-2. ***, the ***, reported increasedsales quantities and values and *** in every period. While ***. *** reported capacity utilization rates(approximately *** percent in 2006 and 2007 and *** percent in 2008) were ***,9 and this may alsocontribute to ***. While *** also generally had the ***, the disparity between ***. ***’s quantity andvalue of net sales increased in both 2007 and 2008. ***, on the other hand, reported decreased salesquantities and values from 2006 to 2007, and then increased sales quantities and values from 2007 to2008. Its unit revenues and unit costs were generally ***. The company reported ***. ***10 ***.

VI-3
Table VI-1Citric acid and certain citrate salts: Results of U.S. producers1 on their operations, calendar years2006-2008
ItemCalendar year
2006 2007 2008Quantity (1,000 pounds)
Net sales quantities:
Commercial sales *** *** *** Internal consumption *** *** *** Transfers to related firms *** *** *** Total net sales quantities 466,160 513,924 515,514
Value (1,000 dollars)Net sales values:
Commercial sales *** *** *** Internal consumption *** *** *** Transfers to related firms *** *** *** Total net sales values 205,773 226,909 271,708Cost of goods sold (COGS) 202,849 235,123 266,120Gross profit (loss) 2,924 (8,214) 5,588SG&A expenses 13,653 13,420 13,093Operating income (loss) (10,729) (21,634) (7,505) Interest expense 6,981 6,692 5,253 All other expenses1 2,599 198 40,432 All other income 1,745 2,469 0Net income (loss) (18,564) (26,055) (53,190)Depreciation/amortization 15,468 14,137 11,522Cash flow (3,096) (11,918) (41,668)
Unit value (per pound)Net sales values $0.441 $0.442 $0.527COGS 0.435 0.458 0.516Gross profit (loss) 0.006 (0.016) 0.011SG&A expenses 0.029 0.026 0.025Operating income (loss) (0.023) (0.042) (0.015)
Table continued on next page.
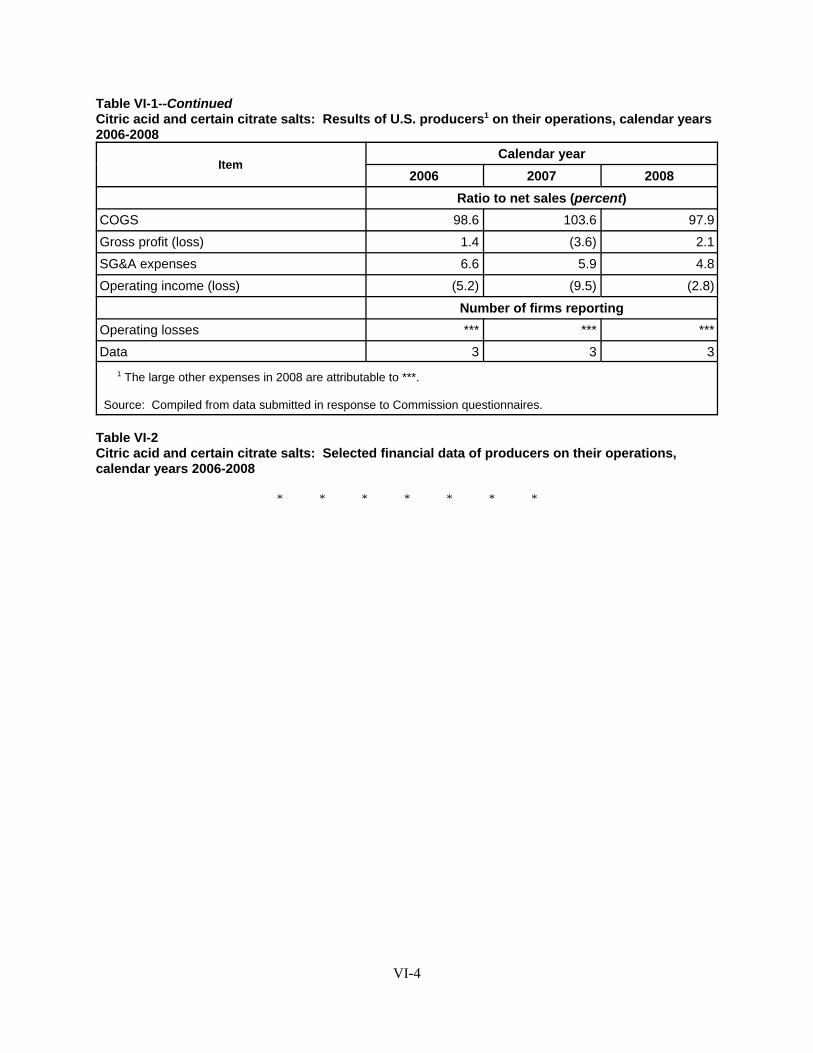
VI-4
Table VI-1--Continued Citric acid and certain citrate salts: Results of U.S. producers1 on their operations, calendar years2006-2008
ItemCalendar year
2006 2007 2008Ratio to net sales (percent)
COGS 98.6 103.6 97.9Gross profit (loss) 1.4 (3.6) 2.1SG&A expenses 6.6 5.9 4.8Operating income (loss) (5.2) (9.5) (2.8)
Number of firms reportingOperating losses *** *** ***Data 3 3 3
1 The large other expenses in 2008 are attributable to ***.
Source: Compiled from data submitted in response to Commission questionnaires.
Table VI-2Citric acid and certain citrate salts: Selected financial data of producers on their operations,calendar years 2006-2008
* * * * * * *
11 February 24, 2009 e-mail from ***. 12 Statement of Financial Accounting Standards No. 161 (FAS-161, Disclosures about Derivative Instruments andHedging Activities; an amendment of FASB No. 133) changes the disclosure requirements for derivative instrumentsand hedging activities. This Statement has the same scope as Statement 133. It requires that the location and fairvalue amounts of derivative instruments be reported in the statement of financial position and the location andamount of the gains and losses be reported in the statement of financial performance. Fair value amounts and theeffective portion of gains and losses shall be presented separately by type of derivative contract and the disclosureshall identify the line item(s) in both statements. Financial Accounting Standard (FAS-133, Accounting forDerivative Instruments and Hedging Activities) states that if inventory has been the hedged item in a fair valuehedge, the inventory’s cost basis used in determining the lower-of-cost-or-market shall include the effects ofadjusting its carrying amount as a result of recording the gain or loss on the hedged item. According to ADM’snotes to consolidated financial statements, Note 1, summary of significant accounting policies, ADM will berequired to adopt FAS-161 on January 1, 2009. It further states that the adoption of this standard will requireexpanded disclosure in the notes to the company’s consolidated financial statements but will not affect financialresults. 13 Mark-to-market or fair value accounting refers to the accounting standards (FAS-157, Fair ValueMeasurements) of assigning a value to a position held in a financial instrument based on the current fair market pricefor the instrument or similar instruments. 14 ***. FASB No. 161 (Disclosures about Derivative Instruments and Hedging Activities; an amendment ofFASB No. 133) requires that the location and fair value amounts of derivative instruments be reported in thestatement of financial position and that the location and amount of the gains and losses be reported in the statementof financial performance. Fair value amounts and the effective portion of gains and losses shall be presentedseparately by type of derivative contract and the disclosure shall identify the line item(s) in both statements. Theeffective portion of gains or loss is recorded as part of cost of sales and the ineffective portion of gains or loss isrecorded as part of other income or expenses. 15 Petitioners noted several times at the staff conference that theirs was a capital-intensive industry with highfixed costs. Conference transcript, pp. 22-23 (Oakley); pp. 34-35 and 37 (Poulos); and, p. 41 (Anderson). Whilethere is no exact definition of a capital-intensive or a high fixed cost industry, staff notes that other factory costs(generally considered fixed costs) accounted for approximately 50 percent of the domestic industry’s total cost ofgoods sold from 2006 through 2007 while they decreased to 44 percent in 2008. 16 The U.S. producers incurred a net cost (the excess of disposal costs over revenues earned) of $*** in 2007($*** per pound) to dispose of the byproducts of their citric acid production. Petitioners’ postconference brief,exhibit 1, pp. 16-17. This cost was reported in other factory costs.
VI-5
***.11 ***. Cargill and Tate & Lyle also experienced ***. Unlike ***, the bulk of their ***. On a per-unit basis, ***.
All three producers use futures contracts to hedge against changes in the price of corn. Eventhough the questionnaire responses of the three producers seemed to indicate that they accounted for gains or losses associated with these contracts differently, upon further inquiry by staff, the three producers all accounted for them eventually in the same manner - any gains or losses attributable to cornconsumed were included in raw material costs as actual costs, and any gains or losses attributable to anyopen futures positions were reported as other income or expenses.12 Cargill books ***13***.14
Per-pound cost data of the producers on their operations, i.e., COGS and SG&A expenses, are presented in table VI-3. As shown in this table, the increase in unit COGS was entirely driven by increases in raw material costs, as the direct labor cost decreased slightly while factory overhead increased slightly. Factory overhead, the single largest operating cost component for 2006 and 2007,15 16

17 February 24, 2009 e-mail from ***.
VI-6
consists of many different costs, such as energy, depreciation, general maintenance, repairs, insurance, and property taxes. Petitioners noted that their energy costs in particular have increased.17 While the ratio of total COGS to net sales increased from 98.6 percent in 2006 to 103.6 percent in 2007, it decreased back to 97.9 percent in 2008.
Table VI-3Citric acid and certain citrate salts: Selected financial data of producers on their operations,calendar years 2006-2008
Item
Calendar year
2006 2007 2008
COGS: Value (per pound)
Raw materials $0.182 $0.205 $0.263
Direct labor 0.033 0.029 0.028
Factory overhead 0.221 0.223 0.225
Total COGS 0.435 0.458 0.516
SG&A expenses 0.029 0.026 0.025
Total cost 0.464 0.484 0.542
Source: Compiled from data submitted in response to Commission questionnaires.
The variance analysis showing the effects of prices and volume on the producers’ revenues, andof expenses, costs, and volume on their total cost, is shown in table VI-4. The analysis illustrates thatfrom 2006 to 2008 the decrease in losses resulted from a positive price variance ($44.1 million; unitrevenues increased), in spite of a negative cost/expense variance (negative $39.8 million; unit total costsincreased).
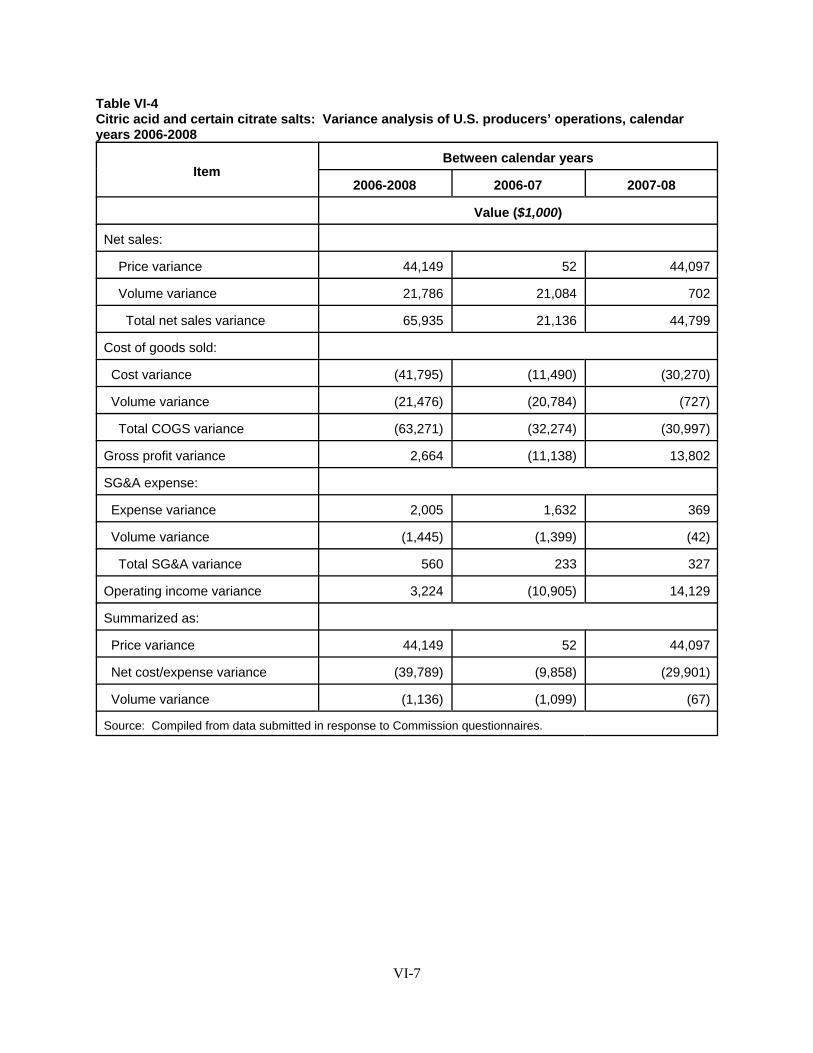
VI-7
Table VI-4Citric acid and certain citrate salts: Variance analysis of U.S. producers’ operations, calendaryears 2006-2008
ItemBetween calendar years
2006-2008 2006-07 2007-08
Value ($1,000)
Net sales:
Price variance 44,149 52 44,097
Volume variance 21,786 21,084 702
Total net sales variance 65,935 21,136 44,799
Cost of goods sold:
Cost variance (41,795) (11,490) (30,270)
Volume variance (21,476) (20,784) (727)
Total COGS variance (63,271) (32,274) (30,997)
Gross profit variance 2,664 (11,138) 13,802
SG&A expense:
Expense variance 2,005 1,632 369
Volume variance (1,445) (1,399) (42)
Total SG&A variance 560 233 327
Operating income variance 3,224 (10,905) 14,129
Summarized as:
Price variance 44,149 52 44,097
Net cost/expense variance (39,789) (9,858) (29,901)
Volume variance (1,136) (1,099) (67)
Source: Compiled from data submitted in response to Commission questionnaires.

18 ***.
VI-8
CAPITAL EXPENDITURES AND RESEARCH AND DEVELOPMENT EXPENSES
Domestic citric acid producers’ capital expenditures and research and development (R&D)expenses are presented in table VI-5. The overall level of expenditures was generally low, being less thandepreciation expenses (table VI-1) in every period. This is an indication that the domestic industry is notexpanding or improving its productive facilities, but is at best maintaining them.
*** R&D expenses, the overall level was low.
Table VI-5Citric acid and certain citrate salts: U.S. producers’ capital expenditures and research anddevelopment (R&D) expenses, calendar years 2006-2008
ItemCalendar year
2006 2007 2008Value (1,000 dollars)
Capital expenditures: ADM1 *** *** *** Cargill2 *** *** *** Tate & Lyle3 *** *** *** Total 6,534 7,746 5,537R&D expenses: ADM *** *** *** Cargill *** *** *** Tate & Lyle *** *** *** Total 1,701 1,473 1,919 1 ADM reported the following: ***. 2 Expenditures cover ***. 3 ***.
Source: Compiled from data submitted in response to Commission questionnaires.
ASSETS AND RETURN ON INVESTMENT
Data on the domestic citric acid and certain citrate salts producers’ assets and their return oninvestment (defined as operating income divided by total assets) are presented in table VI-6. The value oftotal assets decreased *** in 2008 as ***.18 The return on investment approximated the operating incomemargins in table VI-1.
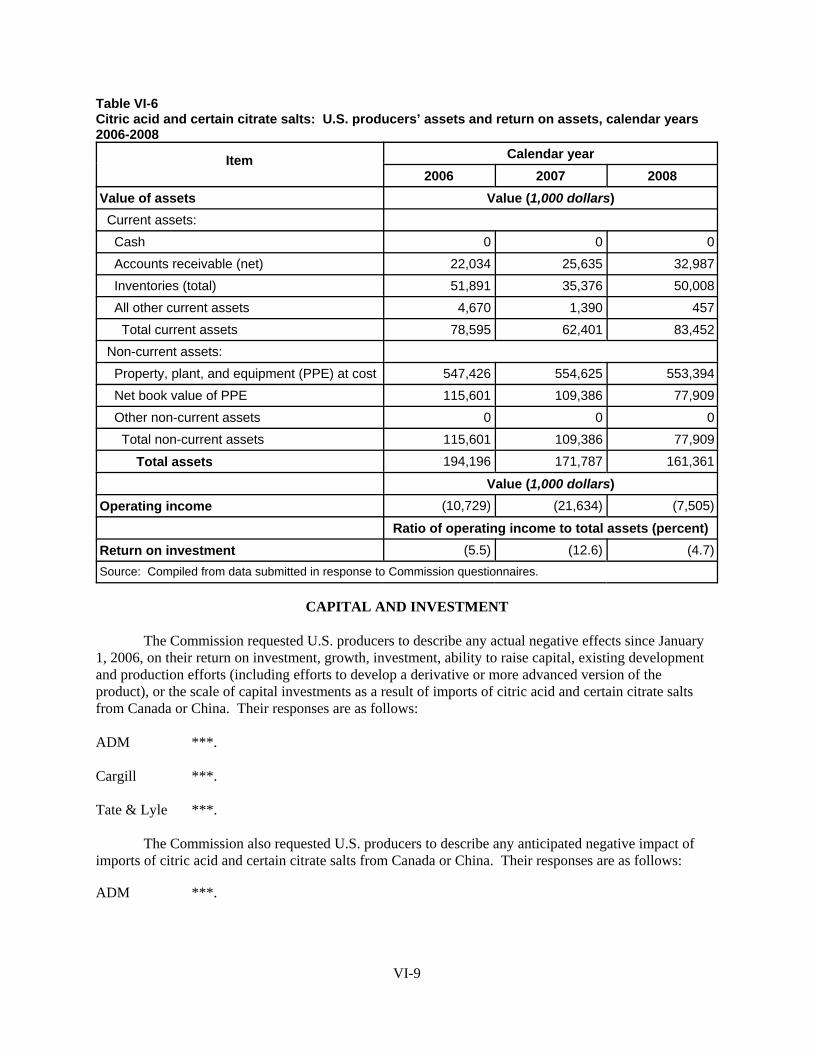
VI-9
Table VI-6Citric acid and certain citrate salts: U.S. producers’ assets and return on assets, calendar years2006-2008
Item Calendar year2006 2007 2008
Value of assets Value (1,000 dollars) Current assets: Cash 0 0 0 Accounts receivable (net) 22,034 25,635 32,987 Inventories (total) 51,891 35,376 50,008 All other current assets 4,670 1,390 457 Total current assets 78,595 62,401 83,452 Non-current assets: Property, plant, and equipment (PPE) at cost 547,426 554,625 553,394 Net book value of PPE 115,601 109,386 77,909 Other non-current assets 0 0 0 Total non-current assets 115,601 109,386 77,909
Total assets 194,196 171,787 161,361
Value (1,000 dollars)Operating income (10,729) (21,634) (7,505)
Ratio of operating income to total assets (percent)Return on investment (5.5) (12.6) (4.7)Source: Compiled from data submitted in response to Commission questionnaires.
CAPITAL AND INVESTMENT
The Commission requested U.S. producers to describe any actual negative effects since January1, 2006, on their return on investment, growth, investment, ability to raise capital, existing developmentand production efforts (including efforts to develop a derivative or more advanced version of theproduct), or the scale of capital investments as a result of imports of citric acid and certain citrate saltsfrom Canada or China. Their responses are as follows:
ADM ***.
Cargill ***.
Tate & Lyle ***.
The Commission also requested U.S. producers to describe any anticipated negative impact ofimports of citric acid and certain citrate salts from Canada or China. Their responses are as follows:
ADM ***.

VI-10
Cargill ***.
Tate & Lyle ***.
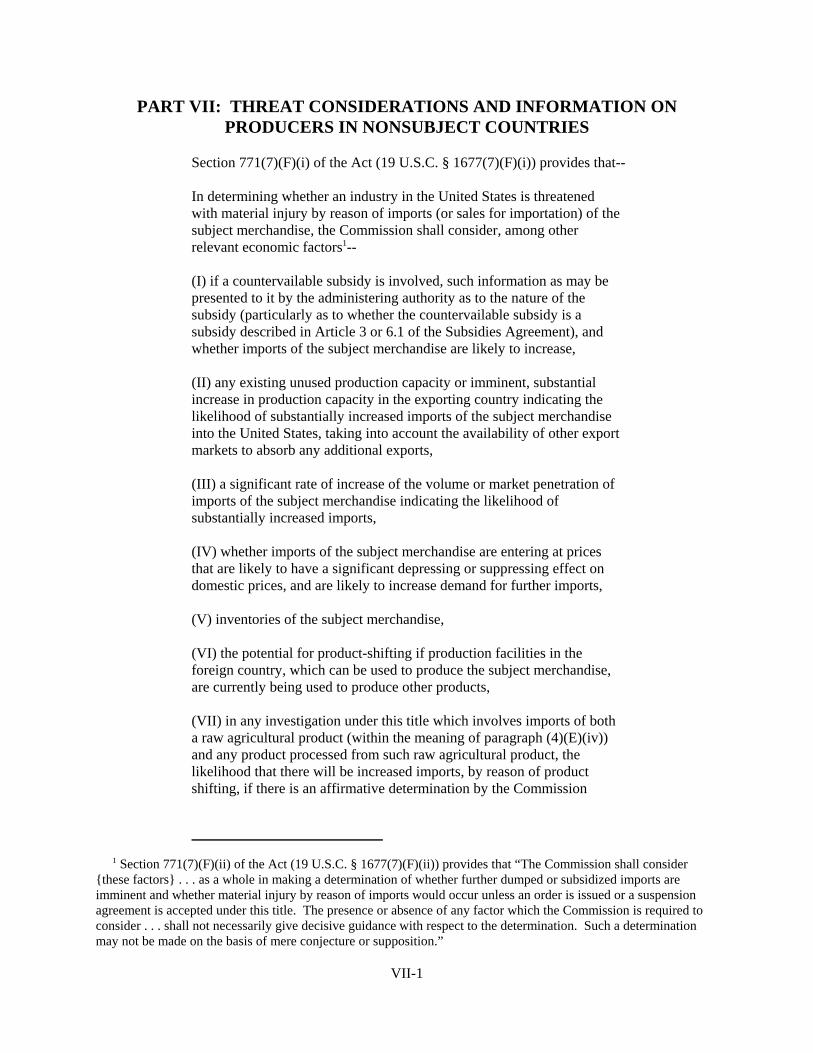
1 Section 771(7)(F)(ii) of the Act (19 U.S.C. § 1677(7)(F)(ii)) provides that “The Commission shall consider{these factors} . . . as a whole in making a determination of whether further dumped or subsidized imports areimminent and whether material injury by reason of imports would occur unless an order is issued or a suspensionagreement is accepted under this title. The presence or absence of any factor which the Commission is required toconsider . . . shall not necessarily give decisive guidance with respect to the determination. Such a determinationmay not be made on the basis of mere conjecture or supposition.”
VII-1
PART VII: THREAT CONSIDERATIONS AND INFORMATION ONPRODUCERS IN NONSUBJECT COUNTRIES
Section 771(7)(F)(i) of the Act (19 U.S.C. § 1677(7)(F)(i)) provides that--
In determining whether an industry in the United States is threatenedwith material injury by reason of imports (or sales for importation) of thesubject merchandise, the Commission shall consider, among otherrelevant economic factors1--
(I) if a countervailable subsidy is involved, such information as may bepresented to it by the administering authority as to the nature of thesubsidy (particularly as to whether the countervailable subsidy is asubsidy described in Article 3 or 6.1 of the Subsidies Agreement), andwhether imports of the subject merchandise are likely to increase,
(II) any existing unused production capacity or imminent, substantialincrease in production capacity in the exporting country indicating thelikelihood of substantially increased imports of the subject merchandiseinto the United States, taking into account the availability of other exportmarkets to absorb any additional exports,
(III) a significant rate of increase of the volume or market penetration ofimports of the subject merchandise indicating the likelihood ofsubstantially increased imports,
(IV) whether imports of the subject merchandise are entering at pricesthat are likely to have a significant depressing or suppressing effect ondomestic prices, and are likely to increase demand for further imports,
(V) inventories of the subject merchandise,
(VI) the potential for product-shifting if production facilities in theforeign country, which can be used to produce the subject merchandise,are currently being used to produce other products,
(VII) in any investigation under this title which involves imports of botha raw agricultural product (within the meaning of paragraph (4)(E)(iv))and any product processed from such raw agricultural product, thelikelihood that there will be increased imports, by reason of productshifting, if there is an affirmative determination by the Commission

2 Section 771(7)(F)(iii) of the Act (19 U.S.C. § 1677(7)(F)(iii)) further provides that, in antidumpinginvestigations, “. . . the Commission shall consider whether dumping in the markets of foreign countries (asevidenced by dumping findings or antidumping remedies in other WTO member markets against the same class orkind of merchandise manufactured or exported by the same party as under investigation) suggests a threat of materialinjury to the domestic industry.” 3 JBL Canada’s foreign producer’s questionnaire, p. 6.
VII-2
under section 705(b)(1) or 735(b)(1) with respect to either the rawagricultural product or the processed agricultural product (but not both),
(VIII) the actual and potential negative effects on the existingdevelopment and production efforts of the domestic industry, includingefforts to develop a derivative or more advanced version of the domesticlike product, and
(IX) any other demonstrable adverse trends that indicate the probabilitythat there is likely to be material injury by reason of imports (or sale forimportation) of the subject merchandise (whether or not it is actuallybeing imported at the time).2
Information on the nature of the countervailable subsidies was presented in Part I of this report;information on the volume and pricing of imports of the subject merchandise is presented in Parts IV andV; and information on the effects of imports of the subject merchandise on U.S. producers’ existingdevelopment and production efforts is presented in Part VI. Information on inventories of the subjectmerchandise; foreign producers’ operations, including the potential for “product-shifting;” any otherthreat indicators, if applicable; and any dumping in third-country markets, follows. Also presented in thissection of the report is information obtained for consideration by the Commission on nonsubject-countryproducers.
THE INDUSTRY IN CANADA
The Commission requested and received data from one firm, Jungbunzlauer Technology GmbH& Co. KG (“JBL Canada”), which was listed in the petition and accounted for all citric acid production inCanada during the period of investigation. JBL Canada does not produce sodium citrate, potassiumcitrate, or crude calcium citrate at its production facility in Canada. JBL Canada is wholly owned by theSwiss firm, Jungbunzlauer AG.
During the 2000 investigation, U.S. imports from nonsubject countries included imports fromJungbunzlauer Austria AG’s citric acid production facility in Vienna, Austria. In 1999, JBL beganplanning to build a citric acid production facility in North America to better supply that geographicalmarket. In 2002, JBL Canada’s production facility began production of food and beverage grade citricacid.
During the period for which data were collected in these investigations, JBL Canada reported that*** percent of its total sales in the most recent fiscal year were sales of citric acid. In 2008, *** percentof JBL Canada’s total shipments of citric acid were exported to the United States, *** percent of itsshipments were to its home market, and *** percent of its shipments were exported to other countries,principally to ***. JBL Canada reported a ***-percent increase in capacity from 2007 to 2008 ***. Ithas stated that it ***.3 JBL Canada’s production increased by *** percent between 2006 and 2008, and isprojected to *** in 2009 and 2010. JBL Canada reported that it acted as its exclusive U.S. importer of

4 Foreign producer questionnaires were sent to counsel for the Chinese respondents. Two firms in China (***)reported that they did not export to the United States from China citric acid or certain citrate salts during the periodof investigation. ***. 5 Export shipments to the United States reported by responding Chinese producers accounted for 88.2 percent ofU.S. imports in 2008 (based on Commerce statistics). According to ***. 6 Chinese respondents stated that there has been rapid consolidation of Chinese citric acid producers; and since2002, the number of major producers of citric acid in China has fallen from over 100 to below 20. They claim thatthe driving force behind this consolidation is the government of China’s new environmental protection policies,which forced the closure of many obsolete citric acid manufacturing facilities and may slow or prevent the additionof more capacity. In 2008, pursuant to these environmental regulations, the Chinese government approved 15Chinese producers of citric acid to export the product. Chinese respondents’ prehearing brief, pp. 70-71; Chineserespondents’ posthearing brief, app. A, p. 39. 7 According to ***. See Petitioners’ postconference brief, exh. 32, p. 1. 8 *** of the 14 responding Chinese producers (and *** out of the largest 5 producers), ***, reported increases incapacity during the period of investigation. *** accounted for *** percent of the increase in capacity from 2006 to2008. Chinese respondents’ posthearing brief, p. 10 fn. 5 (observing that ***). 9 Chinese respondents stated that in November 2008, because of violations of Chinese environmental regulations,*** lost its right to export citric acid. *** reported in its questionnaire that its projected 2009 exports to the UnitedStates would *** dry pounds. Chinese respondents’ prehearing brief, pp. 74-75. *** observe that *** is currently
(continued...)
VII-3
record of citric acid ***. Table VII-1 presents data for reported production and shipments of citric acidfor JBL Canada.
Table VII-1Citric acid and certain citrate salts: Canada’s reported production capacity, production,shipments, and inventories, 2006-2008 and projections for 2009 and 2010
* * * * * * *
THE INDUSTRY IN CHINA
The Commission received 16 responses from foreign producers or exporters of citric acid andcertain citrate salts in China.4 Data regarding the Chinese industry are based on 14 foreign producerquestionnaires, which are believed to account for approximately 90 percent of Chinese export shipmentsto the United States in 2008.5 The largest five reporting Chinese producers accounted for the vastmajority of reported 2008 production.6 These companies are: ***. Table VII-2 presents separately thecapacity, production, capacity utilization, export shipments to the United States, and shares of reportedproduction and exports of the 14 responding Chinese producers in 2008.
Table VII-2Citric acid and certain citrate salts: China’s reported production capacity, production, shipments,and inventories, 2008
* * * * * * *
Table VII-3 presents data for capacity, production, and shipments of citric acid and certain citratesalts from all reporting producers in China. Chinese producers’ capacity increased by 41.9 percent from2006 to 2008.7 8 Capacity is projected to increase further by 7.1 percent from 2008 to 2009 and remainvirtually steady in 2010.9 The production10 of Chinese producers increased by 45.0 percent from 2006 to

9 (...continued)soliciting overseas sales via public websites. ***.
Chinese respondents also stated that DSM Citric Acid (Wuxi), Ltd. (“DSM”) discontinued citric acidproduction in the first quarter of 2009 after the Chinese government requested that the production facility be movedto accommodate future urban development. DSM’s capacity is approximately 50,000 metric tons (110.2 million drypounds). Chinese respondents’ prehearing brief, p. 73. Counsel for Chinese respondents do not represent DSM. The Commission did not receive a questionnaire response from DSM. 10 *** of the responding Chinese producers reported that they produced products other than citric acid or certaincitrate salts on the same manufacturing equipment. 11 Chinese respondents project that exports to the United States in 2009 and 2010 will decrease dramatically asChinese firms ship product to other markets, especially the European Union. Chinese respondents’ posthearingbrief, p. 36.
VII-4
2008, and is projected to decrease by 1.5 percent from 2008 to 2009 before rebounding slightly in 2010. Chinese producers reported capacity utilization rates ranging from 86.4 percent in 2006 to 89.0 percent in2007. During the period of investigation, the volume of Chinese producers’ export shipments to theUnited States increased by 20.4 percent from 2006 to 2008, but decreased as a share of China’s totalshipments from 11.2 percent in 2006 to 10.0 percent in 2008.11 Meanwhile, the volume of Chineseproducers’ shipments to the Chinese home market (including internal consumption) increased by 47.6percent from 2006 to 2008 and increased as a share of total shipments during the period from 26.2 percentof total shipments in 2006 to 28.9 percent in 2008. From 2006 to 2008, Chinese commercial shipments toother countries increased by 31.2 percent. Throughout the period of investigation, the majority of theChinese producers’ shipments went to other markets, ranging from 61.2 percent of total shipments in2008 to 62.6 percent of total shipments in 2006. The top five Chinese producers reported that *** aretheir principal export markets.
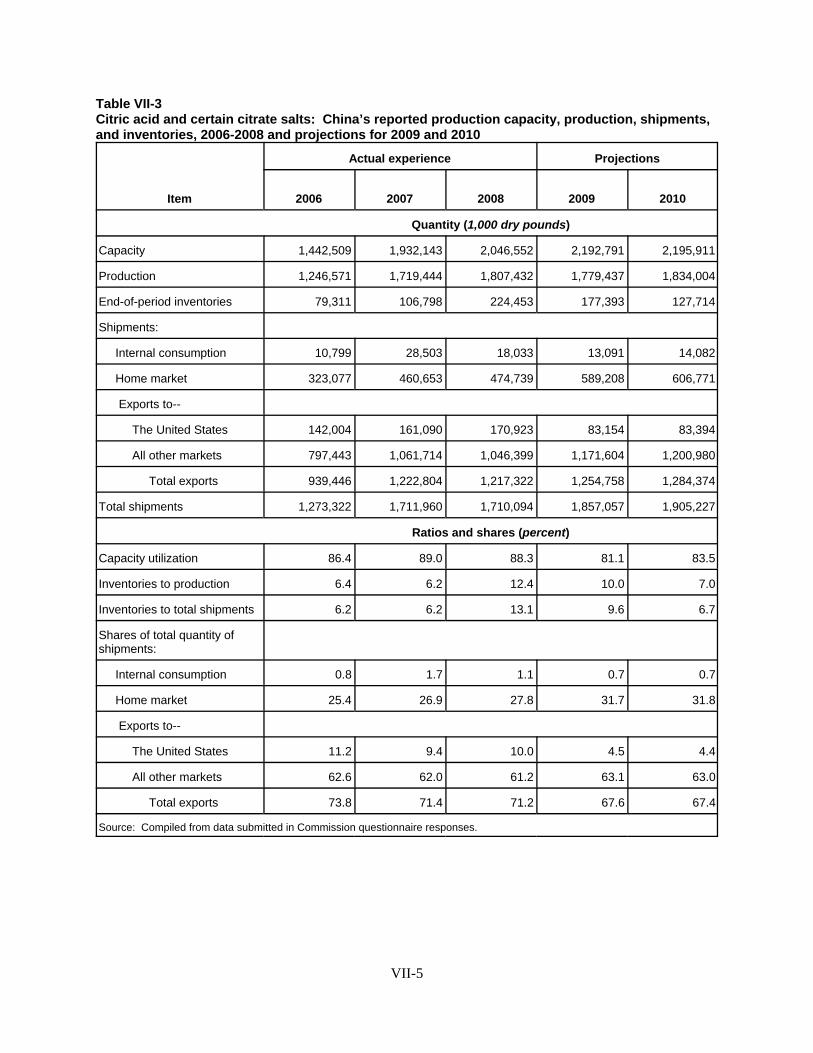
VII-5
Table VII-3Citric acid and certain citrate salts: China’s reported production capacity, production, shipments,and inventories, 2006-2008 and projections for 2009 and 2010
Item
Actual experience Projections
2006 2007 2008 2009 2010
Quantity (1,000 dry pounds)
Capacity 1,442,509 1,932,143 2,046,552 2,192,791 2,195,911
Production 1,246,571 1,719,444 1,807,432 1,779,437 1,834,004
End-of-period inventories 79,311 106,798 224,453 177,393 127,714
Shipments:
Internal consumption 10,799 28,503 18,033 13,091 14,082
Home market 323,077 460,653 474,739 589,208 606,771
Exports to--
The United States 142,004 161,090 170,923 83,154 83,394
All other markets 797,443 1,061,714 1,046,399 1,171,604 1,200,980
Total exports 939,446 1,222,804 1,217,322 1,254,758 1,284,374
Total shipments 1,273,322 1,711,960 1,710,094 1,857,057 1,905,227
Ratios and shares (percent)
Capacity utilization 86.4 89.0 88.3 81.1 83.5
Inventories to production 6.4 6.2 12.4 10.0 7.0
Inventories to total shipments 6.2 6.2 13.1 9.6 6.7
Shares of total quantity ofshipments:
Internal consumption 0.8 1.7 1.1 0.7 0.7
Home market 25.4 26.9 27.8 31.7 31.8
Exports to--
The United States 11.2 9.4 10.0 4.5 4.4
All other markets 62.6 62.0 61.2 63.1 63.0
Total exports 73.8 71.4 71.2 67.6 67.4
Source: Compiled from data submitted in Commission questionnaire responses.
VII-6
COMBINED INDUSTRY DATA FOR BOTH SUBJECT COUNTRIES
Table VII-4 presents data for capacity, production, and shipments of citric acid and certain citratesalts from all reporting producers in Canada and China combined.
Table VII-4Citric acid and certain citrate salts: Canada and China’s reported production capacity, production,shipments, and inventories, 2006-2008 and projections for 2009 and 2010
* * * * * * *
U.S. IMPORTERS’ INVENTORIES
Reported inventories held by U.S. importers of subject merchandise from Canada, China, andnonsubject countries are shown in table VII-5.

VII-7
Table VII-5Citric acid and certain citrate salts: U.S. importers’ end-of-period inventories of subject andnonsubject imports, by sources, 2006-2008
Source
Calendar year
2006 2007 2008
Imports from Canada:
Inventories (1,000 dry pounds) *** *** ***
Ratio to imports (percent) *** *** ***
Ratio to U.S. shipments of imports (percent) *** *** ***
Imports from China:
Inventories (1,000 dry pounds) 17,701 28,685 24,376
Ratio to imports (percent) 12.8 19.2 14.5
Ratio to U.S. shipments of imports (percent) 14.7 23.8 16.0
Imports from Canada and China:
Inventories (1,000 dry pounds) *** *** ***
Ratio to imports (percent) *** *** ***
Ratio to U.S. shipments of imports (percent) *** *** ***
Imports from nonsubject countries:
Inventories (1,000 dry pounds) *** *** ***
Ratio to imports (percent) *** *** ***
Ratio to U.S. shipments of imports (percent) *** *** ***
Imports from all sources:
Inventories (1,000 dry pounds) *** *** ***
Ratio to imports (percent) *** *** ***
Ratio to U.S. shipments of imports (percent) *** *** ***
Note.–All ratios are calculated using data from firms providing both numerator and denominator information.
Source: Compiled from data submitted in response to Commission questionnaires.
12 Official Journal of the European Union, December 3, 2008 (L 323/1). 13 These firms are: (1) Anhui BBCA Biochemical, (2) RZBC, (3) TTCA, (4) Yixing-Union Biochemical, (5) Laiwu Taihe Biochemistry, and (6) Wiefang Ensign. Chinese producers not covered by the price undertakingagreement would be subject to the 42.7 percent antidumping duty imposed by the EC. 14 Official Journal of the European Union, December 3, 2008 (L 323/62). 15 See the India’s Ministry of Commerce and Industry website retrieved on May 6, 2008http://commerce.nic.in/traderemedies/ad_casesinindia.asp?id=2. In 2003, the government of India imposedantidumping duties on citric acid from Indonesia and Thailand. In 2007, the government of South Africa terminatedan antidumping duty investigation on citric acid from China for reasons unrelated to its domestic industry’s materialinjury. 16 Mittal Steel Point Lisas Ltd. v. United States, Slip Op. 2007-1552 at 17 (Fed. Cir., Sept. 18, 2008), quotingfrom Statement of Administrative Action on Uruguay Round Agreements Act, H.R. Rep. 103-316, Vol. I at 851-52;see also Bratsk Aluminum Smelter v. United States, 444 F.3d 1369 (Fed. Cir. 2006).
VII-8
U.S. IMPORTERS’ CURRENT ORDERS
The Commission requested U.S. importers to indicate whether they imported or arranged for theimportation of citric acid or certain citrate salts after December 31, 2008. Four of the 30 reporting U.S.importers stated that they had imported or arranged for importation since December 31, 2008. Table VII-6 presents the four U.S. importers which indicated that they had imported or arranged for the importationof the subject product from Canada or China and the quantity of those U.S. imports.
Table VII-6Citric acid and certain citrate salts: U.S. importers’ orders of subject imports from Canada andChina subsequent to December 31, 2008, by firm
* * * * * * *
ANTIDUMPING AND COUNTERVAILING DUTY ORDERS IN THIRD-COUNTRY MARKETS
On December 1, 2008, the European Union announced the imposition of definitive antidumpingduties on imports of citric acid (including sodium citrate) from China. The definitive duties announcedranged from 6.6 percent to 42.7 percent.12 However, on December 2, 2008, the EU accepted a “priceundertaking” from six Chinese exporters13 which offered to sell product in the EU at price levels whichwould eliminate the injurious effects of dumping.14
In 2005, the government of India conducted an antidumping duty investigation on its imports ofcitric acid from China and Ukraine. On August 25, 2005, it determined that the Indian citric acid industrywas not materially injured and did not impose antidumping duties.15 Petitioners reported that Mexicoimposed antidumping duties on imports of citric acid from China from 2003 until October 2008 at whichtime the duties expired. There is no indication that citric acid and certain citrate salts from Canada orChina have been the subject of any import relief investigations in any other countries.
INFORMATION ON PRODUCERS IN NONSUBJECT COUNTRIES
In assessing whether the domestic industry is materially injured or threatened with material injury“by reason of subject imports,” the legislative history states “that the Commission must examine allrelevant evidence, including any known factors, other than the dumped or subsidized imports, that may beinjuring the domestic industry, and that the Commission must examine those other factors (including non-subject imports) ‘to ensure that it is not attributing injury from other sources to the subject imports.’”16

17 ***; Conference transcript, p. 74 (Poulos). 18 ***. 19 ***. 20 GBI and Jiangsu Nuobei Biochemical reportedly have partnered to build a new citric acid plant in Jiangsu,China. “Gadot-Best Biochemical’s 60,000 t/a citric acid project under construction,” China Corn Products News,December 2007. 21 ***. 22 ***. 23 ***. 24 ***.
VII-9
Based on U.S. Government official trade statistics, the following nonsubject countries exportedsubstantial amounts of citric acid, sodium citrate, or other salts and esters of citric acid to the U.S. marketduring the period of investigation: Israel, Colombia, Germany, Thailand, Austria, and Belgium (listed indescending order of import volume in 2008).
Table VII-7 presents estimates from *** on citric acid and included in exhibit I-2 of the petition,which show January 2006 capacities and full-year 2005 production.
Table VII-7: World capacity (January 2006) and production (2005) of citric acid, by country/region
* * * * * * *
In Western Europe, there have been three operating citric acid plants during the period for whichdata were collected in these investigations. JBL, the parent of the Canadian respondent, owns the largestplant with a capacity of *** in Austria. At the time of the last investigation, Austria and Israel were thetwo largest sources of nonsubject imports in the U.S. market. Citrique Belge operates the ***, which hasa capacity of ***. Tate & Lyle had a plant in the United Kingdom that had a capacity of ***, but closedthe facility permanently in 2007.17 JBL used to operate an additional citric acid plant in Germany butclosed this plant in 1991 due to logistical issues and currently converts purchased citric acid into citratesalts at this facility. ADM used to operate a plant in Ireland but it permanently closed the facility in 2005. Both ADM and Tate & Lyle assert that imports from China were the reasons for the closures.
All of the capacity listed for Central and South America is controlled by the petitioners. *** ownthe plants in Brazil which have a combined capacity of *** ***.18 *** has *** in the lone plant inColombia, which has a capacity of ***.19
An Israeli company, Gadot Biochemical Industries LTC (“GBI”) with a capacity of ***, is thelargest producer in the Middle East.20 Two Iranian companies have the balance of the capacity in theregion.
*** capacity in Japan ***, Showa Kako, with a capacity of ***, ***.21
The three countries included in “Other Asia” are India, Indonesia, and Thailand. Their capacitiesas of January 2006 were ***, ***, and ***, respectively.22
According to ***, the price for citric acid imports was ***.23 The prices for citric acid imports in***.24
The trade estimates provided in *** showed most of the regions/countries to be net importers. The three exceptions to this rule, Central and South America, China, and the Middle East, had net exportsof approximately ***.


A-1
APPENDIX A
FEDERAL REGISTER NOTICES


73955 Federal Register / Vol. 73, No. 234 / Thursday, December 4, 2008 / Notices
1 For purposes of these investigations, the Department of Commerce hasdefined the subject merchandise as ‘‘all grades and granulation sizes of citric acid, sodium citrate, and potassium citrate in their unblended forms, whether dry or in solution, and regardless of packaging type. The scope also includes blends of citric acid, sodium citrate, and potassium citrate; as well as blends with other ingredients, such as sugar, where the unblended form(s) of citric acid, sodium citrate, and potassium citrate constitute 40 percent or more, by weight, of the blend. The scope of this investigation also includes all forms of crude calcium citrate,
Continued
letter on behalf of the Secretary of Interior from the Designated Federal Official, transmitted the authorization for the state park to effect disposition of the human remains and associated funerary objects of the culturally unidentifiable individuals to the three Indian tribes listed above contingent on the publication of a Notice of Inventory Completion in the Federal Register. This notice fulfills that requirement.
Representatives of any other Indian tribe that believes itself to be culturally affiliated with the human remains and associated funerary objects should contact Brian Jaeschke, Registrar, Mackinac State Historic Parks, P.O. Box 873, Mackinaw City, MI 40701, telephone (231) 436–4100, fax (231) 436–4210, before January 5, 2009. Disposition of the human remains and associated funerary objects to the Bay Mills Indian Community, Michigan; Little Traverse Bay Band of Odawa, Michigan; and Sault Ste. Marie Tribe of Chippewa Indians of Michigan may proceed after that date if no additional claimants come forward.
Mackinac State Historic Parks is responsible for notifying the Bay Mills Indian Community, Michigan; Grand Traverse Bay Band of Ottawa and Chippewa Indians, Michigan; Little Traverse Bay Band of Odawa, Michigan; and Sault Ste. Marie Tribe of Chippewa Indians of Michigan; and the Michigan Anishnaabek Cultural Preservation and Repatriation Alliance (MACPRA), a non- Federally recognized Indian group, that this notice has been published.
Dated: October 21, 2008 Sherry Hutt, Manager, National NAGPRA Program. [FR Doc. E8–28697 Filed 12–3–08; 8:45 am] BILLING CODE 4312–50–S
INTERNATIONAL TRADE COMMISSION
[Investigation No. 337–TA–656]
In the Matter of Certain Integrated Circuits and Products Containing Same; Notice of Commission Determination Not To Review an Initial Determination Terminating the Investigation on the Basis of a Settlement Agreement
AGENCY: U.S. International Trade Commission. ACTION: Notice.
SUMMARY: Notice is hereby given that the U.S. International Trade Commission has determined not to review the presiding administrative law judge’s (‘‘ALJ’’) initial determination
(‘‘ID’’) (Order No. 7) granting the joint motion to terminate the captioned investigation based on a settlement agreement. FOR FURTHER INFORMATION CONTACT: Megan M. Valentine, Office of the General Counsel, U.S. International Trade Commission, 500 E Street, SW., Washington, DC 20436, telephone (202) 708–2301. Copies of non-confidential documents filed in connection with this investigation are or will be available for inspection during official business hours (8:45 a.m. to 5:15 p.m.) in the Office of the Secretary, U.S. International Trade Commission, 500 E Street, SW., Washington, DC 20436, telephone (202) 205–2000. General information concerning the Commission may also be obtained by accessing its Internet server at http://www.usitc.gov. The public record for this investigation may be viewed on the Commission’s electronic docket (EDIS) at http:// edis.usitc.gov. Hearing-impaired persons are advised that information on this matter can be obtained by contacting the Commission’s TDD terminal on (202) 205–1810. SUPPLEMENTARY INFORMATION: This investigation was instituted on September 18, 2008, based on a complaint filed by Freescale Semiconductor, Inc., of Austin, Texas (‘‘Freescale’’). 73 FR 54164 (September 18, 2008). The complaint alleges violations of section 337 of the Tariff Act of 1930, as amended, 19 U.S.C. 1337, in the importation into the United States, the sale for importation, and the sale within the United States after importation of certain integrated circuits or products containing the same that infringe one or more of claims of U.S. Patent Nos. 5,467,455; 5,776,798; and 6,473,349. The complaint further alleges the existence of a domestic industry. The Commission’s notice of investigation named LSI Corporation of Milpitas, California (‘‘LSI’’), as the sole respondent.
On October 27, 2008, Freescale and LSI jointly moved to terminate the investigation on the basis of a settlement agreement. On November 6, 2008, the Commission investigative attorney filed a response supporting the motion.
On November 10, 2008, the ALJ issued the subject ID granting the joint motion to terminate the investigation based on the settlement agreement. The ALJ found that the motion complied with the requirements of Commission Rule 210.21 (19 CFR 210.21). The ALJ also concluded that, pursuant to Commission Rule 210.50(b)(2) (19 CFR 210.50(b)(2)), there is no evidence that termination of this investigation will
prejudice the public interest. No petitions for review of this ID were filed.
The Commission has determined not to review the ID.
The authority for the Commission’s determination is contained in section 337 of the Tariff Act of 1930, as amended (19 U.S.C. 1337), and in section 210.42 of the Commission’s Rules of Practice and Procedure (19 CFR 210.42).
By order of the Commission. Issued: November 29, 2008.
William R. Bishop, Acting Secretary to the Commission. [FR Doc. E8–28698 Filed 12–3–08; 8:45 am] BILLING CODE 7020–02–P
INTERNATIONAL TRADE COMMISSION
[Investigations Nos. 701–TA–456 and 731– TA–1151–1152 (Final)]
Citric Acid and Certain Citrate Salts From Canada and China
AGENCY: United States International Trade Commission. ACTION: Scheduling of the final phase of countervailing duty and antidumping investigations.
SUMMARY: The Commission hereby gives notice of the scheduling of the final phase of countervailing duty investigation No. 701–TA–456 (Final) under section 705(b) of the Tariff Act of 1930 (19 U.S.C. 1671d(b)) (the Act) and the final phase of antidumping investigation Nos. 731–TA–1151–1152 (Final) under section 735(b) of the Act (19 U.S.C. 1673d(b)) to determine whether an industry in the United States is materially injured or threatened with material injury, or the establishment of an industry in the United States is materially retarded, by reason of subsidized imports from China and less-than-fair-value imports from Canada and China of citric acid and certain citrate salts, provided for in subheadings 2918.14.00, 2918.15.10, 2918.15.50, and 3824.90.92 of the Harmonized Tariff Schedule of the United States.1
VerDate Aug<31>2005 17:35 Dec 03, 2008 Jkt 217001 PO 00000 Frm 00055 Fmt 4703 Sfmt 4703 E:\FR\FM\04DEN1.SGM 04DEN1mst
ocks
till o
n P
RO
D1P
C66
with
NO
TIC
ES

73956 Federal Register / Vol. 73, No. 234 / Thursday, December 4, 2008 / Notices
including dicalcium citrate monohydrate, and tricalcium citrate tetrahydrate, which are intermediate products in the production of citric acid, sodium citrate, and potassium citrate. The scope of this investigation does not include calcium citrate that satisfies the standards set forth in the United States Pharmacopeia and has been mixed with a functional excipient, such as dextrose or starch, where the excipient constitutes at least 2%, by weight, of the product. The scope of this investigation includes the hydrous and anhydrous forms of citric acid, the dihydrate and anhydrous forms of sodium citrate, otherwise known as citric acid sodium salt, and the monohydrate and monopotassium forms of potassium citrate. Sodium citrate also includes both trisodium citrate and monosodium citrate, which are also known as citric acid trisodium salt and citric acid monosodium salt, respectively. Citric acid and sodium citrate are classifiable under 2918.14.0000 and 2918.15.1000 of the Harmonized Tariff Schedule of the United States (HTSUS), respectively. Potassium citrate and crude calcium citrate are classifiable under 2918.15.5000 and 3824.90.9290 of the HTSUS, respectively. Blends that include citric acid, sodium citrate, and potassium citrate are classifiable under 3824.90.9290 of the HTSUS. Although the HTSUS subheadings are provided for convenience and customs purposes, the written description of the merchandise is dispositive.’’
For further information concerning the conduct of this phase of the investigations, hearing procedures, and rules of general application, consult the Commission’s Rules of Practice and Procedure, part 201, subparts A through E (19 CFR part 201), and part 207, subparts A and C (19 CFR part 207). DATES: Effective Date: November 20, 2008. FOR FURTHER INFORMATION CONTACT: Christopher J. Cassise (202–708–5408), Office of Investigations, U.S. International Trade Commission, 500 E Street, SW., Washington, DC 20436. Hearing-impaired persons can obtain information on this matter by contacting the Commission’s TDD terminal on 202– 205–1810. Persons with mobility impairments who will need special assistance in gaining access to the Commission should contact the Office of the Secretary at 202–205–2000. General information concerning the Commission may also be obtained by accessing its internet server (http:// www.usitc.gov). The public record for these investigations may be viewed on the Commission’s electronic docket (EDIS) at http://edis.usitc.gov. SUPPLEMENTARY INFORMATION:
Background.—The final phase of these investigations is being scheduled as a result of affirmative preliminary determinations by the Department of Commerce that certain benefits which constitute subsidies within the meaning of section 703 of the Act (19 U.S.C. 1671b) are being provided to manufacturers, producers, or exporters in China of citric acid and certain citric salts, and that imports from Canada and China are being sold in the United
States at less than fair value within the meaning of section 733 of the Act (19 U.S.C. 1673b). The investigations were requested in a petition filed on April 14, 2008, by Archer Daniels Midland Co., Decatur, IL; Cargill, Inc., Wayzata, MN; and Tate & Lyle Americas, Inc., Decatur, IL.
Participation in the investigations and public service list.—Persons, including industrial users of the subject merchandise and, if the merchandise is sold at the retail level, representative consumer organizations, wishing to participate in the final phase of these investigations as parties must file an entry of appearance with the Secretary to the Commission, as provided in section 201.11 of the Commission’s rules, no later than 21 days prior to the hearing date specified in this notice. A party that filed a notice of appearance during the preliminary phase of the investigations need not file an additional notice of appearance during this final phase. The Secretary will maintain a public service list containing the names and addresses of all persons, or their representatives, who are parties to the investigations.
Limited disclosure of business proprietary information (BPI) under an administrative protective order (APO) and BPI service list.—Pursuant to section 207.7(a) of the Commission’s rules, the Secretary will make BPI gathered in the final phase of these investigations available to authorized applicants under the APO issued in the investigations, provided that the application is made no later than 21 days prior to the hearing date specified in this notice. Authorized applicants must represent interested parties, as defined by 19 U.S.C. 1677(9), who are parties to the investigations. A party granted access to BPI in the preliminary phase of the investigations need not reapply for such access. A separate service list will be maintained by the Secretary for those parties authorized to receive BPI under the APO.
Staff report.—The prehearing staff report in the final phase of these investigations will be placed in the nonpublic record on March 24, 2009, and a public version will be issued thereafter, pursuant to section 207.22 of the Commission’s rules.
Hearing.—The Commission will hold a hearing in connection with the final phase of these investigations beginning at 9:30 a.m. on April 7, 2009, at the U.S. International Trade Commission Building. Requests to appear at the hearing should be filed in writing with the Secretary to the Commission on or before March 30, 2009. A nonparty who has testimony that may aid the
Commission’s deliberations may request permission to present a short statement at the hearing. All parties and nonparties desiring to appear at the hearing and make oral presentations should attend a prehearing conference to be held at 9:30 a.m. on April 1, 2009, at the U.S. International Trade Commission Building. Oral testimony and written materials to be submitted at the public hearing are governed by sections 201.6(b)(2), 201.13(f), and 207.24 of the Commission’s rules. Parties must submit any request to present a portion of their hearing testimony in camera no later than 7 business days prior to the date of the hearing.
Written submissions.—Each party who is an interested party shall submit a prehearing brief to the Commission. Prehearing briefs must conform with the provisions of section 207.23 of the Commission’s rules; the deadline for filing is March 31, 2009. Parties may also file written testimony in connection with their presentation at the hearing, as provided in section 207.24 of the Commission’s rules, and posthearing briefs, which must conform with the provisions of section 207.25 of the Commission’s rules. The deadline for filing posthearing briefs is April 15, 2009; witness testimony must be filed no later than three days before the hearing. In addition, any person who has not entered an appearance as a party to the investigations may submit a written statement of information pertinent to the subject of the investigations, including statements of support or opposition to the petition, on or before April 15, 2009. On May 1, 2009, the Commission will make available to parties all information on which they have not had an opportunity to comment. Parties may submit final comments on this information on or before May 5, 2009, but such final comments must not contain new factual information and must otherwise comply with section 207.30 of the Commission’s rules. All written submissions must conform with the provisions of section 201.8 of the Commission’s rules; any submissions that contain BPI must also conform with the requirements of sections 201.6, 207.3, and 207.7 of the Commission’s rules. The Commission’s rules do not authorize filing of submissions with the Secretary by facsimile or electronic means, except to the extent permitted by section 201.8 of the Commission’s rules, as amended, 67 FR 68036 (November 8, 2002). Even where electronic filing of a document is permitted, certain documents must also be filed in paper form, as specified in
VerDate Aug<31>2005 17:35 Dec 03, 2008 Jkt 217001 PO 00000 Frm 00056 Fmt 4703 Sfmt 4703 E:\FR\FM\04DEN1.SGM 04DEN1mst
ocks
till o
n P
RO
D1P
C66
with
NO
TIC
ES

73957 Federal Register / Vol. 73, No. 234 / Thursday, December 4, 2008 / Notices
II(C) of the Commission’s Handbook on Electronic Filing Procedures, 67 FR 68168, 68173 (November 8, 2002).
Additional written submissions to the Commission, including requests pursuant to section 201.12 of the Commission’s rules, shall not be accepted unless good cause is shown for accepting such submissions, or unless the submission is pursuant to a specific request by a Commissioner or Commission staff.
In accordance with sections 201.16(c) and 207.3 of the Commission’s rules, each document filed by a party to the investigations must be served on all other parties to the investigations (as identified by either the public or BPI service list), and a certificate of service must be timely filed. The Secretary will not accept a document for filing without a certificate of service.
Authority: These investigations are being conducted under authority of title VII of the Tariff Act of 1930; this notice is published pursuant to section 207.21 of the Commission’s rules.
Issued: December 1, 2008. By order of the Commission.
William R. Bishop, Acting Secretary to the Commission. [FR Doc. E8–28730 Filed 12–3–08; 8:45 am] BILLING CODE 7020–02–P
INTERNATIONAL TRADE COMMISSION
[USITC SE–08–034]
Government in the Sunshine Act Meeting Notice
AGENCY HOLDING THE MEETING: United States International Trade Commission. TIME AND DATE: December 12, 2008 at 11 a.m. PLACE: Room 101, 500 E Street, SW., Washington, DC 20436, Telephone: (202) 205–2000. STATUS: Open to the public. MATTERS TO BE CONSIDERED:
1. Agenda for future meetings: None. 2. Minutes. 3. Ratification List. 4. Inv. Nos. 701–TA–459 and 731–
TA–1155 (Preliminary) (Commodity Matchbooks from India)—briefing and vote. (The Commission is currently scheduled to transmit its determinations to the Secretary of Commerce on or before December 15, 2008; Commissioners’ opinions are currently scheduled to be transmitted to the Secretary of Commerce on or before December 22, 2008.)
5. Outstanding action jackets: None. In accordance with Commission
policy, subject matter listed above, not
disposed of at the scheduled meeting, may be carried over to the agenda of the following meeting.
By order of the Commission. Issued: December 1, 2008.
William R. Bishop, Hearings and Meetings Coordinator. [FR Doc. E8–28796 Filed 12–3–08; 8:45 am] BILLING CODE 7020–02–P
DEPARTMENT OF JUSTICE
United States Parole Commission
Public Announcement Pursuant to the Government in the Sunshine Act (Pub. L. 94–409) [5 U.S.C. Section 552b]
AGENCY HOLDING MEETING: Department of Justice, United States Parole Commission. TIME AND DATE: 10 a.m., Wednesday, December 3, 2008. PLACE: 5550 Friendship Blvd., Fourth Floor, Chevy Chase, MD 20815. STATUS: Open. MATTERS TO BE CONSIDERED: The following matters have been placed on the agenda for the open Parole Commission meeting:
1. Approval of Minutes of August 2008 Quarterly Business Meeting.
2. Reports from the Chairman, Commissioners, Chief of Staff, and Section Administrators. AGENCY CONTACT: Thomas W. Hutchison, Chief of Staff, United States Parole Commission, (301) 492–5990.
Date: November 26, 2008. Rockne J. Chickinell, General Counsel, U.S. Parole Commission. [FR Doc. E8–28669 Filed 12–3–08; 8:45 am] BILLING CODE 4410–31–M
DEPARTMENT OF LABOR
Employment and Training Administration
Information Collection Request for the ETA 9128, Reemployment and Eligibility Assessments Workloads Report, and the ETA 9129, Reemployment and Eligibility Assessments Outcomes Report: Extension Without Change, Comment Request
AGENCY: Employment and Training Administration. ACTION: Notice.
SUMMARY: The Department of Labor, as part of its continuing effort to reduce
paperwork and respondent burden, conducts a preclearance consultation program to provide the general public and Federal agencies with an opportunity to comment on proposed and/or continuing collection of information in accordance with the Paperwork Reduction Act of 1995 (PRA95) [44 U.S.C. 3506(c)(2)(A)]. This program helps to ensure that requested data can be provided in the desired format, reporting burden (time and financial resources) is minimized, collection instruments are clearly understood, and the impact of collection requirements on respondents can be properly assessed.
A copy of the proposed information collection request (ICR) can be obtained by contacting the office listed below in the addressee section of this notice or by accessing: http://www.doleta.gov/ OMBCN/OMBControlNumber.cfm. DATES: Written comments must be submitted to the office listed in the addressee section below on or before February 2, 2009. ADDRESSES: Send comments to Diane Wood, U.S. Department of Labor, Employment and Training Administration, Office of Workforce Security, 200 Constitution Avenue, NW., Frances Perkins Bldg. Room S– 4531, Washington, DC 20210, telephone number (202) 693–3212 (this is not a toll-free number) or by e-mail at [email protected].
SUPPLEMENTARY INFORMATION: I. Background: Funds were awarded
to participating states in fiscal year 2008 to continue the Reemployment and Eligibility Assessment (REA) initiative. The REA guidelines require that these funds be used to conduct in-person assessments in the One-Stop Career Centers. The REA must include an unemployment insurance (UI) continued eligibility review, the provision of labor market information, development of a work-search plan and referral to reemployment services and/ or training, as appropriate. The guidelines require that participation exclude those claimants who have a specific return-to-work date or who secure employment solely through a union hiring hall.
II. Desired Focus of Comments: Currently, the Employment and Training Administration is soliciting comments on extending the collection of the ETA 9128, Reemployment and Eligibility Assessments Workloads Report and the ETA 9129, Reemployment and Eligibility Assessments Outcomes Report. Comments are requested to:
VerDate Aug<31>2005 17:35 Dec 03, 2008 Jkt 217001 PO 00000 Frm 00057 Fmt 4703 Sfmt 4703 E:\FR\FM\04DEN1.SGM 04DEN1mst
ocks
till o
n P
RO
D1P
C66
with
NO
TIC
ES

16836 Federal Register / Vol. 74, No. 69 / Monday, April 13, 2009 / Notices
Dated: April 6, 2009.
Christopher Cassel, Acting Director, IA Subsidies Enforcement Office. [FR Doc. E9–8396 Filed 4–10–09; 8:45 am]
BILLING CODE: 3510–DS–S
DEPARTMENT OF COMMERCE
International Trade Administration
California Association for Research in Astronomy dba W.M. Keck Observatory, Notice of Decision on Applications for Duty–Free Entry of Scientific Instruments
This is a decision pursuant to Section 6(c) of the Educational, Scientific, and Cultural Materials Importation Act of 1966 (Pub. L. 89–651, as amended by Pub. .106–36; 80 Stat. 897; 15 CFR part 301). Related records can be viewed between 8:30 A.M. and 5:00 P.M. in Room 3705, U.S. Department of Commerce, 14th and Constitution Ave, NW, Washington, D.C. Comments: None received. Decision: Approved. We know of no instruments of equivalent scientific value to the foreign instruments described below, for such purposes as this is intended to be used, that was being manufactured in the United States at the time of its order. Docket Number: 08–061. Applicant: California Association for Research in Astronomy dba W.M. Keck Observatory, Kamuela, HI 96743. Instrument: Laser Launch Telescope Assembly (LTA). Manufacturer: Galileo Avionica, Italy. Intended Use: See notice at 74 FR 9219, March 3, 2009.
Reasons: This laser launch telescope assembly (LTA) has stringent technical requirements in regard to optical qualities, size, weight, and laser power capabilities than standard telescope designs that are used for viewing versus projection of a laser beam. Unique features of this LTA include: 1)it is able to handle the laser power of 20 watts of 589 nanometer light and throughput requirements, 2) it has a temperature range of -10 degrees C to 10 degrees C, and 3) it is able to meet those requirements while the unit is moved from 0 to 70 degrees zenith angle.
Dated: April 7, 2009.
Christopher Cassel, Acting Director, Subsidies Enforcement Office, Import Administration. [FR Doc. E9–8389 Filed 4–10–09; 8:45 am]
BILLING CODE: 3510–DS–S
DEPARTMENT OF COMMERCE
International Trade Administration
(C–570–938)
Citric Acid and Certain Citrate Salts From the People’s Republic of China: Final Affirmative Countervailing Duty Determination
AGENCY: Import Administration, International Trade Administration, Department of Commerce. SUMMARY: The Department of Commerce (‘‘Department’’) has determined that countervailable subsidies are being provided to producers and exporters of citric acid and certain citrate salts (‘‘citric acid’’) from the People’s Republic of China (‘‘PRC’’). For information on the estimated countervailing duty rates, please see the ‘‘Suspension of Liquidation’’ section, below.
EFFECTIVE DATE: April 13, 2009. FOR FURTHER INFORMATION CONTACT: David Neubacher, Shelly Atkinson or Damian Felton, AD/CVD Operations, Office 1, Import Administration, International Trade Administration, U.S. Department of Commerce, 14th Street and Constitution Avenue, NW, Washington, DC 20230; telephone: (202) 482–5823, (202) 482–0116 or (202) 482– 0133, respectively. SUPPLEMENTARY INFORMATION:
Petitioners
The petitioners in this investigation are Archer Daniels Midland Company, Cargill, Incorporated, and Tate & Lyle America, Inc. (collectively, ‘‘Petitioners’’).
Period of Investigation
The period for which we are measuring subsidies, or period of investigation, is January 1, 2007, through December 31, 2007.
Case History
The following events have occurred since the announcement of the preliminary determination, which was published in the Federal Register on September 19, 2008. See Citric Acid and Certain Citrate Salts From the People’s Republic of China: Preliminary Affirmative Countervailing Duty Determination and Alignment of Final Countervailing Duty Determination With Final Antidumping Duty Determination, 73 FR 54367 (September 19, 2008) (‘‘Preliminary Determination’’).
The Department issued several supplemental questionnaires to the Government of the People’s Republic of China (‘‘GOC’’), TTCA Co., Ltd.
(formerly Shandong TTCA Biochemical Co., Ltd.) (‘‘TTCA’’) and Yixing Union Biochemical Co. Ltd. (‘‘Yixing Union’’) and its cross–owned affiliate Yixing Union Cogeneration Co., Ltd., and received responses in September and October 2008.
Public versions of the questionnaires and responses, as well as the various memoranda cited below are available at the Department’s Central Records Unit (Room 1117 in the HCHB Building) (hereafter referred to as ‘‘CRU’’).
On September 12, 2008, the Department determined to investigate certain subsidies alleged by Petitioners in their submission of August 8, 2008. See Memorandum to Susan Kuhbach, Senior Director, Office 1, entitled ‘‘Analysis of Petitioners’ New Subsidy Allegations’’ (September 12, 2008). On October 1, 2008, the Department issued questionnaires to the GOC, TTCA and Yixing Union regarding these new subsidy allegations. We received responses to these questionnaires as well as to supplemental questionnaires regarding the newly alleged submissions in October 2008.
On October 20, 2008, the Department initiated an investigation of TTCA’s creditworthiness for the years 2004, 2006 and 2007, pursuant to 19 CFR 351.505(a)(6). See Memorandum to Susan H. Kuhbach, Senior Director, Office 1, entitled ‘‘Uncreditworthy Allegation for TTCA’’ (October 20, 2008). On February 25, 2009, we issued our preliminary determination that TTCA was uncreditworthy for the years investigated. See Memorandum to Susan H. Kuhbach, Senior Office Director, AD/CVD Operations, Office 1, entitled ‘‘Preliminary Creditworthiness Determination for TTCA Co., Ltd.’’ (February 25, 2009).
From November 1 through November 20, 2008, we conducted verification of the questionnaire responses submitted by the GOC, TTCA and Yixing Union.
On March 4, 2009, we issued our post–preliminary determination regarding the new subsidy allegations and certain other programs discovered in the course of the investigation. See Memorandum to Ronald K. Lorentzen, Acting Assistant Secretary for Import Administration, entitled ‘‘Post– Preliminary Findings for the New Subsidy Allegations’’ (March 4, 2009).
We received case briefs from the GOC and Yixing Union on March 12, 2009, and from Petitioners and TTCA on March 13, 2009. The same parties submitted rebuttal briefs on March 18 and 19, 2009, respectively.
VerDate Nov<24>2008 18:51 Apr 10, 2009 Jkt 217001 PO 00000 Frm 00007 Fmt 4703 Sfmt 4703 E:\FR\FM\13APN1.SGM 13APN1

16837 Federal Register / Vol. 74, No. 69 / Monday, April 13, 2009 / Notices
Scope of the Investigation
The scope of this investigation includes all grades and granulation sizes of citric acid, sodium citrate, and potassium citrate in their unblended forms, whether dry or in solution, and regardless of packaging type. The scope also includes blends of citric acid, sodium citrate, and potassium citrate; as well as blends with other ingredients, such as sugar, where the unblended form(s) of citric acid, sodium citrate, and potassium citrate constitute 40 percent or more, by weight, of the blend. The scope of this investigation also includes all forms of crude calcium citrate, including dicalcium citrate monohydrate, and tricalcium citrate tetrahydrate, which are intermediate products in the production of citric acid, sodium citrate, and potassium citrate. The scope of this investigation does not include calcium citrate that satisfies the standards set forth in the United States Pharmacopeia and has been mixed with a functional excipient, such as dextrose or starch, where the excipient constitutes at least 2 percent, by weight, of the product. The scope of this investigation includes the hydrous and anhydrous forms of citric acid, the dihydrate and anhydrous forms of sodium citrate, otherwise known as citric acid sodium salt, and the monohydrate and monopotassium forms of potassium citrate. Sodium citrate also includes both trisodium citrate and monosodium citrate, which are also known as citric acid trisodium salt and citric acid monosodium salt, respectively. Citric acid and sodium citrate are classifiable under 2918.14.0000 and 2918.15.1000 of the Harmonized Tariff Schedule of the United States (HTSUS), respectively. Potassium citrate and crude calcium citrate are classifiable under 2918.15.5000 and 3824.90.9290 of the HTSUS, respectively. Blends that include citric acid, sodium citrate, and potassium citrate are classifiable under 3824.90.9290 of the HTSUS. Although the HTSUS subheadings are provided for convenience and customs purposes, the written description of the merchandise is dispositive.
Injury Test
Because the PRC is a ‘‘Subsidies Agreement Country’’ within the meaning of section 701(b) of the Tariff Act of 1930, as amended (‘‘Act’’), section 701(a)(2) of the Act applies to this investigation. Accordingly, the International Trade Commission (‘‘ITC’’) must determine whether imports of the subject merchandise from the PRC materially injure, or threaten material
injury to a U.S. industry. On June 11, 2008, the ITC published its preliminary determination that there is a reasonable indication that an industry in the United States is materially injured or threatened with material injury by reason of imports from China of citric acid. See Citric Acid and Certain Citrate Salts From Canada and China; Determinations, 73 FR 33115 (June 11, 2008).
Analysis of Comments Received All issues raised in the case and
rebuttal briefs by parties to this investigation are addressed in the Memorandum from John M. Andersen, Acting Deputy Assistant Secretary for Antidumping and Countervailing Duty Operations, to Ronald K. Lorentzen, Acting Assistant Secretary for Import Administration, entitled ‘‘Issues and Decision Memorandum for the Final Determination in the Countervailing Duty Investigation of Citric Acid and Certain Citrate Salts from the People’s Republic of China’’ (April 6, 2009) (hereafter referred to as the ‘‘Decision Memorandum), which is hereby adopted by this notice. Attached to this notice as an Appendix is a list of the issues that parties have raised and to which we have responded in the Decision Memorandum. Parties can find this public memorandum in the Department’s CRU. In addition, a complete version of the Decision Memorandum can be accessed directly on the Internet at http://ia.ita.doc.gov/ frn/. The paper copy and electronic version of the Decision Memorandum are identical in content.
Use of Adverse Facts Available For purposes of this final
determination, we have continued to rely on facts available and have again used adverse inferences in accordance with sections 776(a) and (b) of the Act to determine the countervailable subsidy rates for Anhui BBCA Biochemical Co., Ltd. (‘‘Anhui BBCA’’), which is one of the three companies selected to respond to our questionnaires. A full discussion of our decision to apply adverse facts available is presented in the Decision Memorandum in the section ‘‘Use of Facts Otherwise Available and Adverse Facts Available.’’
In a departure from the Preliminary Determination, the Department now finds that the use of ‘‘facts otherwise available’’ is warranted with regard to policy lending because TTCA provided information that could not be verified. See Decision Memorandum, at Comment 19. Moreover, TTCA failed to cooperate by not acting to the best of its
ability in this investigation. Accordingly, we find that an adverse inference is warranted, pursuant to section 776(b) of the Act, to ensure that TTCA does not obtain a more favorable result than had it fully complied with our request for information. See Decision Memorandum, at Comment 19.
For reasons explained in the ‘‘Analysis of Programs’’ section I.A (Programs Determined to Be Countervailable: Energy and Water Savings Grant) in the Decision Memorandum, we find the use of ‘‘facts otherwise available’’ is warranted, pursuant to section 776(a)(2)(A) and (D) of the Act, with regard to the specificity determination for the Energy and Water Savings Grant program because the GOC would not provide requested information and did not provide verifiable program usage data. Because the GOC refused to provide information that would allow for a de facto specificity analysis using accurate and verifiable data and failed to act to the best of its ability, we have employed an adverse inference in selecting from among the facts otherwise available. Accordingly, pursuant to section 776(b) of the Act, we find that this program is de facto specific within the meaning of section 771(5A)(D)(iii) of the Act.
Suspension of Liquidation
In accordance with section 705(c)(1)(B)(i)(I) of the Act, we have calculated an individual rate for the companies under investigation, Anhui BBCA, TTCA and Yixing Union. Section 705(c)(5)(A)(i) of the Act states that for companies not investigated, we will determine an all–others rate equal to the weighted average countervailable subsidy rates established for exporters and producers individually investigated, excluding any zero and de minimis countervailable subsidy rates, and any rates determined entirely under section 776 of the Act. As Anhui BBCA’s rate was calculated under section 776 of the Act, it is not included in the all–others rate.
Notwithstanding the language of section 705(c)(5)(A)(i) of the Act, we have not calculated the all–others rate by weight averaging the rates of TTCA and Yixing Union because doing so risks disclosure of proprietary information. Therefore, we have calculated a simple average of the two responding firms’ rates. Finally, because TTCA’s rate includes export subsidies, the all–others rate also includes export subsidies.
VerDate Nov<24>2008 18:51 Apr 10, 2009 Jkt 217001 PO 00000 Frm 00008 Fmt 4703 Sfmt 4703 E:\FR\FM\13APN1.SGM 13APN1
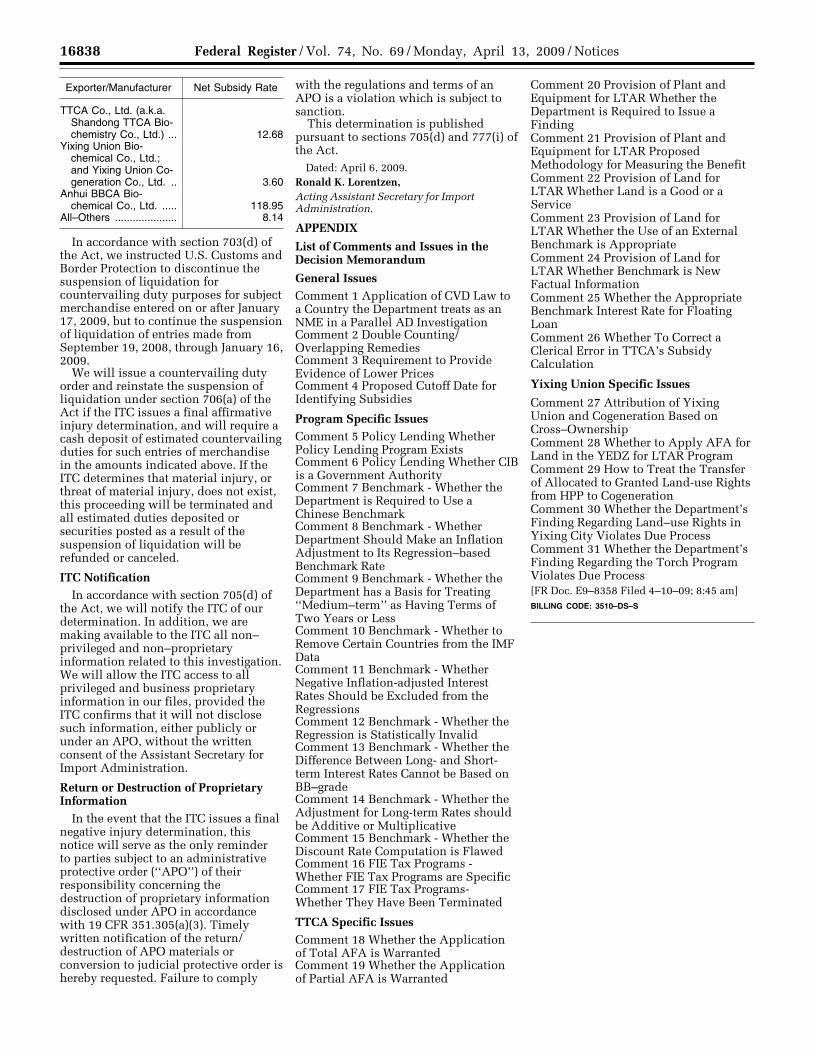
16838 Federal Register / Vol. 74, No. 69 / Monday, April 13, 2009 / Notices
Exporter/Manufacturer Net Subsidy Rate
TTCA Co., Ltd. (a.k.a. Shandong TTCA Bio-chemistry Co., Ltd.) ... 12.68
Yixing Union Bio-chemical Co., Ltd.; and Yixing Union Co-generation Co., Ltd. .. 3.60
Anhui BBCA Bio-chemical Co., Ltd. ..... 118.95
All–Others ..................... 8.14
In accordance with section 703(d) of the Act, we instructed U.S. Customs and Border Protection to discontinue the suspension of liquidation for countervailing duty purposes for subject merchandise entered on or after January 17, 2009, but to continue the suspension of liquidation of entries made from September 19, 2008, through January 16, 2009.
We will issue a countervailing duty order and reinstate the suspension of liquidation under section 706(a) of the Act if the ITC issues a final affirmative injury determination, and will require a cash deposit of estimated countervailing duties for such entries of merchandise in the amounts indicated above. If the ITC determines that material injury, or threat of material injury, does not exist, this proceeding will be terminated and all estimated duties deposited or securities posted as a result of the suspension of liquidation will be refunded or canceled.
ITC Notification In accordance with section 705(d) of
the Act, we will notify the ITC of our determination. In addition, we are making available to the ITC all non– privileged and non–proprietary information related to this investigation. We will allow the ITC access to all privileged and business proprietary information in our files, provided the ITC confirms that it will not disclose such information, either publicly or under an APO, without the written consent of the Assistant Secretary for Import Administration.
Return or Destruction of Proprietary Information
In the event that the ITC issues a final negative injury determination, this notice will serve as the only reminder to parties subject to an administrative protective order (‘‘APO’’) of their responsibility concerning the destruction of proprietary information disclosed under APO in accordance with 19 CFR 351.305(a)(3). Timely written notification of the return/ destruction of APO materials or conversion to judicial protective order is hereby requested. Failure to comply
with the regulations and terms of an APO is a violation which is subject to sanction.
This determination is published pursuant to sections 705(d) and 777(i) of the Act.
Dated: April 6, 2009. Ronald K. Lorentzen, Acting Assistant Secretary for Import Administration.
APPENDIX
List of Comments and Issues in the Decision Memorandum
General Issues Comment 1 Application of CVD Law to a Country the Department treats as an NME in a Parallel AD Investigation Comment 2 Double Counting/ Overlapping Remedies Comment 3 Requirement to Provide Evidence of Lower Prices Comment 4 Proposed Cutoff Date for Identifying Subsidies
Program Specific Issues Comment 5 Policy Lending Whether Policy Lending Program Exists Comment 6 Policy Lending Whether CIB is a Government Authority Comment 7 Benchmark - Whether the Department is Required to Use a Chinese Benchmark Comment 8 Benchmark - Whether Department Should Make an Inflation Adjustment to Its Regression–based Benchmark Rate Comment 9 Benchmark - Whether the Department has a Basis for Treating ‘‘Medium–term’’ as Having Terms of Two Years or Less Comment 10 Benchmark - Whether to Remove Certain Countries from the IMF Data Comment 11 Benchmark - Whether Negative Inflation-adjusted Interest Rates Should be Excluded from the Regressions Comment 12 Benchmark - Whether the Regression is Statistically Invalid Comment 13 Benchmark - Whether the Difference Between Long- and Short- term Interest Rates Cannot be Based on BB–grade Comment 14 Benchmark - Whether the Adjustment for Long-term Rates should be Additive or Multiplicative Comment 15 Benchmark - Whether the Discount Rate Computation is Flawed Comment 16 FIE Tax Programs - Whether FIE Tax Programs are Specific Comment 17 FIE Tax Programs- Whether They Have Been Terminated
TTCA Specific Issues Comment 18 Whether the Application of Total AFA is Warranted Comment 19 Whether the Application of Partial AFA is Warranted
Comment 20 Provision of Plant and Equipment for LTAR Whether the Department is Required to Issue a Finding Comment 21 Provision of Plant and Equipment for LTAR Proposed Methodology for Measuring the Benefit Comment 22 Provision of Land for LTAR Whether Land is a Good or a Service Comment 23 Provision of Land for LTAR Whether the Use of an External Benchmark is Appropriate Comment 24 Provision of Land for LTAR Whether Benchmark is New Factual Information Comment 25 Whether the Appropriate Benchmark Interest Rate for Floating Loan Comment 26 Whether To Correct a Clerical Error in TTCA’s Subsidy Calculation
Yixing Union Specific Issues
Comment 27 Attribution of Yixing Union and Cogeneration Based on Cross–Ownership Comment 28 Whether to Apply AFA for Land in the YEDZ for LTAR Program Comment 29 How to Treat the Transfer of Allocated to Granted Land-use Rights from HPP to Cogeneration Comment 30 Whether the Department’s Finding Regarding Land–use Rights in Yixing City Violates Due Process Comment 31 Whether the Department’s Finding Regarding the Torch Program Violates Due Process [FR Doc. E9–8358 Filed 4–10–09; 8:45 am] BILLING CODE: 3510–DS–S
DEPARTMENT OF COMMERCE
International Trade Administration
[A–570–937]
Citric Acid and Certain Citrate Salts From the People’s Republic of China: Final Affirmative Determination of Sales at Less Than Fair Value
AGENCY: International Trade Administration, Department of Commerce.
DATES: Effective Date: April 13, 2009. SUMMARY: We invited interested parties to comment on our preliminary determination of sales at LTFV. The Department of Commerce (‘‘the Department’’) has determined that citric acid and certain citrate salts (‘‘citric acid’’) from the People’s Republic of China (‘‘PRC’’) is being, or is likely to be, sold in the United States at LTFV as provided in section 735 of the Tariff Act of 1930, as amended (‘‘the Act’’). The estimated margins of sales at less than
VerDate Nov<24>2008 18:51 Apr 10, 2009 Jkt 217001 PO 00000 Frm 00009 Fmt 4703 Sfmt 4703 E:\FR\FM\13APN1.SGM 13APN1

16839 Federal Register / Vol. 74, No. 69 / Monday, April 13, 2009 / Notices
1 See, e.g., Wooden Bedroom Furniture from the People’s Republic of China: Final Results of the 2004–2005 Semi–Annual New Shipper Reviews, 71 FR 70739 (December 6, 2006) and accompanying Issues and Decision Memorandum, at Comment 5; and Malleable Iron Pipe Fittings from the People’s Republic of China: Preliminary Results of Antidumping Duty Administrative Review, 70 FR 76234, 76238 (December 23, 2005).
fair value (‘‘LTFV’’) are shown in the ‘‘Final Determination Margins’’ section of this notice. FOR FURTHER INFORMATION CONTACT: Lilit Astvatsatrian or Andrea Staebler Berton, AD/CVD Operations, Office 8, Import Administration, International Trade Administration, U.S. Department of Commerce, 14th Street and Constitution Avenue, NW., Washington, DC 20230; telephone: (202) 482–6412 or (202) 482– 4037, respectively. SUPPLEMENTARY INFORMATION:
Case History The Department published its
preliminary determination of sales at LTFV on November 20, 2008. See Citric Acid and Certain Citrate Salts from the People’s Republic of China: Preliminary Determination of Sales at Less Than Fair Value and Postponement of Final Determination, 73 FR 70328 (November 20, 2008) (‘‘Preliminary Determination’’). The period of investigation (‘‘POI’’) is October 1, 2007, to March 31, 2008.
Between January 7 and 20, 2009, the Department conducted verifications of TTCA Co., Ltd. (aka Shandong TTCA Biochemistry Co., Ltd.) (‘‘TTCA’’) and Yixing Union Biochemical Co., Ltd. (‘‘Yixing Union’’) (‘‘respondents’’). See the ‘‘Verification’’ section below for additional information.
We invited interested parties to comment on the Preliminary Determination. On February 25, 2009, Archer Daniels Midland Company, Cargill, Incorporated, and Tate & Lyle Americas, Inc. (collectively, ‘‘Petitioners’’), TTCA, and Yixing Union filed case briefs. On March 2, 2009, Petitioners, TTCA, and Yixing Union filed rebuttal briefs. The Department held a hearing on March 12, 2009.
Verification As provided in section 782(i) of the
Act, we verified the information submitted by TTCA and Yixing Union for use in our final determination. See the Department’s verification reports on the record of this investigation in the Central Records Unit (‘‘CRU’’), Room 1117 of the main Department building, with respect to these entities. For all verified companies, we used standard verification procedures, including examination of relevant accounting and production records, as well as original source documents provided by respondents.
Analysis of Comments Received All issues raised in the case and
rebuttal briefs, and at the hearing, by parties to this investigation are addressed in the ‘‘Issues and Decision
Memorandum for the Investigation of Citric Acid and Certain Citrate Salts from the People’s Republic of China,’’ dated concurrently with this notice and which is hereby adopted by this notice (‘‘Issues and Decision Memorandum’’). A list of the issues which parties raised and to which we respond in the Issues and Decision Memorandum is attached to this notice as an Appendix. The Issues and Decision Memorandum is a public document and is on file in the CRU, and is accessible on the Web at http://ia.ita.doc.gov/frn. The paper copy and electronic version of the memorandum are identical in content.
Changes Since the Preliminary Determination
Based on our analysis of information on the record of this investigation, we have made changes to the margin calculations for the final determination for all mandatory respondents.
General Issues
• We have updated the Indonesian and Indian inflator information for the wholesale price index (‘‘WPI’’) as published in the International Financial Statistics of the International Monetary Fund. See Final Determination of the Antidumping Duty Investigation of Citric Acid and Certain Citrate Salts from the People’s Republic of China: Surrogate Value Memorandum, dated April 6, 2009 (‘‘Final SV Memo’’), at 2. All inflated or deflated surrogate values were revised as a result of the updated inflators. See Issues and Decision Memorandum, at Comment 6.
• For the final determination, we deflated the surrogate values for marine insurance and truck freight. See Final SV Memo, at 2, and Issues and Decision Memorandum, at Comment 4.
• We have revised the surrogate value for sodium lignosulphonate. See Final SV Memo, at 3, and Issues and Decision Memorandum, at Comment 11B.
• We have revised the surrogate financial ratios by including interest expenses in the SG&A calculation. See Final SV Memo, at 3, and Issues and Decision Memorandum, at Comment 3.
• Consistent with our practice,1 we have excluded beginning and ending finished goods inventories from the calculation of surrogate financial ratios
for the final determination. See Final SV Memo, at 3.
• Based on the surrogate financial company’s treatment of certain depreciation and warehouse expenses as selling expenses, and depreciation and repairs and maintenance as general and administrative expenses, we have reclassified these expenses from the surrogate factory overhead ratio to the surrogate selling, general, and administrative ratio calculation for the final determination. See Final SV Memo, at 3–4.
• We were unable to segregate and, therefore, were unable to exclude energy costs from the calculation of the surrogate financial ratios. Accordingly, we have disregarded the respondents’ energy inputs (coal and steam by- product offsets for TTCA, electricity and steam for Yixing Union) in the calculation of normal value for purposes of the final determination, in order to avoid double-counting energy costs which have necessarily been captured in the surrogate financial ratios. See Investigation of Citric Acid and Certain Citrate Salts from the People’s Republic of China: Analysis of the Final Determination Margin Calculation for TTCA Co., Ltd., (a.k.a. Shandong TTCA Biochemistry Co., Ltd.), dated April 6, 2009 (‘‘TTCA Final Analysis Memo’’), at 2; see also Investigation of Citric Acid and Certain Citrate Salts from the People’s Republic of China: Analysis of the Final Determination Margin Calculation for Yixing Union Biochemical Co., Ltd., dated April 6, 2009 (‘‘Yixing Union Final Analysis Memo’’), at 1–2; and Issues and Decision Memorandum at Comment 2.
Company-Specific Changes Since the Preliminary Determination
TTCA
• For the final determination, we have adjusted TTCA’s indirect labor. See TTCA Final Analysis Memo at 1–2 and Issues and Decision Memorandum, at Comment 10.
• For the final determination, we have added TTCA’s billing adjustment expense to the gross unit price. See TTCA Final Analysis Memo, at 2 and Issues and Decision Memorandum, at Comment 11A.
• We have included TTCA’s low protein scrap by-product in the calculation of the normal value. See TTCA Final Analysis Memo, at 2–3 and Issues and Decision Memorandum, at Comment 15.
• We have adjusted TTCA’s reported consumption of calcium carbonate to account for the under-reported usage
VerDate Nov<24>2008 18:51 Apr 10, 2009 Jkt 217001 PO 00000 Frm 00010 Fmt 4703 Sfmt 4703 E:\FR\FM\13APN1.SGM 13APN1

16840 Federal Register / Vol. 74, No. 69 / Monday, April 13, 2009 / Notices
rate. See TTCA Final Analysis Memo, at 3.
Yixing Union • We have valued Yixing Union’s
ocean freight using the reported international freight. See Yixing Union Final Analysis Memo.
Scope of Investigation The scope of this investigation
includes all grades and granulation sizes of citric acid, sodium citrate, and potassium citrate in their unblended forms, whether dry or in solution, and regardless of packaging type. The scope also includes blends of citric acid, sodium citrate, and potassium citrate; as well as blends with other ingredients, such as sugar, where the unblended form(s) of citric acid, sodium citrate, and potassium citrate constitute 40 percent or more, by weight, of the blend. The scope of this investigation also includes all forms of crude calcium citrate, including dicalcium citrate monohydrate, and tricalcium citrate tetrahydrate, which are intermediate products in the production of citric acid, sodium citrate, and potassium citrate. The scope of this investigation does not include calcium citrate that satisfies the standards set forth in the United States Pharmacopeia and has been mixed with a functional excipient, such as dextrose or starch, where the excipient constitutes at least 2%, by weight, of the product. The scope of this investigation includes the hydrous and anhydrous forms of citric acid, the dihydrate and anhydrous forms of sodium citrate, otherwise known as citric acid sodium salt, and the monohydrate and monopotassium forms of potassium citrate. Sodium citrate also includes both trisodium citrate and monosodium citrate, which are also known as citric acid trisodium salt and citric acid monosodium salt, respectively. Citric acid and sodium citrate are classifiable under 2918.14.0000 and 2918.15.1000 of the Harmonized Tariff Schedule of the United States (HTSUS), respectively. Potassium citrate and crude calcium citrate are classifiable under 2918.15.5000 and 3824.90.9290 of the HTSUS, respectively. Blends that include citric acid, sodium citrate, and potassium citrate are classifiable under 3824.90.9290 of the HTSUS. Although the HTSUS subheadings are provided for convenience and customs purposes, the written description of the merchandise is dispositive.
Surrogate Country In the Preliminary Determination, we
stated that we had selected Indonesia as
the appropriate surrogate country to use in this investigation for the following reasons: (1) it is a significant producer of comparable merchandise; (2) it is at a similar level of economic development comparable to that of the PRC; and (3) we have reliable data from Indonesia that we can use to value the factors of production. See Preliminary Determination. For the final determination, we continue to use Indonesia as the primary surrogate country. See Issues and Decision Memorandum, at Comment 1.
Separate Rates In proceedings involving non-market-
economy (‘‘NME’’) countries, the Department begins with a rebuttable presumption that all companies within the country are subject to government control and, thus, should be assigned a single antidumping duty deposit rate. It is the Department’s policy to assign all exporters of merchandise subject to an investigation in an NME country this single rate unless an exporter can demonstrate that it is sufficiently independent so as to be entitled to a separate rate. See Final Determination of Sales at Less Than Fair Value: Sparklers from the People’s Republic of China, 56 FR 20588 (May 6, 1991) (‘‘Sparklers’’), as amplified by Notice of Final Determination of Sales at Less Than Fair Value: Silicon Carbide from the People’s Republic of China, 59 FR 22585 (May 2, 1994) (‘‘Silicon Carbide’’), and 19 CFR 351.107(d).
In the Preliminary Determination, we found that TTCA, Yixing Union and 11 separate rate applicants demonstrated their eligibility for separate rate status. For the final determination, we continue to find that the evidence placed on the record of this investigation by TTCA, Yixing Union, and the separate rate applicants demonstrate both a de jure and de facto absence of government control, with respect to their respective exports of the merchandise under investigation, and, thus continue to find that they are eligible for separate rate status.
Use of Facts Available Section 776(a)(2) of the Act, provides
that, if an interested party: (A) Withholds information that has been requested by the Department; (B) fails to provide such information in a timely manner or in the form or manner requested subject to sections 782(c)(1) and (e) of the Act; (C) significantly impedes a proceeding under the antidumping statute; or (D) provides such information but the information cannot be verified, the Department shall, subject to subsection 782(d) of the
Act, use facts otherwise available in reaching the applicable determination.
Section 782(c)(1) of the Act provides that if an interested party ‘‘promptly after receiving a request from (the Department) for information, notifies (the Department) that such party is unable to submit the information requested in the requested form and manner, together with a full explanation and suggested alternative forms in which such party is able to submit the information,’’ the Department may modify the requirements to avoid imposing an unreasonable burden on that party.
Section 782(d) of the Act provides that, if the Department determines that a response to a request for information does not comply with the request, the Department will inform the person submitting the response of the nature of the deficiency and shall, to the extent practicable, provide that person the opportunity to remedy or explain the deficiency. If that person submits further information that continues to be unsatisfactory, or this information is not submitted within the applicable time limits, the Department may, subject to section 782(e), disregard all or part of the original and subsequent responses, as appropriate.
Section 782(e) of the Act states that the Department shall not decline to consider information deemed ‘‘deficient’’ under section 782(d) if: (1) The information is submitted by the established deadline; (2) the information can be verified; (3) the information is not so incomplete that it cannot serve as a reliable basis for reaching the applicable determination; (4) the interested party has demonstrated that it acted to the best of its ability; and (5) the information can be used without undue difficulties.
Furthermore, section 776(b) of the Act states that if the Department ‘‘finds that an interested party has failed to cooperate by not acting to the best of its ability to comply with a request for information from the administering authority or the Commission, the administering authority or the Commission * * *, in reaching the applicable determination under this title, may use an inference that is adverse to the interests of that party in selecting from among the facts otherwise available.’’ See also Statement of Administrative Action (SAA) accompanying the Uruguay Round Agreements Act (URAA), H.R. Rep. No. 103–316, Vol. 1 at 870 (1994).
For this final determination, in accordance with sections 776(a)(2)(A), (B) and (D) and 776(b) of the Act, we have determined that the use of adverse
VerDate Nov<24>2008 18:51 Apr 10, 2009 Jkt 217001 PO 00000 Frm 00011 Fmt 4703 Sfmt 4703 E:\FR\FM\13APN1.SGM 13APN1

16841 Federal Register / Vol. 74, No. 69 / Monday, April 13, 2009 / Notices
facts available (‘‘AFA’’) is warranted for the PRC-wide entity, as discussed below.
The PRC-Wide Rate Because we begin with the
presumption that all companies within an NME country are subject to government control and because only the companies listed under the ‘‘Final Determination Margins’’ section below have overcome that presumption, we are applying a single antidumping rate—the PRC-wide rate—to all other exporters of subject merchandise from the PRC. See, e.g., Synthetic Indigo from the People’s Republic of China: Notice of Final Determination of Sales at Less Than Fair Value, 65 FR 25706 (May 3, 2000). The PRC-wide rate applies to all entries of subject merchandise except for entries from the respondents identified as receiving a separate rate in the ‘‘Final Determination Margins’’ section below. In the Preliminary Determination, the Department found that the PRC-wide entity did not respond to our requests for information because record evidence indicates there were more exporters of citric acid from the PRC during the POI than those that were found to be eligible for a separate rate and responded to the Q&V questionnaire or the full antidumping questionnaire. Therefore, in the Preliminary Determination we treated these PRC exporters as part of the PRC-wide entity because they did not demonstrate that they operate free of government control over their export activities. No additional information was placed on the record with respect to these entities after the Preliminary Determination. In addition, because the PRC-wide entity has not provided the Department with the requested information, pursuant to section 776(a)(2)(A) and (C) of the Act, the Department continues to find that the use of facts available is appropriate to determine the PRC-wide rate. Section 776(b) of the Act provides that, in selecting from among the facts otherwise available, the Department may employ an adverse inference if an interested party fails to cooperate by not acting to the best of its ability to comply
with requests for information. See Notice of Final Determination of Sales at Less Than Fair Value: Certain Cold- Rolled Flat-Rolled Carbon-Quality Steel Products from the Russian Federation, 65 FR 5510, 5518 (February 4, 2000). See also SAA at 870. We have determined that, because the PRC-wide entity did not respond to our request for information, it has failed to cooperate to the best of its ability. Therefore, the Department finds that, in selecting from among the facts otherwise available, an adverse inference is warranted.
In the Preliminary Determination, as facts available, we assigned to the PRC- wide entity the margin alleged in the petition, i.e., 156.87 percent. See Preliminary Determination, 73 FR at 70332. For the final determination, we have continued to assign to the PRC- wide entity the rate of 156.87 percent.
Corroboration Section 776(c) of the Act provides
that, when the Department relies on secondary information in using the facts otherwise available, it must, to the extent practicable, corroborate that information from independent sources that are reasonably at its disposal. We have interpreted ‘‘corroborate’’ to mean that we will, to the extent practicable, examine the reliability and relevance of the information submitted. See Notice of Final Determination of Sales at Less Than Fair Value: Certain Cold-Rolled Flat-Rolled Carbon-Quality Steel Products from Brazil, 65 FR 5554, 5568 (February 4, 2000); see, e.g., Tapered Roller Bearings and Parts Thereof, Finished and Unfinished, from Japan, and Tapered Roller Bearings, Four Inches or Less in Outside Diameter, and Components Thereof, from Japan; Preliminary Results of Antidumping Duty Administrative Reviews and Partial Termination of Administrative Reviews, 61 FR 57391, 57392 (November 6, 1996), unchanged in Tapered Roller Bearings and Parts Thereof, Finished and Unfinished, from Japan, and Tapered Roller Bearings, Four Inches or Less in Outside Diameter, and Components Thereof, from Japan: Final Results of Antidumping Duty
Administrative Reviews and Termination in Part, 62 FR 11825 (March 13, 1997). The Department’s reliance on the petition rate to determine an AFA rate is subject to the requirement to corroborate secondary information.
At the Preliminary Determination, in accordance with section 776(c) of the Act, we corroborated our AFA margin by comparing the U.S. prices and normal values from the petition to the U.S. prices and normal values for the mandatory respondents. Similarly, for the final determination, we have also compared the U.S. prices and normal values from the petition (that were used to derive the margin for our initiation of this proceeding) to the U.S. prices and normal values for the mandatory respondents. We found that the U.S. prices and normal values used to calculate the initiation margin were within the range of net U.S. prices and normal values, respectively, used in our margin calculations for the mandatory respondents in this investigation.
Because no parties commented on the selection of the PRC-wide rate, we continue to find that the margin of 156.87 percent has probative value. Accordingly, we find that the rate of 156.87 percent is corroborated within the meaning of section 776(c) of the Act.
Combination Rates
In the Preliminary Determination, the Department stated that it would calculate combination rates for the respondents that are eligible for a separate rate in this investigation. See Preliminary Determination, 73 FR at 62961. This practice is described in Policy Bulletin 05.1, ‘‘Separate Rates Practice and Application of Combination Rates in Antidumping Investigations Involving Non-Market Economy Countries’’ available at http://ia.ita.doc.gov/policy/index.html.
Final Determination Margins
We determine that the following percentage weighted-average margins exist for the POI:
Exporter Producer Margin
TTCA Co., Ltd. (a.k.a. Shandong TTCA Biochemistry Co., Ltd.).
TTCA Co., Ltd. (a.k.a. Shandong TTCA Biochemistry Co., Ltd.).
129.08
Yixing Union Biochemical Co., Ltd ............................................. Yixing Union Biochemical Co., Ltd ............................................. 94.61 Anhui BBCA Biochemical Co., Ltd ............................................. Anhui BBCA Biochemical Co., Ltd ............................................. 111.85 Anhui BBCA Biochemical Co., Ltd ............................................. China BBCA Maanshan Biochemical Corp ................................ 111.85 A.H.A. International Co., Ltd ...................................................... Yixing Union Biochemical Co., Ltd ............................................. 111.85 A.H.A. International Co., Ltd ...................................................... Nantong Feiyu Fine Chemical Co., Ltd ...................................... 111.85 High Hope International Group Jiangsu Native Produce IMP &
EXP Co., Ltd.Yixing Union Biochemical Co., Ltd ............................................. 111.85
Huangshi Xinghua Biochemical Co., Ltd .................................... Huangshi Xinghua Biochemical Co., Ltd .................................... 111.85
VerDate Nov<24>2008 18:51 Apr 10, 2009 Jkt 217001 PO 00000 Frm 00012 Fmt 4703 Sfmt 4703 E:\FR\FM\13APN1.SGM 13APN1
16842 Federal Register / Vol. 74, No. 69 / Monday, April 13, 2009 / Notices
Exporter Producer Margin
Lianyungang JF International Trade Co., Ltd ............................ TTCA Co., Ltd. (a.k.a. Shandong TTCA Biochemistry Co., Ltd.).
111.85
Laiwu Taihe Biochemistry Co., Ltd ............................................ Laiwu Taihe Biochemistry Co., Ltd ............................................ 111.85 Lianyungang Shuren Scientific Creation Import & Export Co.,
Ltd.Lianyungang Great Chemical Industry Co., Ltd ......................... 111.85
Penglai Marine Bio-Tech Co. Ltd ............................................... Penglai Marine Bio-Tech Co. Ltd ............................................... 111.85 RZBC Imp & Exp. Co., Ltd./RZBC Co., Ltd./RZBC (Juxian)
Co., Ltd.RZBC Co., Ltd ............................................................................ 111.85
RZBC Imp & Exp. Co., Ltd./RZBC Co., Ltd./RZBC (Juxian) Co., Ltd.
RZBC (Juxian) Co., Ltd .............................................................. 111.85
RZBC Imp & Exp. Co., Ltd./RZBC Co., Ltd./RZBC (Juxian) Co., Ltd.
Lianyungang Great Chemical Industry Co., Ltd ......................... 111.85
Shihezi City Changyun Biochemical Co., Ltd ............................ Shihezi City Changyun Biochemical Co., Ltd ............................ 111.85 Weifang Ensign Industry Co., Ltd .............................................. Weifang Ensign Industry Co., Ltd .............................................. 111.85 PRC-Wide Entity ......................................................................... ..................................................................................................... 156.87
Disclosure
We will disclose the calculations performed within five days of the date of publication of this notice to parties in this proceeding in accordance with 19 CFR 351.224(b).
Continuation of Suspension of Liquidation
In accordance with section 735(c)(1)(B) of the Act, we are directing U.S. Customs and Border Protection (‘‘CBP’’) to continue to suspend liquidation of all imports of subject merchandise entered or withdrawn from warehouse, for consumption on or after November 20, 2008, the date of publication of the Preliminary Determination in the Federal Register. We will instruct CBP to continue to require a cash deposit or the posting of a bond for all companies based on the estimated weighted-average dumping margins shown above, adjusted for the export subsidy rate determined in CVD Citric Acid Final (i.e., countervailable subsidy of 1.76 percent ad valorem). See Citric Acid and Certain Citrate Salts From the People’s Republic of China: Final Affirmative Countervailing Duty Determination (‘‘CVD Citric Acid Final’’), to be published concurrently with this notice. Furthermore, for all separate-rate recipients that were not selected as mandatory respondents, we will instruct CBP to require an antidumping cash deposit or the posting of a bond for each entry equal to the average of the margins calculated for the mandatory respondents, adjusted for their respective export subsidy rates, if applicable, from CVD Citric Acid Final. The suspension of liquidation instructions will remain in effect until further notice.
ITC Notification
In accordance with section 735(d) of the Act, we have notified the International Trade Commission (‘‘ITC’’)
of our final determination of sales at LTFV. As our final determination is affirmative, in accordance with section 735(b)(2) of the Act, within 45 days the ITC will determine whether the domestic industry in the United States is materially injured, or threatened with material injury, by reason of imports or sales (or the likelihood of sales) for importation of the subject merchandise. If the ITC determines that material injury or threat of material injury does not exist, the proceeding will be terminated and all securities posted will be refunded or canceled. If the ITC determines that such injury does exist, the Department will issue an antidumping duty order directing CBP to assess antidumping duties on all imports of the subject merchandise entered, or withdrawn from warehouse, for consumption on or after the effective date of the suspension of liquidation.
Notification Regarding APO
This notice also serves as a reminder to the parties subject to administrative protective order (‘‘APO’’) of their responsibility concerning the disposition of proprietary information disclosed under APO in accordance with 19 CFR 351.305. Timely notification of return or destruction of APO materials or conversion to judicial protective order is hereby requested. Failure to comply with the regulations and the terms of an APO is a sanctionable violation.
This determination and notice are issued and published in accordance with sections 735(d) and 777(i)(1) of the Act.
Dated: April 6, 2009. Ronald K. Lorentzen, Acting Assistant Secretary for Import Administration.
Appendix
General Issues
Comment 1: Selection of Surrogate Country
Comment 2: Treatment of Energy in the Surrogate Financial Statements
Comment 3: Treatment of Interest Expense and Income in Selling, General and Administrative Expenses
Comment 4: Correct Calculation for the Inflator of the Indian Trucking Value
Comment 5A: Surrogate Value for Hydrochloric Acid/Hydrogen Chloride
Comment 5B: Surrogate Value for Calcium Carbonate
Comment 5C: Surrogate Value for Coal Comment 5D: Surrogate Value for Water Comment 5E: Surrogate Value for Brokerage
and Handling Comment 6: Indonesian Inflator Comment 7: Valuation of High Protein Corn
By-Product Comment 8: Additional Expenses for Sales of
Corn Feed By-Product Offset
Issues Specific to TTCA
Comment 9: Date of Sale: Contract Date Versus Invoice Date
Comment 10: Adjustment of TTCA’s Labor Factors
Comment 11A: Correction of Clerical Error in Application of Billing Adjustment
Comment 11B: Correction of Clerical Error in the Surrogate Value of Sodium Lignosulphonate
Comment 12: Offset for Steam By-Product Comment 13: Use of TTCA’s Market-
Economy Freight Costs Comment 14: Adjustment of the Surrogate
Value for Hydrochloric Acid/Hydrogen Chloride
Comment 15: Low-Protein Scrap Offset
Issues Specific to Yixing Union
Comment 16: Yixing Union Corn Usage Rate Comment 17: Yixing Union Mycelium By-
Product Offset Comment 18: Inflation of the Surrogate Value
for Steam [FR Doc. E9–8359 Filed 4–10–09; 8:45 am]
BILLING CODE 3510–DS–P
VerDate Nov<24>2008 18:51 Apr 10, 2009 Jkt 217001 PO 00000 Frm 00013 Fmt 4703 Sfmt 4703 E:\FR\FM\13APN1.SGM 13APN1
16843 Federal Register / Vol. 74, No. 69 / Monday, April 13, 2009 / Notices
1 The petitioners in this investigation are Archer Daniels Midland Company, Cargill, Incorporated, and Tate & Lyle Americas, Inc.
2 See Memorandum to the File through James Maeder, Director Office 2 from Rebecca Trainor and Kate Johnson International Trade Compliance Analysts Office 2, ‘‘Verification of the Sales Response of Jungbunzlauer Technology GMBH & Co. KG (JBLT) in the Antidumping Investigation of Citric Acid and Certain Citrate Salts from Canada,’’ dated February 5, 2009 (Sales Verification Report).
3 See Memorandum to the File through Neal M. Harper, Director of Office of Accounting from James Balog Senior Accountant, Office of Accounting, ‘‘Verification of the Cost Response of Jungbunzlauer Technology GMBH & Co. KG in the Antidumping Investigation of Citric Acid and Certain Citrate Salts from Canada,’’ dated February 24, 2009 (Cost Verification Report).
DEPARTMENT OF COMMERCE
International Trade Administration
A–122–853
Notice of Final Determination of Sales at Less Than Fair Value: Citric Acid and Certain Citrate Salts from Canada
AGENCY: Import Administration, International Trade Administration, Department of Commerce. SUMMARY: We determine that imports of citric acid and certain citrate salts (citric acid) are being, or are likely to be, sold in the United States at less than fair value (LTFV), as provided in section 735 of the Tariff Act of 1930, as amended (the Act). The estimated margins of sales at LTFV are shown in the ‘‘Final Determination Margins’’ section of this notice. EFFECTIVE DATE: April 13, 2009. FOR FURTHER INFORMATION CONTACT: Terre Keaton Stefanova or Rebecca Trainor, AD/CVD Operations, Office 2, Import Administration, International Trade Administration, U.S. Department of Commerce, 14th Street and Constitution Avenue, NW, Washington, DC 20230; telephone: (202) 482–1280 or (202) 482–4007, respectively. SUPPLEMENTARY INFORMATION:
Background On November 20, 2008, the
Department of Commerce (Department) published in the Federal Register the preliminary determination of sales at LTFV in the antidumping duty investigation of citric acid from Canada. See Citric Acid and Certain Citrate Salts from Canada: Notice of Preliminary Determination of Sales at Less Than Fair Value and Postponement of Final Determination, 73 FR 70324 (November 20, 2008) (Preliminary Determination).
In November and December 2008, the respondent, Jungbunzlauer Technology GMBH & Co KG (JBLT), submitted revised home market and U.S. sales listings and cost data. On December 1, 2008, we received pre–verification comments from the petitioners.1 On December 18, 2008, the petitioners requested a hearing to discuss issues addressed by the interested parties in their case and rebuttal briefs. From December 9 through December 16, 2008, we verified the respondent’s sales data.
On January 6, 2009, the respondent informed the Department that its Canadian operations had recently undergone a corporate restructuring which resulted in JBL Canada, Inc.
becoming the producer, seller and exporter of citric acid from Canada, effective December 31, 2008. For further discussion, see ‘‘Corporate Restructuring’’ section below.
From January 12 through January 16, 2009, we verified the respondent’s cost data. On February 5, 2009, we issued the sales verification report,2 and requested that the respondent submit a revised home market and U.S. sales listing per verification findings. We received the revised sales listings on February 17, 2009. On February 24, 2009, we issued the cost verification report.3 We provided the interested parties an opportunity to comment on the Preliminary Determination and the Department’s verification findings.
On February 26, 2009, the petitioners withdrew their request for a hearing. On March 3 and March 9, 2009, respectively, the petitioners and respondent each submitted case and rebuttal briefs. Because the petitioners were the only interested party to request a hearing and it subsequently withdrew its request, no hearing was held on issues raised in the case and rebuttal briefs.
Period of Investigation The period of investigation (POI) is
April 1, 2007, through March 31, 2008. This period corresponds to the four most recent fiscal quarters prior to the month of the filing of the petition.
Scope of Investigation The scope of this investigation
includes all grades and granulation sizes of citric acid, sodium citrate, and potassium citrate in their unblended forms, whether dry or in solution, and regardless of packaging type. The scope also includes blends of citric acid, sodium citrate, and potassium citrate; as well as blends with other ingredients, such as sugar, where the unblended form(s) of citric acid, sodium citrate, and potassium citrate constitute 40 percent or more, by weight, of the blend. The scope of this investigation also includes all forms of crude calcium citrate, including dicalcium citrate
monohydrate, and tricalcium citrate tetrahydrate, which are intermediate products in the production of citric acid, sodium citrate, and potassium citrate. The scope of this investigation does not include calcium citrate that satisfies the standards set forth in the United States Pharmacopeia and has been mixed with a functional excipient, such as dextrose or starch, where the excipient constitutes at least 2 percent, by weight, of the product. The scope of this investigation includes the hydrous and anhydrous forms of citric acid, the dihydrate and anhydrous forms of sodium citrate, otherwise known as citric acid sodium salt, and the monohydrate and monopotassium forms of potassium citrate. Sodium citrate also includes both trisodium citrate and monosodium citrate, which are also known as citric acid trisodium salt and citric acid monosodium salt, respectively. Citric acid and sodium citrate are classifiable under 2918.14.0000 and 2918.15.1000 of the Harmonized Tariff Schedule of the United States (HTSUS), respectively. Potassium citrate and crude calcium citrate are classifiable under 2918.15.5000 and 3824.90.9290 of the HTSUS, respectively. Blends that include citric acid, sodium citrate, and potassium citrate are classifiable under 3824.90.9290 of the HTSUS. Although the HTSUS subheadings are provided for convenience and customs purposes, the written description of the merchandise is dispositive.
Corporate Restructuring The respondent reported, and the
Department verified, that during the POI, three subsidiaries of the Jungbunzlauer Group (JBL Group) were involved in the production and sale of citric acid to the United States. The production of citric acid in Canada involved two separate legal entities, JBLT and JBL Canada, Inc. JBLT was responsible for citric acid production and JBL Canada Inc. was responsible for infrastructure and personnel in connection with JBLT’s operations. The third entity, JBL Inc., located in the United States was responsible for selling products from the JBL Group (including JBLT) to the United States, Canada and Mexico.
As noted above, during the course of this investigation JBLT informed the Department that it had undergone a corporate restructuring. We requested that JBLT submit a detailed explanation and supporting documentation of the corporate restructuring. We also provided the petitioners the opportunity to file comments. See January 23, 2009 Memorandum to the File, and the
VerDate Nov<24>2008 18:51 Apr 10, 2009 Jkt 217001 PO 00000 Frm 00014 Fmt 4703 Sfmt 4703 E:\FR\FM\13APN1.SGM 13APN1
16844 Federal Register / Vol. 74, No. 69 / Monday, April 13, 2009 / Notices
4 See JBLT’s October 9, 2008, Response to Supplemental Questions Regarding Currency Conversions and Date of Sale at 3; and JBLT’s October 14, 2008, First Supplemental Questionnaire Response at 5–6.
5 Because we could not isolate the U.S. inland freight expenses that were affected by the inappropriate currency conversions, we are applying facts available to all reported U.S. inland freight expenses.
January 9 and 14, 2009, submissions from JBLT. We did not receive comments from the petitioners on this matter. At verification we examined the corporate restructuring information submitted by JBLT (see Cost Verification Report at 4).
Based on the corporate restructuring documentation, as verified, JBL Canada Inc., rather than JBLT, is the entity responsible for all the activities related to Canadian citric acid production and exportation, effective December 31, 2008. Therefore, we will assign the final determination margin to JBL Canada, Inc.
Verification
As provided in section 782(i) of the Act, we verified the sales and cost information submitted by the respondent for use in our final determination. We used standard verification procedures including an examination of relevant accounting and production records, and original source documents provided by the respondent. Our sales and cost verification results are outlined in separate verification reports. See Sales Verification Report and Cost Verification Report. The verification reports are on file and available in the Central Records Unit, Room 1117 of the Commerce Department.
Analysis of Comments Received
All issues raised in the case and rebuttal briefs submitted by the parties to this investigation are addressed in the ‘‘Issues and Decision Memorandum for the Final Determination in the Less– Than-Fair–Value Investigation of Citric Acid and Certain Citrate Salts from Canada’’ from John Anderson, Acting Deputy Assistant Secretary for Import Administration, to Ronald K. Lorentzen, Acting Assistant Secretary for Import Administration (Decision Memo), dated April 6, 2009, which is hereby adopted by this notice. A list of the issues that parties have raised and to which we have responded, all of which are in the Decision Memo, is attached to this notice as an appendix. Parties can find a complete discussion of all issues raised in this investigation and the corresponding recommendations in the Decision Memo, which is on file in the Central Records Unit, Room 1117 of the Commerce Department. In addition, a complete version of the Decision Memo can be accessed directly on the Web at http://ia.ita.doc.gov/frn. The paper copy and electronic version of the Decision Memo are identical in content.
Changes Since the Preliminary Determination
Based on our analysis of the comments received and our findings at verification, we have made certain changes to the margin calculations for JBL Canada Inc. For a discussion of these changes, see the ‘‘Margin Calculations’’ section of the Decision Memo.
Facts Available Section 776(a) of the Act provides that
the Department will apply ‘‘facts otherwise available’’ if necessary information is not available on the record or an interested party: 1) withholds information that has been requested by the Department; 2) fails to provide such information within the deadlines established, or in the form or manner requested by the Department, subject to subsections (c)(1) and (e) of section 782 of the Act; 3) significantly impedes a proceeding; or 4) provides such information, but the information cannot be verified. As stated in the Preliminary Determination, our antidumping questionnaire instructs respondents to report prices and expenses in the currency in which they were incurred. See Preliminary Determination at 73 FR 70327. Nevertheless, in this case, the respondent reported data that had been converted from multiple currencies into Canadian dollars (CAD) in the home market, and into U.S. dollars (USD) in the U.S. market because its company– wide electronic data processing system (SAP) automatically converts all foreign currency transactions into the currency of the respective JBL Group entity at the moment of posting. According to the respondent, the entry of data and the currency conversion is a simultaneous process in its accounting system. As a result, SAP does not retain the original foreign currency amount in the sales database or in the general ledger.4 Based on the respondent’s representation that the currency conversion process is a company–wide procedure that is done in the normal course of business, we accepted the data as reported for the preliminary determination. However, we stated our intention to examine the reasonableness of the price and expense reporting based on this system at verification. See Preliminary Determination at 73 FR 70327.
At verification, we found that the SAP system does maintain a record of the
original currency from which entries were converted and the exchange rate used. Therefore, the price and expense data could have been reported in the original foreign currency amount as incurred. See Sales Verification Report at 4 and 5. Based on our verification findings, we believe that it was possible for the respondent to have reported prices and expenses in the currency in which they were incurred, contrary to the representation in the respondent’s questionnaire responses. For these reasons, we find that it is appropriate to resort to facts otherwise available to account for the unreported information. See, e.g., Canned Pineapple Fruit from Thailand, 68 FR 65247 (November 19, 2003), and accompanying Issues and Decision Memorandum at Comment 20b where the Department applied facts otherwise available to a respondent that did not provide requested information. Therefore, we have determined that the gross unit prices for certain home market customers who were invoiced in USD during the POI (see the Sales Verification Report at Exhibit 4), and all U.S inland freight expenses should be based on facts available in accordance with sections 776(a)(2)(A),(B), and (D) of the Act.5
In selecting from among the facts otherwise available, section 776(b) of the Act authorizes the Department to use an adverse inference if the Department finds that an interested party failed to cooperate by not acting to the best of its ability to comply with a request for information. See, e.g., Notice of Final Results of Antidumping Duty Administrative Review: Stainless Steel Bar from India, 70 FR 54023, 54025–26 (September 13, 2005); see also Notice of Final Determination of Sales at Less Than Fair Value and Final Negative Critical Circumstances: Carbon and Certain Alloy Steel Wire Rod from Brazil, 67 FR 55792, 55794–96 (August 30, 2002). The Statement of Administrative Action provides guidance by explaining that adverse inferences are appropriate ‘‘to ensure that the party does not obtain a more favorable result by failing to cooperate than if it had cooperated fully.’’ See Statement of Administrative Action accompanying the Uruguay Round Agreements Act, H.R. Doc. No. 103–316, Vol. 1, at 870 (1994). Furthermore, ‘‘affirmative evidence of bad faith on the part of a respondent is not required before the Department may make an
VerDate Nov<24>2008 18:51 Apr 10, 2009 Jkt 217001 PO 00000 Frm 00015 Fmt 4703 Sfmt 4703 E:\FR\FM\13APN1.SGM 13APN1

16845 Federal Register / Vol. 74, No. 69 / Monday, April 13, 2009 / Notices
adverse inference.’’ See Antidumping Duties; Countervailing Duties, 62 FR 27296, 27340 (May 19, 1997); see also Nippon Steel Corp. v. United States, 337 F.3d 1373, 1383 (Fed. Cir. 2003) (Nippon). Because: 1) the respondent had the necessary information within its control and it did not report this information; and 2) it failed to put forth its maximum effort to provide the requested information, we find that the respondent failed to cooperate to the best of its ability. Therefore, for the final determination, we are using facts available with an adverse inference and applying it to the gross unit prices of certain home market sales, and to all U.S. inland freight expenses. Specifically, as adverse facts available, we increased both the affected home market sales prices and the U.S. freight expenses by 1.16 percent, i.e., the percentage difference between the Department’s weighted–average POI exchange rate (used to convert comparison–market values to USD in the margin program), and JBLT’s POI average exchange rate (used by JBLT’s SAP system for currency conversion purposes). For further discussion, see Decision Memo at Comment 4 and the April 6, 2009, Memorandum to The File from Case Analyst, entitled ‘‘Calculations Performed for Jungbunzlauer Technology GMBH & Co. KG for the Final Determination in the Antidumping Duty Investigation of Citric Acid and Certain Citrate Salts from Canada.’’
Continuation of Suspension of Liquidation
In accordance with section 735(c)(1)(B) of the Act, we are directing U.S. Customs and Border Protection (CBP) to continue to suspend liquidation of all imports of subject merchandise that are entered or withdrawn from warehouse, for consumption on or after November 20, 2008, the date of publication of the preliminary determination in the Federal Register. We will instruct CBP to continue to require a cash deposit or the posting of a bond for all companies based on the estimated weighted– average dumping margins shown below. The suspension of liquidation instructions will remain in effect until further notice.
Final Determination Margins
We determine that the following weighted–average dumping margins exist for the period April 1, 2007, through March 31, 2008:
Manufacturer/Exporter Weighted Average Margin (percent)
JBL Canada, Inc. .......... 23.21 All Others ...................... 23.21
All–Others Rate Section 735(c)(5)(A) of the Act
provides that the estimated ‘‘All– Others’’ rate shall be an amount equal to the weighted average of the estimated weighted–average dumping margins established for exporters and producers individually investigated, excluding any zero or de minimis margins, and any margins determined entirely under section 776 of the Act. In this investigation the Department calculated a company–specific rate only for JBL Canada Inc. Therefore, for purposes of determining the all–others rate and pursuant to section 735(c)(5)(A) of the Act, we are using the weighted–average dumping margin calculated for JBL Canada, Inc., as referenced above. See, e.g., Notice of Final Determination of Sales at Less Than Fair Value: Stainless Steel Sheet and Strip in Coils From Italy, 64 FR 30750, 30755 (June 8, 1999); and Coated Free Sheet Paper from Indonesia: Notice of Preliminary Determination of Sales at Less Than Fair Value and Postponement of Final Determination,, 72 FR 30753, 30757 (June 4, 2007), unchanged in final determination, Notice of Final Determination of Sales at Less Than Fair Value: Coated Free Sheet Paper from Indonesia, 72 FR 60636 (October 25, 2007).
Disclosure We will disclose the calculations
performed within five days of the date of publication of this notice to parties in this proceeding in accordance with 19 CFR 351.224(b).
International Trade Commission Notification
In accordance with section 735(d) of the Act, we have notified the International Trade Commission (ITC) of our final determination. As our final determination is affirmative, the ITC will determine within 45 days whether imports of the subject merchandise are causing material injury, or threat of material injury, to an industry in the United States. If the ITC determines that material injury or threat of injury does not exist, the proceeding will be terminated and all securities posted will be refunded or canceled. If the ITC determines that such injury does exist, the Department will issue an antidumping duty order directing CBP to assess antidumping duties on all imports of the subject merchandise
entered, or withdrawn from warehouse, for consumption on or after the effective date of the suspension of liquidation.
Return or Destruction of Proprietary Information
This notice will serve as the only reminder to parties subject to administrative protective order (APO) of their responsibility concerning the destruction of proprietary information disclosed under APO in accordance with 19 CFR 351.305(a)(3). Timely written notification of return/ destruction of APO materials or conversion to judicial protective order is hereby requested. Failure to comply with the regulations and the terms of an APO is a sanctionable violation.
We are issuing and publishing this determination and notice in accordance with sections 735(d) and 777(i) of the Act.
Dated: April 6, 2009. Ronald K. Lorentzen, Acting Assistant Secretary for Import Administration.
Appendix--Issues in Decision Memo
Comments Comment 1: Date of Sale and Whether to Exclude U.S. Sales Made Pursuant to Multiyear Contracts Comment 2: Indirect Selling Expenses Comment 3: Home Market Billing Adjustments Comment 4: Currency Conversions Reported for Certain Home Market Sales Prices and U.S. Freight Expenses Comment 5: Electricity Purchased from an Affiliate Comment 6: General and Administrative (G&A) Expense Ratio [FR Doc. E9–8357 Filed 4–10–09; 8:45 am] BILLING CODE: 3510–DS–S
DEPARTMENT OF COMMERCE
Bureau of the Census
2010 Census Advisory Committee
AGENCY: Bureau of the Census, Department of Commerce. ACTION: Notice of public meeting.
SUMMARY: The Bureau of the Census (U.S. Census Bureau) is giving notice of a meeting of the 2010 Census Advisory Committee. The Committee will address policy, research, and technical issues related to 2010 Decennial Census Programs. Last-minute changes to the agenda are possible, which could prevent giving advance notification of schedule changes. DATES: May 7–8, 2009. On May 7, the meeting will begin at approximately
VerDate Nov<24>2008 18:51 Apr 10, 2009 Jkt 217001 PO 00000 Frm 00016 Fmt 4703 Sfmt 4703 E:\FR\FM\13APN1.SGM 13APN1

B-1
APPENDIX B
HEARING WITNESSES

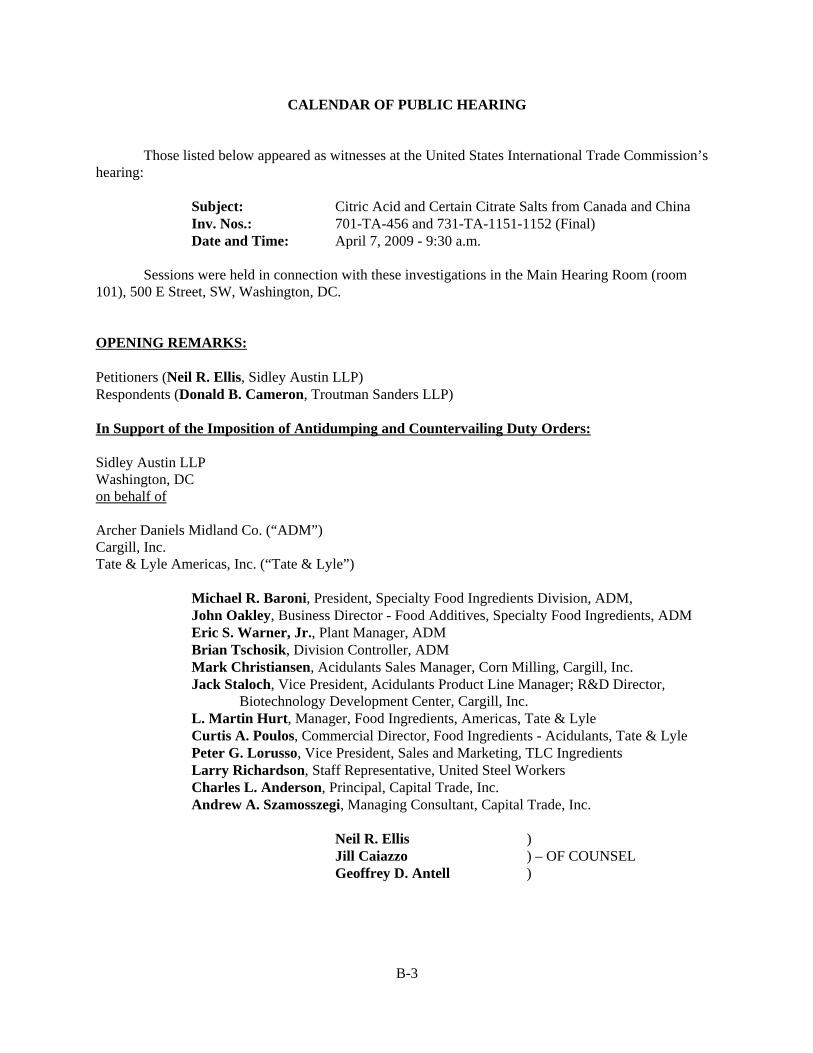
B-3
CALENDAR OF PUBLIC HEARING
Those listed below appeared as witnesses at the United States International Trade Commission’shearing:
Subject: Citric Acid and Certain Citrate Salts from Canada and China Inv. Nos.: 701-TA-456 and 731-TA-1151-1152 (Final)Date and Time: April 7, 2009 - 9:30 a.m.
Sessions were held in connection with these investigations in the Main Hearing Room (room101), 500 E Street, SW, Washington, DC.
OPENING REMARKS:
Petitioners (Neil R. Ellis, Sidley Austin LLP)Respondents (Donald B. Cameron, Troutman Sanders LLP)
In Support of the Imposition of Antidumping and Countervailing Duty Orders:
Sidley Austin LLPWashington, DCon behalf of
Archer Daniels Midland Co. (“ADM”)Cargill, Inc.Tate & Lyle Americas, Inc. (“Tate & Lyle”)
Michael R. Baroni, President, Specialty Food Ingredients Division, ADM, John Oakley, Business Director - Food Additives, Specialty Food Ingredients, ADMEric S. Warner, Jr., Plant Manager, ADMBrian Tschosik, Division Controller, ADMMark Christiansen, Acidulants Sales Manager, Corn Milling, Cargill, Inc.Jack Staloch, Vice President, Acidulants Product Line Manager; R&D Director,
Biotechnology Development Center, Cargill, Inc.L. Martin Hurt, Manager, Food Ingredients, Americas, Tate & LyleCurtis A. Poulos, Commercial Director, Food Ingredients - Acidulants, Tate & LylePeter G. Lorusso, Vice President, Sales and Marketing, TLC IngredientsLarry Richardson, Staff Representative, United Steel WorkersCharles L. Anderson, Principal, Capital Trade, Inc.Andrew A. Szamosszegi, Managing Consultant, Capital Trade, Inc.
Neil R. Ellis )Jill Caiazzo ) – OF COUNSELGeoffrey D. Antell )

B-4
In Opposition to the Imposition of the Antidumping and Countervailing Duty Orders:
Troutman Sanders LLPWashington, DCon behalf of
The Chinese Citric Acid Producers Coalition
Wang Qi, Vice Manager of Asia-Pacific Sales Department, Anhui BBCA BiochemicalCo., Ltd.
Kou Guangzhi, Chairman of the Board, RZBC Co., Ltd.Eric Shao, General Manager, RZBC Import and Export Co., Ltd.Robert W. Bloom, President and CEO, FBC Industries, Inc.
Julie C. Mendoza )Donald B. Cameron ) – OF COUNSELR. Will Planert )Judy Z. Wang )
Vorys, Sater, Seymour and Pease LLPWashington, DCon behalf of
Jungbunzlauer Technology GmbH & Co. KG (“JBL”)
Dan Rainville, President, JBL Inc.Dr. Patrick Magrath, Economist, Georgetown Economic Services
Frederick P. Waite ) – OF COUNSELKimberly R. Young )
Neville Peterson LLPWashington, DCon behalf of
PepsiCo, Inc.
Barry Taylor, Purchasing Director, Pepsi Worldwide Flavors, PepsiCo, Inc.
George Thompson ) – OF COUNSEL

B-5
In Opposition to the Imposition of the Antidumping and Countervailing Duty Orders (Continued):
Lafave AssociatesWashington, DCon behalf of
The Procter & Gamble Manufacturing Co. (“P&G”)
A. Matt Smith, Senior Purchasing Manager, P&GJames Hodges, Purchasing Group Manager, P&GDr. Kenneth Button, Senior Vice President, Economic Consulting Services LLCJennifer Lutz, Senior Economist, Economic Consulting Services LLC
Arthur J. Lafave III ) – OF COUNSEL
Arnold & Porter LLPWashington, DCon behalf of
Reckitt Benckiser Inc.
Klaus Hofmann, Senior Vice President, Global Procurement, Reckitt BenckiserGroup plc
Michael T. Shor ) – OF COUNSEL
Kelley Drye & Warren LLPWashington, DCon behalf of
Vertellus Specialties, Inc.
Tom Pensak, Director, Sales and Marketing, Vertellus Performance Materials, Inc.
Michael J. Coursey ) – OF COUNSEL
CLOSING REMARKS:
Petitioners (Neil R. Ellis, Sidley Austin LLP)Respondents (Frederick P. Waite, Vorys, Sater, Seymour and Pease LLP)


C-1
APPENDIX C
SUMMARY DATA

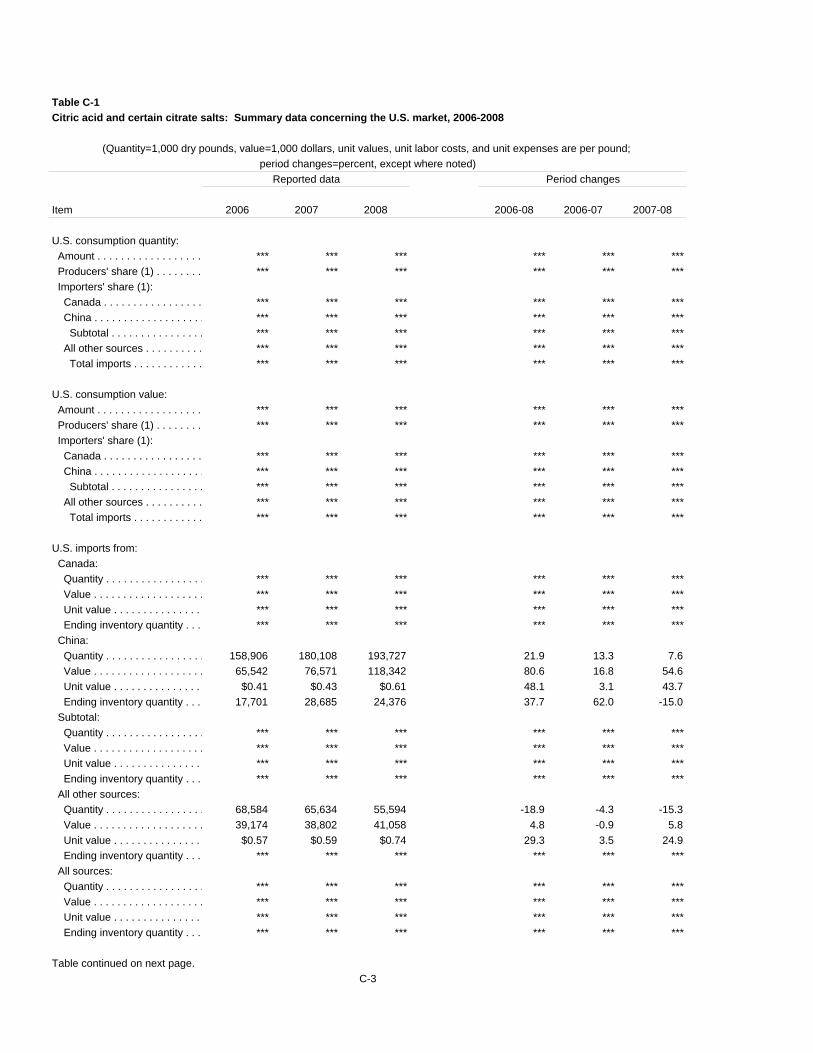
Table C-1Citric acid and certain citrate salts: Summary data concerning the U.S. market, 2006-2008
(Quantity=1,000 dry pounds, value=1,000 dollars, unit values, unit labor costs, and unit expenses are per pound; period changes=percent, except where noted)
Reported data Period changes
Item 2006 2007 2008 2006-08 2006-07 2007-08
U.S. consumption quantity: Amount . . . . . . . . . . . . . . . . . . *** *** *** *** *** *** Producers' share (1) . . . . . . . . *** *** *** *** *** *** Importers' share (1): Canada . . . . . . . . . . . . . . . . . *** *** *** *** *** *** China . . . . . . . . . . . . . . . . . . . *** *** *** *** *** *** Subtotal . . . . . . . . . . . . . . . . *** *** *** *** *** *** All other sources . . . . . . . . . . *** *** *** *** *** *** Total imports . . . . . . . . . . . . *** *** *** *** *** ***
U.S. consumption value: Amount . . . . . . . . . . . . . . . . . . *** *** *** *** *** *** Producers' share (1) . . . . . . . . *** *** *** *** *** *** Importers' share (1): Canada . . . . . . . . . . . . . . . . . *** *** *** *** *** *** China . . . . . . . . . . . . . . . . . . . *** *** *** *** *** *** Subtotal . . . . . . . . . . . . . . . . *** *** *** *** *** *** All other sources . . . . . . . . . . *** *** *** *** *** *** Total imports . . . . . . . . . . . . *** *** *** *** *** ***
U.S. imports from: Canada: Quantity . . . . . . . . . . . . . . . . . *** *** *** *** *** *** Value . . . . . . . . . . . . . . . . . . . *** *** *** *** *** *** Unit value . . . . . . . . . . . . . . . *** *** *** *** *** *** Ending inventory quantity . . . *** *** *** *** *** *** China: Quantity . . . . . . . . . . . . . . . . . 158,906 180,108 193,727 21.9 13.3 7.6 Value . . . . . . . . . . . . . . . . . . . 65,542 76,571 118,342 80.6 16.8 54.6 Unit value . . . . . . . . . . . . . . . $0.41 $0.43 $0.61 48.1 3.1 43.7 Ending inventory quantity . . . 17,701 28,685 24,376 37.7 62.0 -15.0 Subtotal: Quantity . . . . . . . . . . . . . . . . . *** *** *** *** *** *** Value . . . . . . . . . . . . . . . . . . . *** *** *** *** *** *** Unit value . . . . . . . . . . . . . . . *** *** *** *** *** *** Ending inventory quantity . . . *** *** *** *** *** *** All other sources: Quantity . . . . . . . . . . . . . . . . . 68,584 65,634 55,594 -18.9 -4.3 -15.3 Value . . . . . . . . . . . . . . . . . . . 39,174 38,802 41,058 4.8 -0.9 5.8 Unit value . . . . . . . . . . . . . . . $0.57 $0.59 $0.74 29.3 3.5 24.9 Ending inventory quantity . . . *** *** *** *** *** *** All sources: Quantity . . . . . . . . . . . . . . . . . *** *** *** *** *** *** Value . . . . . . . . . . . . . . . . . . . *** *** *** *** *** *** Unit value . . . . . . . . . . . . . . . *** *** *** *** *** *** Ending inventory quantity . . . *** *** *** *** *** ***
Table continued on next page.C-3
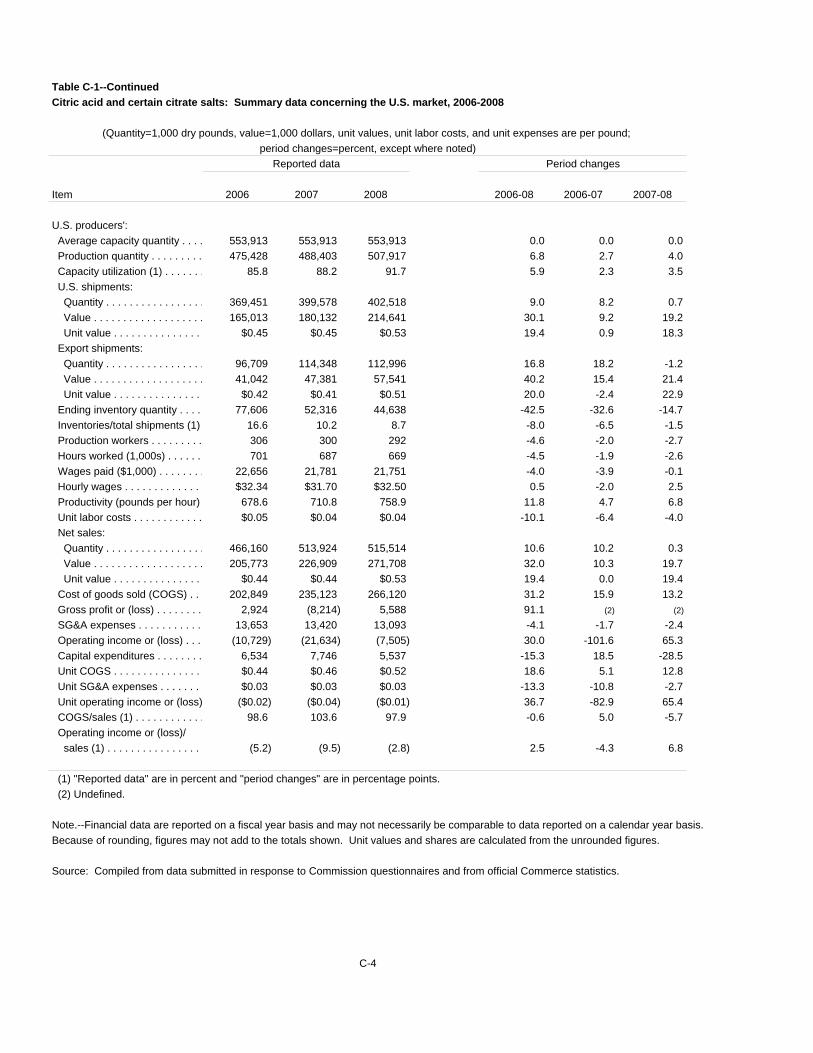
Table C-1--ContinuedCitric acid and certain citrate salts: Summary data concerning the U.S. market, 2006-2008
(Quantity=1,000 dry pounds, value=1,000 dollars, unit values, unit labor costs, and unit expenses are per pound; period changes=percent, except where noted)
Reported data Period changes
Item 2006 2007 2008 2006-08 2006-07 2007-08
U.S. producers': Average capacity quantity . . . . 553,913 553,913 553,913 0.0 0.0 0.0 Production quantity . . . . . . . . . 475,428 488,403 507,917 6.8 2.7 4.0 Capacity utilization (1) . . . . . . . 85.8 88.2 91.7 5.9 2.3 3.5 U.S. shipments: Quantity . . . . . . . . . . . . . . . . . 369,451 399,578 402,518 9.0 8.2 0.7 Value . . . . . . . . . . . . . . . . . . . 165,013 180,132 214,641 30.1 9.2 19.2 Unit value . . . . . . . . . . . . . . . $0.45 $0.45 $0.53 19.4 0.9 18.3 Export shipments: Quantity . . . . . . . . . . . . . . . . . 96,709 114,348 112,996 16.8 18.2 -1.2 Value . . . . . . . . . . . . . . . . . . . 41,042 47,381 57,541 40.2 15.4 21.4 Unit value . . . . . . . . . . . . . . . $0.42 $0.41 $0.51 20.0 -2.4 22.9 Ending inventory quantity . . . . 77,606 52,316 44,638 -42.5 -32.6 -14.7 Inventories/total shipments (1) 16.6 10.2 8.7 -8.0 -6.5 -1.5 Production workers . . . . . . . . . 306 300 292 -4.6 -2.0 -2.7 Hours worked (1,000s) . . . . . . 701 687 669 -4.5 -1.9 -2.6 Wages paid ($1,000) . . . . . . . . 22,656 21,781 21,751 -4.0 -3.9 -0.1 Hourly wages . . . . . . . . . . . . . $32.34 $31.70 $32.50 0.5 -2.0 2.5 Productivity (pounds per hour) 678.6 710.8 758.9 11.8 4.7 6.8 Unit labor costs . . . . . . . . . . . . $0.05 $0.04 $0.04 -10.1 -6.4 -4.0 Net sales: Quantity . . . . . . . . . . . . . . . . . 466,160 513,924 515,514 10.6 10.2 0.3 Value . . . . . . . . . . . . . . . . . . . 205,773 226,909 271,708 32.0 10.3 19.7 Unit value . . . . . . . . . . . . . . . $0.44 $0.44 $0.53 19.4 0.0 19.4 Cost of goods sold (COGS) . . 202,849 235,123 266,120 31.2 15.9 13.2 Gross profit or (loss) . . . . . . . . 2,924 (8,214) 5,588 91.1 (2) (2)
SG&A expenses . . . . . . . . . . . 13,653 13,420 13,093 -4.1 -1.7 -2.4 Operating income or (loss) . . . (10,729) (21,634) (7,505) 30.0 -101.6 65.3 Capital expenditures . . . . . . . . 6,534 7,746 5,537 -15.3 18.5 -28.5 Unit COGS . . . . . . . . . . . . . . . $0.44 $0.46 $0.52 18.6 5.1 12.8 Unit SG&A expenses . . . . . . . $0.03 $0.03 $0.03 -13.3 -10.8 -2.7 Unit operating income or (loss) ($0.02) ($0.04) ($0.01) 36.7 -82.9 65.4 COGS/sales (1) . . . . . . . . . . . . 98.6 103.6 97.9 -0.6 5.0 -5.7 Operating income or (loss)/ sales (1) . . . . . . . . . . . . . . . . (5.2) (9.5) (2.8) 2.5 -4.3 6.8
(1) "Reported data" are in percent and "period changes" are in percentage points. (2) Undefined.
Note.--Financial data are reported on a fiscal year basis and may not necessarily be comparable to data reported on a calendar year basis.Because of rounding, figures may not add to the totals shown. Unit values and shares are calculated from the unrounded figures.
Source: Compiled from data submitted in response to Commission questionnaires and from official Commerce statistics.
C-4
C-5
Table C-2Citric acid: Summary data concerning the U.S. market, 2006-2008
* * * * * * *
Table C-3Sodium citrate: Summary data concerning the U.S. market, 2006-2008
* * * * * * *Table C-4Potassium citrate: Summary data concerning the U.S. market, 2006-2008
* * * * * * *


D-1
APPENDIX D
LARGEST PURCHASERS’ DATA ON BIDS AND PRICES

D-2
D-3
MAJOR U.S. PURCHASERS’ BID INFORMATIONTable D-1Citric acid and certain citrate salts: Information on the three largest bids of U.S. purchasers ofmore than 20 million pounds in one year, 2006-2008
* * * * * * *
Reasons for choosing the supplier(s) of the winning bid(s):
* * * * * * *

D-4
Table D-2Citric acid and certain citrate salts: Weighted-average delivered prices and quantities reported bypurchasers of domestic and imported product 1,1 by spot and contract purchases, and by quarters,January 2006-December 2008
Period
United States Canada China
Price(per pound)
Quantity(1,000 drypounds)
Price(per pound)
Quantity(1,000 drypounds)
Price(per pound)
Quantity(1,000 drypounds)
Spot purchases2006: Jan.-Mar. $*** *** $*** *** $*** *** Apr.-June -- 0 *** *** *** *** July-Sept. *** *** *** *** *** *** Oct.-Dec. *** *** *** *** *** ***2007: Jan.-Mar. *** *** *** *** *** *** Apr.-June *** *** *** *** *** *** July-Sept. *** *** *** *** *** *** Oct.-Dec. *** *** *** *** *** ***2008: Jan.-Mar. *** *** *** *** *** *** Apr.-June *** *** *** *** *** *** July-Sept. *** *** *** *** *** *** Oct.-Dec. *** *** *** *** *** ***
Contract purchases2006: Jan.-Mar. 0.53 10,160 *** *** -- 0 Apr.-June 0.52 11,407 *** *** -- 0 July-Sept. 0.53 11,842 *** *** -- 0 Oct.-Dec. 0.54 9,503 *** *** -- 02007: Jan.-Mar. 0.57 11,440 *** *** -- 0 Apr.-June 0.54 13,701 *** *** -- 0 July-Sept. 0.57 12,085 *** *** -- 0 Oct.-Dec. 0.57 12,081 *** *** -- 02008: Jan.-Mar. 0.53 13,535 *** *** *** *** Apr.-June 0.52 14,933 *** *** *** *** July-Sept. 0.52 13,842 *** *** *** *** Oct.-Dec. 0.52 13,309 *** *** *** *** 1 Citric acid, granular, in dry form in 25-kilogram and 50-pound bags.
Source: Compiled from responses to Commission questionnaires.

D-5
Table D-3Citric acid and certain citrate salts: Weighted-average delivered contract prices and quantitiesreported by purchasers of domestic and imported products 2 and 3, by quarters, January2006-December 2008
* * * * * * *

D-6
Table D-4Citric acid and certain citrate salts: Weighted-average delivered prices and quantities reported bypurchasers of domestic and imported products 4 and 5,1 by quarters, January 2006-December 2008
Period
United States China Nonsubject
Price(per pound)
Quantity(1,000 drypounds)
Price(per pound)
Quantity(1,000 drypounds)
Price(per pound)
Quantity(1,000 drypounds)
Product 42006: Jan.-Mar. $0.47 1,371 $*** *** $*** *** Apr.-June 0.47 1,696 *** *** *** *** July-Sept. 0.47 1,706 *** *** *** *** Oct.-Dec. 0.47 1,226 *** *** *** ***2007: Jan.-Mar. 0.49 1,454 -- 0 *** *** Apr.-June 0.51 1,889 *** *** *** *** July-Sept. 0.50 1,596 *** *** *** *** Oct.-Dec. 0.50 1,541 *** *** *** ***2008: Jan.-Mar. 0.54 1,527 -- 0 *** *** Apr.-June 0.55 1,772 *** *** *** *** July-Sept. 0.55 1,615 *** *** *** *** Oct.-Dec. 0.54 1,460 *** *** *** ***
Product 52006: Jan.-Mar. *** *** *** *** -- 0 Apr.-June *** *** *** *** -- 0 July-Sept. *** *** *** *** -- 0 Oct.-Dec. *** *** *** *** -- 02007: Jan.-Mar. *** *** *** *** -- 0 Apr.-June *** *** *** *** -- 0 July-Sept. *** *** *** *** -- 0 Oct.-Dec. *** *** *** *** -- 02008: Jan.-Mar. *** *** *** *** -- 0 Apr.-June *** *** *** *** -- 0 July-Sept. *** *** *** *** -- 0 Oct.-Dec. *** *** *** *** -- 0 1 Product 4 is sodium citrate, granular, in dry form in 25-kilogram and 50-pound bags, and product 5 is potassiumcitrate, granular, in dry form in 25-kilogram and 50-pound bags.
Source: Compiled from responses to Commission questionnaires.