citizens’ environmental monitoring program water quality
TRANSCRIPT

Citizens’ Environmental Monitoring Program
Water Quality Monitor Training

Training Objectives
Day 1WhatWhy
Days 2 & 3How

•The concept of a “waterkeeper” •Waterkeeper Alliance
•Cook Inletkeeper began in 1995
Vision:Cook Inletkeeper works to guarantee clean water for:
Abundant Fish and Wildlife Strong Communities
Lasting Jobs Renewable Energy
Public Property Rights
Mission:To protect
Alaska’s Cook Inlet watershed and
the life it sustains

WatershedsA watershed is the area of land from which runoff (from rain, snow, and springs) drains to a stream, river, lake, or other body of water. Its boundaries can be identified by locating the highest points of lands around the water body.
Cross section of a watershed

The Cook Inlet watershed covers over 39,000 square miles of Southcentral Alaska. Melting snow and ice from mount McKinley, the Chugach Mountains and the Aleutian Range drains into rivers such as the Susitna, Matanuska and Kenai, which feed the productive waters of Cook Inlet.
The Cook Inlet
Watershed

CEMP: Citizens’ Environmental Monitoring Program
• Goals and Objectives:– Inventory baseline water quality in the waters
of Cook Inlet Basin– Detect and report significant changes and
track water quality trends– Raise public awareness of the importance of
water quality through hands on involvement

Citizen InvolvementOver 500 citizens trained

CEMP Partnership
Homer Soil and Water Conservation District KENAI WATERSHED
FORUM
Wasilla Soil & WaterConservation District
Upper Susitna Soil & Water Conservation
District

CEMP Partnership
CEMP Monitoring Partners:
Resurrection Bay Conservation Alliance, Anchorage Waterways Council, Mat-Su Lake Monitoring, Wasilla SWCD, Upper Susitna SWCD
CEMP Outreach Partners:
Homer SWCD, Kenai Watershed Forum
CEMP Technical Partners:
UAA Environment and Natural Resources Institute (ENRI)

Baseline Data: A long term success story!
Baseline ReportsFilling in the gaps:
- Water quality monitoring
- Bioassessments
- Habitat Assessments
- GIS Analysis
- Invasive plant surveys
- Temperature monitoring

Bioassessment = BUGS!
We monitor 5 sites twice a year – once in June and again in August!

The Living Stream Environment
Human activities shape and alter many of these stream characteristicsHomes, farms, other developments
Septic systems/outhouses, rural runoff, increase in impervious surfacesTowns and cities – urban runoffLogging, mining, gravel extraction activities
Components of the stream system
A healthy stream is a busy place.
•Wildlife and birds•Vegetation •Fish •Insects and other macro invertebrates

CEMP Monitoring
SitesAnchor River watershed:Beaver Creek Ruby Creek Two Moose Bridge Creek
Kachemak Bay watershed:Woodard Creek Bidarka CreekMariner Creek Palmer Creek/Beluga SloughFritz Creek McNeil CanyonRice Creek Miller CreekDiamond Creek

Site Selection
• Representative• Safely and
reasonably accessible
• Prioritization based on uses, database needs, and potential threats

Two Moose Creek

Ruby Creek

“No Name” Creek

Beaver Creek

Bridge Creek

Lower and Upper Diamond Creek

Bidarka Creek

Upper and Lower Woodard Creek

Palmer Creek

Miller Creek

Upper and Lower Fritz Creek

Rice Creek

McNeil Creek
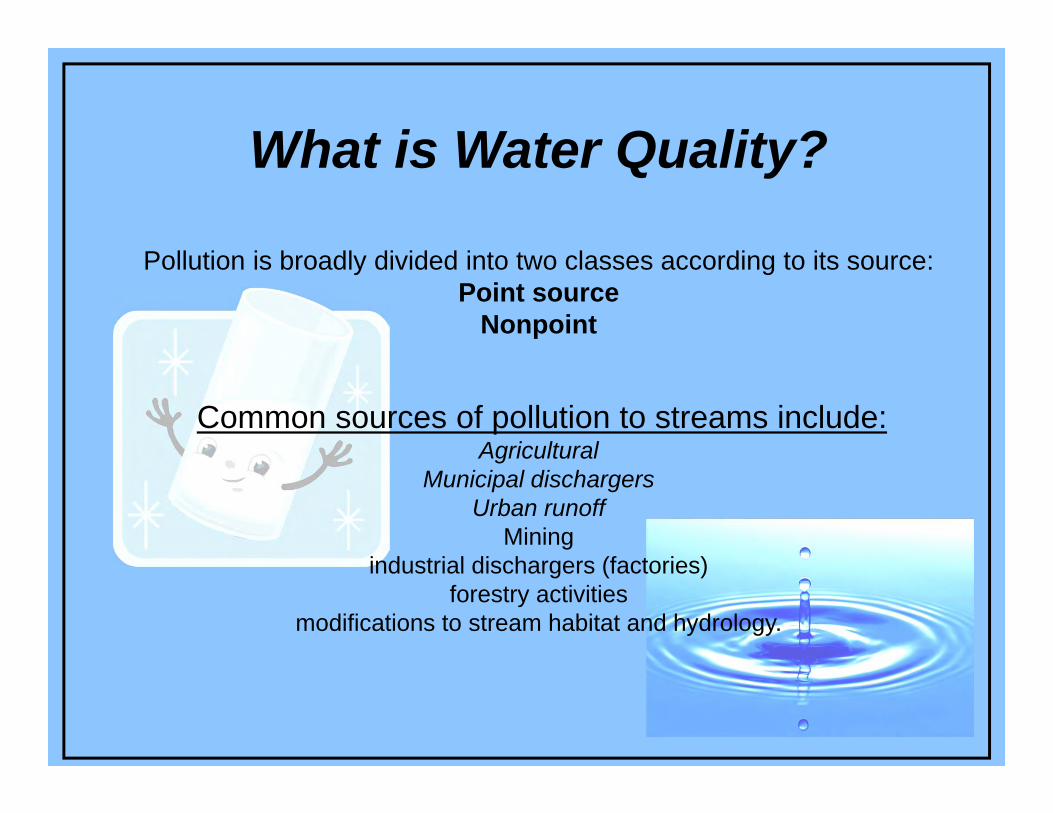
What is Water Quality?
Pollution is broadly divided into two classes according to its source:Point source
Nonpoint
Common sources of pollution to streams include: Agricultural
Municipal dischargersUrban runoff
Miningindustrial dischargers (factories)
forestry activitiesmodifications to stream habitat and hydrology.

What We Monitor
• Chemical • Biological• Physical

WHY DO WE MONITOR WATER QUALITY?
The Need for Monitoring• The federal Clean Water Act of 1972• The single largest factor limiting our ability to
make intelligent policy decisions is not having sufficient information (i.e. hard data).
• Growth in population and its associated pressures on water quality and natural resources
• The federal and state agencies charged with monitoring and protecting water quality have found it increasingly difficult to fulfill their mandates.

Water quality monitoring can be used for many purposes:To identify whether waters are meeting designated uses.
To identify specific pollutants and sources of pollution.To determine trends.
To screen for impairment.Source Common Associated Indicators
Cropland Turbidity, phosphorus, nitrates, temperature, conductivity
Forestry harvest Turbidity, temperature, conductivity
Grazing land Fecal bacteria, turbidity, phosphorus, nitrates, temperature
Industrial discharge Temperature, conductivity, toxics, pH
Mining pH, alkalinity, conductivity
Septic systems Fecal bacteria, nitrates, phosphorus, dissolved oxygen/ biochemical oxygen demand, conductivity, temperature
Sewage treatment plants Dissolved oxygen and biochemical oxygen demand, turbidity, conductivity, phosphorus, nitrates, fecal bacteria, temperature, pH
Construction Turbidity, temperature, dissolved oxygen and biochemical oxygen demand, conductivity, and toxics
Urban runoff Turbidity, phosphorus, nitrates, temperature, conductivity, dissolved oxygen and biochemical oxygen demand

Some Types of Water Quality Monitoring• Baseline Monitoring
• Compliance and Enforcement Monitoring
Sampling Schedule• Samples are to be taken on the second and last
Sundays May - August and on the last Sunday September - April for a total of 16 x per year.
• 2:00 PM.
• The quality of the data collected by our program depends on regular and consistent monitoring

The following are some basic common sense safety rules. At the site:
Always let someone else know where you are, when you intend to return
Complete a volunteer form.
If you drive, park in a safe location. Be sure your car doesn't pose a hazard to other drivers.
Never cross private property without the permission of the landowner.
Watch for wildlife and insects. Know what to do if you get bitten or stung.
Never drink the water in a stream. After monitoring, wash your hands with antibacterial soap.
If the water appears to be severely polluted, contact the Monitoring Coordinator.
Disturb streamside vegetation as little as possible.
If at any time you feel uncomfortable about the condition of the stream or your surroundings, stop monitoring and leave the site at once. Your safety is more important than the data!
Safety

• Precision & Accuracy
• Training & Recertification– DQO
• Site visits & Split samples
• Data Management
Quality Control & Assurance
(www.mathworks.com)

• Quality Management Plan– Guiding Umbrella Document for CEMP Partnership
• Standard Operating Procedures (SOPs)• Quality Assurance Project Plan(s) (QAPP)
– Field Procedures Manual – Standard Operating Procedures (SOPs)
• Data Management– Access Database – Quarterly newsletters & Annual report
Quality Assurance Plans

What and WhyField Observations•Air Temperature
•Wind & Weather
•Water Surface & Substrate
•Comments & Observations
•Photos & Sketches
Water Quality Parameters•Color
•Turbidity (Clarity)
•Water Temperature
•pH
•Conductivity
•Dissolved Oxygen
•Coliform Bacteria

Recording your data
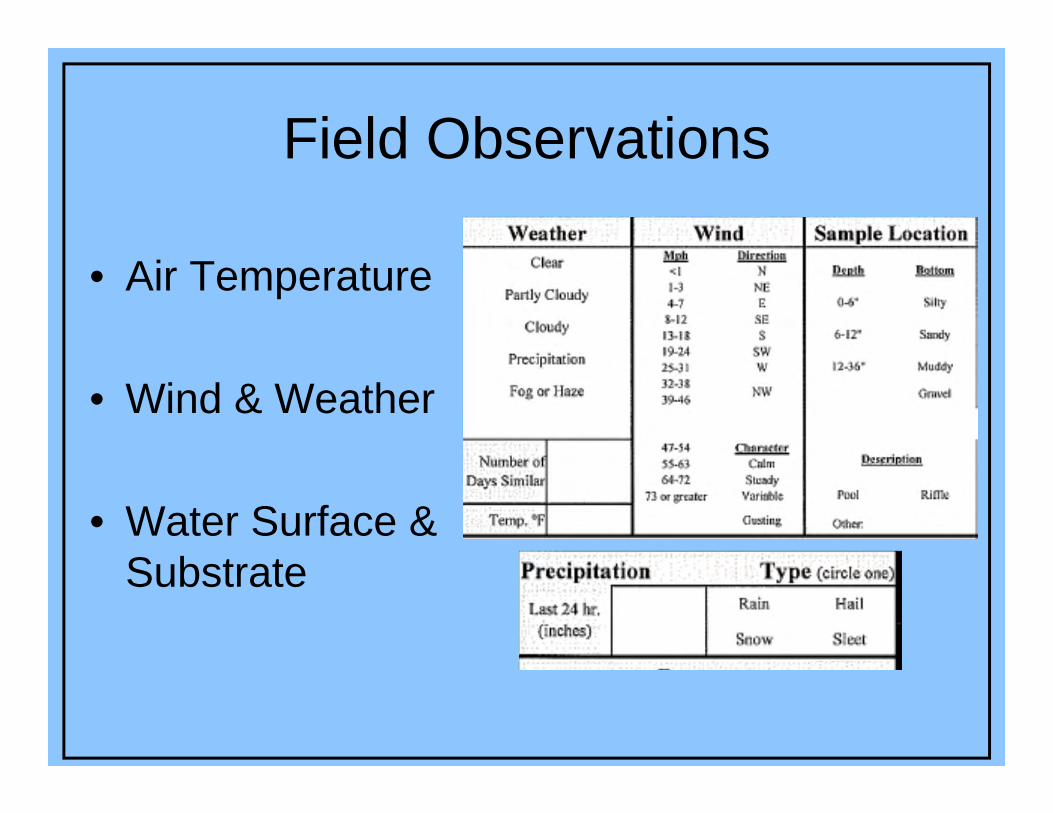
Field Observations
• Air Temperature
• Wind & Weather
• Water Surface & Substrate

Comments & Sketches…

Site Photos
• New system this year – quarterly photos• Inletkeeper has a Flickr site for storage
Water Quality Parameters
• Color• Turbidity (Clarity)• Water Temperature• pH• Conductivity• Dissolved Oxygen• Coliform Bacteria

Color•Apparent color results from dissolved substances and suspended matter
•General but useful!
•CEMP utilizes your descriptive observations of apparent color as well as the BCS#(s)

Turbidity (clarity)• Turbidity is a measure of
how much material suspended in the water decreases the passage of light through it
• Many affects on overall stream health

Water Temperature• Many factors influence
water temperature– Air temperature– Stream flow– Riparian vegetation– Human inputs
• Affects– Rate of photosynthesis– Organisms metabolic
processes – Distribution of aquatic
life– Dissolved oxygen
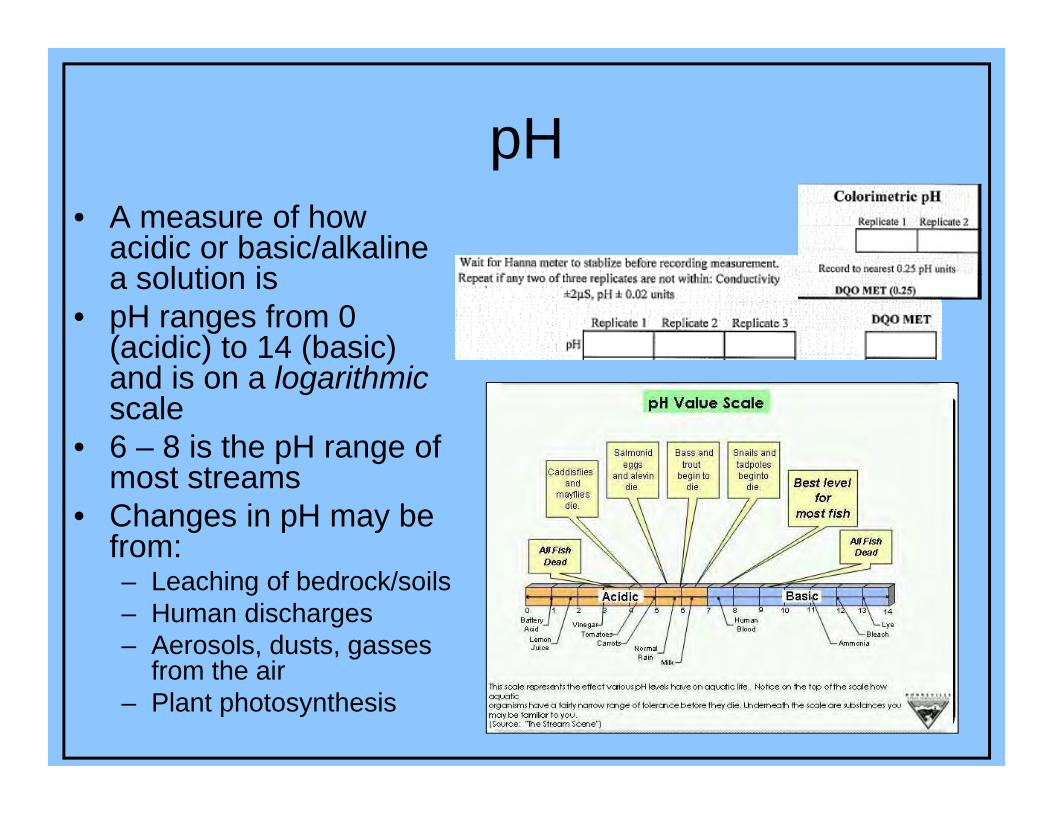
pH• A measure of how
acidic or basic/alkaline a solution is
• pH ranges from 0 (acidic) to 14 (basic) and is on a logarithmic scale
• 6 – 8 is the pH range of most streams
• Changes in pH may be from:– Leaching of bedrock/soils– Human discharges– Aerosols, dusts, gasses
from the air– Plant photosynthesis

Conductivity• The conductance of
water (µS/cm) = total dissolved solids
• Chloride, nitrate, sulfate, phosphate, sodium, magnesium, calcium, iron, aluminum
• Geology & human inputs will change conductivity

Dissolved Oxygen• One of the most
important indicators!• Concentration (mg/l) of
oxygen dissolved in the water
• Saturation & biological oxygen demand
• Influences on DO:– Temperature– Wind & waves– Aquatic plants– Urban, agricultural,
organic waste discharges– Dams

Coliform Bacteria
• Indicator bacteria of sewage pollution – Fecal coliform– E. coli
• Easier & far cheaper to monitor than pathogenic bacteria
• Urbanization, development, and increased population can all increase bacteria levels

Volunteer Monitor Responsibilities
TRAINING
SAFETY
MONITORING SCHEDULE
FIELD PROCEDURES
DATA MANAGEMENT

RESPONSE
KIT MANAGEMENT
CHEMICAL WASTE MANAGEMENT
PERFORMANCE STANDARD
REPLICATE ANALYSIS
Volunteer Monitor Responsibilities (Cont.)

Monitoring Kits

When using chemicals:
Know your equipment, sampling instructions, and procedures before going out into the field.
Prepare labels and clean equipment before you get started.
Keep all equipment and chemicals away from small children. Many of the chemicals used in monitoring are poisonous.
Avoid contact between chemical reagents and skin, eye, nose, and mouth.
Never use your fingers to stopper a sample bottle (e.g., when you are shaking a solution).
Wear safety goggles when performing any chemical test or handling preservatives.
Know chemical cleanup and disposal procedures.
Wipe up all spills when they occur.
Return all unused chemicals to your program coordinator for safe disposal.
Close all containers tightly after use. Do not switch caps.
Know how to use and store chemicals.
Do not expose chemicals or equipment to temperature extremes or longterm direct sunshine.

Basic Equipment for Field Sampling
Listed below is some basic equipment appropriate for any volunteer field activity.
•Boots or waders•“Field Clothes” - long sleeves and pants are best •Rubber gloves•Insect repellent/sunscreen •Drinking water •Clipboard•Several pencils •Tape measure •Thermometer •Field data sheet •Camera and film, to document particular conditions

Questions?