citizens advisory committee...
TRANSCRIPT
Citizens Advisory Committee PresentationPresentation
CSO Long Term Control PlanSewer System Baseline Conditions
October 7, 2009

Outline
Model development– Software overview
– Model extentsModel extents
– Design rainfall
C lib tiCalibrationBaseline conditions

Sewer Modeling Process
State-of-the-art EPA SWMM 5 softwareFour models: Albany North, Albany South,Rensselaer, and TroyModels based on sewer plans, GIS, and fieldinspectionspCalibrated to 2008 flow metering

SWMM Process Models
Evaporation / InfiltrationPrecipitation Surface Runoff
Snow
Buildup Washoff
GroundwaterSanitary Flow Channel, Pipe, &St R tiSanitary Flow
RDII Treatment /
Storage Routing
RDII Treatment /Diversion

SWMM Runoff Modeling

SWMM Hydraulic Modeling

Model components
Pipe hydraulicsDry weather flow– Sanitary wastewater
– Base infiltration
Runoff hydrologyRunoff hydrology– Combined drainage
S it i filt ti /i fl– Sanitary sewer infiltration/inflow
– Direct drainage connections

HydraulicsModeled pipesModeled pipes– All CSO regulators
– All interceptors
– Principal trunk sewers
Pump stations, WWTPs, real-time controlsHudson River stage boundaryHudson River stage boundary
R l Bi C R l t 2Rule Big_C_Regulator_2If Node Scso_017R Depth = 2.58Then Orifice Big_C_Gate Setting = 0.87

Dry Weather Flow2.5
Average sanitary and baseflow 1.5
2.0
Diurnal patternsBaseflow variation
1.0Jan Apr Jul Oct
1.53.5
0.5
1.0
2.5
3.0
0.012 AM 6 AM 12 PM 6 PM 12 AM
2.0
1.5Sun 12 AM Sun 12 PM Mon 12 AM Mon 12 PM Tue 12 AM

Hydrology
All areas tributary to ACSD-N, ACSD-S and RCSD WWTPsRCSD WWTPsDynamically simulate:– runoff to combined sewers
– infiltration / inflow into sanitary sewers
– upstream drainage entering sewer system

Model Extents

Sewersheds

Albany North Model
600 pipes68 catchments24 CSOs24 CSOs13 pump stationsIncludes Patroons Creek Interceptor

Albany South Model
220 pipes30 catchments20 regulators12 CSOs12 CSOsTidal influenceSignificant I/I below Big C

ACSD Interceptor ProfilesHudson River
Beaver Creek

Rensselaer Model
90 pipes17 catchments9 CSOs9 CSOsAiken, Forbes PSCSOs to tidal zoneConsiderable separation

Troy Model
470 pipes470 pipes100 catchments49 CSOs106th, Monroe St. PSCSOs above and below Federal DamSanitary flows from Schaghticoke, Brunswick, and g , ,North Greenbush

RCSD Interceptor Profile

Representative Period Selection
5-year period for long-term CSO statistics– average precipitation
– wet and dry years
– storm depths and frequencies

A A l P i it ti b D d43
Average Annual Precipitation by Decade
41
4243
41
43
41
39 39
41
38 38
3940
3837
3736
3736
33
1830 1850 1870 1890 1910 1930 1950 1970 1990

Annual Precipitation 1985-1989
Year Precipitation (inches) Percentile
1985 30 0 13%1985 30.0 13%
1986 44.0 86%
1987 39 3 68%1987 39.3 68%
1988 29.6 10%
1989 39.7 72%
5‐year average 36.5
Long‐term mean 36.8

Storm Depth Histograms 1985-1989
Year ≥0.25” ≥0.50” ≥0.75” ≥1.0” ≥1.5” ≥2.0” ≥2.5”
1985 33 20 12 6 2 0 0
1986 40 29 20 18 5 3 2
1987 41 25 19 11 4 3 21987 41 25 19 11 4 3 2
1988 33 20 13 7 1 1 1
1989 44 27 19 12 6 1 01989 44 27 19 12 6 1 0
5‐year average 38 24 17 11 3.6 1.6 1.0
L 41 24 15 8 3 4 1 3 0 7Long‐term mean 41 24 15 8 3.4 1.3 0.7

River Stage Stage/discharge at Green IslandStage/discharge at Green Island
22
18
20
Albany tide gage
16Jan 07 Feb 07 Mar 07 Apr 07 May 07 Jun 07
Albany tide gage
6
8
10
2
0
2
4
-2Jan 07 Feb 07 Mar 07 Apr 07 May 07 Jun 07
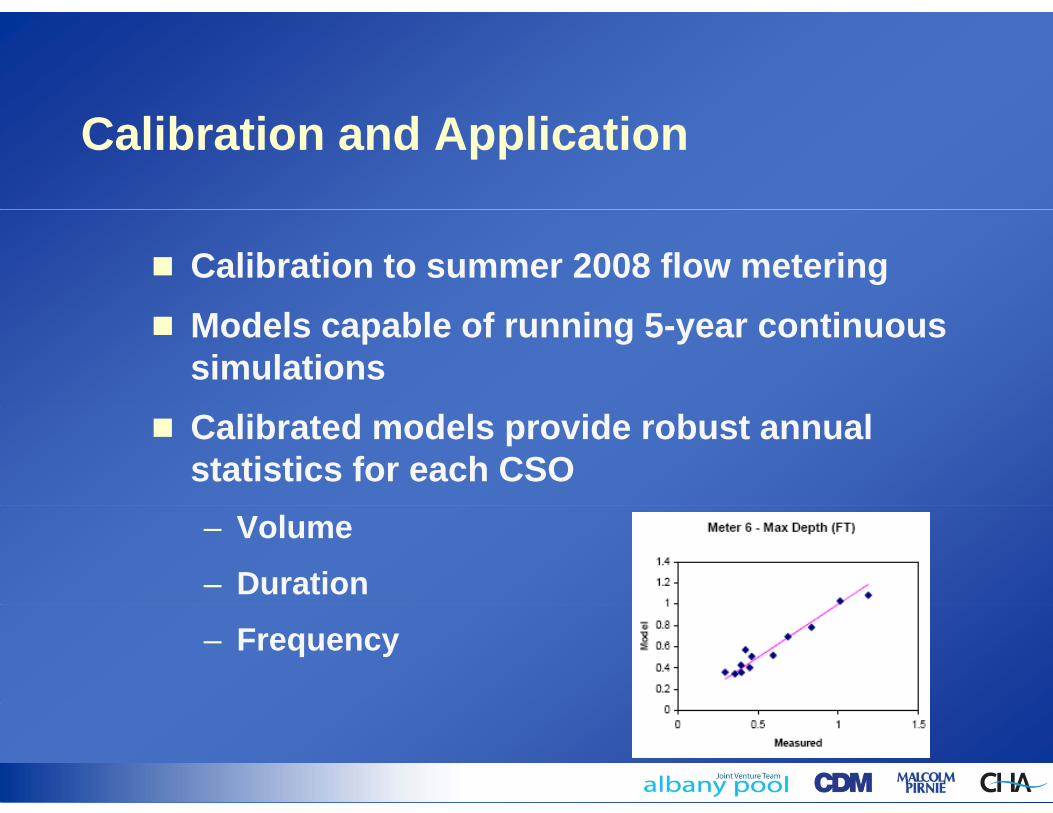
Calibration and Application
Calibration to summer 2008 flow meteringModels capable of running 5-year continuous simulations Calibrated models provide robust annual statistics for each CSO– Volume
– Duration
– Frequency

2008 Metering RainfallDate Rennselaer Troy Cohoes Albany Airporty y pJune 6 1.9 2.3 2.2 1.9 1.8June 16 1.3 1.1 1.2 1.0 1.4July 13 0.7 0.8 1.2 0.8 1.1
18
20
yJuly 23 2.6 2.9 2.7 2.8 3.5July 27 1.1 0.4 0.6 0.4 0.2August 2 1.2 0.7 0.1 1.4 0.4
12
14
16
gAugust 7 1.8 0.4 0.1 1.8 0.1August 11 3.0 1.5 1.4 1.0 1.5September 6 1.6 1.4 1.4 1.3 8
10
12
p
4
6
8
0
2
Jun 6 Jul 6 Aug 5 Sep 4

Calibration Methodology
Discharge volumeTiming of hydrographsPeak flowsWater levelsVelocityVelocity

2008 Metering Data
Flow meteringWWTP flow dataRiver stage above and below dam

September 6, 2008 storm0 4
.11
.22
01 .04.09 .09
.14 .15.19
.14.2
.13 .1.02 01
0.1
0.2
0.3
0.4Rennselaer 1
0.4 Troy 2
.01 .02 .010.0
4 5 6 7 8 9 10 11 12 13 14 15 16 17 18 19 20 21 22 23 24 25 26 27 28
Hours since 9/6 12 AM
.03
.25
.01 .01 .01 .02.06
.11 .14 .12 .14.1
.16
.07 .1.04 .01 .01
0 0
0.1
0.2
0.3Troy 2
.215 14 15
.24
0 2
0.3
0.4 Cohoes 3
0.0
.06 .03 .02 .04 .04.1
.15 .14 .15.1
.05.09
.020.0
0.1
0.2
0 4
.06
.25
03 04.08
.13 .16.12
.08
.16
05 040 1
0.2
0.3
0.4 Albany Airport
.06.02 .01 .01 .03 .04 .05 .04 .01 .02 .01
0.0
0.1

Calibration Hydrographs

All Storms ScatterplotsMeter - ACSD_S-01 - Volume (MG) Meter - ACSD_S-01 - Peak Flow (MGD)
80
100
120
140
led
50
60
70
80
90
led
0
20
40
60Mod
el
0
10
20
30
40
50
Mod
el
0
0 20 40 60 80 100 120Measured
0
0 20 40 60 80Measured
Meter - ACSD_S-01 - Max Depth (FT) Meter - ACSD_S-01 - Max Velocity (FPS)
10
12
14
16
18
ed 3
3.5
4
4.5
5le
d
0
2
4
6
8
10
Mod
ele
0
0.5
1
1.5
2
2.5
Mod
el
0
0 5 10 15Measured
3.2 3.4 3.6 3.8 4Measured

Baseline Conditions
CSO statistics by systemMost active CSOsCommunity-specific issues

Regional CSO
City MG/year
Buffalo 4 000Buffalo 4,000
Albany 1,251
Hartford 1,040
Syracuse 690
S i fi ld 630Springfield 630

Albany Pool Annual CSO
S t MG/ H E t % C tSystem MG/year Hours Events % CaptureAlbany North 30 380 61 91Albany South 753 640 58 63Rensselaer 20 190 52 88Troy 448 720 65 67Total 1251

Albany North - Most Active CSOsLocation SPDES Mgal Hours EventsLocation SPDES Mgal Hours EventsLittle C 008 8.6 30 117th Street 4.5 330 44Mohawk Street 007 4.2 380 21Swan Street 4.0 209 41C i l A 005 2 9 23 11Continental Ave 005 2.9 23 11
Five CSOs active ≥40 events/yearFive CSOs active ≥40 events/year
S t I Alb N thSystem Issues: Albany North
Cohoes, Green Island, and Watervliet compete with separate sanitary contributors for Hudson Ri I t t itRiver Interceptor capacityCapacity of 42-inch Cohoes Interceptor 13 pump stations, some with capacity limitationsMultiple high frequency, low volume CSOs

Most Active CSOs – Albany SouthMost Active CSOs Albany South
Location SPDES Mgal Hours EventsLocation SPDES Mgal Hours Events
Big C 017 547 513 48
kBouck 013 94 637 58Maiden/ Orange/ Steuben 029 48 496 56Steuben 029 48 496 56Livingston/ Jackson/ Quackenbush 031 36 260 55QDivision/ State/ Hudson 025 19 213 42

System Issues: Albany SouthCombined sewers serve 75% of ACSD-S areaCombined sewers serve 75% of ACSD S areaAnecdotal evidence of widespread floodingT tf ll t f 85% f CSOTwo outfalls account for 85% of CSO– Big C (017) 72%– Bouck (013) 13%
High overflow frequency everywhereHigh overflow frequency everywherePeak flows far exceed WWTP capacity

Most Active CSOs – Rensselaer
Location SPDES Mgal Hours EventsColumbia/ /Second 003 8.5 109 41
Partition 006 5.6 192 40Partition 006 5.6 192 40Central/ Barnet 010 3.2 158 52
Fowler 007 1.8 108 42
Belmore 002 0 5 39 27Belmore 002 0.5 39 27

System Issues: Rensselaer
Low CSO volume, but high frequencyPump station and force main constraints

Most Active CSOs – TroyL ti SPDES MG l H E tLocation SPDES MGal Hours Events
Liberty 035 55 518 53
State 031 54 414 52
Hoosick 024 25 99 33Hoosick 024 25 99 33
Adams 037 25 346 50
Jacob 026 23 429 62
Federal 027 19 217 51
• Four CSOs active 500-700 hours/y• 17 CSOs ≥50 events/y

System Issues: Troy
Two confirmed and three unconfirmed DWOlocations identifiedlocations identifiedRCSD regulator modifications have beenidentified to eliminate DWOsidentified to eliminate DWOsPump station constraintsRiver inflowStream connections

Findings
1,250 MG CSO per year, mostly in Troy andAlbany South systemsLimited opportunities for optimizationFew low-cost solutionsDWOs in Troy; BMP solutions identified
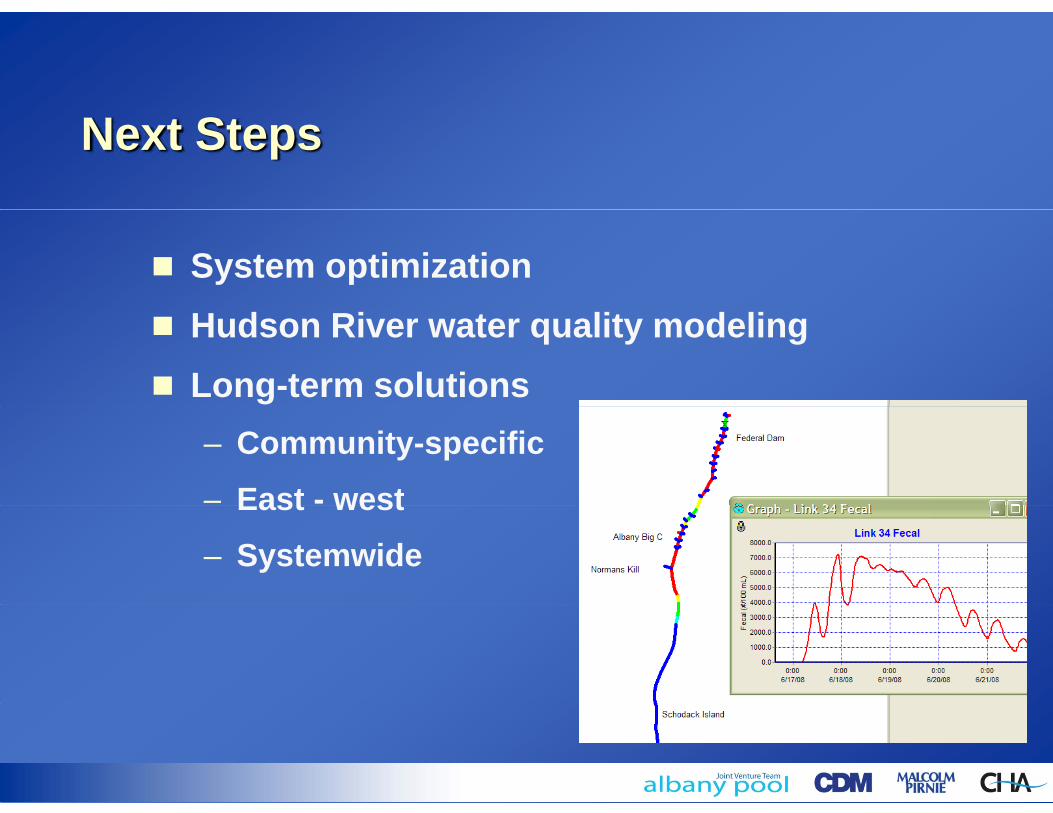
Next Steps
System optimizationHudson River water quality modelingLong-term solutions– Community-specific
– East - westEast west
– Systemwide