citigroup october 19, 2006 - third quarter financial supplement
TRANSCRIPT
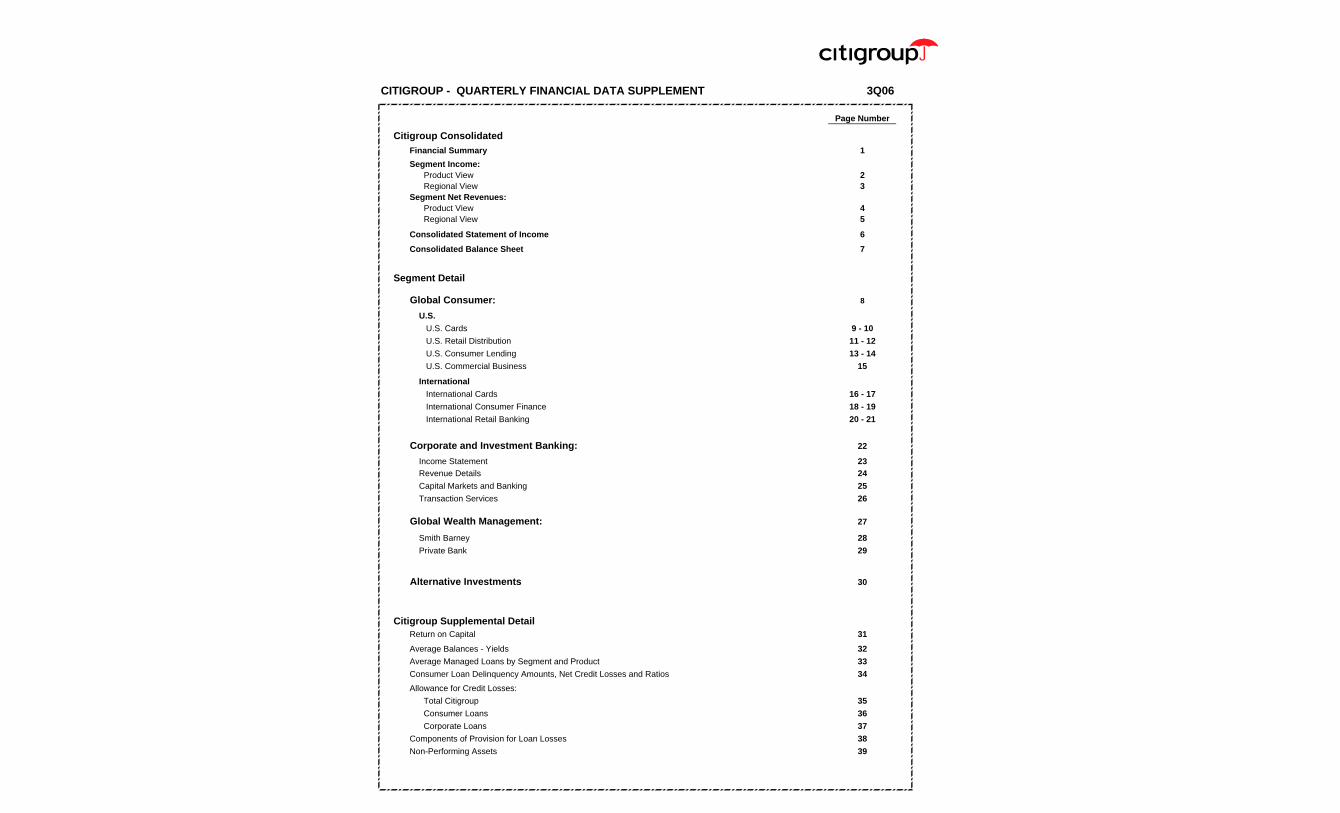
CITIGROUP - QUARTERLY FINANCIAL DATA SUPPLEMENT 3Q06
Page Number
Citigroup Consolidated Financial Summary 1Segment Income: Product View 2 Regional View 3Segment Net Revenues: Product View 4 Regional View 5
Consolidated Statement of Income 6
Consolidated Balance Sheet 7
Segment Detail
Global Consumer: 8
U.S. U.S. Cards 9 - 10 U.S. Retail Distribution 11 - 12 U.S. Consumer Lending 13 - 14 U.S. Commercial Business 15
International International Cards 16 - 17 International Consumer Finance 18 - 19 International Retail Banking 20 - 21
Corporate and Investment Banking: 22
Income Statement 23Revenue Details 24Capital Markets and Banking 25Transaction Services 26
Global Wealth Management: 27
Smith Barney 28Private Bank 29
Alternative Investments 30
Citigroup Supplemental DetailReturn on Capital 31
Average Balances - Yields 32Average Managed Loans by Segment and Product 33Consumer Loan Delinquency Amounts, Net Credit Losses and Ratios 34Allowance for Credit Losses:
Total Citigroup 35 Consumer Loans 36 Corporate Loans 37
Components of Provision for Loan Losses 38Non-Performing Assets 39

CITIGROUP -- FINANCIAL SUMMARY(In millions of dollars, except per share amounts)
3Q06 vs. Nine Nine YTD 2006 vs.1Q 2Q 3Q 4Q 1Q 2Q 3Q 3Q05 Increase/ Months Months YTD 2005 Increase/
2005 2005 2005 2005 2006 2006 2006 (Decrease) 2005 2006 (Decrease)
Income from Continuing Operations 5,115$ 4,731$ 4,988$ 4,972$ 5,555$ 5,262$ 5,303$ 6% 14,834$ 16,120$ 9%Discontinued Operations, After-tax 326 342 2,155 2,009 84 3 202 (91%) 2,823 289 (90%)Cumulative Effect of Accounting Change - - - (49) - - - - -
Net Income 5,441$ 5,073$ 7,143$ 6,932$ 5,639$ 5,265$ 5,505$ (23%) 17,657$ 16,409$ (7%)
Diluted Earnings Per Share:
Income from Continuing Operations 0.98$ 0.91$ 0.97$ 0.98$ 1.11$ 1.05$ 1.06$ 9% 2.85$ 3.22$ 13%
Net Income 1.04$ 0.97$ 1.38$ 1.37$ 1.12$ 1.05$ 1.10$ (20%) 3.39$ 3.28$ (3%)
Adjusted weighted average common sharesapplicable to Diluted EPS (in millions) 5,226.0 5,208.1 5,146.0 5,061.3 5,007.9 4,990.0 4,978.6 5,193.4 4,992.2
Preferred Dividends - Diluted 17$ 17$ 17$ 17$ 16$ 16$ 16$ 51$ 48$
Common Shares Outstanding, at period end (in millions) 5,202.2 5,170.1 5,059.0 4,980.2 4,971.2 4,943.9 4,913.7 5,059.0 4,913.7
Tier 1 Capital Ratio 8.78% 8.71% 9.12% 8.79% 8.60% 8.51% 8.6% * 9.12% 8.6% *
Total Capital Ratio 12.03% 11.87% 12.37% 12.02% 11.80% 11.68% 11.8% * 12.37% 11.8% *
Leverage Ratio 5.19% 5.19% 5.53% 5.35% 5.22% 5.19% 5.2% * 5.53% 5.2% *
Total Assets, at period end (in billions) 1,489.9$ 1,547.8$ 1,472.8$ 1,494.0$ 1,586.2$ 1,626.6$ 1,746.6$ * 1,472.8$ 1,746.6$ *Stockholders' Equity, at period end (in billions) 110.5$ 113.0$ 111.8$ 112.5$ 114.4$ 115.4$ 117.9$ * 111.8$ 117.9$ *
Equity and Trust Securities, at period end (in billions) 116.9$ 119.5$ 118.2$ 118.8$ 120.6$ 122.0$ 125.9$ * 118.2$ 125.9$ *
Book Value Per Share, at period end 21.03$ 21.65$ 21.88$ 22.37$ 22.82$ 23.15$ 23.78$ * 21.88$ 23.78$ *
Return on Common Equity (Net Income) 20.3% 18.4% 25.4% 25.0% 20.3% 18.6% 18.9% 21.4% 19.3%
Return on Risk Capital (Income from Continuing Operations) 40% 36% 37% 37% 41% 38% 37% 38% 39%
* Preliminary
corporations, governments and institutions a complete range of financial products and services.Citigroup, the leading global financial services company, has more than 200 million customer accounts and does business in more than 100 countries, providing consumers,
Page 1

CITIGROUP -- NET INCOMEPRODUCT VIEW(In millions of dollars)
3Q06 vs. Nine Nine YTD 2006 vs.1Q 2Q 3Q 4Q 1Q 2Q 3Q 3Q05 Increase/ Months Months YTD 2005 Increase/
2005 2005 2005 2005 2006 2006 2006 (Decrease) 2005 2006 (Decrease)Global Consumer:
U.S. Cards 778$ 735$ 797$ 444$ 926$ 878$ 1,085$ 36% 2,310$ 2,889$ 25%
U.S. Retail Distribution 564 478 319 391 515 568 481 51% 1,361 1,564 15%
U.S. Consumer Lending 486 507 487 458 437 470 521 7% 1,480 1,428 (4%)
U.S. Commercial Business 252 134 222 121 126 138 151 (32%) 608 415 (32%)
Total U.S. Consumer (1) 2,080 1,854 1,825 1,414 2,004 2,054 2,238 23% 5,759 6,296 9%
International Cards 302 331 383 357 291 328 287 (25%) 1,016 906 (11%)
International Consumer Finance 139 177 152 174 168 173 50 (67%) 468 391 (16%)
International Retail Banking 498 593 427 565 677 714 701 64% 1,518 2,092 38%
Total International Consumer 939 1,101 962 1,096 1,136 1,215 1,038 8% 3,002 3,389 13%
Other (176) (58) (64) (76) (67) (92) (81) (27%) (298) (240) 19%
Total Global Consumer 2,843 2,897 2,723 2,434 3,073 3,177 3,195 17% 8,463 9,445 12%
Corporate and Investment Banking:
Capital Markets and Banking 1,439 1,043 1,424 1,421 1,618 1,412 1,344 (6%) 3,906 4,374 12%Transaction Services 245 288 327 275 323 340 385 18% 860 1,048 22%Other (2) (5) 41 46 351 (12) (29) (8) NM 82 (49) NM
Total Corporate and Investment Banking 1,679 1,372 1,797 2,047 1,929 1,723 1,721 (4%) 4,848 5,373 11%
Global Wealth Management:
Smith Barney 197 239 227 208 168 238 294 30% 663 700 6%
Private Bank 122 83 79 89 119 109 105 33% 284 333 17%
Total Global Wealth Management 319 322 306 297 287 347 399 30% 947 1,033 9%
Alternative Investments 362 385 339 351 353 257 117 (65%) 1,086 727 (33%)
Corporate / Other (88) (245) (177) (157) (87) (242) (129) 27% (510) (458) 10%
Income From Continuing Operations 5,115 4,731 4,988 4,972 5,555 5,262 5,303 6% 14,834 16,120 9%
Discontinued Operations (3)(4) 326 342 2,155 2,009 84 3 202 2,823 289
Cumulative Effect of Accounting Change (5) - - - (49) - - - - -
Net Income 5,441$ 5,073$ 7,143$ 6,932$ 5,639$ 5,265$ 5,505$ (23%) 17,657$ 16,409$ (7%)
(1) U.S. disclosure includes Canada and Puerto Rico.
(2) The 2005 fourth quarter includes a $375 million after-tax release of WorldCom Settlement and Litigation Reserves.
(3) Discontinued Operations includes the operations from the Company's January 31, 2005 announced agreement for the sale of Citigroup's Travelers Life & Annuity, and substantially all of Citigroup's
international insurance business, to MetLife, Inc. The transaction, which closed during the 2005 third quarter, resulted in a total gain of $3.5 billion ($2.2 billion after-tax).
(4) Discontinued Operations includes the operations from the Company's June 24, 2005 announced agreement for the sale of substantially all of Citigroup's Asset Management business to Legg Mason, Inc.
The transaction, which closed during the 2005 fourth quarter, resulted in a total gain of $3.5 billion ($2.1 billion after-tax).
(5) Cumulative Effect of Accounting Change represents the adoption of FIN 47, "Accounting for Conditional Asset Retirement Obligations, an interpretation of SFAS No. 143".
This pronouncement is applicable to real estate leasing agreements that required Citigroup to restore the leased space back to its original condition upon termination of
the lease.
NM Not meaningful
Reclassified to conform to the current period's presentation. Page 2

CITIGROUP -- NET INCOMEREGIONAL VIEW(In millions of dollars)
3Q06 vs. Nine Nine YTD 2006 vs.1Q 2Q 3Q 4Q 1Q 2Q 3Q 3Q05 Increase/ Months Months YTD 2005 Increase/
2005 2005 2005 2005 2006 2006 2006 (Decrease) 2005 2006 (Decrease)
U.S. (1)Global Consumer 1,904$ 1,796$ 1,761$ 1,338$ 1,937$ 1,962$ 2,157$ 22% 5,461$ 6,056$ 11%Corporate and Investment Banking 893 462 637 958 515 747 540 (15%) 1,992 1,802 (10%)Global Wealth Management 273 315 288 265 228 290 342 19% 876 860 (2%)
Total U.S. 3,070 2,573 2,686 2,561 2,680 2,999 3,039 13% 8,329 8,718 5%
MexicoGlobal Consumer 277 368 511 276 358 375 395 (23%) 1,156 1,128 (2%)Corporate and Investment Banking 83 76 177 114 78 88 95 (46%) 336 261 (22%)Global Wealth Management 13 10 12 9 8 10 9 (25%) 35 27 (23%)
Total Mexico 373 454 700 399 444 473 499 (29%) 1,527 1,416 (7%)
Europe, Middle East and Africa (EMEA)Global Consumer 122 124 (154) 282 185 215 213 NM 92 613 NMCorporate and Investment Banking 188 336 358 248 635 342 489 37% 882 1,466 66%Global Wealth Management (1) 3 8 (2) 3 5 7 (13%) 10 15 50%
Total EMEA 309 463 212 528 823 562 709 NM 984 2,094 NM
JapanGlobal Consumer 175 188 169 174 188 178 79 (53%) 532 445 (16%)Corporate and Investment Banking 48 54 58 338 85 72 38 (34%) 160 195 22%Global Wealth Management (8) (45) (29) - - - - 100% (82) - 100%
Total Japan 215 197 198 512 273 250 117 (41%) 610 640 5%
Asia (excluding Japan)Global Consumer 311 341 375 323 347 359 328 (13%) 1,027 1,034 1%Corporate and Investment Banking 322 249 382 295 414 336 391 2% 953 1,141 20%Global Wealth Management 35 31 26 24 45 40 38 46% 92 123 34%
Total Asia 668 621 783 642 806 735 757 (3%) 2,072 2,298 11%
Latin AmericaGlobal Consumer 54 80 61 41 58 88 23 (62%) 195 169 (13%)Corporate and Investment Banking 145 195 185 94 202 138 168 (9%) 525 508 (3%)Global Wealth Management 7 8 1 1 3 2 3 NM 16 8 (50%)
Total Latin America 206 283 247 136 263 228 194 (21%) 736 685 (7%)
Alternative Investments 362 385 339 351 353 257 117 (65%) 1,086 727 (33%)
Corporate / Other (88) (245) (177) (157) (87) (242) (129) 27% (510) (458) 10%
Income From Continuing Operations 5,115 4,731 4,988 4,972 5,555 5,262 5,303 6% 14,834 16,120 9%
Discontinued Operations 326 342 2,155 2,009 84 3 202 2,823 289
Cumulative Effect of Accounting Change - - - (49) - - - - -
Net Income 5,441$ 5,073$ 7,143$ 6,932$ 5,639$ 5,265$ 5,505$ (23%) 17,657$ 16,409$ (7%)
Total International 1,771$ 2,018$ 2,140$ 2,217$ 2,609$ 2,248$ 2,276$ 6% 5,929$ 7,133$ 20%
(1) Excludes Alternative Investments and Corporate / Other which are predominantly related to the U.S. The U.S. regional disclosure includes Canada and Puerto Rico. Global Consumer for the U.S includes Other Consumer.
NM Not meaningful
Reclassified to conform to the current period's presentation.
Page 3
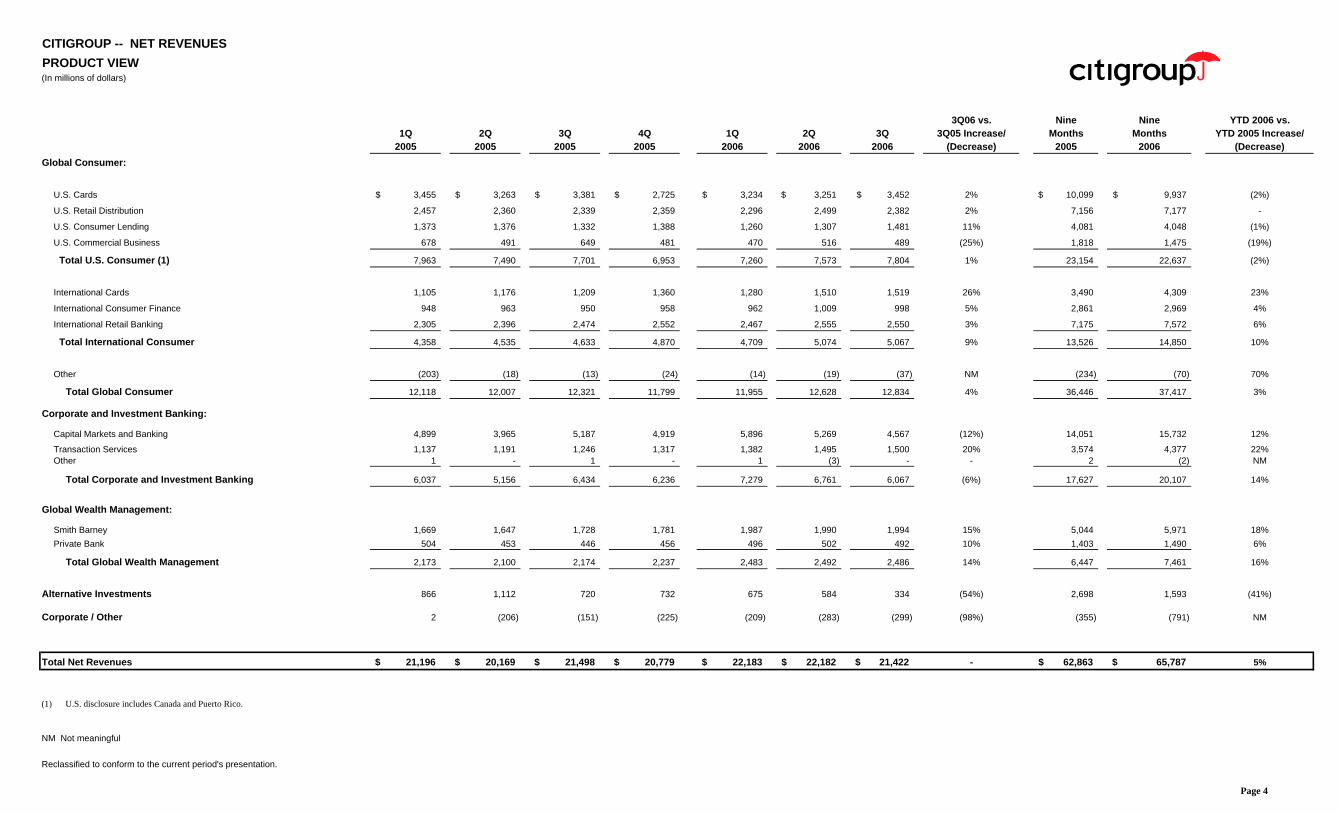
CITIGROUP -- NET REVENUESPRODUCT VIEW(In millions of dollars)
3Q06 vs. Nine Nine YTD 2006 vs.1Q 2Q 3Q 4Q 1Q 2Q 3Q 3Q05 Increase/ Months Months YTD 2005 Increase/
2005 2005 2005 2005 2006 2006 2006 (Decrease) 2005 2006 (Decrease)Global Consumer:
U.S. Cards 3,455$ 3,263$ 3,381$ 2,725$ 3,234$ 3,251$ 3,452$ 2% 10,099$ 9,937$ (2%)
U.S. Retail Distribution 2,457 2,360 2,339 2,359 2,296 2,499 2,382 2% 7,156 7,177 -
U.S. Consumer Lending 1,373 1,376 1,332 1,388 1,260 1,307 1,481 11% 4,081 4,048 (1%)
U.S. Commercial Business 678 491 649 481 470 516 489 (25%) 1,818 1,475 (19%)
Total U.S. Consumer (1) 7,963 7,490 7,701 6,953 7,260 7,573 7,804 1% 23,154 22,637 (2%)
International Cards 1,105 1,176 1,209 1,360 1,280 1,510 1,519 26% 3,490 4,309 23%
International Consumer Finance 948 963 950 958 962 1,009 998 5% 2,861 2,969 4%
International Retail Banking 2,305 2,396 2,474 2,552 2,467 2,555 2,550 3% 7,175 7,572 6%
Total International Consumer 4,358 4,535 4,633 4,870 4,709 5,074 5,067 9% 13,526 14,850 10%
Other (203) (18) (13) (24) (14) (19) (37) NM (234) (70) 70%
Total Global Consumer 12,118 12,007 12,321 11,799 11,955 12,628 12,834 4% 36,446 37,417 3%
Corporate and Investment Banking:
Capital Markets and Banking 4,899 3,965 5,187 4,919 5,896 5,269 4,567 (12%) 14,051 15,732 12%
Transaction Services 1,137 1,191 1,246 1,317 1,382 1,495 1,500 20% 3,574 4,377 22%Other 1 - 1 - 1 (3) - - 2 (2) NM
Total Corporate and Investment Banking 6,037 5,156 6,434 6,236 7,279 6,761 6,067 (6%) 17,627 20,107 14%
Global Wealth Management:
Smith Barney 1,669 1,647 1,728 1,781 1,987 1,990 1,994 15% 5,044 5,971 18%Private Bank 504 453 446 456 496 502 492 10% 1,403 1,490 6%
Total Global Wealth Management 2,173 2,100 2,174 2,237 2,483 2,492 2,486 14% 6,447 7,461 16%
Alternative Investments 866 1,112 720 732 675 584 334 (54%) 2,698 1,593 (41%)
Corporate / Other 2 (206) (151) (225) (209) (283) (299) (98%) (355) (791) NM
Total Net Revenues 21,196$ 20,169$ 21,498$ 20,779$ 22,183$ 22,182$ 21,422$ - 62,863$ 65,787$ 5%
(1) U.S. disclosure includes Canada and Puerto Rico.
NM Not meaningful
Reclassified to conform to the current period's presentation.
Page 4
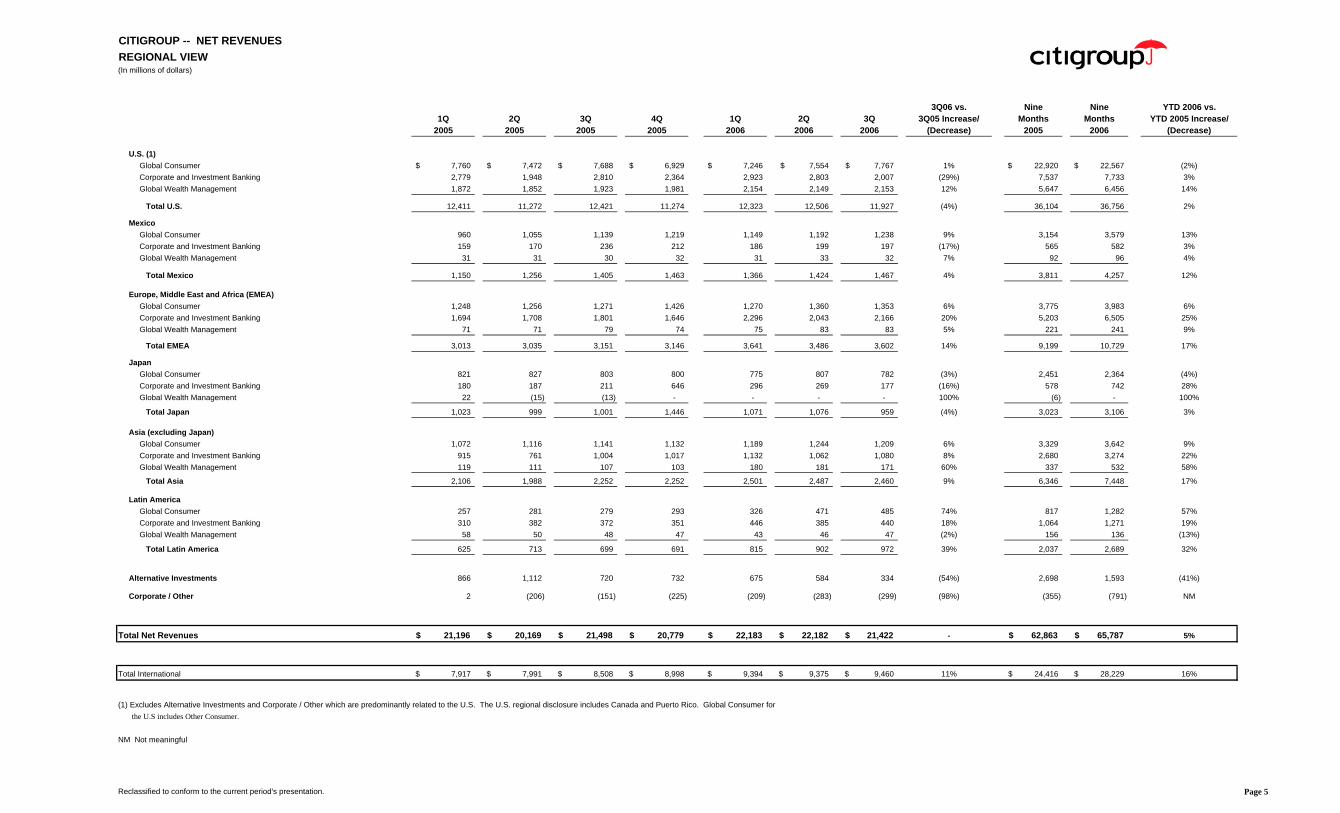
CITIGROUP -- NET REVENUESREGIONAL VIEW(In millions of dollars)
3Q06 vs. Nine Nine YTD 2006 vs.1Q 2Q 3Q 4Q 1Q 2Q 3Q 3Q05 Increase/ Months Months YTD 2005 Increase/
2005 2005 2005 2005 2006 2006 2006 (Decrease) 2005 2006 (Decrease)
U.S. (1)Global Consumer 7,760$ 7,472$ 7,688$ 6,929$ 7,246$ 7,554$ 7,767$ 1% 22,920$ 22,567$ (2%)Corporate and Investment Banking 2,779 1,948 2,810 2,364 2,923 2,803 2,007 (29%) 7,537 7,733 3%Global Wealth Management 1,872 1,852 1,923 1,981 2,154 2,149 2,153 12% 5,647 6,456 14%
Total U.S. 12,411 11,272 12,421 11,274 12,323 12,506 11,927 (4%) 36,104 36,756 2%
MexicoGlobal Consumer 960 1,055 1,139 1,219 1,149 1,192 1,238 9% 3,154 3,579 13%Corporate and Investment Banking 159 170 236 212 186 199 197 (17%) 565 582 3%Global Wealth Management 31 31 30 32 31 33 32 7% 92 96 4%
Total Mexico 1,150 1,256 1,405 1,463 1,366 1,424 1,467 4% 3,811 4,257 12%
Europe, Middle East and Africa (EMEA)Global Consumer 1,248 1,256 1,271 1,426 1,270 1,360 1,353 6% 3,775 3,983 6%Corporate and Investment Banking 1,694 1,708 1,801 1,646 2,296 2,043 2,166 20% 5,203 6,505 25%Global Wealth Management 71 71 79 74 75 83 83 5% 221 241 9%
Total EMEA 3,013 3,035 3,151 3,146 3,641 3,486 3,602 14% 9,199 10,729 17%
JapanGlobal Consumer 821 827 803 800 775 807 782 (3%) 2,451 2,364 (4%)Corporate and Investment Banking 180 187 211 646 296 269 177 (16%) 578 742 28%Global Wealth Management 22 (15) (13) - - - - 100% (6) - 100%
Total Japan 1,023 999 1,001 1,446 1,071 1,076 959 (4%) 3,023 3,106 3%
Asia (excluding Japan)Global Consumer 1,072 1,116 1,141 1,132 1,189 1,244 1,209 6% 3,329 3,642 9%Corporate and Investment Banking 915 761 1,004 1,017 1,132 1,062 1,080 8% 2,680 3,274 22%Global Wealth Management 119 111 107 103 180 181 171 60% 337 532 58%
Total Asia 2,106 1,988 2,252 2,252 2,501 2,487 2,460 9% 6,346 7,448 17%
Latin AmericaGlobal Consumer 257 281 279 293 326 471 485 74% 817 1,282 57%Corporate and Investment Banking 310 382 372 351 446 385 440 18% 1,064 1,271 19%Global Wealth Management 58 50 48 47 43 46 47 (2%) 156 136 (13%)
Total Latin America 625 713 699 691 815 902 972 39% 2,037 2,689 32%
Alternative Investments 866 1,112 720 732 675 584 334 (54%) 2,698 1,593 (41%)
Corporate / Other 2 (206) (151) (225) (209) (283) (299) (98%) (355) (791) NM
Total Net Revenues 21,196$ 20,169$ 21,498$ 20,779$ 22,183$ 22,182$ 21,422$ - 62,863$ 65,787$ 5%
Total International 7,917$ 7,991$ 8,508$ 8,998$ 9,394$ 9,375$ 9,460$ 11% 24,416$ 28,229$ 16%
(1) Excludes Alternative Investments and Corporate / Other which are predominantly related to the U.S. The U.S. regional disclosure includes Canada and Puerto Rico. Global Consumer for the U.S includes Other Consumer.
NM Not meaningful
Reclassified to conform to the current period's presentation. Page 5

CITIGROUP CONSOLIDATED STATEMENT OF INCOME(In millions of dollars)
3Q06 vs. Nine Nine YTD 2006 vs.1Q 2Q 3Q 4Q 1Q 2Q 3Q 3Q05 Increase/ Months Months YTD 2005 Increase/
2005 2005 2005 2005 2006 2006 2006 (Decrease) 2005 2006 (Decrease)Revenues
Interest Revenue 17,547$ 18,422$ 19,344$ 20,603$ 21,873$ 23,572$ 24,729$ 28% 55,313$ 70,174$ 27%Interest Expense 7,424 8,668 9,649 10,935 12,107 13,717 14,901 54% 25,741 40,725 58%
Net interest revenue 10,123 9,754 9,695 9,668 9,766 9,855 9,828 1% 29,572 29,449 -
Insurance premiums 735 793 743 861 770 800 819 10% 2,271 2,389 5%Commissions and fees 4,209 3,978 4,825 4,131 5,188 5,331 4,007 (17%) 13,012 14,526 12%Principal transactions 2,215 844 1,950 1,434 2,117 1,703 1,927 (1%) 5,009 5,747 15%Asset management and administration fees 1,508 1,488 1,522 1,601 1,705 1,707 1,670 10% 4,518 5,082 12%Realized gains (losses) from sales of investments 243 455 284 980 379 302 304 7% 982 985 -Other revenue 2,163 2,857 2,479 2,104 2,258 2,484 2,867 16% 7,499 7,609 1%
Total non-interest revenues 11,073 10,415 11,803 11,111 12,417 12,327 11,594 (2%) 33,291 36,338 9%
Total revenues, net of interest expense 21,196 20,169 21,498 20,779 22,183 22,182 21,422 - 62,863 65,787 5%
Provisions for Credit Losses and for Benefits and ClaimsPolicyholder benefits and claims 217 212 215 223 227 231 274 27% 644 732 14%Provision for loan losses 1,813 1,720 2,525 1,871 1,396 1,436 1,793 (29%) 6,058 4,625 (24%)Provision for unfunded lending commitments - 100 100 50 50 150 50 (50%) 200 250 25%
Total provisions for credit losses and for benefits and claims 2,030 2,032 2,840 2,144 1,673 1,817 2,117 (25%) 6,902 5,607 (19%)
Operating ExpensesCompensation and benefits 6,486 6,033 6,792 6,461 8,263 7,374 6,718 (1%) 19,311 22,355 16%Net occupancy expense 1,241 1,271 1,270 1,359 1,382 1,411 1,435 13% 3,782 4,228 12%Technology / communication expense 866 884 892 882 886 934 948 6% 2,642 2,768 5%Advertising and marketing expense 641 620 587 685 603 652 574 (2%) 1,848 1,829 (1%)Other operating 2,170 2,164 1,872 1,987 2,224 2,398 2,261 21% 6,206 6,883 11%
Total operating expenses 11,404 10,972 11,413 11,374 13,358 12,769 11,936 5% 33,789 38,063 13%
Income from Continuing Operations before Income
Taxes and Minority Interest and
Cumulative Effect of Accounting Change 7,762 7,165 7,245 7,261 7,152 7,596 7,369 2% 22,172 22,117 -
Provision (benefit) for income taxes 2,484 2,179 2,164 2,251 1,537 2,303 2,020 (7%) 6,827 5,860 (14%)Minority interest, net of income taxes 163 255 93 38 60 31 46 (51%) 511 137 (73%)
Income from Continuing Operations beforeCumulative Effect of Accounting Change 5,115 4,731 4,988 4,972 5,555 5,262 5,303 6% 14,834 16,120 9%
Discontinued Operations (1) (2)Income from Discontinued Operations 483 493 49 (117) 1 - 26 1,025 27 Gain on Sale - - 3,386 3,404 21 - 198 3,386 219 Provision for income taxes and minority interest, net of taxes 157 151 1,280 1,278 (62) (3) 22 1,588 (43)
Income from Discontinued Operations, net 326 342 2,155 2,009 84 3 202 2,823 289
Cumulative Effect of Accounting Change (3) - - - (49) - - - - -
Net Income 5,441$ 5,073$ 7,143$ 6,932$ 5,639$ 5,265$ 5,505$ (23%) 17,657$ 16,409$ (7%)
(1) Discontinued Operations includes the operations from the Company's January 31, 2005 announced agreement for the sale of Citigroup's Travelers Life & Annuity, and substantially all of Citigroup's international insurance business, to MetLife, Inc. The transaction, which closed during the 2005 third quarter, resulted in a total gain of $3.5 billion ($2.2 billion after-tax).
(2) Discontinued Operations includes the operations from the Company's June 24, 2005 announced agreement for the sale of substantially all of Citigroup's Asset Management business to Legg Mason, Inc. The transaction, which closed during the 2005 fourth quarter, resulted in a total gain of $3.5 billion ($2.1 billion after-tax).
(3) Cumulative Effect of Accounting Change represents the adoption of FIN 47, "Accounting for Conditional Asset Retirement Obligations, an interpretation of SFAS No. 143".This pronouncement is applicable to real estate leasing agreements that required Citigroup to restore the leased space back to its original condition upon termination the lease.
Reclassified to conform to the current period's presentation.Page 6

CITIGROUP CONSOLIDATED BALANCE SHEET(In millions of dollars)
September 30, 2006vs.
March 31, June 30, September 30, December 31, March 31, June 30, September 30, December 31, 20052005 2005 2005 2005 2006 2006 2006 (1) Inc (Decr)
AssetsCash and due from banks (including segregated cash and other deposits) 22,418$ 24,512$ 24,668$ 23,632$ 21,411$ 24,311$ 22,543$ (5%)Deposits at interest with banks 31,770 35,752 34,374 31,645 33,220 35,868 33,939 7%Federal funds sold and securities borrowed or purchased under agreements to resell 202,099 232,369 236,105 217,464 239,552 234,390 262,627 21%Brokerage receivables 40,747 42,977 42,006 42,823 42,569 46,162 40,970 (4%)Trading account assets 272,841 281,035 293,416 295,820 328,135 327,890 351,149 19%Investments 167,589 165,587 165,905 180,597 193,970 194,953 251,748 39%Loans, net of unearned income
Consumer 430,008 433,057 440,145 454,620 462,068 480,772 488,673 7%Corporate 116,637 122,474 125,780 128,883 143,239 156,313 166,709 29%
Loans, net of unearned income 546,645 555,531 565,925 583,503 605,307 637,085 655,382 12%Allowance for loan losses (10,894) (10,418) (10,015) (9,782) (9,505) (9,144) (8,979) 8%
Total loans, net 535,751 545,113 555,910 573,721 595,802 627,941 646,403 13%Goodwill 32,076 32,235 32,240 33,130 32,933 32,910 33,169 -Intangible assets 15,572 13,894 14,376 14,749 15,092 15,850 15,725 7%Other assets 73,950 79,891 72,613 80,456 83,517 86,276 88,313 10%Assets of discontinued operations held for sale 95,078 94,424 1,180 - - - - -
Total assets 1,489,891$ 1,547,789$ 1,472,793$ 1,494,037$ 1,586,201$ 1,626,551$ 1,746,586$ 17%
LiabilitiesNon-interest-bearing deposits in U.S. offices 38,507$ 37,658$ 37,996$ 36,638$ 37,885$ 38,018$ 36,358$ (1%)Interest-bearing deposits in U.S. offices 159,889 159,825 162,310 169,277 176,032 177,385 183,467 8%Non-interest-bearing deposits in offices outside the U.S. 29,930 31,281 32,374 32,614 34,323 32,981 32,721 -Interest-bearing deposits in offices outside the U.S. 339,963 343,156 347,756 353,299 379,118 397,421 416,732 18%
Total deposits 568,289 571,920 580,436 591,828 627,358 645,805 669,278 13%
Federal funds purchased and securities loaned or sold under agreements to repurchase 217,599 252,774 243,819 242,392 279,540 264,494 320,095 32%Brokerage payables 52,088 53,600 57,330 70,994 70,214 74,970 97,229 37%Trading account liabilities 120,511 133,807 140,723 121,108 144,888 142,983 138,876 15%Short-term borrowings 62,704 62,984 58,224 66,930 58,130 72,581 70,501 5%Long-term debt 207,935 211,346 213,894 217,499 227,165 239,557 260,089 20%Other liabilities (2) 63,856 64,109 66,165 70,749 64,488 70,733 72,653 3%Liabilities of discontinued operations held for sale 86,373 84,212 365 - - - - -
Total liabilities 1,379,355 1,434,752 1,360,956 1,381,500 1,471,783 1,511,123 1,628,721 18% Stockholders' equityPreferred Stock 1,125 1,125 1,125 1,125 1,000 1,000 1,000 (11%)Common Stock 55 55 55 55 55 55 55 -Additional paid-in capital 16,243 17,160 17,636 17,483 17,119 17,426 17,825 2%Retained earnings 105,269 108,026 112,868 117,555 120,703 123,497 126,544 8%Treasury stock (10,475) (12,299) (17,290) (21,149) (21,753) (23,199) (24,737) (17%)Accumulated other changes in equity from nonowner sources (1,681) (1,030) (2,557) (2,532) (2,706) (3,351) (2,822) (11%)
Total stockholders' equity 110,536 113,037 111,837 112,537 114,418 115,428 117,865 5%
Total liabilities and stockholders' equity 1,489,891$ 1,547,789$ 1,472,793$ 1,494,037$ 1,586,201$ 1,626,551$ 1,746,586$ 17%
(1) Preliminary.
(2) Includes allowance for credit losses for letters of credit and unfunded lending commitments of $600 million, $700 million, $800 million, and $850 million for the first, second, third, and fourth quarters of 2005, respectively, and$900 million, $1,050 million, and $1,100 million for the first, second, and third quarters of 2006, respectively.
Reclassified to conform to the current period's presentation.
Page 7

GLOBAL CONSUMER(In millions of dollars)
3Q06 vs. Nine Nine YTD 2006 vs.1Q 2Q 3Q 4Q 1Q 2Q 3Q 3Q05 Increase/ Months Months YTD 2005 Increase/
2005 2005 2005 2005 2006 2006 2006 (Decrease) 2005 2006 (Decrease)
Global Consumer:
Net Interest Revenue 7,518$ 7,325$ 7,369$ 7,314$ 7,224$ 7,481$ 7,523$ 2% 22,212$ 22,228$ -Non-Interest Revenue 4,600 4,682 4,952 4,485 4,731 5,147 5,311 7% 14,234 15,189 7%
Total Revenues, Net of Interest Expense 12,118 12,007 12,321 11,799 11,955 12,628 12,834 4% 36,446 37,417 3%
Total Operating Expenses 5,846 5,753 5,657 6,062 6,357 6,379 6,316 12% 17,256 19,052 10%Provisions for Loan Losses and for Benefits and Claims 2,102 2,047 2,770 2,144 1,668 1,649 1,994 (28%) 6,919 5,311 (23%)
Income Before Taxes and Minority Interest 4,170 4,207 3,894 3,593 3,930 4,600 4,524 16% 12,271 13,054 6%
Income Taxes 1,314 1,295 1,153 1,142 847 1,400 1,312 14% 3,762 3,559 (5%)Minority Interest, Net of Tax 13 15 18 17 10 23 17 (6%) 46 50 9%
Net Income 2,843$ 2,897$ 2,723$ 2,434$ 3,073$ 3,177$ 3,195$ 17% 8,463$ 9,445$ 12%
U.S.:
Net Interest Revenue 4,540$ 4,247$ 4,422$ 4,301$ 4,138$ 4,189$ 4,141$ (6%) 13,209$ 12,468$ (6%)Non-Interest Revenue 3,423 3,243 3,279 2,652 3,122 3,384 3,663 12% 9,945 10,169 2%
Total Revenues, Net of Interest Expense 7,963 7,490 7,701 6,953 7,260 7,573 7,804 1% 23,154 22,637 (2%)
Total Operating Expenses 3,337 3,358 3,290 3,464 3,569 3,551 3,426 4% 9,985 10,546 6%Provisions for Loan Losses and for Benefits and Claims 1,429 1,317 1,573 1,281 901 827 962 (39%) 4,319 2,690 (38%)
Income Before Taxes and Minority Interest 3,197 2,815 2,838 2,208 2,790 3,195 3,416 20% 8,850 9,401 6%
Income Taxes 1,104 945 996 778 777 1,121 1,162 17% 3,045 3,060 -Minority Interest, Net of Tax 13 16 17 16 9 20 16 (6%) 46 45 (2%)
Net Income 2,080$ 1,854$ 1,825$ 1,414$ 2,004$ 2,054$ 2,238$ 23% 5,759$ 6,296$ 9%
International:
Net Interest Revenue 3,002$ 3,119$ 2,995$ 3,064$ 3,133$ 3,343$ 3,445$ 15% 9,116$ 9,921$ 9%Non-Interest Revenue 1,356 1,416 1,638 1,806 1,576 1,731 1,622 (1%) 4,410 4,929 12%
Total Revenues, Net of Interest Expense 4,358 4,535 4,633 4,870 4,709 5,074 5,067 9% 13,526 14,850 10%
Total Operating Expenses 2,422 2,320 2,280 2,498 2,621 2,701 2,769 21% 7,022 8,091 15%Provisions for Loan Losses and for Benefits and Claims 673 730 1,197 863 767 822 1,032 (14%) 2,600 2,621 1%
Income Before Taxes and Minority Interest 1,263 1,485 1,156 1,509 1,321 1,551 1,266 10% 3,904 4,138 6%
Income Taxes 324 385 193 412 184 333 227 18% 902 744 (18%)Minority Interest, Net of Tax - (1) 1 1 1 3 1 - - 5 -
Net Income 939$ 1,101$ 962$ 1,096$ 1,136$ 1,215$ 1,038$ 8% 3,002$ 3,389$ 13%
Other Consumer:
Net Interest Revenue (24)$ (41)$ (48)$ (51)$ (47)$ (51)$ (63)$ (31%) (113)$ (161)$ (42%)Non-Interest Revenue (179) 23 35 27 33 32 26 (26%) (121) 91 NM
Total Revenues, Net of Interest Expense (203) (18) (13) (24) (14) (19) (37) NM (234) (70) 70%
Total Operating Expenses 87 75 87 100 167 127 121 39% 249 415 67%
Income Before Taxes (290) (93) (100) (124) (181) (146) (158) (58%) (483) (485) -
Income Taxes (114) (35) (36) (48) (114) (54) (77) NM (185) (245) (32%)
Net Income (176)$ (58)$ (64)$ (76)$ (67)$ (92)$ (81)$ (27%) (298)$ (240)$ 19%
NM Not meaningful
Reclassified to conform to the current period's presentation. Page 8
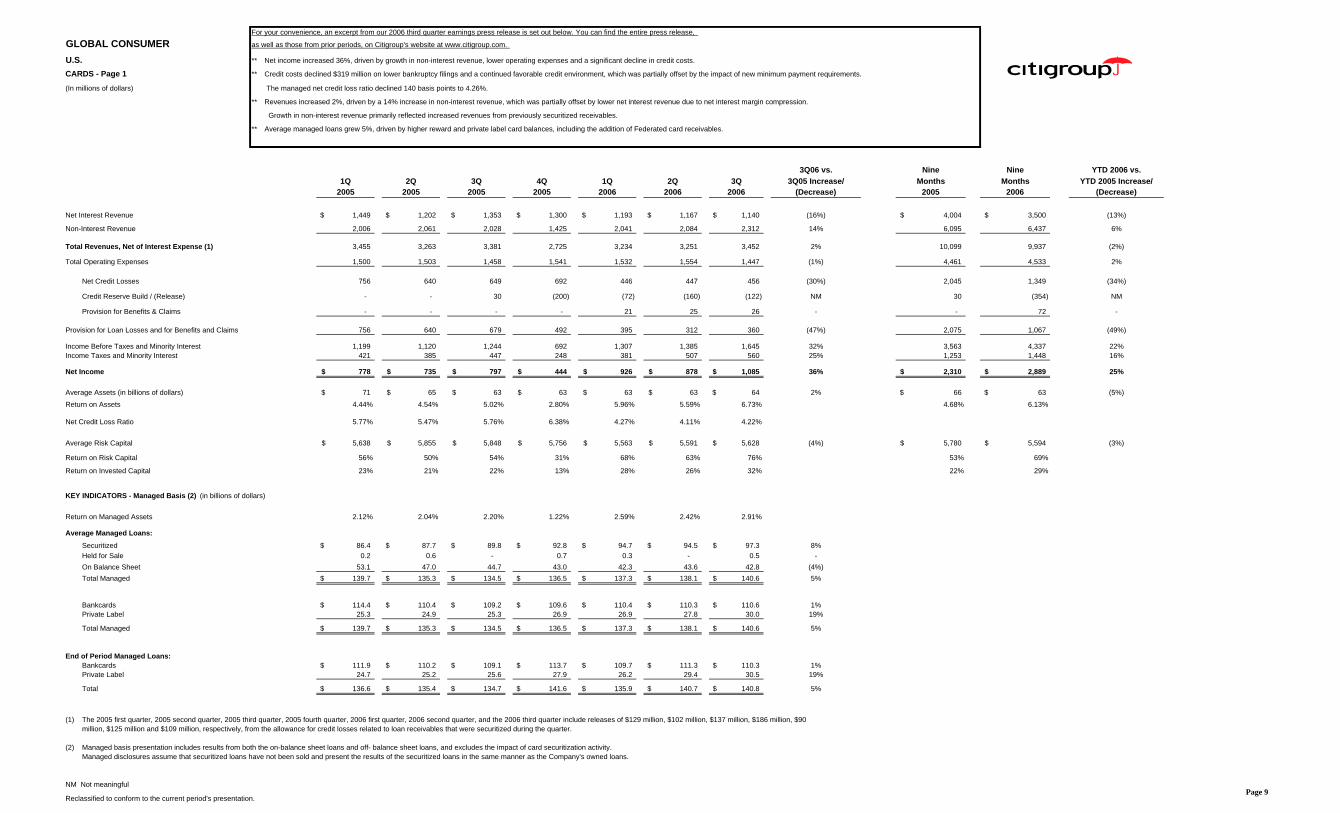
For your convenience, an excerpt from our 2006 third quarter earnings press release is set out below. You can find the entire press release,
GLOBAL CONSUMER as well as those from prior periods, on Citigroup's website at www.citigroup.com.
U.S. ** Net income increased 36%, driven by growth in non-interest revenue, lower operating expenses and a significant decline in credit costs.
CARDS - Page 1 ** Credit costs declined $319 million on lower bankruptcy filings and a continued favorable credit environment, which was partially offset by the impact of new minimum payment requirements.
(In millions of dollars) The managed net credit loss ratio declined 140 basis points to 4.26%.
** Revenues increased 2%, driven by a 14% increase in non-interest revenue, which was partially offset by lower net interest revenue due to net interest margin compression.
Growth in non-interest revenue primarily reflected increased revenues from previously securitized receivables.
** Average managed loans grew 5%, driven by higher reward and private label card balances, including the addition of Federated card receivables.
3Q06 vs. Nine Nine YTD 2006 vs.1Q 2Q 3Q 4Q 1Q 2Q 3Q 3Q05 Increase/ Months Months YTD 2005 Increase/
2005 2005 2005 2005 2006 2006 2006 (Decrease) 2005 2006 (Decrease)
Net Interest Revenue 1,449$ 1,202$ 1,353$ 1,300$ 1,193$ 1,167$ 1,140$ (16%) 4,004$ 3,500$ (13%)
Non-Interest Revenue 2,006 2,061 2,028 1,425 2,041 2,084 2,312 14% 6,095 6,437 6%
Total Revenues, Net of Interest Expense (1) 3,455 3,263 3,381 2,725 3,234 3,251 3,452 2% 10,099 9,937 (2%)
Total Operating Expenses 1,500 1,503 1,458 1,541 1,532 1,554 1,447 (1%) 4,461 4,533 2%
Net Credit Losses 756 640 649 692 446 447 456 (30%) 2,045 1,349 (34%)
Credit Reserve Build / (Release) - - 30 (200) (72) (160) (122) NM 30 (354) NM
Provision for Benefits & Claims - - - - 21 25 26 - - 72 -
Provision for Loan Losses and for Benefits and Claims 756 640 679 492 395 312 360 (47%) 2,075 1,067 (49%)
Income Before Taxes and Minority Interest 1,199 1,120 1,244 692 1,307 1,385 1,645 32% 3,563 4,337 22%Income Taxes and Minority Interest 421 385 447 248 381 507 560 25% 1,253 1,448 16%
Net Income 778$ 735$ 797$ 444$ 926$ 878$ 1,085$ 36% 2,310$ 2,889$ 25%
Average Assets (in billions of dollars) 71$ 65$ 63$ 63$ 63$ 63$ 64$ 2% 66$ 63$ (5%)
Return on Assets 4.44% 4.54% 5.02% 2.80% 5.96% 5.59% 6.73% 4.68% 6.13%
Net Credit Loss Ratio 5.77% 5.47% 5.76% 6.38% 4.27% 4.11% 4.22%
Average Risk Capital 5,638$ 5,855$ 5,848$ 5,756$ 5,563$ 5,591$ 5,628$ (4%) 5,780$ 5,594$ (3%)
Return on Risk Capital 56% 50% 54% 31% 68% 63% 76% 53% 69%
Return on Invested Capital 23% 21% 22% 13% 28% 26% 32% 22% 29%
KEY INDICATORS - Managed Basis (2) (in billions of dollars)
Return on Managed Assets 2.12% 2.04% 2.20% 1.22% 2.59% 2.42% 2.91%
Average Managed Loans:
Securitized 86.4$ 87.7$ 89.8$ 92.8$ 94.7$ 94.5$ 97.3$ 8%Held for Sale 0.2 0.6 - 0.7 0.3 - 0.5 -On Balance Sheet 53.1 47.0 44.7 43.0 42.3 43.6 42.8 (4%)Total Managed 139.7$ 135.3$ 134.5$ 136.5$ 137.3$ 138.1$ 140.6$ 5%
Bankcards 114.4$ 110.4$ 109.2$ 109.6$ 110.4$ 110.3$ 110.6$ 1%Private Label 25.3 24.9 25.3 26.9 26.9 27.8 30.0 19%
Total Managed 139.7$ 135.3$ 134.5$ 136.5$ 137.3$ 138.1$ 140.6$ 5%
End of Period Managed Loans:Bankcards 111.9$ 110.2$ 109.1$ 113.7$ 109.7$ 111.3$ 110.3$ 1%Private Label 24.7 25.2 25.6 27.9 26.2 29.4 30.5 19%
Total 136.6$ 135.4$ 134.7$ 141.6$ 135.9$ 140.7$ 140.8$ 5%
(1) The 2005 first quarter, 2005 second quarter, 2005 third quarter, 2005 fourth quarter, 2006 first quarter, 2006 second quarter, and the 2006 third quarter include releases of $129 million, $102 million, $137 million, $186 million, $90million, $125 million and $109 million, respectively, from the allowance for credit losses related to loan receivables that were securitized during the quarter.
(2) Managed basis presentation includes results from both the on-balance sheet loans and off- balance sheet loans, and excludes the impact of card securitization activity.Managed disclosures assume that securitized loans have not been sold and present the results of the securitized loans in the same manner as the Company's owned loans.
NM Not meaningful
Reclassified to conform to the current period's presentation.Page 9
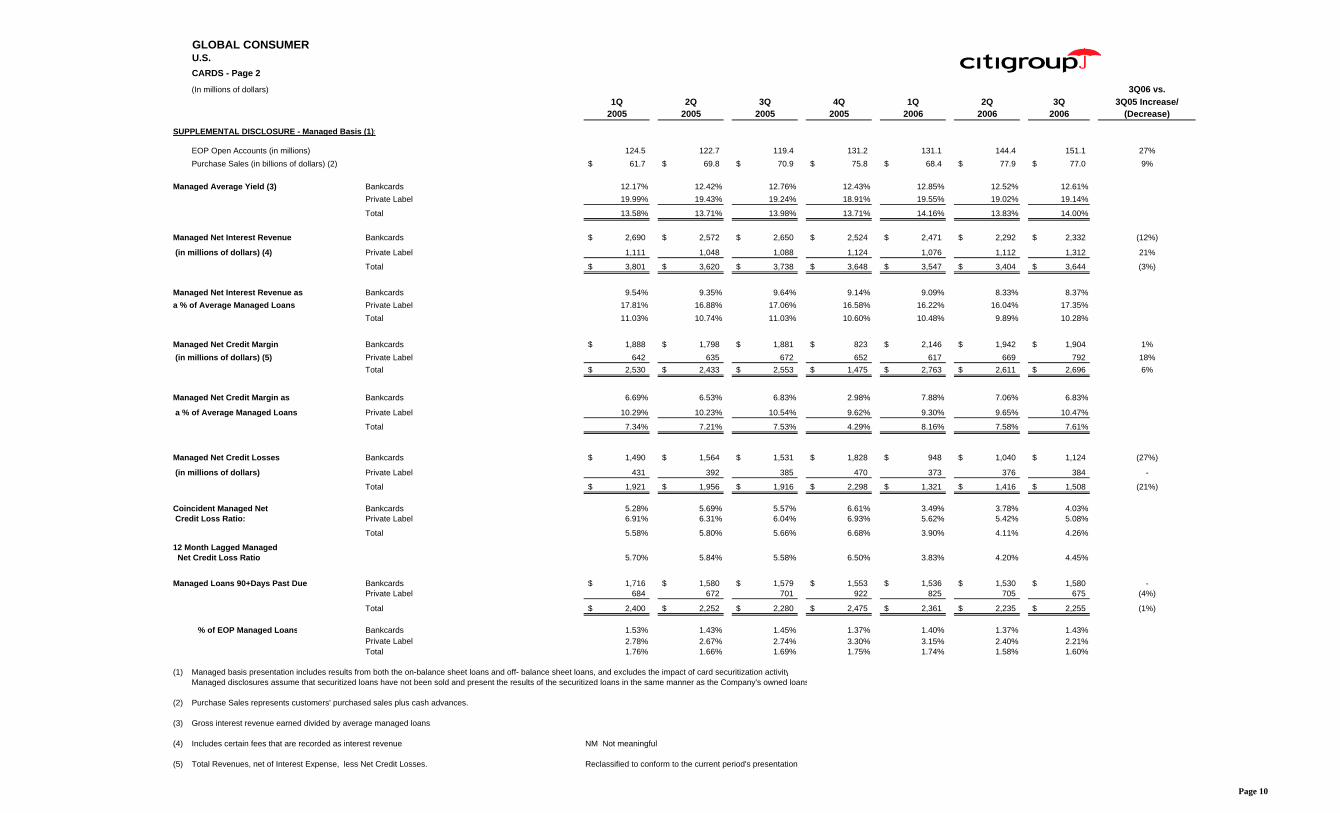
GLOBAL CONSUMERU.S.CARDS - Page 2
(In millions of dollars) 3Q06 vs.1Q 2Q 3Q 4Q 1Q 2Q 3Q 3Q05 Increase/
2005 2005 2005 2005 2006 2006 2006 (Decrease)
SUPPLEMENTAL DISCLOSURE - Managed Basis (1):
EOP Open Accounts (in millions) 124.5 122.7 119.4 131.2 131.1 144.4 151.1 27%Purchase Sales (in billions of dollars) (2) 61.7$ 69.8$ 70.9$ 75.8$ 68.4$ 77.9$ 77.0$ 9%
Managed Average Yield (3) Bankcards 12.17% 12.42% 12.76% 12.43% 12.85% 12.52% 12.61%Private Label 19.99% 19.43% 19.24% 18.91% 19.55% 19.02% 19.14%
Total 13.58% 13.71% 13.98% 13.71% 14.16% 13.83% 14.00%
Managed Net Interest Revenue Bankcards 2,690$ 2,572$ 2,650$ 2,524$ 2,471$ 2,292$ 2,332$ (12%)
(in millions of dollars) (4) Private Label 1,111 1,048 1,088 1,124 1,076 1,112 1,312 21%
Total 3,801$ 3,620$ 3,738$ 3,648$ 3,547$ 3,404$ 3,644$ (3%)
Managed Net Interest Revenue as Bankcards 9.54% 9.35% 9.64% 9.14% 9.09% 8.33% 8.37%a % of Average Managed Loans Private Label 17.81% 16.88% 17.06% 16.58% 16.22% 16.04% 17.35%
Total 11.03% 10.74% 11.03% 10.60% 10.48% 9.89% 10.28%
Managed Net Credit Margin Bankcards 1,888$ 1,798$ 1,881$ 823$ 2,146$ 1,942$ 1,904$ 1% (in millions of dollars) (5) Private Label 642 635 672 652 617 669 792 18%
Total 2,530$ 2,433$ 2,553$ 1,475$ 2,763$ 2,611$ 2,696$ 6%
Managed Net Credit Margin as Bankcards 6.69% 6.53% 6.83% 2.98% 7.88% 7.06% 6.83%
a % of Average Managed Loans Private Label 10.29% 10.23% 10.54% 9.62% 9.30% 9.65% 10.47%
Total 7.34% 7.21% 7.53% 4.29% 8.16% 7.58% 7.61%
Managed Net Credit Losses Bankcards 1,490$ 1,564$ 1,531$ 1,828$ 948$ 1,040$ 1,124$ (27%)
(in millions of dollars) Private Label 431 392 385 470 373 376 384 -
Total 1,921$ 1,956$ 1,916$ 2,298$ 1,321$ 1,416$ 1,508$ (21%)
Coincident Managed Net Bankcards 5.28% 5.69% 5.57% 6.61% 3.49% 3.78% 4.03% Credit Loss Ratio: Private Label 6.91% 6.31% 6.04% 6.93% 5.62% 5.42% 5.08%
Total 5.58% 5.80% 5.66% 6.68% 3.90% 4.11% 4.26%
12 Month Lagged Managed Net Credit Loss Ratio 5.70% 5.84% 5.58% 6.50% 3.83% 4.20% 4.45%
Managed Loans 90+Days Past Due Bankcards 1,716$ 1,580$ 1,579$ 1,553$ 1,536$ 1,530$ 1,580$ -Private Label 684 672 701 922 825 705 675 (4%)
Total 2,400$ 2,252$ 2,280$ 2,475$ 2,361$ 2,235$ 2,255$ (1%)
% of EOP Managed Loans Bankcards 1.53% 1.43% 1.45% 1.37% 1.40% 1.37% 1.43%Private Label 2.78% 2.67% 2.74% 3.30% 3.15% 2.40% 2.21%Total 1.76% 1.66% 1.69% 1.75% 1.74% 1.58% 1.60%
(1) Managed basis presentation includes results from both the on-balance sheet loans and off- balance sheet loans, and excludes the impact of card securitization activityManaged disclosures assume that securitized loans have not been sold and present the results of the securitized loans in the same manner as the Company's owned loans
(2) Purchase Sales represents customers' purchased sales plus cash advances.
(3) Gross interest revenue earned divided by average managed loans.
(4) Includes certain fees that are recorded as interest revenue. NM Not meaningful
(5) Total Revenues, net of Interest Expense, less Net Credit Losses. Reclassified to conform to the current period's presentation.
Page 10
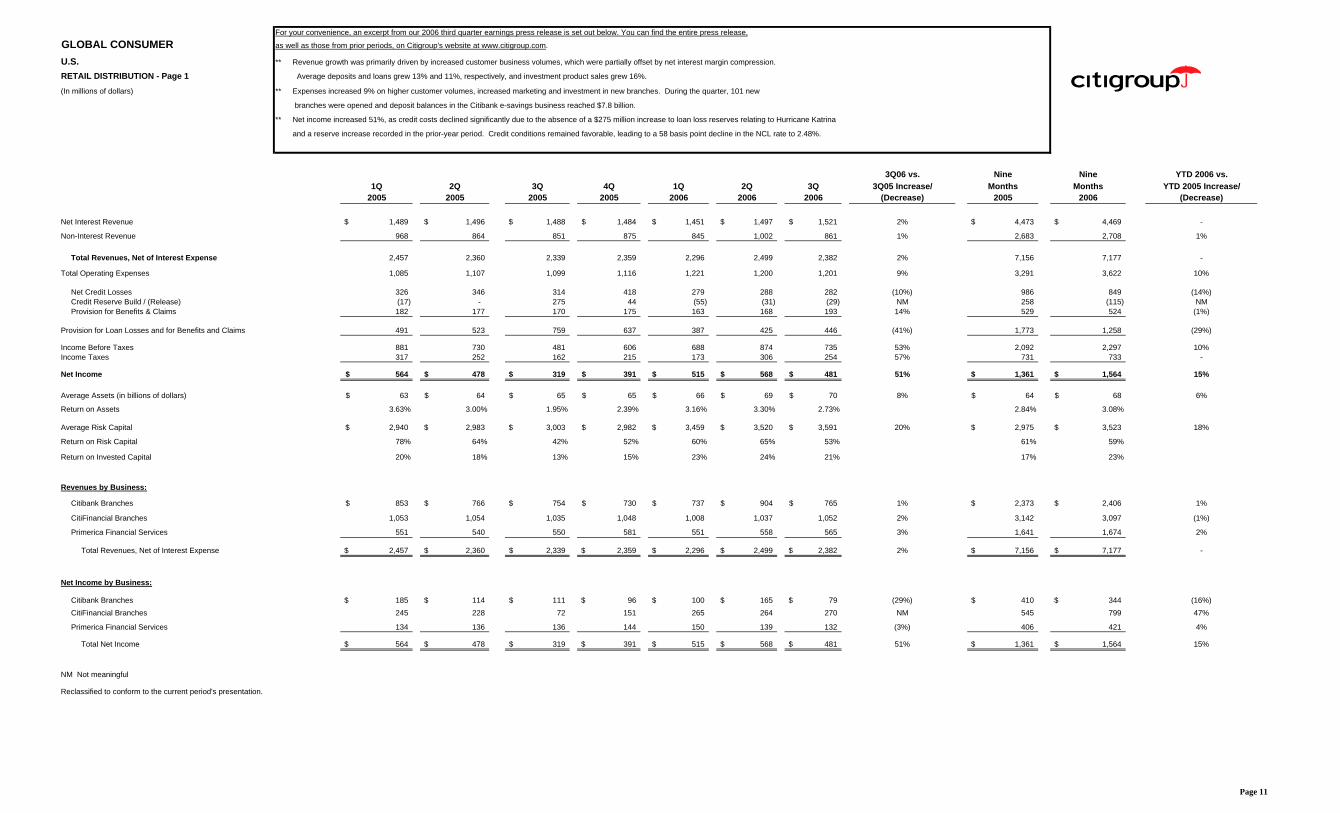
For your convenience, an excerpt from our 2006 third quarter earnings press release is set out below. You can find the entire press release,
GLOBAL CONSUMER as well as those from prior periods, on Citigroup's website at www.citigroup.com.
U.S. ** Revenue growth was primarily driven by increased customer business volumes, which were partially offset by net interest margin compression.
RETAIL DISTRIBUTION - Page 1 Average deposits and loans grew 13% and 11%, respectively, and investment product sales grew 16%.
(In millions of dollars) ** Expenses increased 9% on higher customer volumes, increased marketing and investment in new branches. During the quarter, 101 new
branches were opened and deposit balances in the Citibank e-savings business reached $7.8 billion.
** Net income increased 51%, as credit costs declined significantly due to the absence of a $275 million increase to loan loss reserves relating to Hurricane Katrina
and a reserve increase recorded in the prior-year period. Credit conditions remained favorable, leading to a 58 basis point decline in the NCL rate to 2.48%.
3Q06 vs. Nine Nine YTD 2006 vs.1Q 2Q 3Q 4Q 1Q 2Q 3Q 3Q05 Increase/ Months Months YTD 2005 Increase/
2005 2005 2005 2005 2006 2006 2006 (Decrease) 2005 2006 (Decrease)
Net Interest Revenue 1,489$ 1,496$ 1,488$ 1,484$ 1,451$ 1,497$ 1,521$ 2% 4,473$ 4,469$ -
Non-Interest Revenue 968 864 851 875 845 1,002 861 1% 2,683 2,708 1%
Total Revenues, Net of Interest Expense 2,457 2,360 2,339 2,359 2,296 2,499 2,382 2% 7,156 7,177 -
Total Operating Expenses 1,085 1,107 1,099 1,116 1,221 1,200 1,201 9% 3,291 3,622 10%
Net Credit Losses 326 346 314 418 279 288 282 (10%) 986 849 (14%)Credit Reserve Build / (Release) (17) - 275 44 (55) (31) (29) NM 258 (115) NMProvision for Benefits & Claims 182 177 170 175 163 168 193 14% 529 524 (1%)
Provision for Loan Losses and for Benefits and Claims 491 523 759 637 387 425 446 (41%) 1,773 1,258 (29%)
Income Before Taxes 881 730 481 606 688 874 735 53% 2,092 2,297 10%Income Taxes 317 252 162 215 173 306 254 57% 731 733 -
Net Income 564$ 478$ 319$ 391$ 515$ 568$ 481$ 51% 1,361$ 1,564$ 15%
Average Assets (in billions of dollars) 63$ 64$ 65$ 65$ 66$ 69$ 70$ 8% 64$ 68$ 6%
Return on Assets 3.63% 3.00% 1.95% 2.39% 3.16% 3.30% 2.73% 2.84% 3.08%
Average Risk Capital 2,940$ 2,983$ 3,003$ 2,982$ 3,459$ 3,520$ 3,591$ 20% 2,975$ 3,523$ 18%
Return on Risk Capital 78% 64% 42% 52% 60% 65% 53% 61% 59%
Return on Invested Capital 20% 18% 13% 15% 23% 24% 21% 17% 23%
Revenues by Business:
Citibank Branches 853$ 766$ 754$ 730$ 737$ 904$ 765$ 1% 2,373$ 2,406$ 1%
CitiFinancial Branches 1,053 1,054 1,035 1,048 1,008 1,037 1,052 2% 3,142 3,097 (1%)
Primerica Financial Services 551 540 550 581 551 558 565 3% 1,641 1,674 2%
Total Revenues, Net of Interest Expense 2,457$ 2,360$ 2,339$ 2,359$ 2,296$ 2,499$ 2,382$ 2% 7,156$ 7,177$ -
Net Income by Business:
Citibank Branches 185$ 114$ 111$ 96$ 100$ 165$ 79$ (29%) 410$ 344$ (16%)CitiFinancial Branches 245 228 72 151 265 264 270 NM 545 799 47%
Primerica Financial Services 134 136 136 144 150 139 132 (3%) 406 421 4%
Total Net Income 564$ 478$ 319$ 391$ 515$ 568$ 481$ 51% 1,361$ 1,564$ 15%
NM Not meaningful
Reclassified to conform to the current period's presentation.
Page 11
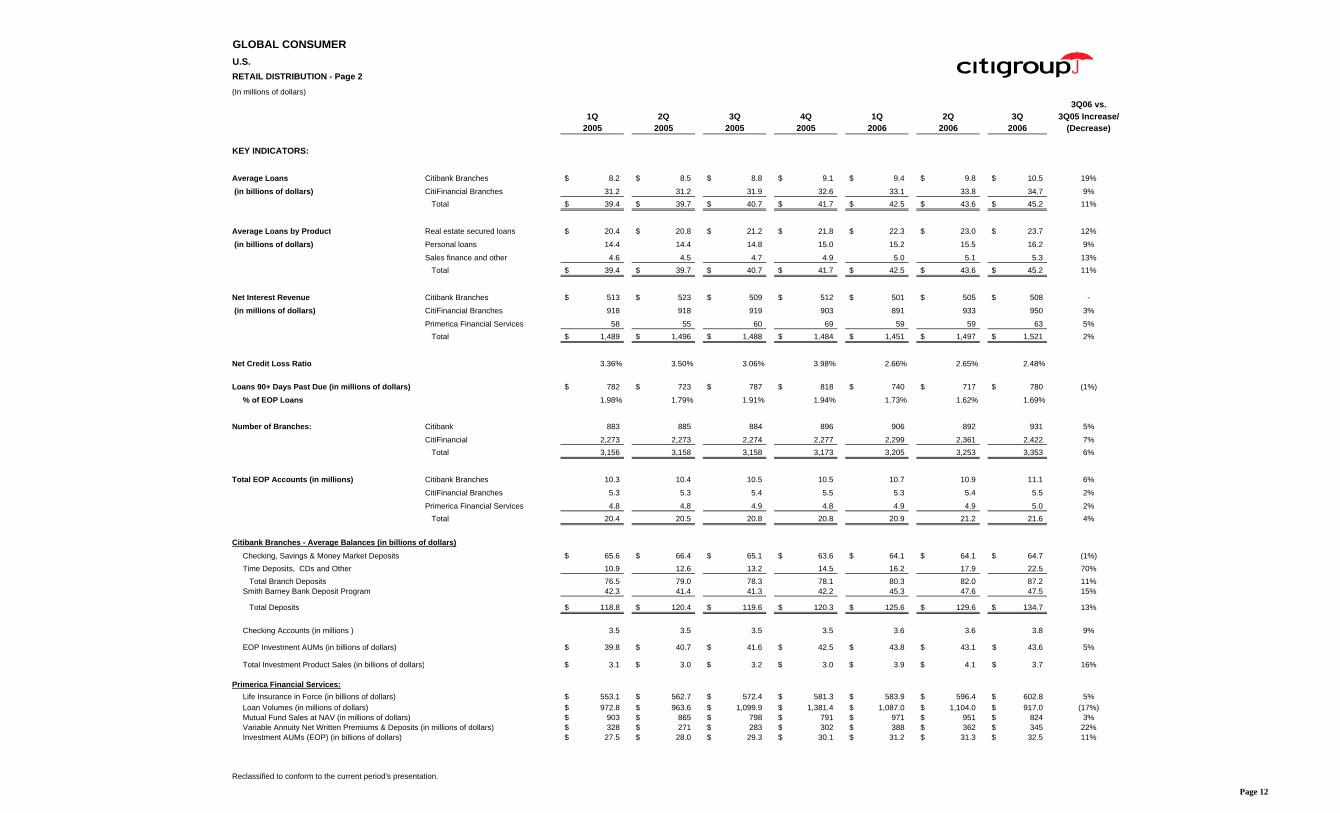
GLOBAL CONSUMERU.S.RETAIL DISTRIBUTION - Page 2
(In millions of dollars)3Q06 vs.
1Q 2Q 3Q 4Q 1Q 2Q 3Q 3Q05 Increase/2005 2005 2005 2005 2006 2006 2006 (Decrease)
KEY INDICATORS:
Average Loans Citibank Branches 8.2$ 8.5$ 8.8$ 9.1$ 9.4$ 9.8$ 10.5$ 19%
(in billions of dollars) CitiFinancial Branches 31.2 31.2 31.9 32.6 33.1 33.8 34.7 9% Total 39.4$ 39.7$ 40.7$ 41.7$ 42.5$ 43.6$ 45.2$ 11%
Average Loans by Product Real estate secured loans 20.4$ 20.8$ 21.2$ 21.8$ 22.3$ 23.0$ 23.7$ 12%
(in billions of dollars) Personal loans 14.4 14.4 14.8 15.0 15.2 15.5 16.2 9%
Sales finance and other 4.6 4.5 4.7 4.9 5.0 5.1 5.3 13% Total 39.4$ 39.7$ 40.7$ 41.7$ 42.5$ 43.6$ 45.2$ 11%
Net Interest Revenue Citibank Branches 513$ 523$ 509$ 512$ 501$ 505$ 508$ -
(in millions of dollars) CitiFinancial Branches 918 918 919 903 891 933 950 3%
Primerica Financial Services 58 55 60 69 59 59 63 5% Total 1,489$ 1,496$ 1,488$ 1,484$ 1,451$ 1,497$ 1,521$ 2%
Net Credit Loss Ratio 3.36% 3.50% 3.06% 3.98% 2.66% 2.65% 2.48%
Loans 90+ Days Past Due (in millions of dollars) 782$ 723$ 787$ 818$ 740$ 717$ 780$ (1%)
% of EOP Loans 1.98% 1.79% 1.91% 1.94% 1.73% 1.62% 1.69%
Number of Branches: Citibank 883 885 884 896 906 892 931 5%
CitiFinancial 2,273 2,273 2,274 2,277 2,299 2,361 2,422 7% Total 3,156 3,158 3,158 3,173 3,205 3,253 3,353 6%
Total EOP Accounts (in millions) Citibank Branches 10.3 10.4 10.5 10.5 10.7 10.9 11.1 6%
CitiFinancial Branches 5.3 5.3 5.4 5.5 5.3 5.4 5.5 2%
Primerica Financial Services 4.8 4.8 4.9 4.8 4.9 4.9 5.0 2% Total 20.4 20.5 20.8 20.8 20.9 21.2 21.6 4%
Citibank Branches - Average Balances (in billions of dollars)Checking, Savings & Money Market Deposits 65.6$ 66.4$ 65.1$ 63.6$ 64.1$ 64.1$ 64.7$ (1%)Time Deposits, CDs and Other 10.9 12.6 13.2 14.5 16.2 17.9 22.5 70% Total Branch Deposits 76.5 79.0 78.3 78.1 80.3 82.0 87.2 11%Smith Barney Bank Deposit Program 42.3 41.4 41.3 42.2 45.3 47.6 47.5 15%
Total Deposits 118.8$ 120.4$ 119.6$ 120.3$ 125.6$ 129.6$ 134.7$ 13%
Checking Accounts (in millions ) 3.5 3.5 3.5 3.5 3.6 3.6 3.8 9%
EOP Investment AUMs (in billions of dollars) 39.8$ 40.7$ 41.6$ 42.5$ 43.8$ 43.1$ 43.6$ 5%
Total Investment Product Sales (in billions of dollars) 3.1$ 3.0$ 3.2$ 3.0$ 3.9$ 4.1$ 3.7$ 16%
Primerica Financial Services:Life Insurance in Force (in billions of dollars) 553.1$ 562.7$ 572.4$ 581.3$ 583.9$ 596.4$ 602.8$ 5%Loan Volumes (in millions of dollars) 972.8$ 963.6$ 1,099.9$ 1,381.4$ 1,087.0$ 1,104.0$ 917.0$ (17%)Mutual Fund Sales at NAV (in millions of dollars) 903$ 865$ 798$ 791$ 971$ 951$ 824$ 3%Variable Annuity Net Written Premiums & Deposits (in millions of dollars) 328$ 271$ 283$ 302$ 388$ 362$ 345$ 22%Investment AUMs (EOP) (in billions of dollars) 27.5$ 28.0$ 29.3$ 30.1$ 31.2$ 31.3$ 32.5$ 11%
Reclassified to conform to the current period's presentation.
Page 12

For your convenience, an excerpt from our 2006 third quarter earnings press release is set out below. You can find the entire press release,
GLOBAL CONSUMER as well as those from prior periods, on Citigroup's website at www.citigroup.com.
U.S. ** Revenues increased 11%, driven by growth in net servicing revenues and gains on sales of securities. Net interest revenues declined slightly, as 19% growth in average
CONSUMER LENDING - Page 1 loans was offset by net interest margin compression across the loan portfolios.
(In millions of dollars) ** Expenses increased 6%, primarily due to investment spending. Higher credit costs reflected portfolio growth and the absence of prior-year reserve releases.
3Q06 vs. Nine Nine YTD 2006 vs.1Q 2Q 3Q 4Q 1Q 2Q 3Q 3Q05 Increase/ Months Months YTD 2005 Increase/
2005 2005 2005 2005 2006 2006 2006 (Decrease) 2005 2006 (Decrease)
Net Interest Revenue 1,273$ 1,227$ 1,209$ 1,222$ 1,207$ 1,214$ 1,185$ (2%) 3,709$ 3,606$ (3%)
Non-Interest Revenue 100 149 123 166 53 93 296 NM 372 442 19%
Total Revenues, Net of Interest Expense 1,373 1,376 1,332 1,388 1,260 1,307 1,481 11% 4,081 4,048 (1%)
Total Operating Expenses 411 413 425 451 453 444 450 6% 1,249 1,347 8%
Net Credit Losses 181 146 168 178 176 160 193 15% 495 529 7%Credit Reserve Build / (Release) (1) 1 (56) (8) (31) (75) (8) 86% (56) (114) NMProvision for Benefits & Claims 2 1 2 - (2) 1 1 (50%) 5 - (100%)
Provision for Loan Losses and for Benefits and Claims 182 148 114 170 143 86 186 63% 444 415 (7%)
Income Before Taxes and Minority Interest 780 815 793 767 664 777 845 7% 2,388 2,286 (4%)
Income Taxes 281 292 289 293 218 287 308 7% 862 813 (6%)Minority Interest, Net of Tax 13 16 17 16 9 20 16 (6%) 46 45 (2%)
Net Income 486$ 507$ 487$ 458$ 437$ 470$ 521$ 7% 1,480$ 1,428$ (4%)
Average Assets (in billions of dollars) 178$ 186$ 192$ 201$ 209$ 221$ 244$ 27% 185$ 225$ 22%
Return on Assets 1.11% 1.09% 1.01% 0.90% 0.85% 0.85% 0.85% 1.07% 0.85%
Average Risk Capital 3,291$ 3,341$ 3,218$ 3,270$ 3,732$ 3,451$ 3,770$ 17% 3,283$ 3,651$ 11%
Return on Risk Capital 60% 61% 60% 56% 47% 55% 55% 60% 52%
Return on Invested Capital 38% 32% 31% 29% 27% 30% 31% 34% 28%
Revenues by Business:Real Estate Lending 924$ 888$ 836$ 910$ 843$ 793$ 1,000$ 20% 2,648$ 2,636$ -Student Loans 132 176 173 171 117 202 163 (6%) 481 482 -Auto 317 312 323 307 300 312 318 (2%) 952 930 (2%)
Total Revenues, Net of Interest Expense 1,373$ 1,376$ 1,332$ 1,388$ 1,260$ 1,307$ 1,481$ 11% 4,081$ 4,048$ (1%)
Net Income by Business:
Real Estate Lending 363$ 356$ 318$ 341$ 328$ 297$ 389$ 22% 1,037$ 1,014$ (2%)Student Loans 52 62 62 58 38 75 58 (6%) 176 171 (3%)
Auto 71 89 107 59 71 98 74 (31%) 267 243 (9%)
Total Net Income 486$ 507$ 487$ 458$ 437$ 470$ 521$ 7% 1,480$ 1,428$ (4%)
NM Not meaningful
Reclassified to conform to the current period's presentation.
Page 13

GLOBAL CONSUMERU.S.CONSUMER LENDING - Page 2
3Q06 vs.1Q 2Q 3Q 4Q 1Q 2Q 3Q 3Q05 Increase/
2005 2005 2005 2005 2006 2006 2006 (Decrease)
KEY INDICATORS:
Real Estate Lending - Balances (in billions of dollars):
Average Loans 122.2$ 126.5$ 132.2$ 141.5$ 149.6$ 159.1$ 163.5$ 24%
Originations 25.9$ 33.3$ 37.0$ 35.7$ 32.4$ 38.6$ 35.8$ (3%)Third Party Mortgage Servicing Portfolio (EOP) 288.8$ 287.2$ 293.5$ 293.8$ 307.4$ 324.9$ 353.2$ 20%Net Servicing & Gain/(Loss) on Sale - (in millions of dollars) 82.3$ 82.3$ 51.9$ 77.1$ 10.5$ (11.7)$ 74.4$ 43%
Net Interest Revenue - (in millions of dollars) 831$ 793$ 774$ 815$ 812$ 804$ 789$ 2%NIR as a % of Average Loans 2.76% 2.51% 2.32% 2.29% 2.20% 2.03% 1.91%
Net Credit Loss Ratio 0.23% 0.19% 0.17% 0.16% 0.19% 0.19% 0.19%
Loans 90+Days Past Due - (in millions of dollars) 1,911$ 1,672$ 1,697$ 1,766$ 1,605$ 1,524$ 1,692$ -% of EOP Loans 1.54% 1.31% 1.24% 1.22% 1.03% 0.94% 1.02%
Student Loans - Balances (in billions of dollars):
Average Loans 24.9$ 25.7$ 25.3$ 24.9$ 24.7$ 24.7$ 23.2$ (8%)Originations 2.6$ 1.6$ 3.8$ 2.8$ 2.9$ 1.9$ 4.1$ 8%
Net Interest Revenue - (in millions of dollars) 134$ 129$ 121$ 109$ 104$ 106$ 88$ (27%)NIR as a % of Average Loans 2.18% 2.01% 1.90% 1.74% 1.71% 1.72% 1.50%
Net Credit Loss Ratio 0.02% 0.07% 0.04% 0.08% 0.03% 0.08% 0.10%
Loans 90+Days Past Due - (in millions of dollars) 773$ 792$ 814$ 743$ 729$ 747$ 726$ (11%)% of EOP Loans 3.06% 3.25% 3.25% 3.11% 2.95% 3.26% 3.34%
Auto - (in billions of dollars):
Average Loans 11.0$ 11.4$ 11.9$ 12.3$ 12.8$ 13.5$ 14.3$ 20%Originations 1.4$ 1.6$ 1.9$ 1.5$ 2.0$ 2.0$ 2.4$ 26%
Net Interest Revenue - (in millions of dollars) 308$ 305$ 314$ 298$ 291$ 304$ 309$ (2%)NIR as a % of Average Loans 11.36% 10.73% 10.47% 9.61% 9.22% 9.03% 8.57%
Net Credit Margin (NCM) - (in millions of dollars) 204$ 231$ 213$ 191$ 196$ 231$ 207$ (3%)NCM as a % of Average Loans 7.52% 8.13% 7.10% 6.16% 6.21% 6.86% 5.74%
Net Credit Loss Ratio 4.17% 2.81% 3.70% 3.74% 3.29% 2.44% 3.08%
Loans 90+Days Past Due - (in millions of dollars) 74$ 75$ 97$ 115$ 77$ 85$ 138$ 42%% of EOP Loans 0.66% 0.65% 0.80% 0.93% 0.58% 0.61% 0.93%
Reclassified to conform to the current period's presentation.Page 14
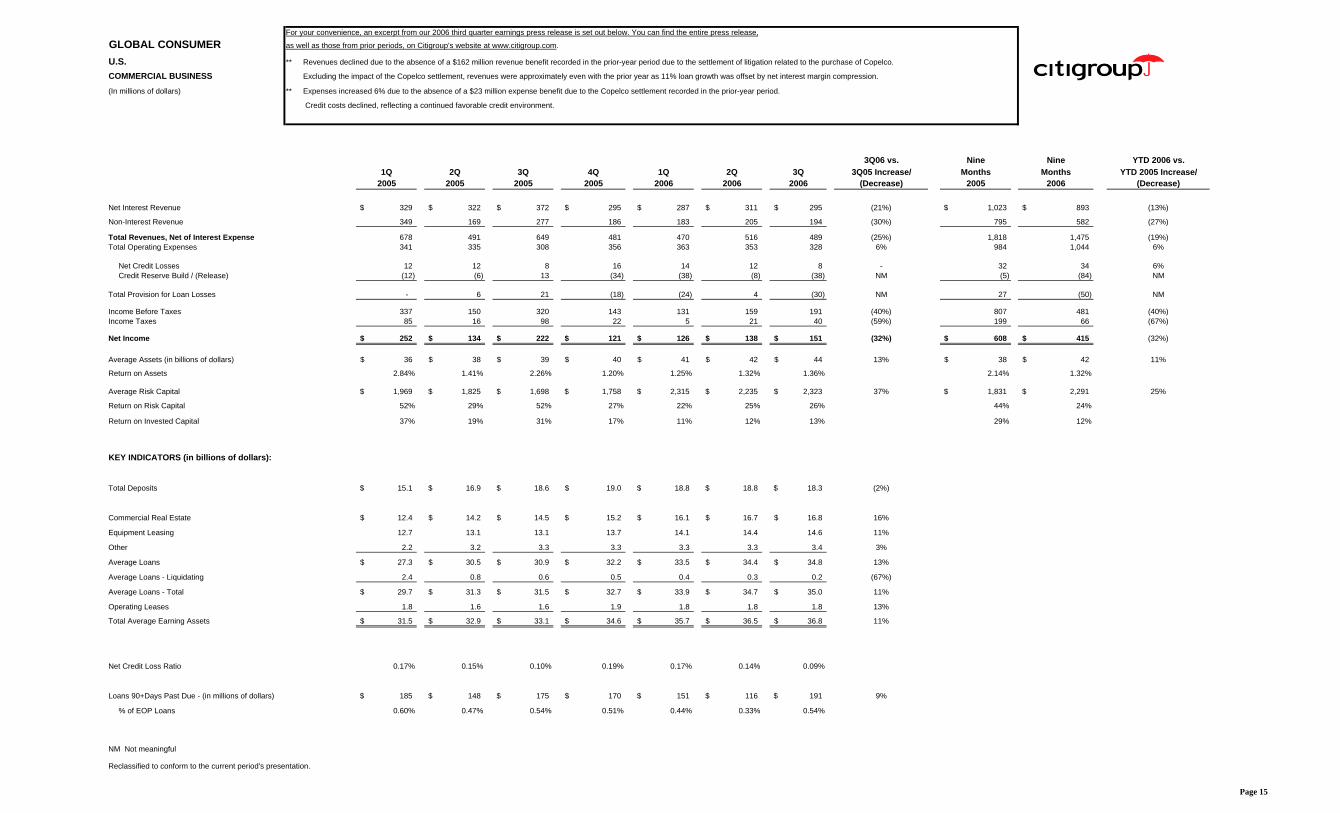
For your convenience, an excerpt from our 2006 third quarter earnings press release is set out below. You can find the entire press release,
GLOBAL CONSUMER as well as those from prior periods, on Citigroup's website at www.citigroup.com.
U.S. ** Revenues declined due to the absence of a $162 million revenue benefit recorded in the prior-year period due to the settlement of litigation related to the purchase of Copelco.
COMMERCIAL BUSINESS Excluding the impact of the Copelco settlement, revenues were approximately even with the prior year as 11% loan growth was offset by net interest margin compression.
(In millions of dollars) ** Expenses increased 6% due to the absence of a $23 million expense benefit due to the Copelco settlement recorded in the prior-year period.
Credit costs declined, reflecting a continued favorable credit environment.
3Q06 vs. Nine Nine YTD 2006 vs.1Q 2Q 3Q 4Q 1Q 2Q 3Q 3Q05 Increase/ Months Months YTD 2005 Increase/
2005 2005 2005 2005 2006 2006 2006 (Decrease) 2005 2006 (Decrease)
Net Interest Revenue 329$ 322$ 372$ 295$ 287$ 311$ 295$ (21%) 1,023$ 893$ (13%)
Non-Interest Revenue 349 169 277 186 183 205 194 (30%) 795 582 (27%)
Total Revenues, Net of Interest Expense 678 491 649 481 470 516 489 (25%) 1,818 1,475 (19%)Total Operating Expenses 341 335 308 356 363 353 328 6% 984 1,044 6%
Net Credit Losses 12 12 8 16 14 12 8 - 32 34 6%Credit Reserve Build / (Release) (12) (6) 13 (34) (38) (8) (38) NM (5) (84) NM
Total Provision for Loan Losses - 6 21 (18) (24) 4 (30) NM 27 (50) NM
Income Before Taxes 337 150 320 143 131 159 191 (40%) 807 481 (40%)Income Taxes 85 16 98 22 5 21 40 (59%) 199 66 (67%)
Net Income 252$ 134$ 222$ 121$ 126$ 138$ 151$ (32%) 608$ 415$ (32%)
Average Assets (in billions of dollars) 36$ 38$ 39$ 40$ 41$ 42$ 44$ 13% 38$ 42$ 11%
Return on Assets 2.84% 1.41% 2.26% 1.20% 1.25% 1.32% 1.36% 2.14% 1.32%
Average Risk Capital 1,969$ 1,825$ 1,698$ 1,758$ 2,315$ 2,235$ 2,323$ 37% 1,831$ 2,291$ 25%
Return on Risk Capital 52% 29% 52% 27% 22% 25% 26% 44% 24%
Return on Invested Capital 37% 19% 31% 17% 11% 12% 13% 29% 12%
KEY INDICATORS (in billions of dollars):
Total Deposits 15.1$ 16.9$ 18.6$ 19.0$ 18.8$ 18.8$ 18.3$ (2%)
Commercial Real Estate 12.4$ 14.2$ 14.5$ 15.2$ 16.1$ 16.7$ 16.8$ 16%
Equipment Leasing 12.7 13.1 13.1 13.7 14.1 14.4 14.6 11%
Other 2.2 3.2 3.3 3.3 3.3 3.3 3.4 3%
Average Loans 27.3$ 30.5$ 30.9$ 32.2$ 33.5$ 34.4$ 34.8$ 13%
Average Loans - Liquidating 2.4 0.8 0.6 0.5 0.4 0.3 0.2 (67%)
Average Loans - Total 29.7$ 31.3$ 31.5$ 32.7$ 33.9$ 34.7$ 35.0$ 11%
Operating Leases 1.8 1.6 1.6 1.9 1.8 1.8 1.8 13%
Total Average Earning Assets 31.5$ 32.9$ 33.1$ 34.6$ 35.7$ 36.5$ 36.8$ 11%
Net Credit Loss Ratio 0.17% 0.15% 0.10% 0.19% 0.17% 0.14% 0.09%
Loans 90+Days Past Due - (in millions of dollars) 185$ 148$ 175$ 170$ 151$ 116$ 191$ 9%
% of EOP Loans 0.60% 0.47% 0.54% 0.51% 0.44% 0.33% 0.54%
NM Not meaningful
Reclassified to conform to the current period's presentation.
Page 15
For your convenience, an excerpt from our 2006 third quarter earnings press release is set out below. You can find the entire press release,
GLOBAL CONSUMER as well as those from prior periods, on Citigroup's website at www.citigroup.com.
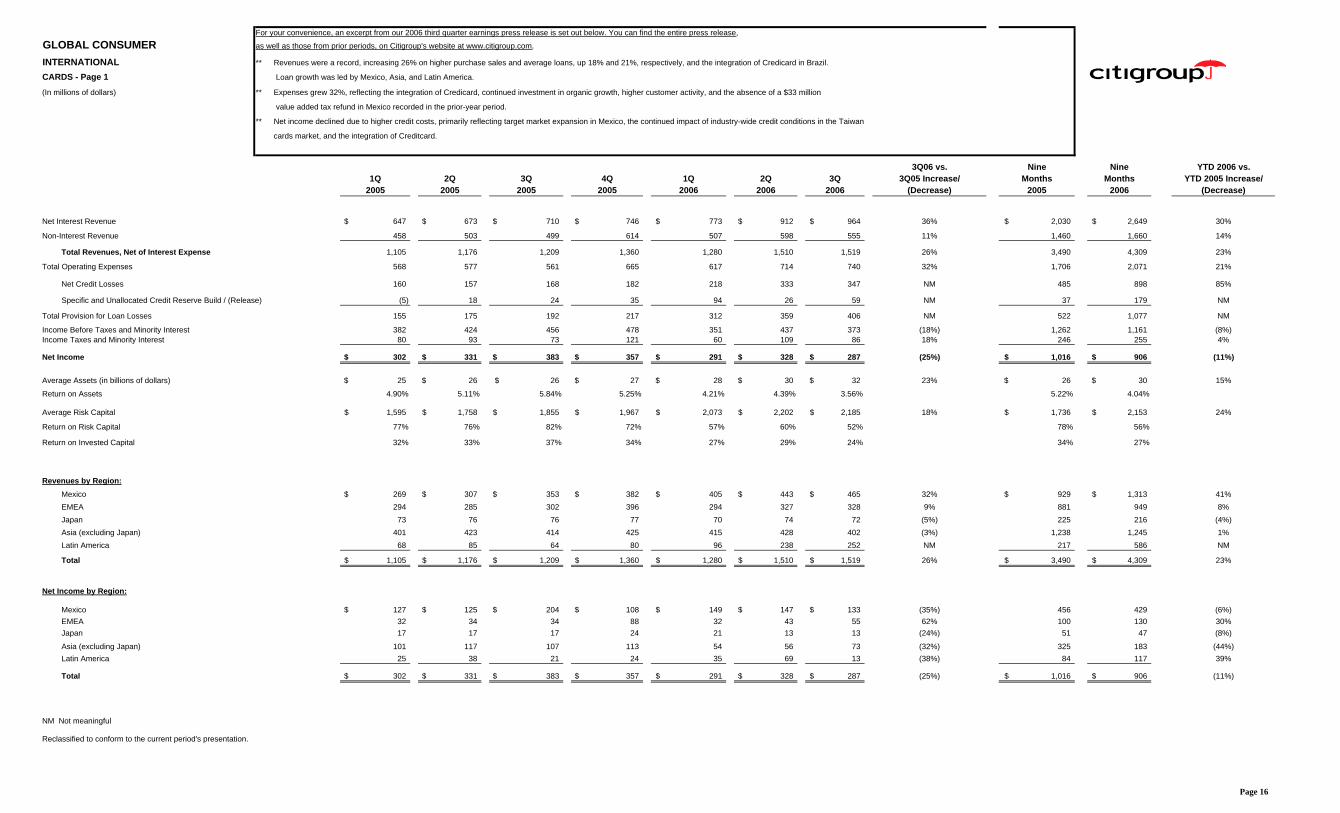
INTERNATIONAL ** Revenues were a record, increasing 26% on higher purchase sales and average loans, up 18% and 21%, respectively, and the integration of Credicard in Brazil.
CARDS - Page 1 Loan growth was led by Mexico, Asia, and Latin America.
(In millions of dollars) ** Expenses grew 32%, reflecting the integration of Credicard, continued investment in organic growth, higher customer activity, and the absence of a $33 million
value added tax refund in Mexico recorded in the prior-year period.
** Net income declined due to higher credit costs, primarily reflecting target market expansion in Mexico, the continued impact of industry-wide credit conditions in the Taiwan
cards market, and the integration of Creditcard.
3Q06 vs. Nine Nine YTD 2006 vs.1Q 2Q 3Q 4Q 1Q 2Q 3Q 3Q05 Increase/ Months Months YTD 2005 Increase/
2005 2005 2005 2005 2006 2006 2006 (Decrease) 2005 2006 (Decrease)
Net Interest Revenue 647$ 673$ 710$ 746$ 773$ 912$ 964$ 36% 2,030$ 2,649$ 30%
Non-Interest Revenue 458 503 499 614 507 598 555 11% 1,460 1,660 14%
Total Revenues, Net of Interest Expense 1,105 1,176 1,209 1,360 1,280 1,510 1,519 26% 3,490 4,309 23%
Total Operating Expenses 568 577 561 665 617 714 740 32% 1,706 2,071 21%
Net Credit Losses 160 157 168 182 218 333 347 NM 485 898 85%
Specific and Unallocated Credit Reserve Build / (Release) (5) 18 24 35 94 26 59 NM 37 179 NM
Total Provision for Loan Losses 155 175 192 217 312 359 406 NM 522 1,077 NM
Income Before Taxes and Minority Interest 382 424 456 478 351 437 373 (18%) 1,262 1,161 (8%)Income Taxes and Minority Interest 80 93 73 121 60 109 86 18% 246 255 4%
Net Income 302$ 331$ 383$ 357$ 291$ 328$ 287$ (25%) 1,016$ 906$ (11%)
Average Assets (in billions of dollars) 25$ 26$ 26$ 27$ 28$ 30$ 32$ 23% 26$ 30$ 15%
Return on Assets 4.90% 5.11% 5.84% 5.25% 4.21% 4.39% 3.56% 5.22% 4.04%
Average Risk Capital 1,595$ 1,758$ 1,855$ 1,967$ 2,073$ 2,202$ 2,185$ 18% 1,736$ 2,153$ 24%
Return on Risk Capital 77% 76% 82% 72% 57% 60% 52% 78% 56%
Return on Invested Capital 32% 33% 37% 34% 27% 29% 24% 34% 27%
Revenues by Region:Mexico 269$ 307$ 353$ 382$ 405$ 443$ 465$ 32% 929$ 1,313$ 41%EMEA 294 285 302 396 294 327 328 9% 881 949 8%Japan 73 76 76 77 70 74 72 (5%) 225 216 (4%)Asia (excluding Japan) 401 423 414 425 415 428 402 (3%) 1,238 1,245 1%Latin America 68 85 64 80 96 238 252 NM 217 586 NM
Total 1,105$ 1,176$ 1,209$ 1,360$ 1,280$ 1,510$ 1,519$ 26% 3,490$ 4,309$ 23%
Net Income by Region:
Mexico 127$ 125$ 204$ 108$ 149$ 147$ 133$ (35%) 456 429 (6%)EMEA 32 34 34 88 32 43 55 62% 100 130 30%Japan 17 17 17 24 21 13 13 (24%) 51 47 (8%)
Asia (excluding Japan) 101 117 107 113 54 56 73 (32%) 325 183 (44%)Latin America 25 38 21 24 35 69 13 (38%) 84 117 39%
Total 302$ 331$ 383$ 357$ 291$ 328$ 287$ (25%) 1,016$ 906$ (11%)
NM Not meaningful
Reclassified to conform to the current period's presentation.
Page 16
GLOBAL CONSUMERINTERNATIONALCARDS - Page 2
(In millions of dollars)
3Q06 vs.1Q 2Q 3Q 4Q 1Q 2Q 3Q 3Q05 Increase/
2005 2005 2005 2005 2006 2006 2006 (Decrease)
KEY INDICATORS (in billions of dollars)
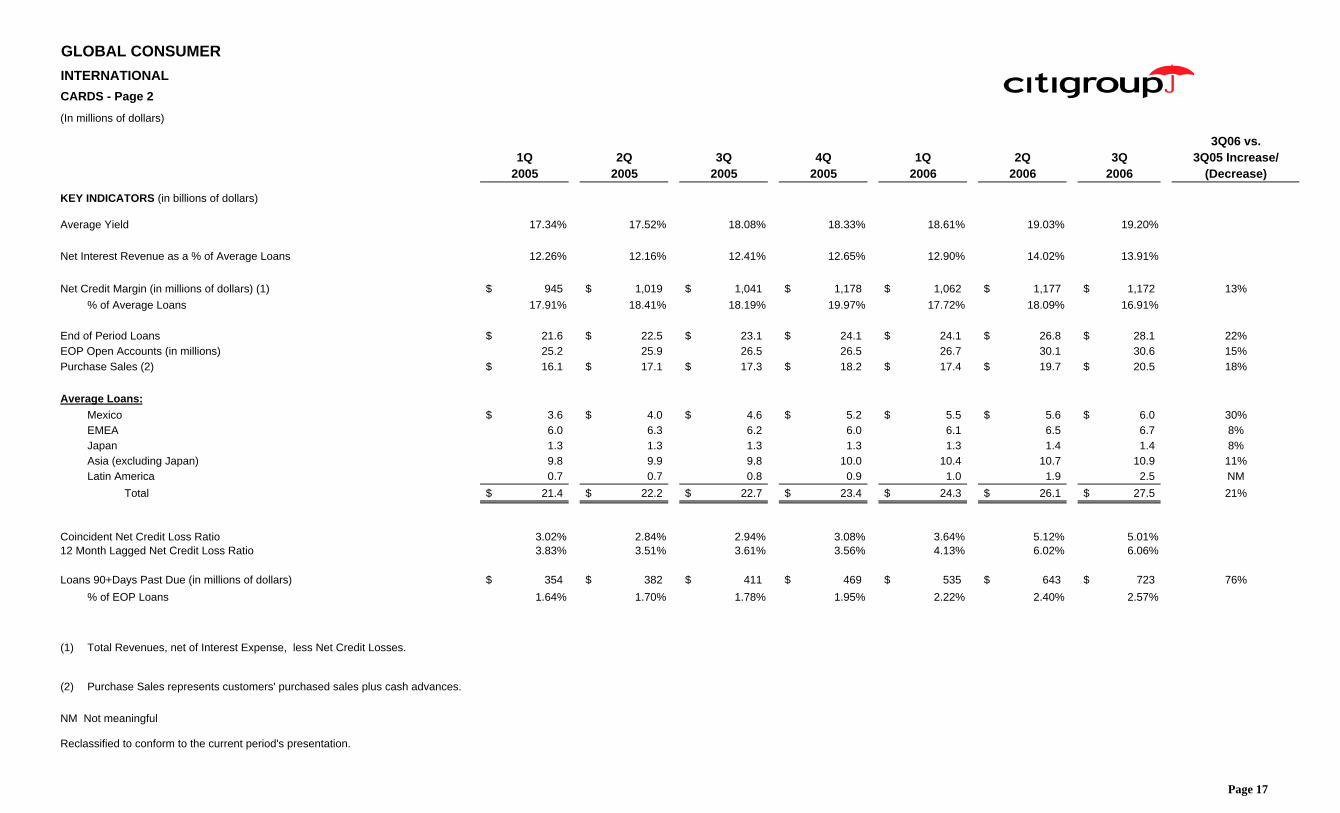
Average Yield 17.34% 17.52% 18.08% 18.33% 18.61% 19.03% 19.20%
Net Interest Revenue as a % of Average Loans 12.26% 12.16% 12.41% 12.65% 12.90% 14.02% 13.91%
Net Credit Margin (in millions of dollars) (1) 945$ 1,019$ 1,041$ 1,178$ 1,062$ 1,177$ 1,172$ 13%% of Average Loans 17.91% 18.41% 18.19% 19.97% 17.72% 18.09% 16.91%
End of Period Loans 21.6$ 22.5$ 23.1$ 24.1$ 24.1$ 26.8$ 28.1$ 22%EOP Open Accounts (in millions) 25.2 25.9 26.5 26.5 26.7 30.1 30.6 15%Purchase Sales (2) 16.1$ 17.1$ 17.3$ 18.2$ 17.4$ 19.7$ 20.5$ 18%
Average Loans:Mexico 3.6$ 4.0$ 4.6$ 5.2$ 5.5$ 5.6$ 6.0$ 30%EMEA 6.0 6.3 6.2 6.0 6.1 6.5 6.7 8%Japan 1.3 1.3 1.3 1.3 1.3 1.4 1.4 8%Asia (excluding Japan) 9.8 9.9 9.8 10.0 10.4 10.7 10.9 11%Latin America 0.7 0.7 0.8 0.9 1.0 1.9 2.5 NM
Total 21.4$ 22.2$ 22.7$ 23.4$ 24.3$ 26.1$ 27.5$ 21%
Coincident Net Credit Loss Ratio 3.02% 2.84% 2.94% 3.08% 3.64% 5.12% 5.01%12 Month Lagged Net Credit Loss Ratio 3.83% 3.51% 3.61% 3.56% 4.13% 6.02% 6.06%
Loans 90+Days Past Due (in millions of dollars) 354$ 382$ 411$ 469$ 535$ 643$ 723$ 76%% of EOP Loans 1.64% 1.70% 1.78% 1.95% 2.22% 2.40% 2.57%
(1) Total Revenues, net of Interest Expense, less Net Credit Losses.
(2) Purchase Sales represents customers' purchased sales plus cash advances.
NM Not meaningful
Reclassified to conform to the current period's presentation.
Page 17
For your convenience, an excerpt from our 2006 third quarter earnings press release is set out below. You can find the entire press release,
GLOBAL CONSUMER as well as those from prior periods, on Citigroup's website at www.citigroup.com.
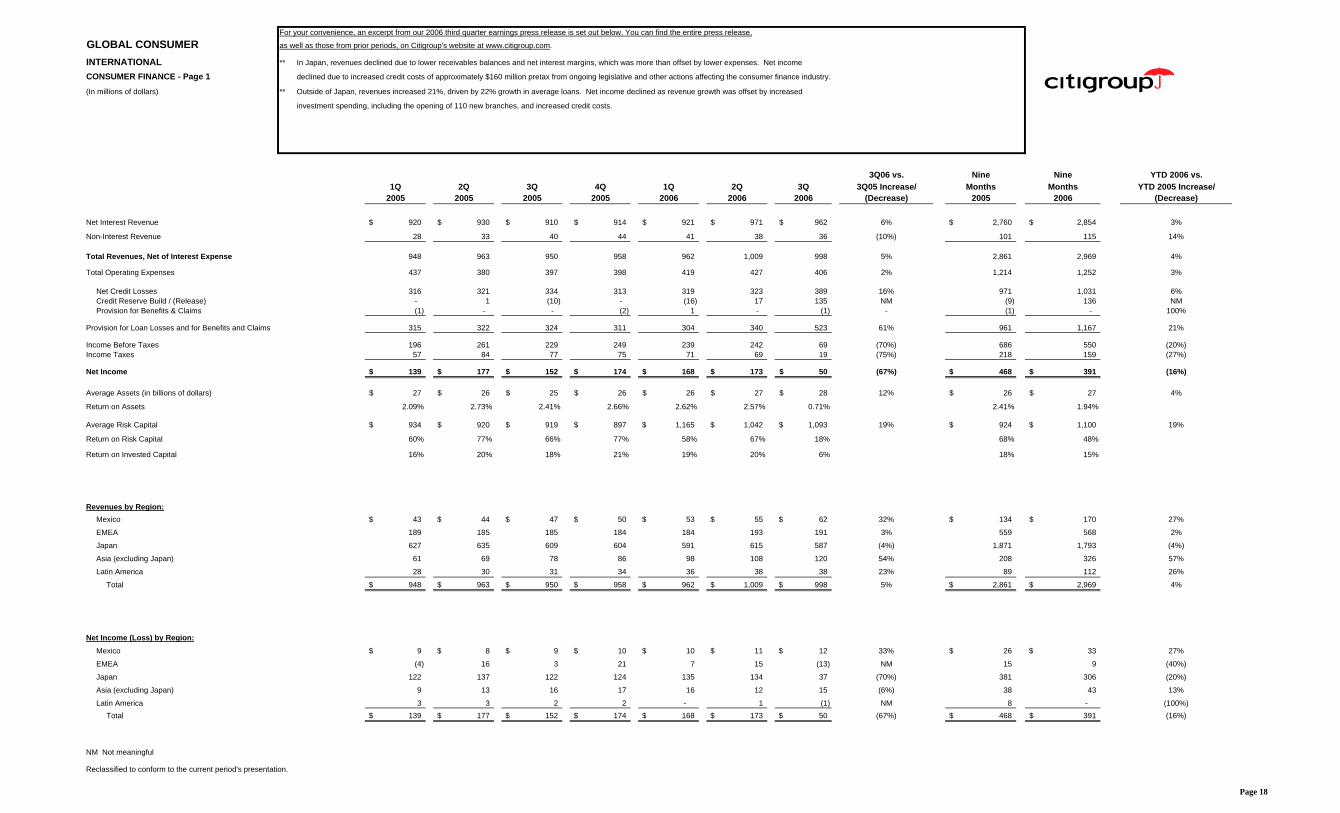
INTERNATIONAL ** In Japan, revenues declined due to lower receivables balances and net interest margins, which was more than offset by lower expenses. Net income
CONSUMER FINANCE - Page 1 declined due to increased credit costs of approximately $160 million pretax from ongoing legislative and other actions affecting the consumer finance industry.
(In millions of dollars) ** Outside of Japan, revenues increased 21%, driven by 22% growth in average loans. Net income declined as revenue growth was offset by increased
investment spending, including the opening of 110 new branches, and increased credit costs.
3Q06 vs. Nine Nine YTD 2006 vs.1Q 2Q 3Q 4Q 1Q 2Q 3Q 3Q05 Increase/ Months Months YTD 2005 Increase/
2005 2005 2005 2005 2006 2006 2006 (Decrease) 2005 2006 (Decrease)
Net Interest Revenue 920$ 930$ 910$ 914$ 921$ 971$ 962$ 6% 2,760$ 2,854$ 3%
Non-Interest Revenue 28 33 40 44 41 38 36 (10%) 101 115 14%
Total Revenues, Net of Interest Expense 948 963 950 958 962 1,009 998 5% 2,861 2,969 4%
Total Operating Expenses 437 380 397 398 419 427 406 2% 1,214 1,252 3%
Net Credit Losses 316 321 334 313 319 323 389 16% 971 1,031 6%Credit Reserve Build / (Release) - 1 (10) - (16) 17 135 NM (9) 136 NMProvision for Benefits & Claims (1) - - (2) 1 - (1) - (1) - 100%
Provision for Loan Losses and for Benefits and Claims 315 322 324 311 304 340 523 61% 961 1,167 21%
Income Before Taxes 196 261 229 249 239 242 69 (70%) 686 550 (20%)Income Taxes 57 84 77 75 71 69 19 (75%) 218 159 (27%)
Net Income 139$ 177$ 152$ 174$ 168$ 173$ 50$ (67%) 468$ 391$ (16%)
Average Assets (in billions of dollars) 27$ 26$ 25$ 26$ 26$ 27$ 28$ 12% 26$ 27$ 4%
Return on Assets 2.09% 2.73% 2.41% 2.66% 2.62% 2.57% 0.71% 2.41% 1.94%
Average Risk Capital 934$ 920$ 919$ 897$ 1,165$ 1,042$ 1,093$ 19% 924$ 1,100$ 19%
Return on Risk Capital 60% 77% 66% 77% 58% 67% 18% 68% 48%
Return on Invested Capital 16% 20% 18% 21% 19% 20% 6% 18% 15%
Revenues by Region:Mexico 43$ 44$ 47$ 50$ 53$ 55$ 62$ 32% 134$ 170$ 27%
EMEA 189 185 185 184 184 193 191 3% 559 568 2%
Japan 627 635 609 604 591 615 587 (4%) 1,871 1,793 (4%)
Asia (excluding Japan) 61 69 78 86 98 108 120 54% 208 326 57%
Latin America 28 30 31 34 36 38 38 23% 89 112 26%
Total 948$ 963$ 950$ 958$ 962$ 1,009$ 998$ 5% 2,861$ 2,969$ 4%
Net Income (Loss) by Region:Mexico 9$ 8$ 9$ 10$ 10$ 11$ 12$ 33% 26$ 33$ 27%
EMEA (4) 16 3 21 7 15 (13) NM 15 9 (40%)
Japan 122 137 122 124 135 134 37 (70%) 381 306 (20%)
Asia (excluding Japan) 9 13 16 17 16 12 15 (6%) 38 43 13%
Latin America 3 3 2 2 - 1 (1) NM 8 - (100%)Total 139$ 177$ 152$ 174$ 168$ 173$ 50$ (67%) 468$ 391$ (16%)
NM Not meaningful
Reclassified to conform to the current period's presentation.
Page 18

GLOBAL CONSUMER INTERNATIONALCONSUMER FINANCE - Page 2
3Q06 vs.1Q 2Q 3Q 4Q 1Q 2Q 3Q 3Q05 Increase/
2005 2005 2005 2005 2006 2006 2006 (Decrease)
KEY INDICATORS:
Average Loans by Product (in billions of dollars):Real estate secured loans 8.3$ 8.1$ 8.0$ 8.2$ 8.1$ 8.5$ 8.6$ 8%Personal loans 13.0 12.9 12.8 12.8 13.3 14.3 14.6 14%
Auto 0.8 0.6 0.5 0.4 0.3 0.3 0.2 (60%)Sales finance and other 0.7 0.8 0.6 0.7 0.7 0.7 0.8 33%
Total 22.8$ 22.4$ 21.9$ 22.1$ 22.4$ 23.8$ 24.2$ 11%
Average Loans by Region (in billions of dollars):Mexico 0.2$ 0.2$ 0.3$ 0.3$ 0.3$ 0.3$ 0.4$ 33%EMEA 9.9 9.7 9.5 9.7 9.6 10.4 10.5 11%Japan 10.9 10.5 10.0 9.6 9.6 9.9 9.7 (3%)Asia (excluding Japan) 1.4 1.6 1.7 2.0 2.3 2.6 2.9 71%Latin America 0.4 0.4 0.4 0.5 0.6 0.6 0.7 75%
Total 22.8$ 22.4$ 21.9$ 22.1$ 22.4$ 23.8$ 24.2$ 11%
Average Yield 18.31% 18.90% 18.87% 18.63% 19.06% 18.88% 18.49%
Net Interest Revenue as a % of Average Loans 16.36% 16.65% 16.49% 16.41% 16.67% 16.36% 15.77%
Net Credit Margin (NCM) - (in millions of dollars) 632$ 642$ 617$ 645$ 643$ 686$ 609$ (1%)NCM as a % of Average Loans 11.24% 11.50% 11.18% 11.58% 11.64% 11.56% 9.98%
Net Credit Loss Ratio 5.62% 5.75% 6.03% 5.62% 5.78% 5.44% 6.38%
Net Credit Loss Ratio - Japan 9.25% 9.68% 9.77% 9.92% 9.12% 9.74% 11.26%
Loans 90+ Days Past Due - (in millions of dollars) 480$ 477$ 467$ 442$ 437$ 519$ 575$ 23%% of EOP Loans 2.12% 2.17% 2.13% 2.03% 1.93% 2.16% 2.37%
Number of Sales Points:Japan Branches 405 405 392 325 325 324 324 (17%)Japan Automated Loan Machines (ALMs) 523 588 654 682 731 809 809 24%
Total Japan 928 993 1,046 1,007 1,056 1,133 1,133 8%
Mexico Branches 217 233 255 268 288 312 349 37%
EMEA Branches 264 277 282 284 306 326 339 20%Asia (excluding Japan) Branches 224 250 293 418 489 547 582 99%Latin America Branches 118 128 138 160 180 188 213 54%
Total 1,751 1,881 2,014 2,137 2,319 2,506 2,616 30%
Reclassified to conform to the current period's presentation.
Page 19

For your convenience, an excerpt from our 2006 third quarter earnings press release is set out below. You can find the entire press release,GLOBAL CONSUMER as well as those from prior periods, on Citigroup's website at www.citigroup.com.INTERNATIONAL ** Revenue growth was driven by a 9% increase in deposits and 18% growth in investment product sales. Average loan balances increased 3%, led
RETAIL BANKING - Page 1 by growth in Asia, EMEA and Latin America.
(In millions of dollars) ** Expense growth reflected increased business volumes, continued investment spending, and the absence of a $93 million value added tax refund in Mexico
recorded in the prior-year period. During the quarter, 66 new branches were opened.
** Credit costs declined significantly due to the absence of a $476 million pre-tax charge to standardize loan write-off policies in EMEA with global write-off policies.
Credit costs included loan loss reserve releases in Korea and Mexico. The NCL rate declined to 0.87%.
3Q06 vs. Nine Nine YTD 2006 vs.1Q 2Q 3Q 4Q 1Q 2Q 3Q 3Q05 Increase/ Months Months YTD 2005 Increase/
2005 2005 2005 2005 2006 2006 2006 (Decrease) 2005 2006 (Decrease)
Net Interest Revenue 1,435$ 1,516$ 1,375$ 1,404$ 1,439$ 1,460$ 1,519$ 10% 4,326$ 4,418$ 2%
Non-Interest Revenue 870 880 1,099 1,148 1,028 1,095 1,031 (6%) 2,849 3,154 11%
Total Revenues, Net of Interest Expense 2,305 2,396 2,474 2,552 2,467 2,555 2,550 3% 7,175 7,572 6%
Total Operating Expenses 1,417 1,363 1,322 1,435 1,585 1,560 1,623 23% 4,102 4,768 16%
Net Credit Losses 179 181 1,288 234 184 191 141 (89%) 1,648 516 (69%)Credit Reserve Build / (Release) (9) 19 (649) 51 (77) (105) (93) 86% (639) (275) 57%Provision for Benefits & Claims 33 33 42 50 44 37 55 31% 108 136 26%
Provision for Loan Losses and for Benefits and Claims 203 233 681 335 151 123 103 (85%) 1,117 377 (66%)
Income Before Taxes and Minority Interest 685 800 471 782 731 872 824 75% 1,956 2,427 24%
Income Taxes and Minority Interest 187 207 44 217 54 158 123 NM 438 335 (24%)
Net Income 498$ 593$ 427$ 565$ 677$ 714$ 701$ 64% 1,518$ 2,092$ 38%
Average Assets (in billions of dollars) 113$ 114$ 115$ 116$ 119$ 120$ 127$ 10% 114$ 122$ 7%
Return on Assets 1.79% 2.09% 1.47% 1.93% 2.31% 2.39% 2.19% 1.78% 2.29%
Average Risk Capital 9,983$ 10,663$ 10,802$ 9,764$ 9,407$ 9,481$ 9,348$ (13%) 10,483$ 9,412$ (10%)
Return on Risk Capital 20% 22% 16% 23% 29% 30% 30% 19% 30%
Return on Invested Capital 12% 13% 9% 12% 15% 16% 15% 10% 15%
Total Revenues, Net of Interest Expense:Mexico 648$ 704$ 739$ 787$ 691$ 694$ 711$ (4%) 2,091$ 2,096$ -EMEA 765 786 784 846 792 840 834 6% 2,335 2,466 6%Japan 121 116 118 119 114 118 123 4% 355 355 -Asia (excluding Japan) 610 624 649 621 676 708 687 6% 1,883 2,071 10%Latin America 161 166 184 179 194 195 195 6% 511 584 14%
Total 2,305$ 2,396$ 2,474$ 2,552$ 2,467$ 2,555$ 2,550$ 3% 7,175$ 7,572$ 6%
Net Income (Loss) by Region:
Mexico 141$ 235$ 298$ 158$ 199$ 217$ 250$ (16%) 674$ 666$ (1%)EMEA 94 74 (191) 173 146 157 171 NM (23) 474 NMJapan 36 34 30 26 32 31 29 (3%) 100 92 (8%)Asia (excluding Japan) 201 211 252 193 277 291 240 (5%) 664 808 22%Latin America 26 39 38 15 23 18 11 (71%) 103 52 (50%)
Total 498$ 593$ 427$ 565$ 677$ 714$ 701$ 64% 1,518$ 2,092$ 38%
KEY INDICATORS:
Net Credit Loss Ratio 1.17% 1.17% 8.20% 1.53% 1.21% 1.22% 0.87%
Loans 90+Days Past Due (in millions of dollars) 2,013$ 1,901$ 770$ 779$ 736$ 680$ 679$ (12%)% of EOP Loans 3.26% 3.09% 1.26% 1.29% 1.21% 1.08% 1.04%
Branches by Region:Mexico 1,346 1,334 1,335 1,382 1,404 1,441 1,452 9%EMEA 612 619 618 625 636 663 682 10%Japan 25 25 25 25 25 25 25 -Asia (excluding Japan) 354 394 396 401 403 404 405 2%Latin America 153 158 162 176 179 187 209 29%
Total 2,490 2,530 2,536 2,609 2,647 2,720 2,773 9%
NM Not meaningful
Reclassified to conform to the current period's presentation.
Page 20

GLOBAL CONSUMERINTERNATIONALRETAIL BANKING - Page 2
3Q06 vs.1Q 2Q 3Q 4Q 1Q 2Q 3Q 3Q05 Increase/
2005 2005 2005 2005 2006 2006 2006 (Decrease)
KEY INDICATORS (Continued):
International - Balances (in billions of dollars)
Checking, Savings & Money Market Deposits 72.5$ 71.0$ 70.6$ 72.2$ 76.8$ 78.8$ 77.6$ 10%Time Deposits, CDs and Other 63.2 63.3 65.5 66.8 67.7 67.8 70.8 8%
Total Average Deposits 135.7$ 134.3$ 136.1$ 139.0$ 144.5$ 146.6$ 148.4$ 9%
Investment Sales 12.5$ 11.4$ 13.6$ 13.3$ 17.1$ 18.2$ 16.0$ 18%
Investment AUMs (EOP) 74.8$ 76.4$ 81.4$ 83.3$ 90.1$ 90.0$ 95.2$ 17%Other (primarily Retirement Services) 31.0 32.3 34.9 37.2 40.3 39.1 38.6 11%
Total AUMs 105.8$ 108.7$ 116.3$ 120.5$ 130.4$ 129.1$ 133.8$ 15%
Average Customer Deposits by Region (in billions of dollars):
Mexico 23.0$ 23.1$ 23.6$ 25.4$ 25.9$ 24.9$ 25.7$ 9%
EMEA 25.9 25.3 26.7 28.1 31.0 32.8 32.7 22%Japan 21.9 21.2 21.1 20.7 20.8 21.1 20.9 (1%)Asia (excluding Japan) 57.9 57.6 57.7 57.7 59.6 60.6 61.5 7%Latin America 7.0 7.1 7.0 7.1 7.2 7.2 7.6 9%
Total 135.7$ 134.3$ 136.1$ 139.0$ 144.5$ 146.6$ 148.4$ 9%
Average Loans by Region (in billions of dollars):Mexico 7.3$ 7.6$ 7.8$ 8.0$ 8.2$ 7.7$ 7.9$ 1%EMEA 19.3 18.7 18.5 17.2 17.4 18.6 19.0 3%Japan 0.3 0.2 0.7 0.7 0.7 0.8 0.6 (14%)Asia (excluding Japan) 34.3 34.6 34.4 33.8 34.1 34.4 35.6 3%Latin America 0.8 0.8 0.9 1.0 1.1 1.1 1.3 44%
Total 62.0$ 61.9$ 62.3$ 60.7$ 61.5$ 62.6$ 64.4$ 3%
Average Loans by Type (in billions of dollars):
Mortgage 23.3$ 23.6$ 23.5$ 23.1$ 23.3$ 23.2$ 24.2$ 3%Auto 2.7 2.7 2.6 2.4 2.3 2.2 2.2 (15%)Installment / Overdraft 24.0 23.7 23.7 22.6 23.2 24.4 25.4 7%Commercial 7.7 7.8 7.8 7.9 8.1 8.2 8.5 9%Other Retail 4.3 4.1 4.7 4.7 4.6 4.6 4.1 (13%)
Total 62.0$ 61.9$ 62.3$ 60.7$ 61.5$ 62.6$ 64.4$ 3%
EOP Accounts by Region (in millions):
Mexico 17.1 17.5 17.9 18.1 18.5 19.0 19.8 11%
EMEA 8.4 8.6 8.7 8.9 9.0 9.3 9.6 10%Japan 2.1 2.1 2.1 2.0 2.0 2.1 2.1 -Asia (excluding Japan) 11.7 11.9 12.2 12.0 12.0 12.1 12.3 1%Latin America 6.4 6.5 6.6 6.7 7.0 7.2 7.5 14%
Total 45.7 46.6 47.5 47.7 48.5 49.7 51.3 8%
Reclassified to conform to the current period's presentation.
Page 21
CORPORATE AND INVESTMENT BANKING(In millions of dollars)
3Q06 vs. Nine Nine YTD 2006 vs.1Q 2Q 3Q 4Q 1Q 2Q 3Q 3Q05 Increase/ Months Months YTD 2005 Increase/
2005 2005 2005 2005 2006 2006 2006 (Decrease) 2005 2006 (Decrease)
Corporate and Investment Banking:
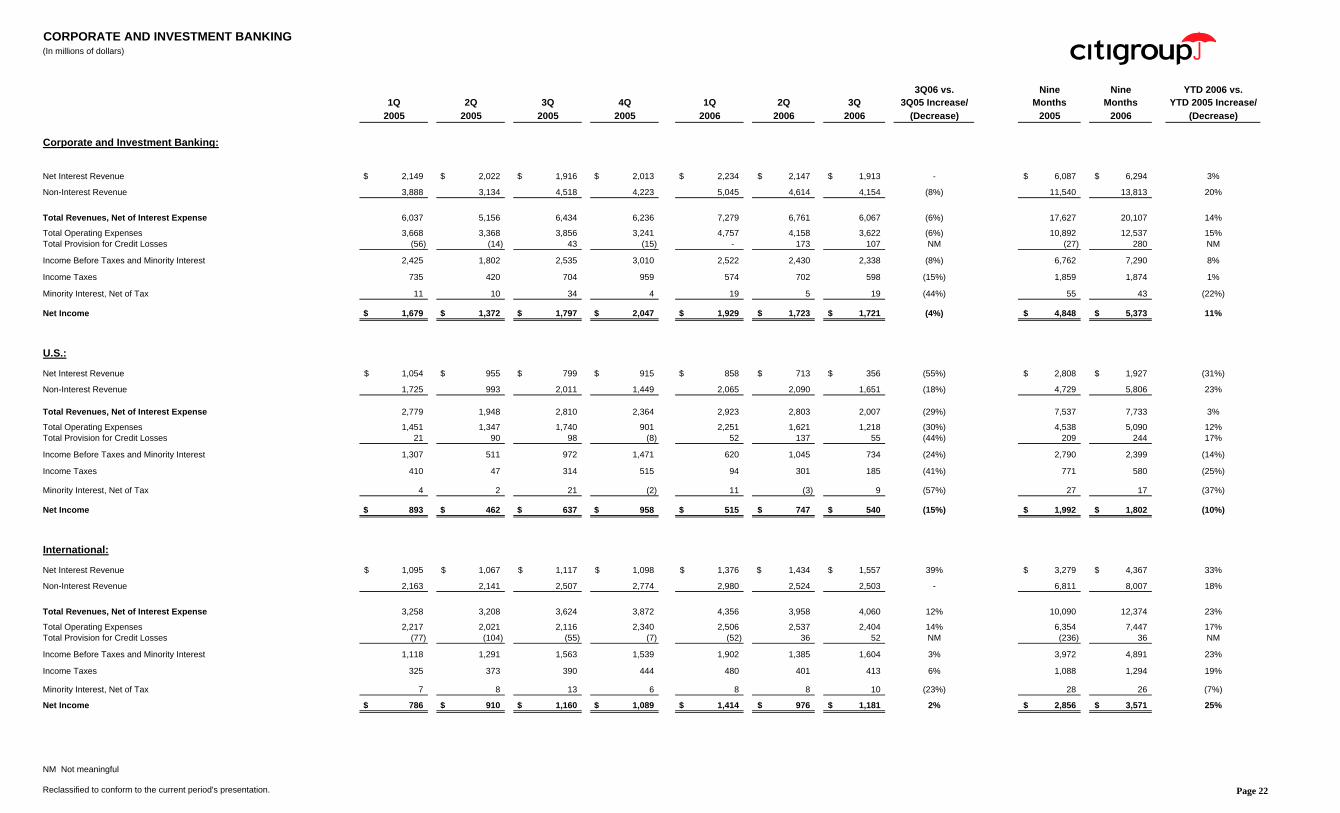
Net Interest Revenue 2,149$ 2,022$ 1,916$ 2,013$ 2,234$ 2,147$ 1,913$ - 6,087$ 6,294$ 3%
Non-Interest Revenue 3,888 3,134 4,518 4,223 5,045 4,614 4,154 (8%) 11,540 13,813 20%
Total Revenues, Net of Interest Expense 6,037 5,156 6,434 6,236 7,279 6,761 6,067 (6%) 17,627 20,107 14%
Total Operating Expenses 3,668 3,368 3,856 3,241 4,757 4,158 3,622 (6%) 10,892 12,537 15%Total Provision for Credit Losses (56) (14) 43 (15) - 173 107 NM (27) 280 NM
Income Before Taxes and Minority Interest 2,425 1,802 2,535 3,010 2,522 2,430 2,338 (8%) 6,762 7,290 8%
Income Taxes 735 420 704 959 574 702 598 (15%) 1,859 1,874 1%
Minority Interest, Net of Tax 11 10 34 4 19 5 19 (44%) 55 43 (22%)
Net Income 1,679$ 1,372$ 1,797$ 2,047$ 1,929$ 1,723$ 1,721$ (4%) 4,848$ 5,373$ 11%
U.S.:
Net Interest Revenue 1,054$ 955$ 799$ 915$ 858$ 713$ 356$ (55%) 2,808$ 1,927$ (31%)
Non-Interest Revenue 1,725 993 2,011 1,449 2,065 2,090 1,651 (18%) 4,729 5,806 23%
Total Revenues, Net of Interest Expense 2,779 1,948 2,810 2,364 2,923 2,803 2,007 (29%) 7,537 7,733 3%
Total Operating Expenses 1,451 1,347 1,740 901 2,251 1,621 1,218 (30%) 4,538 5,090 12%Total Provision for Credit Losses 21 90 98 (8) 52 137 55 (44%) 209 244 17%
Income Before Taxes and Minority Interest 1,307 511 972 1,471 620 1,045 734 (24%) 2,790 2,399 (14%)
Income Taxes 410 47 314 515 94 301 185 (41%) 771 580 (25%)
Minority Interest, Net of Tax 4 2 21 (2) 11 (3) 9 (57%) 27 17 (37%)
Net Income 893$ 462$ 637$ 958$ 515$ 747$ 540$ (15%) 1,992$ 1,802$ (10%)
International:
Net Interest Revenue 1,095$ 1,067$ 1,117$ 1,098$ 1,376$ 1,434$ 1,557$ 39% 3,279$ 4,367$ 33%
Non-Interest Revenue 2,163 2,141 2,507 2,774 2,980 2,524 2,503 - 6,811 8,007 18%
Total Revenues, Net of Interest Expense 3,258 3,208 3,624 3,872 4,356 3,958 4,060 12% 10,090 12,374 23%
Total Operating Expenses 2,217 2,021 2,116 2,340 2,506 2,537 2,404 14% 6,354 7,447 17%Total Provision for Credit Losses (77) (104) (55) (7) (52) 36 52 NM (236) 36 NM
Income Before Taxes and Minority Interest 1,118 1,291 1,563 1,539 1,902 1,385 1,604 3% 3,972 4,891 23%
Income Taxes 325 373 390 444 480 401 413 6% 1,088 1,294 19%
Minority Interest, Net of Tax 7 8 13 6 8 8 10 (23%) 28 26 (7%)
Net Income 786$ 910$ 1,160$ 1,089$ 1,414$ 976$ 1,181$ 2% 2,856$ 3,571$ 25%
NM Not meaningful
Reclassified to conform to the current period's presentation. Page 22
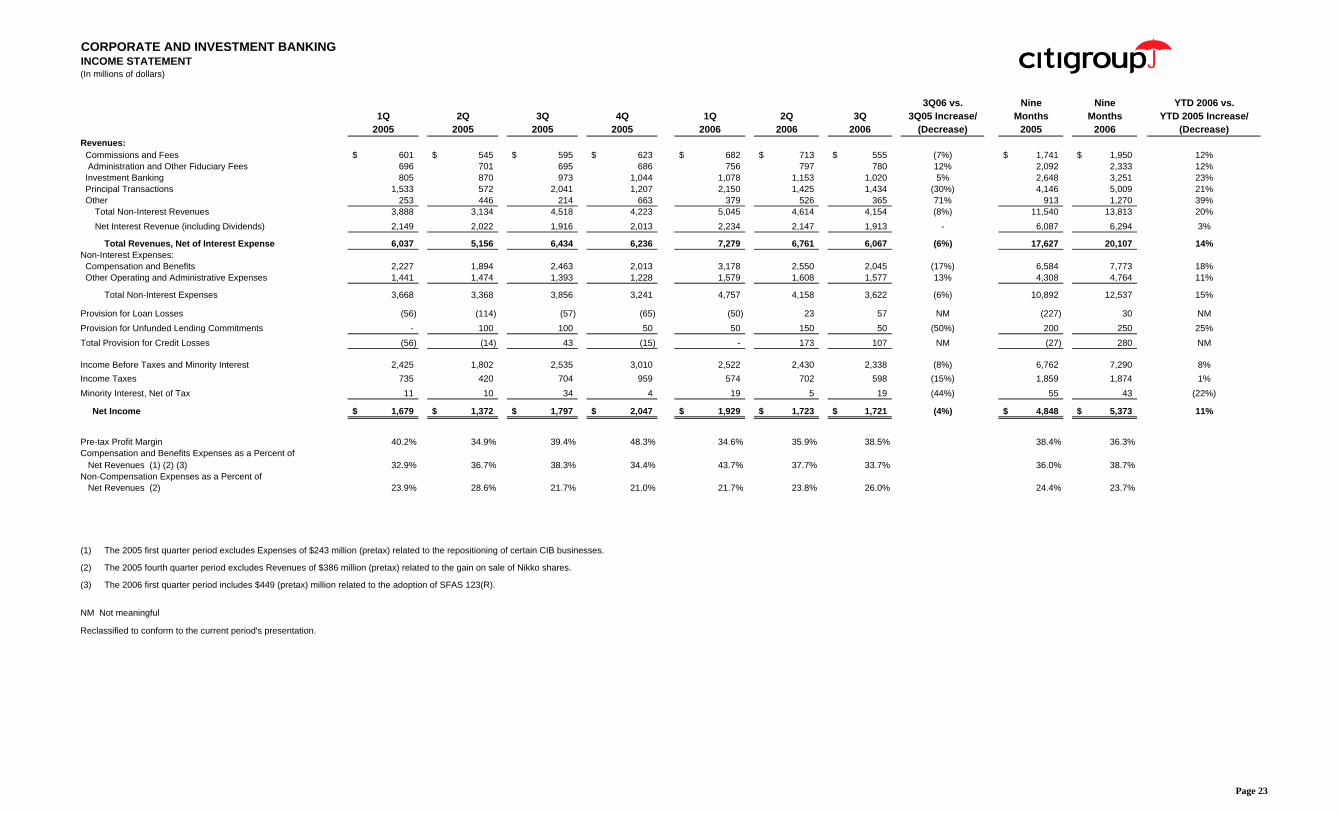
CORPORATE AND INVESTMENT BANKINGINCOME STATEMENT(In millions of dollars)
3Q06 vs. Nine Nine YTD 2006 vs.1Q 2Q 3Q 4Q 1Q 2Q 3Q 3Q05 Increase/ Months Months YTD 2005 Increase/
2005 2005 2005 2005 2006 2006 2006 (Decrease) 2005 2006 (Decrease)Revenues: Commissions and Fees 601$ 545$ 595$ 623$ 682$ 713$ 555$ (7%) 1,741$ 1,950$ 12% Administration and Other Fiduciary Fees 696 701 695 686 756 797 780 12% 2,092 2,333 12% Investment Banking 805 870 973 1,044 1,078 1,153 1,020 5% 2,648 3,251 23% Principal Transactions 1,533 572 2,041 1,207 2,150 1,425 1,434 (30%) 4,146 5,009 21% Other 253 446 214 663 379 526 365 71% 913 1,270 39%
Total Non-Interest Revenues 3,888 3,134 4,518 4,223 5,045 4,614 4,154 (8%) 11,540 13,813 20% Net Interest Revenue (including Dividends) 2,149 2,022 1,916 2,013 2,234 2,147 1,913 - 6,087 6,294 3%
Total Revenues, Net of Interest Expense 6,037 5,156 6,434 6,236 7,279 6,761 6,067 (6%) 17,627 20,107 14%Non-Interest Expenses: Compensation and Benefits 2,227 1,894 2,463 2,013 3,178 2,550 2,045 (17%) 6,584 7,773 18% Other Operating and Administrative Expenses 1,441 1,474 1,393 1,228 1,579 1,608 1,577 13% 4,308 4,764 11%
Total Non-Interest Expenses 3,668 3,368 3,856 3,241 4,757 4,158 3,622 (6%) 10,892 12,537 15%
Provision for Loan Losses (56) (114) (57) (65) (50) 23 57 NM (227) 30 NMProvision for Unfunded Lending Commitments - 100 100 50 50 150 50 (50%) 200 250 25%Total Provision for Credit Losses (56) (14) 43 (15) - 173 107 NM (27) 280 NM
Income Before Taxes and Minority Interest 2,425 1,802 2,535 3,010 2,522 2,430 2,338 (8%) 6,762 7,290 8%Income Taxes 735 420 704 959 574 702 598 (15%) 1,859 1,874 1%Minority Interest, Net of Tax 11 10 34 4 19 5 19 (44%) 55 43 (22%)
Net Income 1,679$ 1,372$ 1,797$ 2,047$ 1,929$ 1,723$ 1,721$ (4%) 4,848$ 5,373$ 11%
Pre-tax Profit Margin 40.2% 34.9% 39.4% 48.3% 34.6% 35.9% 38.5% 38.4% 36.3%Compensation and Benefits Expenses as a Percent of Net Revenues (1) (2) (3) 32.9% 36.7% 38.3% 34.4% 43.7% 37.7% 33.7% 36.0% 38.7%Non-Compensation Expenses as a Percent of Net Revenues (2) 23.9% 28.6% 21.7% 21.0% 21.7% 23.8% 26.0% 24.4% 23.7%
(1) The 2005 first quarter period excludes Expenses of $243 million (pretax) related to the repositioning of certain CIB businesses.
(2) The 2005 fourth quarter period excludes Revenues of $386 million (pretax) related to the gain on sale of Nikko shares.
(3) The 2006 first quarter period includes $449 (pretax) million related to the adoption of SFAS 123(R).
NM Not meaningful
Reclassified to conform to the current period's presentation.
Page 23
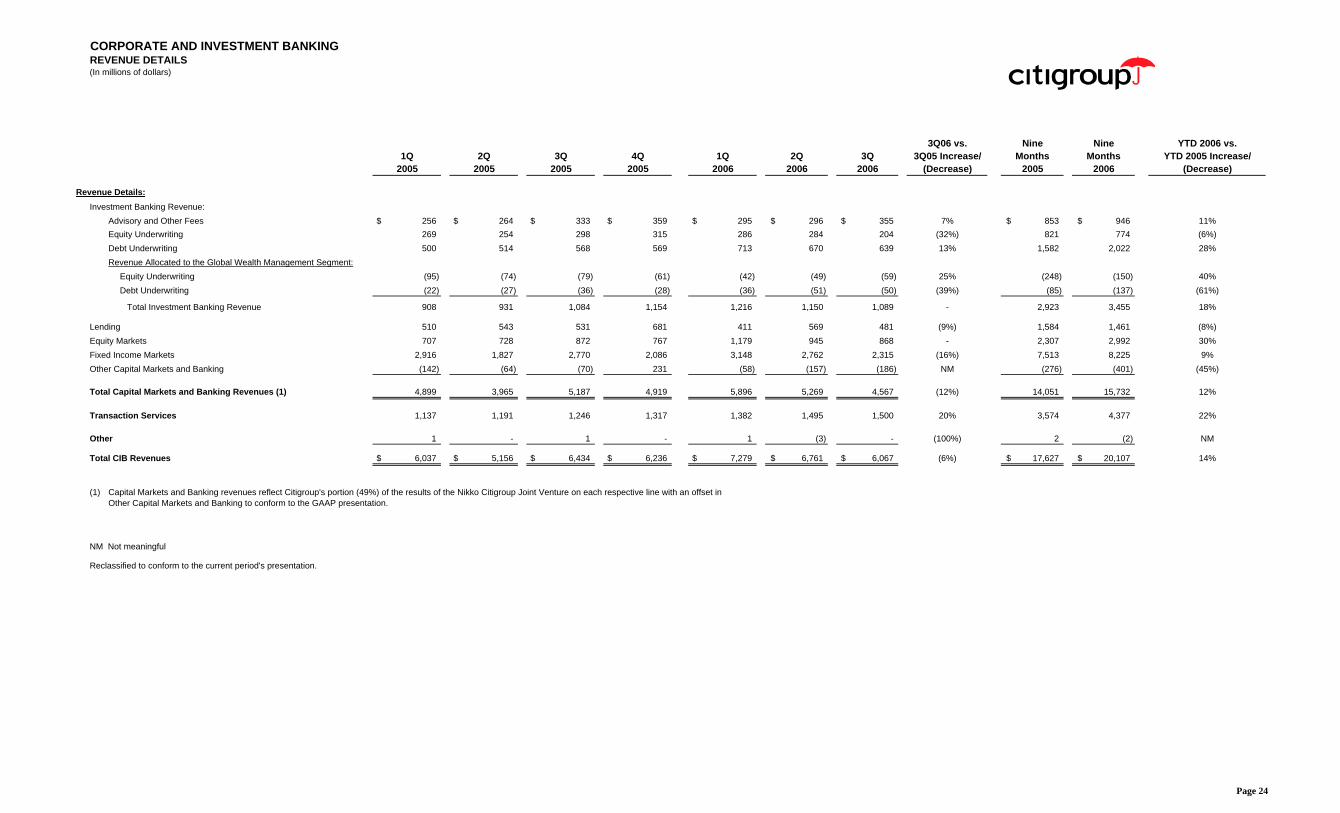
CORPORATE AND INVESTMENT BANKINGREVENUE DETAILS(In millions of dollars)
3Q06 vs. Nine Nine YTD 2006 vs.1Q 2Q 3Q 4Q 1Q 2Q 3Q 3Q05 Increase/ Months Months YTD 2005 Increase/
2005 2005 2005 2005 2006 2006 2006 (Decrease) 2005 2006 (Decrease)
Revenue Details:Investment Banking Revenue:
Advisory and Other Fees 256$ 264$ 333$ 359$ 295$ 296$ 355$ 7% 853$ 946$ 11%Equity Underwriting 269 254 298 315 286 284 204 (32%) 821 774 (6%)Debt Underwriting 500 514 568 569 713 670 639 13% 1,582 2,022 28%Revenue Allocated to the Global Wealth Management Segment:
Equity Underwriting (95) (74) (79) (61) (42) (49) (59) 25% (248) (150) 40%Debt Underwriting (22) (27) (36) (28) (36) (51) (50) (39%) (85) (137) (61%)
Total Investment Banking Revenue 908 931 1,084 1,154 1,216 1,150 1,089 - 2,923 3,455 18%
Lending 510 543 531 681 411 569 481 (9%) 1,584 1,461 (8%)Equity Markets 707 728 872 767 1,179 945 868 - 2,307 2,992 30%Fixed Income Markets 2,916 1,827 2,770 2,086 3,148 2,762 2,315 (16%) 7,513 8,225 9%Other Capital Markets and Banking (142) (64) (70) 231 (58) (157) (186) NM (276) (401) (45%)
Total Capital Markets and Banking Revenues (1) 4,899 3,965 5,187 4,919 5,896 5,269 4,567 (12%) 14,051 15,732 12%
Transaction Services 1,137 1,191 1,246 1,317 1,382 1,495 1,500 20% 3,574 4,377 22%
Other 1 - 1 - 1 (3) - (100%) 2 (2) NM
Total CIB Revenues 6,037$ 5,156$ 6,434$ 6,236$ 7,279$ 6,761$ 6,067$ (6%) 17,627$ 20,107$ 14%
(1) Capital Markets and Banking revenues reflect Citigroup's portion (49%) of the results of the Nikko Citigroup Joint Venture on each respective line with an offset inOther Capital Markets and Banking to conform to the GAAP presentation.
NM Not meaningful
Reclassified to conform to the current period's presentation.
Page 24
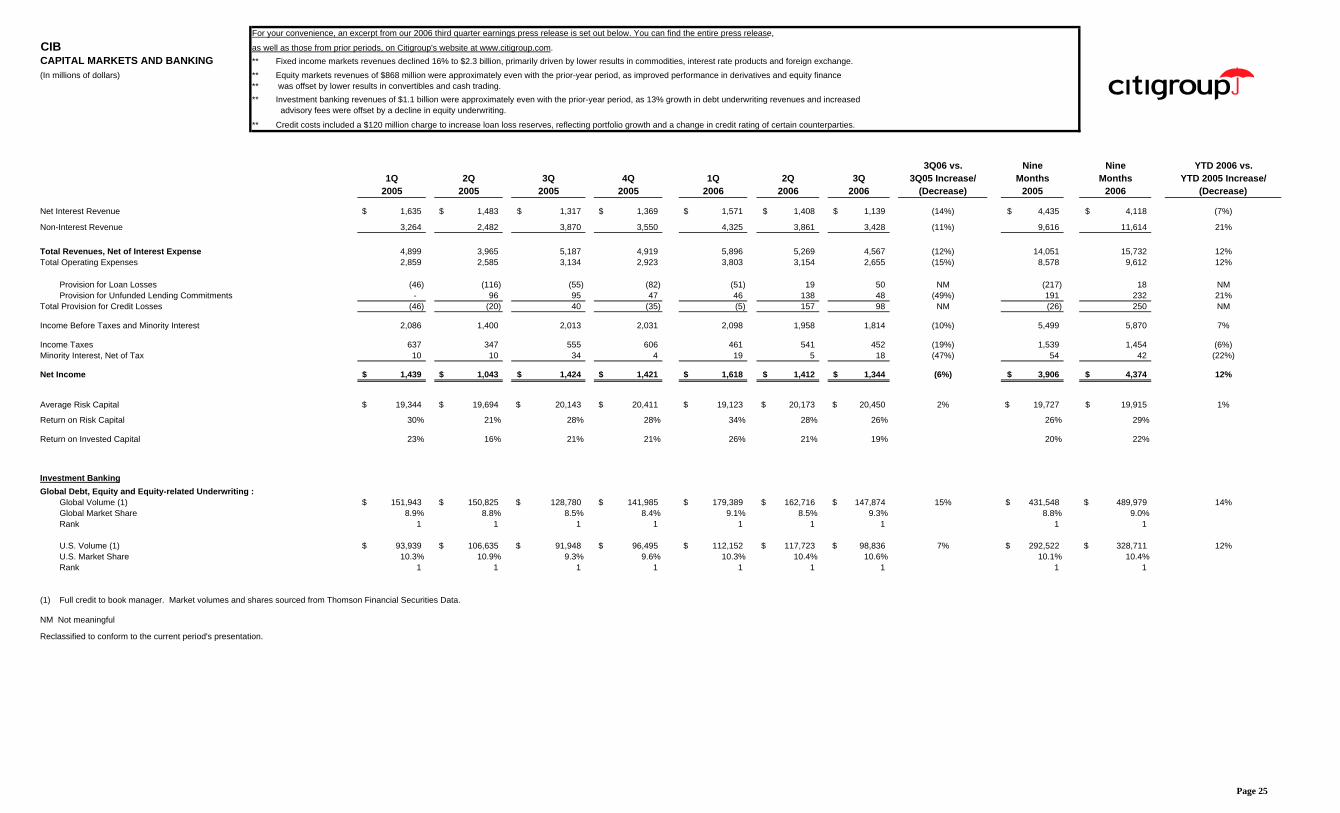
For your convenience, an excerpt from our 2006 third quarter earnings press release is set out below. You can find the entire press release,
CIB as well as those from prior periods, on Citigroup's website at www.citigroup.com.CAPITAL MARKETS AND BANKING ** Fixed income markets revenues declined 16% to $2.3 billion, primarily driven by lower results in commodities, interest rate products and foreign exchange. (In millions of dollars) ** Equity markets revenues of $868 million were approximately even with the prior-year period, as improved performance in derivatives and equity finance
** was offset by lower results in convertibles and cash trading. ** Investment banking revenues of $1.1 billion were approximately even with the prior-year period, as 13% growth in debt underwriting revenues and increased
advisory fees were offset by a decline in equity underwriting.
** Credit costs included a $120 million charge to increase loan loss reserves, reflecting portfolio growth and a change in credit rating of certain counterparties.
3Q06 vs. Nine Nine YTD 2006 vs.1Q 2Q 3Q 4Q 1Q 2Q 3Q 3Q05 Increase/ Months Months YTD 2005 Increase/
2005 2005 2005 2005 2006 2006 2006 (Decrease) 2005 2006 (Decrease)
Net Interest Revenue 1,635$ 1,483$ 1,317$ 1,369$ 1,571$ 1,408$ 1,139$ (14%) 4,435$ 4,118$ (7%)
Non-Interest Revenue 3,264 2,482 3,870 3,550 4,325 3,861 3,428 (11%) 9,616 11,614 21%
Total Revenues, Net of Interest Expense 4,899 3,965 5,187 4,919 5,896 5,269 4,567 (12%) 14,051 15,732 12%Total Operating Expenses 2,859 2,585 3,134 2,923 3,803 3,154 2,655 (15%) 8,578 9,612 12%
Provision for Loan Losses (46) (116) (55) (82) (51) 19 50 NM (217) 18 NMProvision for Unfunded Lending Commitments - 96 95 47 46 138 48 (49%) 191 232 21%
Total Provision for Credit Losses (46) (20) 40 (35) (5) 157 98 NM (26) 250 NM
Income Before Taxes and Minority Interest 2,086 1,400 2,013 2,031 2,098 1,958 1,814 (10%) 5,499 5,870 7%
Income Taxes 637 347 555 606 461 541 452 (19%) 1,539 1,454 (6%)Minority Interest, Net of Tax 10 10 34 4 19 5 18 (47%) 54 42 (22%)
Net Income 1,439$ 1,043$ 1,424$ 1,421$ 1,618$ 1,412$ 1,344$ (6%) 3,906$ 4,374$ 12%
Average Risk Capital 19,344$ 19,694$ 20,143$ 20,411$ 19,123$ 20,173$ 20,450$ 2% 19,727$ 19,915$ 1%
Return on Risk Capital 30% 21% 28% 28% 34% 28% 26% 26% 29%
Return on Invested Capital 23% 16% 21% 21% 26% 21% 19% 20% 22%
Investment BankingGlobal Debt, Equity and Equity-related Underwriting :
Global Volume (1) 151,943$ 150,825$ 128,780$ 141,985$ 179,389$ 162,716$ 147,874$ 15% 431,548$ 489,979$ 14%Global Market Share 8.9% 8.8% 8.5% 8.4% 9.1% 8.5% 9.3% 8.8% 9.0%Rank 1 1 1 1 1 1 1 1 1
U.S. Volume (1) 93,939$ 106,635$ 91,948$ 96,495$ 112,152$ 117,723$ 98,836$ 7% 292,522$ 328,711$ 12%U.S. Market Share 10.3% 10.9% 9.3% 9.6% 10.3% 10.4% 10.6% 10.1% 10.4%Rank 1 1 1 1 1 1 1 1 1
(1) Full credit to book manager. Market volumes and shares sourced from Thomson Financial Securities Data.
NM Not meaningful
Reclassified to conform to the current period's presentation.
Page 25
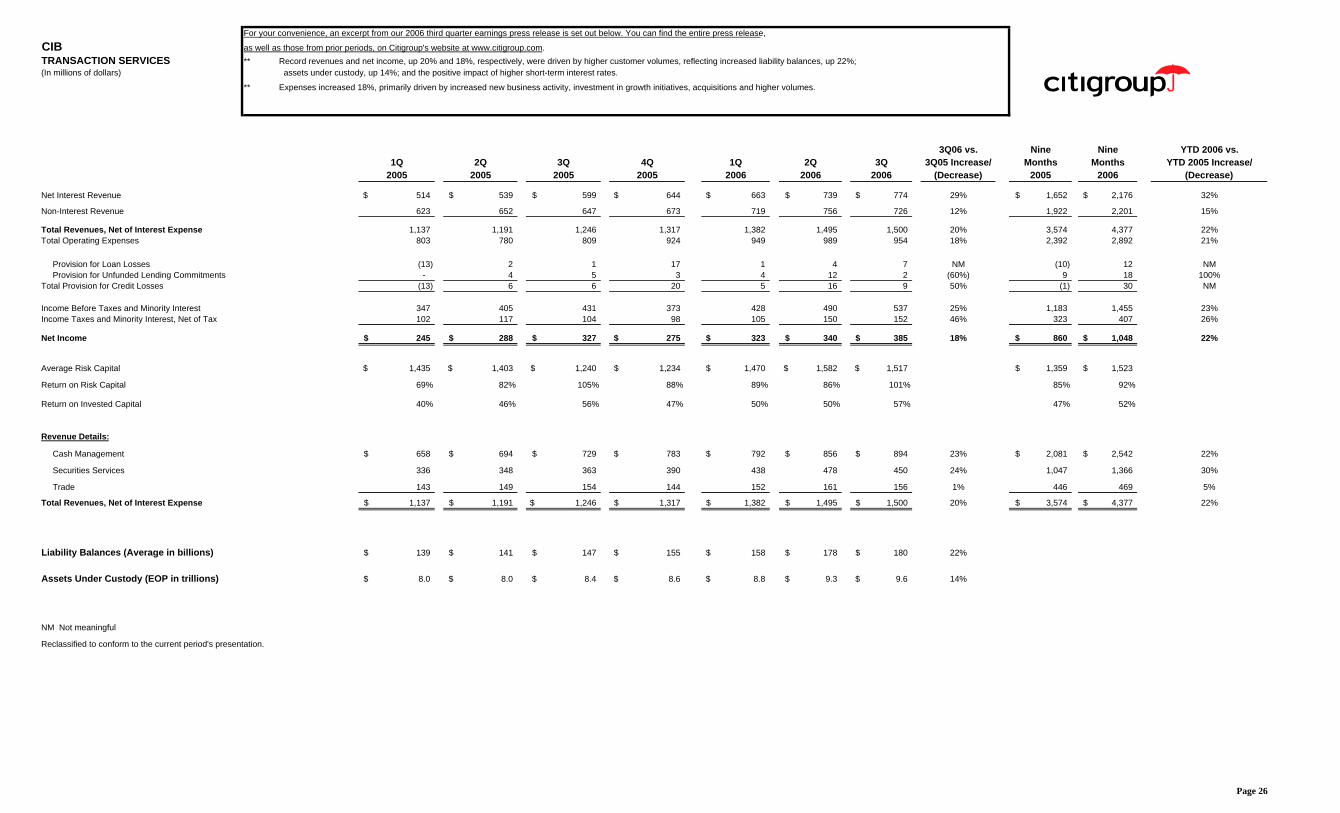
For your convenience, an excerpt from our 2006 third quarter earnings press release is set out below. You can find the entire press release,
CIB as well as those from prior periods, on Citigroup's website at www.citigroup.com.TRANSACTION SERVICES ** Record revenues and net income, up 20% and 18%, respectively, were driven by higher customer volumes, reflecting increased liability balances, up 22%; (In millions of dollars) assets under custody, up 14%; and the positive impact of higher short-term interest rates.
** Expenses increased 18%, primarily driven by increased new business activity, investment in growth initiatives, acquisitions and higher volumes.
3Q06 vs. Nine Nine YTD 2006 vs.1Q 2Q 3Q 4Q 1Q 2Q 3Q 3Q05 Increase/ Months Months YTD 2005 Increase/
2005 2005 2005 2005 2006 2006 2006 (Decrease) 2005 2006 (Decrease)
Net Interest Revenue 514$ 539$ 599$ 644$ 663$ 739$ 774$ 29% 1,652$ 2,176$ 32%
Non-Interest Revenue 623 652 647 673 719 756 726 12% 1,922 2,201 15%
Total Revenues, Net of Interest Expense 1,137 1,191 1,246 1,317 1,382 1,495 1,500 20% 3,574 4,377 22%Total Operating Expenses 803 780 809 924 949 989 954 18% 2,392 2,892 21%
Provision for Loan Losses (13) 2 1 17 1 4 7 NM (10) 12 NMProvision for Unfunded Lending Commitments - 4 5 3 4 12 2 (60%) 9 18 100%
Total Provision for Credit Losses (13) 6 6 20 5 16 9 50% (1) 30 NM
Income Before Taxes and Minority Interest 347 405 431 373 428 490 537 25% 1,183 1,455 23%Income Taxes and Minority Interest, Net of Tax 102 117 104 98 105 150 152 46% 323 407 26%
Net Income 245$ 288$ 327$ 275$ 323$ 340$ 385$ 18% 860$ 1,048$ 22%
Average Risk Capital 1,435$ 1,403$ 1,240$ 1,234$ 1,470$ 1,582$ 1,517$ 1,359$ 1,523$
Return on Risk Capital 69% 82% 105% 88% 89% 86% 101% 85% 92%
Return on Invested Capital 40% 46% 56% 47% 50% 50% 57% 47% 52%
Revenue Details:
Cash Management 658$ 694$ 729$ 783$ 792$ 856$ 894$ 23% 2,081$ 2,542$ 22%
Securities Services 336 348 363 390 438 478 450 24% 1,047 1,366 30%
Trade 143 149 154 144 152 161 156 1% 446 469 5%
Total Revenues, Net of Interest Expense 1,137$ 1,191$ 1,246$ 1,317$ 1,382$ 1,495$ 1,500$ 20% 3,574$ 4,377$ 22%
Liability Balances (Average in billions) 139$ 141$ 147$ 155$ 158$ 178$ 180$ 22%
Assets Under Custody (EOP in trillions) 8.0$ 8.0$ 8.4$ 8.6$ 8.8$ 9.3$ 9.6$ 14%
NM Not meaningful
Reclassified to conform to the current period's presentation.
Page 26
GLOBAL WEALTH MANAGEMENT(In millions of dollars)
3Q06 vs. Nine Nine YTD 2006 vs.1Q 2Q 3Q 4Q 1Q 2Q 3Q 3Q05 Increase/ Months Months YTD 2005 Increase/
2005 2005 2005 2005 2006 2006 2006 (Decrease) 2005 2006 (Decrease)
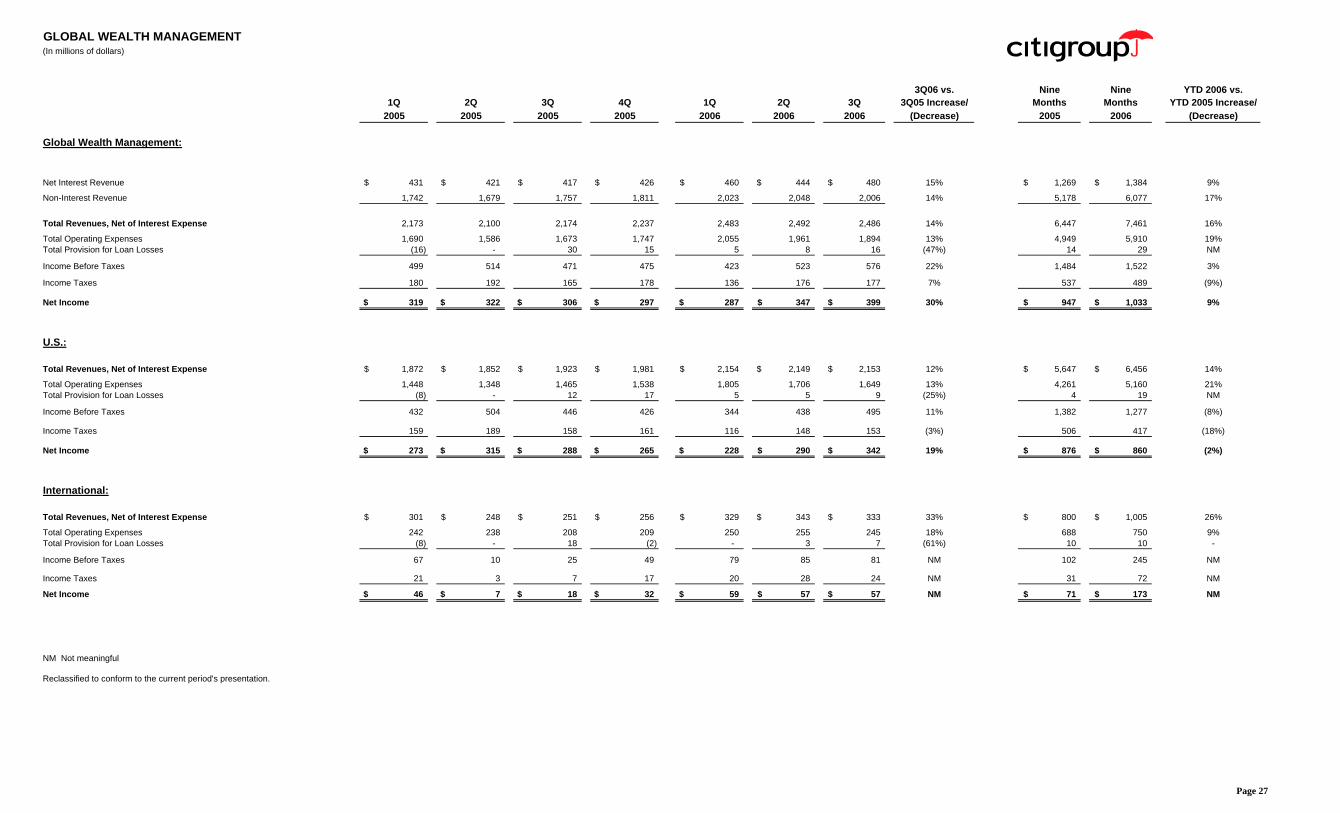
Global Wealth Management:
Net Interest Revenue 431$ 421$ 417$ 426$ 460$ 444$ 480$ 15% 1,269$ 1,384$ 9%
Non-Interest Revenue 1,742 1,679 1,757 1,811 2,023 2,048 2,006 14% 5,178 6,077 17%
Total Revenues, Net of Interest Expense 2,173 2,100 2,174 2,237 2,483 2,492 2,486 14% 6,447 7,461 16%
Total Operating Expenses 1,690 1,586 1,673 1,747 2,055 1,961 1,894 13% 4,949 5,910 19%Total Provision for Loan Losses (16) - 30 15 5 8 16 (47%) 14 29 NM
Income Before Taxes 499 514 471 475 423 523 576 22% 1,484 1,522 3%
Income Taxes 180 192 165 178 136 176 177 7% 537 489 (9%)
Net Income 319$ 322$ 306$ 297$ 287$ 347$ 399$ 30% 947$ 1,033$ 9%
U.S.:
Total Revenues, Net of Interest Expense 1,872$ 1,852$ 1,923$ 1,981$ 2,154$ 2,149$ 2,153$ 12% 5,647$ 6,456$ 14%
Total Operating Expenses 1,448 1,348 1,465 1,538 1,805 1,706 1,649 13% 4,261 5,160 21%Total Provision for Loan Losses (8) - 12 17 5 5 9 (25%) 4 19 NM
Income Before Taxes 432 504 446 426 344 438 495 11% 1,382 1,277 (8%)
Income Taxes 159 189 158 161 116 148 153 (3%) 506 417 (18%)
Net Income 273$ 315$ 288$ 265$ 228$ 290$ 342$ 19% 876$ 860$ (2%)
International:
Total Revenues, Net of Interest Expense 301$ 248$ 251$ 256$ 329$ 343$ 333$ 33% 800$ 1,005$ 26%
Total Operating Expenses 242 238 208 209 250 255 245 18% 688 750 9%Total Provision for Loan Losses (8) - 18 (2) - 3 7 (61%) 10 10 -
Income Before Taxes 67 10 25 49 79 85 81 NM 102 245 NM
Income Taxes 21 3 7 17 20 28 24 NM 31 72 NM
Net Income 46$ 7$ 18$ 32$ 59$ 57$ 57$ NM 71$ 173$ NM
NM Not meaningful
Reclassified to conform to the current period's presentation.
Page 27

For your convenience, an excerpt from our 2006 third quarter earnings press release is set out below. You can find the entire press release,
as well as those from prior periods, on Citigroup's website at www.citigroup.com.
GLOBAL WEALTH MANAGEMENT ** Record revenues were driven by strong customer demand for advisory services, resulting in a 32% increase in fee-based revenues, and the acquisition of the Legg Mason retail
SMITH BARNEY brokerage business. Transactional revenues declined 7%, reflecting lower customer trading volumes and a continued shift toward offering fee-based advisory products and services.(In millions of dollars) ** Assets under fee-based management increased 25% to $322 billion, driven by both organic growth and the addition of Legg Mason client assets.
** Results included $59 million expense from SFAS 123(R) accruals.
3Q06 vs. Nine Nine YTD 2006 vs.1Q 2Q 3Q 4Q 1Q 2Q 3Q 3Q05 Increase/ Months Months YTD 2005 Increase/
2005 2005 2005 2005 2006 2006 2006 (Decrease) 2005 2006 (Decrease)
Revenues:Fee-Based and Net Interest Revenue 911$ 956$ 986$ 1,039$ 1,200$ 1,238$ 1,305$ 32% 2,853$ 3,743$ 31%Commissions and Other Transactional Revenue 758 691 742 742 787 752 689 (7%) 2,191 2,228 2%
Total Revenues, Net of Interest Expense 1,669 1,647 1,728 1,781 1,987 1,990 1,994 15% 5,044 5,971 18%
Total Operating Expenses 1,351 1,252 1,366 1,436 1,720 1,624 1,565 15% 3,969 4,909 24%Provision for Loan Losses - 4 7 1 1 (1) (1) NM 11 (1) NM
Income Before Taxes 318 391 355 344 266 367 430 21% 1,064 1,063 -Income Taxes 121 152 128 136 98 129 136 6% 401 363 (9%)
Net Income 197$ 239$ 227$ 208$ 168$ 238$ 294$ 30% 663$ 700$ 6%
Pretax Profit Margin 19% 24% 21% 19% 13% 18% 22% 21% 18%
Average Risk Capital 876$ 927$ 958$ 989$ 1,457$ 1,422$ 1,436$ 50% 920$ 1,438$ 56%
Return on Risk Capital 91% 103% 94% 83% 47% 67% 81% 96% 65%
Return on Invested Capital 63% 73% 67% 42% 24% 34% 41% 68% 33%
Financial Advisors 12,189 12,150 12,111 13,414 13,321 13,177 13,076 8%Annualized Revenue per FA (000) 556$ 538$ 565$ 566$ 597$ 600$ 606$ 7%Branch offices 522 518 517 640 635 635 635 23%
Revenues:
Net Interest Revenue 150$ 148$ 158$ 169$ 209$ 203$ 247$ 56% 456$ 659$ 45%
Non-Interest Revenue 1,519 1,499 1,570 1,612 1,778 1,787 1,747 11% 4,588 5,312 16%
Total 1,669$ 1,647$ 1,728$ 1,781$ 1,987$ 1,990$ 1,994$ 15% 5,044$ 5,971$ 18%
Assets (in billions of dollars):
Total Client Assets 969$ 987$ 1,015$ 1,130$ 1,167$ 1,142$ 1,173$ 16%
Net Client Asset Flows 13$ 5$ 6$ 4$ 3$ (5)$ 2$ (67%)
Client Assets Under Fee-Based Management:
Consulting Group and Other Advisory Accounts 155$ 159$ 168$ 177$ 189$ 187$ 193$ 15%Financial Advisor Managed Accounts 84 86 90 121 130 126 129 43%
Total Smith Barney 239$ 245$ 258$ 298$ 319$ 313$ 322$ 25%
NM Not meaningful
Reclassified to conform to the current period's presentation.
Page 28
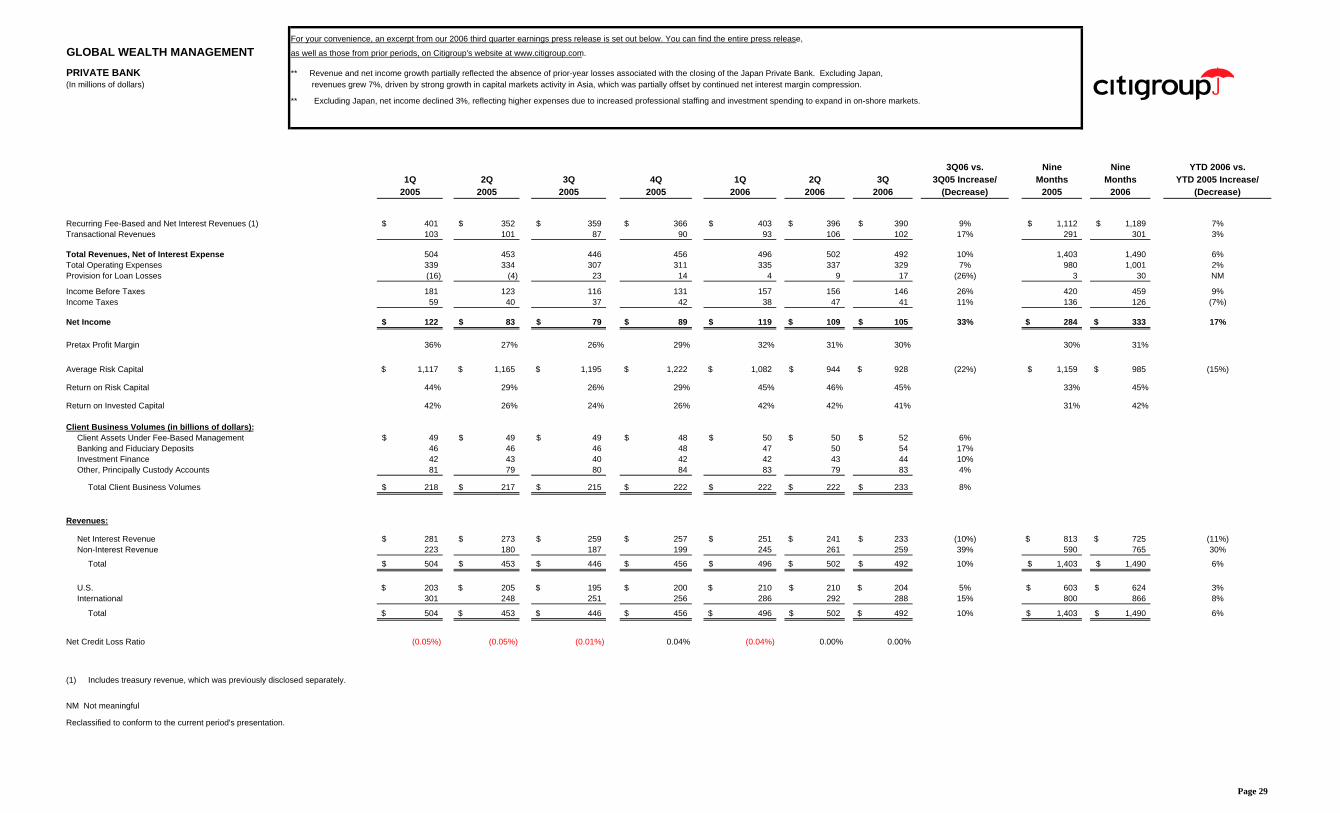
For your convenience, an excerpt from our 2006 third quarter earnings press release is set out below. You can find the entire press release,
GLOBAL WEALTH MANAGEMENT as well as those from prior periods, on Citigroup's website at www.citigroup.com.
PRIVATE BANK ** Revenue and net income growth partially reflected the absence of prior-year losses associated with the closing of the Japan Private Bank. Excluding Japan, (In millions of dollars) revenues grew 7%, driven by strong growth in capital markets activity in Asia, which was partially offset by continued net interest margin compression.
** Excluding Japan, net income declined 3%, reflecting higher expenses due to increased professional staffing and investment spending to expand in on-shore markets.
3Q06 vs. Nine Nine YTD 2006 vs.1Q 2Q 3Q 4Q 1Q 2Q 3Q 3Q05 Increase/ Months Months YTD 2005 Increase/
2005 2005 2005 2005 2006 2006 2006 (Decrease) 2005 2006 (Decrease)
Recurring Fee-Based and Net Interest Revenues (1) 401$ 352$ 359$ 366$ 403$ 396$ 390$ 9% 1,112$ 1,189$ 7%Transactional Revenues 103 101 87 90 93 106 102 17% 291 301 3%
Total Revenues, Net of Interest Expense 504 453 446 456 496 502 492 10% 1,403 1,490 6%Total Operating Expenses 339 334 307 311 335 337 329 7% 980 1,001 2%Provision for Loan Losses (16) (4) 23 14 4 9 17 (26%) 3 30 NM
Income Before Taxes 181 123 116 131 157 156 146 26% 420 459 9%Income Taxes 59 40 37 42 38 47 41 11% 136 126 (7%)
Net Income 122$ 83$ 79$ 89$ 119$ 109$ 105$ 33% 284$ 333$ 17%
Pretax Profit Margin 36% 27% 26% 29% 32% 31% 30% 30% 31%
Average Risk Capital 1,117$ 1,165$ 1,195$ 1,222$ 1,082$ 944$ 928$ (22%) 1,159$ 985$ (15%)
Return on Risk Capital 44% 29% 26% 29% 45% 46% 45% 33% 45%
Return on Invested Capital 42% 26% 24% 26% 42% 42% 41% 31% 42%
Client Business Volumes (in billions of dollars):Client Assets Under Fee-Based Management 49$ 49$ 49$ 48$ 50$ 50$ 52$ 6%Banking and Fiduciary Deposits 46 46 46 48 47 50 54 17%Investment Finance 42 43 40 42 42 43 44 10%Other, Principally Custody Accounts 81 79 80 84 83 79 83 4%
Total Client Business Volumes 218$ 217$ 215$ 222$ 222$ 222$ 233$ 8%
Revenues:
Net Interest Revenue 281$ 273$ 259$ 257$ 251$ 241$ 233$ (10%) 813$ 725$ (11%)Non-Interest Revenue 223 180 187 199 245 261 259 39% 590 765 30%
Total 504$ 453$ 446$ 456$ 496$ 502$ 492$ 10% 1,403$ 1,490$ 6%
U.S. 203$ 205$ 195$ 200$ 210$ 210$ 204$ 5% 603$ 624$ 3%International 301 248 251 256 286 292 288 15% 800 866 8%
Total 504$ 453$ 446$ 456$ 496$ 502$ 492$ 10% 1,403$ 1,490$ 6%
Net Credit Loss Ratio (0.05%) (0.05%) (0.01%) 0.04% (0.04%) 0.00% 0.00%
(1) Includes treasury revenue, which was previously disclosed separately.
NM Not meaningful
Reclassified to conform to the current period's presentation.
Page 29

For your convenience, an excerpt from our 2006 third quarter earnings press release is set out below. You can find the entire press release,
ALTERNATIVE INVESTMENTS (1) as well as those from prior periods, on Citigroup's website at www.citigroup.com.(In millions of dollars) ** Revenues and net income declined due to lower results in private equity and liquid investments, which were partially offset by higher client revenues,
and an $85 million after-tax gain on the sale of MetLife shares.
3Q06 vs. Nine Nine YTD 2006 vs.1Q 2Q 3Q 4Q 1Q 2Q 3Q 3Q05 Increase/ Months Months YTD 2005 Increase/
2005 2005 2005 2005 2006 2006 2006 (Decrease) 2005 2006 (Decrease)
Total Revenues, Net of Interest Expense 866$ 1,112$ 720$ 732$ 675$ 584$ 334$ (54%) 2,698$ 1,593$ (41%)
Total Operating Expenses 105 159 167 202 181 199 137 (18%) 431 517 20%
Provision for Loan Losses - - (2) - - (13) - 100% (2) (13) NM
Income Before Taxes and Minority Interest 761 953 555 530 494 398 197 (65%) 2,269 1,089 (52%)
Income Taxes 267 334 181 168 111 138 70 (61%) 782 319 (59%)
Minority Interest, Net of Tax 132 234 35 11 30 3 10 (71%) 401 43 (89%)
Net Income 362$ 385$ 339$ 351$ 353$ 257$ 117$ (65%) 1,086$ 727$ (33%)
Assets (in billions) 9.7$ 10.9$ 11.4$ 12.9$ 11.8$ 11.9$ 10.8$ (5%)
Average Risk Capital (in billions) 4.1$ 4.3$ 4.3$ 4.3$ 4.5$ 4.0$ 4.0$ (7%) 4.2$ 4.2$ -Return on Risk Capital 36% 36% 31% 32% 32% 26% 12% 35% 23%Return on Invested Capital 34% 34% 29% 30% 28% 22% 8% 32% 20%
Total Revenues, Net of Interest Expense (by Business):
Client 62$ 83$ 81$ 114$ 91$ 97$ 97$ 20% 226$ 285$ 26%Proprietary Investment Activities:
Private Equity 752 982 449 380 213 516 56 (88%) 2,183 785 (64%)Hedge Funds 30 (47) 91 (5) 107 (43) 1 (99%) 74 65 (12%)Other 22 94 99 243 264 14 180 82% 215 458 NM
Total Proprietary Investment Activities 804 1,029 639 618 584 487 237 (63%) 2,472 1,308 (47%) Total 866$ 1,112$ 720$ 732$ 675$ 584$ 334$ (54%) 2,698$ 1,593$ (41%)
Total Revenues, Net of Interest Expense (by Type):Client 62$ 83$ 81$ 114$ 91$ 97$ 97$ 20% 226$ 285$ 26%Proprietary Investment Activities:
Fees / Dividends / Interest 81 86 194 148 49 49 58 (70%) 361 156 (57%)Realized & Unrealized Gains (including Public Mark-to-Market) 706 943 442 491 563 475 200 (55%) 2,091 1,238 (41%)Other 17 - 3 (21) (28) (37) (21) NM 20 (86) NM
Total Proprietary Investment Activities 804 1,029 639 618 584 487 237 (63%) 2,472 1,308 (47%) Total 866$ 1,112$ 720$ 732$ 675$ 584$ 334$ (54%) 2,698$ 1,593$ (41%)
Capital Under Management (in billions):
Client 20.2$ 21.7$ 24.8$ 25.4$ 28.2$ 30.6$ 33.5$ 35%Proprietary Investment Activities 8.8 9.6 10.7 12.2 11.1 11.3 10.2 (5%)Capital Under Management 29.0$ 31.3$ 35.5$ 37.6$ 39.3$ 41.9$ 43.7$ 23%
(1) Includes Citigroup Venture Capital activities and certain other corporate investments.
NM Not meaningful
Reclassified to conform to the current period's presentation.
Page 30
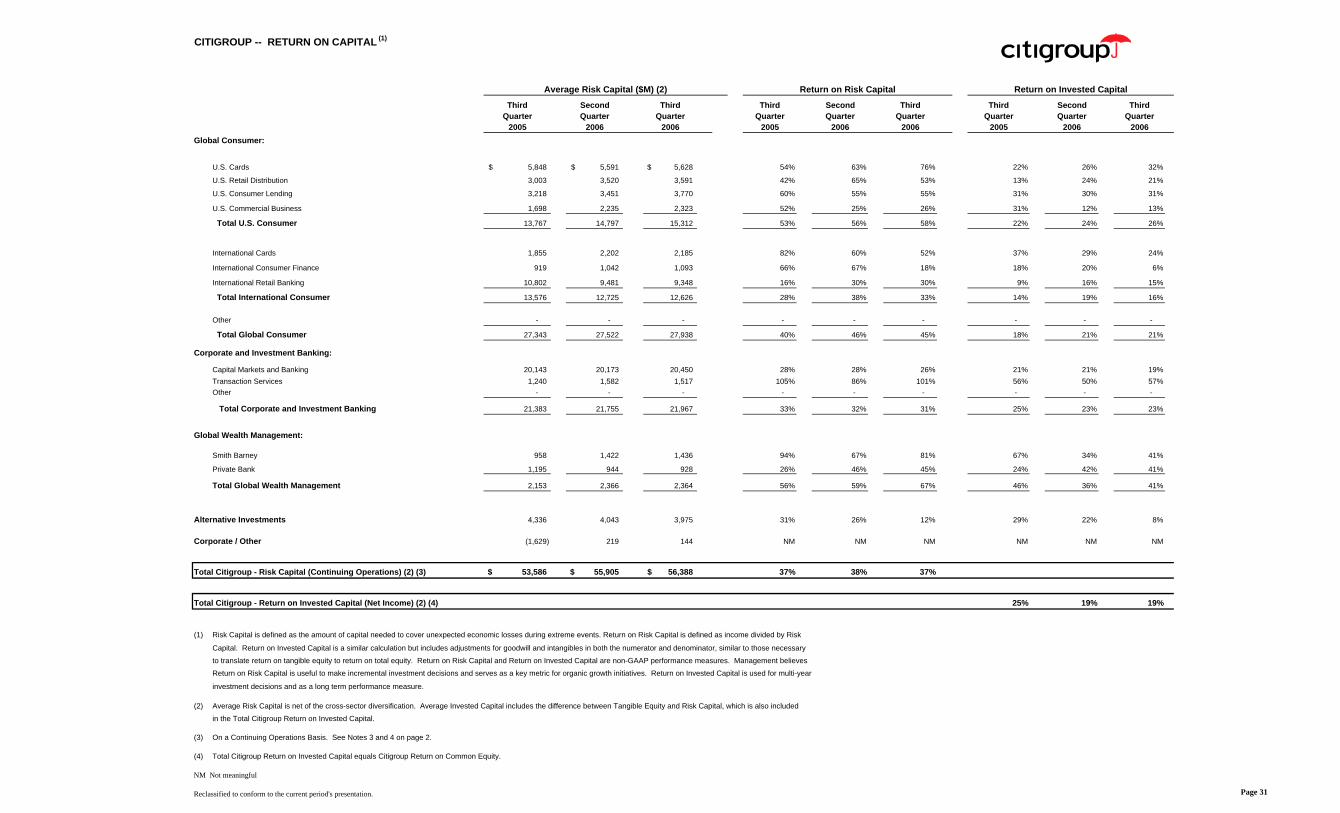
CITIGROUP -- RETURN ON CAPITAL (1)
Third Second Third Third Second Third Third Second ThirdQuarter Quarter Quarter Quarter Quarter Quarter Quarter Quarter Quarter
2005 2006 2006 2005 2006 2006 2005 2006 2006Global Consumer:
U.S. Cards 5,848$ 5,591$ 5,628$ 54% 63% 76% 22% 26% 32%
U.S. Retail Distribution 3,003 3,520 3,591 42% 65% 53% 13% 24% 21%
U.S. Consumer Lending 3,218 3,451 3,770 60% 55% 55% 31% 30% 31%
U.S. Commercial Business 1,698 2,235 2,323 52% 25% 26% 31% 12% 13%
Total U.S. Consumer 13,767 14,797 15,312 53% 56% 58% 22% 24% 26%
International Cards 1,855 2,202 2,185 82% 60% 52% 37% 29% 24%
International Consumer Finance 919 1,042 1,093 66% 67% 18% 18% 20% 6%
International Retail Banking 10,802 9,481 9,348 16% 30% 30% 9% 16% 15%
Total International Consumer 13,576 12,725 12,626 28% 38% 33% 14% 19% 16%
Other - - - - - - - - -
Total Global Consumer 27,343 27,522 27,938 40% 46% 45% 18% 21% 21%
Corporate and Investment Banking:
Capital Markets and Banking 20,143 20,173 20,450 28% 28% 26% 21% 21% 19%Transaction Services 1,240 1,582 1,517 105% 86% 101% 56% 50% 57%Other - - - - - - - - -
Total Corporate and Investment Banking 21,383 21,755 21,967 33% 32% 31% 25% 23% 23%
Global Wealth Management:
Smith Barney 958 1,422 1,436 94% 67% 81% 67% 34% 41%
Private Bank 1,195 944 928 26% 46% 45% 24% 42% 41%
Total Global Wealth Management 2,153 2,366 2,364 56% 59% 67% 46% 36% 41%
Alternative Investments 4,336 4,043 3,975 31% 26% 12% 29% 22% 8%
Corporate / Other (1,629) 219 144 NM NM NM NM NM NM
Total Citigroup - Risk Capital (Continuing Operations) (2) (3) 53,586$ 55,905$ 56,388$ 37% 38% 37%
Total Citigroup - Return on Invested Capital (Net Income) (2) (4) 25% 19% 19%
(1) Risk Capital is defined as the amount of capital needed to cover unexpected economic losses during extreme events. Return on Risk Capital is defined as income divided by Risk
Capital. Return on Invested Capital is a similar calculation but includes adjustments for goodwill and intangibles in both the numerator and denominator, similar to those necessary
to translate return on tangible equity to return on total equity. Return on Risk Capital and Return on Invested Capital are non-GAAP performance measures. Management believes
Return on Risk Capital is useful to make incremental investment decisions and serves as a key metric for organic growth initiatives. Return on Invested Capital is used for multi-year
investment decisions and as a long term performance measure.
(2) Average Risk Capital is net of the cross-sector diversification. Average Invested Capital includes the difference between Tangible Equity and Risk Capital, which is also included
in the Total Citigroup Return on Invested Capital.
(3) On a Continuing Operations Basis. See Notes 3 and 4 on page 2.
(4) Total Citigroup Return on Invested Capital equals Citigroup Return on Common Equity.
NM Not meaningful
Reclassified to conform to the current period's presentation.
Average Risk Capital ($M) (2) Return on Risk Capital Return on Invested Capital
Page 31

AVERAGE BALANCES AND INTEREST RATES (1)(2)(3)(4)
Third Second Third Third Second Third Third Second ThirdQuarter Quarter Quarter Quarter Quarter Quarter Quarter Quarter Quarter
In millions of dollars 2005 2006 2006 (5) 2005 2006 2006 (5) 2005 2006 2006 (5)
Assets:
Deposits at Interest with Banks 35,118$ 38,951$ 37,469$ 438$ 630$ 713$ 4.95% 6.49% 7.55%Fed Funds Sold and Resale Agreements (6) 236,927 251,082 247,671 2,641 3,397 3,713 4.42% 5.43% 5.95%Trading Account Assets (7) 230,405 281,059 284,295 1,847 2,888 2,558 3.18% 4.12% 3.57%Investments (1) 171,772 197,900 218,997 1,814 2,255 2,606 4.19% 4.57% 4.72%
Consumer Loans 437,600 476,645 485,658 9,996 10,905 11,134 9.06% 9.18% 9.10%
Corporate Loans 121,213 148,684 161,040 2,039 2,738 3,256 6.67% 7.39% 8.02%
Total Loans (net of Unearned Income) 558,813 625,329 646,698 12,035 13,643 14,390 8.54% 8.75% 8.83%
Other Interest-Earning Assets 56,060 55,081 54,493 569 759 749 4.03% 5.53% 5.45%
Total Average Interest-Earning Assets 1,289,095$ 1,449,402$ 1,489,623$ 19,344$ 23,572$ 24,729$ 5.95% 6.52% 6.59%
Liabilities:
Deposits 508,939$ 574,055$ 601,531$ 3,616$ 5,204$ 5,771$ 2.82% 3.64% 3.81%Fed Funds Purchased and Repurchase Agreements (6) 245,107 284,754 281,084 3,127 4,319 4,396 5.06% 6.08% 6.20%Trading Account Liabilities (7) 74,510 74,867 73,245 32 62 56 0.17% 0.33% 0.30%
Short-Term Borrowings 107,369 144,187 144,949 845 1,348 1,518 3.12% 3.75% 4.15%
Long-Term Debt 213,117 231,850 247,276 2,029 2,784 3,160 3.78% 4.82% 5.07%
Total Interest-Bearing Liabilities 1,149,042$ 1,309,713$ 1,348,085$ 9,649$ 13,717$ 14,901$ 3.33% 4.20% 4.39%
Net Interest Revenue as a % of Average Interest-Earning Assets 9,695$ 9,855$ 9,828$ 2.98% 2.73% 2.62%
3Q06 Increase (Decrease) From (36) bps (11) bps
(1) Interest Revenue excludes the taxable equivalent adjustments (based on the U.S. federal statutory tax rate of 35%) of $41 million for the 2005 third quarter,
$25 million for the 2006 second quarter and $14 million for the 2006 third quarter.
(2) Citigroup Average Balances and Interest Rates include both domestic and international operations.
(3) Monthly or quarterly averages have been used by certain subsidiaries where daily averages are unavailable.
(4) Average Rate % is calculated as annualized interest over average volumes.
(5) Preliminary
(6) Average volumes of securities borrowed or purchased under agreements to resell and securities loaned or sold under agreements to repurchase are reported net pursuant to FIN 41; the related interest excludes the impact of FIN 41.
(7) Interest expense on trading account liabilities of CIB is reported as a reduction of interest revenue.
Reclassified to conform to the current period's presentation.
Average Volumes Interest % Average Rate (4)
Page 32
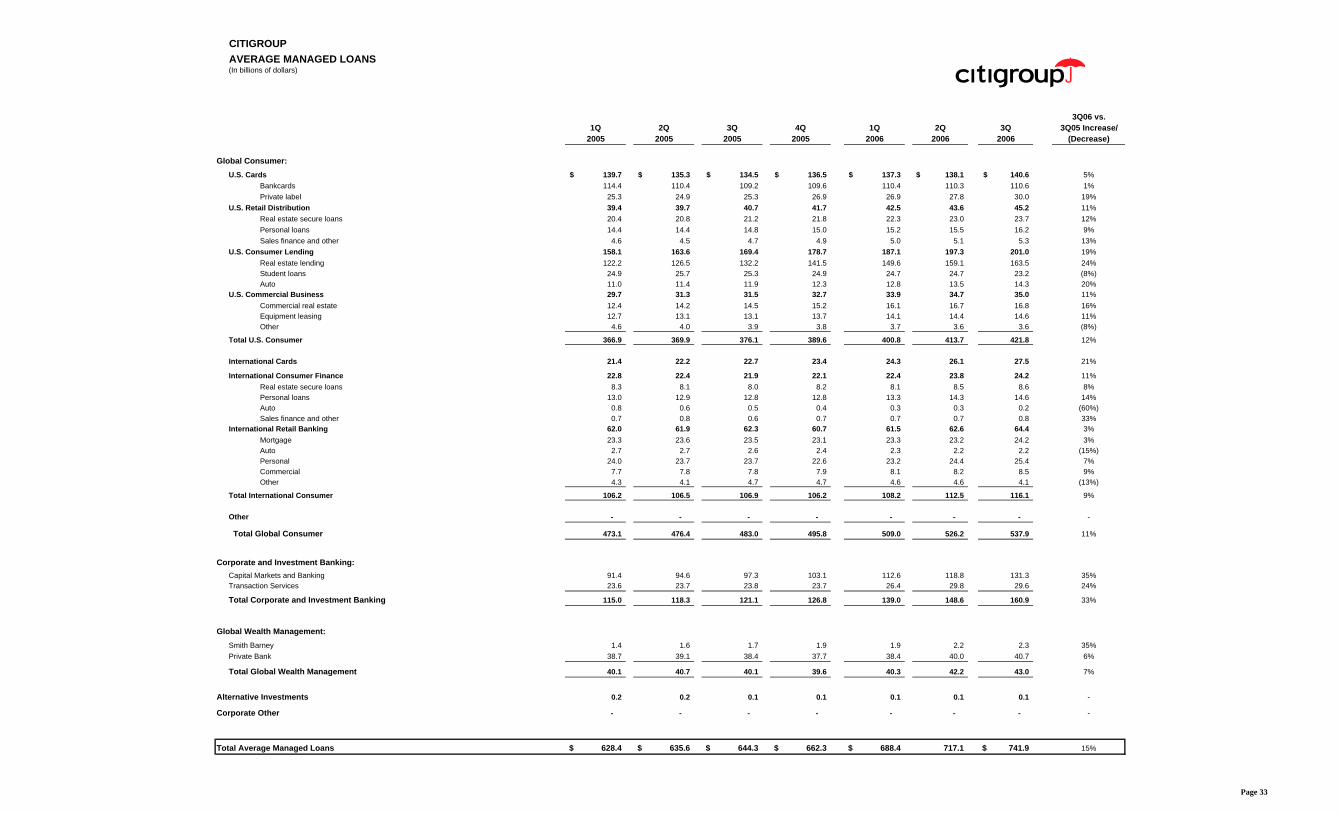
CITIGROUPAVERAGE MANAGED LOANS(In billions of dollars)
3Q06 vs.1Q 2Q 3Q 4Q 1Q 2Q 3Q 3Q05 Increase/
2005 2005 2005 2005 2006 2006 2006 (Decrease)
Global Consumer:U.S. Cards 139.7$ 135.3$ 134.5$ 136.5$ 137.3$ 138.1$ 140.6$ 5%
Bankcards 114.4 110.4 109.2 109.6 110.4 110.3 110.6 1%Private label 25.3 24.9 25.3 26.9 26.9 27.8 30.0 19%
U.S. Retail Distribution 39.4 39.7 40.7 41.7 42.5 43.6 45.2 11%Real estate secure loans 20.4 20.8 21.2 21.8 22.3 23.0 23.7 12%Personal loans 14.4 14.4 14.8 15.0 15.2 15.5 16.2 9%Sales finance and other 4.6 4.5 4.7 4.9 5.0 5.1 5.3 13%
U.S. Consumer Lending 158.1 163.6 169.4 178.7 187.1 197.3 201.0 19%Real estate lending 122.2 126.5 132.2 141.5 149.6 159.1 163.5 24%Student loans 24.9 25.7 25.3 24.9 24.7 24.7 23.2 (8%)Auto 11.0 11.4 11.9 12.3 12.8 13.5 14.3 20%
U.S. Commercial Business 29.7 31.3 31.5 32.7 33.9 34.7 35.0 11%Commercial real estate 12.4 14.2 14.5 15.2 16.1 16.7 16.8 16%Equipment leasing 12.7 13.1 13.1 13.7 14.1 14.4 14.6 11%Other 4.6 4.0 3.9 3.8 3.7 3.6 3.6 (8%)
Total U.S. Consumer 366.9 369.9 376.1 389.6 400.8 413.7 421.8 12%
International Cards 21.4 22.2 22.7 23.4 24.3 26.1 27.5 21%
International Consumer Finance 22.8 22.4 21.9 22.1 22.4 23.8 24.2 11%Real estate secure loans 8.3 8.1 8.0 8.2 8.1 8.5 8.6 8%Personal loans 13.0 12.9 12.8 12.8 13.3 14.3 14.6 14%Auto 0.8 0.6 0.5 0.4 0.3 0.3 0.2 (60%)Sales finance and other 0.7 0.8 0.6 0.7 0.7 0.7 0.8 33%
International Retail Banking 62.0 61.9 62.3 60.7 61.5 62.6 64.4 3%Mortgage 23.3 23.6 23.5 23.1 23.3 23.2 24.2 3%Auto 2.7 2.7 2.6 2.4 2.3 2.2 2.2 (15%)Personal 24.0 23.7 23.7 22.6 23.2 24.4 25.4 7%Commercial 7.7 7.8 7.8 7.9 8.1 8.2 8.5 9%Other 4.3 4.1 4.7 4.7 4.6 4.6 4.1 (13%)
Total International Consumer 106.2 106.5 106.9 106.2 108.2 112.5 116.1 9%
Other - - - - - - - -
Total Global Consumer 473.1 476.4 483.0 495.8 509.0 526.2 537.9 11%
Corporate and Investment Banking:Capital Markets and Banking 91.4 94.6 97.3 103.1 112.6 118.8 131.3 35%Transaction Services 23.6 23.7 23.8 23.7 26.4 29.8 29.6 24%
Total Corporate and Investment Banking 115.0 118.3 121.1 126.8 139.0 148.6 160.9 33%
Global Wealth Management:Smith Barney 1.4 1.6 1.7 1.9 1.9 2.2 2.3 35%Private Bank 38.7 39.1 38.4 37.7 38.4 40.0 40.7 6%
Total Global Wealth Management 40.1 40.7 40.1 39.6 40.3 42.2 43.0 7%
Alternative Investments 0.2 0.2 0.1 0.1 0.1 0.1 0.1 -
Corporate Other - - - - - - - -
Total Average Managed Loans 628.4$ 635.6$ 644.3$ 662.3$ 688.4$ 717.1 741.9$ 15%
Page 33
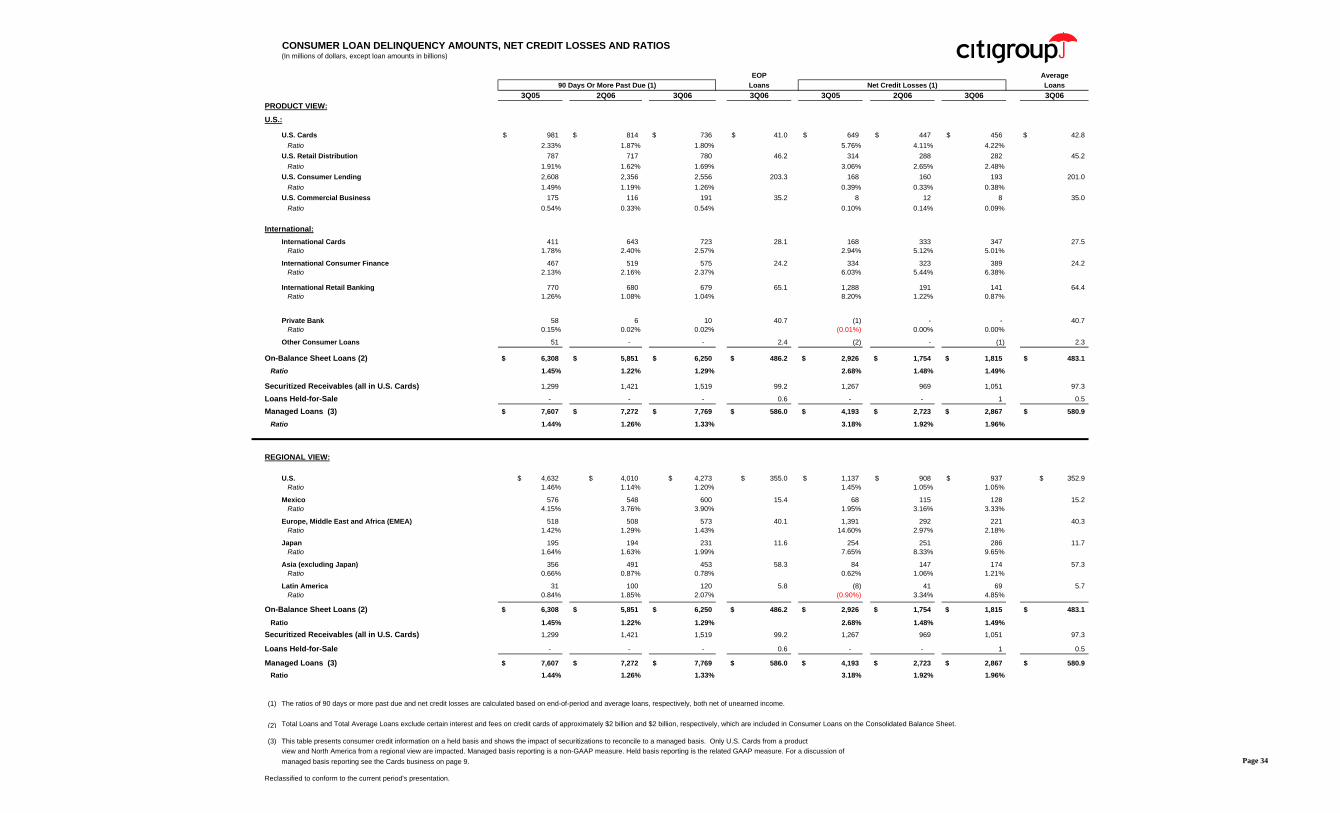
CONSUMER LOAN DELINQUENCY AMOUNTS, NET CREDIT LOSSES AND RATIOS(In millions of dollars, except loan amounts in billions)
EOP AverageLoans Loans
3Q05 2Q06 3Q06 3Q06 3Q05 2Q06 3Q06 3Q06PRODUCT VIEW:
U.S.:
U.S. Cards 981$ 814$ 736$ 41.0$ 649$ 447$ 456$ 42.8$ Ratio 2.33% 1.87% 1.80% 5.76% 4.11% 4.22%U.S. Retail Distribution 787 717 780 46.2 314 288 282 45.2 Ratio 1.91% 1.62% 1.69% 3.06% 2.65% 2.48%U.S. Consumer Lending 2,608 2,356 2,556 203.3 168 160 193 201.0 Ratio 1.49% 1.19% 1.26% 0.39% 0.33% 0.38%U.S. Commercial Business 175 116 191 35.2 8 12 8 35.0 Ratio 0.54% 0.33% 0.54% 0.10% 0.14% 0.09%
International:International Cards 411 643 723 28.1 168 333 347 27.5 Ratio 1.78% 2.40% 2.57% 2.94% 5.12% 5.01%
International Consumer Finance 467 519 575 24.2 334 323 389 24.2 Ratio 2.13% 2.16% 2.37% 6.03% 5.44% 6.38%
International Retail Banking 770 680 679 65.1 1,288 191 141 64.4 Ratio 1.26% 1.08% 1.04% 8.20% 1.22% 0.87%
Private Bank 58 6 10 40.7 (1) - - 40.7 Ratio 0.15% 0.02% 0.02% (0.01%) 0.00% 0.00%
Other Consumer Loans 51 - - 2.4 (2) - (1) 2.3
6,308$ 5,851$ 6,250$ 486.2$ 2,926$ 1,754$ 1,815$ 483.1$
Ratio 1.45% 1.22% 1.29% 2.68% 1.48% 1.49%
Securitized Receivables (all in U.S. Cards) 1,299 1,421 1,519 99.2 1,267 969 1,051 97.3
Loans Held-for-Sale - - - 0.6 - - 1 0.5
7,607$ 7,272$ 7,769$ 586.0$ 4,193$ 2,723$ 2,867$ 580.9$
Ratio 1.44% 1.26% 1.33% 3.18% 1.92% 1.96%
REGIONAL VIEW:
U.S. 4,632$ 4,010$ 4,273$ 355.0$ 1,137$ 908$ 937$ 352.9$ Ratio 1.46% 1.14% 1.20% 1.45% 1.05% 1.05%
Mexico 576 548 600 15.4 68 115 128 15.2 Ratio 4.15% 3.76% 3.90% 1.95% 3.16% 3.33%
Europe, Middle East and Africa (EMEA) 518 508 573 40.1 1,391 292 221 40.3 Ratio 1.42% 1.29% 1.43% 14.60% 2.97% 2.18%
Japan 195 194 231 11.6 254 251 286 11.7 Ratio 1.64% 1.63% 1.99% 7.65% 8.33% 9.65%
Asia (excluding Japan) 356 491 453 58.3 84 147 174 57.3 Ratio 0.66% 0.87% 0.78% 0.62% 1.06% 1.21%
Latin America 31 100 120 5.8 (8) 41 69 5.7 Ratio 0.84% 1.85% 2.07% (0.90%) 3.34% 4.85%
6,308$ 5,851$ 6,250$ 486.2$ 2,926$ 1,754$ 1,815$ 483.1$
Ratio 1.45% 1.22% 1.29% 2.68% 1.48% 1.49%Securitized Receivables (all in U.S. Cards) 1,299 1,421 1,519 99.2 1,267 969 1,051 97.3
Loans Held-for-Sale - - - 0.6 - - 1 0.5
7,607$ 7,272$ 7,769$ 586.0$ 4,193$ 2,723$ 2,867$ 580.9$ Ratio 1.44% 1.26% 1.33% 3.18% 1.92% 1.96%
(1) The ratios of 90 days or more past due and net credit losses are calculated based on end-of-period and average loans, respectively, both net of unearned income.
(2) Total Loans and Total Average Loans exclude certain interest and fees on credit cards of approximately $2 billion and $2 billion, respectively, which are included in Consumer Loans on the Consolidated Balance Sheet.
(3) This table presents consumer credit information on a held basis and shows the impact of securitizations to reconcile to a managed basis. Only U.S. Cards from a productview and North America from a regional view are impacted. Managed basis reporting is a non-GAAP measure. Held basis reporting is the related GAAP measure. For a discussion ofmanaged basis reporting see the Cards business on page 9.
Reclassified to conform to the current period's presentation.
Managed Loans (3)
On-Balance Sheet Loans (2)
90 Days Or More Past Due (1) Net Credit Losses (1)
On-Balance Sheet Loans (2)
Managed Loans (3)
Page 34
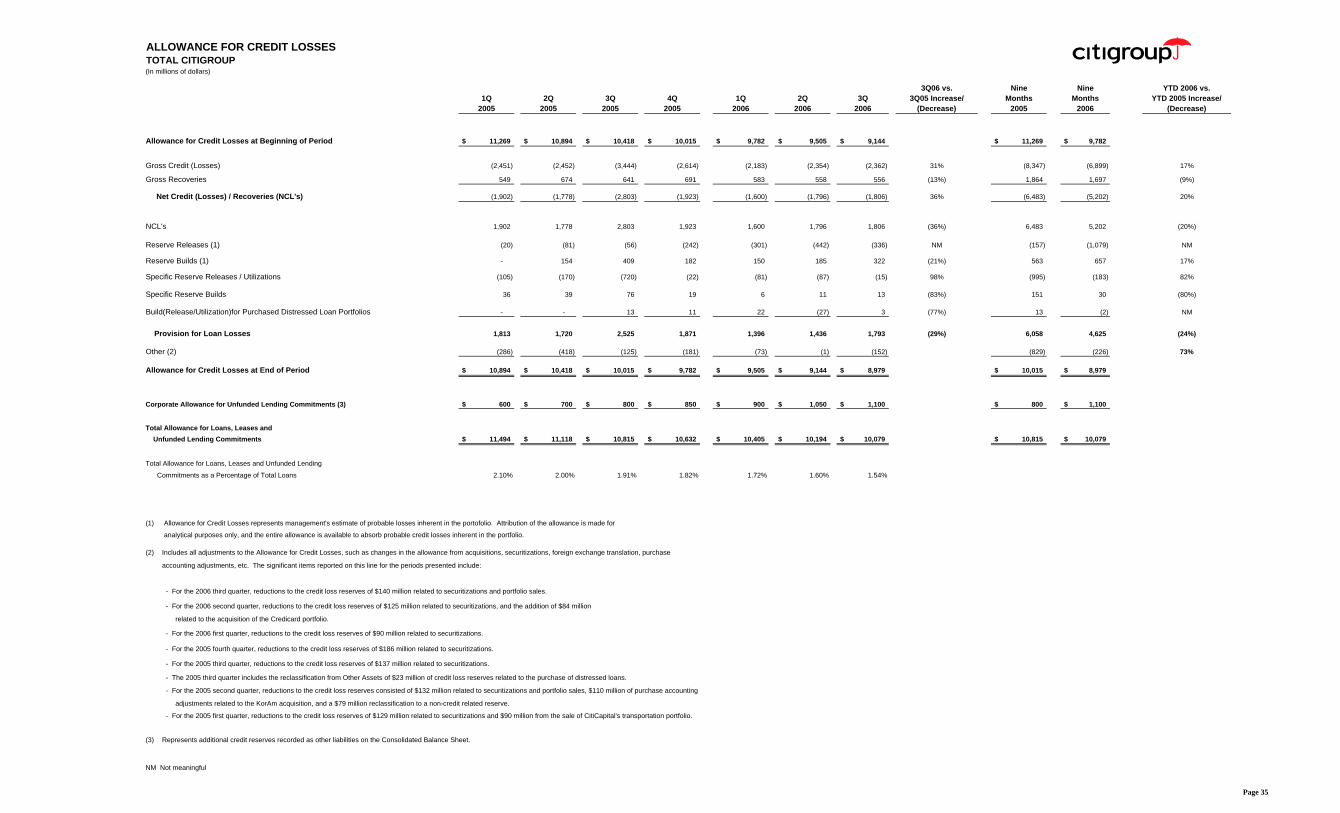
ALLOWANCE FOR CREDIT LOSSESTOTAL CITIGROUP(In millions of dollars)
3Q06 vs. Nine Nine YTD 2006 vs.1Q 2Q 3Q 4Q 1Q 2Q 3Q 3Q05 Increase/ Months Months YTD 2005 Increase/
2005 2005 2005 2005 2006 2006 2006 (Decrease) 2005 2006 (Decrease)
Allowance for Credit Losses at Beginning of Period 11,269$ 10,894$ 10,418$ 10,015$ 9,782$ 9,505$ 9,144$ 11,269$ 9,782$
Gross Credit (Losses) (2,451) (2,452) (3,444) (2,614) (2,183) (2,354) (2,362) 31% (8,347) (6,899) 17%
Gross Recoveries 549 674 641 691 583 558 556 (13%) 1,864 1,697 (9%)
Net Credit (Losses) / Recoveries (NCL's) (1,902) (1,778) (2,803) (1,923) (1,600) (1,796) (1,806) 36% (6,483) (5,202) 20%
NCL's 1,902 1,778 2,803 1,923 1,600 1,796 1,806 (36%) 6,483 5,202 (20%)
Reserve Releases (1) (20) (81) (56) (242) (301) (442) (336) NM (157) (1,079) NM
Reserve Builds (1) - 154 409 182 150 185 322 (21%) 563 657 17%
Specific Reserve Releases / Utilizations (105) (170) (720) (22) (81) (87) (15) 98% (995) (183) 82%
Specific Reserve Builds 36 39 76 19 6 11 13 (83%) 151 30 (80%)
Build(Release/Utilization)for Purchased Distressed Loan Portfolios - - 13 11 22 (27) 3 (77%) 13 (2) NM
Provision for Loan Losses 1,813 1,720 2,525 1,871 1,396 1,436 1,793 (29%) 6,058 4,625 (24%)
Other (2) (286) (418) (125) (181) (73) (1) (152) (829) (226) 73%
Allowance for Credit Losses at End of Period 10,894$ 10,418$ 10,015$ 9,782$ 9,505$ 9,144$ 8,979$ 10,015$ 8,979$
Corporate Allowance for Unfunded Lending Commitments (3) 600$ 700$ 800$ 850$ 900$ 1,050$ 1,100$ 800$ 1,100$
Total Allowance for Loans, Leases and Unfunded Lending Commitments 11,494$ 11,118$ 10,815$ 10,632$ 10,405$ 10,194$ 10,079$ 10,815$ 10,079$
Total Allowance for Loans, Leases and Unfunded Lending
Commitments as a Percentage of Total Loans 2.10% 2.00% 1.91% 1.82% 1.72% 1.60% 1.54%
(1) Allowance for Credit Losses represents management's estimate of probable losses inherent in the portofolio. Attribution of the allowance is made for
analytical purposes only, and the entire allowance is available to absorb probable credit losses inherent in the portfolio.
(2) Includes all adjustments to the Allowance for Credit Losses, such as changes in the allowance from acquisitions, securitizations, foreign exchange translation, purchase
accounting adjustments, etc. The significant items reported on this line for the periods presented include:
- For the 2006 third quarter, reductions to the credit loss reserves of $140 million related to securitizations and portfolio sales.
- For the 2006 second quarter, reductions to the credit loss reserves of $125 million related to securitizations, and the addition of $84 million
related to the acquisition of the Credicard portfolio.
- For the 2006 first quarter, reductions to the credit loss reserves of $90 million related to securitizations.
- For the 2005 fourth quarter, reductions to the credit loss reserves of $186 million related to securitizations.
- For the 2005 third quarter, reductions to the credit loss reserves of $137 million related to securitizations.
- The 2005 third quarter includes the reclassification from Other Assets of $23 million of credit loss reserves related to the purchase of distressed loans.
- For the 2005 second quarter, reductions to the credit loss reserves consisted of $132 million related to securitizations and portfolio sales, $110 million of purchase accounting
adjustments related to the KorAm acquisition, and a $79 million reclassification to a non-credit related reserve.
- For the 2005 first quarter, reductions to the credit loss reserves of $129 million related to securitizations and $90 million from the sale of CitiCapital's transportation portfolio.
(3) Represents additional credit reserves recorded as other liabilities on the Consolidated Balance Sheet.
NM Not meaningful
Page 35

ALLOWANCE FOR CREDIT LOSSESCONSUMER LOANS (1)
(In millions of dollars)
3Q06 vs. Nine Nine YTD 2006 vs.1Q 2Q 3Q 4Q 1Q 2Q 3Q 3Q05 Increase/ Months Months YTD 2005 Increase/
2005 2005 2005 2005 2006 2006 2006 (Decrease) 2005 2006 (Decrease)
Allowance for Credit Losses at Beginning of Period 8,379$ 8,060$ 7,714$ 7,226$ 6,922$ 6,647$ 6,311$ 8,379$ 6,922$
Gross Credit (Losses) (2,379) (2,341) (3,380) (2,486) (2,142) (2,235) (2,318) 31% (8,100) (6,695) 17%
Gross Recoveries 454 544 454 451 509 481 503 11% 1,452 1,493 3%
Net Credit (Losses) / Recoveries (NCL's) (1,925) (1,797) (2,926) (2,035) (1,633) (1,754) (1,815) 38% (6,648) (5,202) 22%
NCL's 1,925 1,797 2,926 2,035 1,633 1,754 1,815 (38%) 6,648 5,202 (22%)
Reserve Releases (2) (20) (81) (56) (242) (301) (442) (336) NM (157) (1,079) NM
Reserve Builds (2) - 154 359 147 150 110 247 (31%) 513 507 (1%)
Specific Reserve Releases / Utilizations (41) (42) (665) (5) (36) (3) - 100% (748) (39) 95%
Specific Reserve Builds 5 7 20 1 - 7 10 (50%) 32 17 (47%)
Build(Release/Utilization)for Purchased Distressed Loan Portfolios - - - - - - - - - - -
Provision for Loan Losses 1,869 1,835 2,584 1,936 1,446 1,426 1,736 (33%) 6,288 4,608 (27%)
Other (3) (263) (384) (146) (205) (88) (8) (145) (793) (241) 70%
Allowance for Credit Losses at End of Period 8,060$ 7,714$ 7,226$ 6,922$ 6,647$ 6,311$ 6,087$ 7,226$ 6,087$
Net Consumer Credit (Losses) as a Percentage of Average Consumer Loans 1.83% 1.68% 2.68% 1.82% 1.46% 1.48% 1.49%
Consumer Allowance for Credit Losses
As a Percentage of Total Consumer Loans 1.87% 1.78% 1.64% 1.52% 1.44% 1.31% 1.25%
(1) Includes loans made to Global Wealth Management clients.
(2) Allowance for Credit Losses represents management's estimate of probable losses inherent in the portofolio. Attribution of the allowance is made for
analytical purposes only, and the entire allowance is available to absorb probable credit losses inherent in the portfolio.
(3) Includes all adjustments to the Allowance for Credit Losses, such as changes in the allowance from acquisitions, securitizations, foreign exchange translation, purchase
accounting adjustments, etc. The significant items reported on this line for the periods presented include:
- For the 2006 third quarter, reductions to the credit loss reserves of $140 million related to securitizations and portfolio sales.
- For the 2006 second quarter, reductions to the credit loss reserves of $125 million related to securitizations, and the addition of $84 million
related to the acquisition of the Credicard portfolio.
- For the 2006 first quarter, reductions to the credit loss reserves of $90 million related to securitizations.
- For the 2005 fourth quarter, reductions to the credit loss reserves of $186 million related to securitizations.
- For the 2005 third quarter, reductions to the credit loss reserves of $137 million related to securitizations.
- For the 2005 second quarter, reductions to the credit loss reserves consisted of $132 million related to securitizations and portfolio sales, $110 million of purchase accounting
adjustments related to the KorAm acquisition, and a $79 million reclassification to a non-credit related reserve.
- For the 2005 first quarter, reductions to the credit loss reserves of $129 million related to securitizations and $90 million from the sale of CitiCapital's transportation portfolio.
NM Not meaningful
Page 36
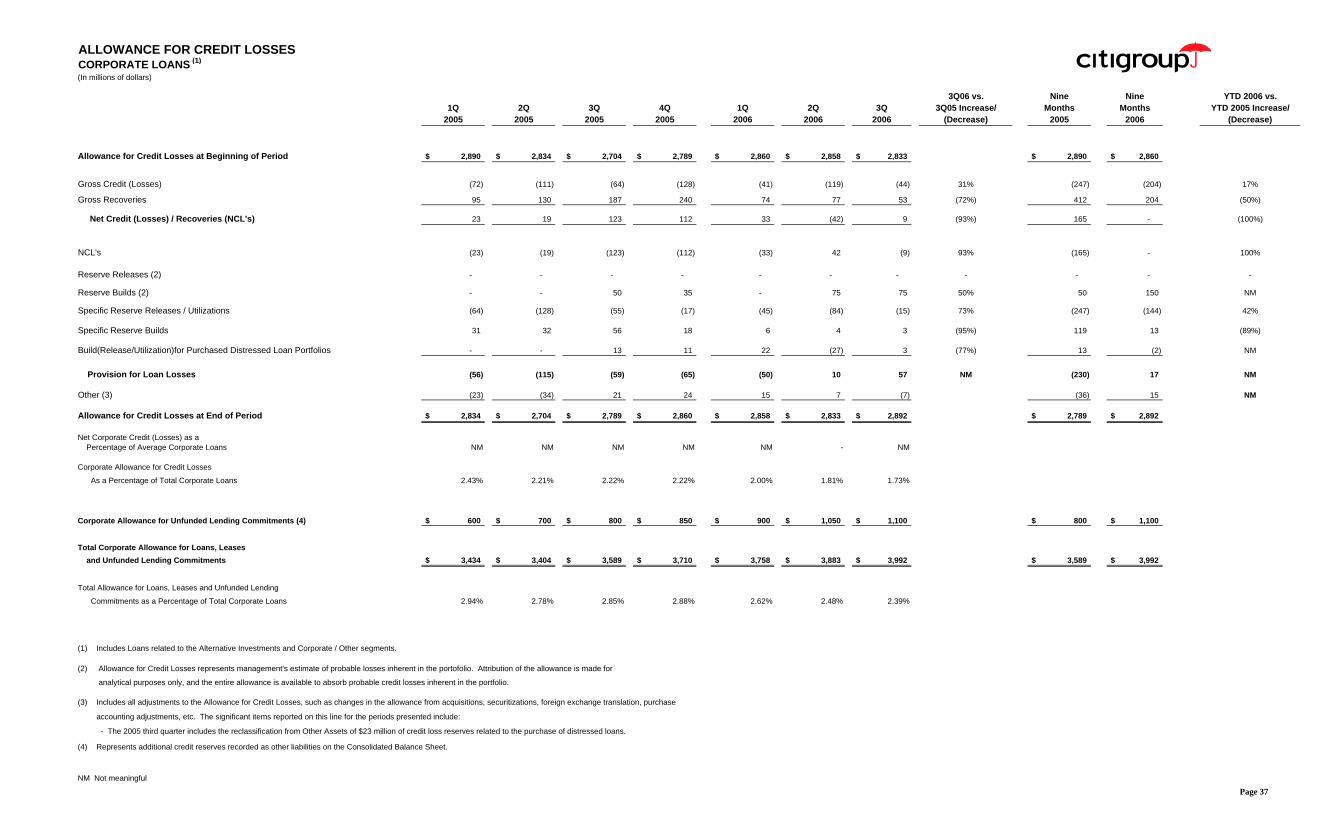
ALLOWANCE FOR CREDIT LOSSESCORPORATE LOANS (1)
(In millions of dollars)
3Q06 vs. Nine Nine YTD 2006 vs.1Q 2Q 3Q 4Q 1Q 2Q 3Q 3Q05 Increase/ Months Months YTD 2005 Increase/
2005 2005 2005 2005 2006 2006 2006 (Decrease) 2005 2006 (Decrease)
Allowance for Credit Losses at Beginning of Period 2,890$ 2,834$ 2,704$ 2,789$ 2,860$ 2,858$ 2,833$ 2,890$ 2,860$
Gross Credit (Losses) (72) (111) (64) (128) (41) (119) (44) 31% (247) (204) 17%
Gross Recoveries 95 130 187 240 74 77 53 (72%) 412 204 (50%)
Net Credit (Losses) / Recoveries (NCL's) 23 19 123 112 33 (42) 9 (93%) 165 - (100%)
NCL's (23) (19) (123) (112) (33) 42 (9) 93% (165) - 100%
Reserve Releases (2) - - - - - - - - - - -
Reserve Builds (2) - - 50 35 - 75 75 50% 50 150 NM
Specific Reserve Releases / Utilizations (64) (128) (55) (17) (45) (84) (15) 73% (247) (144) 42%
Specific Reserve Builds 31 32 56 18 6 4 3 (95%) 119 13 (89%)
Build(Release/Utilization)for Purchased Distressed Loan Portfolios - - 13 11 22 (27) 3 (77%) 13 (2) NM
Provision for Loan Losses (56) (115) (59) (65) (50) 10 57 NM (230) 17 NM
Other (3) (23) (34) 21 24 15 7 (7) (36) 15 NM
Allowance for Credit Losses at End of Period 2,834$ 2,704$ 2,789$ 2,860$ 2,858$ 2,833$ 2,892$ 2,789$ 2,892$
Net Corporate Credit (Losses) as a Percentage of Average Corporate Loans NM NM NM NM NM - NM
Corporate Allowance for Credit Losses
As a Percentage of Total Corporate Loans 2.43% 2.21% 2.22% 2.22% 2.00% 1.81% 1.73%
Corporate Allowance for Unfunded Lending Commitments (4) 600$ 700$ 800$ 850$ 900$ 1,050$ 1,100$ 800$ 1,100$
Total Corporate Allowance for Loans, Leases and Unfunded Lending Commitments 3,434$ 3,404$ 3,589$ 3,710$ 3,758$ 3,883$ 3,992$ 3,589$ 3,992$
Total Allowance for Loans, Leases and Unfunded Lending
Commitments as a Percentage of Total Corporate Loans 2.94% 2.78% 2.85% 2.88% 2.62% 2.48% 2.39%
(1) Includes Loans related to the Alternative Investments and Corporate / Other segments.
(2) Allowance for Credit Losses represents management's estimate of probable losses inherent in the portofolio. Attribution of the allowance is made for
analytical purposes only, and the entire allowance is available to absorb probable credit losses inherent in the portfolio.
(3) Includes all adjustments to the Allowance for Credit Losses, such as changes in the allowance from acquisitions, securitizations, foreign exchange translation, purchase
accounting adjustments, etc. The significant items reported on this line for the periods presented include:
- The 2005 third quarter includes the reclassification from Other Assets of $23 million of credit loss reserves related to the purchase of distressed loans.
(4) Represents additional credit reserves recorded as other liabilities on the Consolidated Balance Sheet.
NM Not meaningful
Page 37
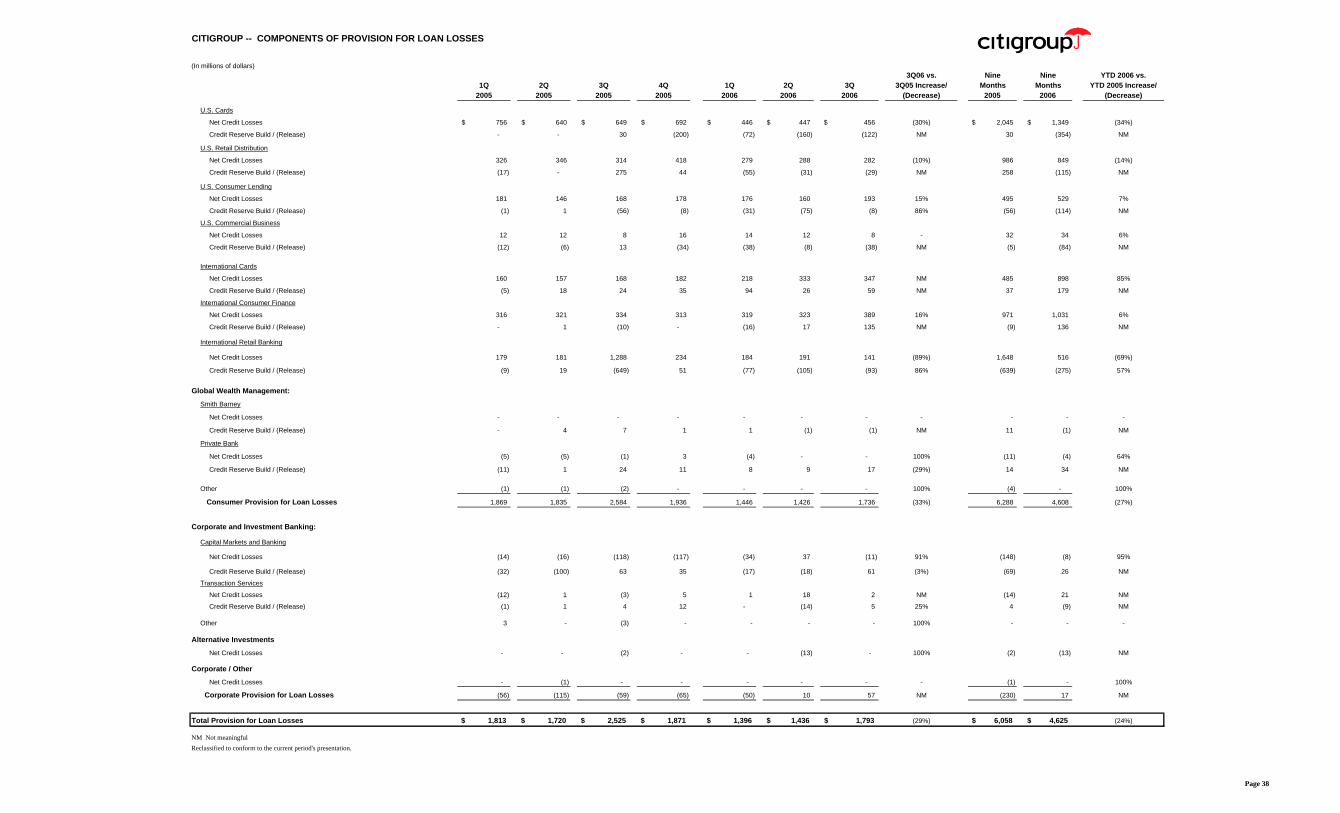
CITIGROUP -- COMPONENTS OF PROVISION FOR LOAN LOSSES
(In millions of dollars)3Q06 vs. Nine Nine YTD 2006 vs.
1Q 2Q 3Q 4Q 1Q 2Q 3Q 3Q05 Increase/ Months Months YTD 2005 Increase/2005 2005 2005 2005 2006 2006 2006 (Decrease) 2005 2006 (Decrease)
U.S. Cards
Net Credit Losses 756$ 640$ 649$ 692$ 446$ 447$ 456$ (30%) 2,045$ 1,349$ (34%)
Credit Reserve Build / (Release) - - 30 (200) (72) (160) (122) NM 30 (354) NM
U.S. Retail Distribution
Net Credit Losses 326 346 314 418 279 288 282 (10%) 986 849 (14%)
Credit Reserve Build / (Release) (17) - 275 44 (55) (31) (29) NM 258 (115) NM
U.S. Consumer Lending
Net Credit Losses 181 146 168 178 176 160 193 15% 495 529 7%
Credit Reserve Build / (Release) (1) 1 (56) (8) (31) (75) (8) 86% (56) (114) NM
U.S. Commercial Business
Net Credit Losses 12 12 8 16 14 12 8 - 32 34 6%
Credit Reserve Build / (Release) (12) (6) 13 (34) (38) (8) (38) NM (5) (84) NM
International Cards
Net Credit Losses 160 157 168 182 218 333 347 NM 485 898 85%
Credit Reserve Build / (Release) (5) 18 24 35 94 26 59 NM 37 179 NM
International Consumer Finance
Net Credit Losses 316 321 334 313 319 323 389 16% 971 1,031 6%
Credit Reserve Build / (Release) - 1 (10) - (16) 17 135 NM (9) 136 NM
International Retail Banking
Net Credit Losses 179 181 1,288 234 184 191 141 (89%) 1,648 516 (69%)
Credit Reserve Build / (Release) (9) 19 (649) 51 (77) (105) (93) 86% (639) (275) 57%
Global Wealth Management:
Smith Barney
Net Credit Losses - - - - - - - - - - -
Credit Reserve Build / (Release) - 4 7 1 1 (1) (1) NM 11 (1) NM
Private Bank
Net Credit Losses (5) (5) (1) 3 (4) - - 100% (11) (4) 64%
Credit Reserve Build / (Release) (11) 1 24 11 8 9 17 (29%) 14 34 NM
Other (1) (1) (2) - - - - 100% (4) - 100%
Consumer Provision for Loan Losses 1,869 1,835 2,584 1,936 1,446 1,426 1,736 (33%) 6,288 4,608 (27%)
Corporate and Investment Banking:
Capital Markets and Banking
Net Credit Losses (14) (16) (118) (117) (34) 37 (11) 91% (148) (8) 95%
Credit Reserve Build / (Release) (32) (100) 63 35 (17) (18) 61 (3%) (69) 26 NM
Transaction Services
Net Credit Losses (12) 1 (3) 5 1 18 2 NM (14) 21 NM
Credit Reserve Build / (Release) (1) 1 4 12 - (14) 5 25% 4 (9) NM
Other 3 - (3) - - - - 100% - - -
Alternative Investments
Net Credit Losses - - (2) - - (13) - 100% (2) (13) NM
Corporate / Other
Net Credit Losses - (1) - - - - - - (1) - 100%
Corporate Provision for Loan Losses (56) (115) (59) (65) (50) 10 57 NM (230) 17 NM
Total Provision for Loan Losses 1,813$ 1,720$ 2,525$ 1,871$ 1,396$ 1,436$ 1,793$ (29%) 6,058$ 4,625$ (24%)
NM Not meaningfulReclassified to conform to the current period's presentation.
Page 38
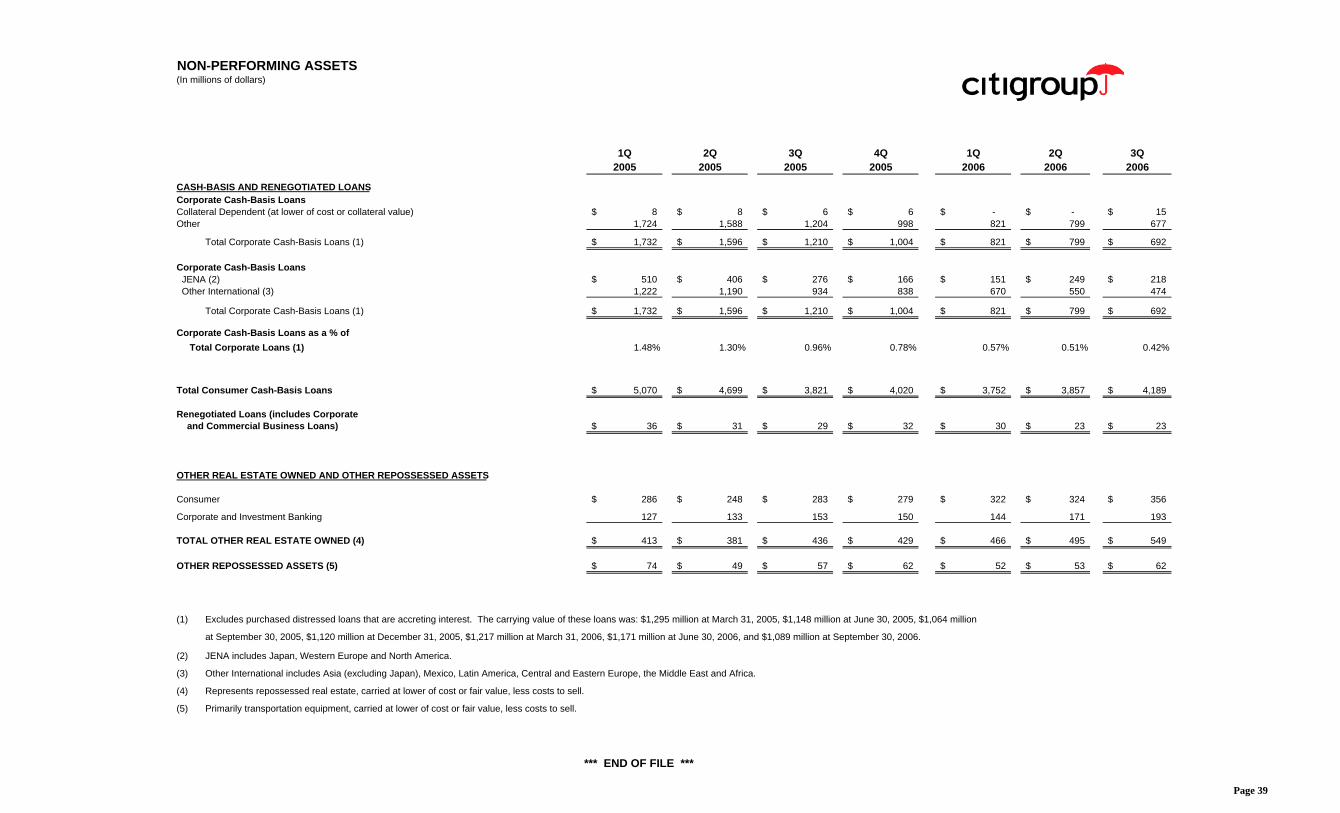
NON-PERFORMING ASSETS (In millions of dollars)
1Q 2Q 3Q 4Q 1Q 2Q 3Q
2005 2005 2005 2005 2006 2006 2006
CASH-BASIS AND RENEGOTIATED LOANSCorporate Cash-Basis LoansCollateral Dependent (at lower of cost or collateral value) 8$ 8$ 6$ 6$ -$ -$ 15$ Other 1,724 1,588 1,204 998 821 799 677
Total Corporate Cash-Basis Loans (1) 1,732$ 1,596$ 1,210$ 1,004$ 821$ 799$ 692$
Corporate Cash-Basis Loans JENA (2) 510$ 406$ 276$ 166$ 151$ 249$ 218$ Other International (3) 1,222 1,190 934 838 670 550 474
Total Corporate Cash-Basis Loans (1) 1,732$ 1,596$ 1,210$ 1,004$ 821$ 799$ 692$
Corporate Cash-Basis Loans as a % of Total Corporate Loans (1) 1.48% 1.30% 0.96% 0.78% 0.57% 0.51% 0.42%
Total Consumer Cash-Basis Loans 5,070$ 4,699$ 3,821$ 4,020$ 3,752$ 3,857$ 4,189$
Renegotiated Loans (includes Corporate and Commercial Business Loans) 36$ 31$ 29$ 32$ 30$ 23$ 23$
OTHER REAL ESTATE OWNED AND OTHER REPOSSESSED ASSETS
Consumer 286$ 248$ 283$ 279$ 322$ 324$ 356$
Corporate and Investment Banking 127 133 153 150 144 171 193
TOTAL OTHER REAL ESTATE OWNED (4) 413$ 381$ 436$ 429$ 466$ 495$ 549$
OTHER REPOSSESSED ASSETS (5) 74$ 49$ 57$ 62$ 52$ 53$ 62$
(1) Excludes purchased distressed loans that are accreting interest. The carrying value of these loans was: $1,295 million at March 31, 2005, $1,148 million at June 30, 2005, $1,064 million
at September 30, 2005, $1,120 million at December 31, 2005, $1,217 million at March 31, 2006, $1,171 million at June 30, 2006, and $1,089 million at September 30, 2006.
(2) JENA includes Japan, Western Europe and North America.
(3) Other International includes Asia (excluding Japan), Mexico, Latin America, Central and Eastern Europe, the Middle East and Africa.
(4) Represents repossessed real estate, carried at lower of cost or fair value, less costs to sell.
(5) Primarily transportation equipment, carried at lower of cost or fair value, less costs to sell.
*** END OF FILE ***
Page 39