cities without redevelopment marcia l. godwin, ph.d., and ...1 cities without redevelopment marcia...
TRANSCRIPT
Cities without Redevelopment
Marcia L. Godwin, Ph.D., and Jean Paul Schumacher, University of La Verne
DRAFT – PLEASE DO NOT CITE WITHOUT PERMISSION
Redevelopment agencies, until their abolishment in early 2012, were a popular mechanism for city and county governments in California to increase revenues. Property tax increment financing allowed local governments to subsidize the development of sales-tax producing businesses, redevelop downtowns, and fund affordable housing projects. Redevelopment had long been a source of controversy and the target of state-takeaways during economic downturns. This study analyzes revenue histories and economic development strategies for three mid-sized Southern California cities (Gardena, Diamond Bar, and Chino Hills) that did not have redevelopment agencies. Findings are contrasted with neighboring cities that had redevelopment agencies. This study fills in a gap in the literature about the effectiveness of tax increment financing.
Corresponding Author:
Marcia L. Godwin, Ph.D. Associate Professor of Public Administration
Department of Public and Health Administration College of Business and Public Management, CBPM 123
University of La Verne 1950 Third Street
La Verne, CA 91750 [email protected]
Co-Author:
Jean Paul Schumacher Master of Public Administration Candidate
Paper prepared for presentation at the 2013 annual meeting of the Western Political Science Association, Hollywood, CA, March 28-30, 2013.
1
Cities without Redevelopment
Marcia L. Godwin, Ph.D., and Jean Paul Schumacher1
Tax increment financing (TIF) has been a popular mechanism for local governments to
engage in economic development activities. TIF originated in California and was the
cornerstone of local redevelopment agencies (RDAs), which used increment financing to
subsidize the development of sales-tax producing businesses and to redevelop downtowns.
Redevelopment also allowed cities to make up losses in revenues by retaining a higher
proportion of property taxes at the expense of school districts and other governments. The large-
scale projects and diversion of property tax revenues drew controversy and led to state
government takeaways during economic downturns. Ultimately, the California state legislature
passed legislation to require RDAs to either make large payments to the state government or
abolish their redevelopment agencies; a California Supreme Court decision in early 2012 struck
down the payment provisions, thereby requiring the dismantling of all redevelopment agencies in
the state.
With the large number of government-owned properties and debt issued by
redevelopment agencies, it will decades before RDAs are completely abolished. There has been
follow-up legislation to clarify which types of projects will be allowed to be funded through
completion. There is some interest in eventually restoring a more limited form of TIF, but there
appears to be limited support in the state legislature for immediate action and opposition by the
current governor, Jerry Brown. Therefore, local governments that had redevelopment agencies
1 The authors appreciate contributions made by Master of Public Administration students in Marcia Godwin’s PADM 586 courses in Summer 2012 and Winter 2013. Students researched local cities’ economic development strategies and provided valuable insights about their perceptions about the end of redevelopment in California. The University of La Verne also provided a faculty research grant for 2012/13.
2
need to develop new economic development plans and strategies that do not rely on TIF at the
same time they are winding down current projects.
Research findings on the effectiveness of TIF are limited in spite of its widespread
adoption in the United States. In particular, there is a lack of research on the types of cities that
have not utilized this tool. This paper begins with an overview of TIF and a review of studies
about its effectiveness. Next, the California form of redevelopment is explained and a policy
history presented. The research methodology is then described. Analysis of the characteristics
of cities in Southern California that did not establish redevelopment agencies and case studies
follow.
Tax Increment Financing in the United States
Tax increment financing (TIF) has gained near universal adoption in the United States. A
handful of states adopted some form of TIF in the 1950s and 1960s, before the practice spread to
most other states in the 1970s and 1980s; nine others adopted in the 1990s and 2000s (CDFA
2007). Arizona was the sole holdout by the late 2000s, having repealed an earlier law. However,
adopting a limited form of TIF appears to be on the table, as witnessed by the Arizona PIRG’s
2011 review of TIF programs (Kerth and Baxandall 2011).
TIF appears to be an ideal form of redevelopment. A local government provides bond
financing to assist with the development of low-valued properties, usually commercially-zoned
areas. After development, properties are re-assessed at higher values. The increased property
tax serves to pay off the bonds and to provide for public city services (Koven and Lyons 2010;
Weber 2013). From a public choice or welfare economics perspective, TIF is considered a
Pareto-optimal policy as everyone is better off and no one is harmed. Even if government

3
assembles parcels for redevelopment by purchase or eminent domain, the Kaldor-Hicks criterion
is satisfied as previous property owners are compensated and there is a net benefit (Stokey and
Zeckhauser 1978; Weimer and Vining 2005).
As the Council of Development Finance Agencies (CDFA 2007, 9) advocates, TIF is
“most effective and least controversial” when it is targeted towards properties with severe blight,
and funding goes primarily to infrastructure construction and environmental cleanup. The
CDFA (2009) also recommends that governments carefully plan and analyze prospective uses of
TIF, be transparent through community engagement and education, and establish strong
accountability mechanisms. The Arizona PIRG’s review of TIF concluded that TIF districts
should be “targeted and temporary” (Kerth and Baxandall 2011, 15).
TIF in practice has often departed from the ideal and become more complicated. Along
with other economic development incentives, there has been a tendency to offer almost all
prospective commercial development subsidies or incentives. In the 1990s, more cities
connected incentives to performance measures, but there is also some evidence that more fiscally
stressed cities were still being overly generous with incentives (Sharp 2012). The establishment
of TIF districts may actually promote excessive inducements to private developers because the
funding comes from future revenues rather than being seen as coming out of operating budgets
(Weber 2013).
Rachel Weber (2013), a leading TIF scholar, says that tax increment revenues tend to be
seen by local leaders as locally-controlled funds that are not subject to many restrictions and that
issuing TIF bonds is relatively quick and easy, usually not requiring state or voter approval. It is
also relatively common, as it was in California, for property tax increment to be diverted to cities

4
from other governmental agencies, special districts, and schools. The net effect can vary,
depending on contextual factors and the ability of these other governments to make up losses
with other revenue sources (Weber, Hendrick, and Thompson 2008). Still, the perceived
advantages for cities have resulted in TIF being routinely used for development and
redevelopment projects, even though the merits of widespread use are unclear (Weber 2013; see
also Farris and Horbas 2009; Briffault 2010; and Lefcoe 2011).
Obviously, tax increment from re-assessed property values really is totally free or new if
diverted from other agencies and from the general revenues of the city establishing the TIF as
well. Subsidizing private development that might have occurred anyway further draws funds
away from public services. There also is a tendency for the availability of TIF to foster
competition among neighboring cities for tax-generating businesses (Briffault 2010). Weber
points out that higher-end development may drive away or shut down small businesses, actually
hurting the economic vitality of a community. The use of TIF can also expose a city to risk of
financial losses and repayment problems, as major economic downturns are not typically
included in the original plans (Weber 2013). TIF bond rates are usually higher than other forms
of municipal debt, which further magnifies potential risks and debt levels (Chapman and Gorina
2012).
Scholars have generally agreed that there are strong reasons for municipalities to favor
TIF, but also conclude that its use often has lacked transparency and accountability. There is
much less consensus and mixed results from studies attempting to evaluate outcomes. One study
found that cities in the Dallas/Fort Worth area emphasized risk assessment or performance
measurement, but not both (Bartels and Hall 2012). Another problem is the inherent difficulty of
5
trying to measure displacement effects or what would have happened in a location without
redevelopment (Farris and Horbas 2009; Weber 2013).
Recent studies have suggested that the geographical location and types of TIF districts
affect whether TIF can be deemed successful. On study found that business property values
increased in TIF districts in Wisconsin (Carroll 2008) while scholars studying industrial TIF
districts in Chicago showed negative spillover effects on residential property values (Weber,
Bhatta, and Merriman 2006). Another study of Wisconsin TIF districts found distinctions
between types of land uses and TIF’s impact on property values. The use of TIF for commercial
uses apparently contributed to increased property values while TIF did not seem to have a
positive impact on residential and manufacturing values (Merriman, Skidmore, and Kashian
2011). Another study of Illinois yielded findings that industrial TIF districts promoted job
growth while commercial TIF districts apparently reduced employment (Byrne 2010). These
authors also discuss the difficulties of controlling for self-selection bias: TIF districts may be
applied mainly to the most promising locations where deals can be made with developers,
targeted towards the most blighted areas that would not otherwise be redeveloped, or applied
indiscriminately.
Redevelopment in California
In California, redevelopment agencies were the umbrella entities for TIF projects for
sixty years, from 1952 to 2012. California’s version of redevelopment became extremely
sophisticated and varied across jurisdictions. The basic arrangements were deceptively simple
and the same for either a city or county. For ease of understanding, the following is described
from a city perspective. A city would establish its own redevelopment agency (RDA). Usually,

6
the city council would do double duty as the Redevelopment Agency Board of Directors. Most
RDA meetings would take place at the same time as council meetings, with its own call to order,
action, and adjournment. The meetings were subject to public meeting requirements, but
property tax negotiations would be conducted in closed or executive sessions. The council
members could also receive extra compensation beyond their council stipends.
Project areas were then established to redevelopment blighted properties. The number of
project areas and proportion of a city in redevelopment project areas varied greatly. Project areas
could also be merged or reformulated, which also had the effect of extending a project area for
decades longer; relatively few project areas expired or completely went away until the time the
whole system was abolished. Twenty percent of tax increment returning to cities as designated
as a housing set-aside for affordable housing programs, leaving the remaining 80% with the
RDA. Pass-through requirements to transfer a portion of increment back to schools and other
governmental agencies varied. Older project areas were not subject to pass-through
requirements while newer areas had to return a minimum percentage. As another example, the
City of Walnut, a suburban city in eastern Los Angeles County, had an agreement with Los
County that limited its annual increment revenues.
The allocation of expenses to RDAs also became very complicated. Doing long-term
projections for paying off a myriad of bonds and providing incentives to developers was just part
of RDA financial management. The RDAs often became major land owners and contracted for
infrastructure construction. As tax increment revenues built up over time and general fund
revenues continued to be constrained, many cities attempted to maximize staffing and overhead
charges charged to RDAs. Staff responsible for redevelopment activities and housing managers
were just some of those funded through redevelopment funds; parts of a multitude of other city
7
positions in other departments, including the City Manager, might be partially paid by
redevelopment funds. While the part paid by redevelopment was supposed to be related to
redevelopment, arguably redevelopment stabilized funding and allowed for higher service levels
and staff compensation.2
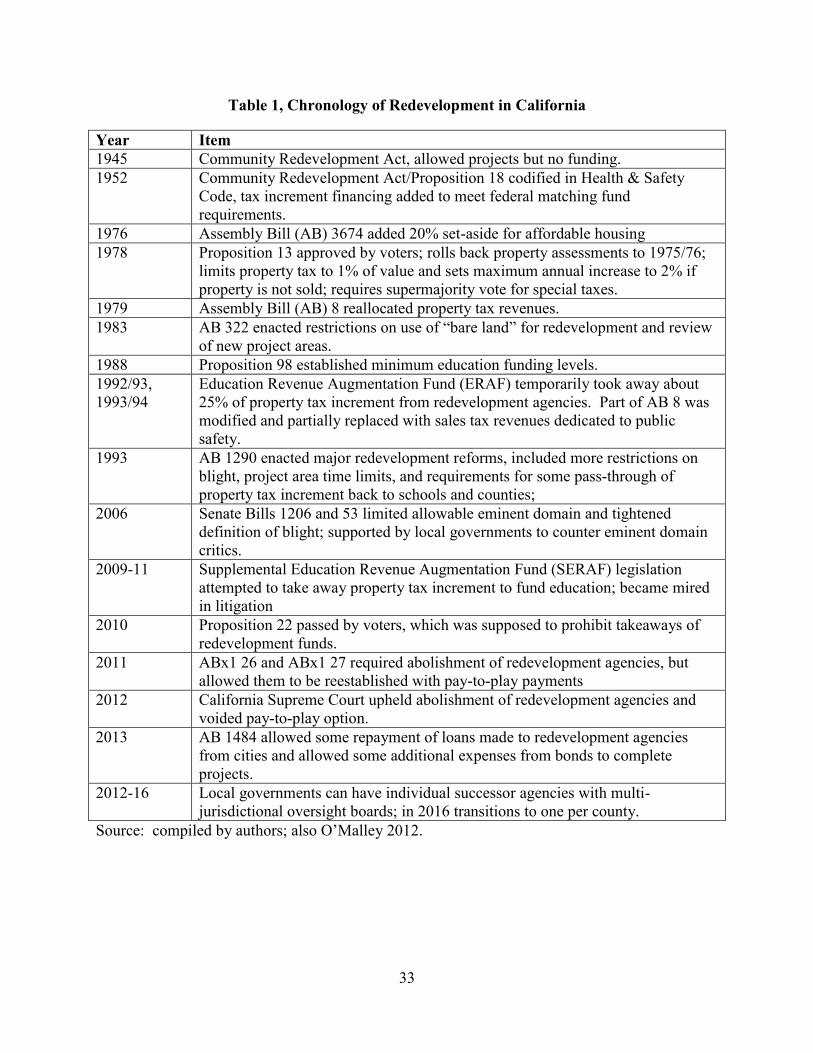
A chronology of key legislative actions and ballot propositions related to redevelopment
in California is provided as Table 1. The first community redevelopment law actually dates from
1945 as federal, state, and local governments in the United States began urban renewal programs.
However, tax increment financing not added until 1952 in order to provide matching funds for
federal grants. Thus, many reference sources use 1952 as the birth year of TIF.
Only 30 redevelopment agencies had been created in California by the end of the 1950s.
That number was more than doubled with 49 new agencies in the 1960s and then doubled again
with 106 created in the 1970s. Growth peaked in the 1980s, with an additional 153 agencies,
after voters approved Proposition 13 limiting property taxes. The 1990s through the start of the
Great Recession in mid-2007 saw only 62 new agencies (Steinmann 2010, 109-112). The
slowdown appeared to be due to a lack of additional eligible cities, with redevelopment reforms
of the early 1990s a major contributing factor, as described later in this section. During the last
full year of redevelopment (2010/11), there were 427 redevelopment agencies and 743 project
areas with over $5 billion in property tax increment3; about 80% of tax increment, or just under
$4 billion, was apportioned directly to the redevelopment agencies as opposed to being passed
through to other agencies (California State Controller 2012). In spite of increasing restrictions,
2 Coomes, et al.’s lengthy text, Redevelopment in California, Fourth Edition provides an overview of redevelopment processes and the text of California’s redevelopment law as of 2009. However, Fulton and Shigley’s Guide to California Planning, Fourth Edition (2012) provides a more concise, understandable, and critical review, with material updated through the abolishment of redevelopment agencies. 3 This number includes inactive agencies and those that reported no tax increment.
8
the percentage of all property tax going to redevelopment escalated from 2% in 1977 to 6% in
1988, 8% in 1998, and 12% in 2008 (O’Malley 2012).
[Insert Table 1 about here.]
While redevelopment was already gaining in popularity in the early 1970s, the passage of
Proposition 13 by the California electorate in 1978 made the establishment of RDAs and
expanding project areas more attractive. The development or redevelopment of property would
trigger a reassessment, thereby override Proposition 13’s cap on annual property tax increases.
Sales tax also became increasingly important, which led leaders to favor large-scale retail
shopping centers. With city revenues slashed after Proposition 13, the initial lack of requirements
to pass-through increment to other governmental agencies also meant that cities with
redevelopment agencies could maximize their share of property tax.
While the general public may not have understood the revenue shifts from
redevelopment, the unchecked growth in redevelopment did not go unnoticed by the state
legislature. Limits on the use of vacant land for redevelopment were tightened in 1984. The
share of property tax going to city redevelopment agencies had also increased to such a degree
that the state legislature directly required RDAs to make large payments to an Educational
Revenue Augmentation Fund (ERAF) in the early 1990s while simultaneously adopting other
takeways and shifting of revenues that had historically been designated for local government
(Multari, Coleman, Hampian, and Statler 2012).
The redevelopment process itself underwent major reform with the passage of AB 1290
in 1993, which went into effect in 1994. In fact, the leading reference book on California
redevelopment divides its chronology into a pre and post AB 1290 eras (Coomes et al. 2009).

9
The California Redevelopment Association itself was involved in sponsoring the legislation to
curb some of the worst abuses of redevelopment. RDAs were prohibited from including sales
tax rebates in incentive packages, a mandatory pass-through of some increment to other agencies
was required, and additional vacant land prohibitions were included (Coomes, et al. 2009).
These reforms, though, did not really deal with grandfathered redevelopment projects and
the pass-through requirements still diverted considerable funds to cities at the expense of other
agencies (Fulton and Shipley 2012). A study sponsored by the Public Policy Institute of
California projected that tax increment diversion would only decrease modestly and would
actually hurt counties while helping schools (Dardia 1998). William Fulton and Paul Shigley
(2012, 311) also highlight that an “anti-redevelopment industry” emerged in the 1990s, focusing
initially among more libertarian interest groups and officials in Orange County where the City of
Anaheim proposed a large redevelopment project around Disneyland. Chris Norby, first a city
council member in the city of Fullerton in Orange County and later a county supervisor became
the founding director of an anti-redevelopment organization, Municipal Officials for
Redevelopment Reform (MORR) that sponsored eight editions of a white paper, Redevelopment:
The Unknown Government, between 1996 and 2006.
As the California economy worsened, first during the dot.com bust of the early 2000s and
then during the Great Recession of the late 2000s, MORR was joined by other redevelopment
critics, including: more liberal political leaders concerned about developer subsidies and school
founding, supporters of more transparent government, and public safety unions gambling that an
end to redevelopment would eventually free up funds for more general use. The California
legislature continued to try to force payments from redevelopment agencies as a Supplemental
Educational Augmentation Fund (SERAF) over several years, which became mired in litigation.
10
Cities and the California Redevelopment Association also decided to push back through
the sponsorship of ballot propositions. Proposition 1A in 2004 protected several local
government revenue sources, but had a loophole for times of severe financial problems.
Proposition 22 in 2010 directly prohibited several specific revenue sources, including
redevelopment (Multari, Coleman, Hampian and Statler 2012). Nevertheless, the state
legislature continued to creatively draft bills to take away funds and an extremely critical report
by the state controller mobilized support for abolishing redevelopment itself (California State
Controller 2011). Legislation passed in 2011 gave RDA the option to stay in existence only by
paying extremely large payments; the early 2012 California Supreme Court decision, California
Redevelopment Association v. Matosantos, voided the pay-to-play option, forcing RDAs to
disband.
With the end of redevelopment agencies in California, there is an opportunity to reflect
on whether cities that did not have redevelopment were as successful as those that did have
redevelopment agencies. There also is an immediate need to evaluate whether the cities without
redevelopment agencies have used economic development strategies that can be adopted by
others as best practices. In order to determine whether these cities are appropriate examples, it is
necessary to evaluate whether these cities were similar to others that did have redevelopment
agencies. Were they already advantaged and did not need redevelopment? Were they limited by
pre-existing community features that made them ineligible for redevelopment? Was it more
happenstance or unique political factors that led some city councils to decide against pursuing
redevelopment? To the best of our knowledge, there has not been previous research on the
characteristics of cities that have not implemented TIF when it was available.
Methodology
11
With this exploratory study, we chose to start with Los Angeles County and its four
surrounding counties in Southern California (Ventura, Orange, Riverside, and San Bernardino
Counties). Using the final financial reports filed with the California State Controller before
redevelopment was abolished (Fiscal Year 2010/11), we begin by identifying the cities that did
not have active redevelopment agencies and conducting a basic review of community
characteristics. Incorporation year provides an indication of whether restrictions adopted in 1994
and the increasingly hostile environment for redevelopment in the 2000s limited new adoptions.
We also examine population size and median household income, as proxies to identify cities that
may not have had blighted areas and to also flag cities for more in-depth case studies.
We identified only two cities in Los Angeles County that had populations over 50,000
and did not have redevelopment agencies: Gardena and Diamond Bar. Gardena, as a relatively
low income city is the major focus of this paper. We present a history of its failed attempts to
adopt redevelopment and its economic development challenges and opportunities; we also
include a sales tax revenue comparison with the City of Carson, using data from the Rand
Corporations’s RAND-California database. We also include preliminary discussion on Diamond
Bar and its neighboring city, Chino Hills, which was the only city in San Bernardino without
redevelopment. We finish with a sales tax comparison of the two cities and the City of Chino.
Southern California Cities without Redevelopment
The Southern California region, including Los Angeles and its surrounding counties, has
184 incorporated cities, 38% of the 482 cities in the state. The percentage of those with
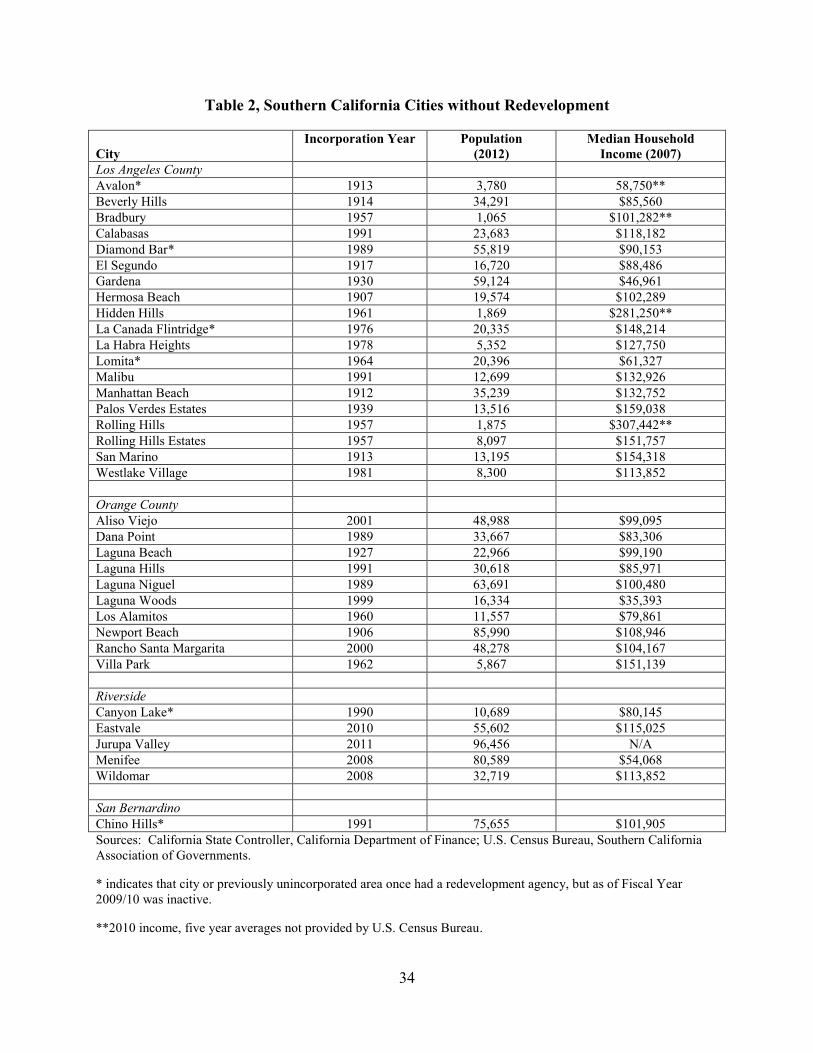
redevelopment agencies is near the state average, at 81%. A total of 35 cities did not have active
redevelopment agencies as of the late 2000s, as shown in Table 2. (A list of cities with
12
redevelopment, including year of establishment and number of project areas is shown as
Appendix A.)
[Insert Table 2 about here.]
To the north of Los Angeles, all ten cities in Ventura County had redevelopment agencies
well before the reforms of the early 1990s; the county government established its own agency
later and a separate authority was created in the late 1990s as the former Camarillo State Mental
Hospital was transformed into California State University, Channel Islands.
Nineteen of 88 cities (22%) in Los Angeles County did not have active redevelopment
agencies as of the late 2000s. These cities fall into three main categories: smaller, residential
enclaves; newer cities; and relatively affluent communities (coastal cities and Beverly Hills).
The City of Gardena stands out among this group, as one of the only city without redevelopment
to have a population of over 50,000 and be relatively low income (median household income of
$46,961). Diamond Bar is only other city with a population over 50,000 not to have
redevelopment, but is relatively affluent with a median household income of $90,153.
In spite of the heart of redevelopment opposition being in Orange County, only ten of 34
cities (29%) did not have a redevelopment agency. The cities without redevelopment agencies
fell into similar categories as those in Los Angeles County, although it is notable that two
communities, Laguna Niguel and Newport Beach, both had populations well over 50,000.
Newport Beach, in particular, seemed to be a prime candidate for redevelopment as an older city
(incorporated 1906) with a population of over 85,000. At the other extreme, though, is the City
of Laguna Woods. With a median household income of just over $35,000, it might appear to be
a low-income community in need of redevelopment. The reality is that most of the city is a

13
gated, senior community formerly known as Leisure World; the average age is 78 and a full
range of amenities are offered to residents (City of Laguna Woods 2013).
In fast-growing Riverside County, the five cities out of 28 (18%) that did not have
redevelopment included all of the cities incorporated in the late 2000s plus the City of Canyon
Lake, incorporated in 1990. (Riverside County cities incorporated in the same time frame as
Canyon Lake did have redevelopment agencies). It should be noted that Jurupa Valley only
incorporated in July 2011 and there were pre-existing county redevelopment project areas within
its city limits. As of 2013, Jurupa Valley was staffed solely by contract employees and was
struggling to remain viable after a state takeaway of its major revenue source, vehicle license
fees.
San Bernardino County, also in the Inland Empire, only had one city out of 24 (4%)
without an active redevelopment agency. Chino Hills had county redevelopment for an older
residential area prior to its incorporation as a city in 1991. However, it was not really eligible to
develop its own redevelopment program since it had very little flat land available for commercial
development; the City didn’t meet requirements related to blight and certainly would have later
run into restrictions against use of vacant land. Nevertheless, it is a good comparison case
because Diamond Bar is adjacent to the west and the City of Chino, with similar population size
and a redevelopment agency, is adjacent to the east.
Case Study: The City of Gardena
Gardena, a suburb of Los Angeles 15 miles south of the city core, now bears little
resemblance to a garden or its agrarian roots. Once renowned for its strawberries in the 1930s,
the city’s current claims to fame may be its two major casinos and the four freeways that bound

14
it – the latter a point of pride embodied by Gardena’s slogan “Freeway City.” City leaders now
desire to position Gardena as a ‘City of Opportunity’, envisioning it as “one of the most desired
communities in which to live, do business, work and play” (City of Gardena 2009, 7). With
Gardena situated in the shadows of larger, more affluent South Bay cities to the west and
struggling South Los Angeles cities to the east, actualizing the City of Opportunity may just be a
considerably tall order for the nearly 6-square mile suburb. Gardena has never enjoyed the
economic benefits of redevelopment, its citizens voting against redevelopment efforts a total of
three times. Gardena could be well positioned for the post-redevelopment future, but also it may
have fallen irreparably behind its neighboring cities that had RDAs.
City Profile
Gardena has much more work to do to live up to its bold vision. Housing is plentiful (see
Figure 1), with the city dedicating 44% to it, of which 68% is zoned for low-density houses (City
of Gardena, 2005 7). However, houses in South and Southwest Gardena (closer to the coast and
South Bay areas) are well kept, newer, and modernized in comparison to older, less maintained
homes in North and Northeast Gardena (South L.A. areas). Further, the perception of increased
crime activity seems to be more prevalent in North and Northeast Gardena as evidenced by a
preponderance of window bars.
Business opportunities follow the same pattern. According to the Gardena Land Use
Plan, Gardena appears to prioritize industry on the South LA side of the city, with a large
industrial bloc in the economically depressed area north of the Rosecrans Blvd arterial.
Meanwhile, two large thriving commercial areas surround the Redondo Beach and Artesia Blvd
arterial streets, the latter further buttressed by a younger vibe and newly constructed mixed-use,
15
green housing. City leaders hoped redevelopment would jumpstart commercial investment in the
north and along the city to finally capitalize on the heavy traffic flow along the Rosecrans
thoroughfare. But with redevelopment rejected by voters in 2004, the balance of commercial
activity has yet to be realized.
Gardena also seems to be an entertainment desert. Despite a decent parks and recreation
program, green space and recreation facilities are lacking for the city of nearly 60,000 residents
(USC Center for Economic Development, 2002, p. 61). Also, despite cultural diversity and
strong cultural exposure opportunities by the thriving Japanese community, most residents would
need to travel outside city limits to access arts, theatre, cuisine, and culture. The city is home to
one movie theatre and a bowling alley, but lacks the attractive entertainment, recreation, and
social opportunities afforded by nearby beach communities.
Attempts to Establish Redevelopment
Gardena’s first economic driver was farming. Situated in the once lush Gardena Valley,
Japanese farmers were central to the city’s success as a farming community, growing
strawberries and apples. Gardena’s thriving farms earned the area the distinction of being the
“berry capital of Southern California” (Gardena Heritage Committee, 2006, p.7). By the time the
communities of Gardena, Moneta, and Strawberry Park incorporated into the City of Gardena in
1930 to fend off annexation by the City of Los Angeles, strawberry crops had lost their
dominance. In 1936, Earnest Primm opened the first California card club in Gardena, exploiting
a loophole in California’s ban on gambling (Normandie Casino, n.d). This move paved the way
for other card clubs to open — an economic boon for the fledgling city, using card club licensing
fees to shoulder much of Gardena’s operating costs (Normandie Casino, n.d.). As the city slowly
16
expanded north from its downtown core situated around Palm Avenue (later Gardena Blvd), it
gradually transformed its rich farmland into homes, businesses, and industry (Lee 1974, CS1).
By the 1950s, industry rendered the city unrecognizable from its agrarian roots and joined
gaming as Gardena’s economic engine (Gardena Community History, n.d). Because of its
proximity to the ports of Los Angeles and Long Beach, Gardena was an excellent site for light
manufacturing and aerospace companies (Gardena Community History, n.d.). Freeway
construction in the 1960s spurred industrial investment. By the mid-1970s, however, Gardena
faced budget woes due to inflation and critical budgeting errors (“Gardena Council,” 1974).
Further, Gardena was beginning to see growing blight in the north part of the city along with the
negative environmental impact of industry (Lee, 1974, pp. CS1). Observing the success of
redevelopment agencies in surrounding South Bay municipalities, Gardena established a
redevelopment agency in November 1974 (“Council Resolves Redevelopment,” 1974, pp. CS2;
Lee, 1974, pp. CS1), but was met with immediate opposition.
While residents had various concerns, from increased taxes to the capacity of the part-
time council to double as members of the redevelopment agency, the primary fear of residents
was that eminent domain would result in the demolition of homes and displacement of families
(1974, pp. CS1). This was of particular concern to Japanese-American residents whose lands
were seized and who had to suffer through the trauma of internment during World War II. There
was also a racist sentiment to some residents’ concerns about the building of apartments,
believing that it would allow “low income minority families, not living in the city… [to be]
eligible for dwellings through subsidies” (1974, pp. CS1). Despite the polarizing nature of
redevelopment, the council approved the agency in November. An immediate response by
Gardeneans led to the gathering and submission of petitions within a month of the ordinance’s

17
passage, forcing the council to rescind the ordinance or put the issue to a vote. By January, the
council reneged on their push for redevelopment (“Citizens Group,” 1975, pp. CS1). Despite
acquiescing to its residents, the Council did not lay redevelopment to rest for too long.
Two years later, armed with a new strategy, Gardena launched its second attempt at
redevelopment. There were , dual goals: to assuage fears of the city seizing and destroying
homes and focus solely on industry (Wolinsky 1977, CS3). The focus on industry was in
recognition that Carson and Hawthorne had effectively leveraged redevelopment to create malls,
and Gardena was no longer in a position to compete commercially (Wolinky 1977, CS1).
Despite the change in tactics, residents, many of which were concerned that redevelopment
required affordable housing would create slums in the city, effectively petitioned the ordinance
(“New Panel” 1977, CS1). Instead of acquiescing to petitioners this time, the council allowed
the issue to be determined by residents at the polls. Redevelopment was killed again in
November 1977, seven months before the statewide passage of Proposition 13 limiting property
taxes and before the peak in redevelopment growth.
Without redevelopment, Gardena maintained its traditional “pay-as-you-go” philosophy
and used general city funds to front the money required for tax incentives to spur redevelopment
(North-Hager 2004, A1). And while this philosophy would serve Gardena well for more than a
decade, by the early 1990s, a fiscally secure Gardena would seek to diversify its economic
development using bonds to fund two novel but risky programs rather than utilizing the more
well-understood TIF bonds used in redevelopment.
Gardena established a first time home buyers loan assistance program (1992) and a
mutual municipal insurance company (1993). Despite its innovation, both moves to stimulate
18
economic development cost the city dearly. Its first time homebuyers loan assistance program
was the first one sponsored by a California city and was ironically adopted by other cities as a
way of spending affordable housing funds accumulated through redevelopment. Gardena’s
program was initially popular, drawing people of “middle- and upper-income” (Willis, 1993, p.
Metro 3).
Following up, Gardena’s second foray in novel economic development was the creation
of its own insurance company, a first in the nation. Gardena aspired for its Mutual Municipal
Insurance Company (MMIC) to offer California cities a viable option to the popular municipal
insurance pools as well as a share in its company. Despite early optimism for generating income
for the city, MMIC was unable to successfully challenge the insurance pools and market
saturation (Becerra 2005, Metro B1), drawing in very few clients. But instead of dissolving the
company and recouping any available funds, the city cited business growing pains, refinanced its
loan in 1995 and in 2000 entered the worker’s compensation market (Becerra 2005, MetroB1).
Further complicating matters, Gardena incurred a $5.2 budget deficit in 1998, at the end
of an economic recession. The city took four years to balance its budget, ending fiscal year
2001/02 with a million dollar surplus (City of Gardena, 2012). Despite an apparent return to
fiscal stability, the city faced a $26.2 million dollar repayment in 2004 (Issacs 2003, A3).
Despite this, Gardena held out for one final experiment.
In 2003, the Gardena city council voted to create a redevelopment agency. The primary
city council arguments for redevelopment were lost income due to the lack of economic
development and blight along the busy Rosecrans Avenue thoroughfare and the success of
neighboring South Bay cities with redevelopment agencies. One council member went so far as
19
to Gardena as “the hole in the doughnut of development” and the city you pass “on the way to
Carson and Inglewood” (North-Hager 2004, A3). Armed with the tools of redevelopment,
council members believed that they could rejuvenate ailing areas in the city, particularly north of
the Rosecrans arterial, assembling the land and incentives necessary to attract developers,
generate income, and develop a stream of funding that would pay down the $26.2 million in
debt.
In light of the two recent municipal project failures, detractors were skeptical and formed
a group whose name spoke to its skepticism: No GRAB (Gardena Redevelopment Agency
Boondoggle). No GRAB acquired the requisite signatures for the Council to make the choice to
rescind the redevelopment ordinance or take it to the voters. For the second time, the Council
opted for a citizen vote (Issacs 2003, A3). Leading up to November 2004 vote, the pro-
redevelopment campaign outspent the No GRAB anti-redevelopment campaign. While the
supporters of redevelopment emphasized optimism, opportunity, and the need for new funds to
pay down the debt, No GRAB cited Gardena’s traditional “pay-as-you-go” philosophy, the city’s
success at bringing thriving commercial development along Redondo Beach and Artesia
Boulevards, and the two failed municipal projects of the 1990s (North-Hager 2004, A3; Issacs
2003, A3). No GRAB mail outs highlighted the problematic nature of eminent domain,
highlighting the still palpable trauma of Japanese internment and forcible land seizure (“No
GRAB, n.d.). Despite being outspent 5 to 1, redevelopment was crushed 2 to 1 at the polls.
With the end of redevelopment in 2012, Gardena’s third attempt at redevelopment was also its
last.
Despite the municipal project failures and the lack of a redevelopment agency, Gardena’s
economic development since the 1998 has been on a slow, but steady pace forward. Gardena

20
boasted a $9.2 million dollar reserve fund by the end of fiscal year 2010/11, had settled its $26.2
million bond debt, and improved its credit rating (City of Gardena 2011, viii, 36, 163). With
better financial management and its pay-as-you-go philosophy, Gardena was able to implement
several specific plans to stimulate residential and commercial development, including new gated
communities of higher-end single-family and townhouses and improvements to the local Sam’s
Club. Artesia Corridor, the most recent 44 acre specific plan initiated in 2006, has already
yielded the lucrative residential facility 1600 at Artesia Square, a self-titled “solar community in
the heart of Gardena” (“1600 at Artesia Square, n.d.) consisting of modern townhomes and lofts.
In addition to using specific plans as a guide for economic development, Gardena has benefitted
from large government grants. Because the industrial boom from the 1950s to the 1980s left a
disproportionate amount of brownfields (former industrial sites suspected or confirmed to have
toxic substances in the soil) in the city, Gardena competed and has attained large federal
Environmental Protection Agency grants for brownfield remediation (City of Gardena
Department of Community Development 2009). Since 2000, Gardena has received over $1.2
million in funding to assist with environmental study and strategic planning for redevelopment.
Successful brownfield redevelopment has led to commercial investment from such chains as
Albertsons and GNC as well as the development of a LEED certified public building that houses
the Gardena Transit Authority (City of Gardena, Department of Community Development 2006).
Life Outside the Donut Hole: Hawthorne and Carson
The cities of Hawthorne (to the west) and Carson (to the east) were considered as
possible comparison cities with Gardena. Gardena and Hawthorne are similar sized in land area
(see Table 3), while Carson is much larger. Carson makes the most of its land area, dedicating
the majority of its land to heavy and light manufacturing, while Gardena and Hawthorne zone the
21
preponderance of their land to housing. The difference between Gardena and Hawthorne’s
residential zoning is that Hawthorne has more high-density residential zones, accounting for the
larger population in Hawthorne.
[Insert Table 3 about here.]
Carson and Gardena are most similar in terms of racial/ethnic diversity. Educationally,
Carson and Gardena are similar again: Gardena possesses a higher number of HS graduates (81%
to Carson’s 80%) while Carson has a slightly higher number of residents with bachelors (25% to
Gardena’s 23%). Carson’s median income, though, is substantially higher than Gardena’s
($70,416 and $46,961). Despite possessing a higher number of high school and college
graduates than Hawthorne, Gardena’s median income is only slightly higher than Hawthorne’s
median $45,622. In addition to similar median incomes, Gardena and Hawthorne have poverty
rates that are close to each other (16% and 17% respectively), while Carson is a low 7.8%.
However, since Carson is the most similar to Gardena in terms of demographics and population
size, it was selected first for comparison with Gardena.
Prior to incorporation, Carson was home to “refuse dumps, landfills, and auto
dismantling plants” (History of Carson, n.d.). Long an unincorporated part of Los Angeles
County, Carson finally incorporated in 1969. A relatively young city compared to its neighbors,
it quickly established a redevelopment agency in 1971 and since made quick work of turning a
city around that had long been the “dumping ground… of its neighbors” (History of Carson,
n.d.). Two more project areas were added in 1974 and 1984; they were combined in 1996,
according to State Controller Records; further changes were made in 2002 (California State
22
Controller 2012). Carson’s property tax increment revenues from redevelopment increased from
$7.8 million in 1990 to $25.7 million by 2007 (Steinmann 2010).
One of Carson’s earliest redevelopment successes was the development of the Carson
Mall. Gardena Major Edmond J. Russ cited the success of the Carson Mall as a push for
redevelopment in 1974 (Lee 1974, Petitions Again, CS1) and the Carson mall was mentioned
once again when the council changed redevelopment strategies to focus on industry in 1977,
ceding commercial development to the primacy of the Carson and Hawthorne Malls (Wolinsky
1977 CS1).
Moving forward from the 1970s, Carson leveraged its redevelopment agency to draw
impressive commercial business and industry to the area. In the early 1990s, Carson successfully
beat out Gardena and the Harbor Gateway area of Los Angeles in landing Ikea as another anchor
to the Carson Mall (Schoch 1991, Metro 3). In the 2000s, Carson brought in Nissan and Honda
dealerships as well as several big box stores such as Staples and Home Depot (Carson
Redevelopment, n.d). During this decade, Carson was also able to entice FedEx to create a
distribution center in the city and sold office space to British Petroleum (BP) (Wotapka 2004,
C2).
As with Gardena, Carson has had concerns with contaminated property, although its
brownfield redevelopment has included a former landfill and its redevelopment agency activities
also extended to retail and affordable housing projects (Steinmann 2010). One property under
construction on a former brownfield is The Boulevards of South Bay. According to its website,
the future commercial power center will “meld residential, retail, entertainment and hospitality

23
uses” via mixed use housing, outlets, entertainment, a cinema, hotel (“The Project”, n.d.; “The
Boulevards at South Bay Project”, n.d.).
Since the purported intent of most redevelopment projects is to promote commercial
development and generate more sales tax, an analysis was done to compare sales tax per capita
revenues for both Carson and Gardena from 1990/91 through 2009/10, which are all the years
available from the RAND-California database. The results are shown as Figure 1. Interestingly,
Carson began this time period with a little over $40/capita edge in sales tax, which was within a
few dollars per capita of the difference in 2009/2010. However, Carson did have a period in the
early 2000s with higher sales tax revenues when the economy was booming. If the Boulevard’s
project is successful and other commercial properties rebound from the recession, a larger gap
between Carson and Gardena would open up again. Still, neither city can really be said to be
thriving. Given the mixed land use in both cities, Carson and Gardena at best are attempting to
maintain rather than really grow sales tax. Comparisons of property tax revenues, which are
challenging with tax increment revenues not available in a downloadable format, will be the
subject of future research.
[Insert Figure 1 about here.]
Additional Case Studies
City of Diamond Bar
The City of Diamond Bar is unusual in that there was a serious effort to establish a 1,300
redevelopment project area in the 1990s, but it was rejected by a state appellate court in 2000 in
Beach-Courchesne v. City of Diamond Bar (80 Cal. App. 4th 388). The court ruled that the
24
proposed redevelopment project included vacant property and areas that did not meet the
definition of blight (Fulton and Shigley 2005 in Steinmann 2010; Coomes et al. 2009).
Diamond Bar incorporated in 1989 as a mostly contract city, with police services
contracted back to the Los Angeles County Sheriff and other services contracted with private
firms. It has a number of residential tracts, some gated luxury home areas, and a golf course. Its
major commercial shopping centers are along Diamond Bar Blvd. that runs north to south.
Although located mostly south of the 60 freeway and just east of the 57 freeway leading into
Orange County, its commercial uses appear to be underdeveloped; the hilly topography and,
ironically, the easy access to high-end stores in Brea to the south seem to have drawn residents to
shop elsewhere. Still, Diamond Bar’s streamlined governmental structure allowed its
government to purchase a building for its city hall in the midst of the Great Recession, taking
advantage of the fall in real estate values. The City also was able to lease a portion of the new
city hall building back to Los Angeles County for a $1 per year for an expanded public library.
City of Chino Hills
The City of Chino Hills incorporated in 1991, with voters rejecting options to be joined
with the City of Chino to its east or to remain as an unincorporated area. Prior to incorporation,
Chino Hills had experienced rapid residential development and had established large lighting and
landscaping districts to provide funding for parks and parkway landscaping. A county-led
community services district oversaw operations, with several county staff transitioning to
become city employees after incorporation. Chino Hills’ first city manager, Robert Van Nort,
had served in similar capacities for Diamond Bar and Big Bear Lake when they first
incorporated. After an initial contract expired, the City hired a new city manager, Doug LeBelle,

25
with community development experience. LeBelle served a long tenure as city manager and was
instrumental in crafting several innovative development projects. The capstone of his career was
completing a public-private land swap that made possible the opening of a successful shopping
center and civic center complex in the midst of the Great Recession. Chino Hills now has, by
far, the highest income levels in San Bernardino County and has remained its safest city.
As with Diamond Bar, Chino Hills’ leaders had attempted to form a redevelopment
agency. The details are unclear, but the first mayor of Chino Hills (still serving on the city
council in 2012) said that there were two failed attempts in the years immediately following
incorporation to craft a redevelopment plan that would qualify under state law. In hindsight,
Chino Hills’ leaders were thankful that they had not been able to establish a redevelopment
agency. While careful planning and cultivation of developers were cited, especially in beating
out the City of Pomona for a Costco, it still appears that Chino Hills would have been an
attractive location for development with or without the presence of an RDA (Tasci 2012). It is
located right at the boundaries of Los Angeles, Orange, Riverside, and San Bernardino Counties;
it had just enough vacant, flat land to attract retailers; and its hillside homes attracted higher-
income residents.
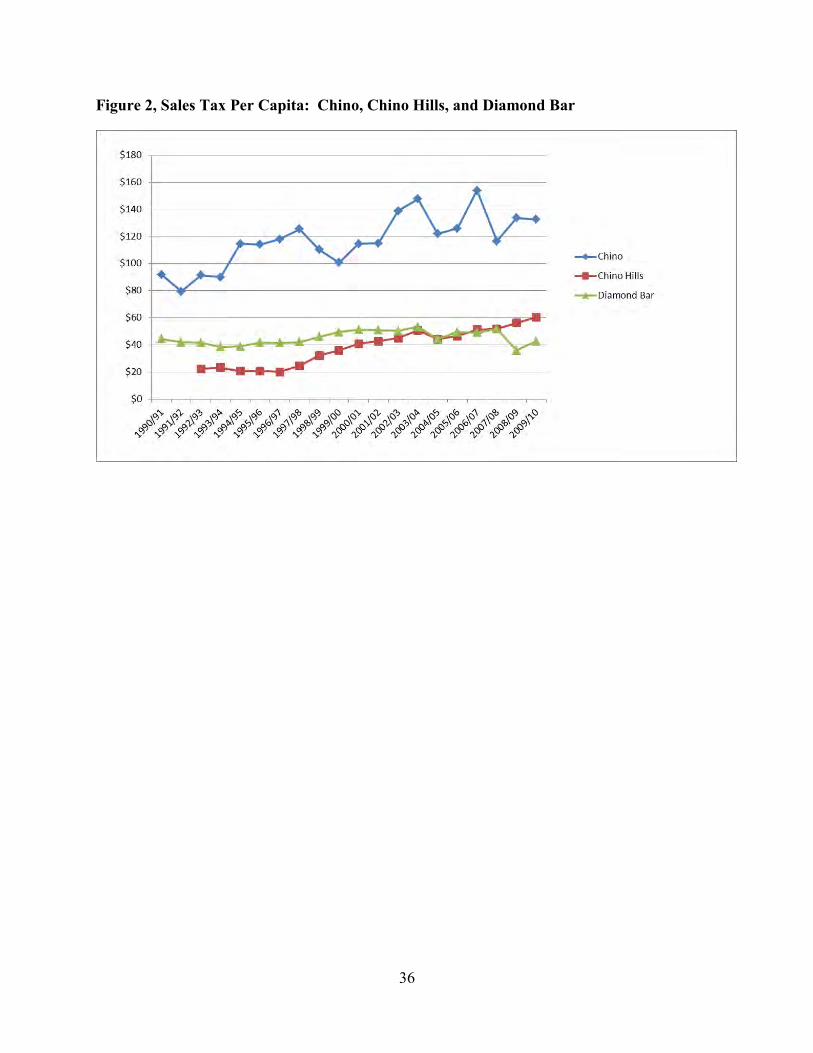
Chino, Chino Hills, and Diamond Bar Comparisons
As shown in Figure 2, the City of Chino has long had an advantage in sales tax per capita
revenues. It began commercial development along the 71 Freeway bordering Chino and Chino
Hills ahead of the City of Chino Hills. It also had the advantage of considerably more vacant
land next to the 71 Freeway and commercial areas near the cities of Montclair and Ontario to its
26
north and east respectively. Chino’s sales tax revenue increased over time, but with a lot of
volatility.
Chino Hills’ sales tax revenues show steady growth and tripling from $20 per capita in
the first full year after incorporation to $60 per capita less than twenty years later. It still has
only about half the sales tax revenue of Chino, but both cities appear to have increased
commercial businesses in pace with population growth. Diamond Bar, especially when adjusting
for inflation, has had stagnant sales tax and a drop with the onset of the Great Recession. It now
has fallen behind Chino Hills with only $40 per capita in sales tax revenues. Property tax
comparisons will be more complicated than with Carson and Gardena, because of the existence
of property tax supported Community Services Districts that predated incorporation for Chino
Hills and Diamond Bar.
[Insert Figure 2 about here.]
Conclusion
This exploratory research highlights that decisions on whether to pursue tax increment
financing can be constrained by legal restrictions, but may also reflect local circumstances.
Addition research is recommended to identify the reasons and circumstances behind other cities’
decisions not to pursue the establishment of redevelopment agencies. All three of the cities
profiled in this paper, to varying degrees, actually did pursue the establishment of
redevelopment. Gardena’s first failed effort at redevelopment set the script for future failures.
Chino Hills and Diamond Bar’s experiences were more a product of state restrictions, but it
could be argued that Diamond Bar might have been able to craft a more workable redevelopment
plan than the one that was rejected in the courts.
27
The comparative case study approach also holds promise as a way of evaluating the
relative winners and losers among California cities during the several decades when
redevelopment was aggressively used both as an economic development and revenue generating
tool. This research may not be able to isolate whether the use of tax increment financing was
responsible for economic growth in comparison cities, but can generate findings about the
relative success or failure of cities to generate revenues in the post Proposition 13 era.
28
References
Bartels, Christopher E. and Jeremy L. Hall. 2012. “Exploring Management Practice Variation in Tax Increment Financing Districts: Toward an Administrative Theory of Performance.” Economic Development Quarterly 26(1): 13-33.
Becerra, Hector. “Novel Plan to Help City Backfires.” The Los Angeles Times. February 21, 2005.
“The Boulevards at South Bay”. The Project. http://www.boulevardsatsouthbay.com/project/the-project.aspx
Briffault, Richard. 2010. "The Most Popular Tool: Tax Increment Financing and the Political Economy of Local Government." The University Of Chicago Law Review 77 (1): 65-95.
Byrne, Paul F. 2010. “Does Tax Increment Financing Deliver on Its Promise of Jobs? The Impact of Tax Increment Financing on Municipal Employment Growth.” Economic Development Quarterly 24(1): 13-22.
California Department of Finance. 2012 (revised). 1850-2010 Historical US Census Populations of Counties and Incorporated Cities/Towns in California. www.dof.ca.gov/research/demographic/state_census_data_center/historical_census_1850-2010/view.php
California Department of Finance. 2012. E-1: City/County Population Estimates with Annual Percent Change, January 1, 2011 and 2012. www.dof.ca.gov/research/demographic/reports/estimates/e-1/view.php
California State Controller. 2012. Community Redevelopment Agencies Annual Report, Fiscal Year Ending June 30, 2011. Sacramento, CA: California State Controller, www.sco.ca.gov.
California State Controller. 2011. Selected Redevelopment Agencies, Review Report, Analysis of Administrative, Financial, and Reporting Practices, July 1, 2009 through June 30, 2010. Sacramento, CA: State Controller’s Office, Division of Audits, www.sco.ca.gov.
Carroll, Deborah A. 2008. “Tax Increment Financing and Property Value: An Examination of Business Property Using Panel Data.” Urban Affairs Review 43 (4): 520-522.
Chapman, Jeffrey I., and Evgenia Gorina. 2012. "Municipal Fiscal Stress and the use of Tax Increment Financing (TIF).” The Town Planning Review 83 (2): 195-203.
“Citizens Group to Find Solutions.” The Los Angeles Times. January 16, 1975.
29
City of Carson. The Boulevards at South Bay Project. http://ci.carson.ca.us/content/department/eco_dev_service/marketplace.asp
City of Carson. History of Carson. http://ci.carson.ca.us/content/department /about_carson/growing_pains.asp
City of Carson. Carson Redevelopment Success Stories. http://ci.carson.ca.us/content/department/eco_dev_service/redev_success_stories.asp
City of Gardena. 2005. Land Use Plan. Gardena General Plan 2006. Retrieved from: http://www.ci.gardena.ca.us/generalplan.html City of Gardena. Gardena General Plan 2006.
http://www.ci.gardena.ca.us/generalplan.html City of Gardena. City of Gardena Adopted Budget Fiscal Year 2012-2013 – 2013 2014. http://www.ci.gardena.ca.us/Departments/AdministrativeServices/budget.html City of Gardena. City of Gardena Adopted Budget Fiscal Year 2011-2012.
http://www.ci.gardena.ca.us/Departments/AdministrativeServices/budget.html City of Gardena. City of Gardena Adopted Budget Fiscal Year 2009-2010.
http://www.ci.gardena.ca.us/Departments/AdministrativeServices/budget.html City of Gardena Department of Community Development. Brownfields Program.
http://www.gardenaecondev.com/?p=7 City of Gardena Department of Community Development. Brownfields Program News.
http://www.gardenaecondev.com/wp-content/uploads/2010/01/iv.pdf
City of Laguna Woods. 2013. History of Laguna Woods. Available at www.lagunawoodscity.org
Coomes, Jr., Joseph E., Iris E. Yang, T. Brent Hawkins, Gerald J. Ramiza, and Ethan Walsh. 2009. Redevelopment in California, Fourth Edition. Point Arena, CA: Solano Press.
“Council Will Resolve Redevelopment Issue.” The Los Angeles Times. November 7,1974.
Council of Development Finance Agencies. 2009. Advanced Tax Increment Finance Reference Guide. Cleveland, OH: Council of Development Finance Agencies.
Council of Development Finance Agencies and International Council of Shopping Centers. 2007. Tax Increment Finance Best Practices Reference Guide. Cleveland, OH: Council of Development Finance Agencies.
30
Dardia, Michael. 1998. Subsidizing Redevelopment in California. San Francisco, CA: Public Policy of California.
Farris, Sherri, and John Horbas. 2009. "Creation vs. Capture: Evaluating the True Costs of Tax Increment Financing." Journal Of Property Tax Assessment & Administration 6 (4): 5-28.
“Gardena Council to Hold Series of Talks on $8.1 Million Budget.” The Los Angeles Times. June 20, 1974. Gardena Heritage Committee. Images of America: Gardena. Charleston: Arcadia Publishing
Company, 2006. Issacs, Tracy Jai. “Redevelopment agency studied.” The Daily Breeze. September 8, 2003.
http://www.dailybreeze.com/news/ci_19898887 Kerth, Rob and Phineas Baxandall. 2011. Tax-Increment Financing: The Need for Increased
Transparency and Accountability in Local Economic Development Subsidies. Arizona PIRG Education Fund, www.arizonapirg.org.
Koven, Steven G. and Thomas S. Lyons. 2010. Economic Development: Strategies for State and Local Practice, Second Edition. Washington, DC: International City/County Management Association.
Lee, Mary Ann. “Hearing Delayed: Gardena Factions Polarized Over Plan For Renewal.” The Los Angeles Times. October 20, 1974.
Lee, Mary Ann. “Petitions Against Redevelopment Will Be Gauged.” The Los Angeles Times.
December 12, 1974. Lefcoe, George. 2011. "Competing for the Next Hundred Million Americans: The Uses and
Abuses of Tax Increment Financing." Urban Lawyer 43 (2): 427-482.
“MBK Homes.” 1600 at Artesia Square. http://www.mbkhomes.com/home_finder/neighborhood/?neigh_id=1042&utm_source=CurbedLA&utm_medium=Listing&utm_campaign=GO
Merriman, David F., Mark L. Skidmore, and Russ D. Kashian. 2011. "Do Tax Increment Finance Districts Stimulate Growth in Real Estate Values?" Real Estate Economics 39 (2): 221-250.
Multari, Michale, Michael Coleman, Kenneth Hampian, and Bill Statler. 2012. Guide to Local Government Finance in California. Point Arena, CA: Solano Press.
“New Panel Joins Fight to Retain Renewal Unit.” The Los Angeles Times. October 13, 1977.
“No GRAB”. No on G. http://www.nograb.org/index.htm

31
“Normandie Casino.” Community / History http://www.normandiecasino.com/communtiyandhistory.htm
North-Hager, Eddie. “No Headline.” The Daily Breeze. October 31, 2004. http://nl.newsbank.com/nojavascript.html
O’Malley, Marianne. 2012. The 2012-13 Budget: Unwinding Redevelopment. Sacramento, CA: Legislative Analyst’s Office, www.lao.ca.gov.
Schoch, Deborah. “Furniture Giant Ikea Considers Three South Bay Sites.” The Los Angeles Times. January 11, 1991. Sharp, Elaine B. 2012. Does Local Government Matter? How Urban Politics Shape Civic
Engagement. Minneapolis: University of Minnesota Press. Southern California Association of Governments. 2013. Local Profiles. www.scag.ca.gov Steinmann, Frederick. 2010. The Twilight of the Local Redevelopment Era: The Past, Present,
and Future of Urban Revitalization and Urban Economic Development in Nevada and California. Doctoral Dissertation, University of Southern California.
Stokey, Edith and Richard Aeckhauser. 1978. A Primer for Policy Analysis. New York: W.W. Norton.
Tasci, Canon. 2012, Feb 22. “One City’s Success Story: Chino Hills Thrived without Aid of RDA.” Inland Valley Daily Bulletin, A1
United States Census Bureau 2013. State and County Quick Facts. http://quickfacts.census.gov/qfd/states/06000.html
USC Center for Economic Development. City of Gardena General Plan 2020 Draft Technical Background Report. http://cdm15025.contentdm.oclc.org/cdm/singleitem/collection/p266301ccp2/id/491/rec/1284
Weber, Rachel. 2013. “Tax Increment Financing in Theory and Practice.” In Financing
Economic Development in the 21st Century, Second Edition, edited by Sammis B. White and Zenia Z. Kotval, 283-301. Armonk, NY: M.E. Sharpe.
Weber, Rachel, Rebecca Hendrick, and Jeremy Thompson. 2008. “The Effect of Tax Increment Financing on School District Revenues: Regional Variation and Interjurisdictional Competition.” State and Local Government Review 40 (1): 27-41.
Weber, Rachel, Saurav Dev Bhatta, and David Merriman. 2007. “Spillovers from tax increment financing districts: Implications for housing price appreciation,” Regional Science and Urban Economics, 37 (2): 259-281.

32
Weimer, David L. and Aidan R. Vining. 2005. Policy Analysis: Concepts and Practice, Fourth
Edition. Upper Saddle River, NJ: Pearson/Prentice Hall.
Willis, Teresa Ann. “Gardena Puts Insurance Matters Into Own Hands.” The Los Angeles Times. October 24, 1993.
Wolinsky, Leo C. “Once-Victorious Opponents of Renewal Consider Fighting Latest
Gardena Plans.” June 23, 1977. Wolinky, Leo C. “Renewal Rears Its Head Again in Gardena.” The Los Angeles Times.
May 15, 1977. Wotapka, Dawn. “FedEx Chooses Carson for New Distribution Center.” The Los
Angeles Times. July 9, 2004.
33
Table 1, Chronology of Redevelopment in California
Year Item 1945 Community Redevelopment Act, allowed projects but no funding. 1952 Community Redevelopment Act/Proposition 18 codified in Health & Safety
Code, tax increment financing added to meet federal matching fund requirements.
1976 Assembly Bill (AB) 3674 added 20% set-aside for affordable housing 1978 Proposition 13 approved by voters; rolls back property assessments to 1975/76;
limits property tax to 1% of value and sets maximum annual increase to 2% if property is not sold; requires supermajority vote for special taxes.
1979 Assembly Bill (AB) 8 reallocated property tax revenues. 1983 AB 322 enacted restrictions on use of “bare land” for redevelopment and review
of new project areas. 1988 Proposition 98 established minimum education funding levels. 1992/93, 1993/94
Education Revenue Augmentation Fund (ERAF) temporarily took away about 25% of property tax increment from redevelopment agencies. Part of AB 8 was modified and partially replaced with sales tax revenues dedicated to public safety.
1993 AB 1290 enacted major redevelopment reforms, included more restrictions on blight, project area time limits, and requirements for some pass-through of property tax increment back to schools and counties;
2006 Senate Bills 1206 and 53 limited allowable eminent domain and tightened definition of blight; supported by local governments to counter eminent domain critics.
2009-11 Supplemental Education Revenue Augmentation Fund (SERAF) legislation attempted to take away property tax increment to fund education; became mired in litigation
2010 Proposition 22 passed by voters, which was supposed to prohibit takeaways of redevelopment funds.
2011 ABx1 26 and ABx1 27 required abolishment of redevelopment agencies, but allowed them to be reestablished with pay-to-play payments
2012 California Supreme Court upheld abolishment of redevelopment agencies and voided pay-to-play option.
2013 AB 1484 allowed some repayment of loans made to redevelopment agencies from cities and allowed some additional expenses from bonds to complete projects.
2012-16 Local governments can have individual successor agencies with multi-jurisdictional oversight boards; in 2016 transitions to one per county.
Source: compiled by authors; also O’Malley 2012.
34
Table 2, Southern California Cities without Redevelopment
City
Incorporation Year Population (2012)
Median Household Income (2007)
Los Angeles County Avalon* 1913 3,780 58,750** Beverly Hills 1914 34,291 $85,560 Bradbury 1957 1,065 $101,282** Calabasas 1991 23,683 $118,182 Diamond Bar* 1989 55,819 $90,153 El Segundo 1917 16,720 $88,486 Gardena 1930 59,124 $46,961 Hermosa Beach 1907 19,574 $102,289 Hidden Hills 1961 1,869 $281,250** La Canada Flintridge* 1976 20,335 $148,214 La Habra Heights 1978 5,352 $127,750 Lomita* 1964 20,396 $61,327 Malibu 1991 12,699 $132,926 Manhattan Beach 1912 35,239 $132,752 Palos Verdes Estates 1939 13,516 $159,038 Rolling Hills 1957 1,875 $307,442** Rolling Hills Estates 1957 8,097 $151,757 San Marino 1913 13,195 $154,318 Westlake Village 1981 8,300 $113,852 Orange County Aliso Viejo 2001 48,988 $99,095 Dana Point 1989 33,667 $83,306 Laguna Beach 1927 22,966 $99,190 Laguna Hills 1991 30,618 $85,971 Laguna Niguel 1989 63,691 $100,480 Laguna Woods 1999 16,334 $35,393 Los Alamitos 1960 11,557 $79,861 Newport Beach 1906 85,990 $108,946 Rancho Santa Margarita 2000 48,278 $104,167 Villa Park 1962 5,867 $151,139 Riverside Canyon Lake* 1990 10,689 $80,145 Eastvale 2010 55,602 $115,025 Jurupa Valley 2011 96,456 N/A Menifee 2008 80,589 $54,068 Wildomar 2008 32,719 $113,852 San Bernardino Chino Hills* 1991 75,655 $101,905 Sources: California State Controller, California Department of Finance; U.S. Census Bureau, Southern California Association of Governments.
* indicates that city or previously unincorporated area once had a redevelopment agency, but as of Fiscal Year 2009/10 was inactive.
**2010 income, five year averages not provided by U.S. Census Bureau.

35
Table 3, Comparison Cities Analysis
Carson Gardena Hawthorne Incorporation 1969 1930 1922 RDA Established 1971 n/a 1968 Land Area (sq. mi.) 18.72 5.83 6.08 Population
White Black Native American Asian Hawaiian/Pac Isl. Latino
92,376 23.8% 23.8% 0.6% 25.6% 2.6% 38.6%
59,253 24.6% 24.4% 0.6% 26.2% 0.7% 37.7%
84,905 32.8% 27.7% 0.7% 6.7% 1.2% 52.9%
Education % HS Grad+ % BA/BS+
79.7% 25.4%
81.3% 22.8%
73.9% 16.2%
Persons below poverty level 7.8% 15.5% 17.2% Median Income $70,416 $46,961 $45,622 FBI Crime Index (2009) 2,894.8 3,127.9 2,796.2 Sales Tax Revenue (2009) $14,030,967 $6,559,597 $7,641,610 Property Tax Revenue, non-RDA (2009) $7,284,746 $5,616,257 $4,329,179
Source: http://quickfacts.census.gov/qfd/states/06/0628168.html
Figure 1, Sales Tax Per Capita: Carson and Gardena
$0
$50
$100
$150
$200
$250
Carson
Gardena
36
Figure 2, Sales Tax Per Capita: Chino, Chino Hills, and Diamond Bar
37
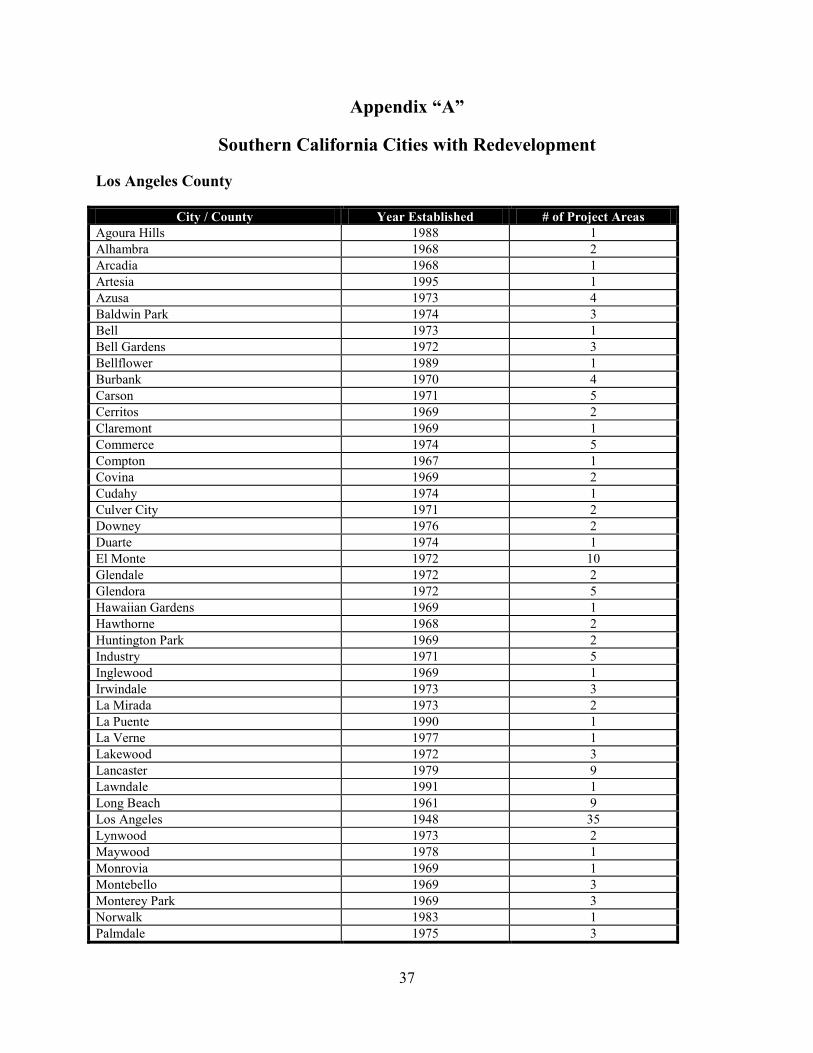
Appendix “A”
Southern California Cities with Redevelopment
Los Angeles County
City / County Year Established # of Project Areas Agoura Hills 1988 1 Alhambra 1968 2 Arcadia 1968 1 Artesia 1995 1 Azusa 1973 4 Baldwin Park 1974 3 Bell 1973 1 Bell Gardens 1972 3 Bellflower 1989 1 Burbank 1970 4 Carson 1971 5 Cerritos 1969 2 Claremont 1969 1 Commerce 1974 5 Compton 1967 1 Covina 1969 2 Cudahy 1974 1 Culver City 1971 2 Downey 1976 2 Duarte 1974 1 El Monte 1972 10 Glendale 1972 2 Glendora 1972 5 Hawaiian Gardens 1969 1 Hawthorne 1968 2 Huntington Park 1969 2 Industry 1971 5 Inglewood 1969 1 Irwindale 1973 3 La Mirada 1973 2 La Puente 1990 1 La Verne 1977 1 Lakewood 1972 3 Lancaster 1979 9 Lawndale 1991 1 Long Beach 1961 9 Los Angeles 1948 35 Lynwood 1973 2 Maywood 1978 1 Monrovia 1969 1 Montebello 1969 3 Monterey Park 1969 3 Norwalk 1983 1 Palmdale 1975 3
38
Paramount 1973 4 Pasadena 1959 9 Pico Rivera 1974 1 Pomona 1966 2 Rancho Palos Verdes 1984 1 Redondo Beach 1962 4 Rosemead 1972 2 San Dimas 1972 2 San Fernando 1965 5 San Gabriel 1991 1 Santa Clarita 1989 1 Santa Fe Springs 1961 2 Santa Monica 1957 3 Sierra Madre 1973 1 Signal Hill 1974 1 South El Monte 1974 1 South Gate 1973 1 South Pasadena 1953 1 Temple City 1972 1 Torrance 1964 4 Vernon 1986 1 Walnut 1979 1 West Covina 1971 2 West Hollywood 1996 1 Whittier 1971 5 Los Angeles County 1969 6
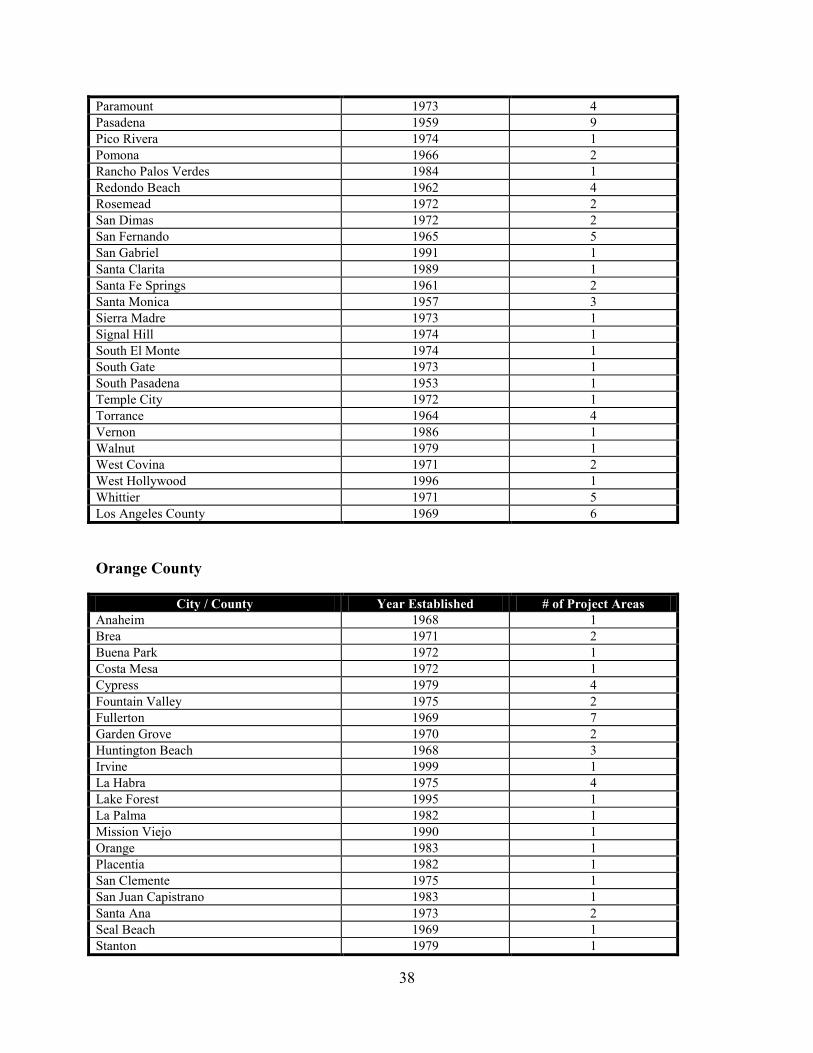
Orange County
City / County Year Established # of Project Areas Anaheim 1968 1 Brea 1971 2 Buena Park 1972 1 Costa Mesa 1972 1 Cypress 1979 4 Fountain Valley 1975 2 Fullerton 1969 7 Garden Grove 1970 2 Huntington Beach 1968 3 Irvine 1999 1 La Habra 1975 4 Lake Forest 1995 1 La Palma 1982 1 Mission Viejo 1990 1 Orange 1983 1 Placentia 1982 1 San Clemente 1975 1 San Juan Capistrano 1983 1 Santa Ana 1973 2 Seal Beach 1969 1 Stanton 1979 1

39
Tustin 1976 3 Westminster 1982 1 Yorba Linda 1983 1 Orange County 1982 3
Riverside County
City / County Year Established # of Project Areas Banning 1973 2 Beaumont 1992 1 Blythe 1984 1 Calimesa 1992 3 Cathedral City 1982 1 Coachella 1981 4 Corona 1964 6 Desert Hot Springs 1982 1 Hemet 1982 3 Indian Wells 1982 1 Indio 1981 1 Lake Elsinore 1980 5 La Quinta 1983 2 March Joint Powers 1996 1 Moreno Valley 1986 1 Murrieta 1992 1 Norco 1981 1 Palm Desert 1975 6 Palm Springs 1972 3 Perris 1966 3 Rancho Mirage 1979 3 Riverside 1967 9 San Jacinto 1983 2 Temecula 1991 1 Riverside County 1984 5
San Bernardino County
City / County Year Established # of Project Areas Adelanto 1979 2 Apple Valley 1993 1 Barstow 1973 2 Big Bear Lake 1982 3 Chino 1972 1 Colton 1962 10 Fontana 1968 6 Grand Terrace 1979 1 Hesperia 1988 2 Highland 1990 1 Inland Valley Dev’t Agency 1990 1 Loma Linda 1979 2
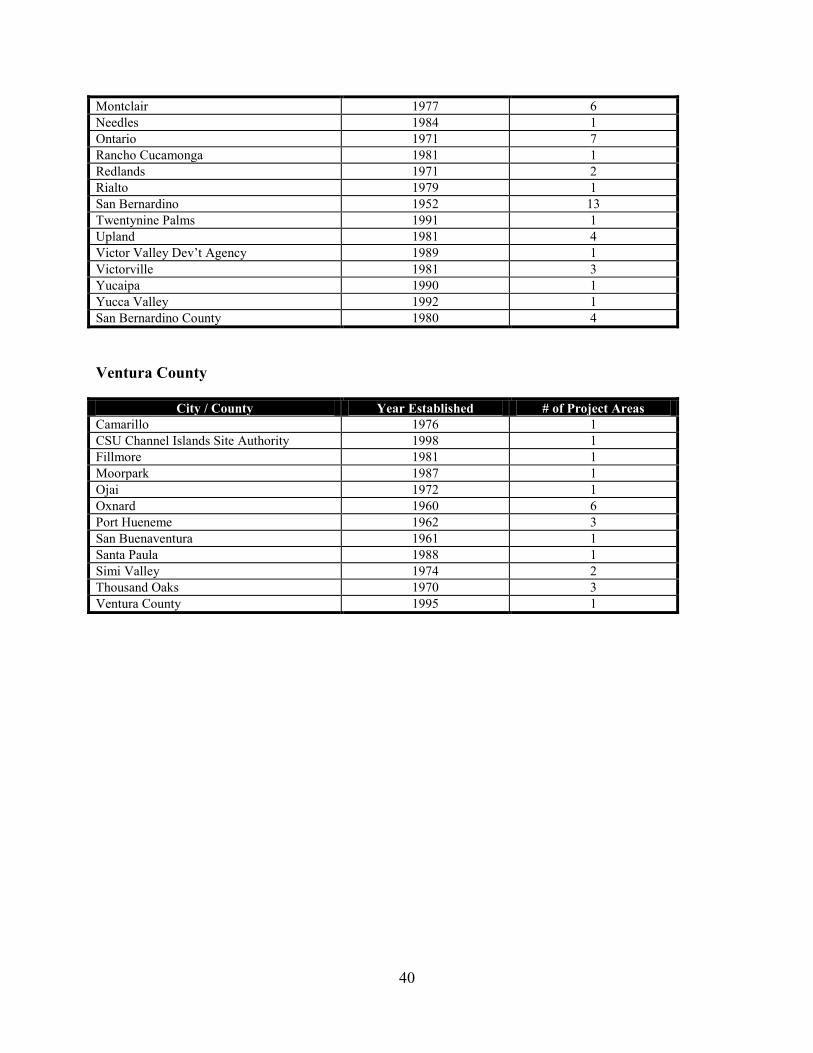
40
Montclair 1977 6 Needles 1984 1 Ontario 1971 7 Rancho Cucamonga 1981 1 Redlands 1971 2 Rialto 1979 1 San Bernardino 1952 13 Twentynine Palms 1991 1 Upland 1981 4 Victor Valley Dev’t Agency 1989 1 Victorville 1981 3 Yucaipa 1990 1 Yucca Valley 1992 1 San Bernardino County 1980 4
Ventura County
City / County Year Established # of Project Areas Camarillo 1976 1 CSU Channel Islands Site Authority 1998 1 Fillmore 1981 1 Moorpark 1987 1 Ojai 1972 1 Oxnard 1960 6 Port Hueneme 1962 3 San Buenaventura 1961 1 Santa Paula 1988 1 Simi Valley 1974 2 Thousand Oaks 1970 3 Ventura County 1995 1