cities, energy and mobility - core.ac.uk · nicola morelli, aalborg university, denmark enrica...
TRANSCRIPT


TeMA Journal of Land Use Mobility and Environment 3 (2015)
CITIES, ENERGY AND MOBILITY
3 (2015)
Published by Laboratory of Land Use Mobility and Environment DICEA - Department of Civil, Architectural and Environmental Engineering University of Naples "Federico II"
TeMA is realized by CAB - Center for Libraries at “Federico II” University of Naples using Open Journal System
Editor-in-chief: Rocco Papa print ISSN 1970-9889 | on line ISSN 1970-9870 Lycence: Cancelleria del Tribunale di Napoli, n° 6 of 29/01/2008
Editorial correspondence Laboratory of Land Use Mobility and Environment DICEA - Department of Civil, Architectural and Environmental Engineering University of Naples "Federico II" Piazzale Tecchio, 80 80125 Naples web: www.tema.unina.it e-mail: [email protected]
Cover image is from https://www.pexels.com/photo/london-telephone-booth-long-exposure-lights-6618/
TeMA Journal of Land Use, Mobility and Environment

TeMA Journal of Land Use Mobility and Environment 3 (2015)
TeMA. Journal of Land Use, Mobility and Environment offers researches, applications and contributions with a unified approach to planning and mobility and publishes original inter-disciplinary papers on the interaction of transport, land use and environment. Domains include: engineering, planning, modeling, behavior, economics, geography, regional science, sociology, architecture and design, network science and complex systems.
The Italian National Agency for the Evaluation of Universities and Research Institutes (ANVUR) classified TeMA as scientific journal in the Area 08. TeMA has also received the Sparc Europe Seal for Open Access Journals released by Scholarly Publishing and Academic Resources Coalition (SPARC Europe) and the Directory of Open Access Journals (DOAJ). TeMA is published under a Creative Commons Attribution 3.0 License and is blind peer reviewed at least by two referees selected among high-profile scientists. TeMA has been published since 2007 and is indexed in the main bibliographical databases and it is present in the catalogues of hundreds of academic and research libraries worldwide.
EDITOR IN-CHIEF
Rocco Papa, University of Naples Federico II, Italy
EDITORIAL ADVISORY BOARD
Mir Ali, University of Illinois, USA Luca Bertolini, University of Amsterdam, Netherlands Luuk Boelens, Ghent University, Belgium Dino Borri, Polytechnic University of Bari, Italy Enrique Calderon, Polytechnic University of Madrid, Spain Roberto Camagni, Polytechnic University of Milan, Italy Derrick De Kerckhove, University of Toronto, Canada Mark Deakin, Edinburgh Napier University, Scotland Aharon Kellerman, University of Haifa, Israel Nicos Komninos, Aristotle University of Thessaloniki, Greece David Matthew Levinson, University of Minnesota, USA Paolo Malanima, Magna Græcia University of Catanzaro, Italy Agostino Nuzzolo, Tor Vergata University of Rome, Italy Rocco Papa, University of Naples Federico II, Italy Serge Salat, Urban Morphology and Complex Systems Institute, France Mattheos Santamouris, National Kapodistrian University of Athens, Greece Ali Soltani, Shiraz University, Iran
ASSOCIATE EDITORS
Rosaria Battarra, National Research Council Institute of Studies on Mediterranean Societies, Italy Luigi dell'Olio, University of Cantabria, Spain Romano Fistola, University of Sannio, Italy Adriana Galderisi, University of Naples Federico II, Italy Carmela Gargiulo, University of Naples Federico II, Italy Thomas Hartmann, Utrecht University, Netherlands Markus Hesse, University of Luxemburg, Luxemburg Seda Kundak, Technical University of Istanbul, Turkey Rosa Anna La Rocca, University of Naples Federico II, Italy Houshmand Ebrahimpour Masoumi, Technical University of Berlin, Germany Giuseppe Mazzeo, National Research Council Institute of Studies on Mediterranean Societies, Italy Nicola Morelli, Aalborg University, Denmark Enrica Papa, University of Westminster, United Kingdom Dorina Pojani, University of Queensland, Australia Floriana Zucaro, University of Naples Federico II, Italy
EDITORIAL STAFF
Gennaro Angiello, PhD student at University of Naples Federico II, Italy Gerardo Carpentieri, PhD student at University of Naples Federico II, Italy Raffaella Niglio, PhD student at University of Naples Federico II, Italy Stefano Franco, PhD student at Luiss University Rome, Italy Laura Russo, PhD student at University of Naples Federico II, Italy Andrea Tulisi, PhD at University of Naples Federico II, Italy
TeMA Journal of Land Use Mobility and Environment 3 (2015)
TeMA Journal of Land Use, Mobility and Environment
CITIES, ENERGY AND MOBILITY 3 (2015)
Contents
261
EDITORIAL PREFACERocco Papa
FOCUS
263 A Markov Chain Model of Land Use ChangeMichael Iacono, David Levinson, Ahmed El-Geneidy, Rania Wasfi
277 A Tool for Appraising Mobility Environment with a Perfect Based Index MeasureAbdulMajeed Olaremi Shittu, Muhammad Zaly Shah
293 A Land-Use Approach for Capturing Future Trip Generating PolesIraklis Stamos, Aifadopoulou Georgia, Evangelos Mitsakis, Maria Morfoulaki, Iasonas Tamiakis
311 Tourism and Mobility.Best Practices and Conditions to Improve Urban Liveability Rosa Anna La Rocca
LAND USE, MOBILITY AND ENVIRONMENT
331 Council Tax Policies and Territorial Governance:Analysis and Outlook of a Difficult Relationship Simone Rusci

TeMA Journal of Land Use Mobility and Environment 3 (2015)
347 REVIEW PAGES Gennaro Angiello, Gerardo Carpentieri, Raffaella Niglio, Laura Russo, Andrea Tulisi

TeMA Journal of Land Use, Mobility and Environment
TeMA 3 (2015) 277-292 print ISSN 1970-9889, e- ISSN 1970-9870 DOI: 10.6092/1970-9870/2948
review paper received 8 March 2015, accepted 19 October 2015 Licensed under the Creative Commons Attribution – Non Commercial License 3.0 www.tema.unina.it
How to cite item in APA format: Shittu A., A. O., Shah, M. Z. (2015). A tool for appraising mobility environment with a perfect based index measure. Tema. Journal of Land Use, Mobility and Environment, 8 (3), 277-292. doi: http://dx.doi.org/10.6092/1970-9870/2948
A TOOL FOR APPRAISING MOBILITY ENVIRONMENT WITH
A PERFECT BASED INDEX MEASURE
ABDULMAJEED OLAREMI SHITTUa, MUHAMMAD ZALY SHAHb
a,bUniversity Teknologi Malaysia ae-mail: [email protected]
be-mail: [email protected]
ABSTRACT
Diverse methods, approaches and models have been employed in explaining mobility in both the urban and human context. However, there has been the ever-present drawback premised on data unavailability, “dyrtiness” or scantiness. More so, the techniques and parameters used, does not provide clues about mobility complexities engendered by attributes of “mobility environments”, as a result, determinants of mobility complexities are hardly fully described. To narrow the gap, it is conjectured that systematic evaluation of traveler perception of “mobility environments”, may provide hints about the degree to which specified spatial units enhance or hinder mobility, by rating such environment with a perception based index construct we hope will help improve assessments of “mobility environments”. This need is underscored by the necessity to explore alternative decision support tools, for mobility evaluations, especially where it may be implausible to apply advanced, high end, data hungry models of mobility evaluation. The method involved a two-pronged survey of transport professionals and randomly selected travelers. The professionals helped with “mobility environment” attributes identification and selection of contextually relevant ones from a list of potential attributes of influence, extracted from relevant literature using the Delphi method. Randomly selected travelers were in turn presented with the short listed attributes for rating on a five point Likert scale. Ratings were then used to determine attribute rankings and their commensurate index equivalents, as a basis for classification. Travelers indicated that a high activity mix, high road and pedestrian network density are good mobility enhancing qualities a city should possess. However, aggregate indexing indicated that enhancing development characteristics, mode characteristics, travel and economic attributes, are the most important for the study area. The measures are targeted at facilitating development of cost effective and parsimonious means of identifying urban mobility challenges by local authorities, to provide a strategic pathway for a city’s “mobility environments” qualities to be identified and objectively appraised, in order to satisfactorily target interventions at improving both the “mobility environment” and the quality of life of city inhabitants.
KEYWORDS: mobility appraisal, mobility environment, index measure, mobility influencers, mobility complexities, traveler perception

A. O. Shittu, A, M. Z. Shah - A Tool for Appraising Mobility Environment with a Perfect Based Index Measure
278 - TeMA Journal of Land Use Mobility and Environment 3 (2015)
TeMA 3 (2015) 277-292 print ISSN 1970-9889, e- ISSN 1970-9870 DOI: 10.6092/1970-9870/2948
review paper received 8 March 2015, accepted 19 October 2015 Licensed under the Creative Commons Attribution – Non Commercial License 3.0 www.tema.unina.it
How to cite item in APA format: Shittu A., A. O., Shah, M. Z. (2015). A tool for appraising mobility environment with a perfect based index measure. Tema. Journal of Land Use, Mobility and Environment, 8 (3), 277-292. doi: http://dx.doi.org/10.6092/1970-9870/2948
TeMA 有关土地使用、交通和环境的杂志
用基于认知的衡量指标来评
估移动环境的一种工具
ABDULMAJEED OLAREMI SHITTUa, MUHAMMAD ZALY SHAHb
a,bUniversity Teknologi Malaysia ae-mail: [email protected]
be-mail: [email protected]
ABSTRACT
且,所用的技 和参数并未提供关于由术 “移 境动环 ”
和 特经济 性才是最重要的。 些衡量指 的目的是这 标 推 开 出具有成本效益和 的方法动 发 节俭 ,来 出识别 地方当局面 的城市移 性挑临 动 战, 要被 和客为 识别 估的城市观评 “移 境动环 ”品 提供一个 略路径质 战 ,
KEYWORDS:
移动性评估,移动环境,衡量指标,移动影响,
移动复杂性,旅行者认知

A. O. Shittu, A, M. Z. Shah - A Tool for Appraising Mobility Environment with a Perfect Based Index Measure
279 - TeMA Journal of Land Use Mobility and Environment 3 (2015)
1 INTRODUCTION
Mobility as a phenomenon have been widely studied, its connotations in transportation, accessibility and
general human wellbeing have been explored to varying degrees, as exemplified in the works of Patla and
Shumway – Cook, (1999), WBCSD, (2004), Oluseyi, (2006), Asiyanbola, (2007), Lotfi and Kooshari, (2009),
and Hjorthol et al., (2010). To this end, diverse methods, approaches and models have been employed in
explaining mobility in both the urban and human context. However, there has been the ever present
drawback premised on data unavailability, “dirtyness” or scantiness. More so, the techniques and parameters
used, according to Hong, (2010) and Isaacman et al., (2011), does not provide clues about mobility
complexities facing the individual as a result of the nature of “mobility environments”, which according to
Soria – Lara et al. (2014), should be understood as a comprehensive planning concept based on the
interaction between land use and transport factors, which Hong, (2010) and Isaacman et al., (2011) stated
are critical determinant of mobility capabilities of individuals.
Therefore, to harness opportunities that may accrue from evaluating the link between “mobility
environments” and how they affect travelers’, it will be pertinent to develop other ways of gaining this
insight. Hence, it is suggested that tapping into perception of travel by the traveler, as a consequence of the
attributes of “mobility environments” from which engendered inhibitors and enhancers of mobility embedded
in such spaces can be deciphered, may be one way of achieving this. The growing interest in examining the
relationship between the physical environment and active transportation through audits and perception
studies, as attested to by Vanwolleghem, et al., (2014), underscores this thinking. Florindo et al., (2009),
also stated that, developing operational concepts of mobility are desirable towards measuring or identifying
benefits associated with individual movement. To buttress this point Bertolini and Dijst (2003) mentioned
that the quality of “mobility environments” depend on the features of each location, but also on individual
characteristics, showing that there is a relationship between environmental and individual attributes which
shapes mobility perception. Based on the foregoing, it is believed that opportunities and threats to mobility
should be inferable from examining how attributes of “mobility environments” affect perception of such
space. This line of thought is desirable because it will further deepen the understanding of how percept
based determinants of an individual or city’s mobility requirement can be identified, especially in terms of
broadening the perspective from which mobility dilemma can be evaluated, as a bases for achieving a more
effective and traveler centered mobility planning.
Furthermore, studies linking environmental factors to mobility perception or active transportation, such as
Hume, et al., (2005) which looked at association between physical environmental factors (perceived and
objectively measured), and levels of physical activity in children found a strong association between them.
Similarly, a cross‐sectional study of more than 1200 primary school children in Australia found associations
between children's walking levels and their perceptions of the local neighbourhood’s environment (Alton, et
al., 2007; Timperio, et al., 2004; Humpel, et al., 2004). Also, importance of environment to mobility disability
has been acknowledged, even though the potentially disabling features of the environment are difficult to
identify, it is apparent that there are potentially many environmental features that influence the complexity
and difficulty of mobility, embedded in “mobility environments” (Patla and Shumway – Cook, 1999). This
proves that there are salient perception influencing attributes of mobility, associated with the mobility
operating space of individuals. Therefore, perception based studies can be used to gain insight into the array
of pervasive factors that might be influencing particular cohorts. Given that, individuals with different travel
modes show differences in their perception of important factors influencing mobility Howard et al., (2001).
Thus, understanding the relationships between user perception and experiences can bolster mobility
planning and related interventions. For this reason, it is conjectured that a systematic evaluation of traveler
perception of mobility influencing attributes of “mobility environments” could provide hints about how certain
groups of people perceive them. This paper proposes a technique of appraising perception of “mobility

A. O. Shittu, A, M. Z. Shah - A Tool for Appraising Mobility Environment with a Perfect Based Index Measure
280 - TeMA Journal of Land Use Mobility and Environment 3 (2015)
environments” with an index construct, as a measure of the aggregate type of influence the “mobility
environment” is having on travelers. The work seeks to use indicators deducible from the percept of
interaction between the moving subject and the containment within which mobility takes place, to rate the
extent to which such spaces hinder or foster mobility. It further seeks to evaluate whether it will be
practicable to determine “mobility environment” induced dilemma from travelers’ perception, and also
attempt establishing an index based measure of extent of positivity or negativity of a “mobility
environment’s” effect on travelers. The technique is proposed as an alternative approach to assessing or
describing how “mobility environments” determine mobility perception of urban areas, in order to provide a
decision support platform for managing cities, thereby setting the stage for use of traveler perception
determined attributes in city planning. Since, ultimately the target of mobility planning is to remove
constraints, ease movement and foster adequate accessibility to component areas of a spatial entity, in a
manner that will accommodate motorized and non – motorized travelers, as pointed out in Asiyanbola
(2007). The paper is structured into five parts, the first part introduces the research and presents issues
from related literature, part two sets out the conceptual bases of the argument. Three contains the
description of the study area and why it was selected as the study case. The fourth section explains how
data was gathered and the method of analysis. Lastly, the fifth part presents discussion on important points,
ultimately ending with conclusions.
2 CONCEPTUAL ISSUES AND JUSTIFICATIONS
Due to the exploratory nature of this work, it is necessary to explain some key terms and underpinnings.
Despite the development of different practical applications based on “mobility environment”, as can be seen
in Bertolini (2006), Soria – Lara (2012) or Talavera et al. (2014). There are no strict guidelines on how
“mobility environment” can be defined, identified or mapped (Soria – Lara et al. 2014). However, Bertolini
and Dijst (2003), asserted that “mobility environment” is defined by the whole of the external conditions,
that may have influence on the presence of people in a given location, as defined by features of both the
transportation services available there and the activity place itself, underscored by institutional
arrangements, such as regulations. Based on this, the concept is described for the purpose of this study as
“the totality of three dimensional spaces, within which elements - upon, through, around, and with which
mobility take place - are contained, as defined by the guidelines governing the use of such spaces”, which
collectively influence how such a space is perceived”. The idea that perception of a phenomenon is shaped
by internal and external factors that could further be classified into tangible and intangible aspects, as
described by (Sokolowska, 2014) buttresses this notion. Hence, the attributes of a “mobility environment”
are thought to determine how a traveler perceives mobility in such places, so it becomes pertinent to seek
out how such an environment can be structured to elicit positive perceptions.
In another sense, “the degree to which an identified “mobility environment” hinder or foster mobility of a
group of randomly selected individuals, operating within it, is expected to be related to the attributes of such
“mobility environment”. So, it is our thought that, the degree to which a “mobility environment” foster or
hinder mobility, should be inferable from its rating in relation to an established scale, ranking or
interpretation system. This posture is justified by assertions that intangible phenomenon are measurable
through scaling, rating or indexing as exemplified by works such as Mingshun (2002), Zaly (2010), Shittu et
al. (2015). Against this backdrop, an attempt is made to use traveler’s perception of the environment within
which travel takes place as a measure of the kind of influence such an environment is having on travelers.
The fact that a collection of ideas are needed to achieve the task necessitated a multidisciplinary approach.
Most importantly, a number of principles or consensus opinions were identified from diverse literature, upon
which the foundation of this work was built, these include:
− the fact that intangible phenomenon are measurable through scaling, rating or indexing.

A. O. Shittu, A, M. Z. Shah - A Tool for Appraising Mobility Environment with a Perfect Based Index Measure
281 - TeMA Journal of Land Use Mobility and Environment 3 (2015)
− an established commitment to importance of the “person” as a fundamental unit of analysis and data
derivation (the holistic modeling posture), as a necessary requirement for bottom up solutions that
targets human behaviour related conditions;
− as an extension of (ii) above, the established need to incorporate human perception in measurements
as a crucial element in understanding human preferences and requirements, because measurements
lacking human perceptions are usually faulty.
− the prioritization of self reported factors in the analysis of mobility can more appropriately capture an
individual’s mobility complexities, thereby providing information that will be helpful in identifying
appropriate interventions;
− the inability of abstract models to capture information on nuances underlying perception, which are
important indicators of how changes to status quo are reacted to; and
− the need to promote inclusive and functional explore-ability of cities as a fundamental requirement of
social participation and inclusion.
At the operational level, “mobility environments” have been used to describe geographical units with
homogeneous mobility characteristics, based directly on the idea that mobility planning should play a central
role in urban planning (Bertolini and Dijst, 2003). It was also put forward that the concept has been used to
facilitate the adoption of particular methodologies to identify and use “mobility environments” from different
countries and planning contexts. The direction now in “mobility environment’s” study, is aimed at helping
planners root policies in the very source of mobility, and also to help identify needs and constraints of
individuals as members of different types of social organizations. The thrust is towards fully integrating
mobility and accessibility considerations into urban planning and design. In the long run, it is expected that
different kinds of “mobility environments” will emerge (Soria – Lara et al. 2014), as a bases for fashioning
out better strategies and policies for specific “mobility environments”.
3 THE STUDY AREA
Ilorin, a metropolitan area in Kwara state, north central Nigeria was selected for the study. The selection
was made because the city exhibits characteristic dualism similar to many developing country cities, as
mentioned in (Ahmed, 1996). Thus, Ilorin can be taken as a fair representation of cities in developing
countries, more so Nigeria. The city has both organic and inorganic sectors, reflecting both modern and
traditional characteristics. The city of Ilorin comprises of 20 political subdivisions known as wards. The city’s
population was estimated to be 510,444 persons for 2014. Ilorin metropolis sits on an estimated land mass
of 111.46 km2.The city has no formal public transportation system, transport services are provided by
private informal operators. Expectedly, the city also suffers from inadequate planning data base, as attested
to by (Aderamo, 2000). Ilorin, to a large extent exhibits homogeneity in terms of development density,
environmental quality, and in transport enterprises (Aderamo, 2003). Efforts to provide adequate transport
infrastructure for the city of Ilorin have been adjudged ad–hoc, uncoordinated and poor in (Aderamo, 2008).
Figure 1(a), depict Ilorin metropolis in the context of country and state within which it is located, while
Figure 1(b), illustrates its political subdivisions known as wards. The socio–economic profiles and
infrastructural status of the constituent wards of Ilorin metropolis, are largely similar. Mobility issues are not
dealt with in relation to city needs and requirements, as attested to by (Aderamo, 2000), akin to most
metropolitan areas of its kind and status in Nigeria.

A. O. Shittu, A, M. Z. Shah - A Tool for Appraising Mobility Environment with a Perfect Based Index Measure
282 - TeMA Journal of Land Use Mobility and Environment 3 (2015)
Fig. 1(a) Ilorin Metropolis in the context of Kwara state
Fig. 1(b) The twenty wards of Ilorin Metropolis
4 DATA ACQUISITION AND ANALYSIS
4.1 DATA ACQUISITION METHOD
Two types of surveys were carried out. The first one targeted the experts, while the second type was
directed at general respondents. The experts helped with attribute reduction exercise via the Delphi method.
Ten (10) urban planning and transportation professionals were purposively selected from agencies and
associated institutions in Ilorin metropolis. Six (6) of whom are field professionals and four (4) from local
tertiary institutions, all belonging to the senior cadre. Professionals from planning institutions were selected
because they are statutorily responsible for urban planning activities in Ilorin. Representatives from tertiary
institutions were targeted because Ilorin metropolis is their main study zone, and for the advisory role they
play in policy development. The general survey on the other hand, was carried out by trained research
assistants with knowledge of the local language and terrain. The interviews were carried out in respondents’
houses and in the streets of the constituent wards of Ilorin, for which information is sought. Respondents

A. O. Shittu, A, M. Z. Shah - A Tool for Appraising Mobility Environment with a Perfect Based Index Measure
283 - TeMA Journal of Land Use Mobility and Environment 3 (2015)
were interviewed and asked to rate attributes such as modal variety, pedestrian network density, activity
and land use mix, based on the checklist that emerged from professional contextual evaluation of 57
potential attributes of “mobility environments” harvested from literature. 500 questionnaires were
administered, based on Krejcie and Morgan, (1970), Veal, (2006) and Morenikeji (2006), suggestions and in
view of the population of the city. This translates into 25 each per ward. In addition, 5 extra questionnaires
were added as a precaution to make 30 per ward, in order to make room for substitution in case some are
returned unusable at the end of the city wide survey, which usually is the case with survey based data
collection exercises. Equal numbers of interviews were conducted in all wards, mainly, because the
population figures at the ward level are not officially available. So, there was no base for differing figures.
Hence, 25 questionnaires were in turn randomly selected without replacement from the total number of valid
questionnaires returned from each ward. The main issues of consideration in sampling for this research were
geographic distribution, age, gender, employment status, income, location of activities of daily living and
available human and financial resources to the researchers. The targeted age bracket was 18 – 65, normally
considered active age range. Interviews were conducted along randomly selected streets by trained research
assistants covering specific wards of the city. Approach to respondents’ selection was systematic random
sampling.
4.2 DATA ANALYSIS
4.2.1 EXTRACTION OF CONTEXTUALLY RELEVANT ATTRIBUTES FROM RATINGS
The professional raters reduced the 57 potential attributes of “mobility environment” harvested from
relevant literature to 30 contextually relevant ones to mobility assessment in Ilorin metropolis. The rating of
harvested attributes were done on a 5 point Likert scale ranging from 4 – 0, with extremely significant
having the highest and not significant the lowest. For instance, there is no formal bus system in Ilorin
metropolis, hence a score of (0) is awarded and the attribute end up taken off the list. Only 7 of the 10
participating professionals were available for each of 3 contacts. Therefore, only ratings from these 7 were
utilized for further analysis.
S/NO ITEMS
4 3 2 1 0 WEIGHTED
MEAN-WM
DECISION
ES HS S LS NS R/NR
1 Road Network Characteristics 3 4 0 0 0 3.43 R
2 Public transport cost 5 1 1 0 0 3.57 R
3 Public transport Fare/Distance relationship 3 4 0 0 0 3.43 R
4 Quality of public transport facilities 1 3 3 0 0 2.71 R
5 Land Use Mix 5 2 0 0 0 3.71 R
6 Activity Mix 4 3 0 0 0 4.00 R
7 Modal Variety 3 2 2 0 0 3.14 R
8 Private Modes 5 2 0 0 0 3.71 R
9 Congestion effect on mobility 3 3 1 0 0 3.28 R
10 Effect of time spent waiting at transport stops 3 2 1 1 0 3.00 R
11 Diversity of Movement Channels 5 2 0 0 0 3.71 R
12 Road Network Density 6 1 0 0 0 3.85 R
13 Pedestrian Network Density 6 1 0 0 0 3.85 R
14 Quality of public transport services 2 2 2 1 0 2.71 R
15 Public Transport Service Reliability 4 2 1 0 0 3.43 R
16 Delay factor 3 1 2 1 0 2.86 R
17 Safety attributes of Pedestrian Paths 3 4 0 0 0 3.43 R

A. O. Shittu, A, M. Z. Shah - A Tool for Appraising Mobility Environment with a Perfect Based Index Measure
284 - TeMA Journal of Land Use Mobility and Environment 3 (2015)
Table 1 List of Extracted Contextually Relevant attributes of “Mobility Environment in Ilorin Metropolis
Following professional contextual relevance rating, the weighted mean of entries for each factor were
derived to pave way for comparison with the calculated cut-off point. The cut-off point of acceptance or
rejection of items rated in Likert scale is the arithmetic mean of individual weights, Morenikeji, (2006), which
in this case are 4, 3, 2, 1 and 0. Hence, the cut-off point was calculated to be 2.00, see eqn (1). Therefore,
any item with a weighted mean (WM) of 1.99 and below is considered not significant in the context of the
study area, while those with WM equal to or above 2.00 are considered significant, WM is derived as shown
in eqn (2). The extraction of contextually relevant mobility influencing factors was then done. Table 1 shows
the WM values of extracted contextually significant attributes for Ilorin metropolis.
Cut-off point i = 1, 2, 3.... n (1)
, i = 1, 2, 3.... n (2)
4.2.2 THEMATIC CATEGORIZATION OF CONTEXTUALLY RELEVANT ATTRIBUTES FOR ILORIN METROPOLIS
Here, the contextually relevant attributes are grouped into thematic areas, according to trait similarities.
Attributes that collectively describe a certain phenomenon, say city development density, were all classified
under such a sub – heading. This is necessary because several factors tend to cluster together in defining
specific domains and also in shaping perception of individuals (Sokolowska, 2014). It also enables group by
group, as well as item by item comparison. The 9 groups of factors identified and classified descriptively are
as presented in Table 3. The categorization then forms the basis for preparing the questionnaires for the
general “mobility environment” perception survey targeted at respondents from the 20 wards of Ilorin
metropolitan area.
18 Perceived Safety of bus stops 2 3 2 0 0 3.00 R
19 Traffic accidents 2 3 2 0 0 3.00 R
20 Road markings and signage 2 4 0 1 0 3.00 R
21 Development Density 4 3 0 0 0 3.57 R
22 Development Pattern 3 3 1 0 0 3.28 R
23
Public transport fare effect on monthly
income 4 2 1 0 0 3.43 R
24 Public Modes 3 2 2 0 0 3.14 R
25
Number of transfers on routine trips to
work/school/shopping 2 3 2 0 0 3.00 R
26 Public Transport Service Comfort 2 3 1 1 0 2.86 R
27
Distance from transport stops to your
destination(s) 4 2 1 0 0 3.43 R
28
Distance to Public Transport stop at your
origin 4 2 1 0 0 3.43 R
29 Average travel time to work/school/shopping 3 2 2 0 0 3.14 R
30 Pedestrian Network Characteristics 3 2 2 0 0 2.20 R

A. O. Shittu, A, M. Z. Shah - A Tool for Appraising Mobility Environment with a Perfect Based Index Measure
285 - TeMA Journal of Land Use Mobility and Environment 3 (2015)
4.2.3 DEVELOPMENT OF ATTRIBUTE RANKING, RANK ORDER OF IMPORTANCE POINTS (ROIP) AND INDEX EQUIVALENTS (IE) TEMPLATE FOR ILORIN METROPOLIS
After ascertaining the number of contextually relevant attributes with the help of local professional urban
and transport planners, a factor ranking and Index Equivalent (IE) template was developed. The premise
was that since 30 contextually relevant factors were identified, it means ranking can only range from 1st to
30th. Ranking signifies order of importance of a particular attribute, according to respondents’ perception in
a particular city sub-unit. However, to show true effect, Accentuated Rank Order of Importance Points
(ROIP) were assigned to rank positions. The ROIP considered the total number of contextually relevant
attributes, as bases for accentuating rankings, using true values of figures to show relative magnitude.
Consequently, the highest ranking attribute is assigned 30 points as ROIP, to reflect its magnitude of
importance, while the lowest ranking attribute, receives 1 point as ROIP, signifying its low level of influence
on traveler perception in the specific city unit within which the attribute has been rated. Subsequently, the
general IE for each contextually relevant factors were established by dividing a specific ROIP with the sum of
all ROIPs, see eqn (3), this ensures normalization of IE values between 0 and 1, thereby removing the need
to attribute separate characteristic units to each factor. Table 2 then becomes the template for iterative
index equivalent assignment to attribute rankings for all the wards, according to city wide survey. Note that
WM values were also derived from respondents’ ratings for ranking purposes, as shown in column 5 of Table
3.
i = 1, 2, 3.... 30 (3)
RANK ORDER (RO)
ACCENTUATED RANK ORDER OF IMPORTANCE POINTS (ROIP)
INDEX EQUIVALENT (IE)
1st 30 0.065
2nd 29 0.062
3rd 28 0.060
4th 27 0.058
5th 26 0.056
6th 25 0.054
7th 24 0.052
8th 23 0.049
9th 22 0.047
10th 21 0.045
11th 20 0.043
12th 19 0.041
13th 18 0.039
14th 17 0.037
15th 16 0.034
16th 15 0.032
17th 14 0.030
18th 13 0.028
19th 12 0.026
20th 11 0.024
21st 10 0.022
22nd 9 0.019
23rd 8 0.017
A. O. Shittu, A, M. Z. Shah - A Tool for Appraising Mobility Environment with a Perfect Based Index Measure
286 - TeMA Journal of Land Use Mobility and Environment 3 (2015)
24th 7 0.015
25th 6 0.013
26th 5 0.011
27th 4 0.009
28th 3 0.006
29th 2 0.004
30th 1 0.002
Total 465 1.000
Table 2 Attribute Ranking, Rank Order of Importance Points (ROIP) and (IE) Template
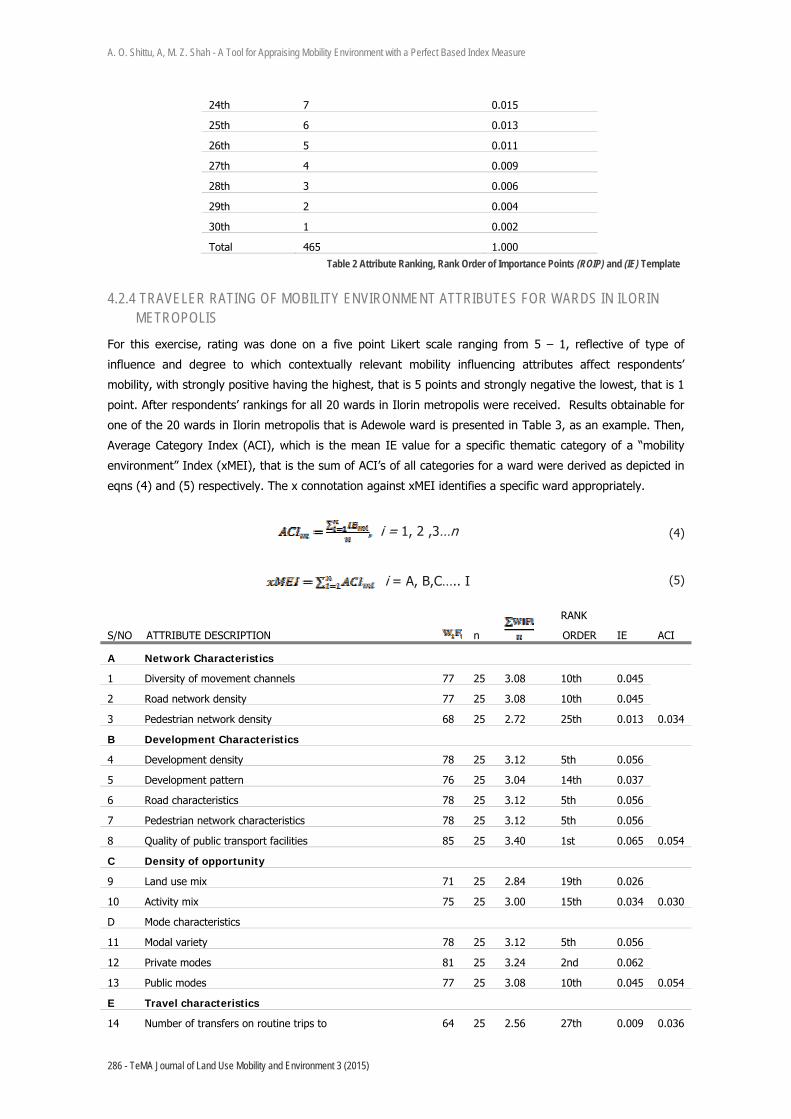
4.2.4 TRAVELER RATING OF MOBILITY ENVIRONMENT ATTRIBUTES FOR WARDS IN ILORIN METROPOLIS
For this exercise, rating was done on a five point Likert scale ranging from 5 – 1, reflective of type of
influence and degree to which contextually relevant mobility influencing attributes affect respondents’
mobility, with strongly positive having the highest, that is 5 points and strongly negative the lowest, that is 1
point. After respondents’ rankings for all 20 wards in Ilorin metropolis were received. Results obtainable for
one of the 20 wards in Ilorin metropolis that is Adewole ward is presented in Table 3, as an example. Then,
Average Category Index (ACI), which is the mean IE value for a specific thematic category of a “mobility
environment” Index (xMEI), that is the sum of ACI’s of all categories for a ward were derived as depicted in
eqns (4) and (5) respectively. The x connotation against xMEI identifies a specific ward appropriately.
i = 1, 2 ,3…n (4)
i = A, B,C….. I (5)
S/NO ATTRIBUTE DESCRIPTION n
RANK
ORDER IE ACI
A Network Characteristics
1 Diversity of movement channels 77 25 3.08 10th 0.045
0.034
2 Road network density 77 25 3.08 10th 0.045
3 Pedestrian network density 68 25 2.72 25th 0.013
B Development Characteristics
4 Development density 78 25 3.12 5th 0.056
0.054
5 Development pattern 76 25 3.04 14th 0.037
6 Road characteristics 78 25 3.12 5th 0.056
7 Pedestrian network characteristics 78 25 3.12 5th 0.056
8 Quality of public transport facilities 85 25 3.40 1st 0.065
C Density of opportunity
9 Land use mix 71 25 2.84 19th 0.026
0.030 10 Activity mix 75 25 3.00 15th 0.034
D Mode characteristics
11 Modal variety 78 25 3.12 5th 0.056
0.054
12 Private modes 81 25 3.24 2nd 0.062
13 Public modes 77 25 3.08 10th 0.045
E Travel characteristics
14 Number of transfers on routine trips to 64 25 2.56 27th 0.009 0.036

A. O. Shittu, A, M. Z. Shah - A Tool for Appraising Mobility Environment with a Perfect Based Index Measure
287 - TeMA Journal of Land Use Mobility and Environment 3 (2015)
0.310 Table 3 Rank Order of Perception Ratings of Mobility Influencing Attributes for Adewole ward
Table 3, illustrates results for Adewole ward, where a wMEI of 0.310 was derived. The least contributor to
wMEI index for Adewale ward in terms of thematic categories was the “safety factor” group. Specifically,
“safety attributes of pedestrian paths” ranked the lowest, which is 30th position, with a weighted mean
value of 1.88 and IE of 0.002, meaning that the largest proportion of raters, consider safety characteristics
of pedestrian paths as unfavourable to them. The highest ranking attributes for this ward was “quality of
public transport facilities”, a pointer to a relatively good perception of public transport facilities, which for
this case, refers almost entirely to bus stops, mainly utilized by informal public transport providers. The
“development characteristics” and “modal varieties” categories tied on ACI contribution of 0.054 to xMEI as
perceived for Adewole ward, which means that, respondents’ perceived development density of the area
quite positively, just as they believe the choices of modes available to them are favourable, even though
most of the respondents prefer to use private modes. This is possibly because of the unfavourable distance
to public transport stops at respondents’ origin, which turned in a low IE of 0.017, along with public
transport cost. The “network characteristics” and “economic factors” categories also turned up with equal
ACI of 0.034 for the ward, the public transport “fare/distance” relationship under the “economic factor”
group was particularly rated high, coming 5th in terms of positive influence on respondents’ mobility,
meaning that respondents consider public transport fare versus distance generally acceptable, even though
overall cost are perceived not to be so. The “public transport accessibility” thematic category on the other
hand, turned up with a low ACI of 0.022 for the ward, signifying a need for priority intervention in both
“public transport accessibility” and “safety” areas. If the general perception of “mobility environment” of
Adewole ward is to improve from a grade level 8 good “mobility environment” rating to a better status on
the mobility environment ratings interpretation table, as shown in Table 4.
work/school/shopping
15 Average travel time to work/school/shopping 81 25 3.24 2nd 0.062
F Transport accessibility factors
16 Distance to public transport stop at your origin 69 25 2.76 23rd 0.017
0.022 17 Distance from transport stops to your destination(s) 71 25 2.84 19th 0.026
G Economic factors
18 Public transport cost 69 25 2.76 23rd 0.017
0.034
19
Public transport fare/distance
relationship 78 25 3.12 5th 0.056
20 Public transport fare effect on monthly income 73 25 2.92 17th 0.030
H Operational Characteristics
21 Congestion effect on mobility 71 25 2.84 19th 0.026
0.025
22 Effect of time spent waiting at transport stops 72 25 2.88 18th 0.028
23 Public transport service reliability 67 25 2.68 26th 0.011
24 Public transport service comfort 64 25 2.56 27th 0.009
25 Delay factor 70 25 2.80 22nd 0.019
26 Quality of public transport services 79 25 3.16 4th 0.058
I Safety factors
27 Safety attributes of pedestrian paths 47 25 1.88 30th 0.002
0.021
28 Perceived safety of bus stops 53 25 2.12 29th 0.004
29 Traffic accidents 74 25 2.96 16th 0.032
30 Road Markings and signage 77 25 3.08 10th 0.045
WMEI

A. O. Shittu, A, M. Z. Shah - A Tool for Appraising Mobility Environment with a Perfect Based Index Measure
288 - TeMA Journal of Land Use Mobility and Environment 3 (2015)
MEI VALUE RANGE DESCRIPTIVE RATING CHANGE INDICATOR
MEI INCREMENT INDICATOR INTERPRETATION
= 0.5850 32.5 Exceptional Mobility Environment
0.576 – 0.584 1 32
Excellent Mobility Environment
0.558 – 0.575 2 31
0.540 – 0.557 3 30
0.522 – 0.539 4 29
0.504 -0.521 5 28
0.486 – 0.503 6 27
0.468 – 0.485 7 26
0.450 – 0.467 8 25
0.432 – 0.449 1 24
Good Mobility Environment
0.414 – 0.431 2 23
0.396 – 0.413 3 22
0.378 – 0.395 4 21
0.360 – 0.377 5 20
0.342 – 0.359 6 19
0.324 – 0.341 7 18
0.306 – 0.323 8 17
0.2925 – 0.305 16.25 Satisfactory Mobility Environment
0.288 – 0.291 1 16
Fair Mobility Environment
0.270 – 0.287 2 15
0.252 – 0.269 3 14
0.234 – 0.251 4 13
0.216 – 0.233 5 12
0.198 – 0.215 6 11
0.180 – 0.197 7 10
0.162 – 0.179 8 9
0.144 – 0.161 1 8
Poor Mobility Environment
0.126 – 0.143 2 7
0.108 – 0.125 3 6
0.090 – 0.107 4 5
0.072 – 0.089 5 4
0.054 – 0.071 6 3
0.036 – 0.053 7 2
0.018 – 0.035 8 1
Table 4 Mobility Environment Rating Interpretation Table
The premise here is that, the perception of a “mobility environment” improves positively as “mobility
environment index” (MEI) tend towards the max, in this case 0.5850 achievable index points, while” mobility
environment” perception deteriorates negatively as “mobility environment index (MEI) tends towards the
minimum achievable points, which is 0.018. The figures literarily denote the degree to which a spatial unit
enhances or inhibits mobility. Therefore, it is expected that the higher the MEI value, the higher the
perceived positivity of influence of “mobility environment” by that spatial unit and vice versa.
, i = 1, 2, 3,...., n (6)

A. O. Shittu, A, M. Z. Shah - A Tool for Appraising Mobility Environment with a Perfect Based Index Measure
289 - TeMA Journal of Land Use Mobility and Environment 3 (2015)
S/NO WARD NAME
WARD MOBILITY LEVEL
INDEX (WMSLI)
WARD RANKING BY
MSLI VALUE
PERCENT CONTRIBUTION
OF WARD
1 Adewole 0.310 12th 4.90
2 Babooko 0.316 8th 5.00
3 Balogun Ajikobi 0.316 8th 5.00
4 Balogun Alanamu 0.302 17th 4.77
5 Balogun Fulani 0.308 16th 4.87
6 Balogun Gambari 0.329 5th 5.20
7 Magaji Are 0.310 12th 4.90
8 Magaji Badari 0.300 18th 4.74
9 Magaji Gari 0.324 7th 5.12
10 Magaji Ibogun 0.315 10th 4.98
11 Magaji Ogidi 0.300 18th 4.74
12 Magaji Ojuekun 0.313 11th 4.95
13 Magaji Okaka 0.325 6th 5.14
14 Magaji Oloje 0.334 2nd 5.3
15 Magaji Zarumi 0.330 4th 5.21
16 Oke Ogun 0.334 2nd 5.3
17 Sabongari 1 0.309 15th 4.88
18 Sabongari 2 0.310 12th 4.90
19 Uban Dawaki 0.298 20th 4.71
20 Zango 0.339 1st 5.4
Cumulative MSLI 6.322 100
i = 1,2,3,…n 0.316
Table 5 Derivation of CMSLI Value for Ilorin Metropolis
5 THE STUDY AREA
From the general overview of the 20 wards, the difference between the highest and lowest XMEI
contribution is 0.041 index points, which signifies only a two (2) stage drop or climb for the highest
contributor or the lowest contributor to be at par, respectively. It can then be deduced that the status of the
wards “mobility environment” in terms of effect on perception of mobility are similar and not significantly
different from one another. Even though, the major contributing attributes to the shades of perception
reported for each ward differ. The lesson here is that aggregate description attributes of “mobility
environment” may produce a generalized outlook that might not be reflective distinct geographical units.
This reiterates the belief of Bertolini and Dijst, (2003), that “mobility environments” are geographical units
with homogeneous mobility characteristics. The general outlook of “mobility environments” in Ilorin
metropolis further proves this point because it presents a quite homogeneous picture of different wards,
irrespective of the fact that some wards developed entirely organically, while others had some planning
history or interventions in the course of their development. It may then be concluded that the disjointed and
piecemeal approach to planning in the metropolis underscored by lack of continuity has resulted into a
scenario where advantages accruable from occasional planning are eroded by the disadvantages of the lack
of concerted planning.
More so, the highest ranking positively influencing attributes of mobility were private modes, rated 1st, in 16
of the 20 wards, with an IE of 0.065 in all cases. This agrees with assertions in the literature that private
means of movement are usually preferred by travelers, unless conscious efforts are instituted to reduce its
use from several fronts, so as to reduce the side effects of over motorization, which is usually compounded

A. O. Shittu, A, M. Z. Shah - A Tool for Appraising Mobility Environment with a Perfect Based Index Measure
290 - TeMA Journal of Land Use Mobility and Environment 3 (2015)
by inadequate planning, as is the case in Ilorin metropolis. This also shows that perception based indices are
adequate in eliciting probable determinants of mobility preferences and dilemma. On the contrary, attributes
of public modes were generally perceived negatively; thereby ranking lowest that is 30th, with IEs of 0.002
in 45% of cases. This without doubt reflects the highly decentralized nature of the sector, due mainly to its
total informal private ownership, and the lack of service quality enforcement of public transport modes in the
metropolis. This attribute of public modes also explains the possibility of having such diverse characteristics
in public transportation within one city. This is underscored by the fact that some wards are serviced by only
rickshaws, or motorcycles, or taxis or minibuses, while others are served by a combination of taxis,
minibuses, and motorcycles, leading to a different array of public transport mode choices available for each
ward. Furthermore, route choice is basically governed by “cream skimming”, where the lucrative routes are
over supplied and the less profitable ones neglected.
In terms of utility, the index based “mobility environment” appraisal technique is developed basically to
provide an alternate assessments procedure aimed at simplifying mobility planning decision making,
especially where the normal gamut of required data and information to run sophisticated mobility
evaluations are lacking. It also enables dimensioning and classification that allows a “mobility environment”
to be assessed with respect to its peculiarities, be it covert or overt, in order that the complexities of mobility
suffered by individual traveler become clearly understood. Besides, the measures generated from the
application of the MEI technique provide justifiable reasons for project and programme design and selection
for specific districts of identified cities. The tool is also useful in that it offers urban mobility planning and
improvement decision support criteria for resource allocation, project prioritization and programme
assessment. In addition, the tool also provide the bases for comparative analysis of needs and budgets in a
manner that targets the overall mobility objectives of a city, besides enabling the assessment of goal(s)
achievement. Budgeting tasks can be dealt with by using rankings of factors to determine priority projects
and programmes, on the basis of how they fare on the ranking table. Future expenditure requirements can
also be gleaned from simulating preferred positions of factors against city goals or targets, or by expert re-
ordering of ranks by allocating weight of importance. In practical terms, the bases for mobility need
projections and trend analysis in hitherto “mobility environment” attribute indeterminate areas have been
presented, as a precursor to achieving goals of urban sustainability and livability.
In conclusion, the deeper understanding of underlining explanations of “mobility environment” induced
mobility complexities by authorities responsible for urban mobility planning and management will improve
responsiveness on the part of decision makers, leading to an improved and positively perceived “mobility
environment” and quality of life. This research is expected to stimulate further enquiries into ways of
quantitatively capturing perception based indicators from “mobility environments”, as inputs in urban
mobility assessments. First, the work presents an alternative mobility appraisal technique to complex data
hungry models. This tool uses easily gathered data to facilitate realistic situational mobility evaluations, thus,
permitting some measure of conscious management to begin in settings where inadequate mobility data and
skilled manpower bedevil the sector. The study also strives to bridge the need gap for a parsimonious
technique of assessing mobility, from the angle of environmental qualities. This serves to reduce the
negative implications of indeterminate and indescribable mobility environment situations, thus enabling
reasonable evaluations as a basis for local solutions and interventions. The tool’s usage of individual percept
of mobility influencing attributes enables a decent capture of some measure of mobility complexity
determinants from the “mobility environment”, by this means prioritizing the real essence of mobility
planning, which is meeting Instrumental Activities of Daily Living (IADLs), an important determinant of
quality of life. An attempt has been made in this study to develop a tool for deriving a percept-to-index
construct, which can be used to describe “mobility environments”, it will still be necessary to evaluate the
extent to which the MEI technique can be relied upon to depict future changes, from evaluation of ex-post-
facto ratings by new groups of respondents, after the implementation of MEI based programmes and

A. O. Shittu, A, M. Z. Shah - A Tool for Appraising Mobility Environment with a Perfect Based Index Measure
291 - TeMA Journal of Land Use Mobility and Environment 3 (2015)
project. In other for the tool to be a reliable instrument of measuring the achievement of short and long
term goals of mobility planning. The belief is that, if factors that shape human perception of a phenomenon
can be identified, they will go a long way in helping decision makers arrive at more acceptable decisions.
REFERENCES
Aderamo, A.J. (2000) City Planning and Management Techniques. In: Jimoh and Ifabiyi (Eds.), Contemporary Issues in Environmental Studies, (pp. 32-43). Ilorin, Nigeria: University Press.
Aderamo, A. J. (2003). Changing Structure of Intra-Urban Road Network in Ilorin, Nigeria (1963 – 1999). Ilorin Journal of Business and Social Sciences, vol. 8 Nos1 and 2, 65-76. MJT press.
Aderamo, A. I. (2008). Urbanization and transportation in Nigeria. In Urbanization, Resource Exploitation and environmental stability in Nigeria. Proceeding of the 49th Annual Conferences of Association of Nigerian Geographers (pp. 134-149).
Ahmed, Y. A. (1996). Problems of Physical Planning in Ilorin City, Nigeria (Unpublished Msc. Thesis). Geography Department, University of llorin, Nigeria.
Alton, D., Adab, P., Roberts, L., & Barrett, T. (2007). Relationship between walking levels and perceptions of the local neighbourhood environment. Archives of disease in childhood, 92(1), 29-33. doi:10.1136/adc.2006.100826.
Asiyanbola, R. A. (2007, June). Intra-urban transportation, gender and psychological distress in developing countries: Nigeria. In PRIPODE Workshop on Urban Population, Development and Environment Dynamics in Developing Countries. Nairobi, Kenya (pp. 11-13). Available at: http://www.cicred.org/pripode/CONF/NAIROBI/pdf/Abidemi-ASIYANBOLA_paperNairobi2007-2.pdf.
Bertolini, L. (2006). Fostering urbanity in a mobile society: Linking concepts and practices. Journal of Urban Design, 11(3), 319–334. doi: 10.1080/13574800600888269.
Bertolini, L., & Djist, M. (2003). Mobility Environments and Network Cities. Journal of Urban Design, 8(1), 27-43. doi: 10.1080/1357480032000064755.
Florindo, A. A., Guimarães, V. V., Galvao Cesar, C. L., de Azevedo Barros, M. B., Goi Porto Alves, M. C., & Goldbaum, M. (2009). Epidemiology of leisure, transportation, occupational, and household physical activity: prevalence and associated factors. Journal of Physical Activity and Health, 6(5), 625. Available at: http://journals.humankinetics.com/AcuCustom/Sitename/Documents/DocumentItem/17397.pdf.
Howard, C., & Burns, E. (2001). Cycling to Work in Phoenix: Route Choice, Travel Behavior, and Commuter Characteristics. Transportation Research Record: Journal of the Transportation Research Board, (1773), 39-46. doi:10.3141/1773-05.
Hjorthol, R., Levin, L., and Siren, A. (2010). Mobility in Different Generation of Older Persons: The Development of Daily Travel in Different Cohorts in Denmark, Norway and Sweden. Journal of Transport Geography, 18 (5), 624 – 633. doi: http://dx.doi.org/10.1016/j.jtrangeo.2010.03.011.
Hong, S. (2010). Human movement patterns, mobility models and their impacts on wireless applications. (Doctoral dissertation).North Carolina State University. ISBN: 978-1-124-92302-4. Available at: http://dl.acm.org/citation.cfm?id=2338217.
Hume, C., Salmon, J., & Ball, K. (2005). Children's perceptions of their home and neighborhood environments, and their association with objectively measured physical activity: a qualitative and quantitative study. Health education research, 20(1), 1-13. doi: http://dx.doi.org/10.1093/her/cyg095.
Humpel, N., Marshall, A. L., Leslie, E., Bauman, A., and Owen, N. (2004). Changes in neighborhood walking are related to changes in perceptions of environmental attributes. Annals of Behavioral Medicine, 27(1), 60-67. doi: http://dx.doi.org/10.1207/s15324796abm2701_8.
Isaacman, S., Becker, R., Caceres, R., Kubourov, S,. Martonosi, M., Rowland, J,. and Varshavsky, A. (2011). Ranges of Human Mobility in Los Angeles and New York. In 8th IEEE Workshop on Managing Ubiquitous Communications and Services. doi: http://dx.doi.org/10.1109/PERCOMW.2011.5766977.
Krejcie, R.V and Morgan, D.W. (1970). Determining Sample Size for Research Activities, Educational and Psychological Measurement, 1970 (30), 607 – 610.
Lotfi, S., & Koohsari, M. J. (2009). Analyzing accessibility dimension of urban quality of life: Where urban designers face

A. O. Shittu, A, M. Z. Shah - A Tool for Appraising Mobility Environment with a Perfect Based Index Measure
292 - TeMA Journal of Land Use Mobility and Environment 3 (2015)
duality between subjective and objective reading of place. Social Indicators Research, 94(3), 417-435. doi:10.1007/s11205-009-9438-5.
Mingshun, Z. (2002). Measuring urban Sustainability in China. (Doctoral dissertation). Institute for Housing and Urban Development Studies (IHS) and Erasmus University, Rotterdam, the Netherlands. Available at: http://library.wur.nl/WebQuery/clc/1651432.
Morenikeji, W. (2006). Research and Analytical Methods. Jos, Nigeria: Jos University Press Ltd.
Oluseyi, O. F. (2006). Analysis of inter-connectivity levels of urban street networks and social interactions in enclosed neighborhood in Johannesburg RSA. Humanity & Social Sciences Journal, 1(1), 79-95. ISSN 1818-4960.
Patla, A.E., and Shumway – Cook, A. (1999). Dimensions of Mobility: Defining the Complexity and Difficulty Associated with Community Mobility. Journal of Aging and Physical Activity. 7(1), 7-19.
Shittu, A.O., Zaly, M.S. and Chiroma, M.A. (2015). Perception based determinants of mobility dilemma in Ilorin metropolis. Open Journal of Social Sciences, 3(4), 61-70. doi: http://dx.doi.org/10.4236/jss.2015.34008.
Sokołowska, K. (2014). Determinants and perceptions of social mobility in Poland, 1992-2008. Contemporary Economics, 8(1), 89-102. doi: 10.5709/ce.1897-9254.133.
Soria-Lara, J. A., Valenzuela-Montes, L. M., and Pinho, P. (2014): Using ‘Mobility Environments' in Practice: Lessons from a Metropolitan Transit Corridor in Spain. Journal of Environmental Policy & Planning, (ahead-of-print), 1-20. doi: 10.1080/1523908X.2014.991779.
Soria-Lara, J. (2012). Modelo de umbrales para la evaluacio´n ambiental de la movilidad urbana (Thesis diss.). University of Granada. Available at http://hdl.handle.net/10481/20193.
Talavera-Garcı´a, R., Soria-Lara, J. A., & Valenzuela-Montes, L. M. (2014). La calidad peatonal como metodo para evaluar entornos de movilidad urbanos. Documents d'anàlisi geogràfica, 60: 161-187, 60(1), 161–187. ISSN 0212-1573.
Timperio, A., Crawford, D., Telford, A., and Salmon, J. (2004). Perceptions about the local neighborhood and walking and cycling among children. Preventive Medicine, 38(1), 39-47. doi: http://dx.doi.org/10.1016/j.ypmed.2003.09.026.
Vanwolleghem, G., Van Dyck, D., Ducheyne, F., Bourdeaudhuij, I., and Cardon, G. (2014). Assessing the Environmental Characteristics of Cycling Routes to School: A Study on the Reliability and Validity of a Google Street View-based audit. International Journal of Health Geographics, 13:19. Available at http://www.ij-healthgeographics.com/content/13/1/19.
Veal, A.J. (2006). Research Methods for Leisure and Tourism. A practical Guide: London: Prentice Hall. ISBN-13: 978-0273682004.
World Business Council for Sustainable Development (2004). Mobility 2030: Meeting the Challenges to Sustainability. WBCSD: Geneva, Switzerland. Available at: http://www.wbcsd.org/web/publications/mobility/mobility-full.pdf.
Zaly, M., 2010. Rating Pedestrian Facility with P – Index and The Application of Google Map (Monograph No.8). Centre for Innovative Planning and Development, Universiti Teknology Malaysia. Available at http://www.epublication.fab.utm.my/83/.
IMAGE SOURCES
Fig. 1(a): Source: Kwara State Town Planning Authority
Fig. 1(b): Source: Kwara State Town Planning Authority
AUTHOR’S PROFILES
AbdulMajeed Olaremi Shittu
PhD Candidate, Transportation Planning, Universiti Teknologi Malaysia.
Muhammad Zaly Shah
Senior Lecturer, Department of Urban and Regional Planning, Universiti Teknologi Malaysia.