cisco catalyst 29xx (3258) - ca...
TRANSCRIPT
Cisco Catalyst 29xx
Device Management
Supports Management Module SM-CAT1005
Titlep
age
D e v i c e M a n a g e m e n t Page 2 C i s c o C a t a l y s t 2 9 x x
Copyright NoticeDocument 3258. Copyright © 2002-present by Aprisma Management Technologies, Inc. All rights reserved worldwide. Use, duplication, or disclosure by the United States government is subject to the restrictions set forth in DFARS 252.227-7013(c)(1)(ii) and FAR 52.227-19.
Liability DisclaimerAprisma Management Technologies, Inc. (“Aprisma”) reserves the right to make changes in specifications and other information contained in this document without prior notice. In all cases, the reader should contact Aprisma to inquire if any changes have been made.The hardware, firmware, or software described in this manual is subject to change without notice.IN NO EVENT SHALL APRISMA, ITS EMPLOYEES, OFFICERS, DIRECTORS, AGENTS, OR AFFILIATES BE LIABLE FOR ANY INCIDENTAL, INDIRECT, SPECIAL, OR CONSEQUENTIAL DAMAGES WHATSOEVER (INCLUDING BUT NOT LIMITED TO LOST PROFITS) ARISING OUT OF OR RELATED TO THIS MANUAL OR THE INFORMATION CONTAINED IN IT, EVEN IF APRISMA HAS BEEN ADVISED OF, HAS KNOWN, OR SHOULD HAVE KNOWN, THE POSSIBILITY OF SUCH DAMAGES.Trademark, Service Mark, and Logo InformationSPECTRUM, IMT, and the SPECTRUM IMT/VNM logo are registered trademarks of Aprisma Management Technologies, Inc., or its affiliates. APRISMA, APRISMA MANAGEMENT TECHNOLOGIES, the APRISMA MANAGEMENT TECHNOLOGIES logo, MANAGE WHAT MATTERS, DCM, VNM, SpectroGRAPH, SpectroSERVER, Inductive Modeling Technology, Device Communications Manager, SPECTRUM Security Manager, and Virtual Network Machine are unregistered trademarks of Aprisma Management Technologies, Inc., or its affiliates. For a complete list of Aprisma trademarks, service marks, and trade names, go tohttp://www.aprisma.com/manuals/trademark-list.htm.All referenced trademarks, service marks, and trade names identified in this document, whether registered or unregistered, are the intellectual property of their respective owners. No rights are granted by Aprisma Management Technologies, Inc., to use such marks, whether by implication, estoppel, or otherwise. If you have comments or concerns
about trademark or copyright references, please send an e-mail to [email protected]; we will do our best to help.Restricted Rights Notice(Applicable to licenses to the United States government only.)
This software and/or user documentation is/are provided with RESTRICTED AND LIMITED RIGHTS. Use, duplication, or disclosure by the government is subject to restrictions as set forth in FAR 52.227-14 (June 1987) Alternate III(g)(3) (June 1987), FAR 52.227-19 (June 1987), or DFARS 52.227-7013(c)(1)(ii) (June 1988), and/or in similar or successor clauses in the FAR or DFARS, or in the DOD or NASA FAR Supplement, as applicable. Contractor/manufacturer is Aprisma Management Technologies, Inc. In the event the government seeks to obtain the software pursuant to standard commercial practice, this software agreement, instead of the noted regulatory clauses, shall control the terms of the government's license.
Virus DisclaimerAprisma makes no representations or warranties to the effect that the licensed software is virus-free.Aprisma has tested its software with current virus-checking technologies. However, because no antivirus system is 100 percent effective, we strongly recommend that you write-protect the licensed software and verify (with an antivirus system in which you have confidence) that the licensed software, prior to installation, is virus-free.Contact InformationAprisma Management Technologies, Inc.273 Corporate DrivePortsmouth, NH 03801Phone: 603-334-2100U.S. toll-free: 877-468-1448Web site: http://www.aprisma.com
D e v i c e M a n a g e m e n t Page 3 C i s c o C a t a l y s t 2 9 x x
ContentsINTRODUCTION 5
Purpose and Scope ........................................................5Required Reading ...........................................................5Supported Devices..........................................................6
The SPECTRUM Model ..............................................6
TASKS 8
DEVICE VIEW 10
Interface Icons ..............................................................11Interface Icon Subviews Menu Options .....................12
Interface Status View ....................................................13Port BroadCast View.....................................................13Port Monitor View..........................................................14Port Bandwidth View.....................................................15
Peak Usage Table .....................................................16Port Stats View .............................................................16
Errors .....................................................................16Received Frames Discarded..................................17Non-Unicast Frames ..............................................17
Port Address View ........................................................18Module Table ................................................................19
DEVICE TOPOLOGY VIEW 20
APPLICATION VIEWS 21
Main Application View................................................... 21Supported Applications ................................................. 22
Common Applications ............................................... 22Device-Specific Applications ..................................... 23
Cisco Chassis Application.............................................24Cisco Chassis Card View .......................................... 24Cisco Chassis General Information View .................. 24
Chassis Information............................................ 24ROM Information ................................................ 25RAM Information ................................................ 25
Cisco Discovery Application.......................................... 25Discovery Cache Table View .................................... 25Interface Discovery Status Table .............................. 26
Cisco Interface Application ...........................................27Cisco Terminal Application ...........................................27
Cisco Terminal Server Line View .............................. 27Cisco Terminal Server Session View ........................ 29
PERFORMANCE VIEWS 30
Performance View......................................................... 31Device Performance View.............................................31
CONFIGURATION VIEWS 32
Device Configuration View............................................ 32Interface Configuration Table ................................ 34
Port Configuration View ................................................ 35
C o n t e n t s C o n t e n t s
D e v i c e M a n a g e m e n t Page 4 C i s c o C a t a l y s t 2 9 x x
Network/Host Configuration View .................................37Network Configuration ...............................................37Host Configuration.....................................................38Interface Address Translation Table..........................39
Cisco Running Config Event/Alarm Configuration View ................................................................39
MODEL INFORMATION VIEW 41
INDEX 42
S P E C T R U M E n t e r p r i s e M a n a g e r Page 5 C i s c o C a t a l y s t 2 9 x x
Introduction
This section introduces the SPECTRUM Device Management documentation for Cisco Catalyst 29xx devices.
The introduction to Device Management documentation for the Cisco Catalyst 29xx devices contains the following information:
• Purpose and Scope• Required Reading• Supported Devices (Page 6)• The SPECTRUM Model (Page 6)
Purpose and ScopeUse this document as a guide for managing Cisco Catalyst 29xx devices with the SPECTRUM model numbered SM-CAT1005, which supports the Catalyst 29xx switch series and the Catalyst 29xx model types identified herein. The documentation describes the views that enable you to remotely monitor, configure, and troubleshoot Cisco Catalyst 29xx devices through software models in your SPECTRUM database.
Only information specific to the supported management module is included under this topic. For general information about device
management using SPECTRUM and for explanations of basic SPECTRUM functionality and navigation techniques, refer to the documentation listed under Required Reading.
Required ReadingTo use this documentation effectively, you must be familiar with the information covered by the other SPECTRUM online documents listed below.
• Getting Started with SPECTRUM for Operators
• Getting Started with SPECTRUM for Administrators
• How to Manage Your Network with SPECTRUM
• SPECTRUM Views
• SPECTRUM Menus
• SPECTRUM Icons
• SPECTRUM Software Release Notice
I n t r o d u c t i o n S u p p o r t e d D e v i c e s
S P E C T R U M E n t e r p r i s e M a n a g e r Page 6 C i s c o C a t a l y s t 2 9 x x
Supported DevicesThe SPECTRUM management module SM-CAT 1005 currently allows you to model four different types of Cisco Catalyst 4xxx devices as described below.
• The Catalyst 2924M XL. This device is an auto-sensing Fast Ethernet switch with12 switched 10BaseTx ports.
• The Catalyst 2912M XL. This fast Ethernet device has 12 switched 1000BaseFX ports and two module slots.
• The Catalyst 2924C. This device is an auto-sensing Fast Ethernet switch with 22 switched 10 BaseT/1000BaseTX ports and two switched 1000BaseFX ports.
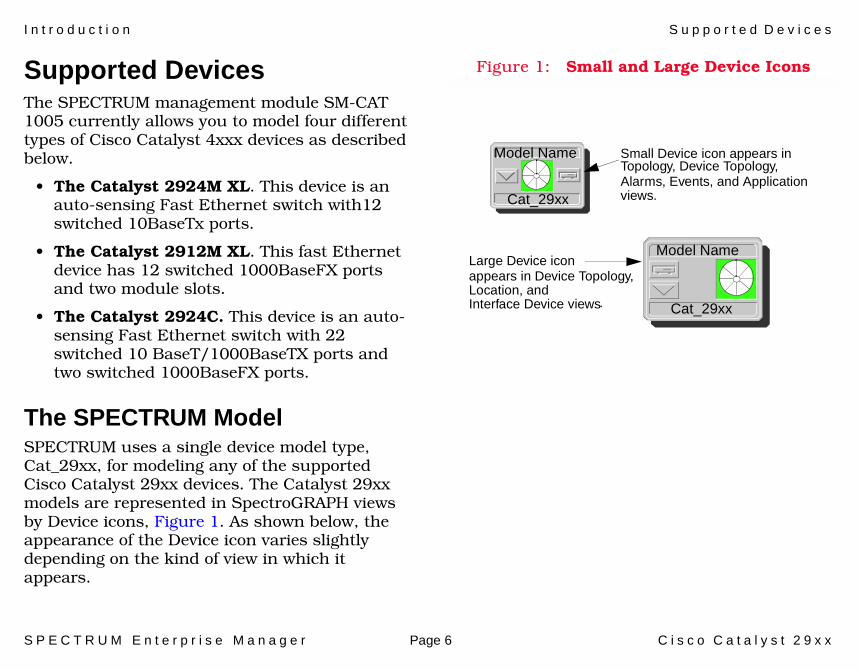
The SPECTRUM ModelSPECTRUM uses a single device model type, Cat_29xx, for modeling any of the supported Cisco Catalyst 29xx devices. The Catalyst 29xx models are represented in SpectroGRAPH views by Device icons, Figure 1. As shown below, the appearance of the Device icon varies slightly depending on the kind of view in which it appears.
Figure 1: Small and Large Device Icons
Model Name
Cat_29xx
Model Name
Cat_29xx
Small Device icon appears inTopology, Device Topology, Alarms, Events, and Application
Large Device iconappears in Device Topology,Location, andInterface Device views.
views.
I n t r o d u c t i o n S u p p o r t e d D e v i c e s
S P E C T R U M E n t e r p r i s e M a n a g e r Page 7 C i s c o C a t a l y s t 2 9 x x
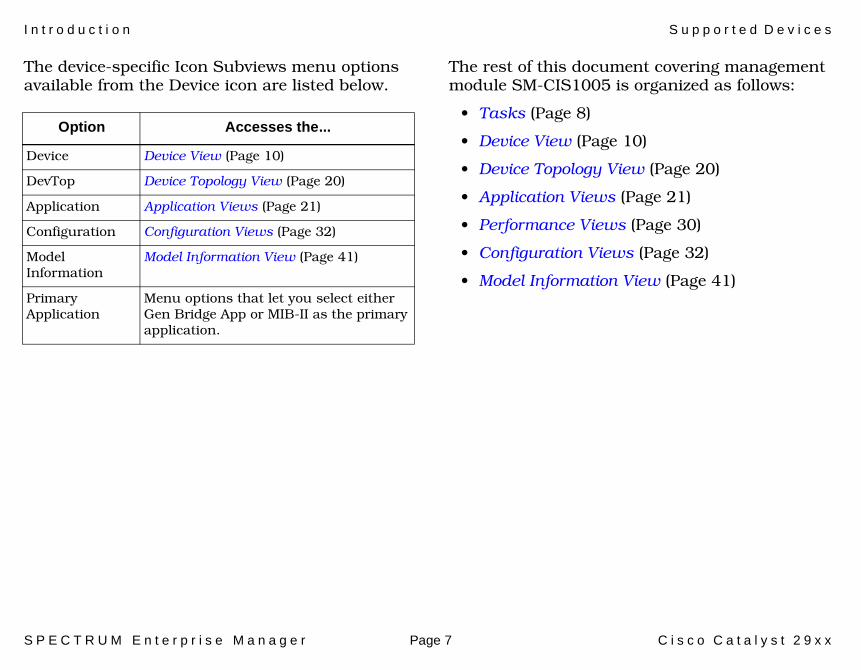
The device-specific Icon Subviews menu options available from the Device icon are listed below.
The rest of this document covering management module SM-CIS1005 is organized as follows:
• Tasks (Page 8)
• Device View (Page 10)
• Device Topology View (Page 20)
• Application Views (Page 21)
• Performance Views (Page 30)
• Configuration Views (Page 32)
• Model Information View (Page 41)
Option Accesses the...
Device Device View (Page 10)
DevTop Device Topology View (Page 20)
Application Application Views (Page 21)
Configuration Configuration Views (Page 32)
Model Information
Model Information View (Page 41)
Primary Application
Menu options that let you select either Gen Bridge App or MIB-II as the primary application.
S P E C T R U M E n t e r p r i s e M a n a g e r Page 8 C i s c o C a t a l y s t 2 9 x x
Tasks
This section lists device management tasks alphabetically and provides links to descriptions of the views and/or tables used to perform the task.
Alarm Thresholds (Set/Check)• Port BroadCast View (Page 13)
Applications (Change)• Device Topology View (Page 20)
Address Learnability/Alarms• Port Address View (Page 18)
Bandwidth (Check)• Port Bandwidth View (Page 15)
Bridging Information (View)• Device Topology View (Page 20)
Hardware/Software Information• Module Table (Page 19)
Port Statistics • Port Stats View (Page 16)
Port Operation (Monitor)• Device Topology View (Page 20)• Configuration Views (Page 32)• Port Configuration View (Page 35)
Port Operational Mode (Set)• Device Topology View (Page 20)
Ports (Configure)• Device Configuration View (Page 32)
Port Enable/Disable• Interface Status View (Page 13)
Repeater Frame and Error Stats (View)• Application Views (Page 21)
Topology (Check)• Device Topology View (Page 20)

T a s k s S u p p o r t e d D e v i c e s
S P E C T R U M E n t e r p r i s e M a n a g e r Page 9 C i s c o C a t a l y s t 2 9 x x
Traps (Set Up)• Port Address View (Page 18)• Port BroadCast View (Page 13)
S P E C T R U M E n t e r p r i s e M a n a g e r Page 10 C i s c o C a t a l y s t 2 9 x x
Device View
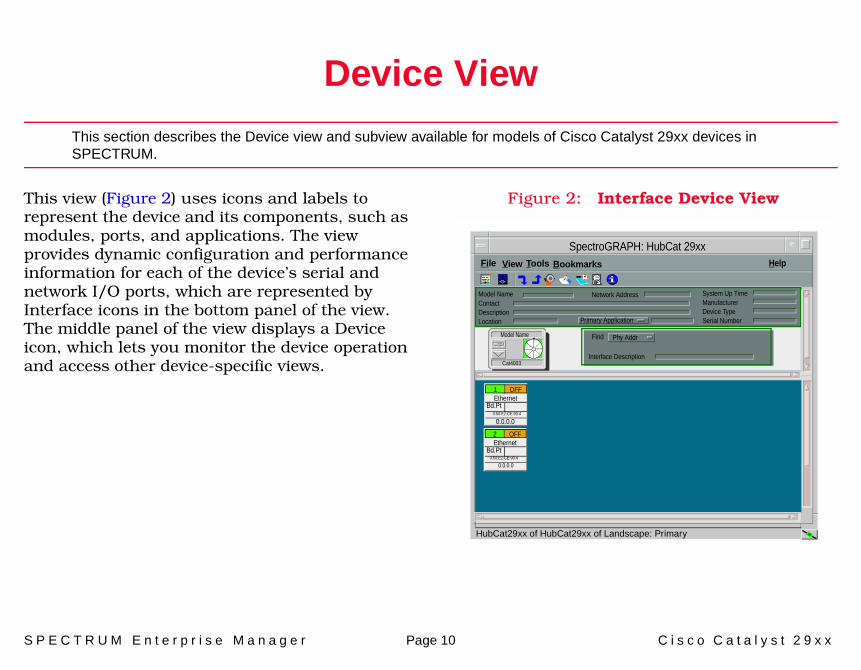
This section describes the Device view and subview available for models of Cisco Catalyst 29xx devices in SPECTRUM.
This view (Figure 2) uses icons and labels to represent the device and its components, such as modules, ports, and applications. The view provides dynamic configuration and performance information for each of the device’s serial and network I/O ports, which are represented by Interface icons in the bottom panel of the view. The middle panel of the view displays a Device icon, which lets you monitor the device operation and access other device-specific views.
Figure 2: Interface Device View
SpectroGRAPH: HubCat 29xx File View Help
Model NameContactDescriptionLocation
System Up TimeManufacturerDevice TypeSerial Number
Network Address
Primary Application
Interface Description
Find Phy AddrModel Name
Cat4003
Ethernet1 OFF
0.0.0.0
Ethernet2 OFF
0.0.0.0
Bd.Pt
Bd.Pt
0:50:E2:CE:90:4
0:50:E2:CE:90:4
Tools Bookmarks
HubCat29xx of HubCat29xx of Landscape: Primary
D e v i c e V i e w I n t e r f a c e I c o n s
S P E C T R U M E n t e r p r i s e M a n a g e r Page 11 C i s c o C a t a l y s t 2 9 x x
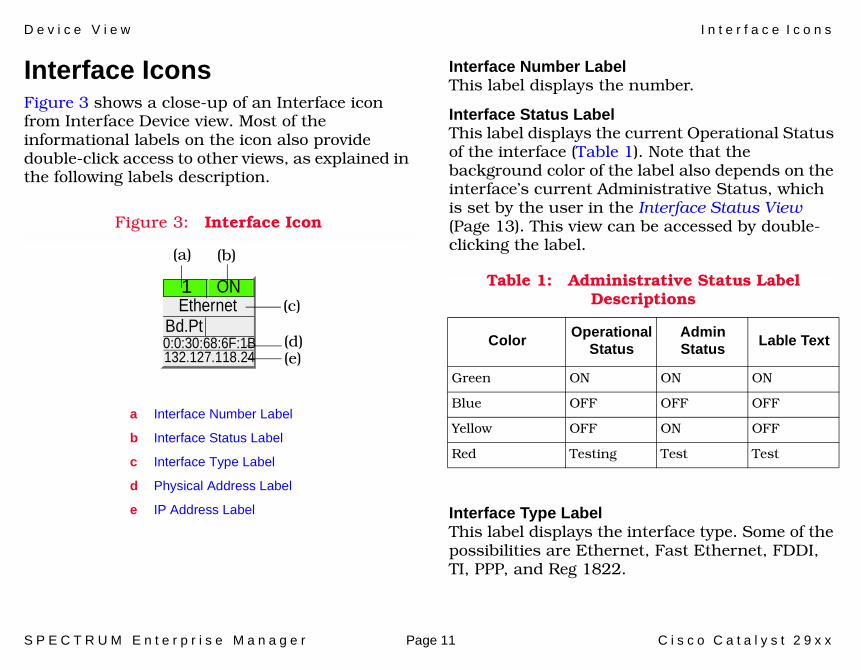
Interface IconsFigure 3 shows a close-up of an Interface icon from Interface Device view. Most of the informational labels on the icon also provide double-click access to other views, as explained in the following labels description.
Figure 3: Interface Icon
Interface Number LabelThis label displays the number.
Interface Status LabelThis label displays the current Operational Status of the interface (Table 1). Note that the background color of the label also depends on the interface’s current Administrative Status, which is set by the user in the Interface Status View (Page 13). This view can be accessed by double-clicking the label.
Interface Type LabelThis label displays the interface type. Some of the possibilities are Ethernet, Fast Ethernet, FDDI, TI, PPP, and Reg 1822.
Ethernet1 ON
0:0:30:68:6F:1B132.127.118.24
a Interface Number Label
b Interface Status Label
c Interface Type Label
d Physical Address Label
e IP Address Label
(a) (b)
(c)
(d)(e)
Bd.Pt
Table 1: Administrative Status Label Descriptions
Color OperationalStatus
AdminStatus Lable Text
Green ON ON ON
Blue OFF OFF OFF
Yellow OFF ON OFF
Red Testing Test Test
D e v i c e V i e w I n t e r f a c e I c o n s
S P E C T R U M E n t e r p r i s e M a n a g e r Page 12 C i s c o C a t a l y s t 2 9 x x
Physical Address LabelThis label displays the physical (MAC) address of this interface. Double-click the label to open the Interface Address Translation Table (Page 39), which cross-references network (IP addresses) to physical (MAC) addresses for selected nodes between networks. Double-clicking on any column entry opens an address-specific Address Translation Table Information view. This view provides the same information as the corresponding row for the IF Address Translation table, but allows you to modify field values.
IP Address LabelThis label displays the IP address for the interface. Double-click the label to open the Secondary Address Panel, which allows you to change the address and mask for this interface.
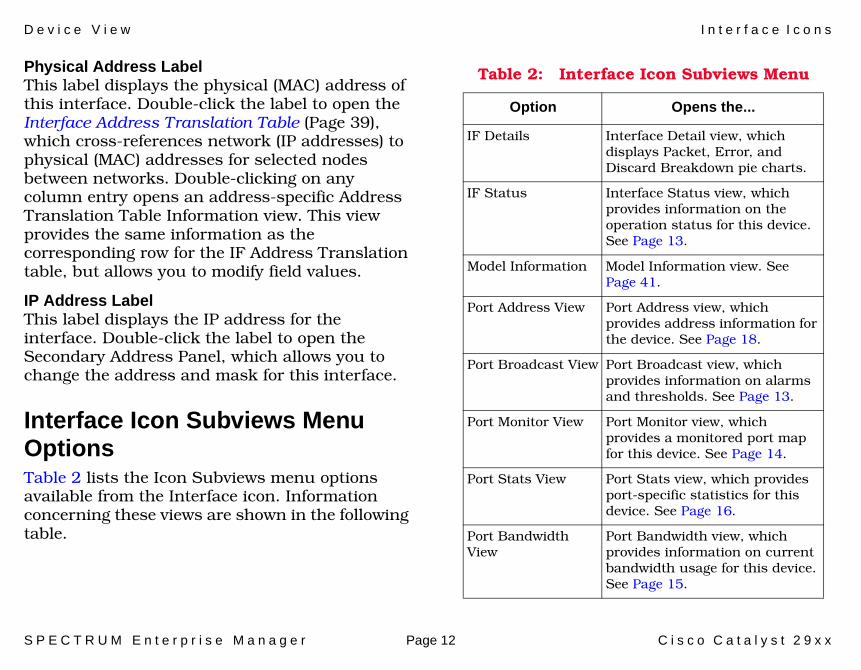
Interface Icon Subviews Menu OptionsTable 2 lists the Icon Subviews menu options available from the Interface icon. Information concerning these views are shown in the following table.
Table 2: Interface Icon Subviews Menu
Option Opens the...
IF Details Interface Detail view, which displays Packet, Error, and Discard Breakdown pie charts.
IF Status Interface Status view, which provides information on the operation status for this device. See Page 13.
Model Information Model Information view. See Page 41.
Port Address View Port Address view, which provides address information for the device. See Page 18.
Port Broadcast View Port Broadcast view, which provides information on alarms and thresholds. See Page 13.
Port Monitor View Port Monitor view, which provides a monitored port map for this device. See Page 14.
Port Stats View Port Stats view, which provides port-specific statistics for this device. See Page 16.
Port Bandwidth View
Port Bandwidth view, which provides information on current bandwidth usage for this device. See Page 15.
D e v i c e V i e w I n t e r f a c e S t a t u s V i e w
S P E C T R U M E n t e r p r i s e M a n a g e r Page 13 C i s c o C a t a l y s t 2 9 x x
Interface Status ViewAccess: From Icon Subviews menu for the Interface icon in the Device view, select IF Status.
This view provides information on the operational status of the interface and allows you to enable or disable the ports.
Operational StatusThe current state of the interface (On, Off, or Testing).
Administrative StatusThis button allows you to select the desired operational state of the interface (On, Off, or Testing).
Port BroadCast ViewAccess: From the Icon Subviews menu for the Interface icon in the Device view, select Port Broadcast View.
This view provides the following information on alarms and thresholds for this port.
Storm ActionThis field indicates what action to take when the broadcast rising threshold for a port is reached. The default action is to stop Broadcast Forwarding for all broadcast frames received from the port, until the broadcast reception rate falls to or below the falling threshold. The other actions are to forward Broadcast as usual, or disable the receiving port.
Falling ThresholdThe broadcast falling threshold is measured in the number of broadcast frames received on a port in a second. When the threshold is crossed and the Storm Action was stopbrdcastfwrding then broadcast forwarding will be re-enabled on the port. For the other values of Storm Action, the crossing the falling threshold has no affect.
Rising ThresholdThe broadcast rising threshold is measured in the number of broadcast frames received on a port in a second. When the number of broadcast frames received per second on this port crosses this
Port Configuration View
Port Configuration view, which provides configuration information for the ports of this device. See Page 35
Table 2: Interface Icon Subviews Menu
Option Opens the...
D e v i c e V i e w P o r t M o n i t o r V i e w
S P E C T R U M E n t e r p r i s e M a n a g e r Page 14 C i s c o C a t a l y s t 2 9 x x
threshold. The appropriate action as specified by the object in the Storm Action field will take place.
Flood Unknown MulticastsSet to true to allow for forwarding to this port of frames addressed to multicast addresses that have not been configured for the port. Set to false to filter and discard such frames.
Storm AlarmIndicates whether an alarm has been generated on this device.
Port Unknown UnicastControls the forwarding of unknown unicast frames to this port. When set to true the switch will, upon receiving a frame with an unknown unicast destination address from another port, transmit the frame to this port. When set to false, the switch will filter and not transmit said frames to this port. Default value is false for ports using the security or monitor application. Default is true for all other applications.
Port Monitor ViewAccess: From the Icon Subviews menu for the Interface icon in the Device view, select Port Monitor View.
This view provides details on ports that you may want to monitor, or stop monitoring.
Switch Port IndexUnique to this switch, this field gives you the port index number for this interface.
Remove Monitor DestAllows you to remove the switch port index of the port you no longer wish to monitor.
Add Monitor DestAllows you to enter the switch port index of the port you wish to monitor.
Monitored Port MapThis read-only field displays all of the ports that are monitored on this device.
D e v i c e V i e w P o r t B a n d w i d t h V i e w
S P E C T R U M E n t e r p r i s e M a n a g e r Page 15 C i s c o C a t a l y s t 2 9 x x
Port Bandwidth ViewAccess: From the Icon Subviews menu for the Interface icon in the Device view, select Port Bandwidth View.
This view presents the following information about the usage of bandwidth, including a Peak Usage table, which is described below.
Current UsageThis field displays the current bandwidth consumed. The measurement unit is in megabits per second (1,000,000 bit/second). This value gives a reasonable estimate of the amount of traffic currently flowing through the switch. Table 3 details the calculations for this field.
Where:The Measurement Interval is the amount of time over which the Octets and Frames were collected, in seconds. Measurement Interval is always one second in current implementation.
Octet is the total number of octets transmitted or received by all network interfaces, excluding
framing data but including FCS. This includes octets in frames which were partially transmitted or received (i.e. due to collisions).
Frames is the total number of frames transmitted or received by all network interfaces, including frames with error.
The number of frames is multiplied by 96 plus 64 in order to estimate the delay between each frame for Ethernet’s IPG and preamble/SFD.
The 2 in the divisor makes this a forwarding bandwidth counter. A frame received on one interface is typically forwarded out another interface. In order to avoid double-counting this frame’s bandwidth, once on the receiving interface and once on the transmitting interface, the total bandwidth is divided by two. Since multicast and broadcast frames can be sent to multiple ports, the above is at best a lower bound.
Max Peak EntriesThe maximum number of entries allowed in the Peak Usage table.
Peak IntervalThis field specifies the length of time which forms a peak bandwidth measurement interval. Writing to this field with any new value restarts the peak bandwidth recording interval used by the Peak Usage table.
Table 3: Current Usage Formula
Octets * 8 + Frames(96+64)
Measurement Interval * 1,000,000 * 2
D e v i c e V i e w P o r t S t a t s V i e w
S P E C T R U M E n t e r p r i s e M a n a g e r Page 16 C i s c o C a t a l y s t 2 9 x x
Peak RestartSet this field to true to clear the Peak Usage table and restart the peak bandwidth recording. No action will be taken if this field is set to false. This field returns false when read.
Current Peak EntryThis field shows a value identifying an instance of the Peak Index (Peak Usage table) where the peak bandwidth estimation is most recent.
Peak Usage TableThis table, within the Port Broadcast view, contains entries regarding peak bandwidth usages in a number of recording intervals. When this table is cleared, entries are added to the table. When the number of entries reaches the maximum found in the Max Peak entries field, the table will reset. Below are a list of the fields found in the Peak Usage table.
Peak IndexThis column displays a number from one up to the Max Peak entries field, identifying a particular Peak Usage entry. This field is a unique index value used only for the peak table.
Start TimeThe time that marks the start of this recording interval.
PeakThe maximum bandwidth usage of any measurement interval within this recording interval. This value is an estimate of the highest amount of traffic flowing through the switch during this recording level. For the calculation of this value, see Current Usage on Page 15.
Peak TimeThis field shows the start time of the measurement interval.
Port Stats ViewAccess: From the Icon Subviews menu for the Interface icon in the Device view, select Port Stats View.
This view contains the following three graphs, which are used to provide port statistics.
• Errors• Received Frames Discarded• Non-Unicast Frames
ErrorsThis graph, in the Port Stats views, displays the following error statistics:
FCS ErrorThe total number of frames received with FCS errors and an integral number of bytes. Unlike
D e v i c e V i e w P o r t S t a t s V i e w
S P E C T R U M E n t e r p r i s e M a n a g e r Page 17 C i s c o C a t a l y s t 2 9 x x
RFC1650’s Stats Errors, this field does not include frames that are less than the minimum packet size (such as collision fragments).
Bad FCS ValuesThe total number of frames whose lengths are less than 64 abd which gave bad FCS values. The preamble and the sfd fields are excluded from the byte count of a frame while the FCS field is included.
Received Frames DiscardedThis graph, in the Port Stats view, displays the following statistics for traveling packets that were either sent or received on this port:
No BandWidthA count of frames received on this port that were discarded due to the lack of bandwidth resources in the Catalyst Switch forwarding engine.
No BufferA count of buffered frames that were discarded due to a lack of frame buffer resources in the Catalyst Switch forwarding engine.
No Destination Unicast
A count of unicast frames received that were dis-carded, because the forwarding rule stipulates that they are not being forwarded.
No Destination MulticastA count of frames received that were discarded, because they have not been configured for the port.
Non-Unicast FramesThis graph, in the Port Stats view, displays the following statistics for non-unicast frames transmitted over this port:
Tx MulticastA count of frames that successfully transmitted and are directed to a multicast address.
Tx BroadcastA count of frames that successfully transmitted and are directed to the broadcast address.
Note:Note:
FCS or Frame Check Sequence is defined by Cisco as “extra characters added to a frame for error control purposes.” FCS works with HDLC, Frame Relay, and other data link protocols.
D e v i c e V i e w P o r t A d d r e s s V i e w
S P E C T R U M E n t e r p r i s e M a n a g e r Page 18 C i s c o C a t a l y s t 2 9 x x
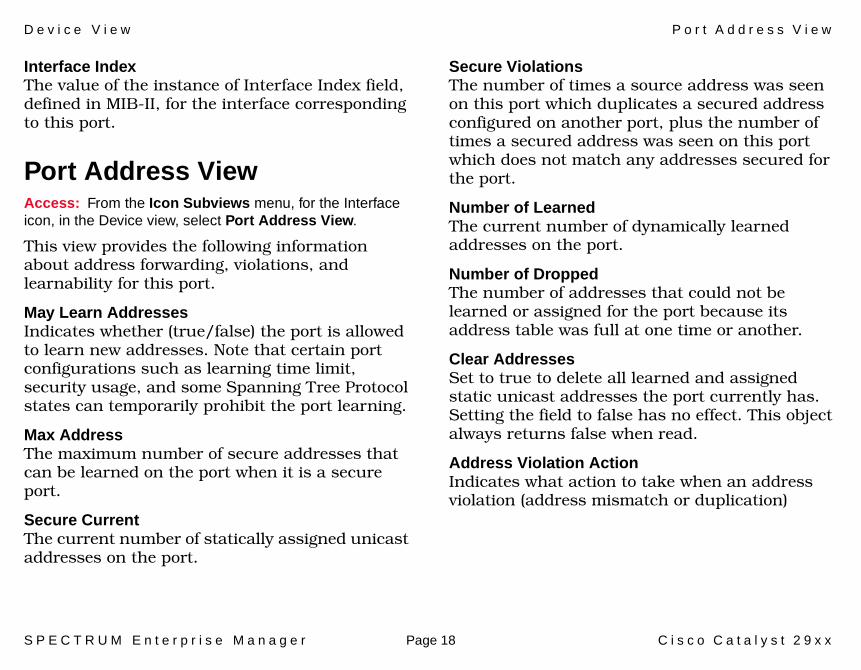
Interface IndexThe value of the instance of Interface Index field, defined in MIB-II, for the interface corresponding to this port.
Port Address ViewAccess: From the Icon Subviews menu, for the Interface icon, in the Device view, select Port Address View.
This view provides the following information about address forwarding, violations, and learnability for this port.
May Learn AddressesIndicates whether (true/false) the port is allowed to learn new addresses. Note that certain port configurations such as learning time limit, security usage, and some Spanning Tree Protocol states can temporarily prohibit the port learning.
Max AddressThe maximum number of secure addresses that can be learned on the port when it is a secure port.
Secure CurrentThe current number of statically assigned unicast addresses on the port.
Secure ViolationsThe number of times a source address was seen on this port which duplicates a secured address configured on another port, plus the number of times a secured address was seen on this port which does not match any addresses secured for the port.
Number of LearnedThe current number of dynamically learned addresses on the port.
Number of DroppedThe number of addresses that could not be learned or assigned for the port because its address table was full at one time or another.
Clear AddressesSet to true to delete all learned and assigned static unicast addresses the port currently has. Setting the field to false has no effect. This object always returns false when read.
Address Violation ActionIndicates what action to take when an address violation (address mismatch or duplication)
D e v i c e V i e w M o d u l e T a b l e
S P E C T R U M E n t e r p r i s e M a n a g e r Page 19 C i s c o C a t a l y s t 2 9 x x
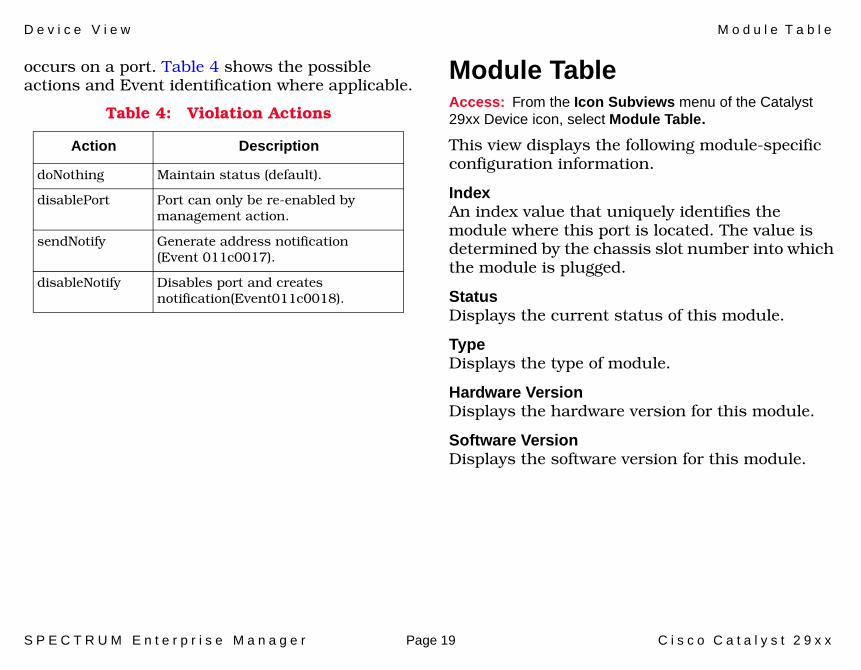
occurs on a port. Table 4 shows the possible actions and Event identification where applicable.
Module Table Access: From the Icon Subviews menu of the Catalyst 29xx Device icon, select Module Table.
This view displays the following module-specific configuration information.
IndexAn index value that uniquely identifies the module where this port is located. The value is determined by the chassis slot number into which the module is plugged.
StatusDisplays the current status of this module.
TypeDisplays the type of module.
Hardware VersionDisplays the hardware version for this module.
Software VersionDisplays the software version for this module.
Table 4: Violation Actions
Action Description
doNothing Maintain status (default).
disablePort Port can only be re-enabled by management action.
sendNotify Generate address notification (Event 011c0017).
disableNotify Disables port and creates notification(Event011c0018).
S P E C T R U M E n t e r p r i s e M a n a g e r Page 20 C i s c o C a t a l y s t 2 9 x x
Device Topology View
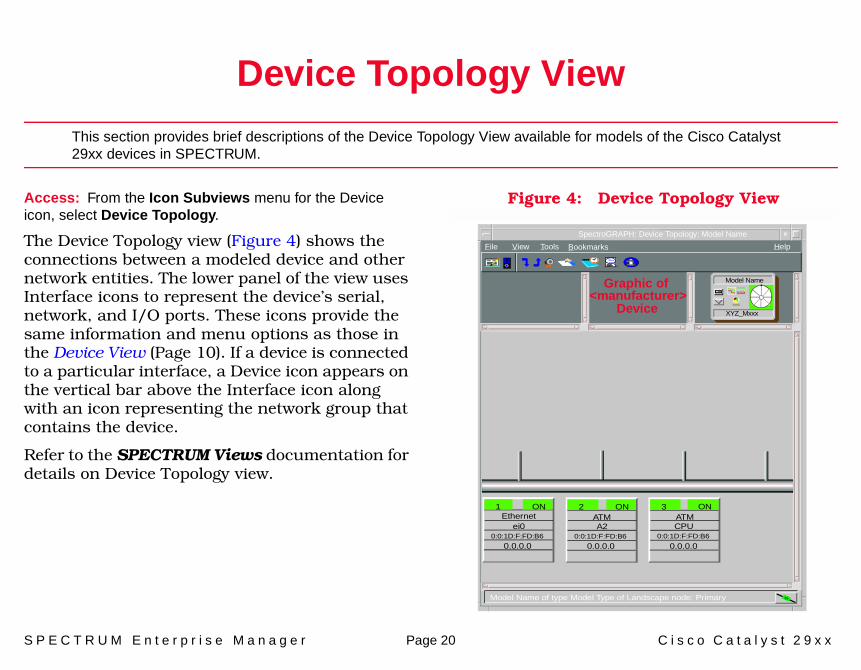
This section provides brief descriptions of the Device Topology View available for models of the Cisco Catalyst 29xx devices in SPECTRUM.
Access: From the Icon Subviews menu for the Device icon, select Device Topology.
The Device Topology view (Figure 4) shows the connections between a modeled device and other network entities. The lower panel of the view uses Interface icons to represent the device’s serial, network, and I/O ports. These icons provide the same information and menu options as those in the Device View (Page 10). If a device is connected to a particular interface, a Device icon appears on the vertical bar above the Interface icon along with an icon representing the network group that contains the device.
Refer to the SPECTRUM Views documentation for details on Device Topology view.
Figure 4: Device Topology View
File View HelpTools
1Ethernet
0:0:1D:F:FD:B6ei0
0.0.0.0
ON 2ATM
0:0:1D:F:FD:B6A2
0.0.0.0
ON 3ATM
0:0:1D:F:FD:B6CPU
0.0.0.0
ON
XYZ_Mxxx
Model Name
Bookmarks
SpectroGRAPH: Device Topology: Model Name
Graphic of<manufacturer>
Device
Model Name of type Model Type of Landscape node: Primary
S P E C T R U M E n t e r p r i s e M a n a g e r Page 21 C i s c o C a t a l y s t 2 9 x x
Application Views
This section describes the main Application view and the associated application-specific subviews available for models of the Cisco Catalyst 29xx devices in SPECTRUM.
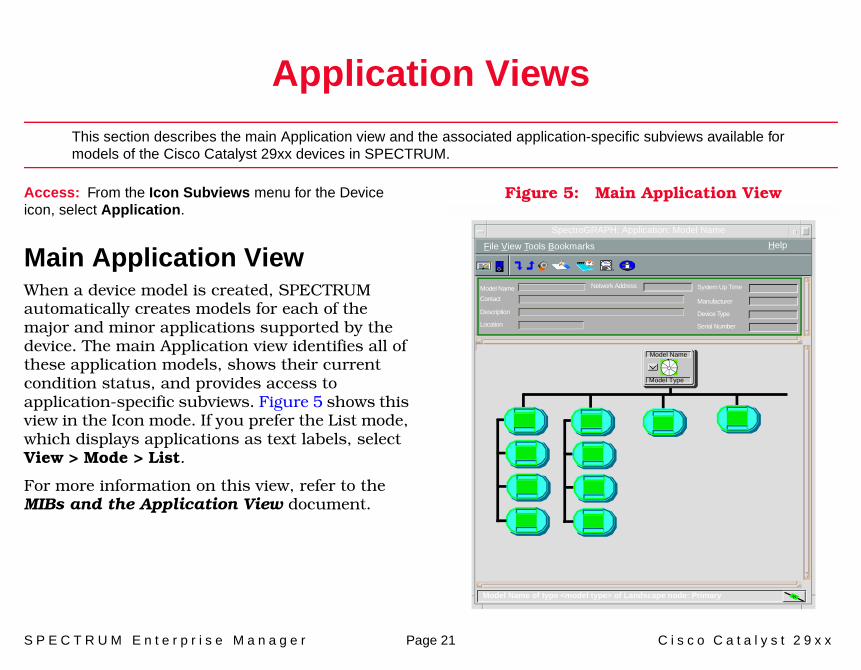
Access: From the Icon Subviews menu for the Device icon, select Application.
Main Application ViewWhen a device model is created, SPECTRUM automatically creates models for each of the major and minor applications supported by the device. The main Application view identifies all of these application models, shows their current condition status, and provides access to application-specific subviews. Figure 5 shows this view in the Icon mode. If you prefer the List mode, which displays applications as text labels, select View > Mode > List.
For more information on this view, refer to the MIBs and the Application View document.
Figure 5: Main Application View
SpectroGRAPH: Application: Model Name
Model Name
Contact
Description
Location
Network Address System Up Time
Manufacturer
Device Type
Serial Number
Model Name
6E132_25
Model Name
Model Type
File View Tools Bookmarks
Model Name of type <model type> of Landscape node: Primary
Help
A p p l i c a t i o n V i e w s S u p p o r t e d A p p l i c a t i o n s
S P E C T R U M E n t e r p r i s e M a n a g e r Page 22 C i s c o C a t a l y s t 2 9 x x
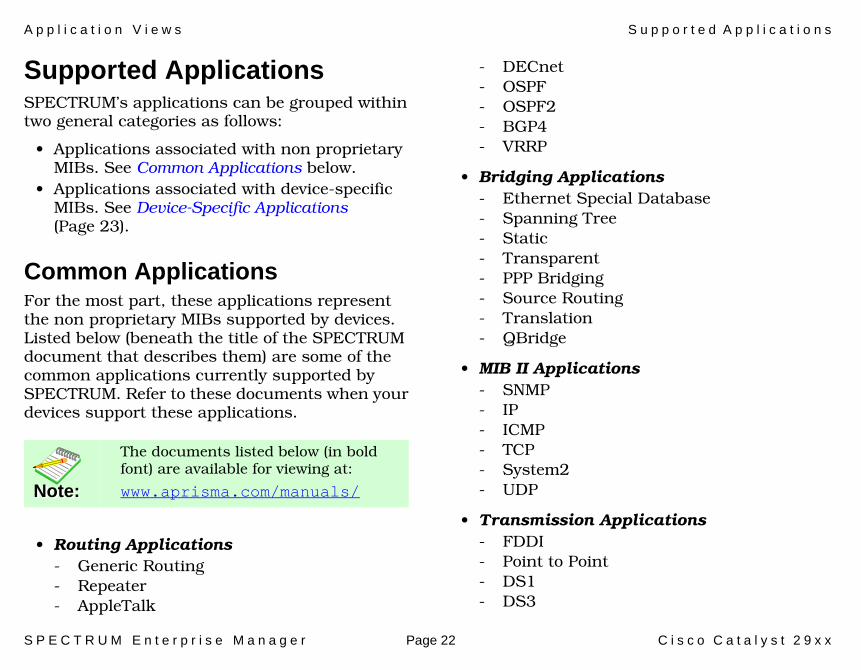
Supported ApplicationsSPECTRUM’s applications can be grouped within two general categories as follows:
• Applications associated with non proprietary MIBs. See Common Applications below.
• Applications associated with device-specific MIBs. See Device-Specific Applications (Page 23).
Common ApplicationsFor the most part, these applications represent the non proprietary MIBs supported by devices. Listed below (beneath the title of the SPECTRUM document that describes them) are some of the common applications currently supported by SPECTRUM. Refer to these documents when your devices support these applications.
• Routing Applications- Generic Routing- Repeater- AppleTalk
- DECnet- OSPF- OSPF2- BGP4- VRRP
• Bridging Applications- Ethernet Special Database- Spanning Tree- Static- Transparent- PPP Bridging- Source Routing- Translation- QBridge
• MIB II Applications- SNMP- IP- ICMP- TCP- System2- UDP
• Transmission Applications- FDDI- Point to Point- DS1- DS3
Note:Note:
The documents listed below (in bold font) are available for viewing at:
www.aprisma.com/manuals/
A p p l i c a t i o n V i e w s S u p p o r t e d A p p l i c a t i o n s
S P E C T R U M E n t e r p r i s e M a n a g e r Page 23 C i s c o C a t a l y s t 2 9 x x
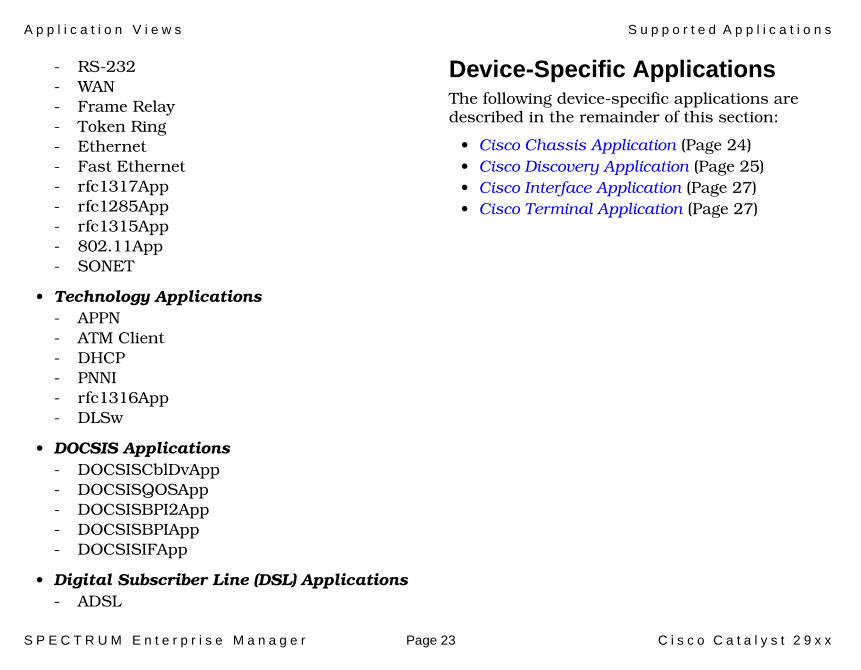
- RS-232- WAN- Frame Relay- Token Ring- Ethernet- Fast Ethernet- rfc1317App- rfc1285App- rfc1315App- 802.11App- SONET
• Technology Applications- APPN- ATM Client- DHCP- PNNI- rfc1316App- DLSw
• DOCSIS Applications- DOCSISCblDvApp - DOCSISQOSApp- DOCSISBPI2App - DOCSISBPIApp - DOCSISIFApp
• Digital Subscriber Line (DSL) Applications- ADSL
Device-Specific ApplicationsThe following device-specific applications are described in the remainder of this section:
• Cisco Chassis Application (Page 24)• Cisco Discovery Application (Page 25)• Cisco Interface Application (Page 27)• Cisco Terminal Application (Page 27)
A p p l i c a t i o n V i e w s C i s c o C h a s s i s A p p l i c a t i o n
S P E C T R U M E n t e r p r i s e M a n a g e r Page 24 C i s c o C a t a l y s t 2 9 x x
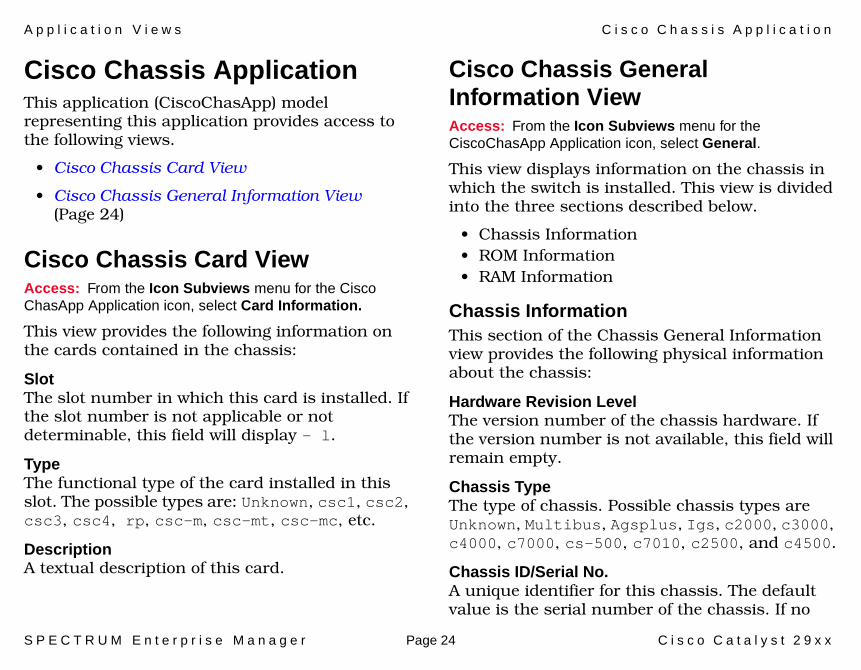
Cisco Chassis ApplicationThis application (CiscoChasApp) model representing this application provides access to the following views.
• Cisco Chassis Card View
• Cisco Chassis General Information View (Page 24)
Cisco Chassis Card ViewAccess: From the Icon Subviews menu for the Cisco ChasApp Application icon, select Card Information.
This view provides the following information on the cards contained in the chassis:
SlotThe slot number in which this card is installed. If the slot number is not applicable or not determinable, this field will display - l.
TypeThe functional type of the card installed in this slot. The possible types are: Unknown, csc1, csc2, csc3, csc4, rp, csc-m, csc-mt, csc-mc, etc.
DescriptionA textual description of this card.
Cisco Chassis General Information ViewAccess: From the Icon Subviews menu for the CiscoChasApp Application icon, select General.
This view displays information on the chassis in which the switch is installed. This view is divided into the three sections described below.
• Chassis Information• ROM Information• RAM Information
Chassis InformationThis section of the Chassis General Information view provides the following physical information about the chassis:
Hardware Revision LevelThe version number of the chassis hardware. If the version number is not available, this field will remain empty.
Chassis TypeThe type of chassis. Possible chassis types are Unknown, Multibus, Agsplus, Igs, c2000, c3000, c4000, c7000, cs-500, c7010, c2500, and c4500.
Chassis ID/Serial No.A unique identifier for this chassis. The default value is the serial number of the chassis. If no
A p p l i c a t i o n V i e w s C i s c o D i s c o v e r y A p p l i c a t i o n
S P E C T R U M E n t e r p r i s e M a n a g e r Page 25 C i s c o C a t a l y s t 2 9 x x
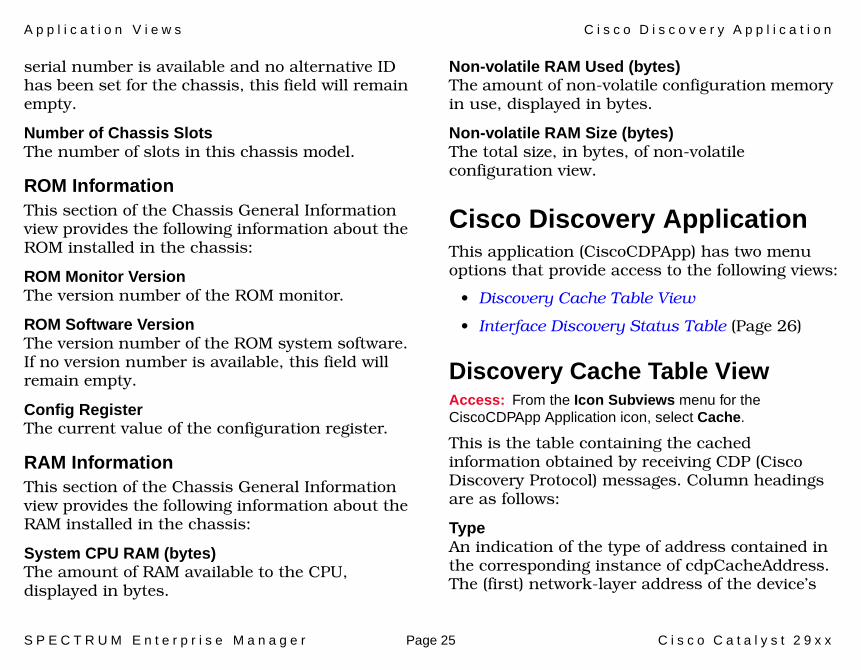
serial number is available and no alternative ID has been set for the chassis, this field will remain empty.
Number of Chassis SlotsThe number of slots in this chassis model.
ROM InformationThis section of the Chassis General Information view provides the following information about the ROM installed in the chassis:
ROM Monitor VersionThe version number of the ROM monitor.
ROM Software VersionThe version number of the ROM system software. If no version number is available, this field will remain empty.
Config RegisterThe current value of the configuration register.
RAM InformationThis section of the Chassis General Information view provides the following information about the RAM installed in the chassis:
System CPU RAM (bytes)The amount of RAM available to the CPU, displayed in bytes.
Non-volatile RAM Used (bytes)The amount of non-volatile configuration memory in use, displayed in bytes.
Non-volatile RAM Size (bytes)The total size, in bytes, of non-volatile configuration view.
Cisco Discovery ApplicationThis application (CiscoCDPApp) has two menu options that provide access to the following views:
• Discovery Cache Table View
• Interface Discovery Status Table (Page 26)
Discovery Cache Table ViewAccess: From the Icon Subviews menu for the CiscoCDPApp Application icon, select Cache.
This is the table containing the cached information obtained by receiving CDP (Cisco Discovery Protocol) messages. Column headings are as follows:
TypeAn indication of the type of address contained in the corresponding instance of cdpCacheAddress. The (first) network-layer address of the device’s
A p p l i c a t i o n V i e w s C i s c o D i s c o v e r y A p p l i c a t i o n
S P E C T R U M E n t e r p r i s e M a n a g e r Page 26 C i s c o C a t a l y s t 2 9 x x
SNMP-agent as reported in the most recent CDP message.
Device IDThe Device-ID string as reported in the most recent CDP message. The zero-length string indicates no Device-ID field was reported in the most recent CDP message.
Device PortThe Port-ID string as reported in the most recent CDP message. This will typically be the value of the ifName object (e.g., Ethernet0) The zero-length string indicates no Port-ID field was reported in the most recent CDP message.
PlatformThe device’s hardware platform as reported in the most recent CDP message. The zero-length string indicates that no Platform field was reported in the most recent CDP message.
CapabilitiesThe device’s functional capabilities as reported in the most recent CDP message. For the latest set of specific values, see the latest version of the CDP specification. A zero-length string indicates no Capabilities field was reported in the most recent CDP message.
Interface Discovery Status TableAccess: From the Icon Subviews menu for the Cisco CDPApp Application icon, select Interfaces.
This is the table containing the status of Cisco Dicovery Protocol on the device’s interfaces.
DiscoveryAn indication of whether the CDP is currently running on this interface.
GroupThis column is only relevant to interfaces which are repeater ports on 802.3 repeaters. In this situation, it indicates the RFC1516 group number of the repeater port which corresponds to this interface.
PortThis column is only relevant to interfaces which are repeater ports on 802.3 repeaters. In this situation, it indicates the RFC1516 port number of the repeater port which corresponds to this interface.

A p p l i c a t i o n V i e w s C i s c o I n t e r f a c e A p p l i c a t i o n
S P E C T R U M E n t e r p r i s e M a n a g e r Page 27 C i s c o C a t a l y s t 2 9 x x
Cisco Interface ApplicationAccess: From the Icon Subviews menu of the CiscoIFApp icon, select Configuration.
This application model type (CiscoIFApp) provides access to the application-specific Configuration view. The CiscoIFApp Configuration opens giving you the choices to Create Interface application and/or Create Sub Interface applications.
Cisco Terminal ApplicationThe Cisco Terminal Server Application (CiscoTSApp) provides access to the following application-specific views:
• Cisco Terminal Server Line View
• Cisco Terminal Server Session View (Page 29)
Cisco Terminal Server Line ViewAccess: From the Icon Subviews menu for the CiscoTSApp Application icon, select Line Table.
This view displays the following information on each terminal server line connected to the Cisco Router.
StatusThe current state of this line. Possible states are Active and Inactive.
TypeThe type of line. Possible types are: Unknown, Console, Terminal, Line-Printer, Virtual-Terminal, and Auxiliary.
AutobaudWhether the line will autobaud or not.
Speed InThe input speed of this line, displayed as a baud rate.
Speed OutThe output speed of this line, displayed as a baud rate.
Flow ControlThe type of flow control in use on this line. Possible flow control types are Unknown, None, Software-Input, Software-Output, Software-

A p p l i c a t i o n V i e w s C i s c o T e r m i n a l A p p l i c a t i o n
S P E C T R U M E n t e r p r i s e M a n a g e r Page 28 C i s c o C a t a l y s t 2 9 x x
Both, Hardware-Input, Hardware-Output, and Hardware-Both.
Modem ControlThe type of modem control in use on this line. Possible modem control types are: Unknown, None, Call-In, Call-Out, CTS-Required, RI-IS-CD, and InOut.
LocationThe physical location of this line.
Term TypeThe type of terminal on this line.
Length in LinesLength, in lines, of the terminal’s screen attached to this line.
Width in CharWidth, in characters, of the terminal’s screen attached to this line.
Escape CharEscape character used to break out of the active session.
Idle Time outThe amount of idle time allowed on this line before the line times out.
Session Time outThe amount of idle time allowed in this session before the session times out.
RotaryThe number of the rotary group the line belongs.
# of ConnectionsThe number of times a connection has been made to or from this line.
Current SessionThe current number of sessions in use on this line.
UserTACACS user name, if TACACS is enabled.
NoiseCount of garbage characters received when the line is inactive.
Line NumberThe number (listed in sequential order) for this terminal server line.
Time ActiveThe time, in seconds, since the line was activated.
A p p l i c a t i o n V i e w s C i s c o T e r m i n a l A p p l i c a t i o n
S P E C T R U M E n t e r p r i s e M a n a g e r Page 29 C i s c o C a t a l y s t 2 9 x x
Cisco Terminal Server Session ViewAccess: From the Icon Subviews menu for the CiscoTSapp Application icon, select Session Table.
This view displays the Terminal Server (TS) Session Table, which provides the following information about each terminal server session connected to the Cisco Router:
TypeThe type of this session. Possible types are: Unknown, Pad, Stream, Rlogin, Telnet, and TCP.
DirectionThe direction of this session. Possible directions are: Unknown, Incoming, and Outgoing.
AddrThe remote host address of the session.
Name The remote host name of the session.
StateThe indicator of whether this session is the currently active session. Possible states are Inactive and Active.
IdleTime in seconds that the session has been idle.
LineThe index value of the hosting session.
SessionA second index value that identifies this session.
S P E C T R U M E n t e r p r i s e M a n a g e r Page 30 C i s c o C a t a l y s t 2 9 x x
Performance Views
This section provides brief descriptions of the Performance views available for models of the Cisco Catalyst 29xx devices in SPECTRUM.
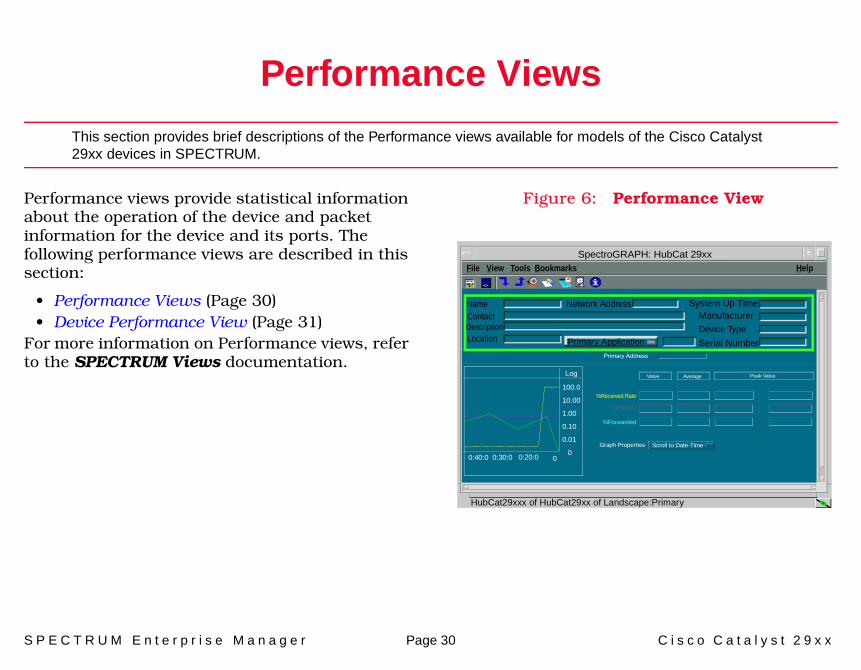
Performance views provide statistical information about the operation of the device and packet information for the device and its ports. The following performance views are described in this section:
• Performance Views (Page 30)• Device Performance View (Page 31)
For more information on Performance views, refer to the SPECTRUM Views documentation.
Figure 6: Performance View
Log
100.0
10.00
1.00
0.10
0.01
000:40:0 0:30:0 0:20:0
Value Average Peak Value
%Filtered
%Forwarded
Graph Properties Scroll to Date-Time
SpectroGRAPH: HubCat 29xx
Primary Application
System Up TimeManufacturer
Device Type
Serial Number
Network Address
%Received Rate
NameContactDescriptionLocation
File View Help
Primary Address
Tools Bookmarks
HubCat29xxx of HubCat29xx of Landscape:Primary
P e r f o r m a n c e V i e w s P e r f o r m a n c e V i e w
S P E C T R U M E n t e r p r i s e M a n a g e r Page 31 C i s c o C a t a l y s t 2 9 x x
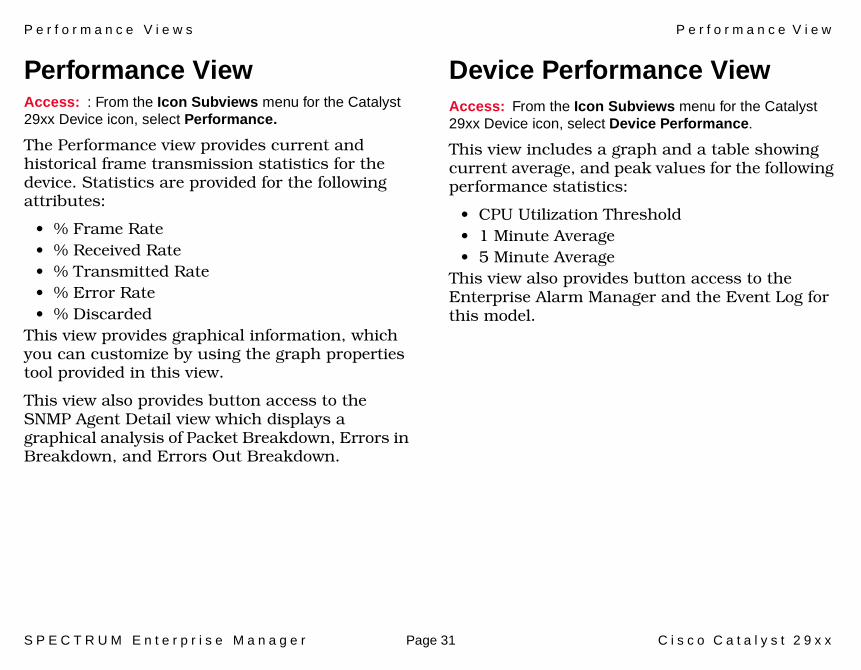
Performance ViewAccess: : From the Icon Subviews menu for the Catalyst 29xx Device icon, select Performance.
The Performance view provides current and historical frame transmission statistics for the device. Statistics are provided for the following attributes:
• % Frame Rate• % Received Rate• % Transmitted Rate• % Error Rate• % Discarded
This view provides graphical information, which you can customize by using the graph properties tool provided in this view.
This view also provides button access to the SNMP Agent Detail view which displays a graphical analysis of Packet Breakdown, Errors in Breakdown, and Errors Out Breakdown.
Device Performance ViewAccess: From the Icon Subviews menu for the Catalyst 29xx Device icon, select Device Performance.
This view includes a graph and a table showing current average, and peak values for the following performance statistics:
• CPU Utilization Threshold• 1 Minute Average• 5 Minute Average
This view also provides button access to the Enterprise Alarm Manager and the Event Log for this model.
S P E C T R U M E n t e r p r i s e M a n a g e r Page 32 C i s c o C a t a l y s t 2 9 x x
Configuration Views
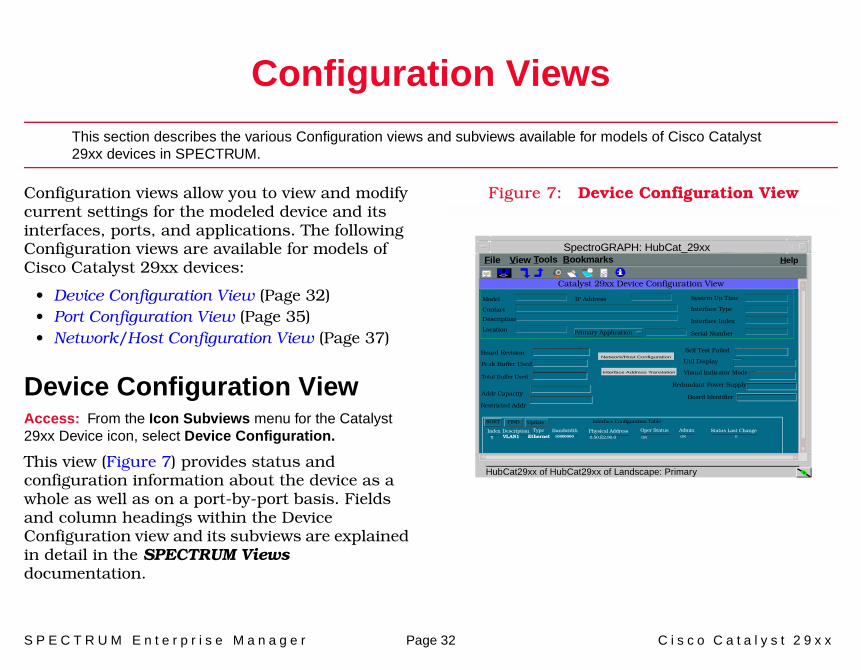
This section describes the various Configuration views and subviews available for models of Cisco Catalyst 29xx devices in SPECTRUM.
Configuration views allow you to view and modify current settings for the modeled device and its interfaces, ports, and applications. The following Configuration views are available for models of Cisco Catalyst 29xx devices:
• Device Configuration View (Page 32)• Port Configuration View (Page 35)• Network/Host Configuration View (Page 37)
Device Configuration ViewAccess: From the Icon Subviews menu for the Catalyst 29xx Device icon, select Device Configuration.
This view (Figure 7) provides status and configuration information about the device as a whole as well as on a port-by-port basis. Fields and column headings within the Device Configuration view and its subviews are explained in detail in the SPECTRUM Views documentation.
Figure 7: Device Configuration View
SpectroGRAPH: HubCat_29xx
Primary Application
System Up Time
Interface Type
Interface Index
Serial Number
IP AddressModel
Contact
Description
Location
File View Help
Peak Buffer Used
Restricted Addr
Board Revision
Total Buffer Used
Addr Capacity
Catalyst 29xx Device Configuration View
SORT FIND Update Interface Configuration Table
Index Description Type Bandwidth Physical Address Oper Status Admin Status Last Change
1 VLAN1 Ethernet 10000000 0.50.E2.90.0 ON ON 0
Self Test Failed
Util Display
Visual Indicator Mode
Redundant Power Supply
Board Identifier
Network/Host Configuration
Interface Address Translation
Tools Bookmarks
HubCat29xx of HubCat29xx of Landscape: Primary

C o n f i g u r a t i o n V i e w s D e v i c e C o n f i g u r a t i o n V i e w
S P E C T R U M E n t e r p r i s e M a n a g e r Page 33 C i s c o C a t a l y s t 2 9 x x
The following fields provide device-specific configuration information:
Board RevisionThis field allows the user to return the revision number of the main board on which the FastSwitch firmware resides.
Peak Buffers UsedThe maximum number of 64-byte buffers used in the main switch buffer pool.
Total Buffer DepthThis represents the total number of 64-byte buffers used in the Ethernet control.
Address CapacityThe system-wide maximum number of MAC addresses supported in the address table, a primary resource when forwarding frames through a bridge. The address table is dynamically updated with new learned addresses inserted and aged addresses removed. The address capacity represented by this object includes dynamic, secure, and static address types. To ensure optimal performance, the number of MAC addresses in the bridged local area network to which this bridge is connected should be less than the value of this field.
Restricted Static AddrThe system-wide number of static addresses supported. A static address is one that has explicit source port filtering information assigned.
Self Test FailedA bit array where the presence of a particular bit indicates a failure of a specific Power On Self Test.
Util Display The number of utilization meter LEDs currently lit on the front panel. LEDs are lit as more total bandwidth through the switch is utilized. If the number of this field is not four you will see a zero in the Visual Indicator Mode.
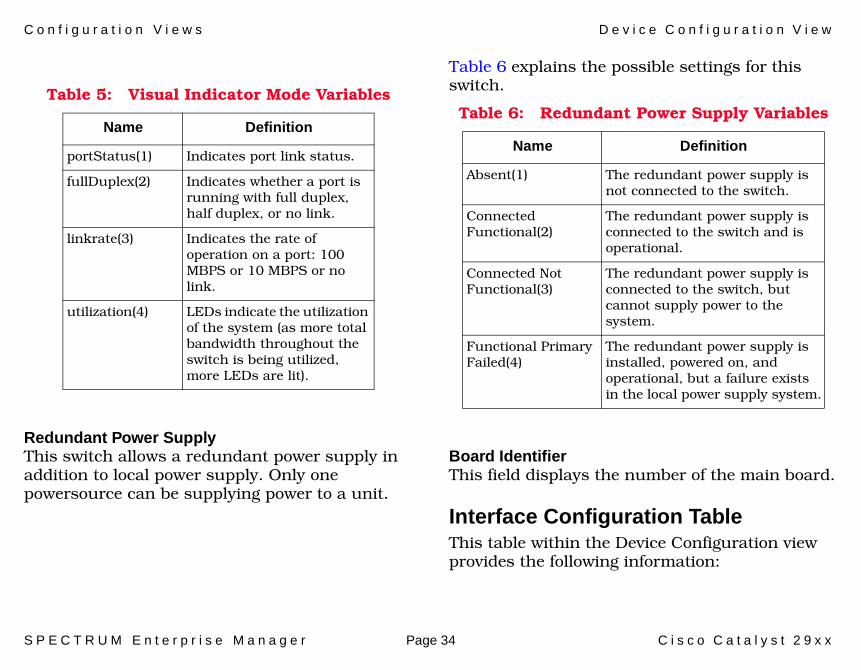
Visual Indicator ModeThe currently selected visual indication mode (see Table 5).
C o n f i g u r a t i o n V i e w s D e v i c e C o n f i g u r a t i o n V i e w
S P E C T R U M E n t e r p r i s e M a n a g e r Page 34 C i s c o C a t a l y s t 2 9 x x
Redundant Power SupplyThis switch allows a redundant power supply in addition to local power supply. Only one powersource can be supplying power to a unit.
Table 6 explains the possible settings for this switch.
Board IdentifierThis field displays the number of the main board.
Interface Configuration TableThis table within the Device Configuration view provides the following information:
Table 5: Visual Indicator Mode Variables
Name Definition
portStatus(1) Indicates port link status.
fullDuplex(2) Indicates whether a port is running with full duplex, half duplex, or no link.
linkrate(3) Indicates the rate of operation on a port: 100 MBPS or 10 MBPS or no link.
utilization(4) LEDs indicate the utilization of the system (as more total bandwidth throughout the switch is being utilized, more LEDs are lit).
Table 6: Redundant Power Supply Variables
Name Definition
Absent(1) The redundant power supply is not connected to the switch.
Connected Functional(2)
The redundant power supply is connected to the switch and is operational.
Connected Not Functional(3)
The redundant power supply is connected to the switch, but cannot supply power to the system.
Functional Primary Failed(4)
The redundant power supply is installed, powered on, and operational, but a failure exists in the local power supply system.
C o n f i g u r a t i o n V i e w s P o r t C o n f i g u r a t i o n V i e w
S P E C T R U M E n t e r p r i s e M a n a g e r Page 35 C i s c o C a t a l y s t 2 9 x x
Number of InterfacesThe number of interfaces available from the module.
IndexThe numerical value identifying the port.
DescriptionA textual description of the port.
TypeThe type of hardware interface for the port.
BandwidthThe estimated bandwidth of the interface measured in bits per second. For interfaces that do not vary in bandwidth, or for which no accurate estimate can be made, a nominal bandwidth, is provided.
Physical AddressThe MAC address of the port.
Oper StatusThe current operational state of the port (Up, Down, or Testing).
Admin StatusThe administrative status for this interface. Possible states are: On, Off, and Testing.
Last ChangeThe value of sysUPTime at the time of the interface entered its core operational state. If the current state was entered prior to the last reinitialization of the local network management subsystem, then this object contains a zero value.
Queue LengthThe length of the outbound packet queue in packets.
Packet SizeThe largest Maximum Transmission Unit (MTU) that can be transmitted or received by the port, measured in octets.
Port Configuration ViewAccess: From the Device Interface Icon Subviews menu, select Port Configuration.
This view displays the following port-specific MIB information for the module.
Group IndexApplies only when the corresponding Catalyst 29xx PortUsageApplication is port grouping. Ports assigned with the same value belong to the same connection channel.
C o n f i g u r a t i o n V i e w s P o r t C o n f i g u r a t i o n V i e w
S P E C T R U M E n t e r p r i s e M a n a g e r Page 36 C i s c o C a t a l y s t 2 9 x x
May ForwardThis button reflects the internal state of the port with regard to its ability to forward frames. A port sometimes stops forwarding when it is blocked by the Spanning Tree Protocol, or while it is undergoing temporary load balancing as part of the port group usage. This object is true (forwarding) if the port is allowed to forward frames. It is false (unforwarding) otherwise.
Admin StatusDisplays the aging interval in milliseconds after which old frames queued for transmission on this part are discarded.
Linkbeat StatusDisplays the current linkbeat status which depends on the physical layer in use. This field will also tell you if the physical link between two devices is properly configured or not.
Test ResultIndicates if the port passed or failed the power self test.
Buffer Congestion ThresholdThe port buffer congestion threshold provides an early warning to the switch that the port is about to exhaust all its guaranteed buffers, leading to congestion. This threshold is expressed as a percentage of the port’s total guaranteed buffer
depth. Once this threshold has been crossed, the switch begins colliding with frames received on the port for a fixed period of time. After this time has expired, the switch determines whether the port’s buffer congestion has been alleviated. If this situation has not changed, the switch resumes this congestion control algorithm on the port.
Usage ApplicationIndicates how the port is to be used. These applications are defined such that they are mutually exclusive. In other words, a port using the security cannot use the monitoring application at the same time. The default usage is standard, or no special behavior (the port behaves as a normal switched port). The monitor usage provides network diagnosis by reflecting traffic on other ports to this port. The portGrouping application treats this and other ports in the same group as one (inter-switch) connection for more bandwidth potential.
Duplex StateIndicates the duplex modes supported by this port.
Duplex StatusThe administrative status requested by management for the duplex of this port. The value of halfduplex indicates that if Auto-Negotiation is

C o n f i g u r a t i o n V i e w s N e t w o r k / H o s t C o n f i g u r a t i o n V i e w
S P E C T R U M E n t e r p r i s e M a n a g e r Page 37 C i s c o C a t a l y s t 2 9 x x
disabled for this port, that the port will operate in halfduplex mode. The same is true for fullduplex provided that the port supports these variables.
Admin SpeedIndicates the administrative status requested by management for the speed of this port. The value of tenmegabit(2) indicates that if the Auto-Negotiation is disabled for this port, that the port will operate at speed of 10 megabits per second. The value of hundredmegabit(3) indicates that the Auto-Negotiation will operate at 100 megabits per second. The gigabit(4) indicates that the Auto-Negotiation will operate at 1000 megabits per second.
Network/Host Configuration ViewAccess: From the Device Configuration views, click the Network/Host Configuration button.
The view allow you to transfer the network/host configuration file information between hosts and servers. It contains two main areas as described below.
Network ConfigurationThis section of the Device Configuration view allows you to perform transfers of the network configuration file, which contains commands that apply to all network servers and terminal services on a network host/server.
Previous Host AddrProvides the address of the host that supplied the network configuration file for the managed device.
Previous File NameProvides the name of the network configuration file that resides on managed devices.
New Host AddrReplaces the Previous Host Addr field (when the Upload Net Config File is selected).
New File NameReplaces the Previous File Name field (when the Upload Net Config File is selected).
Initiates the transfer of configuration file from host to server.
TFTP Server AddrSend the configuration file from server to a host.
Upload Net Config File
C o n f i g u r a t i o n V i e w s N e t w o r k / H o s t C o n f i g u r a t i o n V i e w
S P E C T R U M E n t e r p r i s e M a n a g e r Page 38 C i s c o C a t a l y s t 2 9 x x
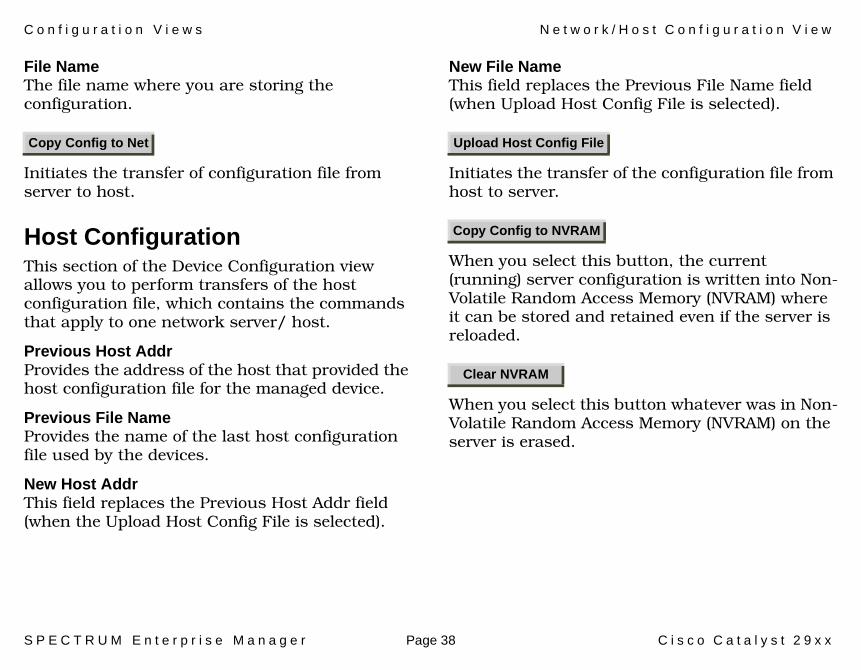
File NameThe file name where you are storing the configuration.
Initiates the transfer of configuration file from server to host.
Host ConfigurationThis section of the Device Configuration view allows you to perform transfers of the host configuration file, which contains the commands that apply to one network server/ host.
Previous Host AddrProvides the address of the host that provided the host configuration file for the managed device.
Previous File NameProvides the name of the last host configuration file used by the devices.
New Host AddrThis field replaces the Previous Host Addr field (when the Upload Host Config File is selected).
New File NameThis field replaces the Previous File Name field (when Upload Host Config File is selected).
Initiates the transfer of the configuration file from host to server.
When you select this button, the current (running) server configuration is written into Non-Volatile Random Access Memory (NVRAM) where it can be stored and retained even if the server is reloaded.
When you select this button whatever was in Non-Volatile Random Access Memory (NVRAM) on the server is erased.
Copy Config to Net Upload Host Config File
Copy Config to NVRAM
Clear NVRAM
C o n f i g u r a t i o n V i e w s N e t w o r k / H o s t C o n f i g u r a t i o n V i e w
S P E C T R U M E n t e r p r i s e M a n a g e r Page 39 C i s c o C a t a l y s t 2 9 x x
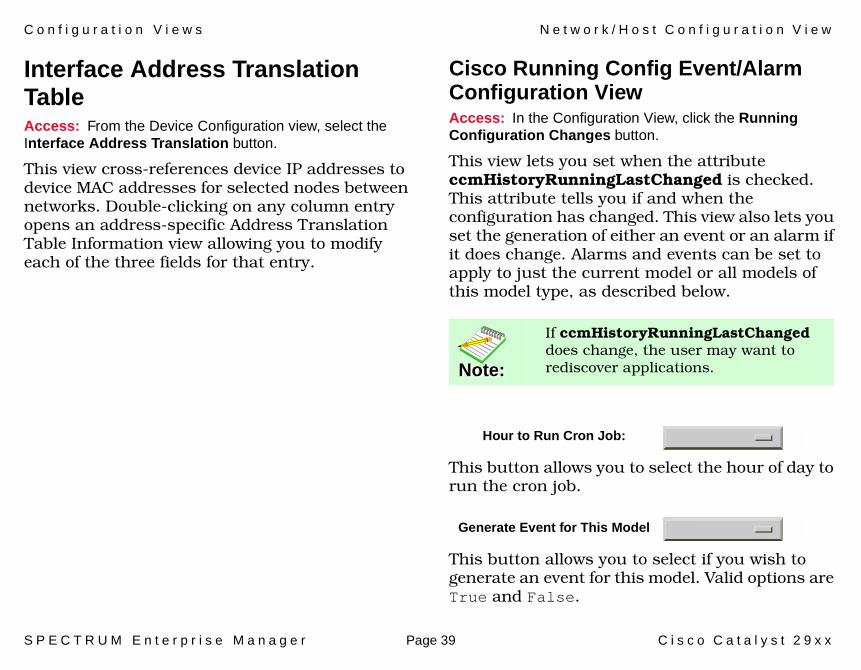
Interface Address Translation TableAccess: From the Device Configuration view, select the Interface Address Translation button.
This view cross-references device IP addresses to device MAC addresses for selected nodes between networks. Double-clicking on any column entry opens an address-specific Address Translation Table Information view allowing you to modify each of the three fields for that entry.
Cisco Running Config Event/Alarm Configuration ViewAccess: In the Configuration View, click the Running Configuration Changes button.
This view lets you set when the attribute ccmHistoryRunningLastChanged is checked. This attribute tells you if and when the configuration has changed. This view also lets you set the generation of either an event or an alarm if it does change. Alarms and events can be set to apply to just the current model or all models of this model type, as described below.
This button allows you to select the hour of day to run the cron job.
This button allows you to select if you wish to generate an event for this model. Valid options are True and False.
Note:Note:
If ccmHistoryRunningLastChanged does change, the user may want to rediscover applications.
Hour to Run Cron Job:
Generate Event for This Model
C o n f i g u r a t i o n V i e w s N e t w o r k / H o s t C o n f i g u r a t i o n V i e w
S P E C T R U M E n t e r p r i s e M a n a g e r Page 40 C i s c o C a t a l y s t 2 9 x x
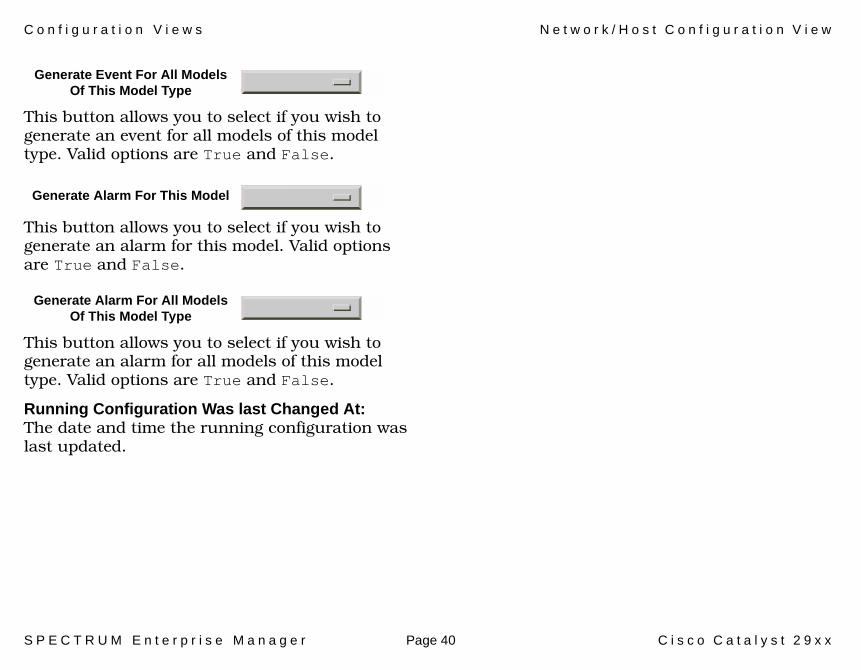
This button allows you to select if you wish to generate an event for all models of this model type. Valid options are True and False.
This button allows you to select if you wish to generate an alarm for this model. Valid options are True and False.
This button allows you to select if you wish to generate an alarm for all models of this model type. Valid options are True and False.
Running Configuration Was last Changed At:The date and time the running configuration was last updated.
Generate Event For All Models Of This Model Type
Generate Alarm For This Model
Generate Alarm For All Models Of This Model Type
S P E C T R U M E n t e r p r i s e M a n a g e r Page 41 C i s c o C a t a l y s t 2 9 x x
Model Information View
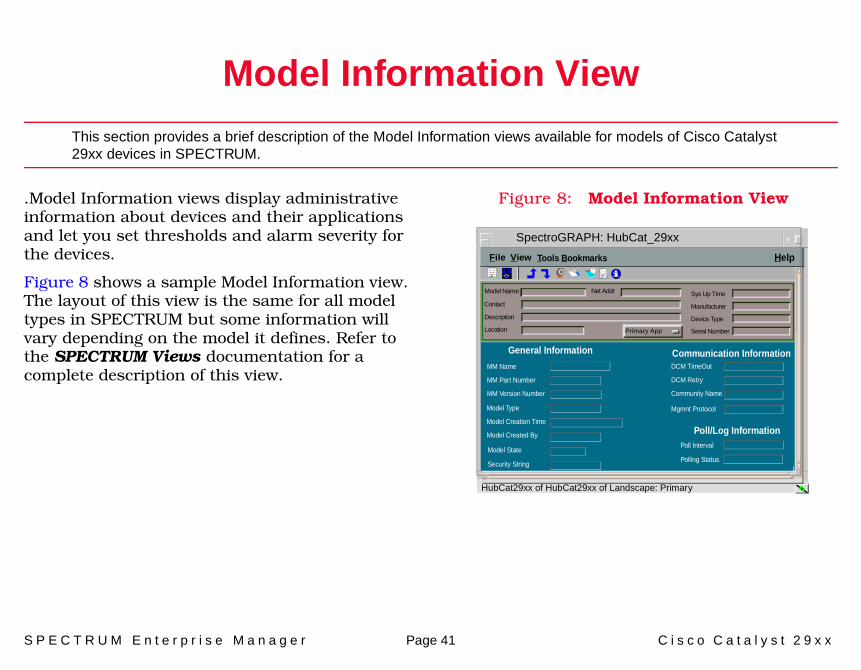
This section provides a brief description of the Model Information views available for models of Cisco Catalyst 29xx devices in SPECTRUM.
.Model Information views display administrative information about devices and their applications and let you set thresholds and alarm severity for the devices.
Figure 8 shows a sample Model Information view. The layout of this view is the same for all model types in SPECTRUM but some information will vary depending on the model it defines. Refer to the SPECTRUM Views documentation for a complete description of this view.
Figure 8: Model Information View
File View
SpectroGRAPH: HubCat_29xx
Model Name
Contact
Description
Location
Net Addr Sys Up Time
Manufacturer
Device Type
Serial Number
MM Version Number
MM Name
MM Part Number
General Information Communication Information
Community Name
DCM TimeOut
DCM Retry
Poll/Log InformationModel Created By
Model Type
Model Creation Time
Poll Interval
Polling StatusModel State
Security String
Mgmnt Protocol
HelpTools Bookmarks
HubCat29xx of HubCat29xx of Landscape: Primary
Primary App
D e v i c e M a n a g e m e n t Page 42 C i s c o C a t a l y s t 2 9 x x
Index
Symbols# Connect 28
AAlarm Thresholds 8Application Views 21
BBandwidth 15
Current Peak 15Current Usage 15Formula 15Peak 15Peak Interaval. 15Peak Restart 15Peak Usage Table 15
BridgingApplication Views 29
CC29XX Mib System Information 32
Catalyst 2924C 6Catalyst2912M XL 6Catalyst2912XL 6Catalyst2924M XL 6ccmHistoryRunningLastChanged 3
9Chassis
ID/Serial No. 24Information 24Type 24
Chassis General Information ViewChassis Information 24RAM Information 25
Cisco Chassis Application 24Cisco Chassis Card View 24Cisco Chassis General Information
View 24Cisco Interface Application 27Cisco Terminal Server
Line View 27Session View 29
Cisco Terminal Server Line View 32Config Register 25Contact Status 32Current Session 28
DDevice Configuration View 32DevTop Views 20Discovery Application 25Discovery Cache Table View 25Documentation 5
FFalling Threshold 15Flow Control 27
HHardware Revision Level 24Hardware Type 35Host Configuration 38
IIdle T-out 28If_Port Performance View 10Index 35
I n d e x I n d e x
D e v i c e M a n a g e m e n t Page 43 C i s c o C a t a l y s t 2 9 x x
Interface Address Translation Table 39
Interface Configuration 34Interface Configuration Table 34Interface Discovery Status Table 26Interface Icon 11, 32Interface Icon Subview Menu
Options 12
LLocation 28
MManagement Tasks 8Model Name 11Model Type 11Modem Control 28Monitoring Operation 8
NNetwork Configuration 37Network I/O ports 20Network/Host Configuration
View 37Non-volatile RAM
Size (bytes) 25
Used (bytes) 25Number of Chassis Slots 25
OOper 35Operation Status 35
PPerformance Statistics 30Physical Address 35Port Address View 18Port Configuration 35Port Configuration View 35
RRAM Information 25ROM Information 25ROM Monitor Version 25ROM Software Version 25Running Configuration Changes 39
SSerial ports 20Session Table 29
Session Time out 28Session T-out 28Session View 29Slot Number 11Speed In 27Speed Out 27Status 27Supported Devices 6System CPU RAM (bytes) 25
TTerm Type 28Terminal Server Application
Terminal Server Line View 27Terminal Server Session View 29
Terminal Server Application Line Configuration View 32
Threshold 13Troubleshooting 8TS Session Table 29Type 27Type of Hardware 35

I n d e x I n d e x
D e v i c e M a n a g e m e n t Page 44 C i s c o C a t a l y s t 2 9 x x