circumnuclear regions in barred spiral galaxies – ii. relations to host galaxies
TRANSCRIPT

Mon. Not. R. Astron. Soc. 337, 808–828 (2002)
Circumnuclear regions in barred spiral galaxies – II. Relationsto host galaxies
J. H. Knapen,1,2� D. Perez-Ramırez3 and S. Laine4
1Isaac Newton Group of Telescopes, Apartado 321, E-38700 Santa Cruz de La Palma, Spain2Department of Physical Sciences, University of Hertfordshire, Hatfield, Herts AL10 9AB3Department of Physics and Astronomy, Michigan Technological University, 1400 Townsend Dr., Houghton, MI 49931, USA4Space Telescope Science Institute, 3700 San Martin Drive, Baltimore, MD 21218, USA
Accepted 2002 July 4. Received 2002 June 25; in original form 2002 January 3
ABSTRACTWe present optical broad- and narrow-band imaging of a sample of a dozen barred galaxies.These images are analysed in conjunction with our previously published near-infrared imagingof their central regions and with literature values for, e.g. bar strengths and the total starformation activity of the galaxies. We present B, I and Hα images, and radial profiles derivedfrom these, to infer geometric and dynamical parameters of the structural components of thegalaxies, such as bar lengths, bar ellipticities, and location of star formation and dust. We findthat the more centrally concentrated the Hα emission in a galaxy is, i.e. the higher the fractionof star formation originating in the circumnuclear region, the higher the overall star formationrate, as measured from far-infrared flux ratios. Stronger bars host smaller nuclear rings, but thestrength of the bar does not correlate with either the intrinsic ellipticity of the ring or the offsetbetween the position angles of the bar and the ring. We interpret these results in comparisonwith modelling of gas inflow in the circumnuclear region, and show that they were theoreticallyexpected. We confirm observationally, and for the first time, the anticorrelation predicted fromtheory and modelling between the degree of curvature of the bar dust lanes and the strength ofthe bar, where stronger bars have straighter dust lanes.
Key words: galaxies: evolution – galaxies: ISM – galaxies: spiral – galaxies: starburst –galaxies: structure.
1 I N T RO D U C T I O N
Most galaxies are barred (e.g. Sellwood & Wilkinson 1993; Knapen,Shlosman & Peletier 2000a) and a substantial fraction of barredgalaxies show enhanced star formation (SF) activity in or near theircentres, often in the form of complete or incomplete nuclear rings(e.g. Buta & Combes 1996; Knapen 1999). It is believed that thereis a causal connection between the existence of a bar and circumnu-clear SF activity. Through its non-axisymmetric potential, a bar canfacilitate gas inflow by extracting angular momentum from the gasthrough gravitational torques. The inflowing gas may then accumu-late in the vicinity of inner Lindblad resonances (ILRs), triggeringmassive SF (see, e.g. review by Shlosman 1999). It is therefore nat-ural to infer that the properties of the circumnuclear starburst regionare connected to those of the large-scale structure, most obviouslythe bar, and it is this inference that we wish to test observationallyin the present paper.
Correlations have been established between morphological prop-erties of the stellar bar, such as size, shape and surface brightness
�E-mail: [email protected]
(Elmegreen & Elmegreen 1985; Martin 1995), the location of star-forming regions (Sersic & Pastoriza 1967; Phillips 1993, 1996), thepresence of nuclear activity (Chapelon, Contini & Davoust 1999;Knapen, Shlosman & Peletier 2000a; Shlosman, Peletier & Knapen2000; Laine et al. 2002) and the Hubble type of their host galaxy.Bars are found to be longer in early-type barred galaxies (Martin1995), longer bars are more elliptical (Martinet & Friedli 1997),bar radial profiles appear to be flatter in early-type galaxies andexponential in late-type galaxies (Elmegreen & Elmegreen 1985),and there is some evidence that the more elliptical the bar is, thehigher is its overall SF rate (Aguerri 1999). There also appears tobe some correlation between the location of SF in galaxies and theirmorphological classification. Phillips (1993) noted that early-typebarred galaxies exhibit SF in rings but neither in the bar nor thecentre, whereas late-type barred spirals display many star-formingregions along their bars.
Sersic & Pastoriza (1967) realized that enhanced SF is found inthe inner parts of some spiral galaxies, and that this SF is frequentlyarranged into a ring or pseudo-ring pattern. Combes & Gerin (1985)and Athanassoula (1992a) found that such spiral galaxies are usu-ally of early type and host a bar. Rings in galaxies, including nuclear
C© 2002 RAS

Circumnuclear regions of barred galaxies – II 809
rings, were extensively reviewed by Buta & Combes (1996). Buta& Crocker (1993) compiled a catalogue of rings in galaxies, in-cluding ten nuclear rings studied in the present paper, and derivedmetric characteristics for the rings. Case studies combining opticaland near-infrared (NIR) imaging with velocity fields and dynamicalmodelling show in detail how the bar and the circumnuclear regions(CNRs) are part of the same dynamical system. Gas is driven inwardunder the influence of a large stellar bar, where it piles up near orbetween the ILRs, and possibly results in massive SF. Examples ofsuch case studies are those by Knapen et al. (1995a,b, 2000b) onM100 (=NGC 4321), Regan et al. (1996, 1997) on NGC 1530, Buta,Crocker & Byrd (1999) on ESO 565-11 (see also Rautiainen & Salo2000), and Laine et al. (1999, 2001) and Jogee et al. (2002a,b) onNGC 5248. In thin bars (high axial ratio) the gas inflow may be mosteffective, but according to the simulations by Piner, Stone & Teuben(1995), nuclear rings will not form in such bars and gas will flowdirectly to the nucleus. Nuclear bars, spirals, or rings, are frequentlyobserved on scales of a kpc or less, and can be modelled as di-rectly resulting from the dynamics of the overall system (see Knapenet al. 2001, for many examples).
We have performed an imaging study of a dozen barred spiralswith evidence for the presence of star-forming CNRs, to investigatethe coupling between the CNRs and their host galaxies in a morestatistical manner. Our main goal is to test the hypothesis (Knapenet al. 1995b; Perez–Ramırez & Knapen 1998) that the structure anddynamics of the large-scale bar and disc of the host galaxies is inti-mately connected with that of the inner, active region (either AGNor SF), and thus determines whether such activity occurs in a givengalaxy, and in what form. In Paper I (Perez–Ramırez et al. 2000),we presented NIR images of the central regions of a sample of 12barred galaxies to study the properties of circumnuclear structuresin stars and dust that exist at small scales (a few hundred pc to a fewkpc). In this paper, we present optical broad-band and Hα imagingof the whole extent of the discs of the same 12 barred galaxies, andcombine parameters derived from the NIR and optical parts of ourimaging survey with parameters taken from the literature to identifyseveral correlations which illuminate the important connections thatexist between the central regions and the host galaxy structures atlarge.
We summarize the observations and data reduction procedures inSection 2, and present our observational results in Section 3. RelativeHα fluxes from different parts of the sample galaxies are explored inSection 4. In subsequent sections, we explore correlations betweenthe strength of the bar and the geometric parameters of the nuclearrings (Section 5), and the shapes of the dust lanes within the bar(Section 6). We summarize our main findings in Section 7. Noteson individual objects can be found in Appendix A.
2 O B S E RVAT I O N S A N D DATA R E D U C T I O N
2.1 Optical observations
We present new and archival broad (B and I) and narrow-band(Hα) images of the entire bar and disc region of the 12 barredgalaxies that make up our sample. The selection criteria and ba-sic properties of our sample galaxies (spiral galaxies known to hoststar-forming circumnuclear ring-like structure) are given in Paper I.The main goal of the present paper is to identify and quantify ba-sic structural parameters such as the bar length and ellipticity, thelocation and shape of dust lanes, and the distribution of massiveSF. It is relatively easy to measure these parameters from multi-band optical imaging (see, e.g. Knapen et al. 1995a,b; Knapen &
Beckman 1996). Schematically, we use different bands and coloursas follows.
(i) I: to trace the old stellar population in the absence of signifi-cant contamination by young stars and dust. For most galaxies, wealso used I-band images as the continuum that is subtracted fromthe raw Hα images.
(ii) B: in combination with I, using B − I colour index maps, toshow the location of dust lanes and sites of SF.
(iii) Hα: hydrogen recombination line emission to trace directlythe massive SF.
Most images were obtained during two observing runs on the1.0-m Jacobus Kapteyn Telescope (JKT), during 1998 March 2–9 and 1998 November 9–15 (Table 1). We used the TEK4 CCDCamera with a pixel size of 0.331 arcsec pixel−1, and a field ofview (FOV) on the sky of 5.6 × 5.6 arcmin2. The average FWHMseeing is just below 2 arcsec (best seeing is 1.2 arcsec). The imagesin I from the first run presented problems during the flat-fieldingprocess. We have instead used I-band data for these galaxies fromthe Isaac Newton Group (ING) archive. In addition, we includeseveral images from the literature, as detailed in Table 1.
2.2 Data reduction and photometric calibration
The images were reduced using standard IRAF tasks. First, the biaslevel of the CCD was subtracted from all exposures as a constantafter we verified that the bias level was constant across the chip. Theimages were flat-fielded using sky flats taken in each filter at twilight.We estimated the sky background by determining the mean level ona few small areas in regions free of galactic emission, althoughlater in the reduction we checked, and in some cases corrected,these estimates using the colour profiles (see Section 2.3). Theimages were sky-subtracted and bias-only overscan regions wereremoved.
Table 1. Observing details: month of observation (col. 2); tele-scope (col. 3), where INT is the 2.5-m Isaac Newton Tele-scope, WHT is the 4.2-m William Herschel Telescope; filters(col. 4); and source from which the image was obtained (col. 5),where KB96 is Knapen & Beckman (1996), RBK96 is Rozas,Beckman & Knapen (1996) and K98 is Knapen (1998).
Galaxy Date Telescope Filters Source
NGC 1300 11/98 JKT B,I,Hα This paperNGC 1530 11/98 JKT B,Hα This paper
10/96 I JKT archiveNGC 2903 03/98 JKT B,I,Hα This paper
11/98 B,I,Hα This paperNGC 3351 11/98 JKT B,Hα This paper
04/99 I JKT archiveNGC 3504 11/98 JKT B,Hα This paper
04/98 I JKT archiveNGC 3516 03/98 JKT B,I,Hα This paperNGC 3982 11/98 JKT B,Hα This paper
05/88 I JKT archiveNGC 4303 11/98 JKT B,Hα This paper
04/96 I JKT archiveNGC 4314 03/98 JKT B,Hα This paper
11/98 I JKT archiveNGC 4321 05/92 INT B,I KB96
04/91 WHT Hα K98NGC 5248 04/95 INT B,I,Hα This paperNGC 6951 10/95 INT B,I INT archive
02/92 WHT Hα RBK96
C© 2002 RAS, MNRAS 337, 808–828

810 J. H. Knapen, D. Perez-Ramırez and S. Laine
After foreground stars were located and their positions deter-mined, we shifted all the images of each galaxy to a common po-sition. Where multiple exposures in one band were available, thesewere median combined to make the final image of the galaxy inthat band. Cosmic-ray events were automatically removed in theprocess. Again using the foreground stars, we calibrated the imagesastrometrically. The angle of rotation employed to achieve this was181.2◦ counterclockwise for the images from our two JKT runs.
The photometric calibration of the broad-band images of thegalaxies was done using published aperture photometry where thiswas available. For the rest of the galaxies, we used a mean photomet-ric constant. We could not use standard stars owing to unfavourableweather conditions during both of our JKT runs. Our Hα data havenot been calibrated for the same reason.
2.3 Ellipse fitting
After calibrating the images, we used the task ELLIPSE in IRAF tofit ellipses to the images, in order to produce radial runs of surfacebrightness in the different bands, as well as of parameters such asthe major axis position angle (PA) and the ellipticity of the fittedellipses. Unlike in Paper I, where foreground stars were not a prob-lem because of the small FOV of the NIR images, here we had toselect and mask out stars that could affect the fitting process. Wefirst fitted one of the bands (I) leaving PA, ellipticity and centre po-
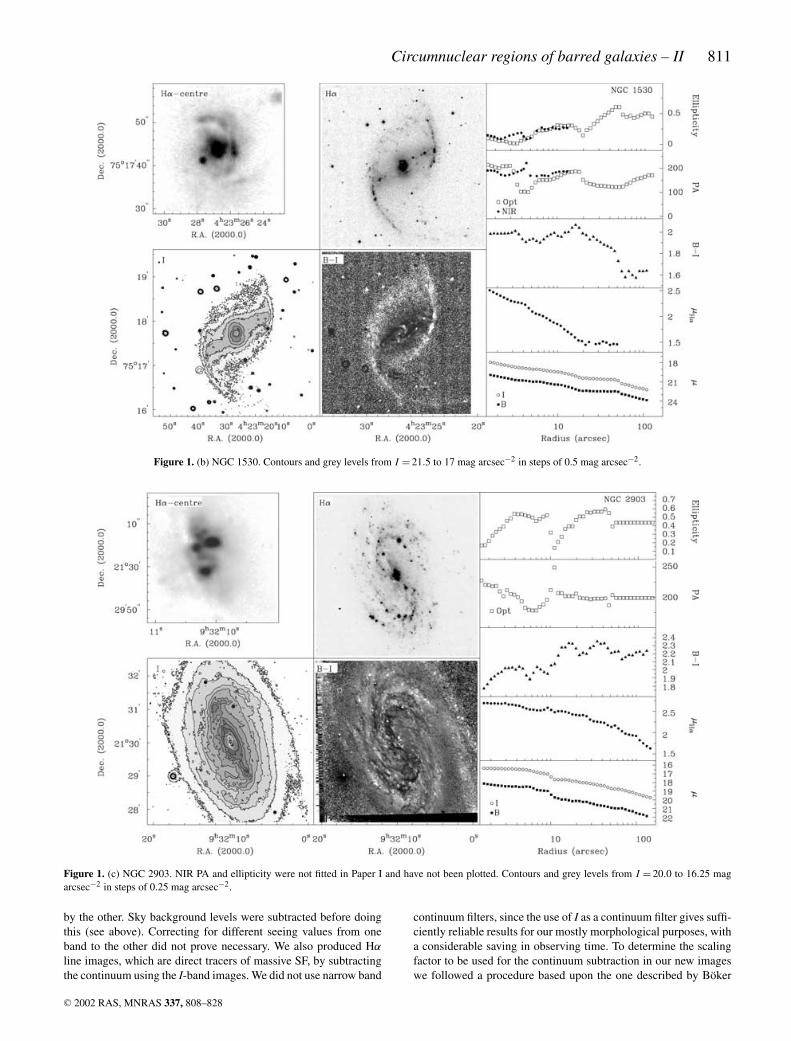
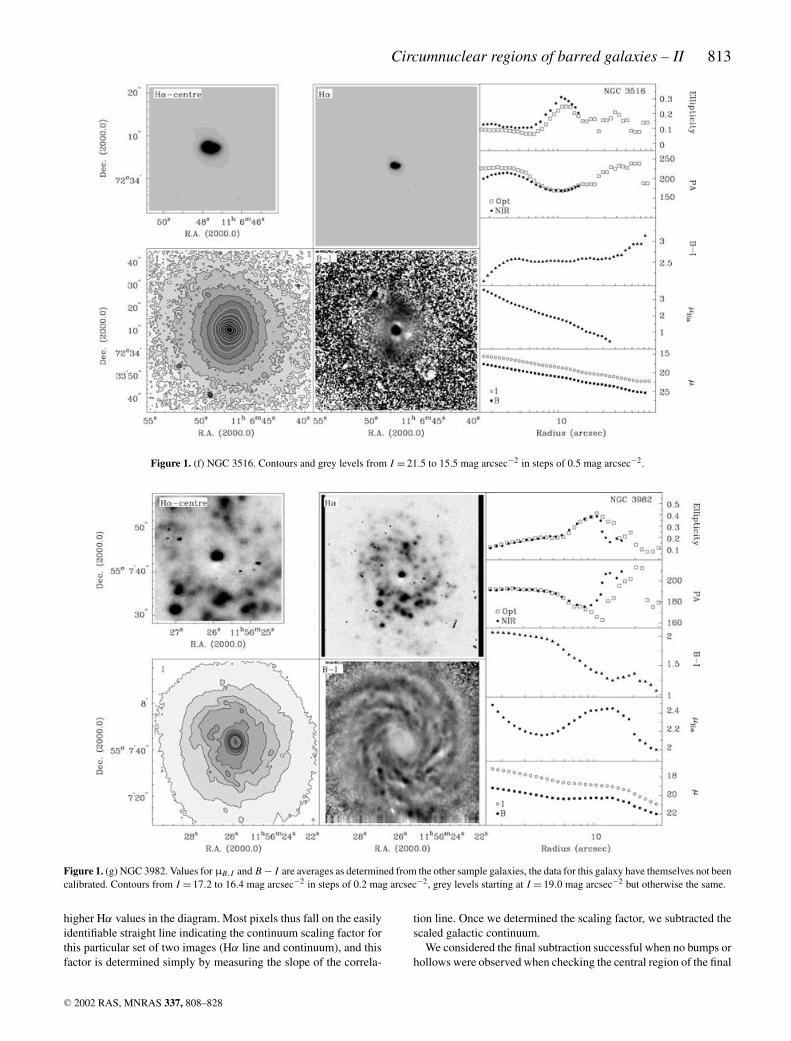
Figure 1. (a) Images and photometric profiles for the 12 galaxies in our sample. The lower left panel is a contour plus grey-scale plot of the galaxy in theI-band. Contour levels are indicated in the captions to the individual galaxy figures. The coordinates are J2000.0, obtained from the NASA/IPAC ExtragalacticDatabase (NED). The panels in the middle show a grey-scale representation of the B − I colour index (below) and Hα images. A close-up of the centre of theHα image is presented on the upper left, showing exactly the same region as that shown for the NIR imaging in fig. 2 in Paper I, to facilitate intercomparison.Darker tones indicate redder colours in the B − I image, more flux in Hα. The right panels show radial profiles of, from bottom to top, B, I and Hα surfacebrightness, B − I colour, PA and ellipticity. The B and I-band surface brightness and B − I colour have been photometrically calibrated using aperturephotometry from the literature, while the Hα surface brightness is uncalibrated and given in instrumental units of log(counts). All profiles are plotted as afunction of major axis radius. The PA has been measured in degrees from N through E. Small filled dots in the PA and ellipticity profiles are the NIR valuesreproduced from fig. 2 of Paper I. Uncertainties arising from the fitting procedure have not been indicated in the figure because they are smaller than thesymbol size in all cases, except for the colour index profile at large radii, where uncertainties can amount to 0.1–0.3 mag for the outer few points plotted.This panel shows NGC 1300. Contours from I = 21 to 20 mag arcsec−2, with intervals of 0.25 mag arcsec−2, and from 19.5 to 17 with intervals of 0.5;grey-scale levels in I from 21.5 to 17 in steps of 0.25.
sition as free parameters in the fit. We then imposed the resultingradial runs of PA, ellipticity and centre position as fixed input valuesfor the fits to the other two bands. That way, we ensure that whencombining two bands to evaluate a colour (B − I in this case), wecombine emission from the same areas in the individual images.B − I radial profiles have the advantage that they are rather sen-sitive to uncorrect background subtraction in one of the individualimages, which leads to easily recognizable sharply rising or drop-ping colour profiles in the outer regions. This fact allowed us to fine-tune the background subtraction, giving more accurate backgrounddeterminations. We thus produced radial B, I and Hα surface bright-ness, B − I , PA and ellipticity profiles, all of which are shown inFig. 1.
There was a problem in the practical implementation of this pro-cedure for a few galaxies, for which the centre is saturated in ourI-band image (NGC 4321, NGC 5248 and NGC 6951). We circum-vented this problem by creating a fictitious centre. We located thereal position of the centre from other bands, and added a number ofcounts to the pixel at this position (usually no more than 10 per centof the surrounding value) using the IRAF task PIXEDIT.
2.4 Colour index and Hα images
B − I colour maps, which indicate the location of the major dustlanes in the disc of a galaxy, were produced by dividing one image
C© 2002 RAS, MNRAS 337, 808–828
Circumnuclear regions of barred galaxies – II 811
Figure 1. (b) NGC 1530. Contours and grey levels from I = 21.5 to 17 mag arcsec−2 in steps of 0.5 mag arcsec−2.
Figure 1. (c) NGC 2903. NIR PA and ellipticity were not fitted in Paper I and have not been plotted. Contours and grey levels from I = 20.0 to 16.25 magarcsec−2 in steps of 0.25 mag arcsec−2.
by the other. Sky background levels were subtracted before doingthis (see above). Correcting for different seeing values from oneband to the other did not prove necessary. We also produced Hα
line images, which are direct tracers of massive SF, by subtractingthe continuum using the I-band images. We did not use narrow band
continuum filters, since the use of I as a continuum filter gives suffi-ciently reliable results for our mostly morphological purposes, witha considerable saving in observing time. To determine the scalingfactor to be used for the continuum subtraction in our new imageswe followed a procedure based upon the one described by Boker
C© 2002 RAS, MNRAS 337, 808–828

812 J. H. Knapen, D. Perez-Ramırez and S. Laine
Figure 1. (d) NGC 3351. Contours and grey levels from I = 20.5 to 16 mag arcsec−2 in steps of 0.25 mag arcsec−2. Differences between the PSFs of the Band I images cause some small artefacts in the B − I image.
Figure 1. (e) NGC 3504. Contours and grey levels from I = 21.5 to 15.5 mag arcsec−2 in steps of 0.5 mag arcsec−2.
et al. (1999). We first found the pixel by pixel intensity correla-tion in the original I and Hα images, using CORMAP (a GIPSY task).Most pixels in our large images trace background or galaxy con-tinuum, emission which will, after appropriate scaling, be equal inthe two filters. This factor will mostly depend on the shape of the
throughput curves of the filters used. All these pixels will fall alonga straight line, the x and y intercepts of which give an additionalestimate for the sky background in the I and Hα images. The mi-nority of pixels which trace Hα line emission will have enhancedHα emission relative to I (continuum), and will be displaced toward
C© 2002 RAS, MNRAS 337, 808–828
Circumnuclear regions of barred galaxies – II 813
Figure 1. (f) NGC 3516. Contours and grey levels from I = 21.5 to 15.5 mag arcsec−2 in steps of 0.5 mag arcsec−2.
Figure 1. (g) NGC 3982. Values for µB,I and B − I are averages as determined from the other sample galaxies, the data for this galaxy have themselves not beencalibrated. Contours from I = 17.2 to 16.4 mag arcsec−2 in steps of 0.2 mag arcsec−2, grey levels starting at I = 19.0 mag arcsec−2 but otherwise the same.
higher Hα values in the diagram. Most pixels thus fall on the easilyidentifiable straight line indicating the continuum scaling factor forthis particular set of two images (Hα line and continuum), and thisfactor is determined simply by measuring the slope of the correla-
tion line. Once we determined the scaling factor, we subtracted thescaled galactic continuum.
We considered the final subtraction successful when no bumps orhollows were observed when checking the central region of the final
C© 2002 RAS, MNRAS 337, 808–828

814 J. H. Knapen, D. Perez-Ramırez and S. Laine
Figure 1. (h) NGC 4303. Contours and grey levels from I = 20.75 to 16.0 mag arcsec−2 in steps of 0.25 mag arcsec−2.
Figure 1. (i) NGC 4314. Values for µI and B − I are averages as determined from the other sample galaxies, the data for this galaxy have themselves not beencalibrated. Contours and grey levels from I = 20.0 to 15.5 mag arcsec−2 in steps of 0.25 mag arcsec−2.
image. More extensive testing of this method, including a compar-ison with a method where fluxes from foreground stars are used toderive the continuum scaling factor, and a comparison of differentfilters (R, I, narrow-band continuum filter centred at λ = 6470 Aand 115 A wide) used for continuum subtraction, will be presented
elsewhere (Knapen et al., in preparation). From that study, and fromtests performed in this paper, we conclude that scaling factors can bedetermined accurately as described above, and that resulting uncer-tainties in the Hα flux level are of the order of 1 per cent in the discto at most 10 per cent in the H II regions closest to the nucleus.
C© 2002 RAS, MNRAS 337, 808–828

Circumnuclear regions of barred galaxies – II 815
Figure 1. (j) NGC 4321. The nuclear region in the I-band image is saturated, and no data are available in that region in the I and B − I images and the I andB − I profiles. Contours and grey levels from I = 22.0 to 17.5 mag arcsec−2 in steps of 0.5 mag arcsec−2.
Figure 1. (k) NGC 5248. The nuclear region in the I-band image is saturated, and no data are available in that region in the I and B − I images and the I andB − I profiles. Contours and grey levels from I = 21.0 to 16.5 mag arcsec−2 in steps of 0.5 mag arcsec−2.
The bulk of the latter uncertainty originates in colour dif-ferences between the wavelength of the on- and off-line fil-ters, in turn mostly caused by excess dust extinction in theCNR at the Hα wavelength as compared to that of the I fil-
ter. The continuum subtraction for the Hα images of NGC4321 and NGC 6951 was done differently, and has been de-scribed by Knapen (1998) and Rozas, Beckman & Knapen (1996),respectively.
C© 2002 RAS, MNRAS 337, 808–828

816 J. H. Knapen, D. Perez-Ramırez and S. Laine
Figure 1. (l) NGC 6951. The nuclear region in the I-band image is saturated, and no data are available in that region in the I and B − I images and the I andB − I profiles. Values for µI and B − I are averages as determined from the other sample galaxies, the data for this galaxy have themselves not been calibrated.Contours and grey levels from I = 19.25 to 16.5 mag arcsec−2 in steps of 0.25 mag arcsec−2.
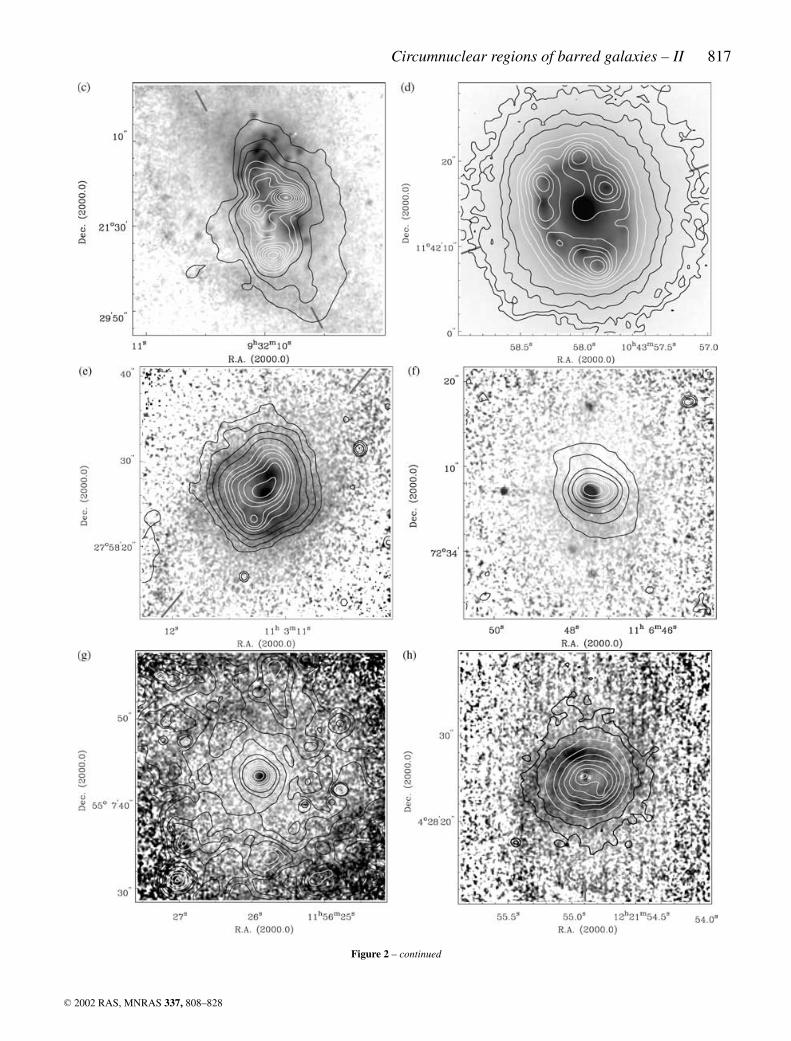
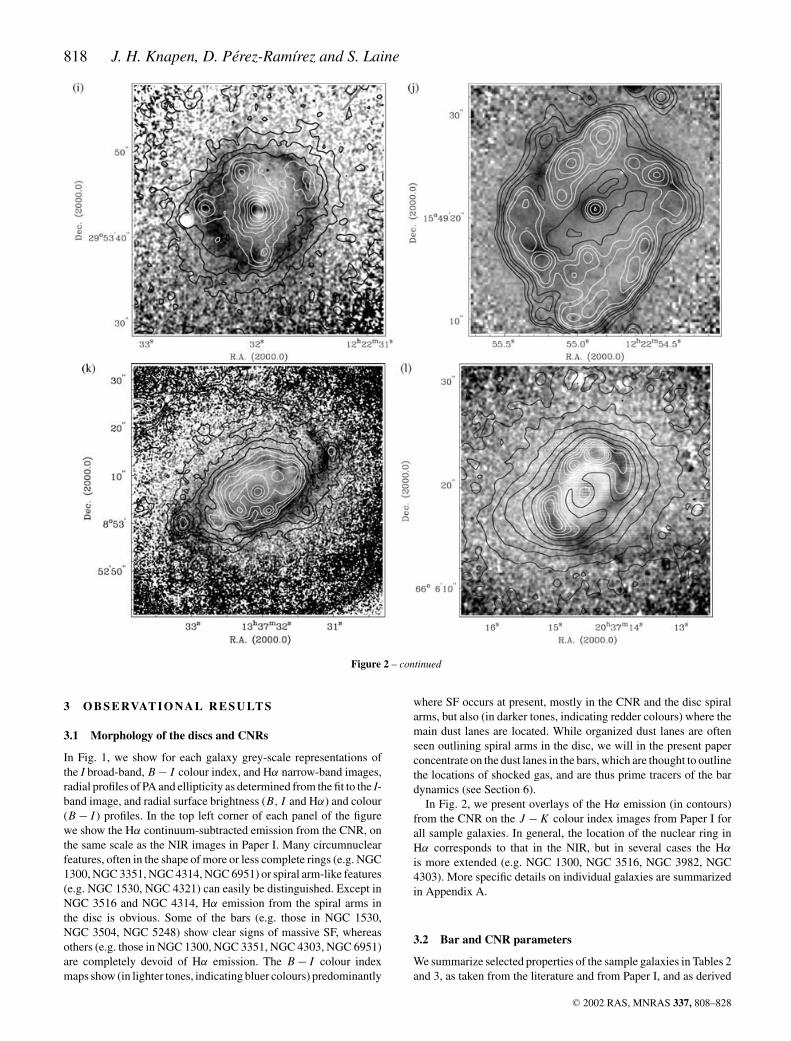
Figure 2. (a) Hα contours over a grey-scale J − K colour map of NGC 1300. Contour levels are linearly increasing in instrumental counts. Darker tonesin the colour index image indicate redder colours. (b) As (a), now for NGC 1530. (c) As (a), now for NGC 2903. (d) Hα contours (as in panel a) overlaidon a grey-scale representation K-band image of NGC 3351. (e) As (a), now for NGC 3504. (f) As (a), now for NGC 3516. (g) As (a), now for NGC3982. (h) As (a), now for NGC 4303. (i) As (a), now for NGC 4314. (j) As (a), now for NGC 4321. (k) As (a), now for NGC 5248. (l) As (a), now forNGC 6951.
2.5 NIR observations
We obtained broad-band NIR images of the central few kpc re-gions of our sample galaxies, as described in detail in Paper I. Thesub-arcsec resolution NIR images were obtained with the Canada–France–Hawaii Telescope. In Paper I, we present the data in the form
of sets of grey-scale and contour plots of the broad-band images andof colour index images derived from them, and sets of radial pro-files of surface brightness, colour, ellipticity and PA. In Fig. 2, weshow overlays of the central regions of the Hα images, described inSection 2.1 and Section 2.4, on the NIR J − K colour index imagesfrom Paper I.
C© 2002 RAS, MNRAS 337, 808–828
Circumnuclear regions of barred galaxies – II 817
Figure 2 – continued
C© 2002 RAS, MNRAS 337, 808–828
818 J. H. Knapen, D. Perez-Ramırez and S. Laine
Figure 2 – continued
3 O B S E RVAT I O NA L R E S U LT S
3.1 Morphology of the discs and CNRs
In Fig. 1, we show for each galaxy grey-scale representations ofthe I broad-band, B − I colour index, and Hα narrow-band images,radial profiles of PA and ellipticity as determined from the fit to the I-band image, and radial surface brightness (B, I and Hα) and colour(B − I ) profiles. In the top left corner of each panel of the figurewe show the Hα continuum-subtracted emission from the CNR, onthe same scale as the NIR images in Paper I. Many circumnuclearfeatures, often in the shape of more or less complete rings (e.g. NGC1300, NGC 3351, NGC 4314, NGC 6951) or spiral arm-like features(e.g. NGC 1530, NGC 4321) can easily be distinguished. Except inNGC 3516 and NGC 4314, Hα emission from the spiral arms inthe disc is obvious. Some of the bars (e.g. those in NGC 1530,NGC 3504, NGC 5248) show clear signs of massive SF, whereasothers (e.g. those in NGC 1300, NGC 3351, NGC 4303, NGC 6951)are completely devoid of Hα emission. The B − I colour indexmaps show (in lighter tones, indicating bluer colours) predominantly
where SF occurs at present, mostly in the CNR and the disc spiralarms, but also (in darker tones, indicating redder colours) where themain dust lanes are located. While organized dust lanes are oftenseen outlining spiral arms in the disc, we will in the present paperconcentrate on the dust lanes in the bars, which are thought to outlinethe locations of shocked gas, and are thus prime tracers of the bardynamics (see Section 6).
In Fig. 2, we present overlays of the Hα emission (in contours)from the CNR on the J − K colour index images from Paper I forall sample galaxies. In general, the location of the nuclear ring inHα corresponds to that in the NIR, but in several cases the Hα
is more extended (e.g. NGC 1300, NGC 3516, NGC 3982, NGC4303). More specific details on individual galaxies are summarizedin Appendix A.
3.2 Bar and CNR parameters
We summarize selected properties of the sample galaxies in Tables 2and 3, as taken from the literature and from Paper I, and as derived
C© 2002 RAS, MNRAS 337, 808–828

Circumnuclear regions of barred galaxies – II 819
Table 2. Properties of the sample galaxies. Identification (col. 1), scale (col. 2, Paper I); morphological type (col. 3, from de Vaucouleurset al. 1991, hereafter RC3), presence and type of nuclear activity (col. 4, from NED; Sy is Seyfert), features in the CNR (col. 5, Paper I),scalelength of the exponential disc (col. 6), and deprojection parameters: PA of the major axis of the outer disc (col. 7) and galaxyinclination (col. 8).
Galaxy Scale Morphological Nuclear CNR Disc scale- Disc PA Inclinationpc/arcsec type activity feature length (kpc) (◦) angle (◦)
NGC 1300 101 (R’)SB(s)bc – Ring 21.5 87 35NGC 1530 159 SB(rs)b – Ring + spiral 9.6 8 45NGC 2903 36 SAB(rs)bc Starburst Ring 3.4 22 65NGC 3351 49 SB(r)b Starburst Ring 1.9 13 40NGC 3504 99 (R)SAB(s)ab Starburst Ring + spiral 2.0 147 22NGC 3516 171 (R)SB(s) Sy 1.5 Ring 4.2 46 34NGC 3982 72 SAB(r)b Sy 2 Spiral 0.6 6 14NGC 4303 101 SAB(rs)a Sy 2 Ring 5.7 116 22NGC 4314 62 SB(rs)a LINER Ring + spiral 3.2 59 27NGC 4321 70 SAB(s)bc – Ring + spiral 3.1 153 30NGC 5248 74 SAB(rs)bc – Ring + spiral 3.3 105 40NGC 6951 92 SAB(rs)bc LINER/Sy Ring + spiral 3.7 157 44
Table 3. Properties of the nuclear rings and the bars in our sample galaxies: measured dimensions of the nuclear ring(major and minor axis radii, in kpc, col. 2), ring size expressed as Dring/D25, where D25 is from the RC3 (Col. 3),deprojected ring ellipticity (col. 4), deprojected PA offset (in degrees) between major axes of the nuclear ring and of thebar (col. 5); deprojected bar length in kpc (col. 6); bar ellipticity as determined from our data, as measured (col. 7) anddeprojected (col. 8); bar strength Qb (col. 9; from Block et al. 2001, Laurikainen & Salo, in preparation, and Buta, privatecommunication; the average is given where a galaxy is included in more than one study); and dust lane curvature measure�α (see text, col. 10).
Galaxy Dimensions of Ring Ring ε PA offset (◦) Bar length Bar ellipticity Bar strength �α
Hα ring (kpc) size Deproj. Deproj. (kpc) ε εd Qb (◦/kpc)
NGC 1300 0.5 × 0.5 0.026 0.18 28 8.6 0.72 0.58 0.44 5NGC 1530 0.7 × 0.6 0.032 0.19 85 11.0 0.61 0.65 0.71 3NGC 2903 0.4 × 0.2 0.030 0.17 18 2.7 0.60 0.15 0.26 –NGC 3351 0.7 × 0.6 0.064 0.11 88 3.1 0.39 0.58 0.20 12NGC 3504 0.4 × 0.3 0.050 0.10 43 2.9 0.62 0.36 0.26 11NGC 3516 – – – – 2.4 0.30 0.39 – –NGC 3982 – – – – 0.8 0.41 0.37 – –NGC 4303 0.6 × 0.6 0.030 0.07 53 4.3 0.54 0.58 0.27 9NGC 4314 0.5 × 0.4 0.064 0.27 12 4.8 0.63 0.67 0.33 7NGC 4321 0.9 × 0.6 0.058 0.26 19 3.7 0.50 0.50 0.20 18NGC 5248 0.9 × 0.9 0.066 0.23 10 7.8 0.48 0.51 0.03 20NGC 6951 0.5 × 0.3 0.046 0.29 46 5.5 0.50 0.52 0.39 0
in this paper. Table 2 lists the scale in pc/arcsec, the morphologicaltype, type of nuclear activity, and a brief description of the observedCNR features for all sample galaxies. We determined the scalelengthof the exponential disc of each galaxy by least-squares fitting of therelevant part of the I-band surface brightness profile (Fig. 1). Thedimensions of the nuclear ring were measured directly from theimages, and are given in Table 3 as major and minor axis sizes, inkpc. The size of the ring was measured by tracing the ridge line ofthe ring from the colour index maps (for the NIR) or the Hα images(for the SF), and fitting these coordinates to an ellipse to find thesize and the ellipticity. Allowing for the different kinds of imagingused, our ring dimension measurements generally agree rather wellwith those published by Buta & Crocker (1993) for the ten galaxiescommon to their and our samples. We also derived the relative sizeand deprojected (or intrinsic) ellipticity of the nuclear rings, whichare listed in Table 3. Typical uncertainties in these quantities are10 per cent and 0.05, respectively. The relative size of the ring wasdefined as the diameter of the ring divided by the diameter of thedisc, where we use D25 from the RC3 to find the latter value. Laineet al. (2002) showed that the distribution of these relative nuclear
ring sizes peaks at rring/D25 = 0.06. The values found here are inagreement with their result.
We used the NIR and optical radial profiles in combination withthe images to measure the difference between the PAs of the nuclearring and of the bar. Using the disc parameters given in Table 2 wedeprojected this angle. The final PA offset between the bar and thering is given in Table 3. Typical uncertainties, resulting from smalluncertainties in the PAs as measured from the profiles and imagesand in the deprojection parameters, are ±7◦.
The basic bar parameters length and ellipticity are also tabulatedin Table 3. We define the end of the bar as the radius where theellipticity reaches its local maximum value. The uncertainty in thebar length is on the order of 5–10 per cent. The bulge componentusually has a radius of only 1 kpc or so, and is not expected to affectthe measured bar lengths. We used the scales as given in Table 2to calculate the values in kpc, and the disc parameters (Table 2) todeproject the bar ellipticities and lengths.
To evaluate the ellipticities of the bars, often, but strictly speakingincorrectly, referred to as bar strengths, we followed the simpleprocedure outlined by Martin (1995), and implemented by many
C© 2002 RAS, MNRAS 337, 808–828

820 J. H. Knapen, D. Perez-Ramırez and S. Laine
other authors (e.g. Martinet & Friedli 1997; Chapelon et al. 1999;Knapen et al. 2000a). Considering bars to be ellipsoidal features,their shape can be described by the ellipticity of the bar ε = 1 − b/a(where b/a is the bar axis ratio). A value of ε = 0 corresponds to theabsence of a bar, whereas ε = 0.8 denotes the thinnest class of bars.Following the approach of, among others, Knapen et al. (2000a), wehave determined the bar ellipticity from the maximum in the radialellipticity profile in a region of roughly constant PA. This value isthen deprojected using the (disc) ellipticity at large radii in the discof the galaxy, and the difference between the bar PA and the PA ofthe major axis of the outer disc. The results are listed in Table 3,where typical uncertainties in the ellipticity measures are 0.05.
Recently, bar strength has been addressed in a more accuratesense on the basis of NIR imaging, basically by measuring the ra-tio of non-axisymmetric to axisymmetric forces (e.g. Buta & Block2001; Block et al. 2001; Laurikainen, Salo & Rautiainen 2002).Determinations of the bar strength parameter Qb by Block et al.and Laurikainen et al. in general agree well (E. Laurikainen, pri-vate communication), but only broad agreement between this barstrength and the bar ellipticity has been found (Block et al. 2001).In Table 3, we also list values for Qb for those galaxies where thishas been determined. Typical errors in Qb are ±0.1.
With the information in hand, we can easily check the correlationbetween the bar ‘strength’ and length, as reported by Martinet &Friedli (1997). In Fig. 3(a), we show how the length of the bar iscorrelated with the strength of the bar, as measured through Qb. Thisfigure at first sight indeed confirms the claim by Martinet & Friedlithat stronger bars are longer. But if instead of the bar length in kpcthe length of the bar relative to the scalelength of the exponential discof its host galaxy is plotted (Fig. 3b), the correlation disappears, andthere is even a hint that shorter bars are stronger, which is oppositeto the effect reported by Martinet & Friedli (1997). Reproducingthe measure used by Martinet & Friedli, bar length relative to thesize of the host galaxy (D25 from the RC3), we find no correlationat all (Fig. 3c). Reasons for the confusing set of results may includethe small sample size in our study, but also the use by Martinet &Friedli of parameters measured by Martin (1995), who derived barlengths and ellipticities from optical (as opposed to NIR) images,and who used bar ellipticity as a measure of bar strength. Properanalysis of a larger galaxy sample is needed to confirm any relationbetween lengths and strengths of galactic bars. We draw attentionto a deviant point in Figs 3(a) and (b), which denotes the very weakbar in NGC 5248 (Qb = 0.03). This may well be a special case, asdescribed in detail by Jogee et al. (2002a,b).
3.3 Radial profiles
Some of the most important morphological characteristics of eachgalaxy can be recognized in radial profiles such as the ones shownin Fig. 1. In NGC 4321, Knapen & Beckman (1996) identified fourmain regions in the Hα profile, reflected also in, e.g. the B − I pro-file: the nuclear area corresponding to a central peak and explainedby the existence of enhanced SF in and around the nucleus; the barregion with a relatively smaller SF rate, seen as a dip in the profile;a region where the Hα luminosity falls off exponentially, whichcorresponds to the star-forming spiral arms in the disc; and finallyan outer region of steeper decline. From their study of H II regiondistributions in spiral galaxies, Gonzalez Delgado & Perez (1997)note that the barred galaxies in their sample tend to have either ris-ing or flat central parts in the radial distribution of the number ofH II regions per unit surface area, which is probably connected tothe lack of SF in the bar. It is interesting in this respect that the one
(a)
(b)
(c)
Figure 3. (a) Bar length in kpc as function of bar strength. Typical uncer-tainties are 5–10 per cent in bar length and 0.1 in Qb. (b) Relative bar length,or the ratio of bar length and disc exponential scalelength, as a function ofbar strength. Typical uncertainties are 10–15 per cent in relative bar lengthand 0.1 in Qb. (c) As (b), but now for the ratio of bar length and galaxy size.The RC3 parameter D25 was used for the latter value.
exception mentioned by Gonzalez Delgado & Perez (1997) is NGC7479, well-known for being a strongly barred galaxy with excep-tionally prominent SF within the bar, a bar which may have beencreated in a recent minor merger (Laine et al. 1999).
We can now try to generalize findings such as those by Knapen &Beckman (1996) using the 12 Hα radial profiles for the barred galax-ies in our sample. Considering primarily the Hα profiles, we findthat most galaxies have enhanced emission in the CNR, although in
C© 2002 RAS, MNRAS 337, 808–828

Circumnuclear regions of barred galaxies – II 821
some cases non-stellar emission from the nucleus may contribute toa central rise in the profile (e.g. in NGC 3516). Very often the profileshows a dip in the region of the bar. Particularly good examples areNGC 1300, NGC 3351 and NGC 6951. In a number of galaxies,such as in NGC 1530, the profile shows a small rise correspondingto zones of enhanced SF near the ends of the bar, clearly visible inthe images. The inner rings near the ends of the bar in NGC 3351and NGC 3504 can be recognized as bumps in the Hα profile. A fewgalaxies (e.g. NGC 4303 and NGC 6951) clearly show the SF in thedisc outside the bar region, just as in NGC 4321 (Knapen & Beckman1996). In the case of NGC 2903 there is a dominant continuous com-ponent in the profile, and individual star-forming regions are hard toidentify. We can conclude that the radial zones identified by Knapen& Beckman (1996) in their study of NGC 4321 are not all presentin each of the galaxies studied here. However, depending on the dis-tribution of SF in the galaxies, morphologically important regionscan be recognized in the profiles, such as the CNR with enhanced,or the bar with depressed SF. In general, and as expected, the resultsobtained from the radial profiles are consistent with the morphologyas summarized in Appendix A.
Where specific zones are seen in the Hα profile, these can usuallybe recognized in the B and I profiles as well. These profiles behavein a very similar way radially: central peak; depression in the barregion, less pronounced in I, as expected for an older, redder, barpopulation; inner ring where present; and exponential disc. TheB − I colour index profile also follows the large-scale distributionof SF in most galaxies, showing a blue peak in the CNR and a reddepression in the bar zone.
4 R E L AT I V E Hα F L U X F RO M BA R SA N D C I R C U M N U C L E A R R E G I O N S
In order to study whether and how the large-scale parameters ofdiscs of galaxies influence the relative distribution of the massive SFwithin those discs, we have measured the relative Hα flux from thebars and the CNRs. We have done this by separating the images intodifferent regions: the CNR, the bar and the disc, and determiningthe flux from these areas with the aperture photometry packagewithin GAIA. The separation of the Hα images into individual areaswas done by carefully judging where the CNR and bar regions end,which is in general very easy to recognize in Hα (see Fig. 1), but alsoreferring to the I and B − I images in doing so. While this may wellintroduce a small uncertainty in our measurements, the main sourceof uncertainty, especially for the entire disc, is the determinationof the background sky value. The resulting uncertainties are of theorder of 25 per cent in the flux from the total disc, 10 per cent inthe case of the bar, and one to a few per cent in the CNRs. Giventhe uncertainties in the continuum subtraction in the nuclear regions(see Section 2.4), we conservatively increase the error margin forthe CNR flux ratio to 10 per cent.
For NGC 3516 and NGC 3982 no bar could be defined, and nobar flux values for these galaxies are included in the table. In orderto take out possible disturbing effects owing to Hα emission fromactive nuclei, we subtracted the flux from a nuclear point source,where present, from the CNR flux. Only in one galaxy (NGC 3516) isthe nuclear Hα flux fraction high (44 per cent) and hard to determine,and we do not consider this galaxy in the analysis below. Of thethree galaxies with nuclear flux fractions of 8–9 per cent, in two thenuclear point source is easy to identify (NGC 3982 and NGC 4314,see Figs 1g and i), whereas in NGC 3504 the uncertainty is slightlyhigher. In all other galaxies, the nuclear Hα flux fraction is zero orlow (0–3 per cent) and relatively easy to determine. Table 4 lists
Table 4. Relative flux from the disc, bar and circumnuclear regions.The latter does not contain the flux from the nuclear point source, ifpresent, which is also why the percentages given here do not add upto 100 per cent in all galaxies. Typical uncertainties are 25 per cent,10 per cent and a few to 10 per cent for disc, bar and CNR values,respectively (see text).
Galaxy Per cent Per cent Per centflux from flux from flux fromthe disc the bar the CNR
(excluding bar (excluding CNR) (excluding nucleus)and CNR)
NGC 1300 67 24 9NGC 1530 31 37 29NGC 2903 68 19 13NGC 3351 51 10 38NGC 3504 6 20 66NGC 3516 11 0 45NGC 3982 91 0 0NGC 4303 69 19 12NGC 4314 0 17 74NGC 4321 73 11 16NGC 5248 63 14 20NGC 6951 77 7 15
the relative fluxes thus obtained for the CNR, bar, and disc, for oursample galaxies.
In certain sample galaxies (NGC 3504 and NGC 4314) the Hα
flux from the CNR dominates the total Hα emission from the hostgalaxy. The relative contribution of the bar itself is substantial ingalaxies such as NGC 1300 and NGC 1530, but is generally at thelevel of around 10 per cent of the total flux. The contribution fromthe disc is very small or even negligible in NGC 3504, NGC 3516and NGC 4314, substantial or dominant in all others.
Various authors have used far-infrared (FIR) colour indices as di-rect estimators of current SF activity. Puxley, Hawarden & Mountain(1988) established a value of log (S12/S25) < −0.35 as a signature ofthe existence of regions of SF. Dultzin-Hacyan, Moles & Masegosa(1988) studied a sample of H II galaxies and discussed the useof log (S25/S100) to evaluate the SF activity, giving median valuesof log (S25/S100) = −1.4 for normal galaxies, −1.15 for LINERs,−0.8 for starburst and Seyfert 2 galaxies, and −0.5 for Seyfert 1galaxies. Martinet & Friedli (1997), using the same parameter,considered two classes of FIR colours (log(S25/S100) �−1.2 andlog(S25/S100) < −1.2) corresponding to more or less pronounced SFactivity, respectively.
We have compiled IRAS fluxes for our sample galaxies fromthe literature (Table 5). We explored possible relations between theIRAS index log (S25/S100), used as an indicative value to quantify theglobal SF, and the length and strength of the bars, but found no trendsfrom our small sample of galaxies (e.g. Fig. 4 shows the IRAS indexversus bar strength Qb). From larger samples of galaxies, but usingless reliable methodology, Martinet & Friedli (1997) and Aguerri(1999) found that galaxies with enhanced global SF as measuredfrom their IRAS fluxes tend to have longer and more elliptical bars.1
Equally, we cannot distinguish any trends in the distribution of SFas a function of bar strength Qb (as an example, we show the runof the relative flux from the CNR against bar strength in Fig. 5) orlength (not shown) of the bar. A related conclusion is drawn by Sheth
1 Note that both these studies used bar parameters determined from opticalimaging, and that Aguerri did not deproject these parameters.
C© 2002 RAS, MNRAS 337, 808–828

822 J. H. Knapen, D. Perez-Ramırez and S. Laine
Table 5. IRAS flux values for our sample galaxies, as obtained from Moshiret al. (1990).
Galaxy S25 Per cent S100 Per cent log(S25/S100)(W m−2 Hz−1) error (W m−2 Hz−1) error
NGC 1300 2.30E−27 0 1.03E−25 10 −1.65±0.16NGC 1530 8.40E−27 7 2.19E−25 9 −1.42±0.16NGC 2903 2.90E−26 6 1.01E−24 7 −1.54±0.14NGC 3351 2.09E−26 12 3.35E−25 18 −1.20±0.26NGC 3504 3.73E−26 9 3.27E−25 16 −0.94±0.17NGC 3516 8.94E−27 7 2.26E−26 6 −0.40±0.04NGC 3982 8.33E−27 3 1.52E−25 3 −1.26±0.05NGC 4303 1.40E−26 1 6.47E−25 3 −1.66±0.05NGC 4314 3.62E−27 12 7.14E−26 13 −1.29±0.23NGC 4321 1.57E−26 11 5.62E−25 11 −1.55±0.24NGC 5248 1.74E−26 12 4.45E−25 13 −1.41±0.25NGC 6951 1.37E−26 3 3.75E−25 3 −1.44±0.06
Figure 4. IRAS index log(S25/S100) as a function of the strength of the bar,Qb.
Figure 5. Relative flux from the CNR (excluding the nucleus), plotted as afunction of the strength of the bar, Qb.
(2001) who finds that the ratio of nuclear over disc molecular gassurface density does not correlate with the length of the bar. Thisratio itself is much enhanced in barred with respect to non-barredgalaxies (see also Sakamoto et al. 1999).
Fig. 6 presents the run of the relative flux from the CNR againstthe IRAS log(S25/S100) index, quantifying the global SF. It shows
Figure 6. Relative flux from the CNR (excluding the nucleus) vs. the IRASindex log(S25/S100). Typical errors along the x-axis are a few to 10 per cent(see text).
that a higher Hα flux fraction from the CNR leads to higher IRASindices. This may be caused by the IRAS index being more sensitiveto CNR SF, which is concentrated in a more dusty environment thandisc SF. It may also imply, though, that the more centrally concen-trated the star formation is, the more SF takes place in absolute termsin the whole of the host galaxy. Although we subtracted the Hα fluxwhich might be a result of non-stellar nuclear activity rather thancircumnuclear SF, a caveat here is the role played by nuclear activ-ity in the FIR emission, which we cannot quantify for our samplegalaxies in the absence of FIR spectroscopy. On the basis of studiesof other galaxies (see e.g. Genzel & Cesarsky 2000), though, we es-timate that the Seyfert nucleus contributes at most 20 per cent, andpossibly as little as 5 per cent, to the total flux, with the exceptionof NGC 3516. For this galaxy, already excluded from our analysison other grounds, Mouri & Taniguchi (2002) claim that the FIRluminosity is dominated by the AGN contribution. Only the studyof a larger sample of galaxies can confirm the tentative relation wereport here. We have started to undertake such a larger study.
5 O R I E N TAT I O N O F BA R SA N D N U C L E A R R I N G S
From our Hα images and radial profiles we have measured the sizesof the nuclear rings, the deprojected differences between the PAs of
C© 2002 RAS, MNRAS 337, 808–828

Circumnuclear regions of barred galaxies – II 823
Figure 7. Difference between the major axis PAs of the nuclear ring and thebar which hosts it, as a function of bar strength Qb. Typical uncertainties are7 per cent in PA offset and 0.1 in Qb.
the major axes of the rings and of the large-scale bar of their hostgalaxies, as well as the deprojected, or intrinsic, ellipticities of therings (Table 3). Since for most of our galaxies we also know the barstrength, we can now, for the first time, explore observationally howthese geometric ring parameters depend on the strength of the barpotential that hosts them.
The relative orientations of the nuclear rings span the completerange from aligned to perpendicular to the bar, with no preferredPA offset. This was also found by Buta & Crocker (1993). Theseauthors describe a number of caveats in the derivation of PA offsetswhich also apply to our work, namely selection effects, sample size,and difficulty of properly defining ring shapes and orientation. InFig. 7, we plot the observed PA offset between the nuclear ring andthe bar as a function of the bar strength Qb. Even though the galaxywith the weakest bar (NGC 5248) has the smallest PA offset and theone with the strongest bar (NGC 1530) one of the largest, there isno obvious correlation.
Fig. 8 shows the run of the relative size of the nuclear ring, de-fined as the ring diameter divided by the host galaxy diameter, as afunction of bar strength Qb. It is seen that stronger bars host smaller
Figure 8. Relative size of the nuclear ring (ring diameter divided by D25 ofthe galaxy) as a function of bar strength Qb (filled dots). Typical uncertaintiesare 10 per cent in relative ring size and 0.1 in Qb. Crosses indicate averagesof the data points with Qb values between 0 and 0.25 (3 galaxies), 0.26 and0.35 (4), and 0.39 and 1 (3), respectively.
Figure 9. Deprojected, or intrinsic, ellipticity of the nuclear ring as a functionof bar strength Qb. Typical uncertainties are 0.05 in ring ε and 0.1 in Qb.
rings. Finally, Fig. 9 shows that the intrinsic ellipticity of the ringsdoes not vary with different bar strength.
Numerical modelling (e.g. Knapen et al. 1995b; Heller &Shlosman 1996) gives important clues to the evolution of the geo-metric properties of a nuclear ring which forms near the ILRs in abarred galaxy. The first point to note is that stronger, thinner, barslead to smaller nuclear rings, exactly as we see here in Fig. 8. Thiscan be seen, e.g. in fig. 11 of Knapen et al. (1995b), from the formand extent of the representative stellar periodic orbits in a bar withILRs. The main orbit family, that of the so-called x1 orbits (seeContopoulos & Papayannopoulos 1980), forms the backbone of thestellar bar. A second orbit family, that of the x2 orbits, is orientedperpendicularly to the x1 orbits in the region of the ILRs. Sincenuclear rings are gaseous features, it is important to note that gascan only populate those regions where the x1 and x2 orbits are notintersecting, which is the inner part of the galaxy. Fig. 11 of Knapenet al. (1995b) makes clear that, in order to avoid the intersectingorbits, gas will have to settle further in in the case of stronger, orthinner, bars. This then leads to smaller areas where the nuclearring can form, and thus to smaller nuclear rings. Of course smallernuclear rings in this context is a relative term, and we have chosenhere to use the size of the ring relative to the total size of the galaxy(following Laine et al. 2002). However, if we use the size of thering relative to the length of the bar as a measure, we find a similarcorrelation (not shown) as depicted in Fig. 8.
The situation is different for both the PA offsets from the bar, andthe intrinsic ellipticities, of the nuclear rings. As described by, e.g.Knapen et al. (1995b) and Shlosman (1999), these parameters areregulated primarily by the gas inflow into the CNR. As can be seenin, e.g. fig. 13 of Knapen et al. (1995b), less inflow will lead to asmaller leading angle of the ring with respect to the bar, and to asmaller ellipticity of the ring: it becomes rounder. Since gas inflowdoes not depend exclusively on the parameters of the bar, such as itsstrength, but more generally on the availability of fuel, correlationsof ring ellipticity and PA offset are not expected, and in fact notobserved (Figs 7 and 9). The dynamical time-scale in the CNR isof the order of 107 yr, and thus the availability of the fuel can beexpected to be variable, further eliminating any correlation with,e.g. the bar strength. Because the dynamical time-scale of a largestellar bar is much longer (∼108 yr) the size of a nuclear ring willbe much more stable in time, given the arguments outlined in thepreceding paragraph. This picture is nicely illustrated by the recentresults of Jogee et al. (2002b) for the nuclear ring of NGC 5248.
C© 2002 RAS, MNRAS 337, 808–828

824 J. H. Knapen, D. Perez-Ramırez and S. Laine
They found that the younger population in the ring, as traced byFUV emission, outlines spiral arms and is more elliptical in shape,whereas the relaxed ring, as seen in older stellar population, is muchrounder.
6 BA R S A N D D U S T L A N E S W I T H I N T H E M
Colour index maps reveal interesting symmetric dust lane patternsin the bars of strongly and weakly barred galaxies. The curvatureof the dust lanes has theoretically been related to the strength ofthe bar, in the sense that weak bars are associated with curved dustlanes, whereas strong bars have straight dust lanes (Athanassoula1992b).
We have used a simple method to measure and quantify the cur-vature of the dust lanes, in an attempt to probe the anticorrelationtheoretically predicted by Athanassoula (1992b) between the de-gree of curvature of the bar dust lanes and the strength of the bar.From deprojected B − I and B-band images, where the dust lanesare well visible, we have measured the change in the angle of thetangent to the curved dust lane, and express the result �α in units ofdegrees per kpc distance along the dust lane. We ignore those partsof the dust lanes (e.g. where the lanes connect to the CNR) wherethe curvature increases or decreases sharply. Well-defined, twofoldsymmetric dust lanes could not be identified clearly enough in NGC2903, NGC 3516, and NGC 3982, and these galaxies are not con-sidered in the analysis below.
In this scheme, the lowest values of �α correspond to the straight-est class of dust lanes (e.g. NGC 6951), whereas the highest valuesobviously correspond to the most curved lanes (e.g. NGC 5248).The measurements were made along the largest possible stretch ofdust lane, which in all cases runs from just outside the CNR to verynear the end of the bar. Since dust lanes have rather constant cur-vature over this entire range, use of a smaller part of the lanes toderive �α would lead to the same values, but with larger uncertain-ties simply because the linear range involved would be smaller. Weestimate typical errors in �α to be of the order of 3◦ kpc−1, whereuncertainties in the distance to the galaxy, and in the definition of thecurvature of the dust lane from the images are the main contributingfactors. The resulting values are tabulated in Table 5 and plottedagainst deprojected bar ellipticity in Fig. 10, and against Qb inFig. 11.
Figure 10. Deprojected ellipticity of the bar as a function of dust lane cur-vature index �α. Straight dust lanes in the bar are on the left side of thediagram, and thin bars are towards the top. Typical uncertainties are 0.05 inbar ε and 3◦/kpc in �α.
Figure 11. As Fig. 10, but now with bar strength Qb. Typical uncertainty inQb is 0.1.
The theoretically expected trend of more curvature of the dustlanes in weaker bars is borne out clearly in the run of Qb versusdust lane curvature, but much less clearly so, if at all, in the run ofbar ellipticity. This is in fact the first time that a correlation betweenbar strength and dust lane curvature has been observed for a sample(albeit admittedly small) of bars. We thus confirm observationallythe prediction from theory and modelling (e.g. Athanassoula 1992b).The fact that the correlation shows up much less clearly when barellipticity is considered does not contradict this confirmation, giventhe poor correlation between bar ellipticity and Qb shown by Blocket al. (2001). We looked for, but did not find, correlations betweenthe curvature of the dust lanes and parameters like host galaxy typeor inclination angle.
7 S U M M A RY
This paper is the second of a pair presenting results of our studyof how the general structure of barred galaxies is related to, andpossibly determines, the presence and properties of dynamical fea-tures such as rings and spirals in their CNRs. We present opticalbroad and narrow-band imaging of our sample galaxies in B, I andHα in order to map the structural components across the discs ofthese barred galaxies. The 12 galaxies in our sample are all nearbyspiral galaxies known to host star-forming circumnuclear ring-likestructure. We present graphically our optical images and the radialprofiles we derived from these by ellipse fitting. From these data,we infer geometric and dynamical parameters such as bar lengthsand ellipticities, and location of SF and general dust structures, andcombine these with parameters obtained from the literature.
Our main results can be summarized as follows.
(i) For the first time using bar strengths (Qb values from the lit-erature) rather than ellipticity, and using NIR imaging of the bars,we checked the previously found correlation between bar strengthand length, i.e. longer bars are also stronger. Our results are confus-ing because bar length as such correlates with bar strength, but barlength relative to, e.g. the size of the galaxy does not. Careful studyof larger samples is needed.
(ii) The FIR index log(S25/S100), a SF indicator, is used to verifywhether the strength of the bar is connected to the global SF activity.We find no relation with the bar strength Qb nor with the length ofthe bar.
(iii) We measure the relative Hα flux from the disc, bar andCNR components in the galaxies. We find that the more centrally
C© 2002 RAS, MNRAS 337, 808–828

Circumnuclear regions of barred galaxies – II 825
concentrated the Hα emission is (i.e. the higher the fraction of totalSF from the CNR), the more SF takes place in absolute terms inthe galaxy, as estimated from the FIR flux ratios. This is possiblycaused by the IRAS index being more sensitive to CNR SF, whichis concentrated in a dust-rich environment. Alternatively, the CNRSF activity as measured from Hα is related to the overall SF activity,as measured in the FIR, of the disc. We find no correlation betweenthe relative Hα flux from the disc, the bar, and the CNR with barstrength, nor with bar length.
(iv) We explore relations between the strength of the bar and thegeometric parameters of the nuclear rings, namely their size relativeto the galaxy disc, intrinsic inclination, and PA offset between themajor axes of the nuclear ring and the bar which hosts it. We findthat stronger bars tend to host smaller rings, but that the bar strengthis unrelated to both the PA offset and the intrinsic ring ellipticity.The fact that smaller rings occur in stronger bars can be understoodfrom bar orbit theory, which predicts that stronger bars limit theregion where x2 orbits can exist, and thus in turn the size of thenuclear ring. As known from numerical modelling, both PA offsetand intrinsic ring ellipticity depend primarily on the mass inflowrate into the nuclear ring, which in turn is determined only in partby the strength of the bar, but more directly on the availability offuel, and on temporal variations therein.
(v) We present a new, reproducible, measure of the curvatureof dust lanes in bars, a parameter which was theoretically linkedabout a decade ago to the strength of the bar. This link is throughgas shocking under the influence of the bar potential, at the locationwhere pairs of symmetric dust lanes are seen along the bars in opticalimages. We indeed confirm that the stronger the bar, the straighterits dust lanes. This is in fact the first observational confirmation ofthis theoretical result, based on the use of both a sample (admittedlystill rather small) of galaxies, and of quantitative measures of bothdust lane curvature and bar strength.
From these results, we can confirm that indeed the CNRs of barredgalaxies are intimately linked to their host galaxies, and that their SFand morphological properties are determined to a significant degreeby the properties of, mainly, the large bar. The small size of oursample precludes a detailed exploration of the correlations that wehave found. Studies using larger samples of nuclear ring galaxies areneeded to test more fully the predictions and results from theory andmodelling, and to explore further relations between the parametersgoverning the CNR, the bar, and the disc.
AC K N OW L E D G M E N T S
We thank Milagros Ruız and Sharon Stedman for help during the ob-serving runs and for discussions, and Reynier Peletier for his help inthe preparation of Fig. 1. We thank Isaac Shlosman for illuminatingdiscussion on bars and rings, and David Axon for discussions aboutsubtracting the Hα continuum. We thank Ron Buta for calculatingQb values for NGC 1530 and NGC 6951. An anonymous refereeis acknowledged for comments which greatly helped to improvethe presentation of our results. This research has made use of theNASA/IPAC Extragalactic Database (NED) which is operated bythe Jet Propulsion Laboratory, California Institute of Technology,under contract with the National Aeronautics and Space Admin-istration. The Jacobus Kapteyn and Isaac Newton Telescopes areoperated on the island of La Palma by the ING in the Spanish Ob-servatorio del Roque de los Muchachos of the Instituto de Astrofısicade Canarias. Data were partly retrieved from the ING archive.
R E F E R E N C E S
Aguerri J. A. L., 1999, A&A, 351, 43Alonso-Herrero A., Ryder S. D., Knapen J. H., 2001, MNRAS, 322, 757Athanassoula E., 1992a, MNRAS, 259, 328Athanassoula E., 1992b, MNRAS, 259, 345Benedict G. F. et al., 1993, AJ, 105, 1369Block D. L., Puerari I., Knapen J. H., Elmegreen B. G., Buta R., Stedman
S., Elmegreen D. M., 2001, A&A, 375, 761Boker T. et al., 1999, ApJS, 124, 95Buta R., Block D. L., 2001, ApJ, 550, 243Buta R., Combes F., 1996, Fund. Cosmic Phys., 17, 95Buta R., Crocker D. A., 1993, AJ, 105, 1344Buta R., Crocker D. A., Byrd G. G., 1999, AJ, 118, 2071Chapelon S., Contini T., Davoust E., 1999, A&A, 345, 81Colina L., Arribas S., 1999, ApJ, 514, 637Colina L., Garcıa Vargas M. L., Mas-Hesse J. M., Alberdi A., Krabbe A.,
1997, ApJ, 484, L41Combes F., Gerin M., 1985, A&A, 150, 327Contopoulos G., Papayannopoulos T., 1980, A&A, 92, 33de Vaucouleurs G., de Vaucouleurs A., Corwin J. R., Buta R. J., Paturel G.,
Fouque P., 1991, Third reference catalogue of Bright galaxies. Springer-Verlag, New York (RC3)
Downes D., Reynaud D., Solomon P. M., Radford S. J. E., 1996, ApJ, 461,186
Dultzin-Hacyan D., Moles M., Masegosa J., 1988, A&A, 206, 95Elmegreen B. G., Elmegreen D. M., 1985, ApJ, 288, 438Friedli D., Wozniak H., Rieke M., Martinet L., Bratschi P., 1996, A&AS,
118, 461Genzel R., Cesarsky C. J., 2000, ARA&A, 38, 761Gonzalez Delgado R. M., Perez E., 1997, ApJS, 108, 199Heller C., Shlosman I., 1996, ApJ, 471, 143Jogee S., Knapen J. H., Laine S., Shlosman I., Scoville N. Z., 2002a, ApJ,
570, L55Jogee S., Shlosman I., Laine S., Englmaier P., Knapen J. H., Scoville N. Z.,
Wilson C. D., 2002b, ApJ, 575, 156Knapen J. H., 1998, MNRAS, 297, 255Knapen J. H., 1999, in Beckman J. E., Mahoney T. J., eds, ASP Conf. Ser.
Vol. 187, The Evolution of Galaxies on Cosmological Timescales. ASP,San Francisco, p. 72
Knapen J. H., Beckman J. E., 1996, MNRAS, 283, 251Knapen J. H., Beckman J. E., Shlosman I., Peletier R. F., Heller C. H.,
de Jong R. S., 1995a, ApJ, 443, L73Knapen J. H., Beckman J. E., Heller C. H., Shlosman I., de Jong R. S., 1995b,
ApJ, 454, 623Knapen J. H., Beckman J. E., Shlosman I., Mahoney T. J., eds, 2001, ASP
Conf. Ser. Vol. 249, The Central Kiloparsec of Starbursts and AGN: TheLa Palma Connection. ASP, San Francisco
Knapen J. H., Shlosman I., Peletier R. F., 2000a, ApJ, 529, 93Knapen J. H., Shlosman I., Heller C. H., Rand R. J., Beckman J. E., Rozas,
M., 2000b, ApJ, 528, 219Laine S., Heller C. H., 1999, MNRAS, 308, 557Laine S., Knapen J. H., Perez-Ramırez D., Doyon R., Nadeau D., 1999,
MNRAS, 302, L33Laine S., Knapen J. H., Perez-Ramırez D., Englmaier P., Matthias M., 2001,
MNRAS, 324, 891Laine S., Shlosman, I., Knapen, J. H., Peletier, R. F., 2002, ApJ, 567, 97Laurikainen E., Salo H., Rautiainen P., 2002, MNRAS, 331, 880Martin P., 1995, AJ, 109, 2428Martinet L., Friedli D., 1997, A&A, 323, 363Moshir M. et al., 1990, IRAS Faint Source Catalogue, version 2.0. JPL
Infrared Processing and Analysis Center, PasadenaMouri H., Taniguchi Y., 2002, ApJ, 565, 786Perez–Ramırez D., Knapen J. H., 1998, in Sofue Y., ed., IAU Symp. 184,
The Central Regions of the Galaxy and Galaxies. Kluwer, Dordrecht,p. 113
Perez–Ramırez D., Knapen J. H., Peletier R. F., Laine S., Doyon R., NadeauD., 2000, MNRAS, 317, 234 (Paper I)
C© 2002 RAS, MNRAS 337, 808–828
826 J. H. Knapen, D. Perez-Ramırez and S. Laine
Phillips A. C., 1993, A&AS, 183, 2306Phillips A. C., 1996, in Buta R., Crocker D. A., Elmegreen B. G., eds, ASP
Conf. Ser. Vol. 91, Barred galaxies. ASP, San Francisco, p. 44Piner B. G., Stone J. M., Teuben P. J., 1995, ApJ, 449, 508Pogge R. W., 1989, ApJS, 71, 433Puxley P. J., Hawarden T. G., Mountain C. M., 1988, MNRAS, 231, 465Rautiainen P., Salo H., 2000, A&A, 362, 465Regan M. W., Teuben P.J., Vogel S.N., van der Hulst, T., 1996, AJ, 112, 2549Regan M. W., Vogel S. N., Teuben P. J., 1997, ApJ, 482, L143Rozas M., Beckman J. E., Knapen J. H., 1996, A&A, 307, 735Sakamoto K., Okumura S. K., Ishizuki S., Scoville N. Z., 1999, ApJ, 525,
691Sellwood J. A., Wilkinson A., 1993, Rep. Prog. Phys., 56, 173Sersic J. L., Pastoriza M. G., 1967, PASP, 79, 152Sheth K., 2001, in Knapen J. H., Beckman J. E., Shlosman I., Mahoney T. J.
eds, ASP Conf. Ser. Vol. 249, The Central Kiloparsec of Starbursts andAGN: The La Palma Connection. ASP, San Francisco, p. 605
Shlosman I., 1999, in Beckman J. E., Mahoney T. J., eds, ASP Conf. Ser.Vol. 187, The Evolution of Galaxies on Cosmological Timescales. ASP,San Francisco, p. 100
Shlosman I., Peletier R. F., Knapen J. H., 2000, ApJ, 535, L83Wozniak H., Friedli D., Martinet L., Martin P., Bratschi P., 1995, A&AS,
111, 115
A P P E N D I X A : N OT E S O N I N D I V I D UA LG A L A X I E S
A1 NGC 1300
This barred galaxy is a prototype grand-design SBb spiral. It hasa very prominent and smooth bar and two spiral arms that startabruptly at the end of the bar (Fig. 1a). In our B − I image, wecan see two straight, offset dust lanes rather parallel to the majoraxis of the bar. These dust lanes are smooth when compared withthe arms, which corresponds to a lack of distinct emitting regions.It is also apparent from our colour map that, near the ends of thebar, the bar dust lanes join the dust lanes along the inner edge ofthe arms. SF is not obvious in the bar, nor in the nucleus. TheCNR is a site of considerable SF, concentrated in a small area.There is a concentration of H II regions where the arms join the bar,and mainly so on the western side. The western arm also containsseveral very luminous H II regions, while the eastern arm showssome less luminous enhancements. The Hα profile shows a modestpeak of luminosity at radii corresponding to those of the CNR, anda gradual decrease in the region of the bar. The radial profiles reflectand confirm the distribution of SF in this galaxy.
The nuclear ring in NGC 1300 (Figs 1a and 2a) is rather smallangularly, and our Hα image does not give much information. It isclear, however, that the massive SF occurs in a number of discreteclumps (see also Pogge 1989), which are not reproduced in the NIRcolour index images. Whereas the nuclear ring is incomplete in Hα,it appears complete in the NIR, although in Paper I we showed thatthe NIR ring is in fact a pair of tightly wound spirals. The HSTimage (fig. 1 of Paper I) shows structure in the nuclear ring, but nohotspots corresponding to the Hα emission peaks.
A2 NGC 1530
NGC 1530 (Fig. 1b) has a large and moderately elliptical bar and twowide open spiral arms originating from its ends. Its most prominentfeature, however, is a bright mini-spiral at a radius of 10 arcsec fromthe nucleus, and extended roughly perpendicularly to the bar. Thisfeature can be seen best in the Hα and B − I images. From CO andH I observations (e.g. Downes et al. 1996; Regan et al. 1996) it is
known that a large amount of gas is present in the centre. Despitethis, the galaxy has a relatively modest SF rate near the nucleus,which can be explained by the trapping of gas in x2 orbits near aninner ILR, inhibiting further infall. The gas will thus not reach thecritical density that is needed to make the galaxy a true starburst(Downes et al. 1996). In our Hα image, we find relatively weakSF sites along the bar, at the ends of the bar, and along the spiralarms. In the CNR we find two distinct strongly emitting regions,from where the arms of the mini-spiral seem to start. The Hα profileshows a peak at the centre, a dip in the region of the bar, and a slightincrease at roughly the radius where the bar joins the disc spiralarms. Our B − I image shows two curved dust lanes emerging fromthe nucleus, which continue along the bar. Again, as in NGC 1300,it is apparent from our colour map that, near the ends of the bar, thebar dust lanes join those along the inner edge of the arms.
The two symmetrically placed clumps of massive SF (Figs 1band 2b) are not obvious in the colour map, and seem to be hiddenby the spiral structure. They appear similar to K1 and K2 in M100(Knapen et al. 1995a), however, whereas in M100 K1 and K2 aremost obvious in the NIR, the peaks are not conspicuous at all in ourNIR images of NGC 1530, not even in the HST image (Paper I).Hα emission is seen to follow the northern miniature spiral arm,coinciding with the red spiral arm fragment in the NIR colour indeximage.
A3 NGC 2903
NGC 2903 is a ‘hotspot’ galaxy with a circumnuclear starburst. TheB − I colour map reveals a beautiful and complex multi-armed duststructure, but no clear pair of dust lanes in the bar (Fig. 1c). In theHα images we see SF along the bar and in the arms, mostly in thesouthern arm, and in the CNR. Very luminous H II regions delineatethe bar and arms in this galaxy. The Hα profile drops smoothly,outlining continuous and strong H II emission all the way from thecentre to the ends of the bar, and further out into the disc. The profilesshow a lot of structure throughout the CNR and disc, caused by thecombined effects of dust extinction and SF activity. Blue dips in theB − I profile are accompanied by enhancements in the Hα and insome cases the B profiles. No NIR PA and ellipticity profiles aregiven because these could not be fitted in Paper I.
The Hα emitting regions do not all correspond in position andintensity to the NIR hotspots (Fig. 2c). Our Hα image shows justthree of them, whereas our ground-based NIR images, and espe-cially the HST NIR image (Paper I), show a plethora of individ-ual emitting regions. A detailed study of the SF properties of theCNR in this galaxy, using HST archival Hα and Pa α imaging andNIR spectroscopy, in combination with stellar population synthesismodelling, has recently been published by Alonso-Herrero, Ryder& Knapen (2001).
A4 NGC 3351
NGC 3351 shows a nuclear ring and a larger, inner, ring of H II re-gions that encircles the stellar bar (Fig. 1d). The B − I image showstwo straight dust lanes emerging from an elliptical ring-like regionsurrounding the nuclear ring. The SF in this galaxy is significant andconcentrated in the CNR and the inner ring. From the Hα profile wecan see a constant, high level in the nucleus, and a decrease alongthe bar. The profiles display a pronounced peak, coincident withthe location of the nuclear ring, at around 10 arcsec radius, and asecondary peak corresponding to the inner ring. Both these peaksappear blue in the B − I colour plot reflecting the underlying SF.
C© 2002 RAS, MNRAS 337, 808–828

Circumnuclear regions of barred galaxies – II 827
In the close-up of the Hα image of the CNR, the circumnuclearring is clearly visible, outlined by clumps of SF. For NGC 3351we have only a ground-based K-band image at our disposal, alongwith an HST H-band image (Paper I). The correspondence of theSF clumps of its nuclear ring as seen in Hα with those seen in theNIR is obvious from Fig. 2(d), where the Hα contours are shownoverlaid on the K-band image, and can be further traced in the HSTimage.
A5 NGC 3504
NGC 3504 is an inclined barred galaxy with a nuclear starburst. Thedouble nuclear peak seen in the NIR (Paper I) does not show up inour optical images owing to the limited spatial resolution. The B − Icolour map shows two curved dust lanes in the bar region, but verylittle organized dust in the disc region (Fig. 1e). In our Hα image,we see an elliptical region around the nucleus, where SF activity isintense. Outside the CNR, the most luminous H II regions are foundnear the ends of the bar, but SF is also prominent in the rest of thesurrounding disc structure. The radial Hα profile shows a decreasefrom the nucleus to the radius corresponding to the end of the bar,where enhanced SF activity causes a local maximum in the profile.The B − I radial profile shows a blue peak at the same radius, ofabout 50 arcsec. The values for the B − I colour are between 1.5and 2. The central Hα emission in NGC 3504 (Fig. 2e) is elongatedin the direction of the double nucleus, as discussed in Paper I.
A6 NGC 3516
This galaxy hosts a Seyfert 1.5 nucleus, but shows little structure inthe optical. The images displayed in Fig. 1(f) have a field of viewroughly half as big as the rest of the galaxies, owing to the largerdistance and smaller angular size of this galaxy. The Hα imageshows enhanced emission from the nuclear region, not necessarilyfrom SF but quite possibly from the AGN. We do not detect anysign of SF in the bar or disc of this galaxy. The B − I colour indeximage shows no convincing structure in the disc, except possibly tworedder regions near the ends of the (main) bar. The nucleus is red,as seen in the B − I image and profile, but the white patches seenin the image (Fig. 1f) may be artificial and induced by the nearbypresence of the strong nuclear peak. The B − I profile decreasesfrom the nucleus, and becomes stable at 2.5 mag. The Hα emissionin the CNR of NGC 3516 (Fig. 2f) is featureless apart from a slightextension in the east–west direction.
A7 NGC 3982
NGC 3982 is one of two barred spirals with a Seyfert 2 nucleusin our sample. The presence of a small bar, at a radius of around10 arcsec, is evident from the I-band image (Fig. 1g) and fromthe ellipticity and PA profiles. Further out, the disc is dominatedby a spiral pattern. The B − I colour index image displays a richmulti-armed spiral pattern in dust and SF, but is rather smooth nearthe nucleus. This multi-armed spiral pattern is clear also in the Hα
image, with several luminous clumps of SF located mainly in thearm south of the nucleus, and slightly less in the arm north of it.The nucleus of this galaxy, while neutral in B − I , is a relativelystrong Hα emitter. We cannot say how much of this emission isdue to stars or the AGN, but the latter is a likely contributor. TheHα profile displays a peak in the nucleus, followed by a dip anda secondary peak corresponding in radius to the zone where theSF sites in the spiral arms are located. The profile drops rapidlyafter a radius of 20–25 arcsec. The B − I profile reflects the Hα
peak due to the spiral arm SF as a blue depression. The calibrationof our B and I-band data is subject to larger uncertainties than inother galaxies, because no aperture photometry was available forthis galaxy. We use average values for the B and I surface brightnessand B − I colour, as derived from those other sample galaxies forwhich calibration was available, and concentrate on the changes incolours rather than on the exact calibrated value.
The CNR of NGC 3982 (Fig. 2g), which may in fact be interpretedas the emission from the relatively compact disc of this galaxy (thescalelength of the exponential disc is only 0.6 kpc – Table 1), showsmany individual sites of Hα and NIR emission. The relationshipbetween these two kinds of emission is not clear, however, due tothe relatively small signal to noise ratio in the areas of interest.Comparison with the HST image as shown in Paper I, however,indicates that the same individual regions are responsible for Hα
and NIR emission.
A8 NGC 4303
The second Seyfert 2 host galaxy in our sample shows a well-definedbar in the I-band image (Fig. 1h). The B − I image shows two dustlanes in the bar region, which join the inner edge of the spiral arms,and continue as arm dust lanes. The radial profiles in Hα and Bshow a central peak in surface brightness, followed by a decreaseto the radius corresponding to the end of the bar where a secondarypeak is located, and a steeper decrease in the disc. The B − I profilereflects these zones as well. The Hα image shows SF activity alongthe arms and at the ends of the bar, where the bar joins the arms.An especially large concentration of H II regions is located near thenorthern end of the bar, and a smaller number of H II regions, but ofhigher luminosity, are found near the southern end. No SF is visiblein the bar itself, but the CNR (Fig. 2h) is the site of substantial Hα
emission, the morphology of which is however not fully resolvedwith our imaging. The B − I image reflects in blue colours wherethese main sites of SF are. The fact that the CNR, so bright in Hα,is not as blue as the regions near the ends of the bar may indicatesubstantial amounts of dust in the central regions. Alternatively, asubstantial fraction of the CNR Hα emission is due to the Seyfertnucleus and not to circumnuclear SF. We refer to Colina et al. (1997)and Colina & Arribas (1999) for more detailed imaging of the CNRof this galaxy.
A9 NGC 4314
NGC 4314 is a symmetrical SBa galaxy with a long stellar bar andtwo faint outer spiral arms, not visible in our rather shallow I-bandimage (Fig. 1i). The Hα image shows a number of H II regionsforming an incomplete bright nuclear ring, and substantial emissionfrom the (LINER) nucleus. There is no sign of SF activity in the baror disc of this galaxy. In fact, 94 per cent of the total Hα emissionfrom the galaxy originates in the central region (Pogge 1989). In theB − I colour map, the bar is rather featureless, but in the CNR we seeseveral well-defined blue knots corresponding to the sites of SF, anda pair of short dust lanes which depart from the circumnuclear ring.In the NIR colour index images in Paper I, these dust lanes were seento form a smooth and continuous ring. The presumed continuationof these dust lanes into the bar cannot be distinguished in the image.The morphology of the galaxy can clearly be recognized in the Hα
profile: a nuclear peak followed by a depression, a secondary peakat the radius of the star-forming CNR, and a rapid fall-off outside theCNR. The CNR can be recognized as a dip in the B − I profile, aswell as in the B-band profile as a peak resulting from enhanced blue
C© 2002 RAS, MNRAS 337, 808–828

828 J. H. Knapen, D. Perez-Ramırez and S. Laine
emission. We find no evidence for a double bar in this galaxy, neitherfrom our own NIR (Paper I) and optical data, nor from the HST NIRimage shown in Paper I. The ellipticity does go up slightly around10 arcsec in radius, but this rise is accompanied by large changes inPA; these changes are most probably caused by the strongly emittingdistinct regions in the CNR. We thus do not confirm the suggestionby Benedict et al. (1993) and Friedli et al. (1996) of a secondarybar with a semi-major axis length of around 4 arcsec. As in thecase of NGC 3982, no aperture photometry in the I-band have beenpublished. We thus took an average calibration number from the restof our sample and applied this to the I and B − I profiles.
The Hα image of the CNR of NGC 4314 (Fig. 2i) displays fourmain discrete clumps of massive SF in an incomplete ring. The ringis visible, and appears more complete, in the J − K colour map,which shows no evidence for discrete SF sites. The Hα hotspots arelocated very near or on the red ring-like region in the colour indexmap, which points towards an origin of the NIR red colours there inmassive SF. The HST image (Paper I) shows that at high resolutionthe NIR ‘ring’ is resolved into many individual hotspots, locatedalong a pair of very tightly wound spiral arms.
A10 NGC 4321
NGC 4321 (M100) is a late-type barred galaxy with well-defined spi-ral arms and a spectacular central region which only reveals some ofits hidden features through the use of the NIR observations. Knapenet al. (1995a,b) discussed in detail the existence and origin of a stel-lar bar with a large-scale and a small-scale component, a two-armedstar-forming spiral in the CNR, and a pair of leading arms insidethe nuclear ring-like region. We have used the same optical imagesas used by Knapen & Beckman (1996) and refer the reader to thatpaper for a detailed discussion. In summary, the B − I colour indexmap shows a pair of curved dust lanes in the bar continuing into thedisc spiral arms. A string of H II regions accompanies the dust lanesin the bar. There is abundant Hα emission from the CNR and thedisc of this galaxy. Knapen (1998) catalogued almost 2000 individ-ual H II regions from the image shown here and presents a statisticalanalysis of their properties, but also discusses the Hα morphology.Knapen & Beckman (1996) presented surface brightness profilesfor, among other tracers, B, I, B − I and Hα. Although the profilesin the present paper were determined using a different ellipse fittingalgorithm, we confirm the main characteristics of the surface bright-ness and colour profiles. The ellipticity and PA profiles confirm thetwo parts of the bar (Fig. 1j).
As discussed in detail in the literature (e.g. Knapen et al. 1995a,b,2000b), images of the CNR of NGC 4321 (Fig. 2j) show goodcoincidence between the features highlighted by the J − K colourmap and the Hα contours. We can see clearly the SF clumps along thearms of the miniature spiral structure (including the characteristicK1 and K2 points – red loci accompanied by massive SF toward theSE and NW of the nucleus).
A11 NGC 5248
Laine et al. (1999) used some of the optical data presented here,in combination with our NIR data from Paper I and adaptive optics
NIR imaging, to describe the spiral structure in this galaxy at variousscales, including at scales of tens of pc, where it manifests itself inthe form of a nuclear grand-design spiral. We refer the reader toLaine et al. for a description of the general disc morphology ofNGC 5248, as well as of the CNR. Further detailed studies of theCNR and host galaxy can be found in Laine et al. (2001) and Jogeeet al. (2002a,b). Our B − I colour index map (Fig. 1k) shows apair of curved dust lanes emerging from the nuclear region, moreprominent southwest than northeast of the nucleus. Massive SF, asmeasured by Hα emission, is very strong in the CNR and in the(non-active) nucleus, and is located mainly along the spiral arms inthe bar (see Jogee et al. 2002a). The Hα profile outlines the centralregion with its peak in intensity, followed by a second maximumthat corresponds to the region of the arms where the SF is found. Inthe region of the second maximum a small bump in the B − I colourprofile is also visible. The ellipticity and PA profiles are remarkablyflat.
NGC 5248 (Fig. 2k) also exhibits massive SF sites mainly situ-ated in the nuclear ring, seen in Hα and in the HST H-band image(Paper I). The massive SF activity seems not to extend to the spiralarms and is confined to the nuclear ring and the region immediatelysurrounding it.
A12 NGC 6951
Our images of this galaxy (Fig. 1l) suffer from rather poor spatialresolution, but the strong bar and main spiral arms in the disc caneasily be identified. The B − I image shows a pair of curved dustlanes which emerges from the CNR and runs roughly parallel to thespiral arms. The enhanced SF activity in the CNR is obvious fromthe blue colour in the B − I map and from the Hα image, but theresolution in the images is too poor to show much detail (compare,e.g. with the H-band HST image shown in Paper I). The Hα imageshows SF activity across the disc, but none is observed along thebar. There is also some Hα emission from the (LINER/Seyfert)nucleus.
We encountered two problems in the process of the ellipse fitting,resulting in higher than normal uncertainties: the original imageshad saturated centres, and no aperture photometry for the I-bandwas found. We thus used average values for µI and B − I as la-belled in the appropriate profiles in Fig. 1l. We see no evidence foran inner bar from our combined optical and NIR profile fits, con-trary to the suggestion of Wozniak et al. (1995) as based on opticalimaging, a suggestion which, however, could not be unambiguouslyconfirmed by the same team from their NIR imaging (Friedli et al.1996).
NGC 6951 (Fig. 2l), like NGC 5248, shows miniature spiral struc-ture in the HST image, but this spiral is not resolved in our Hα imageand the clumps of massive SF seem to be confined to the ring. Asin e.g. NGC 4314, the regions of massive SF as traced by Hα emis-sion coincide in radius with the red ‘ring’ as traced by the J − Kimage.
This paper has been typeset from a TEX/LATEX file prepared by the author.
C© 2002 RAS, MNRAS 337, 808–828