circular variable filter unclassified inu//linin -- elu ... · sensor consists of two 180-degree...
TRANSCRIPT

1 AD-A109 89A BOSTON COLL CHESTNUT HILL MA SPACE DATA ANALYSIS LAB F/6 20/6ANALYSIS OF PROJECT EXCEDE II CIRCULAR VARIABLE FILTER SPECTRON--ETC(U)JAN 81 W F GRIEDER, C I FOLEY F1962R-79-C-0139
UNCLASSIFIED SC-SOAL-80-3 AFGL-TR-81-0224 NL2:l/ll l
inu//linin-- ElU---.--- El--I/-mm--l------ U
11111111111I 5
1.4 .6
MICROCOPY RESOLUTION TEST CHART

AFGL-TR-81 -0224
A A10989 4
ANALYSIS OF PROJECT IEXCEDE II CIRCULAR VARIABUEFILlER SECTRO1B IEER DATA
William F. GrioderCarol 1. Foley
DTICSpace Data Analysis Laboratory AMEL COTLBoston College JAN 21982885 Centre StreetNewton. MA 02159
Scientific Report No. 11 January 81
Approved for public release; distribution unlimited
Air Force Geophysics LaboratoryAir Force Systems CommandUnted States Air ForceHanecom AFB Massachusetts 01731
jY01 20 c852 063

UNCLASSIFIEDSECURITY CLASSIFICATION OF THIS PAGE (When Data Entered)
REPORT DOCUNPAGE READ INSTRUCTIONSREPORT__ DOCUMENTATIONPAGE_ BEFORE COMPLETING FORM
I. REPORT NUMBER 12. GOVT ACCESSION NO. 3. RECIPIENT'S CATALOG NUMBER
AFGL-TR-81-0224 e"
4. TITLE (and Subtitle) 5. TYPE OF REPORT & PERIOD COVERED
Scientific Report No. 1ANALYSIS OF PROJECT EXCEDE II CIRCULAR 1 July 1979 - 30 Sept 1981VARIABLE FILTER SPECTROMETER DATA 6. PERFORMING ORG. REPORT NUMBER
BC-S DAL- 80- 3.AU THOR(&) 8. CON'RACT OR GRANT NUMBER/aT)
William F. GriederF19628-79-C-0139
9. PERFOIIG ORGANZATJON NAkE AND! ADDRESS 10. PROGRAM ELEMENT PROJECT, TASKsLb o AREA 6 WORK UNIT NUMBERS• oston Colege885 Centre Street 62101FNewton, MA 02159 - 767010AF
11. CONTROLLING OFFICE NAME AND ADDRESS 12. REPORT DATE
Air Force Geophysics Laboratory 1 January 1981Hanscom AFB, Massachusetts 01731 1, NUMBER OF PAGES
Contract Monitor: Mr. John A. Sandock/OPR 1 14914. MONITORING AGENCY NAME a ADDRESS(if different fro.; Controlling Office) 15. SECURITY CLASS. fol this report'
Unclas si fied15. DECLASSI FI CATION DOWNGRADING
SCHEDULE
16. DISTRIBUTION STATEMENT (of this Report)
Approved for public release; distribution unlimited
17. DISTRIBUTION STATEMENT ( j the abstract entered in Block 20, if different from Report)
IS. SUPPLEMENTARY NOTES
19, KEY WORDS (Continue on reverse aide if necessary and identify by block number)
Infrared Spectrometers Artificial Auroral ExperimentInfrared Aurora Infrared Cryogenic SpectrometersInfrared Atmospheric Emissions
20. ABSTP CT (Continue on reverse side If necessary and identify by block number)
EXCEDE II is the fourth in a series of research experiments conducted byAir Force Geophysics Laboratory (AFGL) to study the infrared emission pro-cesses induced by rocketborne electron accelerators. The excitation of theupper atmosphere by the electron beam simulates aurora induced processes butprovides the advantage that the dosing is more precisely quantified than inthe natural auroral case. In addition, optical/infrared instruments carried
(Cont.)
DD I JAN 73 1473 UNCLASSIFIED -
i SECURITY CLASSIFICATION OF THI5 PAGE 'When Date Entered)
i .. ~~- . .. . "- .- - " - - -. ., -., . . , - . 1

SECURtTY CLASSIFICATiON OF TVIS PAGE(When Data Entered)
20. Abstract (Cont.)
on-board the same payload with the accelerator provide controlled viewinggeometry of the induced emissions and measurements do not suffer from long pathatmospheric attenuation as would be the case for some ground based observa-tions.
'The EXCEDE II payload was launched from Pad 4, Poker Flat Research Range,Alaska on 25 October 1979 at 0546:40 UT hours. The payload reached a -i28 kmapogee at -187 seconds after launch. Although some difficulties wereencountered with electron gun arcing the experiment was successful and datawere obtained for gun on and off conditions throughout the flight (O'Neil1980).
The primary purpose of this report is to describe in detail the tech-niques used to process and analyze the data measured with the two CVF spectrom-eters on the EXCEDE II payload. Part A of the report deals with the LN2 CVFspectrometer (designated NS-6-4), Part B describes techniques employed withthe LH CVF spectrometer (designated HS-3B-I) and Part C presents recommenda-tions for final data processing of the IIS-3B-l CVF.
UNCLASSIFIEDii SECURITY CLASSIIlCATION OF THIS PAG(PIRPfl Dota 3i~oe.dE)

P RE FACE
EXCEDE II is an Air Force Geophysics (AFGL) research program to study
auroral infrared emission processes using a rocketborne electron accelerator
to generate artificial aurorae. The effort is sponsored by Defense Nuclear
Agency (DNA). The EXCEDE concept was originally proposed by Dr. A. T. Stair
of AFGL in 1971 and since that time four successful experiments have been
conducted. These experiments have been directed by Mr. 1,xbert O'Neil also
of AFGL.
Accesri ion For
NTIS CXJt X
I-II. t.17
- -e. -, . -, .. .

TABLE OF CONTENTS
Page
PREFACE iii
LIST OF ILLUSTRATIONS v
LIST OF TABLES vi
1.0 INTRODUCTION I
Part A
LN2 CVF Spectrometer
2.0 DESCRIPTION OF NITROGEN CVF (NS-6-4) 3
2.1 NS-6-4 CVF Calibration Parameters 5
2.1.1 Wavelength Calibration 52.1.2 Radiance Calibration 5
2.2 Telemetry Signal 62.3 Data Processing 8
2.3.1 Error Analysis 92.3.2 Data Base 11
Part B
LIi CVF Spectrometere
3.0 DESCRIPTION OF HELIUM CVF (HS-3B-l) 14
3.1 Calibration Parameters 14
3.1.1 Wavelength Calibration 163.1.2 Radiance Calibration 16
3.2 Telemetry Signal 173.3 Data Processing 19
3.3.1 Data Reduction 223.3.2 Data Base (HS-3B-l) 29
3.4 Discussion 30
Part C
4.0 RECOMMENDATIONS 32
5.0 ACKNOWLEDGEMENTS 3
6. 0 REFERENCES 34
Appendix A - NS-6-4 Spectral Scan Data 48
Appendix B - 11S-3B-1 Spectral Scan Data 58
Appendix C - 1S-3B-1 Phase Angle Data 63
Appendix D - Survey of NS-6-4 Data 68
Appendix E - Survey of IIS-3B-1 Data 99
iv

LIST OF ILLUSTRATIONS
Figure Page
2.0-1 Schematic of a typical circular variable filter (CVF) 35
spectrometer
2.1-1 CVF brightness calibration (NS-6-4) 36
2.3-1 Sample spectra from EXCEDE short wavelengt. CVF 37
spectrometer during electron gun operation
3.1-1 CVF brightness calibration (HS-3B-1) 38
3.3-1 Principles of optically chopped CVF signal production 39
3.3-la Example of HS-3B-1 CVF telemetered data 40
3.3-2 Example of fit to chopper reference data 41
3.3-3 Demodulation of scan 1210 42
3.3-4 Example of unfiltered spectral radiance profile 43
3.3-5 Smoothing filter frequency response characteristics 44
3.3-6 Example of smoothed spectral radiance profile 45
3.4-1 Frequency response of HS-3B-1 CVF electronic filter 46
3.4-2 Effects of chopper second harmonic and sampling 47
o.
v

LIST OF TABLES
Page
2.0-1 NS-6--4 CVF Performance Parameters 4
2.1-1 NS-6-4 CVF Brightness Calibration 7
2.3-1 Accelerator Operation 12
3.0-1 HS-3B-l CVF Performance Parameters is
3.1-1 HS-3B-l CVF Brightness Calibration 1
vi

INTRODUCTION
EXCEDE II is the fourth in a series of research experiments con-
ducted by Air Force Geophysics Laboratory (AFGL) to study the infra-
red emission processes induced by rocketborne electron accelerators.
The excitation of the upper atmosphere by the electron beam simulates
aurora induced processes but provides the advantage that the dosing is
more precisely quantified than in the natural auroral case. In addition,
optical/infrared instruments carried on-board the same payload with
the accelerator provide controlled viewing geometry of the induced
emissions and measurements do not suffer from long path atmospheric
attenuation as would be the case for some ground based observations.
The other EXCEDE experiment programs were PRECEDE, EXCEDE II Test,
and EXCEDE: SWIR (O'Neil 1976).
The EXCEDE II payload incorporated four electron guns programmed to
function in different combinations and capable of producing a 10 ampere
electron beam when activated simultaneously. The optical/infrared
instruments on-board the payload were primarily for measuring spectral data
and included; liquid nitrogen (LN2) interferometer, LN2 circular
variable filter (CVF) spectrometer, liquid helium (LHe) CVF spectrometer,
LN2 radiometer, ultraviolet/visible spectrometer, a camera and five
photometer units. In addition the payload contained several ionospheric
probes and diagnostic sensors to measure ion and electron densities and
fields. The optical/infrared instruments viewed the beam region through-
out the flight at a stablized zenith angle to local vertical of 45 .
The EXCEDE II payload was launched from Pad 4, Poker Flat Research
Range, Alaska on 25 October 1979 at 0546:40 UT hours. The payload reached a
_,128 km apogee at -187 seconds after launch. Although some difficulties
were encountered with electron gun arcing the experiment was successful and
data were obtained for gun on and off conditions throughout the flight
(O'Neil 1980).
The primary purpose of this report is to describe in detail the
LL1

techniques used to process and analyze the data measured with the two CVF
spectrometers on the EXCEDE II payload. Part A of the report deals with
the LN2 CVF spectrometer (designated NS-6-4), Part B describes techniques
employed with the LH CVF spectrometer (designated HS-3B-I) and Part C
presents recommendations for final data processing of the IIS-3B-I CVF.
Processed data for this instrument presented in this report is preliminary.
.!2

PART A
LN2 CVF SPECTROMETER
2.0 Description of Nitrogen CVF(NS-6-4).
Construction details and method of operation of the rocketborne
CVF spectrometer have been reported by Rogers, 1976, and Wyatt, 1978.
The CVF instruments were fabricated by the Electrodynamics Laboratory
of Utah State University. In brief the monochromator portion of thesensor consists of two 180-degree circular variable (wedge) filters
mounted so that the bandpass interference layers rotate just above the
detector field stop which performs the function of a spectrometer
slit (see Figure 2.0-1). The srectrometer scans a continuous wave-
length region depending on which half of the filter is rotating over the
detector. Spectral resolution (AX) depends on slit width and f number.
Pertinent figures of merit for the EXCEDE NS-6-4 instrument are given
in Table 2.0-1.
Two important parameters for CVF data processing are the start
times of the beginning of each spectral scan and the speed of rotation
of the CVF. Two assumptions made are that the speed of rotation is
constant throughout the flight and that the wavelength of radiation
being measured is linearly proportional to time (or filter position).
One consequence of this CVF mode of operation is that since the payload
is constantly changing altitude the spectra obtained are associated with
different altitudes. Each part of a spectral scan is for a different
altitude and thus altitude must be computed for every spectral data
point.
3
-.
|

Table 2.0-1
PERFORMANCE PARAMETERS
FOR CVF NS-6-4
Wavelength Coverage (pm) 2.1 to 3.5 , 3.25 to -.4
Spectral Resolution (pm) 0.05 @ 2.7 .m , 0.08 e 4.3 ;m
Detector Type InSb
NESR (w-cm2 -sr -Pm- 1 2.4 10
Dynamic Range 2 x 10 a
Half Angle Field of View (deg) 1.871
Spectral Scan Rate -2/sec
reference S
4

2.1 NS-6-4 Calibration Parameters
Radiance and wavelength calibrations for the NS-6-4 CVF were
accomplished by both AFGL and Utah State University (Wyath 1978) prior to
rocket launch. These calibrations showed good agreement so those of AFGL
were used for this work.
2.1.1 LI'avelength Calibration
The NS-6-4 CVF had two halves designated long (subscript 1)
and short (designated s) which refers to long wavelength and short
wavelength. The AFGL calibration equations were adjusted using the
data and known emission features such as the CO2 (v3 ) peak at 4.28,.m.
The appropriate equations are
Xn(s) = 1.693 + (3.916 x 10- Pn (2-1)
6.79 4P ( 46.37n
P 1.flx 100 (2-2)nl N
Where n = number of the data point in the scan
N = Total number of data points in the scan
Pn= percentage of n data point of total scan
For the long half of the filter.
Xne. 4 -0.292 +(5.860 x 10- Pn (2-3)
59.42 <P /97.82n
In the NS-6-4 the short half of the filter was scanned first.
2.1.2 Radiance Calibration
Radiance computations were done in units of megarayleighs per
micron (MR/Um) or brightness (B) since these units were used in
calibration and permit direct physical interpretation of the results.
In some cases the term "existence" is also used (Wyath 1978). To
convert telemetry volts (VTM) contained in the data channels the
following calibration equations apply
B = M(col)N FVT)/AX megarayleighs/micron (2.4)
where the resolution (AX) is given by
A>, 0.013 +(1.4 875 x 0-2 )XSq

AX 0.0256 + (1.20 x lo-2)X
and
HIGH GAIN F(VTM) = 6.5 x 10⁻³ Vm , VTM _<10 volts (2.6)
F(VTM) = 0.556 VTm , V TM i1.8 volts
LOW GAIN (2.7)
IF = 0.51991.11277TM) VTM TM
The values of M(col)N depends upon wavelength and are given in
Table 2.1-1. M are set to zero for values of X outside the tabled(col)N
limits. The AFGL calibration was truncated based on data at 2.10, 3.50
and 3.25, 5.40 microns. These data are plotted in Figure 2.1-1 and show
the wavelength overlap around 3.25 microns. This fact provided a conveni-
ent region to check consistency in calibration between the long and short
wavelength filter halves. Notice the brightness scale on Figure 2.1-1 is
103 MR/am. Thus the calibration peak at 2.95 wm is 8228 MR/,na.
2.2 Telemetry Signal
The EXCEDE II employed four telemetry (TM) links with ground
receiving and recording systems. All data for the CVF instruments was
contained in TM Link 3 tape (recorder 2 original) track S of the
range tape. IRIG B time code to be used with these data was on track
3 station MUX (the normal 13 IRIG B track was reported to be spotty.)
The data was pulse code modulated (PCM which is described by Space
Data Corporation (1979). Data for each instrument coded in several
PCM words was "read", reformatted and recorded on separate digital tapes
along with time in a format compatible with the AFGL CDC 6600 computer.
Flight data was digitized from T+40 sec (0457:20 UT hours) to
T 340 sec (0553:50 UT) which was loss of signal. Data for the NS-6-4 CVF
instrument were in words 2 and 26, 3 and 27, and 4 and 28 of all
frames. Words 2 and 26 are high gain, 3 and 27 are low gain and 4 and 28
are the reference. The high and low gain contain the spectra and the
reference contains the start pulse of each spectral scan, in addition
to other wavelength reference pulses (of lower amplitude than the
6

TABLE 2.1-1
M(col)N vs. Wavelength NS 6-4
x M(col)N x M(col)N A M(col)N
um MR im MR MR
Short Wavelength Half Long Wavelength Half
2.10 3.03 x 10² 3.25 3.01 x 10² 4.85 2.44 x 10²
2.15 3.03 3.30 2.93 4.90 2.38
2.20 2.95 3.35 2.91 4.95 2.35
2.25 2.77 3.40 2.95 5.00 2.32
2.30 2.56 3.45 2.88 5.05 2.31
2.35 2.40 3.50 2.84 5.10 2.29
2.40 2.28 3.55 2.81 5.15 2.28
2.45 2.24 3.60 2.83 5.20 2.28
2.50 2.27 3.65 2.85 5.25 2.30
2.55 2.38 3.70 2.88 5.30 2.35
2.60 2.51 3.75 2.93 5.35 2.48
2.65 2.60 3.80 2.98 5.40 2.83
2.70 2.94 3.85 3.00
2.75 3.60 3.90 3.01
2.80 4.01 3.95 3.03
2.85 4.30 4.00 3.05
2.90 4.57 4.05 3.05
2.95 4.68 4.10 3.03
3.00 4.43 4.15 3.09
3.05 4.15 4.20 3.14
3.10 3.81 4.25 3.08
3.15 3.42 4.30 2.97
3.20 3.16 4.35 2.91
3.25 2.91 4.40 2.85
3.30 2.74 4.45 2.83
3.35 2.66 4.50 2.76
3.40 2.69 4.55 2.74
3.45 2.72 4.60 2.72
3.50 2.79 4.65 2.70
4.70 2.63
4.75 2.57
4.80 2.51 x 10²
... ...-- 'i

start pulse) that were not used in the data processing. A review of
these words showed a one data point lag in the start pulses between
words 4 and 27. To avoid this confusion only word 4 was used to
locate the scan start times.
Criteria for scan start was the first data point of value 20
counts or less following the peak (>900 counts) of the start pulse.
A listing of these start times (with other parameters is given in
Appendix A).
The high and low gain spectral data were contained in words 2 +26
and 3+27 were converted to TM volts using the equation
" C-12 (2-8)TM=100
Where C = number of counts (Space Data Corp. 1979).
2.3 Data Processing
The CDC digital tapes described in section 2.2 were processed
using the scan start times (Appendix A) and the calibration equations
to form a data base of one record per spectral scan. The seven
parameters per data sample are
Parameter Content
1 wavelength - microns
2 time after launch - seconds
3 altitude - km
4 high gain TM voltage - volts
5 high gain brightness - MR/Am
6 low gain TM voltage - volts
7 low gain brightness - MR/Nm
These parameters were computed for every data point. Payload altitude
was computed with an eighth order fit to radar range data and utilized
time after launch as the independent variable. The trajectory equation
and coefficients are
8

i=8h a0 + a.T
a0 = -.539640306E+02 a5 = .14806951461:-07a, = .2741505348E+01 a - .449.3(969{5.-l0
a2 = -.2947169205E-ol a. = .7464427803E-13
a3 = .3475921337E-03 a8 = -.5216526696E-16
a4 = -.2907943273E -05
where
h = payload altitude -km
T = time after launch - seconds
The brightness data was plotted on semilog scale for each gain
as a function of wavelength and altitude. All scans were plotted.
The data was also plotted on a linear scale but otherwise in the same
format. A sample brightness spectra is shown ir Figure 2.3-1. The
data shows Wu Benesch spectra between 2 and 3 microns and the prominent
4.28 micron CO In the 3.4 micron region the filter short and long
half responses overlap and indicates good agreement in the absolute
brightness calibration. Notice that every spectral data point occurs
at a different altitude because of payload motion as reported previously.
Below 250 MR/pm the presence of noise equivalent to 1 count in the
onboard digitization process is evident. This effect is described
in the next section of this report.
2.3-1 Error Analysis
For the NS-6 CVF the uncertainty in establishing counts is I
count, therefore from Equation (2-8)
min AV = 0.01 volts
Thus for high and low gain F(VTM) is 6.5 x 10⁻⁵ and 5.56 x 10- 3
respectively see Equations (2-6) and (2-7). For the short half the worst
case uncertainty occurs at 2.95 micros (see Figure 2.1-1) and the
uncertainty for high gain is 0.53 ,R/vm. For the long half the worst
case high and low gain uncertainty occur at 3.25 microns and are .03 MR/urm
and 24.7 MR/um respectively. These values represent error bars (+ and
-) of the measured data and in general are given by
AB = M cl) F(.01) (2-10)- AA
A9

where
F(.1 ) = factor for V = 0.01 volts
M(col)
AA = Figure 2.1-1.
The percentage error represented by the one error count depends only on the
number of counts measured, viz,
E xB 100 C-1 x 100% (2-11)
It is desirable to merge the low gain data with the high gain data when
the high gain saturates. However as will be shown below problems of accuracy
are incurred. High and low gain volts are related throt<,.i the electrons gain
factor G as follows
VH = GV (2-12)
where
G = gain factor
VH high gain volts
VL = low gain volts
From Equation (1) the high gain counts (CH) and low gain counts (CL) are substi-
tuted in Equation (10).
C I + 12(G-1) CHC = + - - ) + 12 (2-13)
if the .witcft from high gain to low gain is done using equation (11) the error
due to 1 count at the switch over to low gain is found by substituting (11) in
(9) which yields
switch =2-14)H
If we choose to switch at C 900 the error after the switch due to I count
uncertainty is 8.3% assuming G = 75 where just prior to the switch the error is
unly 0.11% due to I count uncertainty. Ihis discrepancy at the switchover point
is undesirable and consequently the high and low gain data was not merged but
treated separately.
10
Li

2.3.2 Data Bases
In view of the incompatibility of high gain low gain data merge described
above, no attempt was made to merge the two channels. Instead high and low
gain channels were used to generate individual data bases. Samples from these
data bases are given in Appendix D. High gain channels show the effects of
one count digitization noise when the guns (accelerators) are not in operation,
superimposea on a background signal caused by a small ofFset voltage in the
system (see scan 116, 119, 121, etc.). The spectral structure of the background
mirrors the system responsivity characteristic (see Figure 2.1-1).
In the region of 100 km (scans 139, 153, 159) there appears to be a substantial
signal enhancement probably due to instrument covers floating through the CVF
field of view.
Periods for gun-on operation are given in Table 2.3-1. The correlation
of signal enhancement with periods of gun-on operation can be observed by
inspecting scans 237, 276, etc.
*1l

Table 2.3-1
ACCELERATOR OPERATION
(;un Oi Gun OffTi me * Time* Gun
(seconds) (seconds) Number
115.495 11b.052 1
135.845 136.104 4
138.651 139.695 4
141.636 144.148 4
153.254 156.745 4
159.277 161.547 4
173.220 174.538 4
176.485 176.728 4
179.274 100.335 4
188.113 191.242 4
193.916 197.811 4
208.083 209. 383 4
211.335 212.549 4
213.885 214.625 3
222.984 226.814 4
228.779 232.681 4
240.424 240.325 3
243.302 244.273 3
243.032 244.285 4
248.724 248.928 3
24o.246 250.139 4
257.881 281.735 3
257.885 261.743 4
283.607 263.925 1
263.704 264.331 4
263.704 266.7 3
266.859 267.620 4
277.882 279.193 1
275.363 279.224 3
12

Table 2.3-1 (Cont.)
Gun On Gun OffTime* Ti me* Gun
(seconds) (seconds) Number
275.367 279.228 4
281.083 282.047 1
281.189 282.750 4
234.525 235.032 1
283.684 285.088 3
286.929 290.859
292.863 293.236 4
292.759 244.156 1
298.149 296.72 2
292.863 296.723 3
298.581 298.795 1
13

PART B
H CVF SPECTROMETERe
3.0 Description of Helium CVF CHS-3B-1)
The HS-3B-1 CVF (see specifications Table 3.0-1) is basically similar to
the nitrogen CVF except a tuning fork optical chopper was added that periodi-
cally interupted the incoming radiation to the sensor at a frequency of ap-
proximately 106 Hz. The sensor electrical output was filtered with an elec-
tronic filter cenrtered at ]00 Hz and passband approximately 50 Hz wide. This
technique produc. an amplitude modulated waveform whose envelope contained
the observed spectral radiance information. Both a high and low gain channel
were included f,;r the modulated signal. The basic problem in processing the
Helium CVF data was to demodulate and rectify the output signal then apply
calibration factors to deduce the observed spectra in MR/um.
Also unlike the Nitrogen CVF the long half of the HS-3B-l CVF consisted
of two filter segments in order to achieve the long wavelength response. How-
ever since the long half wavelength calibration applied throughout the spectral
region the brightness calibrations at the joint wavelengths was simply set to
zero and the long half of the CVF was treated as if it were continue
3.1 Calibration Parameters
Radiance and wavelength calibrations were accomplished by both AFGL
(Condron and Austin, private communications) and USU (Wyatt, 1979). Agreement
of these data was adequate however the AFGL calibration data were used because
the information was more detailed. In addition the AFGL wavelength data was
also slightly modified (shifted) to agree with certain known emission features
in the data such as CO2 14.97 pm. However the shift was less than a wavelength
14
-.. . . . . -2 "- -. -

Table 3.0-1
PERFOR MANCE PARAMETERS FOR CVF HS-3B-l
Wavelength Coverage (im) 3.9 to 6.8 , 12.7 to 22.3
Spectral Resolution (pm) 0.1 P 5.3 um , 0.4 15 4m
Detector Type Si (As)
-2 -1 -1NESR (w-cm -_sr- rm- ) 1.08 x i0 -
Dynamic Range 8 x 10⁴*
Half Angle Field of View (deg) 1.973
Spectral Scan Rate -0.8/sec
reference 7
1.5
• -.

resolution element of the instrument.
3.1.1 Wavelength Calibration
The HS-3B-l filter halves are designated long wavelength (subscript .
and short wavelength (subscript 4). The short half was scanned first (in
time). The adjusted calibration equations for wavelength for each half are
given by
X = (2.388 E-l) P n 1.097 pm (3-1)
55 _5 Pn -5 97%
x (7.38 E-2) Pn + 3.333 jm (3-2)
4.0 _ P n -< 44 .4
where Pn is the percentage into the scan (Pn = 100 n/N).
The wavelength resolution elements at any wavelength determined by
the CVF filter are given for each filter half by,
(1.8667 E-2) X + 6.21E-2 1m (3-3)
A = (5.482 E-3) X + 3.12E-1 um
3.1.2 Radiance Calibration
During actual radiance (brightness) calibration of the HS-3B-1 CVF the
sensor output was a continuous analog signal and demodulation and rectifi-
cation of the signal was accomplished using a phase sensitive amplifier
(PAR). Since the telemetry signal was PCM this technique was not possible
so a computerized demodulation and rectification scheme had to be formula-
ted to accomplish these tasks which included the laboratory calibration data.
This formulation is derived in section 3.3.1 of this report. However, the
1,6
' .- ..- - . - ' ...... - -2 . " .- - - .: °- .' -. . .,

final result to convert demodulated rectified telemetry volts VTM to spec-
tral radiance is given here
Bn = Gi M(col)V TMI/AX MRIm (3-4)
where Bn = brightness (radiance) of data point n
G . = channel gain (high gain = 1, low gair = 100)1
M o calibration factor in MR/volt (see Table 2.1-1)(col)-
AX = resolution (see equation (3-3))
The adjusted laboratory calibration data for M(col) is given in Table 3.1-1
in units of MR/volt. Notice that the values are zero at 17.50 and 17.70 Lm
where the long wavelength filter point occurs. Other values in the original
data near the mask regions are located have also been adjusted to eliminate
the tendency to "spike" when the mask passes over the sensor. A plot of
the final calibration is shown in Figure 3.1-1 in units of MR/um - volt and
derived using the data in Table 3.1-1 and equation 5-3.
3.2 Telemetry Signal
All aspects of the HS-3B-1 PCM telemetry were identical with CVF
NS-6-4 (see section 2.2 of this report) except that since the HS-3B-1 CVF
was optically chopped one additional channel of data was required (compared
to the NS CVF) for the chopping frequency. The spectral data was contained
in PCM words 5 + 29 (low gain) and words 6 + 30 (high gain). The spectral
reference (start pulse) was on words 7 + 31 and the chopper sequel on word
46. Spectral scan start times are determined in the same manner as the NS
instrument, see Appendix B for the listing of IIS-3B-I start times.
17

TABLE 3.1-1
M(col)N vs. Wavelength HS 3B-1
X M(co1) N x M(Col) N x M(col) N
jim MR/volt Pi N:R/volt MB :R/volt
Short Wavelcr.'t:h Half Long Wavelcngth Ialf
3.70 0 11.90 0 18.50 .8375
3.80 0 12.10 0 18.70 .8225
3.90 7.91 12.30 0 18.90 .821
4.00 4.54 12.S0 0 19.10 .843
4.10 4.335 12.70 1.53 19.30 .869
4.20 4.20 12.90 1.26 19.50 .8825
4.30 4.155 13.10 1.16 19.70 .902
4.40 3.885 13.30 1.15 19.90 .9235
4.50 3.61 13.50 1.09 20.10 .8985
4.60 3.41 13.70 1.05 20.30 .875
4.70 3.255 13.90 1.025 20.50 .8935
4.80 3.14 14.10 .9635 20.70 .920
4.90 3.08 14.30 .8545 20.90 .9405
5.00 2.97 14.50 .836 21.10 .951
5.10 2.85 14.70 .8855 21.30 .964
5.20 2.75 14.90 .8905 21.50 .9805
5.30 2.70 15.10 .835 21.70 .9805
5.40 2.625 15.30 .7925 21.90 .9805
5.50 2.57 15.50 .7665 22.10 .9805
5.60 2.50 15.70 .763 22.30 .9805
5.70 2.50 15.90 .804 22.50 0
5.80 2.51 16.10 .853 22.70 0
5.90 2.49 16.30 .8765 22.90 o
6.00 2.473 16.50 .8205
6.10 2.42 16.70 .716
6.20 2.33 16.90 .735
6.30 2.265 17.10 .7545
6.40 2.285 17.30 .8725
6.50 2.30 17.50 0
6.60 2.215 17.70 0
6.70 2.14 17.90 .9005
.6.80 2.125 18.10 .813
6.90 0 18.30 .8765
18
,.. ,

3.3 Data Processing
The idea of chopped systems accompanied by phase sensitive demodula-
tion and detection to reduce DC drift and improve signal to noise is well
known (Schwartz, 1959) and widely used by electronic engineers. However
for actual digital CVF data such as that of NS-3B-l sor.e special problems
occur and so a brief review of the fundamentals will be presented prior
to describing the actual data reduction techniques used for CVF HS-3B-1.
Figure 3.3-1 illustrates how the HS-3R-l VF modulated signal was pro-
duced. Since the CVF selectively passes the incident spectral radiance as
it rotates at a constant rate the incident spectral radiance can be repre-
sented as a function of time instead of wavelength. This is shown in the
top plate of Figure 3.3-1. The incident spectral radiance is periodically
interupted by a mechanical chopper which itself radiates some lower level
since it is cooled. The chopped signal as seen by the CVF sensor is shown
in the second plate of Figure 3.3-1. The sensor output is assumed propor-
tional to this incident radiance. If we assume for the moment that the
chopper radiance is negligible and that the frequency bandwidth of the in-
cident spectral radiance is small compared to the chopper frequency then
the sensor output can be estimated by the Fourier series
s(t) =.S() + 2 sin n7/2 cos nwt]
where s(t) = chopped spectra signal
S M = infrared spectra (unchopped)
Wc = radian chopping frequency
If we now assume that there is no incident spectral signal and the
chopper radiance is not negligible then the signal output from the chopper
I 9

radiance alone can be written in a similar manner except that there will
be a 1800 phase difference
b 1 R + 2 sin n/2cos((t) 2() L 2 n 2 Cos (nc +
n=l
where b(t ) = chopped chopper signal
R(X) = chopper unchopped radiance
Sc = radian chopper frequency
Clearly the phase angle 7r can be omitted simply by changing the + sign in
front of the surmation to -.
For the case of both incident spectral radiance and non zero chopper
radiance the total sensor output signal is the sum of s(t) and b(t)
Ct) A) ())+~S(ARQ)) sin(t)/
g(t!=s(t)+b sin nr/2 1cos nu (3-6)g~t=s~)*(t)=2 (;), (A ))(A)-R01) n 7r/ o ~
If we now A.C. Couple this output signal to remove the DC term =--S + R(,X) ()M
then filter with a narrow bandpass filter centered a; the fundamental chop-
ping frequency w we get for n=lc
9()R2o t (3-7)g(t) =- (S (A) - RCA)) cos %t(37
This result is the modulated waveform of the EXCEDE sensor output showm in
plate 3 of ikigure 3.3-1. This sensor output was digitized on the payload and
telemetered and recorded in PCM format. Actual data is shown in Figure 3.3-1A.
The sinusoidal waveform of the chopper reference (also digitized and
telenetered) in plate 4 of Figure 3.3-1 is simply expressed as
h(t) = A cos (C t + Ae) (3-8)
where h(t) = A.C. Component of the chopper signal.
20

AO = phase difference between data and chopper signals.
A = amplitude of the chopper signal.
The phase difference Ae is included in this equation to account for such
things as mechanical lag in sensing chopper position which would produce
a phase difference between the sensor signal and the chopper reference.
In principle the demodulation and extraction of the spectra S
from equation (3- is done by forming the product of h(t) and g(t), which
expanded and simplified yields
2A (S(X)-RX)P = g(t)hrt) Tr cos W t cos(wct + AO)
(3-9)A (S A-R( )[(A) [osAe + cos(2w t + A6)]
We now filter the product P with a low pass filter with cutoff frequency
less than 2wc and greater than the highest data frequency in the spectral
radiance. Solving for S(^ yields
S =R + 'T P3,0S) =R) A cos Ae
where P' represents the low pass filtered product of h(t) and g(t).
Equation (-10) shows that the chopper radiance background is added to
the incident signal and clarifies why it is necessary to keep the chopper
radiance small (cold). Also if either the chopper amplitude A or the
phase angle difference Ae between spectral data and chopper reference are
modulated with time in any manner false components will be introduced into
the reduced spectra.
Notice from Equation 0-7) that if the incoming radiation S(X) is less
than the chopper radiation R then g(t) is negative and the product term

in Equation C3-10) will also be negative resulting in a quantity of radiation
being subtracted from R M to give S( X) just as it should be. If one
attempted to retrieve the spectra S( ) by simply reconstructing the envelope
of g(t) this possibility would not be detected and an error in S(A would
result. On the other hand multiplying by chopper signal and filtering as
explained, preserves all the phase properties of the signal. It is crucial
however, to derive an accurate representation of the chopper data character-
istics.
3.3.1 Data Reduction
Several problems arise in attempting to apply the principles derived
above to the EXCEDE chopped CVF PCM data. For one thing all the data
channels were sampled (on the payload) serially so that the chopper refer-
ence data points were not time coincident with the spectral data points.
In addition the chopper was sampled at 512 Hz - just half the spectral data
sample rate. Thus forming the correct product P (Equation (3-9) of the
chopper and spectral data needed for demodulation was not possible. Con-
sequently it was elected to fit the digital chopper data for each spectral
scan with a least squares technique to derive an analog equation to be used
in forming the product term in Equation (3-s. The mean value of the chopper
rfefrence signal data was found and subtracted from the data set. Ai estinated
frequency (f c) of the signal was found by counting zero crossings during
each scan and dividing by two times the product of the total number of data
points and the sampling interval, viz.
N0 N0fsfc 2N TO t 2NTOT (3-11)
22 TOT TOT

where fc = chopper frequency - Hz
N = number of zero crossing in the scan
NTOT = total number of data points in the scan (1/2 number spectral datasamples)
At = sampling interval
fs = 1/At = sampling frequency = 512 Hz.
Since the total number of chopper data points N is known precisely (1/2TOT
the number of spectral data points) for each scan and the sampling frequency
is considered invariant the error Af in determining f is at most due toC c
the error of missing one zero crossing and thus
Af = (1)512 = 0.42 Hzc 2(616)
(The value 616 for NTOT was estimated based on 1232 data points in a typical
spectral data scan - see Appendix A).
Knowing the frequency the assumed chopper sinusoidal signal equation
derived below was least squares fitted to the data in each spectral scan.
h(t) = Acos(w t-O ) = Acosw ct cose + A sinw t sine (3-12)c cc c c c
" h(t) = b cos wct + c sin wtct
where h(t) = chopper signal
A = amplitude
ec = phase angle relative to the scan start
b = A cos 0c
c = A sin ec
As a result of the fit the constants b and c are found and the phase
angle is determined by (see Figure 3.3-2 for typical data fit)
ec= +tan- I (c) (3-13)
23
.. " .. ... .. .. . . L. ... : .- . . -.. - -. -. -- - - - . "

Finally setting the amplitude A=l the chopper signal equation in digital
form is
h(n) = cos [27f c(n-l)At - (el (3-14)
n = 1,2,3 ...... NTOT
where h(n) = chopper equation
fc = chopper frequency - Hz
n = data point number
At = sample interval = i-- sec. for the spectral data1024
0 = phase angle relative to the scan start
NTOT = total data points in the scan.
In actual practice tie frequency f was computed by the fit. Appendix CC
contains a tabulation of the pihase angle and f c0 for the actual data derivedc
as discussed above for each spectral scan. Included in this tabulatioa is
the "goodness of fit" parameter chi squared. The lower the number the better
the fit. A typical example of the calculated chopper reference (solid line)
using Equation 3-14) compared to the actual chopper dat. (points) is shown in
Figure 3.3-2. As long as the chopper reference data amplitude kas relatively
constant (which was not always the case) the fit with Equation 0-14) was
excel lent.
Clearly Equation C3-i4) permits calculating the necessary value of the
chopper reference for any spectrai data point n and thus satisfies the re-,
quirements needed for evaluating the product P in Equation (3-9) (which implied
Is=J). When there is a phase difference between the spectral data and the
chopper defined by 0 -0- LA ,) where 0 and 0 are the phase differences fromC s S c
the start of scan for spectra and chopper respectively, Equation (3-7) becomes
g(t) = .-(S )-R(L)) cos(Wct-6)
24
'. -' * " .. .. . .. . .

It was found by inspection of the data that the chopper lagged the spectral
data by 1/3 a spectral data point (120) so that 20 = -120.
An example of the product P for scan 1211 formed by multiplying each
spectral data point in the scan by a numerical value computed for the chop-
per using Equation 3-14 for the same n (constant A=I and the appropriate
phase angle e taken from Appendix C) is shown in Figure 3.3-3, both the highC
and low gain channels are shown. The product was evaluated in telemetry
units of counts for the spectral data g(t) while h(t) is dimensionless.
Prior to forming the product the mean of the modulated spectral data was
determined and subtracted from each data value of g(t). Theoretically the
mean of the modulated wave should be zero. Note that all prominent count
values, in Figure 3.3-3, are positive except for a few spurious data points
in the high gain channel where the signal was saturated. In addition the
noise values oscillate about zero as it should. The envelope of the data
in Figure 3.3-3 contains the desired spectral information. All that is re-
quired to derive the spectrum is to extract the envelope and apply calibra-
tions for wavelength and brightness. Ripple on the high gain is explained later.
Typically envelope detection is done by smoothing or filtering.
Clearly the only useful data points of the waveforms shown in Figure 3.3-3
are the peak values since only they represent the observed spectrum. Since
filtering of digital data is a somewhat complicated process especially with
large data bases and when Fourier transforms are involved it was decided
to attempt to derive the envelope data by a deciration technique prior to
filtering.
Using the concept of referring phase angles of both the chopper reference
and spectral data to the beginning of the scan and acknowledging that 'ie~e
phase angles could be different the product tern of F'quation c-_t can he
rewritten z,

P A(s-R )oS(6 ) + cos[2wt-(0+6 s) ] (3-15)
since c -s = A6 is constant the maximum value of the product P occurs whenC s
the cos[2w t-(6 +0s)] = +1. Thus the data point number n defining the maximumC CS sp
value is
2[2-i(n -1) f At] - (6c s) = 2(i-l) 7
p C Cs
i=1,2,3,... NTO T
Therefore solving for n yieldsP
(i-i) , + (C + S)/2n 1 + 2 -- fct (3-16)p 2
Since 0 is arbitrary it is clear that values of n computed with Equation (3-1o)c p
could take on non-integer values which do not exist in the digital data base,
viz. data points are numbered in integer steps from 1 at scan start to NTOT at
the end of the scan. Assuming the sampling rate f is invariant (1024 samples/
see) and equal to the reciprocal of the sample interval time .t Equation C)-1)
is rewritten as follows
r (i-I) + +6 V2 )/31
no = round off integer value l + 2ffc s (3-17)
i '1,2,3... NTOT
ihe envelope data base was determined for each scan by choosing only data
points aefined with Equation (3-171 The data point difference An0 = 5 and thus
the data base was reduced by a factor of 5 by this decimation process and con-
tained only the estimated envelope data.
Once the envelope data base was generated in this manner the spectral
data in counts was converted to volts using the relationship
C PVTM 100 100 (3-IS)
where V = telemetry volts
C = counts
26
-.. - . . . ..... .. . ..... . . . .. . . . .. ..... - .

This equation differs slightly from that used for the NS instrument (Fquation
(2-3)) because the A.C. coupling of the IS sensor output removes the 12 count
D.C. offset. The decimated envelope data base derived by Equation (3-16 was
units of counts. These data were converted to volts simply by dividing by 1U,
in accordance with Equation (3-14.
Returning to the hasic relationship for dtriving t1 :e product p in Equation
(3-1 , we must recall in subsequent discussion that we have already assumed
the amplitude A of the chopper reference signal to be constant and equal to I
and also that the phase difference A. between chopper reference and spectral
data to be +120. Finally we make the assumption1 that chopper radiance R A
is negligible compared to the spectrum since it is cooled. In addition we
have used n0 in choosing the envelope instead of n so solving for the spectrumo p
S(X) yields
S -p
() =cosA0 + Cos2[2 f(n_-l)At - _.)/2] (3-19)
The units of S are counts. Notice the denominator z2 for small , . It waq
decided to first generate a data base where the spectra was not filtered but
in the correct units of MR/om then filter the data set in units ef radiance.
This precaution was taken in the event the voltage calibration was not linear.
The unfiltered spectral radiance was thus calculated from the unfiltered
decimated data base where V S()TM 100
B = Gi M(col ) V TM/AX (3-20)
where B unfiltered spectral radiance MR/vm
P = decimated product term (unfiltered) in units of
M(col ) = ca iibration term - MIR/volt
AX = calibration term - vm (see Equation (3-3))
VTM = decimated spectra term expressed in volts
27

G. = gain factor (high gain = 1, low gain = 100)1
Equation $-21) was given previously in Equation C3-4) of this report.
Figure 3.3-4 shows a sample unfiltered spectral radiance profile derived
by the techniques described above. The ripple on the spectra is caused by
a chopping feed-through effect (viz cos 2wct term in Equation 0-9)) which was
intentionally not filtered before initial exam.ination of the spectral data.
The spectral data shows the emission features of CO2 at 4.28 and 14.97 ijm
and NO in the 5 to 6 um region. However the need of filtering to remove
the chopper effect is evident.
As a first approach a simple nonrecursive filter was used for initial
data smoothing. The filtered brightness B at point n is computed asn
follows
B'= aBn 2 +bB bBn+1 + aB 2 ] (3-21)Bn [ 2 b n " 1 + ' Bn l n2
The transfer function of this filter is (Hamming, 1979)
f = 2a cos 2w + 2b cos w + c (3-22)
where w = 7 f/f
f = 1/2 At = fs/2 Nyquist frequency
fs = sampling frequency after decimating = 205 Hz
f = physical frequency
For this case we desire good low pass characteristics, so using the condi-
2 tions
H(o) = 1
~l (0)_ = 0 (3-23)dw
d 2H(O) = 0
dw 2
28

leads to the following values
a = -1/16
b +1/4
c = +5/8 (3-24)
A plot of the frequency response of this filter is shown in Figure 3.3-5.
The decimated data base was processed using Equation (3-21) to produce
initial smoothed data. Spectral scan 1210 (Figure 3.3-6) illustrates the
effect of the smoothing and the improvement of spectral radiance features
are shown in Figure 3.3-6 as compared to Figure 3.3-4.
3.3.2 Data Base (HS-3B-l)
An "abridged" data base was generated for selected spectral scans from
the HS-3B-l CVF using the procedures outlined above. These data are given
in Appendix E. In general the spectra show emission enhancement during
periods of "gun" (accelerator) on times but in addition there seems to be a
background enhancement (scan 1067) at times when the guns are off. This is
attributed to the possibility of instrument covers floating through the CVF
field of view. The fine structure in some of the enhanced emissions (see
5.8 m of scan 1204) is due in part to the effects of chopper second harmonic
and sampling which is explained in more detail in the next section of this
report.
It should be noted that the spectral data shown in Appendix E consist
of merged results from both the high and low gain channels. A signal voltage
of 4.2 volts was used as the criterion for merging the two gain channels.
29

3.4 Discussion
The ripple (-40 Hz) supperimposed on the demodulated waveform in
Figure 3.3-3 is clearly an error source since it falls within the digital
filter passband (see Figure 3.3-5). Power spectral density analyses of these
signals do not indicate the presence of the 40 Hz ripple, however, the
chopper second harmonic (212 11z) is evident in the PSDs of both the spectral
and chopper data. This indicates that the chopper second harmonic is leaking
into the signals due to poor frequency cutoff characteristics of the system
electronic filter on-board the payload. Inspection of the electronic charac-
teristic in Figure 3.4-1 confirms this possibility. A simple trigonometric
exercise demonstrates the point. Assume the chopper fundamental waveform
is added to the second harmonic waveform approximately 900 out of phase and
with reduced amplitude "a".
h(t) = cos ct + as in(2. ct-) (3-35)
where p = small phase angle -9'
h(t ) = chopper waveform
f = chopper frequency 106 Hzc
Sc= 2Tr(n-1) fc/fs
f = sampling frequency 512 lz
n data point number
a = amplitude -1
Setting a = 0.2 and evaluating Equation(3-3j for n=54 to 154 we produce the
simulated chopper waveform in Figure 3.4-2 (scale factors have been introduced
for ease of comparison). Comparing this to a portion of the actual aavcform
indicates obvious similarity. Note that the ripple frequency in the chopper
is only -20 Hz (rather than 40 Hz as it is in the data) because sampling of the
30
X.......... .. ' b-- -

chopper was only 512 Hz compared to 1024 Hz in the case of the spectral data.
As pointed out the ripple cannot be removed from the data without more sophis-
ticated filtering techniques which are beyond the scope of this preliminary work.
There is also an inherent error in the spectral data due to a one
count uncertainty due to digitization. One count is eqvvalent to 10 milli-
volts by Equation 3-18. From Equation 3-20 the noise radiance for this
voltage in high gain (G=l) is
B = 0.01 M / AA (3-36)nun (col)
where M (col ) / AX, is the calibration factor in MR/volt (see Figure 3.1-1) and
AA is the resolution. From the figure the calibration factor depends on
wavelength showing values of 2.23 .IR/m-volt at -15 vim and 16.9 MR/)im-volt
at -5.3 pm. This produces a noise of
Bnois e = 0.02 MR/um at 15 pim
B noise = 1.7 MR/pm at 5.3 vim
These values are well below the signal levels encountered (see Appendix E).
An additional error is introduced by the decimation process because of
the necessity to round off the computed peak value data point number to the
integer value. This causes a cyclical error every 5 data points of about
10%.
31

PART C
4.0 RECOMMENDAT IONS
Data processing techniques of Circular Variable Filter Spectrometers
have developed in the past 5 years to a point where spectral results can be
accepted with good confidence. However, limitations in interprering
processed spectra are imposed by a variety of design parameters. For instance
leakage due to imperfect out-of-band rejection of the CVF can contaminate low
spectral signals. The best blocking possible with a CVF is probably four
orders of magnitude. Non-constant CVF rotation can cause wavelength errors
comparable with the spectral resolution of the CVF. In the case of the EXCEDE
HS-3B-I poor rejection properties of the electronic filter caused chopper
second harmonic to contaminate the data.
Specifically we recommend that the EXCEDE data and techniques presented
here be considered preliminary and reviewed for adequacy in terms of the
physics involved. The helium instrument (HS-3B-l) data should be reprocessed
by more sophisticated techniques to reduce as much as possible the effects
of second harmonic contamination.
32

5 0 ACKNOWLEDGEMENTS
We wish to acknowledge the many helpful suggestions made by Robert
O'Neil of AFGL and the Principal Investigator, Dr. E. Richard Hegblom of
Boston College. We also thank Mary Kelly for typing this manuscript.
......
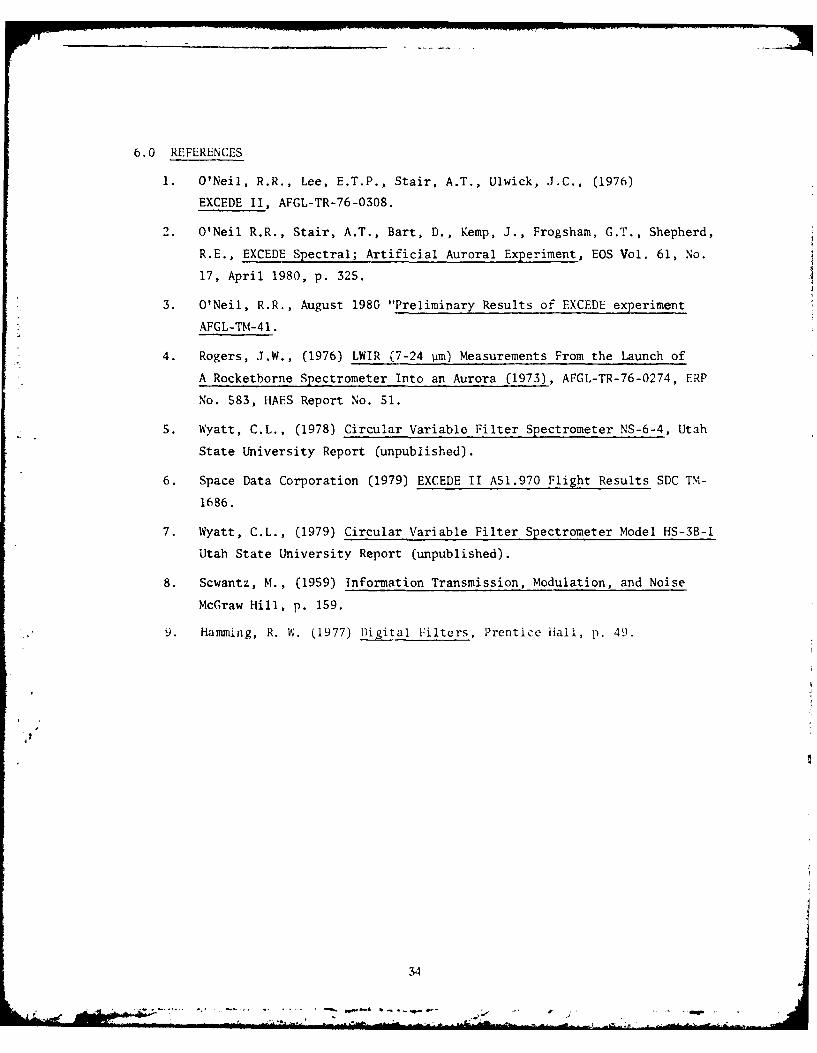
6.0 REFERENCES
1. O'Neil, R.R., Lee, E.T.P., Stair, A.T., Ulwick, J.C., (1976)
EXCEDE II, AFGL-TR-76-0308.
2. O'Neil R.R., Stair, A.T., Bart, D., Kemp, J., Frogsham, G.T., Shepherd,
R.E., EXCEDE Spectral; Artificial Auroral Experiment, EOS Vol. 61, No.
17, April 1980, p. 325.
3. O'Neil, R.R., August 1980 "Preliminary Results of EXCEDE experiment
AFGL-TM-41.
4. Rogers, J.W., (1976) LWIR (7-24 pm) Measurements From the Launch of
A Rocketborne Spectrometer Into an Aurora (1973), AFGL-TR-76-0274, ERP
No. 583, HAES Report No. 51.
5. Wyatt, C.L., (1978) Circular Variable Filter Spectrometer NS-6-4, Utah
State University Report (unpublished).
6. Space Data Corporation (1979) EXCEDE II A51.970 Flight Results SDC TM-
1686.
7. Wyatt, C.L., (1979) Circular Variable Filter Spectrometer Model HS-3B-l
Utah State University Report (unpublished).
8. Scwantz, M., (1959) Information Transmission, Modulation, and Noise
McGraw Hill, p. 159.
. 9. Hamming, R. W. (1977) Digital Filters, Prentice Hail, p. 49.
34

w
crU
4-4
8 ~wv
0- C
oo -3i
D V ILD0
Jt
0
00
z -r

1 0 1,, , . , , ,, , , i , , , , - i,,,, ,,, 1,,,, ,,, ,,,
NS'-6 CVFSYSTEM RFSPONSE
f:5.25 pm
:Z= 5. 40 p
S Long 40
CQ0
4
%.: I Short 4
z= i
2.10! 0 3,50 pm
Ef,1111tl 11 1 I1111 , 1 r,. 5 1 31 1 9 .
1 3 4 5 6WRVELEN'Th [MICRONS)
Figure 2,1-1, CVF brightness calibration (NS-6-4)
4
sO

I-4
V>
c o raCI -- C1:
E4 4~co 0
- ~u C)
00
rc41
co~
*1 4~:jI~LIC.- x C rx-
C LLLUJ4LLLLLLLLLLLLLLLUJLLLL Li.LL
CD CD)
CNOI 3I W/dW ONLU1OUN

5 J[J . .. .. . .r . ... .-
HS-3B CVFI-- rSYSTEM RESPONSE -
.i-
CJL
C)- -
I.- -j
,"I1 2 . 5 _ 2 2 .3 2
0 --
. . MAS1 K sh rt ! A S K t_
r3.9 6.8
3 .LS 15 23 25
Figure 3.1-1 CVF Brightness Calibration ([IS-3B-1)
38

I I
SPECTRA
SI I
spectra signal
0chopper signal
CHOPPED SIGNAL.1t I ! II ! I
phase change
0
FILTERED SIGNALI I
.,I Iii
4.4
CHOPPER FREQUENCY
I I
TI ME
Figure 3.3-,1. Principle of optically chopped CVF observationshowing phase reversal wheon source radiance isle's thmi copperl r':idi ,•wc.
L. . . . ... ..... - .... * -.. Y 7_. .-

C)v
cEz
047
-JL
0 0CC.
400

CHOPPER FIT
B= 194.0954
C= -144.2404
FREQ 106.555
400CJ
co 0 --
S-4000.00 0.02 0.04 0.06 0.08 0.10
TIME SEC FROM 294.05
Figure 3.3-2. Example of least squares fit (sinusoid) to chopper signal
(solid squares) for spectral scan 1210. Also shown are
frequency and constants determined as a result of the best
fit.
41

.....o/
c4 -Ak
4-4
o Pzi
0
C,
424
InI
4?4

NOM2IW/ W- 3NUIOU8
CD 0 0 CD0
o! 41
C-4
z
0,0
I--
0 r-
U) CD LjLi
C- X
~,U)Cc
co.u.:~ .
_ _ _ _ _ _ _ _ _ _ _ _ _ _ _ _ _ _ _ _ _ _ _;z~u i:

1.00 1 §ix
BW 4
I [
0.10t
-11_
0.0
0iur 2S 5so7 100
Frequency - z
3.3-5 Frequency response of smoothing filter u-sedafter decimating data base tu a, samplingfrequency of 205 liz EXCEDF. information band-width is, S0 Hiz.

N03N/W - - ICU
*C CD_ _ _ _ __ _ _ _ _ 0CD
CLLI-r
rd a)
w ......... -
4.
4-)* 0
0.S 44U~0
00
NE
SU) (jC. ~'I- U, x
cc -
U) I* Ito
w W1~ (2
hiDG
LO 0 LOoCM
o 03W/W 330 I

-101
-10 .
< I\
-2010 30 50 70 100 300 500 700 iOWC
Freqluency - lilz
Figure 3.4-1 Characteristics of the electronicfilter for CVF HS-3B-1
of
,10

0.4
0.2 CHOPPER DATA -
NORMALIZED "]90,0t SCAN 1095
0.
0.40 0.42 0.44 0.46; 0,48 0.50 03.52 0.54 0.56 0.58 0.60TIME (SEC) FROM 154.092
1.0/
z
0.8
0
-j
= 0.4
CHOPPER0.2
• ' MQRMON] C MODEL
0.0I I I I 1 154 64 04 04 94 104 114 124 134 144 154
DATA POINT NUMBER
Figure 3.4,-2. Comparison of chopper data with model of the formS = K] - K2 fco-s.,,t + asin(2,,ct-1)j where K1 and K2 arescale factors. and ,:t = 2-fc(ni-1)fs, and :=9 .
' ME ,S', FRO' 1.. 92

APPENDIX A
Spectral Scan Start Times and
Other Data for NS-6-4 CVF
Data in this appendix is defined as follows:
Column Title Definition
I Scan Number Number assigned to the spectral scan
2 Length Number of data points in spectral scan
3 Length sec Duration of the spectral scan inseconds
4 Time A-i, Time after launch in seconds of scanstart
Altitude Payload altitude corresponding toT.A.L.
6 Time U.T. T.A.L. in U.T. seconds
7 Clock Time U.T. T.A.L. in clock, form
~.18

.... .. .... rVUI4~C4's~~~'t~ jINJ(D74viJ rn.vn rM -, W-,' 4rr. .7 4..74 . o-, 4.7 .a a r4 4 4.'' V''~- U'u a 'I
~~. N . N .~ N . . .N ~'. . .N. . W ..N . .. . ~ 4 .O .O . C ON.O .N&NO.N .N. NN.hN O N.N N
CoNC0C.~~~~~~~~ ... ..U07001C .7 C t . . N~N7JN0.t.C .. ,L CI'C0 .CO 50 .. .. ~- ~ -
9- -C-"
1 (0....C~t.A~p .2.10.1 & .-. Co. CC 04(S CA'7S~ .. 7 I'Ll 1AtCNC COi.C.7..~C N." . 7 I if .. '..N.tt.3C.C.-C.-" .".: .45 .1.. .
cw ww Cc-
LI 2'C NN.C7 1 7 01 zI" l 4 0 4 I~N~r e Z. o Z1 ... II.7 r,3Ja7 I 4 C~N 1.1 Or -t. ff .' N 4.N'CLL .. w 1 f ~Q * .r . e. tI. .213.. N . . .C' .C .. 73. C .~O. ' .. .. .0 44
je ~ ~ ~ ~ c r.-c V, CC0 0 0e - 7!: C -C 1 f a0Clc - ;W'c err700 rc'C 0, C 'C -'0 1 t 0!- t- ". 7--r ~ (4 ~r'0 C4C 10 :.z'N'.3 -'N.% r.3r.~NO -,' 1s. '4 I AL .3I.IV 1.4 J7 LCt -1reI..I..4 00714? J? .4 " 4 V10 L:, j
LII-

4--
- ~ ~ ~ ~ ~ ~ ~ ~ ~ ~ ~ ~ ~ ~ ~ ~ ~ ~ ~ . . .. .4 .CU7 W aN ..JSJ .N .64 .'J .'.,'flJ .'. .1 .CJO . I 0 . . . .. ..7 fl. .' . fi C. ." 4 .. .I .4 .J. .
-. ~,....O6.,Ct ... ,av ICW CDC'IA 0 c Ol3..~~~3 nJ ... ~ .rc~uOJ . ,~"r 44'.6sO~~6 ..- ~.v,-rW ~ ~ ~ ~ ~ ~ ~ ~ ~ ~ ~ ~ ~ ~ ~ ~ ~ ~ ~ OC----- -CIt U'5UW .. . . .t. 6.vjIaNtmf -v(/t yN (,uv6/C.NJnfPrW
C 4- T ~c f 0C LL
~ a~a~rL~a CLCCLC067 ~ca or w c coa- acccc aa. c cca-c'c'c cc cccair a c./cC'CCNCt. aa a4444 40 043 4.3 40 4, 44 44 . 63 44 40 04 4 40 .3 44 44 407 44 0. 44 44 30 42 S 00 .
.0r4 . .c . . ..r...-..
L cc cc a c 'c-Oa :,ccac L"c, l Cc'Ul TcC0c CIO 'c crc"O~03O O OO C00C000 OO C,.CjO :O'J0CO O.0O C0 O4..CCOO,~S CtC :e S.L6.64 S0,C.0N..3 1 a 4.317 r/NN.it.NN !,a N a v~ *N N& a~. .2rN j'.S tj &4r' 44--.74 4r. /NPvr 4~4 4c6r 4r N NP.~
~o ~ c c wwco o f C * 'o,1% rv6src0C 11-N',,6 t40 ~ 0
C'c-.-CS ..- t't. - ~ .'Z-4 O~r ~ '3-6. N ** 4 ,ZC t.C..6 - .L..~.6. '' -

b
S. S.OCJU V'.?0Wl ~f'.CNU..- -P4rJ) -~sJ c.,4.I%5J MAWUI O U JtU~
".5 ~ ~ ~ ~ ~ ~ ~ ~ ~ ~ ~ ~ ~ ~ ~ ~ L SO.u4"S .NwU...Q L '0U0~0 Q 1~C O'~.~.J.
.4~~~'9 - -1 -LU&.~ --- - V - L-- --
-. b .5U U'%SM"N.St QQ t3~n..S.JU'J~ S U W ~ CC004.4 U~vn)E U'.LW.S SCO
OU t7 to. .7..7. 45.7.7 L~ n," ~~~m~%L~~~%~tu %%usWVU l vL ULnU~uuu . m l AI N% Z ~UUtrnU; %
ZJ~SS T-- C. eS. .S . .. . ..S .S. SS . . ..S.. ..~~U O C U C '~ O'O'Cum CC' N Q 0. fIf
j's~~~~~~~~~~~~~~~ ... ..U . .~i~hD V .I 31'* CffO . . ... Ifh .u . . 5. .... .-V k, . ... S S7. .l %~dC .0N .~ .3.M~ 43'~ &.roU.0 W.?OI.1 UN' CUUVo WS pi- OrN5lw
L. 4C
- - -21 - - M - - - - -,N .4,rt,& ',N -tr oO4-f ! 7l 7f11. .I.. -0.'p04-. -W9) - 4SlU..JUP-SU .L-.
'TC -----
eeoocOoooOO~~~~~~~~aO~~eC~ rcso~'0 ,O U0~0qOOJCJ.00 OJC3.0 J
Cc= N 'rrIce-*N.~~r.-7 s .st .~ .9~ ftC .4? 3~1E ~07 0\S. S.)..*S44tQC41 * 0*-. .?.. 31t S
.. 5...I 01 = S..,-w c4 ~ iS. 1
NNUro 40 SvC~ I%- 0'N 3ta7 .,..SS L ~ s' .e ~ '- C -- e
C' - m 7.r . . £e414 .~"-Lej ~oD.t4 0.SI.. ~ S 4 p.C O f <l~
Q- SS
r J o C C 'O ~ SI0 0 0 44 ~. ..... -- ~*. ~r4 4.4. ... ,. SS~lC.(JjV~I S-54f7
S. 1...~* -5.- S - . 4

C. r .370,Ca9. . . C,4~~.~ ,.a.-fll ,..-.'Lr-w a -.- v. - v-.-s s -c~ a o - ~ ~ .,ruOll.c,~0'3'9 lJJ,9. ... 5\1s, . 0t10 5. uL~0r.0 '30l-O.0. SO*SCs -. ~ ~ ~ 13~' ~ 9 ~ 9.5.G.9U V .C ~. '9.
% j---- - -'91W - -11. -0. 9w- o- .n.t~pw - - -O...,S.0. - -4 -93 -~ -iW .-? - - C--- -." PO O*
333S*3'4; su.3-
.7 CI 9 I U..'0 c 4r4 .mz.rIC441;
5. ~l'.',4-C I 43C L.-3c3 m05 J 0' C . Q S. . .0:9Z '4 .4 -Mmb-C Oce a,G. .W.tC..J~l, rI11..lc* q cn..0a.9'cl1JN..%..%Aa cr .aa. 9l ,Jt D9.4a M- a .CI , , J rlL 3,',pJ4.t.,0. C' ' at C' Ct.I C c C9..I
.0rU~ 1 Cc0f1 0f1r303 -N3Nl- Z M 1.4 N "I r
t9.C'-O43S1f.. J.Y rtC.4-r..,,rP".43.lUL.5
0.Ct a0 - vN W 3 U P P.C C OL-.4',. -. 4U.ULUft'Prt1.93U91. LrL3C .1 . 0N a P.l -aaCC .- C. ,.5S..1~1 0 .C .@ .~. .3300
C-, : V f . ' P rC ,rLfl I c ~ , rL
005-.~~4 .Cj O00-0tJ CJ C 0C0-TC0 -0.' ~r. o C oo co ~ C z C1CC0OO C CC500 C'4V 4..e-C-sCC '.'U17.ep "L:. -r9N C.eCcr rNrclU~9Csl'.9.9'.~en n .e.e..C.C.9 NN19 '
~~L 'I 'am a- 9U3lW....C9J-.C9. N
.~,o-r- ~ C C cC O ~cOCC ' 00 c coC' e0 0S 0 0,O- 13" 0'f C,OC CuC C' c- l ~cC '%C' L c- tne- c l Q ' n--cIC- C ,
*.95-US.'9
5-30. . .~ .0. .Cn ~ 5 .CCOI ..J. . .O0 $ S 4 P.0 3' 31 c d zs. ... . . . .. . .G. . . rhC. . .,. . 0 . .3 c.
9...
it, V'S.L r .t .V !lj z r -- r.'~ Clr r ~ lPU.r rf'r0c-.... Z'r''3u r.StP z.CC C C'.-l' . 3CC ~ Nlfcl 1Icl 04Iclm .L~C.. J..1.9 Ch. C. rC, c , rc Cl. C&1.3,N N 99r 5 C.~,9 C.0. c.. c-S'.t. t r3, C, St OC
.1 1 - 1 34 3 .3 3 3 3. y , i ' 1 Si '.3 3 3 z .1 3 . 3 cr.' ; c45 3 . 1 ~ 3 . 9 3 . 3 . . 5 C N 3 . 9
55.2
0' o S~nJ.1 13 L. ~ .3. C0~'I. 35.z~a. C'~.C~L.4.4J.~ CJ ', -JC 0
.'4 .~C 39l C.. 1 IF
. 111 . 7 'w
------ - - -
~~.' L!
... . ... . -
(~~~~~u... . .. . . o U o o ~ , ..3 .'~ .a-4 .C .i'.o eL 4c l4.jcw 0o rc-z VLL\rt.%a
tC3O.4..rF~~~~~~~~~~~~~~~~~~ -" -.IF1. -~ -C -SL -'zfj J -S - -IU -j -' -''04 MS t)F -ft -'U -. c c.O C..cv-.,-.SJ(t&
.- C 0'd' d' _ u''0 C 'C'C ac c. CU4rC' jI[.d O1O ' ~ v vd' d'd''IC c'O r, :'C' UI r WW J I . , ,
~ 4*'~'.*!'4*. -N'.' ..4JFN t'J*~ 'a V JNN I 4'F4 J~r~rJ ~ JrJ'a,'CJ(ae'N~d~ N.\~~t.CuC*\r.rN
-~~~~~~~~~~~~~ . .F 4 .4 .~~44 .. C .(' 4 .' .'. .'. .'4 .C ? . .l . .t .U .~4 .~U .eC ... . .4 . .
-r11i-1. *'-' 3 4*-*... _7a- .a,-., T_? Tr. 4. 4 . .T - _v ~
I.3
1'CIr S.4Sp J U U~ P.tCOd ~ '.." j' .4 t-( ~ .~,-..s4* ~ II ''-* CO0..-I.'4

Wc Macw ul'
.4m -. I 2 . T .,- 7027j J7 J I, UUUU W IU
* a. tJO~~a.,4 CIS. wwt'.'044-fl * IVIL4.4~) .44tC 4W' -- o...ca uI~c0frcbo.J04U0.44~cULc 5..*.c...t.4.t .c. .c . .u..
4.- - N 0.r
. . . . . . . . . . . . ... O .. . . . . .. . . . . . . . . . . . . .0" . . . . . . . . . .es . .s JcrcC .t- -. Jr.. IC .* .r..- . . .44 .-C . .
a gr.r.44 " .40r c m- 'm v~u~l ww 4-'sIfFc'. 4,- Uft' ccic 4fJUNC .4N - .. 4C4 '9t4 ,-- cP r'J.,j ,-. .
~4 74 -. 244 44 J4j4SJTc 45c cC4crc U-2.4*. s4z
Z V. LI' ~cc. - let C'#c. ~'; L no 'r'. C . LalC 0-'N C, o-c - C :cC1 C--' f- ..C. . - t2- -
- 54

- mm
UN 9 o0000000000Lnooooooooooo 0404s0 0%uo~rC. . t4'1 N OUtJCJF~ ugCCN 1v.3 -1 111 U ' 'WWG1- -10* I'U 0~Y NU\ .L: .. 4 ~ 'O 0. O SL YW .)t - U. 0 .C
4-. ~ ~ ~ ~ ~ ~ - -- --------------------------- 0'"c :~~ ~ 4~'*N W~4.0tOf ,LP4 '. '. ~N~N Co aZ
!U' ll m 7 4.c-5.-3'4 xo cI. KmW - aI .mW C 4KWD oazv aaC ' rll,=~L4& 4414.ifc'.u'J' &L4U'n~~r,' 'IU.'4 Up~i~fcr.I .'f.4414I~ L~fjfUU.fl.ULpUI.Il..q. XL('I.UC"flt flvb.U S 'JP VUL'4%. '
~~~~~~~~~~~ .4'& .s44 . .. ' .C 0~O6 .00'' .0 . .-
,-C IL r -'P1 -% w
~C~u ' . 0 W-N.U' a~.' -f -4U' Cr UWVI.U r W?3-* C. C
~~~~~~~~~~~~~~~~~~ .3 . .t .U.~ .3.%r.. . .. .rs3 .-c' ..r.. a t ~ .4 . ~
L.'.oo ' c' r0 Cp CC ,rrcCcr -C-c',' t, c C' C'"' zf c c C'4 "C I r~~--Ec -,C.LC'.1c C, r r ct' f' j C'' 'r' r-> 'C- c'. C'i -.
J 2 .C %4 4 1 . -1:4 * r.? -1.7 'P. t.OCN W't .W 4 ON fr.ifl z-L 0'.'..0 .. u -r j 41 r. .14 . .ac,2C' a-A 3.- 5. C
4do4-c. no ce Inor -o .1 1c 4 z= 4c", z oo 'r .! J 'eo mne Lc-cocoV kft 00r.3 V tr WOro c. L' !O . ' rL.2v- ,'ir.~I i - 14.-r. 4.urJ~'3~'..r~~rtirs.~N -.... 3r* -LCN(i4 I C '- 3't~aC r.?r. ~*.3fr'.~ ~WNP 4.w (vvC .... i.C
u aj% U C 3 e . C ~ r g ~ 3 W r ~ t r i S C ~ ~ . t ~ ~ ~ a C ~ r U r ~ t t ~ t w r

.3f = fU
C* . I
* ~ ~ ~ ~ ~ ~ ~ ~ ~ ~ ~ ~ ~ ~ ~ ~ ~ ~ ~ ,r 4. .j O 0 00 O 0 0 O C 0O 0 0 0 0 0U% O 00 00 00 00 0 fl f% 00 0L % 00 00 00 0L Voir 0
I Kt 1 U.-'C I-"~ 1r l-,Wr..3 0.t~s., . OU)0. I.W - 4 . .,t P .UCJ,. n.C,,:7 I 'N'a t- ,..-NL r.' U .3U UO~ .4 Z .0'N.NNWZ wn%,Avw WZ 6N %rLOUMN ;Z.305 r ('3K.iJ .40C.O3 UC-..M. .OIU P4-OC .u'. U'UNU. .7UJTN i')e.J0 W . L- L9 K6 L. L 6
- ~ ~ ~ - -' .' - - -3 C - - -4 .4 r 4 -4i. 4 4 '0 3 C'. C'. C - - - .. ', N r, N ... -. U 04 O '0 --7C 7 ''2 .-c
* N * tU'* U'C %~~~'.C C > . 0 . t f , .MA.sI . . t' ' .4f9 W 4 * ~ . t ~ C C QC 0'.tu h J ) J C KC
* ~ ~ ~ ~ ~ ~ ~ ~ ~ ~ r C' .. 43373....37. .UU ''Ur.WU.9U( UI\'I a - - - - - - - - - . .
. C -- .. -"
*r'~~~~~.L~~~~ilL~~~~~t.C"0t~~~~~~ .4't ..CIJll .. C )4 , .4C .'~l OK .) .4 ..n- C ..4 .3 .~ .-w r . rf .C . c. .. .C .~ . . ., ..
e..- .4 --% -- - - -
. . . . . .. . .~ . o cr. ~ r . .' ...0'' G .. . ..~LU .D" . .. t .C .3 ,'
I.r , r 7 r VC, tC, Or oC..4 r" -0oc- -C,~'0,~,C. Pra nO-'O 0 'l-r~~-n ' cL a~"'.C' r- C, M C. -aN.C C~~r, .flj' C.. S. z9) 14, 4 0.0 ra W ',o J r rI.9s .7>.1 -J J O'.?4 . rjJ -T M7 r 0 4 N P ' C I4.. -T .r Uz Nt a . " I
C..?. .- ". 9 sK .0 . Cr F 00 . CC C',U , w~ a .9'.. .7'rK U.04 L4 r9'ICtc ? C' I.J ' Z*t,. .'C
.- fLL" P9 C 7 KN t' 0M . 9J.C N.- . LC a TC .7 'IV' u@ K9 C- N9 . -... * La -1C".-
2 ''. 37CI C.~.- ~ C ~ .""F ?~ 4C E'~KC~.0 ''.( '3. ' aN'p.KK CC .. 9.C~"90 33 IJ1 56KKC

q. ec -
(-- : .. ..
• ..d ..4.-
4N.r
* C. fp* -o
w N'

APPENDIX B
Spectral Scan Start Times and
Other Data for HS-3B-l CVF
Data in this appendix is defined as follows:
Co l umn Title Definition
1 Scan Number Number assigned to the spectral scan
2 Length Number of data points in spectral scan
3 Length sec Duration of the spectral scan inseconds
4 Time A-L Time after launch in seconds of scan
start
5 Altitude Payload altitude corresponding toT.A.L.
6 Time U.T. T.A.L. in U.T. seconds
7 Clock Time U.T. T.A.L. in clock form
.8

c. t. or M2t mo r' Cr e.,c~ o cet, r U -4,- tw. 0oo NPCC . CC .CCr Ot C CCfC cC.T ;-CN7 r . ,CCC5C
".~~~~~~~~~~~~~~~~~~~~~ .t -".c.K - ~"S 'd~..,.'K 'C. ."U' .Ea ... .-s,. .I .N .C N .y~ .nr r . a . . r. . . .S .. . .'. . .''-"--
- ' C '''.0 ' ' .. ?.7,. ION (L I I C ~(tCC ' 4 '' 1 3
K~~~t..*..~~~~ Z M.t L. U.~% .K.(0.K..K .tNt . . u.N .. aaaa~*,'.e -s U.~ .o,.aI s., .i Iarft 54 -
- - -. - -.- - -. - - - - - - - - - - - - - - - - -! : .3 - - - - - - - - - - - -. - - --- - - - - - - -. - - - - - - - --- - - - - - -..- - - - - - - -.- -3-U- -
~L:LILC'I(I L' I .'L~f L''S I 1.51 L'.L'S'L.LI.ILSL'5L'LLI L'~ L'~C'IISIlL' C IU' ISI' SL.C 'C"C ."L' 'LIL I I L W 41-t (IC .
t
C'.
" -f
I
r - r r
Ors~fle nCS~rU -. 40000'SL~n nC'S~ttn~ne~o'ttt~ez,0etnt .~CsSOS .' fr .'s .Sl' ... CZ. -. ''4t "
u.-~~..5 C.KI('J. m 2-1^',.s! _:;=
ZI rr
0=C'OCJOOC=3=~-- 0CC 'aD 0;Crboo:rO .' .CI .coc .OS'o cC ~ ~ , .S .5ZSC . ~ rr ~ C O'C fC" CC17.
CaUCCK~t'O'!'CC''((0- UC.K .c c? '-. .'UUC C .C '--' - X C..'(!.. '~'C.'~ ~C't* ' C 5 1. ' 5. ." C ' IN C .- L '0 l C' U . 0( 1 .5 U CI . .7 . 'C " L I. . W ' LIlI. c w . ) 5 0. '! U .S . * . 't . .I c .' ..,' -
. . . . . . .. . . . . . . . . . . . . . . . . . . . . . . . . . . . . . . . . .
- ' ~~~ U'UU't'.UC'CC.~~~~~LA.S~r C'C .- ~.4>. .~ S.J .LI'U'4LIU'4U'.'L'C<-. T. 71A 4C,:_ z..t."... C C aUlC. CIC t r. ->C *'. -.-.
. oJC'~a 0CC m05 CuOC, 000C c0000000000 -aco noo I~-ac "oCo ZCcOO, C-C
C,
-
7. 7- -N,7 7
- - -.
-0 -o.
LLC

c.1
I" r
C' o .O CC o . _7o r..' . o ,or , o ; •7 CC-' C • o c- • c'e c , r . o U ' o , ' cr c,- c c c c,c -, or -arL r cC Cf • - - It C I ° .. . . . -. . .C
* o o o. o o oo.~o ,,oo+,oo so,,,o co, , o oCt C CC 3 CC A .3 c ,. , o , o o..o . o C .- ., Y o . o o C' .. . . .. . .
* - ... , en~ o.-o , , . to, c ro, c , .. ,, . .,.rp o..2 , .. ,o.- ,.o,..rr C",-. . o- . ,C C , .. . . . . .. . . . . .. ...
-meC -3.Ccas >, Lb Cl.'N S .i. O>. c s.-..ro- ' Mo. IA I 4.5 .2M -' -cCv f'-C. -' '
Ci
Z. S L' C SaL ~. .pr r r -, ..
Sp44.. . . J . L -. .. . .... .. . ... . . .• I E• . . . ... . . .. . . . ..
C" ... .~ . .... ...t SS ..... 'C..- if ... . .-.- - -... p., --.. +p . .. . . ...o r N . ..f.Cc - . . .. . ca . ,. rC C C ,-h- C .I.-+.,,-,, -- ... -......
,a .,r
-c J, *--:- , -
-,- -
- ---- -le -0C OC '-0C r - C -ll -' -o ~ ol C'caO ,~ -o3 -n E C -- > - -. --------
-- --- - r Z C P -2.- -.- 2C-r- -sr---C-a.-.-J-rr-.-.- - - -- - C~-C. - - - z r-C -. -- ~ ~C -, -- - - -
n -s...Prr ,r ra -- -*--r- -e -. C -lp -C .-F -f, - -- ?. -2. -2 -. C a -- ' - ---- -- n - -C F -- -- - - -
,r,,
r ~ ~ ~ ~ ~ ~ - ---. -~~. -c -.Ce- . -O~ -.-- -r- -F.C .-. tP. - 7 -I. -4 -Ca-' -C - -. - - -. -i -C4 -
...
C' I- S-- C?'c'.....4a~s ~C . tLrC. 4~~- C C O C C' CCn- +C.N FP' 'C.. Ct 5* . c.........C.CC.jNC pt C'p-a-.CC'Cr~.,~J~r~C.rC~er~~j.r.Nrcpoe.rea.~rcPCJ CC CC.C. P.C-C .' rC. C-S

Cr-C
- --
LtCft -, It tl 2-tfL t I ff ! f 1-
o LfL c-co r, C ll Lr r' C'b01r ur.LnN 00 00 C' r Oct.,k~xuk o rL coo a ~ Llr1 t'0.0 0(0 000 00C CotW'lfI-l l CN~ 000 L0C C 0CC WCrn~l U' C'~r CL CC 0 C
% ~ ~ ~ ~ ITC4h, Nr.c &o.. Ct'. a..C P0:4 cC(. CBS C~t N C'.'4."'PO Lf lo wN ncq, '.~ ~r, I :v IcC -.C -. -C-L-S-
- C~.,JN .. .C %a "''r C!E ?. CV' S~O OL ,1IfrC .. .. '.0 . .C." L-CC .C'.L . .C .t ..17.. r- .* C
S. ~'U~' ..- t' S cZ.n P r rC~ uP"Db" c,o z v7, ,fl .r' rs.t--rl r. u'C.Uf0'0. U lloccN--N c. C-0 ( C C"'CL L .5'-
ft ' I('el lllr fSS CCJ. c-;,... t-.. Cr 1 7~a. 1.Z S~ C~.L --
ZL ~ C ,JL.(JL CIL cCC LICCLI L LI' C Lfl .IC.LPLI'C't LI'CLI' C --C LIC C'LI LU>'.& C'CL CC C~L'aC c C:, I ' C
C-'CCCC''OC~~~~~~~~~~~~~~ . ..'L .C .C. C .' . .L3C .C ICp-4\ .CL .1 .~C" 00.C 0 .7fL L Oc .-.-. . . . ..
CC.? .C~4'CC.'&' C00CC V' 0. ,W 0'L ,r CCL..'~"L N ~,cC...'.opor.C 0 '-L.CVC'-L.If0CC.0..'C C>..
r~~~~~C rro o -C.0 pr C'~ 2j Z O e,,,,,(YCC ~4K'II>' r..cnoCC 0'.4tC C C N- C lC CC'' C
CC'~~~~~~~~~~~~~~ ..0C ...000 'O L .CC .0r C , C o e ( o 7 C 0 n .00 .00 .00. bC.
(Cit ~ ~ ~ ~ ~ ~ ~ ~ ~ ~ ~ ~ ~ ~ ~ ~ - - - -C'CN'CJCUC -X'N:C~~~o~C4 -r 00ers04.~~ - rJ. - ~ CrJCCC - ~ ~ ~ f.rt.~rS r -'J -V -rj -. L -. , -< -
-.Ll C.-C ..- r~oaCC "f: C~..a -C.o . C5o- or-o~*C .- v c-'-v-r-,.-~-.
------------
.... 00 ~ ~ ~ ~ ~ ~ ~ ~~ - -00 00 0 0 -.0=C -00 00 0 0 - CCC -0 0 0 00 0 0 0 -C C C't 0-0 -CC -O t -
.a . O C0 .CL C IC~CCC.C .C 0CC,-rC C 0-C.C i '( 0
aCCC-CP..'c~0.~S -.. C- -
I o L 'O -04C ct: IC 'i'-tC C . 'C'' . < C CC 1.r 0- 0-,, C .. t'l--........
LC4 .0..C L .C..'-.I~j.OaCC cc~~sa oor.Z. - N0-"*~'.C...C C~.OC *iC4..~ C'..61N. '
Z~C00 C S.ifC CC J .'P 'C'' ?.1.SC 0.C' S C- O(.".C .0'0..CCCC00..NC.C C'..C 'mo no '...C-a

- ~ _, P '
Ir 11
I-7
2o
IL

APPENI)IX C
Chopper Reference Phase Angle and
Other Data for [IS-3B-1 CVF
Constants A, b, and c are defined by Equation 3-12 o' the text. The
frequency (FREQ) is the best fit chopper frequency and 'rlETA is the chopper
phase angle ,i relative to the scan start. MEAN HI and LO are the spectralc
mean counts for the high and low gain. NPTS is the number of points of the
scan. CII1SQ and INTER are the goodness of fit parameter and the number of
interations required to fit the data.
o63
- - - , w - .

M LU.4.4 . . .4 144 . 44 .
o.D %D0 %OW. 4-.UO- ,Cw G-
&D0 LI C~D NU)N kO .4U)N0 0% .4%DC C'a"'O'"6 44 Y% 0 D 4O' UN~ U N -7 .t3CD O'4 0W%'OM L.4.4-T4 W5 1,0' .44 U 041 C ' .4.oPal-i.4 N~MWV% I9 U0)N NU ) NjI?)%L, C T4 , f, U ) )
S~C - 04 4
OU)-) .4..D 6U NN U 0'0 0U) 0'%U W .AUU LI 't"M4.0 O'U)WW "N.0IU ..4iUr, 4 NU'NU C.JO \L.'.4 0'N- VIO 4 1U.NN 6% U4 WUN-N~f, N a'
.. J NN N ),140.4 N.4U% 1 *N0U'L..40 **4.0 f. .U' 0 ". ,flr' # N .C'0' OMt # U'Cop,. # t.3.-.1' ..?N U) W3 .L"
~ 0a'O O''U) O'.'O') ~O'0'0 0'o~aU) )00'.' 0O'O 04' OO'N ) ) UU)N~ U U))U)U)NN U)cv'U'0 U'.0..
U) UU'UU'UU'.'.LO U'UU'UU'UIf'f'LfIi'~U ~ WU''U'ULf''Li l1U'IU)U'' U LILI'4 Lu'US LAf'L AWU'I[Ul* UN-U\ U,
z c~ .lc~r . .2 . O .ko)40jr'4 ** P C044 4L' CC41 S.14 a%4 C-0 1 0' ) ' t ").0 N-N NP, .T -
N CD, NW44... IN .4 tP- I -44.. 1N4 -1M M W4( N .4.4.4 M4 4 . 4 4 .0..44. (P-.4) WN W. W-44MM-TC 1-~~~~~a1. ~ ~ ~ ~ ~ ~ Nl VVW' -4 0,6U U' U'ISI'UtUWU 'f'UU.f'UIs'.Ut' L'fI NL.L' I'~'.1 W1. M'&f. .L'I A'lfU ' LI'A LfC. U'' I ~ J U' r N-t i r NJ
MC)W.0U4)0'.MVCVM N'.4N U'4#0 0'0-4\j .O0'* .?N O~ 0 U1)N -. 0tO0L.4O1 3:= T v tf 0 W No.4P0NtO-
4 (D0414 '.. U'.U't.-~l$1 P j acc U, -UcO01INN 0NI- '.001 1OO0I 44)O CO 'U .4N- m.UUQ -t. N- 1, OO'uL 0ILI 100 10'tN 404 N4 N4 FO.4 -4 .4 .. N N.4 (\J410N #0. N. .4.4N. N. .4 10. N.4 . T W'.T 4.2
U'.4a 'C ,4C' W 4 a, wN U'.? tOD 4 cu .m 00- Mal 0'-t, D CM- V031 .4.4U z 0. O4 w m N ~ . at.. 04b 10 Ot0C4tL "LU 0'. O'#lo C'-0L' ' 4'j ' NIfUt'44 ' ... 4ot' - r-N ~ I,-.'
3 I U II I IDW I S Ic Ic IL ID-)I r
.4U 4' 'f,'.N#IO Cl~..104U.4 N'N4cU1N 0 Oa40040 '. L'4').'OPN ~~ .
... ... ... .. .

9. It-
.IL ..4
v . .4 .4 .4 .4 .4 .4 .4 ..4 . .4. . . . . ..
PoPPP o.-.4 a*,-,r LL U ,,to1 -
C N~0VcO'u ~ Qo?. U DA .QP.w~7 P..4ICor" r 'p.40 ~ O.eL .O.O04 wC7'.- wa *iow m W.-'mw Ma~ .c'L
Ocd
W lN c c r*...?*%.M*%. ~ ~ f W)4'MPP.'.P.~0.L04 rOO M4,0P IP- c W 4 3
"N") O'O'a'rjtjf tvm" 0.4Oj 04 -4O.4 o0 f 00C'001L0C400 -u
- wtUN .rUw m ~ UW\M' UNU\C' Mmuu' IC'IpN ULI'LgAs UA W \U LU\'U ULI' U\L t UtrU'I U LI'NI U% N U LCAW LI'U\U L UN L'NI IU UIfd U
.7 ........ C . . . .
I'...
L-r.P- co'~~~v ~ ~ .'. .' I ' .. ~.~LP. I.."3 .-
- 41 .1P).).,S, ~''* ~ is * 4.1'fU IL'.rJ..±. IL YN4rs i, 4 ). N AO ..- N L' 4!
101 I S Lll NS 0%0 .C N ...... 4 i- S0 NIID i S ('.ID I S %C1,01 101 IS . 1i54 J. %0 ('IDIDL S061 ID.4 If, i~ DI w 00 CI 10 1" ID 10 , ,'
V. I S S 9 I 5 II I I
4. J ,O ,O 0. . .9N t~ 1 ,,~,N.L'' 1NiJ'0 ... CONP. .. .L'i~@.*~L'C '4f'NNf64. .4N It '. '~f~eN e.0..5. vtl a,.C. 1010 n N .0 I.D O' .1~r 00'. ' 4),v 100r D.CJN I.n . - I ~ . iP.'.N "N
LIC ''_'i t23 ~ t4..(c4 VL'' f~ a4 ""Jf..t' ~ac2 ~~ 4.
u0 . .0 . N P.' .Cn:* * 3 * * 3 1 3 3 33 3 3331X \~~~N~~ "J' iit AJiNNN~ ,'~ iiIIiiNNN i Jiiiil~~ \~ J4iiJN~~ JL'JC. JJINN
p, I-r La

.4
OD~l l4 * 0, g mcw~ ra',P "acC -lo 1014(7 CNpP 0q 4v (%%=DU~ P~LTI4 m ',J 'wnlc%. ...
-0P G NZ4 0DI PIC GI4GN 44P' 4DN 90 NI O Dt ,4 .cf ON O.F-O4000 N O.W .W WF o
4~~~~~~c~~~~~o.14 G ampO M0O C . cu''.4p"U 0 N40 '0 . O O'O ~ '0.4~~~~XY0 N DQ'com'.N0m ~ ~ a ~
o C ~ N Q~a . N 'f 44.a ~ ~ MND 44~
0,4iNc~ecj~fJCV~krw~w"CrNu o wa0i rj" m~'oa OCu"~'O cm~O N~ C~ rrtufJI jCNc vr \Nl~ ifi% e VrJQC \% .l.%CUNfL% .WW\~ . .
~ 44 ~444 a4
X~Pj~ 01) Mr.)EIS A44IEJw Z "~\I1%(tj' men( n(J ""MCEJN.J~ f rl)s~%J~N~S NC\4 ('"Ji\ (JfU( n" C MM 4N(JSJ~ 1'4t W)JfJ (jfJJ(J
USLWU MMu ML MLMLu U.o'O'MM. -1MNMMM - NLI S.D% nM MMMt\inM4MW M r %M
ax " o4 a Ni 4u.0.N M .Y 10 -t M w 4.4 .4W,#- ,4M.,N oMDMMN4.W4 n=,44OM4, . CO- %D 0 4 .-0- "4.I.-co I. U.: C C U\ Lw n"UW "f~t N Sw C WU M 0N4 I4i ??.4wM1 CDm mtkII &r&tW 14u~r (\)ICu' Cr Nru M 1 m N u4 LN I&1' 4t U U'4,
N~NLL'a ~ Nf(N) .#.IIN( Q4 '. 0 . N iN)
.4 N.i4 ON,4 N,14rxN.4 0%J.4111\I Ck*J.4P cu N.4(f)N f.)(Cj,4p.n c ~ MC .0Ci (' t(Ul tN,4,4N,4 P)
,CT4 4,'pf-l C.,o4 b.40%*NoP .. 4t 4W,4t4'J W P00HW,4Jlt W"4 I 4lJl-4\ U'P'p.-JC .0P4 -4
Ct 4U'N WP' - LC0 V)4.4 M0N N CCU Cr, NN4 -. 0 .44.44 4ENJ.4P-.D.T 2 f- D Cl' W , nr w W 4NVN-D U(YDk.4Nt (4..4..4 t'N..44 71N .44.N 74.N %I4 C . NCJ. J44\n 4 IN ..
a ( t 4)=NGLC% A N c N r v% %o ark 40 MaM a- so aN am a" 1, a 1 l a ll ma a a r. 2 a t,
P4400W 40M'4 *,u n-V&Imcv 0a n Q&m N N P 44N4 *U'.40 tw. V1 o rJ mm *m* 42 00ko 4 I cM- rL(A Ai" I rim 4P 4,4 qyuP.,)P- U 0U ,D.0UCI ,4S.,NP-j a) 4v~l " cu .cc.'DcP. c,4N LCv piF~ ..,N U 1~~ ('-
0'N''0 0P. 0I.U NcD N'W"k U4~,,U~lP.I- .~ .'O PD~~.,~~~N~ *~..... .. . .. ~ . . . .. . . . . *. . .0..Cv
- 'I Ia I I ISQIWI IDDI S% S00C I IOU *DZ
ON- ,1 0JL ,1 , cr Df r cNxr-0P-% N rrl P-d l D % l\ 0NI-xN% 0 % L1 PT C% L
2zo .4-N IJ W 0'"c-.0% .OCU00 PD'o 00 D .. IO4Ic,1 WP.I P.4ao 4 7MJ.C-?P. .4.,t ,c Sc...o'.4 0 0' .4*4(.)0D "VD OL wD
~W 0L,4')NI4 ~tTN4 4.4,VIN4. 4P. ')N-4 .c444 P~(T* t.-P 4, .- .P",4 .,4c,4 N'NO.4 .0P't~N 4.Lt 2 7sr O
En . rN~ ' ' -tN UN' 4'P 0~~f0- U..,'4''~ L~.~44 , ..- U- ~-
.4. . .. .*. . . . . . 5. . .

Go9.04 N43,eml " dw
-t- 4 '4. 404 ..* .4 .4.4 t'" le .4 *. .4 914
.4c40w.,4.40
o
.I. . .....
-4 0 N4NO'i0 w C !71 . . .m .CN N .,. I o...m I" I*-C~ (9CU NE.N..N.NN 9..?. Ct. N ' C N CO1N10 ~l
xS. NW UuAut- ArUUNr~%%rLi\tLlr" r Ldl.tN sP'r-rrL UL *4.49'.J.4LLt\L m caw m o~eLm amc
C, .4NU 00DNCu zN. .49N4 . 9.'D . '0..N .C1rucN.u.~o' . C3N o'
-'L.A 3Up)a' NcY..c V'N.C'.00... 9Q ONN ON'.P .?.S . 411' 4 N ~ ~ &~1 03oL''9' fCC).
~~~~.4 ~ ~ ~ ~ :4. ..3 .1N. .0. .O .' .. . .' .-.N .0C.1 ~ ) . D 1..0 . . ~. .N '~,4.4D
.3C.3fO~ea.- 0c t p).JUw~N0.0p ..4%IIDJ . TNN .D .4mN t IN. N. .. N. U.Nev% .I I *\ .\ 41Cj I" I C 1Ck\ N l
I I ~N. ID I' N N I. I.4U044D , tL..N .U I11'' I I I I.I I I I I
VWul rj'404 jtc' N CI c 4. ?9.4rv"4u C9.)N.N. *M.%lC -JN.N.~*.. f~'4'. IC. ft .3.3INI4J
(A '.D')~'9,.N1.N4fN.~,,.I.341J'.4C'Jl 'C4 C 2N04CN '.9"44.
0OUU 14~~0'.t'.J')0' C'Ir .4N44P..04.0 0~ C' ..4~N..N.N.4.4-N.. ~rL" .. 4?'-0'*(LT'4D. NN N91'00.4.N.CU'40'1'.04 .000NCVO
S.
L). .0.uNc.. )O 4.... 3.NN0N.''r .l3.0. ". .O ~.o1~NNT. ~~~,u
I1ooluo .'C 9'T'Nlw .Ole 2140 C.'FO'D4 %C411" ko~oe,9.) LC.4 %D' J.4'N.C 'k.0JD44 N C4Jrl.311.3300
.4 ('*Jv 0%344.)? Sea m.. ey1. W\.P4'T f)\ NO .4 av.n4N" .44 V\OP) N ').4w 9')I' tSJ..4 pn4).-4 %N..q NN' C .t4 d
C. 'CL'0''C. .4'N .4.LC9...L. .. 4-N4 .4*.4 4N.~ P~f.4 0'OQ.49" O'31' .40'OI1 11.40 .4 N c.3 J .9.). N 4.00'
tO9'N..4.4004L~.N C ' ~d~ (UN 1'C 41'C9.d N UC. NO..4. C 441. 42C. . 0 .. 1' N.l940h
I.MO N.U..a.2.9,9.9)e.j'U'-.0941.0MD.3 a UU4 N0~iM 4I~ .. 03.2.4 MN.44N 4674..010

APPENDIX D
Sample Data Base for CVF NS-6-4
This appendix contains selected spectral data developed from CVF NS-6-4
measurements. Scans and scan start times (time after launch in seconds)
follow
Scan T.A.L. Scan T.A.L.
116 96.1080 271 171.4120
119 97.5590 276 173.8840
121 98.5300 395 232.7120
126 100.9500 424 247.0380
136 105.7810 447 257.6770
139 107.2340 467 267.3540
i53 114.0030 487 277.0310
156 115.4520 -497 281.8680
159 116.9030 502 284.2890
171 122.7050 505 285.7450
174 124.1570 507 286.7110
181 127.5440 510 288.1610
223 147.8600 -512 289.1290
228 150.2780 520 292.9960
231 151.7300 -522 293.963
- indicates difficulty in detecting scan start time.
68
, - -;5 ... -- ..... , __ -"-' -* ,.i._ .:2' -.. _-L -Z2- ,

z
ccr
W L0
in 0 to
-J zJ
to cr
Cr)LL
-LJ
IICD
L6

*jjLO)
c-
LI)01a
(n s- L-4 =-
0C
01 0)wa
ini
07

cc
* 0L1-4
C1 I 10
w
2zCA
:
CC)
crrLUo
L 0 LL
01 1 -4J
N7
LI4

1.0 U.)
(n
VV
fn
ccr
.0
* S3
C
cr-
-ar
z- L)
Ccc
ot
x) C)
-LJ
In
LLi
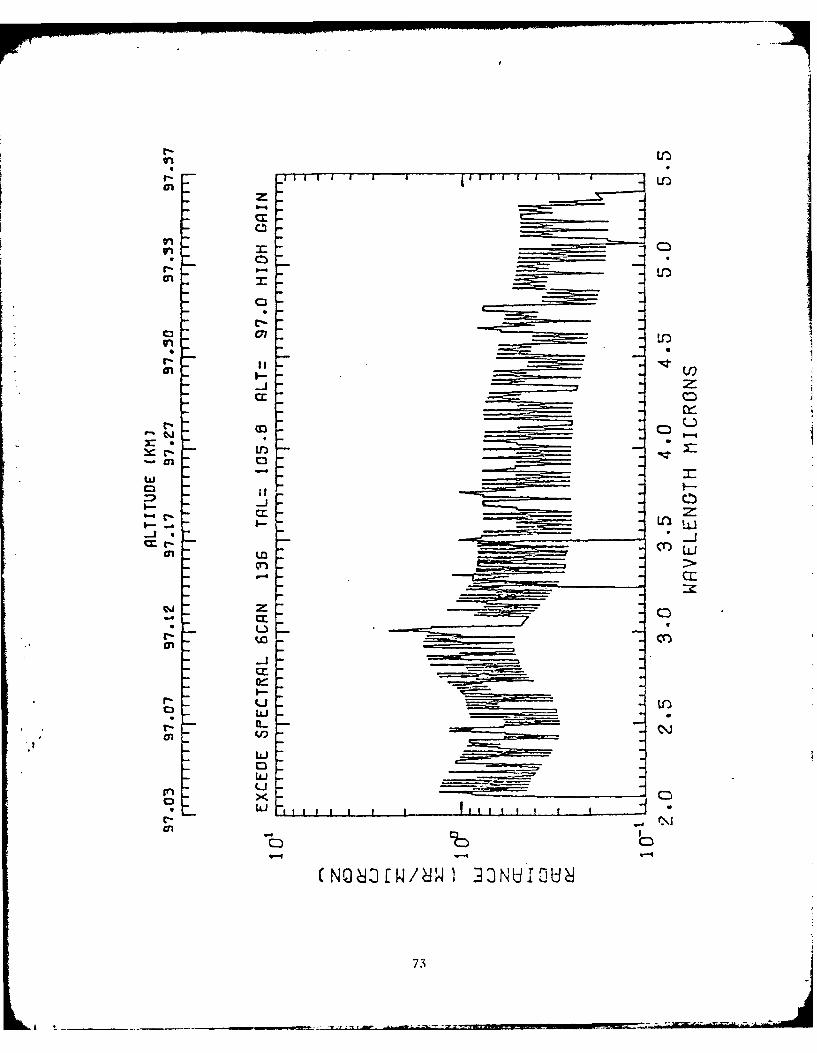
-vi i I I i g II I I I I Iin
r, LO~
C3.
cr
cc
I-
-j
t--
070
Li
IL)
D ____73

cncr
In
Cr ?
-01-
01 CLr)L
ol cr
-Jr
cr
CC\
CLO
X C:
74

rlf
-I I-
ulL
IV_ C'
,zz
k--,

-z -
I-CIO
w V3-4.-
-j
I
-4-
700

Inl
C3 I t I I I't" I I t
tncn
-. 4.
C3:
-, C
C3
ci F II- .1
C3
to:
-j _ ____ _L _
C3L3J---
04DC
77i

Cco
Li
z CDu
00
Cj
* ~z78

- rr
2c C3U
ini
C A
xccc
01 - q-
Ln x 0
-~ V:
9-.9

a.
Ln(
Lao
C- CD
Z-)z
cr Q)
ICEI
-J (cr)LA
cc
C3o
La (iLn Li
CIO C%
LiCW8 3)W O
08
- -7

LO
Cb-4
bcf
-dd
cr e- L
-n
-4c
S-w *
lt
9 U.EC.
-4b
II 4 IW 01)l U
~1 1

cr
C
C Er)
o ccC: L)
C3MO
rn c.
m-4.LL
0C C:ICC
-7
W cr __ __ __ _
X C)
07J
07 C.J It
C NO~ U1 W Z
-82

NN
Wit-J
0
tC.-
0
LU r
0i
r-
NN
C) lb
c83

L Z
LL
C) P-
In
CI,
tUU
04 -CQ
L C)
CNNIWgW I II U
I- -4

LO)
0 LU)
eI Z
CL -
w '-4
I j I -L l l- -
C~Cb
ZN8(W W 00~r

LO)
11111 I I 1111 I ILO
-4X
cc
007
cr
CC-
-~ r
'Iii
IL-
C-:)
'086
C- (1*)

i i iI IilI F
C-3
- Cicc
-t
CLC
I-)
0) ~~ *ilI I (NO8l31W/8W) J30N~rIOU
87

- o
•i
C;
:
'0 I,.--
h88
,o. 0
-Jr c0 -
o
-~lJ
a- L ENII I I ,I [I - |I I I
'IOl~ ] 31;J[1
Li\
4 \o\
88

0r) -Jcm_ _ _ _ _ _ _ _
03 C3
-I -i 2:
cc n
-C, (0
I-i-~:
5-
LLJ0 -I3
(NMOJC!W/ W) 33NUMCU
AD-AI09 89 BOSTON COLL CHESTNUT HILL MA SPACE DATA ANALYSIS LAB F/B 20/6ANALYSIS OF PROJECT EXCEDE II CIRCULAR VARIABLE FILTER SPCCTROM--ETCIU)JAN B1 W F GRIEDER, C I FOLEY F19628-79"C-0139
UNCLASSIFIED SC-SOAL-80-3 AFGL-TR-81-0224 ML
2 2
mmmmmnn-mE...--.mI'D
3-H2

liii ~ _ Jill.2
tIN11111_2iiI
MICROCOPY RESOLUTION TESI CHARI

(an
0 It~
C-b
-J z
0
oG
-J-
LiJfn Cr)
u iu
090

Lo'
r..
of 0-
LoC
tot
iJ
-Go
o r,
I-,
C)
9=1
corC
LU
91
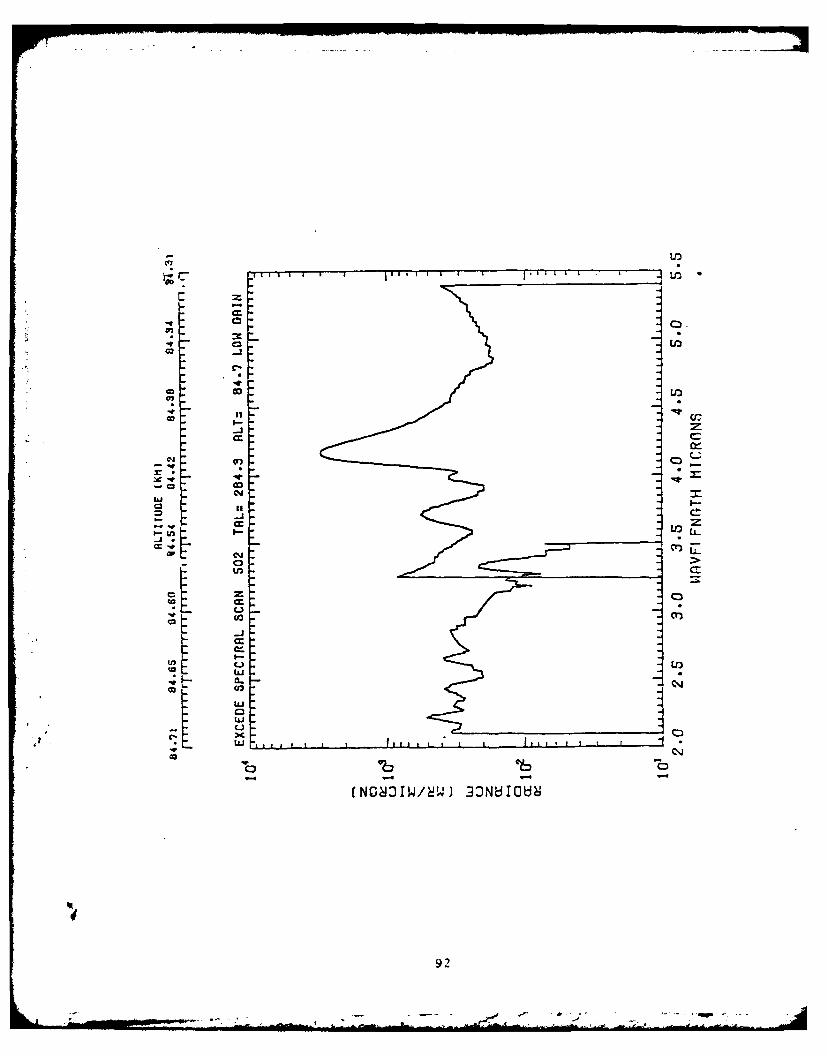
4-
- C
cr
-o L
o I-uj
z 6 60
(NON31/ W) 3NOIGH
-92

C4 C- L
- 0i
10
CIC
c.J93I
Ca9 3

U)
cz
- 0 0
-i
r(
cl C.
5- z-
Ni U?C-4 CL aJ
A 0 0 0

L?)
U, 0)
C-.
loo
C
0coa
C4
I. LL0
ca
-j-
ELIn0Q
U
lbILC
eN83W/W 33NIGU
Aft. I I II t Il

CCOO
-i
C!
030
C0 --
077
tjjj
LI
X CoLU
C3 C)
-jow ) 3UO~
I96

cc
U),C2D
C; I
I-n
ca,M
0-0
U3
C,,)
S-
Luj
>C - C
tNO831W/ W) 33JNUIOU8

C
U;2
C-
C--
-C-3
-er
LO U
*! 4. Uj
Li I
C3'
98
LLp

APPENDIX E
Sample Data Base for CVF HS-3B-l
This appendix contains selected spectral data developed from CVF HS-3B-l
measurements. Scans and scan start times (time after launch in seconds)
follow
Scan T.A.L. Scan T.A.L.
1047 96.1650 1111 173.7760
1048 97.3730 1159 232.9600
1049 98.5790 1171 246.9950
1051 100.9930 1180 257.8540
1055 105.8200 1188 267.5050
1056 107.0260 1196 277.1560
1062 114.2680 1200 281.9820
1063 115.4730 1202 284.3940
1064 116.6810 1203 285.6000
1069 122.7150 1204 286.8070
1070 123.9220 1205 288.0130
1073 127.5420 1206 289.2200
1090 148.0560 1209 292.8380
1092 150.4700 1210 294.0450
1093 151.6770 1211 295.251
1095 154.0910
1109 171.3120

C O rW/.4 ICNbLC
-_J
CF
CD-
uj C)
CDD
LLJZ
w -j
a-
to
-Jl
j LU
_ _ _ _ _ _ ci-c-
CCr
0 -LJ
- -4 - -4 u
100

NOdOI1W/dIW- IONUIOU~
V--
c~cn-4n
C3 0
LCLJ
CDC
CD LO
0) '-4
0)
LLi'cr
C',u
ot
C)C
LU
0o I I I I I 1 O YI 111 1 11litII 1 I1 11111 1 1
CbC1

NOd3H4W/ W- :3NUIOU
CD CM
Cl\1
D -J
LL)O - cc
fil I I I1 I ~ Iti I I I I jIfil l I j li[ I I I
cDcc
C
I-r
4~~~~- Il 1111tI-
102~
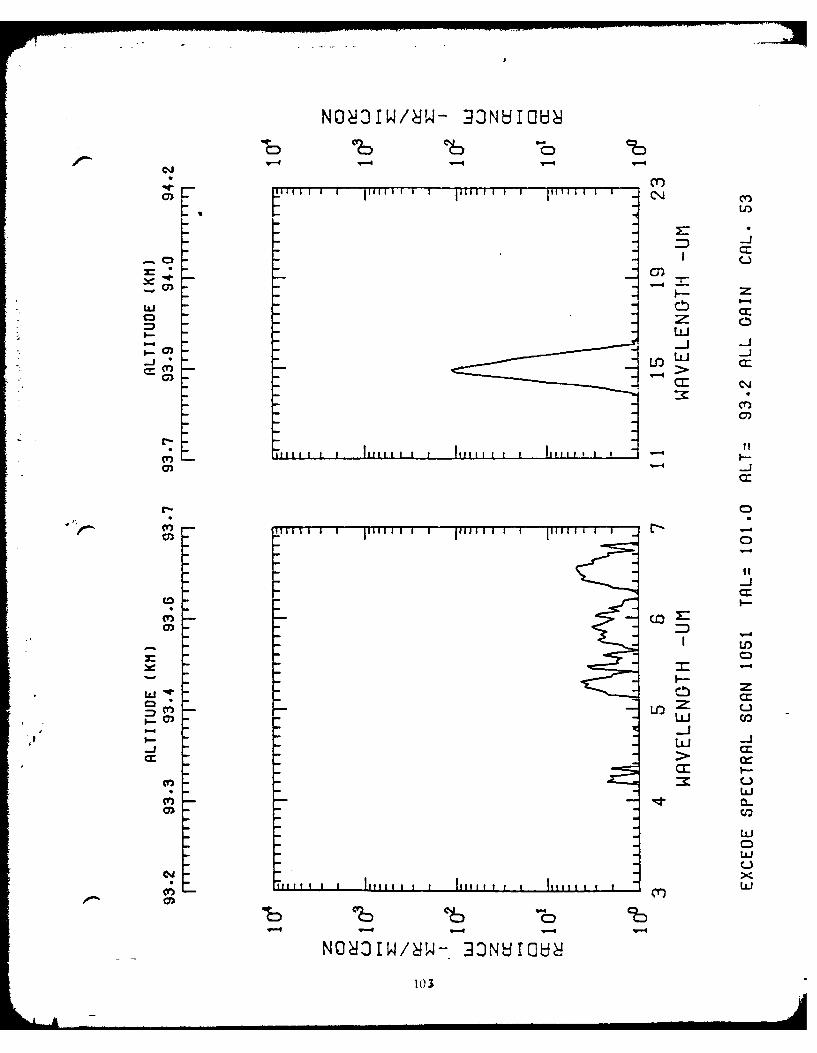
-44 V" -"
~I4 I I Ji lI I i I J llI I I I t l
zz
Lu C
C)
C)r
0
LrC)
ccc
-
-rLu -J
CL
Li
CD-
a) C C
NO~Ot/~W" NV"Q
103

0 0
C3c
:z
oLO
a: CD
C)
V-
9 cc
~1TTa aa a ieaa Ii i ~ Iaa a Lm
LO4
0) z)
CCU
0 *
U].
* L)
CDC
4 -- l
4, 3W/8- 33N -b
1014

C[ -lb C16
ui cc ' ('a
II
C-'
Icc
0 •
000 CO Lo i l 11U 1 1 llcrc
cr-
CC>
II
-j
onn
C) CI
105

11 11 1 1, l P il I I It I Il l " i I l~ )I "i I I C i
-- -CDJ
LJn
ui C)
to -
-o0LUI
-
- Icon hltl I I- ,lllA I I 11 1 1
0, i
o' 1 11 -- 1iil ill I I i, r i [ lll I I I CC)
C C
'-4
II-J
-j ccr0cc
- - I--0 ZCi
uAJ
0Lii
,[I,,l I I I gItllII I IIIJill I III lg I 1
NOO[W/I W- 3NHIOU8
lto

NO 3U4/4- 30NUIOU~l
U,
crcc
w -i
c- m .
C
cc-
jill??I I 11 1 111111 1 1 1 111111 1 I
C.0
CD
LL)
:K L)
o .to
LLI0Lii
C)J C-)L
107

- -I W- -
cr)
C31)
LLI 0z
LUJ
-J~ LUI ccr. C
-4r
o CiI 118 I I 1 111116 1 1 VIMl I I I U;
CD)
CC
-Jr
LI
Lii
C crC
oD C)i
-4-
108

Cb Cl
U?
- -D -=
-1 0
CDC
-
C"i
3Lo L)
cocc
tij
-- 44
109-

NO 131W/8JW- 3NUIO!J
-44
CD)-cn
-- mI
F-l
C-. 4
oo z Q
-4 c
0))
-4-
N03W8W 3UIC,
Lii0

NO OIW/ Th4- IONUIOU
C)
C; C4
- 4o9
o~~~~C CC______________
c a 1.0
LOJ
o CC
.. I
CCC
-4
C)
-4-
0 Li-4U
>,
cr-: 0bC ?

NOdIOIW/ IW- DnN,3CbU
V.I- V-4 V"
-4 ti lI Ic
-O
~ccc
-- 4 I-z
-. U,CM4
-J Cj 4CCI
-4j
CO~'-4
;- -4IL
LU L*
CCt'--)KL
-to-4D
112

0i0
w_ _ _ _ _ _ _ _ _ _ _ _ _ _ C b
LuJLO >1
Ll ~ ~ ~ ~ ~ ~ ~ ~ 0 I MIfI-ilIiI 111
II,,,,,Cc
-i ~C--4 - M
LU C)'4-.
-3 z
-O4I
c
LICj-
-0
~CJ Lu
Lu -)
X:Put I I I 1 1111 1 1 1 hLII I I fil ' II I I-
-4 L
-4l C
NO 3r/ '- 13b~LU

lilt F 1 II I I 1i D J I IJ IJ I jili I I I 1 11
-4
LcLJ
LUJ
_j c.J L~
M C
ccJ
C--4
CJ%
04
3 -4
c.JJ
-Ij
Lii
LiiC-i0-
114j
- 0

NMd31W/ !W- INUICI hl
-4 C
-- 4
-j
I~Ll m z z
LUj
L i l IIIflIlL-.I fi il
LNJJLI)>)
La C
-4
gUL I IIL-t L
C'b CD
NC~v~W/V'0 23!ZL

C-iiI-.I
-4r
cr,
ccJ
-4
C)
-J
cc >-
-J
I-ILU.W
cr icr
C) Cb C) c
NM3I II- 3!J1H
-11
LI AlkWWLU

-4 LIIII I 4
rr-
)
I-L
CJ
-~j
(7))
CD
-4-4
0 CC
r-J
Cc-iLJ
0Li
I- C-
-- W4
NO 131W/ ;W- 23N 10U 4
117

CD lb -
I I i l I I i l I )
Cii
~C
-- 3 4 I---]3U! ~
, 0 -
I.- "
~c J
I ItIl t I If I !lilt I I I I f ll I 1 I I ll 11111 1 1--
cc
1I11li t Iaaa u i Villaa I a 11 1 I 'I
LuL
ii
- rJ
CL
- X
N.- C - 3
118

iv---4 -4-
-4-
-4r
LL))
LL-J
LO
0 -4
o 2
* Lu
CD-
L I If IIf I ha
obCD C-- -

NO 13W/dIW- 3N ,QTU
-~ _ _ _ _ _ _ _ _ _ _ _ _ Cr)
U'
c-
CC
It.l LtLU 'l if(
-4-4
I C-
-4 C
CC.
II
-J
L -J
I- il I II.-tCIO4 LU
"'cr) cCo--' Lu4V-
-O3W/W 33
120~

NO3W/ 4- 3NHIQCd8
-cr
CD-
ClC)
CDD
CCC
uJ C
C C
Cm LI3
cacc
* 0CC
LUu
LUL
CDC
N 0, Wt 3NH 1 J-
L1 1i

N0831W/8W- 13NIOUGH
'4b Ib C~bC) CI
LLJ cJ00
U--3
0j -
M C"CC
C--I
Li ly Ip I 1 11 1 I I I i fill I I I I I
F-j
0L
LaJLJ
Q-
LJ
L)
11114 1 1 1111114 f4144 I 44444 I IL ?ILuj
- - - - - 4
NOI31W/ .- INHICI,'
Lim2

M,01W/I-~ -3HIH
C0)
v--
C; L
0C.
C3 o
cc c'Jcr-j
(0)
D -
0 X
-4 --4--
N 0 0"-owo 2

NO 31W/ L.4- ONdflO'd4
lb -1 - lb
CO)
LL-J
M CC
CC a
ccJ
ze -4
cc C->- C
co CL.
-LiJ
LUJ
cC-)
NOQIW/ IW9 3NHBZO1 24

NO 31W/LB4- 33NUlCHOl
c?-r-
CD cr-
C-J
* CC
I I I I [f t i I I I
-JJ -
cr~ 01>
I--
CC)r
Lf)LJ
LUL-J Q
XU7t. I il 11 11 1 1 1 l- r L
co:
A. 3 N
12LS
ikU

NO 131/ B.4- DONHIOH
r
CO)
CC m
0
C)I
Go
*n m
CC%
cnr
*l C),,
NO.1W/IW
126U
. . . . . . . . .. .U

NO 31/ W-IOUIH-
C) C
LL)
LL)
cz'
cc
0a)
0
C=J
clcr
jC.J CCr
co LLJ-J
-
L=
U-,U
91 11 11 11 1 l i I fill[ ' t 1.,Ll
- 0D
-4C~ C4)4-4-

NO11W8 - - -II
0D oilI I I I I fill I I I I IIH1 I I I a11 I I I y)
F Li O
ccLn urLU
CD0 LJ
C-.b
to
C3
CO"
a
I-
o
- vI-
U-1-
Lii
Lii
NO083[W/8W- 33NUIGH8
128

CD\
* . -
u-j
C.-
rI-
Coo
C.-j
0
zz
CD)LiLa
CO-
Ix~

NO 31W/ W- ONIUIOUoi
cI-)
LU Cc
LU-- j
u-J
(Dc-
co I-l
-4r
0
ccJLOI
-
cc; ck:
(0 a-
-JJ
C) C

NO431W/8- 33NUICU4
C) C
-o
11 1 1 1 I I, , ! i , I I I 111i I, I I - -
, .-
~~cc
- cc
U,C.-
"T , , , I fll i, I I I , 1 , I I Jill, I a x 4
-
1313
L i i
CCl
-JA
U,-
C
U, I litif I I I 1 111111 1 I I 1 1 L
OIL C)

NWMW/-W- 33NUI.4
1b OL C)Cr)V- (7"
cr ->* 0)j
I- Z-
CC"
crn Ml__I ____III- __VillI___I I
0))c'J
cv,
le-
>-
LQZJLiiL
-4i -4
N03-W/W 33Nb I
* 132

0u X
I t
m___ w
RHq I.4iIi i
>',
w X AI~ J~
>0
-J
> -z
5a
Id .
_ _ _ _~~ t .4.z

1 0 jy y ' i i i Ii i i F i i i i iiii I I I a l f l v l 11 it 1 1 1 11 1 it 1 1 11 i-0 ii Ai A
NS"-S CVFSYSTEM RFSPCNSE
1 5.25 .m
6 iVLg 5.40
C)t
Short
2.10 b 3,50 um
I1 2 3 4.5
WAPVELENGTH (MICRONS)
Figure 2,1-1. CVF brightness calibration (NS-6-4)
134

LL
r LLO
- 7- A -:
Cf)
0 01
- ,- 3

HS-3B Cli
SYSTEM RESPONSE
I-
40 D
2---
2 - 12.5 22 .3
long '
-MASK Lhort MASK
3.9 6.8
"5 15 23 25>! J _ " 2T, 1 . NI"-%'"S
Figure 3.1-1 CVF Brightness Caiibration CHS-3B-1)
136

SPECTRA
I I I
spectra signal
chopper signal
CHOPPED SIGNAL
I _ _.
V~~~ phase change
FILTERED SIGNAL
II I 'Nr
PI 4
CHOPPER FREQUENCY
T I
Fi-,r o 3.3-I Princi, of optical ' cho'v' c. " 0
showing phase -v whe.. )urcc r .

CHOPPER FIT
B= 194.0954C= -144.2404FREQ 106.555
a
4 4-- 4
0 J
_ 0.00 0.02 0.04 0.06 0.08 0.10TIME SEC FROM 294.05
F,,ur, 3.3-2. Example of least squares fit (sinusoid" to chopper signal(solid squares, for spectral scan 1210. Also shown are
frequency and constants determined as a result of the bestfit.
138

cc'
zU
0 1 I NfS SNI -

ccr
CE.
p.. * cm
r -4
jO Lj
NdZS~ I II bg 31?C
140-

CD 0 0
ecli
C-
07
In CD
Oz L)
Lj.J 0
60zC Cn
CD CD
M CD 0
uo. CD L
07 -
N08J -/8W
14 1-'

1 .00
7 4-
0.10-
0 25 s0 75 100 ~t
Frequency -Hz
Figure 3.3-5. Frequency response of s.moothingr filter usedafter decimating data base to a samplingfrequency of 205 Hz EXCEDE informationbadwidth is 50 Hz.
142
- - - - - --r ,.t r

o 0
0.d 00
r S r
. . . . .. . .. .. .I , , . , I ..... .... cm
It -
- Er
0r %
IIIOIu
>C-
CD inN . -