cir 1q 2014 eng
DESCRIPTION
Interim Financial Report as of 31 March 2014TRANSCRIPT

COMPAGNIE INDUSTRIALI RIUNITE

CONTENTS
REPORT OF THE BOARD OF DIRECTORS
ON OPERATIONS AS OF 31 MARCH 2014 ..................................................................................... 01
1. PERFORMANCE OF THE GROUP ...................................................................................... 04
2. PERFORMANCE OF THE BUSINESS SECTORS………………….. ............................................... 08
3. NON-CORE INVESTMENTS ................................................................................................ 12
4. SIGNIFICANT EVENTS SUBSEQUENT TO 31 MARCH 2014 ................................................ 13
5. OUTLOOK FOR OPERATIONS ........................................................................................... 13
6. OTHER INFORMATION ...................................................................................................... 13
CONSOLIDATED FINANCIAL STATEMENTS ................................................................................... 14
1. CONSOLIDATED STATEMENT OF FINANCIAL POSITION ................................................... 15
2. CONSOLIDATED INCOME STATEMENT ............................................................................. 16
3. CONSOLIDATED NET FINANCIAL POSITION ...................................................................... 17
NOTES TO THE CONSOLIDATED FINANCIAL STATEMENTS .......................................................... 18
1. INTRODUCTION ................................................................................................................ 18
2. CONSOLIDATION PRINCIPLES ........................................................................................... 18
3. ACCOUNTING POLICIES .................................................................................................... 18
4. SHARE CAPITAL ................................................................................................................ 19
CERTIFICATION PURSUANT TO ART. 154 BIS,
PARAGRAPH 2, OF LEGISLATIVE DECREE 58/1998 ........................................................................ 20

� Report on operations
RReeppoorrtt ooff tthhee BBooaarrdd ooff DDiirreeccttoorrss oonn ooppeerraattiioonnss
aass ooff 3311 MMaarrcchh 22001144
In the first three months of 2014, the CIR Group made a consolidated net loss of € 2.6 million
compared with a consolidated net profit of € 6.4 million in the same period last year. Consolidated
revenues amounted to € 1,069.7 million compared with € 1,241.4 million in the first quarter of 2013
(-13.8%), primarily due to the trend in Sorgenia's revenues.
The contribution made by the four main operating subsidiaries to the net result was negative for €
1.2 million compared with the positive amount of € 1.9 million in the corresponding period of 2013.
The slight decrease is due to Sogefi whose net contribution increased from € +4.1 million in the first
quarter of 2013 to € -3.6 million in the first quarter of 2014. Espresso and KOS ended the first quarter
with a positive net result, in line with that of the same period last year, despite the uncertain
economic environment. The contribution made by Sorgenia to the Group's net result for the quarter
was zero; the company recorded a net loss that was offset by writedowns in the consolidated
financial statements at 31 December 2013.
The result of CIR and the other holding companies in the first three months of 2014 was a loss of €
1.4 million (compared with a profit of € 4.5 million in the corresponding period of 2013); this change
is due to fair value adjustments of the securities in portfolio, positive for about € 6 million in the first
quarter of 2013 and not significant in the first quarter of 2014.
At 31 March 2014, consolidated net debt stood at € 1,943.1 million, compared with € 2,412.4 million
at 31 March 2013 and € 1,845.3 million at 31 December 2013. The consolidated net financial position
is the result of a net financial surplus for CIR and the financial holding companies of € 506.6 million (€
538 million at 31 December 2013) and net debt for the operating groups of € 2,449.7 million (€
2,383.3 million at 31 December 2013).
Group equity at 31 March 2014 was € 1,131.8 million (€ 1,131 million at 31 December 2013).
As regards the situation of Sorgenia and its financial restructuring, please refer to the detailed
description given in CIR's financial statements at 31 December 2013 as approved by the Board of
Directors on 6 June 2014.
The charts on the following pages show a breakdown by business sector of the economic and
financial results of the Group, a breakdown of the contribution made by the main subsidiaries and
the aggregate results of CIR, the parent company, and the other holding subsidiaries (CIR
International, CIGA Luxembourg and CIR Investimenti).
1

INCOME STATEMENT BY BUSINESS SECTOR AND CONTRIBUTIONS TO THE RESULTS OF THE GROUP
(in millions of euro) 1st quarter
2013
Revenues Costs of
production
Other operating
income &
expense
Adjustments to
the value of
investments
consolidated at
equity
Amortisation,
depreciation &
write-downs
EBIT Net
financial
income &
expense
Dividends, net
gains and losses
from trading and
valuing securities
Income taxes Minority
interests
Net result of
the Group
Net result of
the Group
(1) (2) (3) (4)
Sorgenia Group 475.5 (452.3) (0.7) 1.3 (8.2) 15.6 (20.2) (0.3) 4.9 -- -- (4.6)
Espresso Group 157.8 (142.7) 1.5 -- (8.0) 8.6 (3.2) -- (3.4) (0.9) 1.1 1.1
Sogefi Group 338.7 (302.7) (15.1) -- (15.1) 5.8 (8.4) -- (2.7) 1.7 (3.6) 4.1
KOS Group 95.5 (79.4) (3.7) -- (4.6) 7.8 (1.9) -- (3.1) (1.5) 1.3 1.3
Total for main subsidiaries 1,067.5 (977.1) (18.0) 1.3 (35.9) 37.8 (33.7) (0.3) (4.3) (0.7) (1.2) 1.9
Other subsidiaries 2.2 (3.3) 1.6 -- -- 0.5 (0.2) 0.3 -- (0.1) 0.5 (0.3)
Total subsidiaries 1,069.7 (980.4) (16.4) 1.3 (35.9) 38.3 (33.9) -- (4.3) (0.8) (0.7) 1.6
CIR and other holding companies
Revenues -- -- --
Net operating costs (4.0) (4.0) (4.7)
Other operating income & expense 1.0 1.0 1.2
Adjustments to the value of investments
consolidated at equity 1.0 1.0 1.6
Amortisation, depreciation & write-downs (0.2) (0.2) (0.2)
EBIT (2.2)
Net financial income & expense (2.8) (2.8) (3.2)
Dividends and net gains from securities trading 2.1 2.1 8.4
Income taxes 1.0 1.0 1.7
Total CIR and other holding companies
before non-recurring items -- (4.0) 1.0 1.0 (0.2) (2.2) (2.8) 2.1 1.0 -- (1.9) 4.8
Non-recurring items -- -- -- -- -- -- -- -- -- -- -- --
Consolidated total for the Group 1,069.7 (984.4) (15.4) 2.3 (36.1) 36.1 (36.7) 2.1 (3.3) (0.8) (2.6) 6.4
(1) This item is the sum of “changes in inventories”, “costs for the purchase of goods”, “costs for services” and “personnel costs” in the consolidated income statement.
This item does not take into consideration the € (1.3) million effect of intercompany eliminations.
(2) This item is the sum of “other operating income” and “other operating costs” in the consolidated income statement. This item does not take into consideration the € 1.3 million effect of intercompany eliminations.
(3) This item is the sum of “financial income” and “financial expense” in the consolidated income statement.
(4) This item is the sum of "dividends", "gains from trading securities", "losses from trading securities" and "adjustments to the change of financial assets" in the consolidated income statement.
1st quarter 2014
CONSOLIDATED
AGGREGATE
2

CONSOLIDATED FINANCIAL POSITION BY BUSINESS SECTOR
(in millions of euro)31.12.2013
CONSOLIDATED
of which:
AGGREGATE (1) (2) (3) (4)
Sorgenia Group 1,451.5 194.2 280.3 (1,917.0) 9.0 8.9 0.1 0.1
Espresso Group 813.8 (209.8) 20.0 (58.2) 565.8 250.3 315.5 313.5
Sogefi Group 499.3 (34.2) 39.7 (322.5) 182.3 89.9 92.4 97.7
KOS Group 418.5 (23.8) 8.2 (154.9) 248.0 123.5 124.5 123.2
Other subsidiaries 8.5 (7.5) (7.0) 2.9 (3.1) 0.2 (3.3) (3.2)
Total subsidiaries 3,191.6 (81.1) 341.2 (2,449.7) 1,002.0 472.8 529.2 531.3
CIR and other holding companies
Fixed assets 70.1 70.1 70.1 69.1
Other net non-current assets and liabilities 136.2 136.2 136.2 126.5
Net working capital (110.3) (110.3) (110.3) (133.9)
Net financial position 506.6 506.6 506.6 538.0
Consolidated total for the Group 3,261.7 55.1 230.9 (1,943.1) 1,604.6 472.8 1,131.8 1,131.0
(*) The financial position includes cash and cash equivalents of Sorgenia Holding S.p.A.
(1) This item is the sum of “intangible assets”, “tangible assets”, “investment property”, “investments in companies consolidated at equity” and “other equity investments" of the consolidated statement of financial position.
Group equityGroup equityMinority
interests
Total equityNet financial
position
Net working
capital
Other net non-current
assets and liabilities
Fixed assets
31.03.2014
(2) This item is the sum of “other receivables", "securities" and "deferred taxes" under non-current assets and of "other payables", "deferred taxes", "personnel provisions" and "provisions for risks and losses" under non-current liabilities of the consolidated statement of financial position. This
item also includes the "assets held for disposal" and "liabilities held for disposal" in the consolidated balance sheet.
(3) This item is the sum of “inventories”, “contract work in progress”, “trade receivables” and “other receivables" under current assets, and of “trade payables”, “other payables” and “provisions for risks and losses" under current liabilities in the consolidated statement of financial position.
(4) This item is the sum of "financial receivables", "securities", "available-for-sale financial assets" and "cash and cash equivalents" under current assets, "bonds" and "other borrowings” under non-current liabilities, and “bank overdrafts”, “bonds” and “other borrowings” under current liabilities
in the consolidated statement of financial position.

� Report on operations
1. Performance of the Group
Consolidated sales revenues for the first quarter of 2014 came in at € 1,069.7 million versus € 1,241.4
million in the same period of 2013, a decrease of € 171.7 million (-13.8%). This reduction was
primarily due to lower revenues at Sorgenia, despite the growth recorded by Sogefi and KOS.
Consolidated revenues can be broken down by business sector as follows:
1st quarter
(in millions of euro) Change
2014 % 2013 % absolute %
Energy
Sorgenia Group 475.5 44.5 637.4 (*)51.4 (161.9) (25.4)
Media
Espresso Group 157.8 14.7 182.1 14.7 (24.3) (13.3)
Automotive components
Sogefi Group 338.7 31.7 329.2 26.5 9.5 2.9
Healthcare
KOS Group 95.5 8.9 92.1 7.4 3.4 3.7
Other sectors 2.2 0.2 0.6 - 1.6 n.s.
Total consolidated revenues 1,069.7 100.0 1,241.4 100.0 (171.7) (13.8)
(*) Starting in 2013, the Sorgenia Group now shows revenues net of excise duty.
The CIR Group's key income statement figures for the first quarter, with comparatives, are as
follows:
1st quarter
(in millions of euro) 2014 % 2013 %
Revenues 1,069.7 100.0 1,241.4 100.0
Consolidated EBITDA (1) 72.2 6.7 107.2 8.6
Consolidated operating income (EBIT) 36.1 3.4 53.2 4.3
Financial management (2) (34.6) (3.2) (25.8) (2.1)
Income taxes (3.3) (0.3) (19.9) (1.6)
Net income including minority interests (1.8) (0.1) 7.5 0.6
Minority interests (0.8) (0.1) (1.1) (0.1)
Net income of the Group (2.6) (0.2) 6.4 0.5
(1) This is the sum of "earnings before interest and taxes (EBIT)" and "amortisation, depreciation and write-downs" in the consolidated income
statement.
(2) This is the sum of "financial income", "financial expense", "dividends", "gains from trading securities", "losses from trading securities" and
"adjustments to the value of financial assets" in the consolidated income statement.
The consolidated gross operating margin (EBITDA) in first quarter 2014 was € 72.2 million (6.7% of
revenues) versus € 107.2 million (8.6% of revenues) in first quarter 2013, a decrease of € 35 million (-
32.6%). This change was due to the decline in EBITDA of the Sorgenia Group and, to a lesser extent,
that of the Sogefi Group.
The consolidated operating margin (EBIT) for the first quarter of 2014 was € 36.1 million (3.4% of
revenues) versus € 53.2 million (4.3% of revenues) in the same period of 2013 (-32.1%); as for
EBITDA, the change is due to Sorgenia and Sogefi.
4

� Report on operations
Financial management generated a net charge of € 34.6 million compared with one of € 25.8 million
in the first quarter of 2013. In detail:
- net financial expenses were slightly higher than in the corresponding period of 2013 (€ 36.6 million
compared with € 34 million in the first quarter of 2013), because of lower financial income from
cash management;
- net gains on trading of securities amounted to € 3.1 million compared with 2.8 million in the first
three months of last year;
- negative adjustments to financial assets of € 1.1 million have been recorded compared with
positive adjustments of € 5.4 million in the first quarter of 2013.
The condensed consolidated statement of financial position of the CIR Group at 31 March 2014,
with comparative figures at 31 December 2013 and 31 March 2013, is as follows:
(in millions of euro) (1) 31.03.2014 31.12.2013 31.03.2013
Fixed assets 3,261.7 3,269.1 4,259.4
Other net non-current assets and liabilities 55.1 37.8 205.2
Net working capital 230.9 140.7 289.7
Net invested capital 3,547.7 3,447.6 4,754.3
Net financial debt (1,943.1) (1,845.3) (2,412.4)
Total equity 1,604.6 1,602.3 2,341.9
Group equity 1,131.8 1,131.0 1,384.2
Minority interests 472.8 471.3 957.7
(1) These figures are the result of a different aggregation of the items in the financial statements. For a definition, see the notes to the
"Consolidated statement of financial position by business sector" shown earlier.
Consolidated net invested capital at 31 March 2014 stood at € 3,547.7 million versus € 3,447.6
million at 31 December 2013, a rise of € 100.1 million.
The consolidated net financial position at 31 March 2014, as mentioned previously, showed net
debt of € 1,943.1 million (compared with € 1,845.3 million at 31 December 2013) caused by:
- a financial surplus for CIR and other holding companies of € 506.6 million, which compares with €
538 million at 31 December 2013; the decline in the surplus is due to payments relating to the Lodo
Mondadori, already provided for in the financial statements at 31 December 2013;
- total debt of the operating groups of € 2,449.7 million compared with € 2,383.3 million at 31
December 2013. The increase of € 66.4 million was caused by an increase in the debt of the
Sorgenia and Sogefi Groups, which more than offset the reduction in debt recorded by Espresso.
Total equity at 31 March 2014 came to € 1,604.6 million compared with € 1,602.3 million at 31
December 2013, an increase of € 2.3 million.
Group equity at 31 March 2014 amounted to € 1,131.8 million compared with € 1,131 million at 31
December 2013, a net increase of € 0.8 million.
At 31 March 2013 minority interests came to € 472.8 million, compared with € 471.3 million at 31
December 2013, a growth of € 1.5 million.
The consolidated statement of cash flows for the first three months of 2014, prepared according to
a managerial format which shows the changes in net financial position, can be summarised as
follows:
5

� Report on operations
(in millions of euro) 1st quarter
2014
1st quarter
2013
SOURCES OF FUNDS
Net income for the period including minority interests (1.8) 7.6
Amortisation, depreciation, write-downs and other non-monetary
changes 27.0 68.0
Self-financing 25.2 75.6
Change in working capital (96.0) 80.5
CASH FLOW GENERATED (ABSORBED) BY OPERATIONS (70.8) 156.1
Capital increases 1.9 0.4
TOTAL SOURCES OF FUNDS (68.9) 156.5
APPLICATIONS OF FUNDS
Net investment in fixed assets (29.7) (64.6)
Payment of dividends (0.5) (0.1)
Buy-back of own shares - (0.5)
Other changes 1.3 0.7
TOTAL APPLICATIONS OF FUNDS (28.9) (64.5)
FINANCIAL SURPLUS (DEFICIT) (97.8) 92.0
NET FINANCIAL POSITION AT BEGINNING OF PERIOD (1,845.3) (2,504.4)
NET FINANCIAL POSITION AT END OF PERIOD (1,943.1) (2,412.4)
The net cash flow generated by operations, which absorbed € 70.8 million compared with the cash
flow generated in the first quarter of 2013 of € 156.1 million, consists of self-financing of € 25.2
million and a negative change in net working capital of € 96 million, principally in the Sorgenia Group
and the Parent Company CIR, for payments relating to the "Lodo Mondadori", already commented
on above.
For a breakdown of the items making up the net financial position, reference should be made to the
section containing the financial statements.
At 31 March 2013 the Group had 14,233 employees, compared with 14,111 at 31 December 2013.
6

� Report on operations
MAIN GROUP INVESTMENTS AS OF 31 MARCH 2014
(*) The percentage is calculated net of treasury shares.
(**) Percentage of indirect control through Sorgenia Holding
53.1% (**) 56.0% (*) 57.5% (*) 51.3%
ASSETS
Procurement,
generation and sale of
electricity and natural
gas.
All areas of
communication:
newspapers and
magazines, radio,
internet, television and
advertising.
Global supplier of
automotive components
(filtration systems, air
management and engine
cooling systems and
suspension components).
Care homes for the
elderly, rehabilitation
centres and hospital
management.
� Private Equity
� Education
MEDIA AUTOMOTIVE
COMPONENTS ENERGY HEALTHCARE
7

� Report on operations
(in millions of euro) 1st quarter
2014
1st quarter
2013
SOURCES OF FUNDS
Net income for the period including minority interests (1.8) 7.6
Amortisation, depreciation, write-downs and other non-monetary
changes 27.0 68.0
Self-financing 25.2 75.6
Change in working capital (96.0) 80.5
CASH FLOW GENERATED (ABSORBED) BY OPERATIONS (70.8) 156.1
Capital increases 1.9 0.4
TOTAL SOURCES OF FUNDS (68.9) 156.5
APPLICATIONS OF FUNDS
Net investment in fixed assets (29.7) (64.6)
Payment of dividends (0.5) (0.1)
Buy-back of own shares - (0.5)
Other changes 1.3 0.7
TOTAL APPLICATIONS OF FUNDS (28.9) (64.5)
FINANCIAL SURPLUS (DEFICIT) (97.8) 92.0
NET FINANCIAL POSITION AT BEGINNING OF PERIOD (1,845.3) (2,504.4)
NET FINANCIAL POSITION AT END OF PERIOD (1,943.1) (2,412.4)
The net cash flow generated by operations, which absorbed € 70.8 million compared with the cash
flow generated in the first quarter of 2013 of € 156.1 million, consists of self-financing of € 25.2
million and a negative change in net working capital of € 96 million, principally in the Sorgenia Group
and the Parent Company CIR, for payments relating to the "Lodo Mondadori", already commented
on above.
For a breakdown of the items making up the net financial position, reference should be made to the
section containing the financial statements.
At 31 March 2014 the Group had 14,233 employees, compared with 14,111 at 31 December 2013.
8

� Report on operations
� MEDIA
The main performance indicators of the Espresso Group for the current year are shown below, with
comparative figures for the equivalent periods last year:
(in millions of euro) 1st quarter 1st quarter Change
2014 2013 absolute %
Revenues 157.8 182.1 (24.3) (13.3)
Net result 2.1 2.0 0.1 5.0
31/03/2014 31/12/2013 31/03/2013
Net financial position (58.2) (73.5) (83.5)
No. of employees 2,401 2,425 2,514
The publishing industry continues to post negative trends, both in advertising revenues and in the
circulation of newspapers and magazines. In the first two months of 2014, advertising expenditure
fell by 4.3% compared with the same period of 2013 (source: Nielsen Media Research), reflecting a
still critical economic scenario. Television revenues are still fairly stable (0.2%) and radio grew by
7.5%, whereas print is still showing very negative results (-15.7%). Surprisingly, the decline in internet
revenues during the first two months (-6.3%) has been confirmed.
In terms of circulation, the figures published by ADS for the first two months of 2014 indicate a 12%
decline in newspaper sales.
Despite the fact that market trends are still very negative, which is having a significant impact on
revenues, the Espresso Group ended the first quarter with a slightly positive result, in line with that
of the same period last year.
Revenues came in at € 157.8 million, a 13.3% decrease on € 182.1 million in the first quarter of 2013;
the Group's circulation revenues amounted to € 57.9 million, a decrease of 7.1% on the same period
last year (€ 62.4 million), in a market that is continuing to see a significant reduction in the circulation
of daily newspapers (-12%).
Total advertising revenues on Group media fell by 9.7%.
Costs show a reduction of 12.3%, substantially the same as that of revenues; excluding digital
publishing and DTT, where costs are rising to support their development, there has been a 14%
reduction thanks to further rationalisation, especially in the industrial and administrative areas.
Consolidated EBITDA came to € 16.6 million, in line with € 16.7 million in the first quarter of 2013. By
area of activity, profitability has held up reasonably well in print and internet, while radio is showing
a slight recovery.
Consolidated EBIT came to € 8.6 million in line with € 8.8 million in the same period last year.
Consolidated net income amounted to € 2.1 million compared with € 2.0 million in first quarter 2013.
Consolidated net debt at 31 March 2014 amounted to € 58.2 million, a further improvement on €
73.5 million at 31 December 2013, with a financial surplus of € 15.3 million.
9

� Report on operations
The Group had 2,401 employees, including those on fixed-term contracts, a decrease on 2,425 at 31
December 2013. The average for the period was lower by 4.4% compared with the first quarter of
2013.
During the first quarter, the Espresso Group completed two successful operations of strategic
importance: the joint venture with TIMedia in the network operator business and the refinancing of
the parent company, taking into account the fact that its ten-year bond matures in October.
On 9 April 2014 the Espresso Group signed an agreement relating to a possible integration between
the network operator activities of the subsidiary Rete A and Telecom Italia Media Broadcasting
(TIMB), which is controlled by Telecom ltalia Media. This deal, which is only subject to AGCOM
authorisation, will give rise to the main independent network operator in Italy, with five digital
multiplexes with national coverage and high capillarity based on the latest technologies.
On 2 April 2014 a 5-year convertible bond was placed on the market for a nominal value of € 100
million, at an interest rate of 2.625% and a conversion price set at € 2.1523 per share. The bonds will
be convertible into shares, subject to approval of an increase in capital by the Company's
Extraordinary Shareholders' Meeting to be held no later than 31 July 2014.
As regards expectations for the entire year, they are heavily dependent on the performance of the
advertising market, which at present is still uncertain.
� AUTOMOTIVE COMPONENTS
The main performance indicators of the Sogefi Group for the current year are shown below, with
comparative figures for the equivalent periods last year:
31/03/2014 31/12/2013 31/03/2013
Net financial position (322.5) (304.6) (311.9)
No. of employees 6,920 6,834 6,678
In a context characterised by a positive trend in most global automotive markets and a particularly
strong euro against other major currencies, the Sogefi Group posted revenue growth of 2.9% in the
first quarter of 2014 (+9.1% at constant exchange rates). This result was due to growth in markets
outside Europe, particularly in North America and Asia, where Sogefi's revenues grew significantly
despite the impact of exchange rates.
The Engine Systems Business Unit reported revenues that are up by 4.4% to € 210.6 million, while the
Suspension Components Business Unit had revenues of € 128.8 million (+0.7%).
In the first quarter, restructuring in Europe continued, especially in France, to rationalise production
capacity, giving rise to € 11.3 million of extraordinary restructuring charges in the quarter.
Consolidated EBIT was € 20.9 million, compared with € 32.1 million in the first quarter of 2013; net of
restructuring, EBITDA amounted to € 31.8 million versus € 32.5 million in the first quarter of 2013.
Consolidated EBIT amounted to € 5.8 million compared with € 18.2 million in the first quarter of
2013; net of restructuring it came to € 17.1 million versus € 18.6 million in the same period last year.
(in millions of euro) 1st quarter 1st quarter Change
2014 2013 absolute %
Revenues 338.7 329.2 9.5 2.9
Net result (6.3) 7.0 (13.3) n.a.
10

� Report on operations
The consolidated net result was a loss of € 6.3 million (versus a profit of € 7 million in the first quarter
of 2013), affected by extraordinary restructuring costs and higher finance charges following the
process of refinancing the debt that led to more burdensome interest rates at the end of 2013
compared with previously.
Net debt at 31 March 2014 was € 322.5 million compared with € 304.6 million at 31 December 2013
and € 311.9 million at 31 March 2013. This increase is due to the seasonal absorption of cash which is
typical for the automotive industry and outlays of part of the restructuring charges recorded in the
fourth quarter of 2013. In order to reduce financial expenses, in May 2014 Sogefi issued a 7-year
equity-linked bond with a nominal value of € 100 million and a six-monthly coupon at a fixed rate of
2.00% per annum, replacing loans for an equivalent total amount at higher rates. The bonds will be
convertible into shares at a price of € 5.3844 per share, subject to approval of an increase in capital
by the Company's Extraordinary Shareholders' Meeting to be held no later than 30 September 2014.
The Sogefi Group had 6,920 employees at 31 March 2013 compared with 6,834 at 31 December
2013.
The global automotive market expects to see a rising trend in 2014, mainly driven by the Chinese
market and supported by a more moderate increase in the North and South American markets, with
further stabilisation in Europe. The Brazilian and Argentine market, on the other hand, still awaits a
period of weakness.
In this context, Sogefi expects to continue raising the Group's presence outside Europe, based on its
competitive positioning in different geographical areas; increasing the focus on innovation and
improving the product mix; strengthening Group integration and continuing to accelerate the
structural efficiency measures in Europe.
� HEALTHCARE
The main performance indicators of the KOS Group for the current year are shown below, with
comparative figures for the equivalent periods last year:
(in millions of euro) 1st quarter 1st quarter Change
2014 2013 absolute %
Revenues 95.5 92.1 3.4 3.7
Net result 2.5 2.6 (0.1) (3.8)
31/03/2014 31/12/2013 31/03/2013
Net financial position (153.8) (155.7) (170.9)
No. of employees 4,370 4,291 4,154
In the first three months of 2014, the KOS Group generated revenues of € 95.5 million compared
with € 92.1 million in the same period of 2013 (+3.7%), thanks to growth in all three business areas.
Consolidated EBITDA (earnings before interest, taxes, depreciation and amortisation) came to € 13
million, up on the first three months of 2013 (€ 12.6 million), principally because of the change in the
scope of consolidation and business developments that took place in 2013.
11
� Report on operations
Consolidated EBIT came to € 7.8 million versus € 7.3 million in the same period last year, principally
because of the change in the scope of consolidation.
Consolidated net income for first quarter 2014 amounted to € 2.5 million compared with € 2.6
million in the same period of 2013.
At 31 March 2014 the KOS Group had net debt of € 153.8 million, compared with € 155.7 million at
31 December 2013.
The Group had 4,370 employees at 31 March 2014 compared with 4,291 at 31 December 2013.
Subsequent to the year end, on 30 May 2014, KOS acquired the entire capital of Villa Azzurra, a
company which manages an accredited 100-bed neuropsychiatric private hospital in Riolo Terme
(Ravenna). This operation forms part of the strategy launched by KOS in 2004 to develop a range of
services in psychiatric rehabilitation.
As for the outlook, note that growing demands for cuts in public spending, already partly introduced
in certain regions where the Group operates, may reduce the resources allocated to public and
private health spending and influence the economic results of the KOS Group.
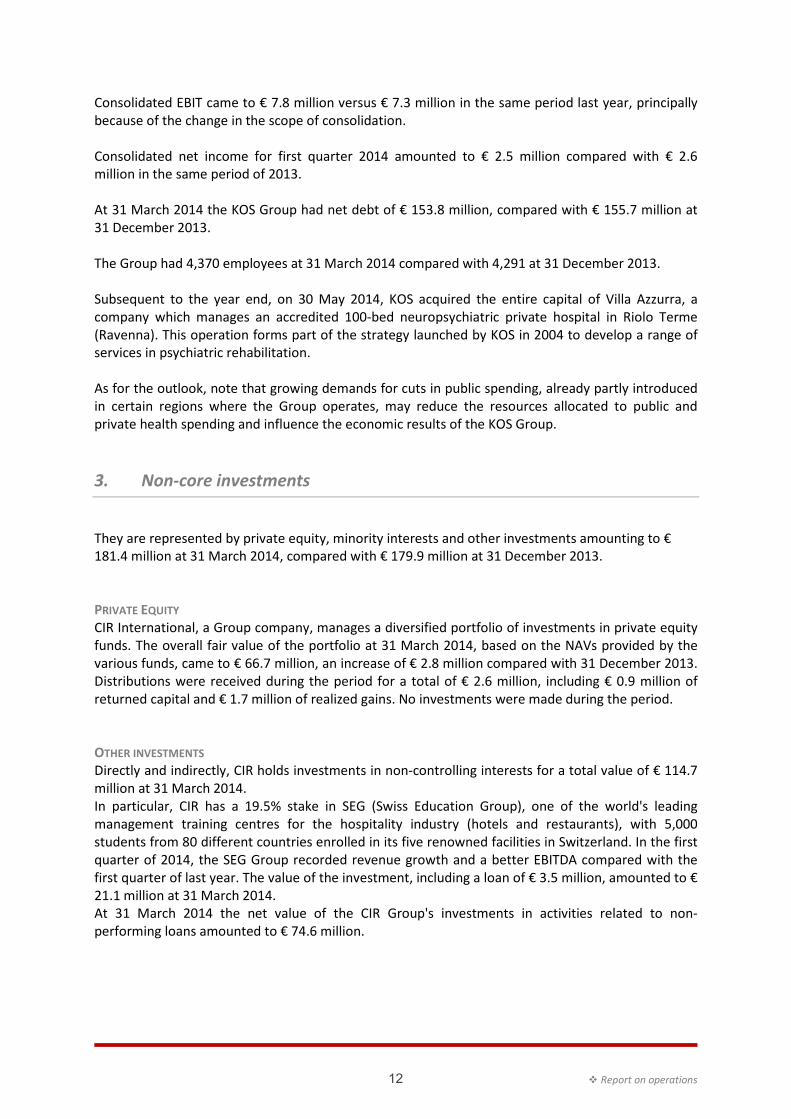
3. Non-core investments
They are represented by private equity, minority interests and other investments amounting to €
181.4 million at 31 March 2014, compared with € 179.9 million at 31 December 2013.
PRIVATE EQUITY
CIR International, a Group company, manages a diversified portfolio of investments in private equity
funds. The overall fair value of the portfolio at 31 March 2014, based on the NAVs provided by the
various funds, came to € 66.7 million, an increase of € 2.8 million compared with 31 December 2013.
Distributions were received during the period for a total of € 2.6 million, including € 0.9 million of
returned capital and € 1.7 million of realized gains. No investments were made during the period.
OTHER INVESTMENTS
Directly and indirectly, CIR holds investments in non-controlling interests for a total value of € 114.7
million at 31 March 2014.
In particular, CIR has a 19.5% stake in SEG (Swiss Education Group), one of the world's leading
management training centres for the hospitality industry (hotels and restaurants), with 5,000
students from 80 different countries enrolled in its five renowned facilities in Switzerland. In the first
quarter of 2014, the SEG Group recorded revenue growth and a better EBITDA compared with the
first quarter of last year. The value of the investment, including a loan of € 3.5 million, amounted to €
21.1 million at 31 March 2014.
At 31 March 2014 the net value of the CIR Group's investments in activities related to non-
performing loans amounted to € 74.6 million.
12

� Report on operations
4. Significant events subsequent to 31 March 2014
As regards significant events that took place after 31 March 2014, information is provided in the part
of the report on the segment performance of the Espresso, Sogefi and KOS groups. As regards the
Sorgenia Group, please refer to the matters discussed in the equivalent section of CIR's financial
statements at 31 December 2013 as approved by the Board of Directors on 6 June 2014.
After 31 March 2014, CIR S.p.A. bought back further own bonds (CIR S.p.A. 2004/2024, issued by the
company on 16/12/2004) with a nominal value of € 78.8 million and proceeded to their disposal. To
date, the nominal value of the outstanding bonds amounts to € 210.2 million. With regard to the
possible early redemption of the bonds as the result of a default event as communicated by CIR to
the Trustee in January, to date the company has not received any communication from the Trustee.
5. Outlook for operations
The performance of CIR Group in 2014 will be influenced by how the macroeconomic scenario
evolves, as well as the outcome of Sorgenia's debt restructuring. As regards the latter, discussions
between the banks and the company and its shareholders are ongoing, bearing witness to the
willingness of the parties to reach an agreement.
6. Other information
OTHER
CIR S.p.A. – Compagnie Industriali Riunite has its registered office in Via Ciovassino 1, Milan, Italy.
CIR shares have been listed on the Milan Stock Exchange since 1973 (Reuters code: CIRX.MI,
Bloomberg code: CIR IM).
This report for the period 1 January-31 March 2014 was approved by the Board of Directors on 30
June 2014.
CIR S.p.A. is subject to management and coordination by Cofide – Gruppo De Benedetti S.p.A.
13

CCOONNSSOOLLIIDDAATTEEDD FFIINNAANNCCIIAALL SSTTAATTEEMMEENNTTSS
CONSOLIDATED STATEMENT OF FINANCIAL POSITION
CONSOLIDATED INCOME STATEMENT
CONSOLIDATED NET FINANCIAL POSITION
14
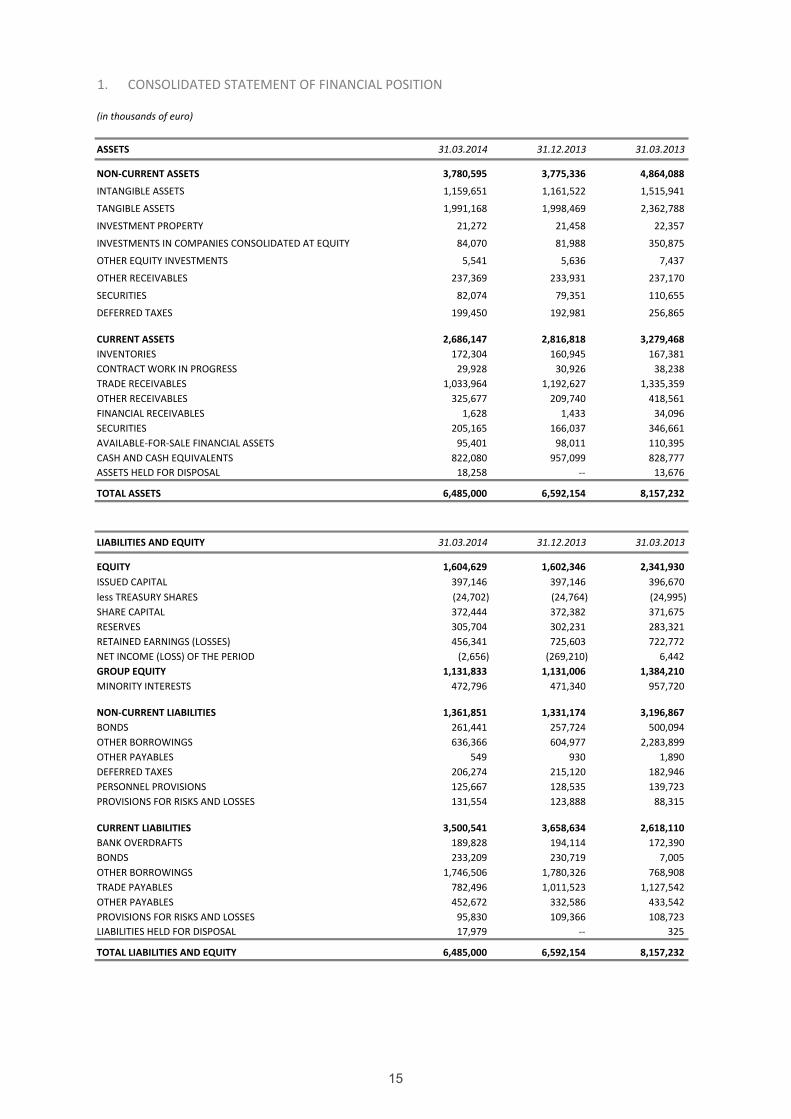
1. CONSOLIDATED STATEMENT OF FINANCIAL POSITION
(in thousands of euro)
ASSETS 31.03.2014 31.12.2013 31.03.2013
NON-CURRENT ASSETS 3,780,595 3,775,336 4,864,088
INTANGIBLE ASSETS 1,159,651 1,161,522 1,515,941
TANGIBLE ASSETS 1,991,168 1,998,469 2,362,788
INVESTMENT PROPERTY 21,272 21,458 22,357
INVESTMENTS IN COMPANIES CONSOLIDATED AT EQUITY 84,070 81,988 350,875
OTHER EQUITY INVESTMENTS 5,541 5,636 7,437
OTHER RECEIVABLES 237,369 233,931 237,170
SECURITIES 82,074 79,351 110,655
DEFERRED TAXES 199,450 192,981 256,865
CURRENT ASSETS 2,686,147 2,816,818 3,279,468
INVENTORIES 172,304 160,945 167,381
CONTRACT WORK IN PROGRESS 29,928 30,926 38,238
TRADE RECEIVABLES 1,033,964 1,192,627 1,335,359
OTHER RECEIVABLES 325,677 209,740 418,561
FINANCIAL RECEIVABLES 1,628 1,433 34,096
SECURITIES 205,165 166,037 346,661
AVAILABLE-FOR-SALE FINANCIAL ASSETS 95,401 98,011 110,395
CASH AND CASH EQUIVALENTS 822,080 957,099 828,777
ASSETS HELD FOR DISPOSAL 18,258 -- 13,676
TOTAL ASSETS 6,485,000 6,592,154 8,157,232
LIABILITIES AND EQUITY 31.03.2014 31.12.2013 31.03.2013
EQUITY 1,604,629 1,602,346 2,341,930
ISSUED CAPITAL 397,146 397,146 396,670
less TREASURY SHARES (24,702) (24,764) (24,995)
SHARE CAPITAL 372,444 372,382 371,675
RESERVES 305,704 302,231 283,321
RETAINED EARNINGS (LOSSES) 456,341 725,603 722,772
NET INCOME (LOSS) OF THE PERIOD (2,656) (269,210) 6,442
GROUP EQUITY 1,131,833 1,131,006 1,384,210
MINORITY INTERESTS 472,796 471,340 957,720
NON-CURRENT LIABILITIES 1,361,851 1,331,174 3,196,867
BONDS 261,441 257,724 500,094
OTHER BORROWINGS 636,366 604,977 2,283,899
OTHER PAYABLES 549 930 1,890
DEFERRED TAXES 206,274 215,120 182,946
PERSONNEL PROVISIONS 125,667 128,535 139,723
PROVISIONS FOR RISKS AND LOSSES 131,554 123,888 88,315
CURRENT LIABILITIES 3,500,541 3,658,634 2,618,110
BANK OVERDRAFTS 189,828 194,114 172,390
BONDS 233,209 230,719 7,005
OTHER BORROWINGS 1,746,506 1,780,326 768,908
TRADE PAYABLES 782,496 1,011,523 1,127,542
OTHER PAYABLES 452,672 332,586 433,542
PROVISIONS FOR RISKS AND LOSSES 95,830 109,366 108,723
LIABILITIES HELD FOR DISPOSAL 17,979 -- 325
TOTAL LIABILITIES AND EQUITY 6,485,000 6,592,154 8,157,232
15

2. CONSOLIDATED INCOME STATEMENT
(in thousands of euro)
01/01-31/03 01/01-31/03
2014 2013
SALES REVENUES 1,069,696 1,241,420
CHANGE IN INVENTORIES 1,943 (1,890)
COSTS FOR THE PURCHASE OF GOODS (625,630) (746,930)
COSTS FOR SERVICES (180,938) (201,827)
PERSONNEL COSTS (178,502) (182,079)
OTHER OPERATING INCOME 24,423 42,938
OTHER OPERATING EXPENSE (41,061) (42,500)
ADJUSTMENTS TO THE VALUE OF INVESTMENTS
CONSOLIDATED AT EQUITY 2,309 (1,921)
AMORTISATION, DEPRECIATION & WRITE-DOWNS (36,142) (54,040)
EARNINGS BEFORE INTEREST
AND TAXES (EBIT) 36,098 53,171
FINANCIAL INCOME 7,351 13,458
FINANCIAL EXPENSE (44,005) (47,421)
DIVIDENDS 26 1
GAINS FROM TRADING SECURITIES 3,135 3,803
LOSSES FROM TRADING SECURITIES (28) (1,019)
ADJUSTMENTS TO THE VALUE OF FINANCIAL ASSETS (1,075) 5,444
INCOME BEFORE TAXES 1,502 27,437
INCOME TAXES (3,338) (19,862)
NET INCOME FOR THE PERIOD INCLUDING MINORITY INTERESTS (1,836) 7,575
- NET INCOME OF MINORITY INTERESTS (820) (1,133)
- NET INCOME OF THE GROUP (2,656) 6,442
16

(in thousands of euro)
31.03.2014 31.12.2013 31.03.2013
A. Cash and bank deposits 822,080 957,099 828,777
B. Other cash equivalents 95,401 98,011 110,395
C. Securities held for trading 205,165 166,037 346,661
D. Cash and cash equivalents (A) + (B) + (C) 1,122,646 1,221,147 1,285,833
E. Current financial receivables 1,628 1,433 34,096
F. Current bank payables (1,862,547) (1,886,721) (311,228)
G. Bonds issued (233,209) (230,719) (7,005)
H. Current portion of non-current debt (73,787) (87,719) (629,929)
I. Other current borrowings -- -- (141)
J. Current financial debt (F) + (G) + (H) + (I) (2,169,543) (2,205,159) (948,303)
K. Current net financial position (J) + (E) + (D) (1,045,269) (982,579) 371,626
L. Non-current bank borrowings (316,022) (291,277) (2,027,532)
M. Bonds issued (261,441) (257,724) (500,094)
N. Other non-current payables (320,344) (313,700) (256,367)
O. Non-current financial debt (L) + (M) + (N) (897,807) (862,701) (2,783,993)
P. Net financial position (K) + (O) (1,943,076) (1,845,280) (2,412,367)
3. CONSOLIDATED NET FINANCIAL POSITION
17

�Consolidated financial statements
NNootteess ttoo tthhee ccoonnssoolliiddaatteedd ffiinnaanncciiaall ssttaatteemmeennttss
1. Introduction
This consolidated interim financial report at 31 March 2014 (unaudited) was prepared in accordance
with IAS/IFRS international accounting standards, which have been mandatory since 2005 for
preparing the consolidated financial statements of companies listed on European regulated markets.
The figures provided for comparison purposes were also determined in accordance with IAS/IFRS.
This interim report was prepared in compliance with the provisions of art. 154/ter paragraph 5 of
D.Lgs. no. 58 of 24 February 1998 and subsequent amendments (TUF). The instructions contained in
the international accounting standard on interim reporting (IAS 34 “Interim Financial Statements”)
have not therefore been adopted.
2. Consolidation principles
Consolidation is on a line-by-line basis. The criteria adopted in applying this method are the same as
those used at 31 December 2013.
The consolidated interim financial statements of the Group as of 31 March 2014, like those as of 31
December 2013, are the result of the consolidation at those dates of the financial statements of CIR,
the parent company, and all of the companies directly or indirectly controlled, joint ventures or
associates. The assets and liabilities of companies due to be sold are reclassified to assets and
liabilities held for disposal in order to disclose them separately.
3. Accounting policies
The accounting principles adopted for the preparation of the interim financial statements as of 31
March 2014 are the same as those adopted for the financial statements for the year ended 31
December 2013.
18
�Consolidated financial statements
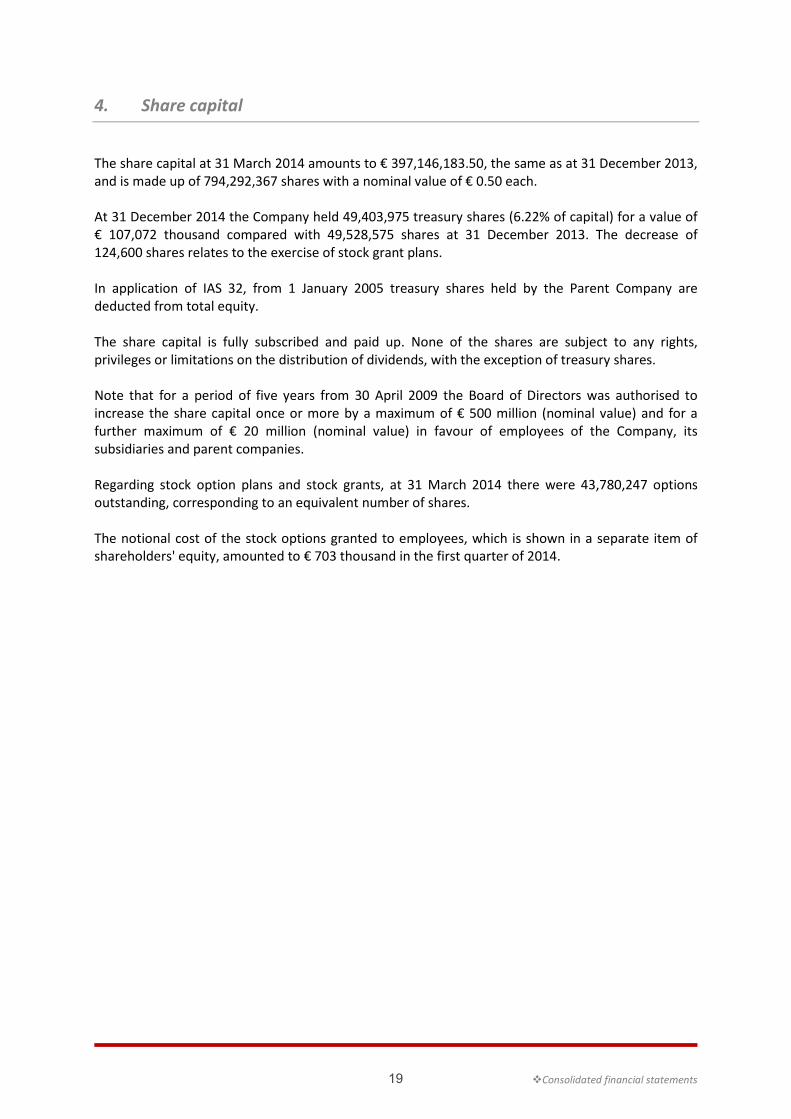
4. Share capital
The share capital at 31 March 2014 amounts to € 397,146,183.50, the same as at 31 December 2013,
and is made up of 794,292,367 shares with a nominal value of € 0.50 each.
At 31 December 2014 the Company held 49,403,975 treasury shares (6.22% of capital) for a value of
€ 107,072 thousand compared with 49,528,575 shares at 31 December 2013. The decrease of
124,600 shares relates to the exercise of stock grant plans.
In application of IAS 32, from 1 January 2005 treasury shares held by the Parent Company are
deducted from total equity.
The share capital is fully subscribed and paid up. None of the shares are subject to any rights,
privileges or limitations on the distribution of dividends, with the exception of treasury shares.
Note that for a period of five years from 30 April 2009 the Board of Directors was authorised to
increase the share capital once or more by a maximum of € 500 million (nominal value) and for a
further maximum of € 20 million (nominal value) in favour of employees of the Company, its
subsidiaries and parent companies.
Regarding stock option plans and stock grants, at 31 March 2014 there were 43,780,247 options
outstanding, corresponding to an equivalent number of shares.
The notional cost of the stock options granted to employees, which is shown in a separate item of
shareholders' equity, amounted to € 703 thousand in the first quarter of 2014.
19

20

CIR S.p.A.Compagnie Industriali RiuniteVia Ciovassino, 1 20121 MilanoPh. +39 02 72 27 [email protected]