cio report: q1 2015 - nz funds · a number of strategies, ... to use a cricket analogy; ... €1.45...
TRANSCRIPT

1
CIO Report: Q1 2015April 2015

3
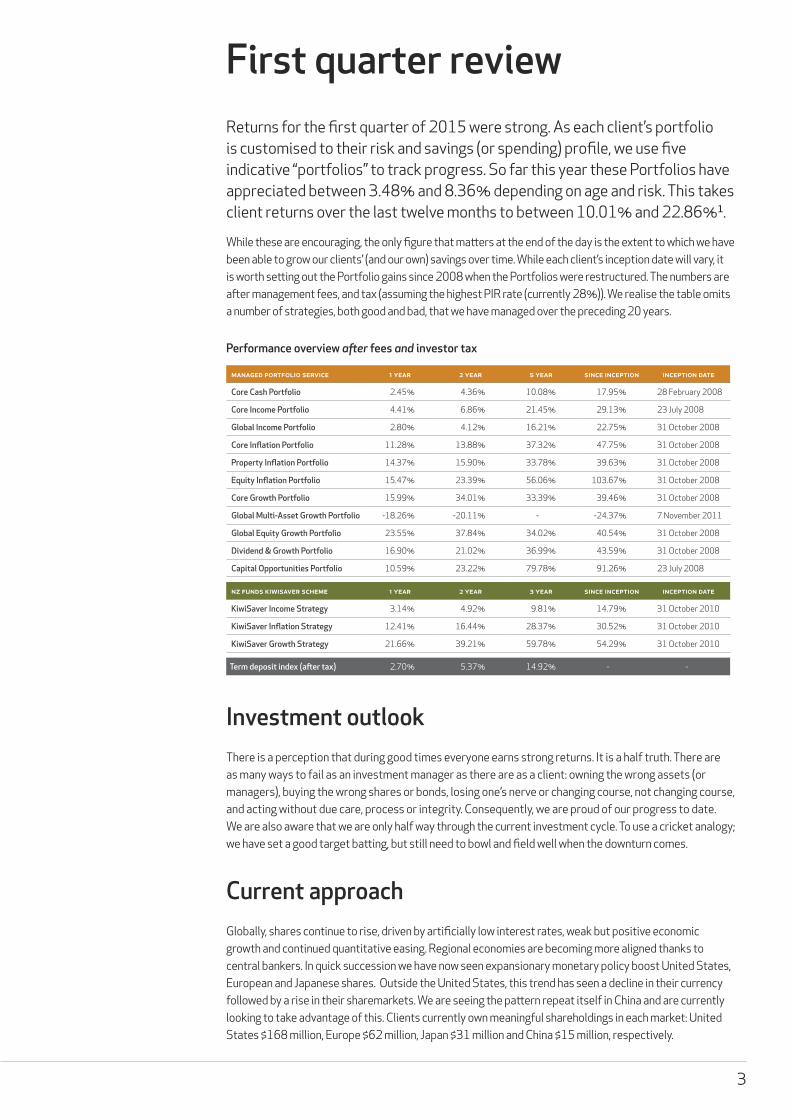
First quarter reviewReturns for the first quarter of 2015 were strong. As each client’s portfolio is customised to their risk and savings (or spending) profile, we use five indicative “portfolios” to track progress. So far this year these Portfolios have appreciated between 3.48% and 8.36% depending on age and risk. This takes client returns over the last twelve months to between 10.01% and 22.86%1.
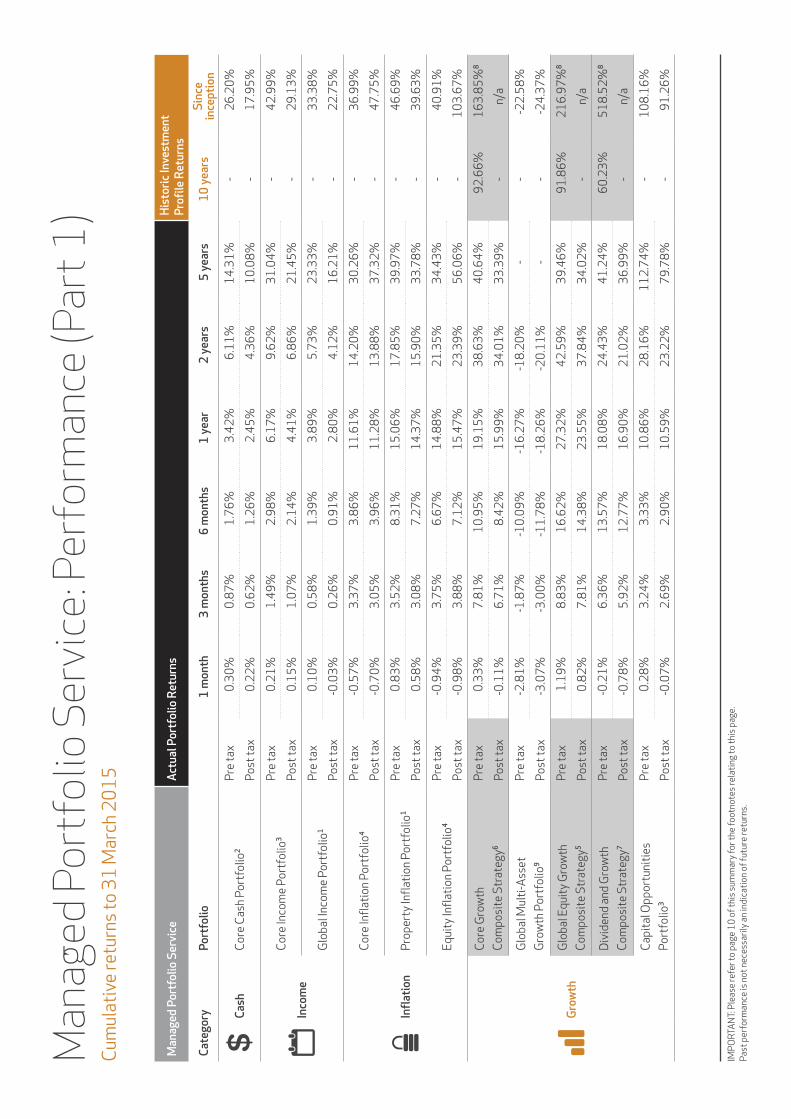
While these are encouraging, the only figure that matters at the end of the day is the extent to which we have been able to grow our clients’ (and our own) savings over time. While each client’s inception date will vary, it is worth setting out the Portfolio gains since 2008 when the Portfolios were restructured. The numbers are after management fees, and tax (assuming the highest PIR rate (currently 28%)). We realise the table omits a number of strategies, both good and bad, that we have managed over the preceding 20 years.
Performance overview after fees and investor taxPerformance overview after fees and investor tax
managed portfolio service 1 year 2 year 5 year since inception inception date
Core Cash Portfolio 2.45% 4.36% 10.08% 17.95% 28 February 2008
Core Income Portfolio 4.41% 6.86% 21.45% 29.13% 23 July 2008
Global Income Portfolio 2.80% 4.12% 16.21% 22.75% 31 October 2008
Core Inflation Portfolio 11.28% 13.88% 37.32% 47.75% 31 October 2008
Property Inflation Portfolio 14.37% 15.90% 33.78% 39.63% 31 October 2008
Equity Inflation Portfolio 15.47% 23.39% 56.06% 103.67% 31 October 2008
Core Growth Portfolio 15.99% 34.01% 33.39% 39.46% 31 October 2008
Global Multi-Asset Growth Portfolio -18.26% -20.11% - -24.37% 7 November 2011
Global Equity Growth Portfolio 23.55% 37.84% 34.02% 40.54% 31 October 2008
Dividend & Growth Portfolio 16.90% 21.02% 36.99% 43.59% 31 October 2008
Capital Opportunities Portfolio 10.59% 23.22% 79.78% 91.26% 23 July 2008
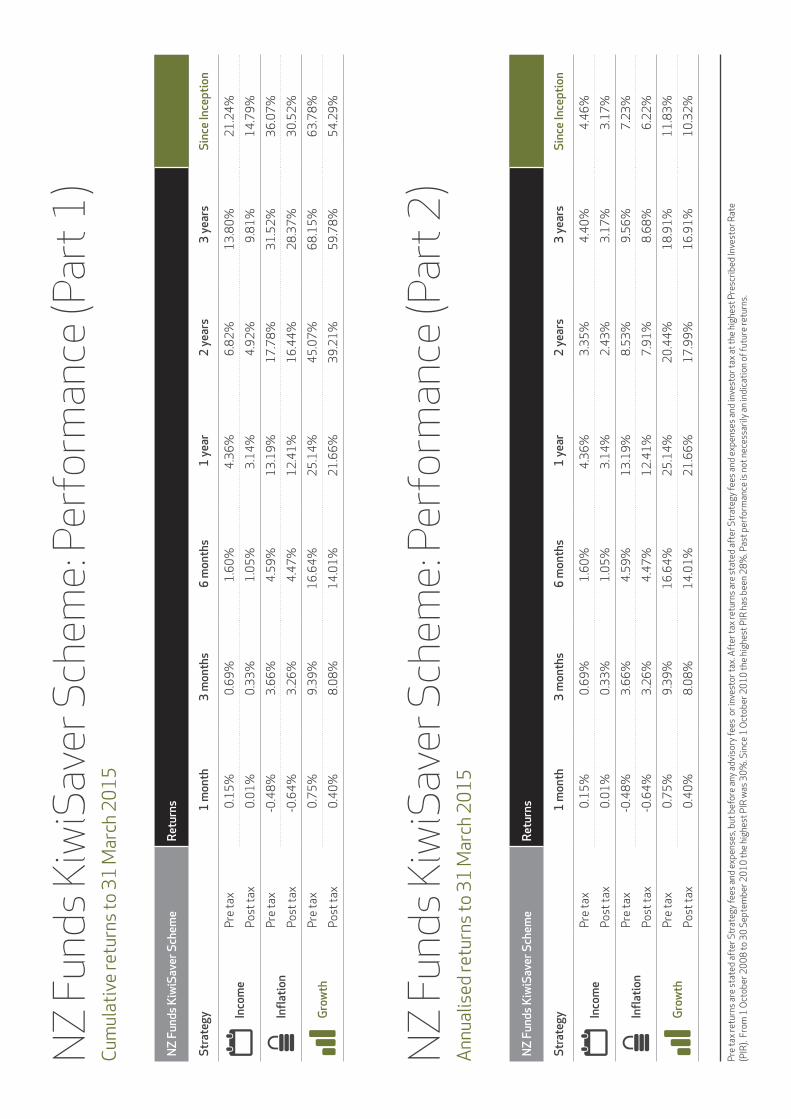
nz funds kiwisaver scheme 1 year 2 year 3 year since inception inception date
KiwiSaver Income Strategy 3.14% 4.92% 9.81% 14.79% 31 October 2010
KiwiSaver Inflation Strategy 12.41% 16.44% 28.37% 30.52% 31 October 2010
KiwiSaver Growth Strategy 21.66% 39.21% 59.78% 54.29% 31 October 2010
Term deposit index (after tax) 2.70% 5.37% 14.92% - -
Investment outlookThere is a perception that during good times everyone earns strong returns. It is a half truth. There are as many ways to fail as an investment manager as there are as a client: owning the wrong assets (or managers), buying the wrong shares or bonds, losing one’s nerve or changing course, not changing course, and acting without due care, process or integrity. Consequently, we are proud of our progress to date. We are also aware that we are only half way through the current investment cycle. To use a cricket analogy; we have set a good target batting, but still need to bowl and field well when the downturn comes.
Current approachGlobally, shares continue to rise, driven by artificially low interest rates, weak but positive economic growth and continued quantitative easing. Regional economies are becoming more aligned thanks to central bankers. In quick succession we have now seen expansionary monetary policy boost United States, European and Japanese shares. Outside the United States, this trend has seen a decline in their currency followed by a rise in their sharemarkets. We are seeing the pattern repeat itself in China and are currently looking to take advantage of this. Clients currently own meaningful shareholdings in each market: United States $168 million, Europe $62 million, Japan $31 million and China $15 million, respectively.

4
European equity market
2,500
2,700
2,900
3,100
3,300
3,500
3,700
3,900
VALU
E OF
USD
EURO
STO
XX 5
0 IN
DEX
European equity market
EUR/USD (RHS)
Jan ‘14 Mar ‘14 Apr ‘14 May ‘14 Jun ‘14 Jul ‘14 Aug ‘14 Sep ‘14 Oct ‘14 Nov ‘14 Dec ‘14 Jan ‘15 Feb ‘15Feb ‘14 Mar ‘15
€1.45
€1.40
€1.35
€1.30
€1.25
€1.20
€1.15
€1.10
€1.05
€1.00
Source: Bloomberg.
8,000
10,000
12,000
14,000
16,000
18,000
20,000
22,000 ¥75
¥80
¥85
¥90
¥95
¥100
¥105
¥110
¥115
¥120
¥125
NIKK
EI 2
25 E
QUIT
Y IN
DEX
VALU
E OF
USD
Japanese equity market
Yen/USD (RHS)
Nov ‘12 Jan ‘13 Mar ‘13 May ‘13 Jul ‘13 Sep ‘13 Nov ‘13 Jan ‘14 Mar ‘14 May ‘14 Jul ‘14 Sep ‘14 Nov ‘14 Jan ‘15 Mar ‘15Source: Bloomberg.
2,000
2,500
3,000
3,500
4,000
4,500 ¥5.90
¥5.95
¥6.00
¥6.05
¥6.10
¥6.15
¥6.20
¥6.25
¥6.30
CSI 3
00 E
QUIT
Y IN
DEX
VALU
E OF
USD
Chinese equity market
Yuan/USD (RHS)
Feb ‘14Jan ‘14 Mar ‘14 Apr ‘14May ‘14 Jun ‘14 Jul ‘14 Aug ‘14 Sep ‘14 Oct ‘14 Nov ‘14 Dec ‘14 Jan ‘15 Feb ‘15 Mar ‘15Source: Bloomberg.
Japanese equity market
Chinese equity market

5
Ultimately, this is an unsustainable state of affairs. Either central banks will have to begin raising interest rates, or inflation will be rekindled. Over the past year we have reviewed each scenario to see how we can fortify clients’ savings against these possibilities.
First, as shares have risen we have increased our investment in defensive managers such as New York based Tweedy, Browne, Chicago based LSV, London based TT Funds, and added a local boutique, Devon Funds. We believe these managers will hold up well during a downturn.
Second, we continue to increase clients’ investment in downside orientated hedge funds, such as Florida based Universa and London based ISAM. During the Global Financial Crisis, Universa’s portfolio rose over 100% in value, while ISAM delivered a 77% return.
Third, we have also increased clients’ exposure to hedge funds where the managers have the ability to be both long and/or short individual companies. Long-short manager returns are predominately determined by their ability to identify good quality companies rather than by the direction of the market. We include London based Odey and New York based Suvretta in this category.
And while the threat of inflation would appear less imminent, our portfolio construction methodology ensures all clients own an actively managed exposure to inflation-orientated assets such as property, inflation linked-bonds and commodities. Commodities in particular have underperformed for a number of years and in many cases now trade well below long-term sustainable prices. As has been the case with shares, the time is approaching where our job will be to capture the upside from commodities, rather than mitigate the downside. We look forward to the challenge.
In what currencies should clients hold their wealth?Globally we are seeing a marked increase in the speed at which global currency prices change, including our own New Zealand dollar. It is as important to address the risk New Zealanders take by holding all their wealth in New Zealand dollars, as it is to consider the risks associated with New Zealanders holding a portion of their wealth in foreign currencies without the specialist tools needed to manage volatility.
By way of example, on 10 March the New Zealand Stock Exchange announced a trading halt on listed dairy producing companies. The New Zealand dollar fell over half a cent against the United States dollar within minutes. In this case the announcement was about the possible 1080 contamination of baby milk powder and was subsequently considered a low possibility by the markets so the currency quickly recovered. But if, for example, it had been an announcement about an outbreak of foot and mouth, the currency may well have lost a third of its value or more. It therefore makes sense to ensure clients hold a portion of their wealth in the currency of a larger, more diversified economy.
Clients’ foreign currency exposure
0% 10% 20% 30% 40% 50% 60% 70% 80% 90% 100%
0% 10% 20% 30% 40% 50% 60% 70% 80% 90% 100%Foreign Currency exposure
New Zealand dollar exposure
Core Cash Portfolio
Core Income Portfolio
Global Income Portfolio
Core Inflation Portfolio
Property Inflation Portfolio
Equity Inflation Portfolio
Core Growth Portfolio
Global Multi Asset Growth Portfolio
Global Equity Growth Portfolio
Dividend and Growth Portfolio
Capital Opportunities Portfolio
KiwiSaver Income
KiwiSaver Inflation
KiwiSaver Growth
Clients’ foreign currency exposure
Source: NZ Funds.

6
On the other hand, we are surprised by the number of New Zealanders we meet who have diversified their investments internationally but who have little or no ability to protect themselves from a change in value of the currency. For example, over the last three years the New Zealand dollar has increased in value by 25% against the Australian dollar. This has reduced the value of Australian investments owned by New Zealanders by a corresponding amount.
Investing through PIE tax efficient portfolios, as we advocate, enables clients to be diversified internationally and to have their foreign currency exposure professionally managed.
NZ Funds’ investment team includes Dave Wilson, former Reserve Bank of New Zealand economist with 30 years experience, Mark Brooks, an interest rate and currency specialist with more than 20 years industry experience and Grant Cotty, who before joining NZ Funds worked on the currency desk of a major Australasian bank. Had an outbreak of foot and mouth occurred we stood by ready to move a significant portion of our clients’ growth-orientated assets into United States dollars.
United States dollar
1969 1973 1977 1981 1985 1989 1993 1997 2001 2005 2009 2013
60
80
100
120
140
160
180
DXY CURRENCY
INDEX
United States dollar
Source: Bloomberg.
Devon Funds ManagementAs clients know, we seek to ensure their assets are managed by a range of global investment specialists that complement our experienced in-house investment team. During the quarter we confirmed the inclusion of New Zealand based Devon Funds Management (Devon) as a manager.
Managers either provide a superior way to access an asset class, for example they might offer higher returns (after fees and tax) than an index approach, or they may manage risk more actively than an index-orientated approach. Clearly, if an asset class no longer makes sense for clients, we are likely to redeem from a manager chosen for this reason as well.
Alternatively, we may also choose to invest with a manager, irrespective of our view of the asset class they invest in, where we believe the manager is so good that they can add value to clients’ portfolios, irrespective of an asset class’s underlying rate of return.
Devon falls into the latter category. Their approach to Australasian shares complements NZ Funds’ dividend harvesting long-term buy and hold approach. Their inclusion enables clients to be invested in both styles. We have known a number of their team for over 20 years. They are exceptional guardians of client capital.
7
Global manager selectionDuring the quarter we also reviewed the performance of the managers we have chosen to invest with since 2009. Of the 33 different managers we worked with, 19 (58%) both grew clients’ capital and out-performed their benchmark. Two managers lost money (reflecting the asset class they invested in), but were able to mitigate the loss that would have occurred had we invested in a passive index. The remaining 12 (37%) underperformed their benchmark but in four of these cases this was due to the manager taking a more conservative (less risky) approach, a quality we looked for when investing with them. We redeemed from six managers due to their poor performance and the remaining two that have underperformed are currently on our watch list.
This analysis shows we have experienced a 75% success ratio when selecting managers. The results speak volumes about the proprietary approach the team has to manager selection which deliberately eschews the approach taken by investment consultants.
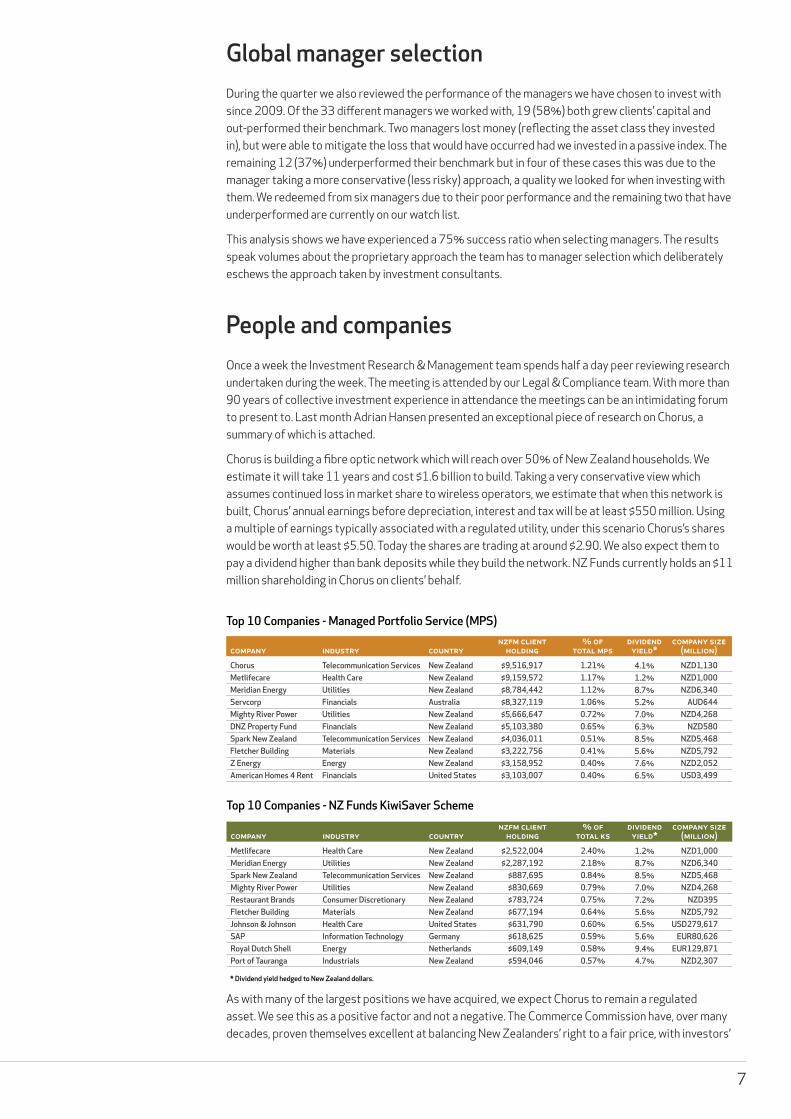
People and companiesOnce a week the Investment Research & Management team spends half a day peer reviewing research undertaken during the week. The meeting is attended by our Legal & Compliance team. With more than 90 years of collective investment experience in attendance the meetings can be an intimidating forum to present to. Last month Adrian Hansen presented an exceptional piece of research on Chorus, a summary of which is attached.
Chorus is building a fibre optic network which will reach over 50% of New Zealand households. We estimate it will take 11 years and cost $1.6 billion to build. Taking a very conservative view which assumes continued loss in market share to wireless operators, we estimate that when this network is built, Chorus’ annual earnings before depreciation, interest and tax will be at least $550 million. Using a multiple of earnings typically associated with a regulated utility, under this scenario Chorus’s shares would be worth at least $5.50. Today the shares are trading at around $2.90. We also expect them to pay a dividend higher than bank deposits while they build the network. NZ Funds currently holds an $11 million shareholding in Chorus on clients’ behalf.
Top 10 Companies - Managed Portfolio Service (MPS)
Top 10 Companies - NZ Funds KiwiSaver Scheme
company industry countrynzfm client
holding% of
total mpsdividend
yield*company size
(million)Chorus Telecommunication Services New Zealand $9,516,917 1.21% 4.1% NZD1,130 Metlifecare Health Care New Zealand $9,159,572 1.17% 1.2% NZD1,000 Meridian Energy Utilities New Zealand $8,784,442 1.12% 8.7% NZD6,340 Servcorp Financials Australia $8,327,119 1.06% 5.2% AUD644 Mighty River Power Utilities New Zealand $5,666,647 0.72% 7.0% NZD4,268 DNZ Property Fund Financials New Zealand $5,103,380 0.65% 6.3% NZD580 Spark New Zealand Telecommunication Services New Zealand $4,036,011 0.51% 8.5% NZD5,468 Fletcher Building Materials New Zealand $3,222,756 0.41% 5.6% NZD5,792 Z Energy Energy New Zealand $3,158,952 0.40% 7.6% NZD2,052 American Homes 4 Rent Financials United States $3,103,007 0.40% 6.5% USD3,499
Top 10 Companies - Managed Portfolio Service (MPS)
company industry countrynzfm client
holding% of
total ksdividend
yield*company size
(million)Metlifecare Health Care New Zealand $2,522,004 2.40% 1.2% NZD1,000 Meridian Energy Utilities New Zealand $2,287,192 2.18% 8.7% NZD6,340 Spark New Zealand Telecommunication Services New Zealand $887,695 0.84% 8.5% NZD5,468 Mighty River Power Utilities New Zealand $830,669 0.79% 7.0% NZD4,268 Restaurant Brands Consumer Discretionary New Zealand $783,724 0.75% 7.2% NZD395 Fletcher Building Materials New Zealand $677,194 0.64% 5.6% NZD5,792 Johnson & Johnson Health Care United States $631,790 0.60% 6.5% USD279,617 SAP Information Technology Germany $618,625 0.59% 5.6% EUR80,626 Royal Dutch Shell Energy Netherlands $609,149 0.58% 9.4% EUR129,871 Port of Tauranga Industrials New Zealand $594,046 0.57% 4.7% NZD2,307
Top 10 Companies - NZ Funds KiwiSaver Scheme
* Dividend yield hedged to New Zealand dollars.
company industry countrynzfm client
holding% of
total mpsdividend
yield*company size
(million)Chorus Telecommunication Services New Zealand $9,516,917 1.21% 4.1% NZD1,130 Metlifecare Health Care New Zealand $9,159,572 1.17% 1.2% NZD1,000 Meridian Energy Utilities New Zealand $8,784,442 1.12% 8.7% NZD6,340 Servcorp Financials Australia $8,327,119 1.06% 5.2% AUD644 Mighty River Power Utilities New Zealand $5,666,647 0.72% 7.0% NZD4,268 DNZ Property Fund Financials New Zealand $5,103,380 0.65% 6.3% NZD580 Spark New Zealand Telecommunication Services New Zealand $4,036,011 0.51% 8.5% NZD5,468 Fletcher Building Materials New Zealand $3,222,756 0.41% 5.6% NZD5,792 Z Energy Energy New Zealand $3,158,952 0.40% 7.6% NZD2,052 American Homes 4 Rent Financials United States $3,103,007 0.40% 6.5% USD3,499
Top 10 Companies - Managed Portfolio Service (MPS)
company industry countrynzfm client
holding% of
total ksdividend
yield*company size
(million)Metlifecare Health Care New Zealand $2,522,004 2.40% 1.2% NZD1,000 Meridian Energy Utilities New Zealand $2,287,192 2.18% 8.7% NZD6,340 Spark New Zealand Telecommunication Services New Zealand $887,695 0.84% 8.5% NZD5,468 Mighty River Power Utilities New Zealand $830,669 0.79% 7.0% NZD4,268 Restaurant Brands Consumer Discretionary New Zealand $783,724 0.75% 7.2% NZD395 Fletcher Building Materials New Zealand $677,194 0.64% 5.6% NZD5,792 Johnson & Johnson Health Care United States $631,790 0.60% 6.5% USD279,617 SAP Information Technology Germany $618,625 0.59% 5.6% EUR80,626 Royal Dutch Shell Energy Netherlands $609,149 0.58% 9.4% EUR129,871 Port of Tauranga Industrials New Zealand $594,046 0.57% 4.7% NZD2,307
Top 10 Companies - NZ Funds KiwiSaver Scheme
* Dividend yield hedged to New Zealand dollars.
As with many of the largest positions we have acquired, we expect Chorus to remain a regulated asset. We see this as a positive factor and not a negative. The Commerce Commission have, over many decades, proven themselves excellent at balancing New Zealanders’ right to a fair price, with investors’

8
need for a competitive return. In time we expect Chorus to join the long list of regulated, high quality, New Zealand assets which have returned multiples of the original investment for clients2.
Our ability to systematically identify investment opportunities of such calibre depends on the quality and stability of the people at our firm. Adrian has a background in electrical engineering and holds a Bachelor of Engineering Degree from Auckland University with first class honours. He joined NZ Funds’ Research & Management team five years ago, after spending six years as a senior member of the IT team. The barriers to joining the investment team are significant, and the internal and external competition intense. Applicants are required to study in their own time to become a Chartered Financial Analyst (CFA) charterholder. The CFA programme requires candidates to sit three six hour exams. The ten year average pass rate per exam is only 42%.
After completing his studies, Adrian has proven himself to be an exceptional addition to the team. Many Authorised Financial Advisers who partner with NZ Funds will be familiar with the rigorous risk management and compliance software system which he developed. We believe it to be superior, for Australasian securities, to some of the top global trading systems available including UBS Delta Software, Bloomberg’s Asset and Investment Manager and MSCI Barra One’s Risk Management System.
I believe client outcomes will ultimately be determined by the culture, skill and integrity of the organisation they partner with. We are grateful that individuals of Adrian’s calibre have chosen to share their career with NZ Funds and our clients.
Thank you for investing with us, and for your continued confidence.
Michael Lang Chief Investment Officer.
2 Companies which NZ Funds has purchased on clients’ behalf which have more than doubled include Auckland International Airport, Trustpower, Port of Tauranga, SkyCity Casino, Sky TV, Natural Gas (now Vector) and most recently MetlifeCare, ServCorp and Meridian Energy.
1 Pre tax returns are stated after Portfolio fees and expenses, but before any advisory fees or investor tax. Post tax returns are stated after Portfolio fees and expenses and investor tax at the highest Personal Income Rate (PIR). From 1 October 2008 to 30 September 2010 the highest PIR was 30%. Since 1 October 2010 the highest PIR has been 28%. Past performance is not necessaily an indication of future returns.
Investment Statement(s): For further information or to request a copy of the NZ Funds Managed Portfolio Service Investment Statement or the NZ Funds KiwiSaver Scheme Investment Statement, please contact NZ Funds or see our website www.nzfunds.co.nz

Appendices
Man
aged
Por
tfol
io S
ervi
ce: P
erfo
rman
ce (P
art 1
)
Man
aged
Por
tfol
io S
ervi
ceAc
tual
Por
tfol
io R
etur
nsHi
stor
ic In
vest
men
t Pr
ofile
Ret
urns
Cate
gory
Port
folio
1 m
onth
3 m
onth
s6
mon
ths
1 ye
ar2
year
s5
year
s10
yea
rsSi
nce
in
cept
ion
Cash
Core
Cas
h Po
rtfo
lio2
Pre
tax
0.30
%0.
87%
1.76
%3.
42%
6.11
%14
.31%
-26
.20%
Post
tax
0.22
%0.
62%
1.26
%2.
45%
4.36
%10
.08%
-17
.95%
Inco
me
Core
Inco
me
Port
folio
3Pr
e ta
x0.
21%
1.49
%2.
98%
6.17
%9.
62%
31.0
4%-
42.9
9%
Post
tax
0.15
%1.
07%
2.14
%4.
41%
6.86
%21
.45%
-29
.13%
Glo
bal I
ncom
e Po
rtfo
lio1
Pre
tax
0.10
%0.
58%
1.39
%3.
89%
5.73
%23
.33%
-33
.38%
Post
tax
-0.0
3%0.
26%
0.91
%2.
80%
4.12
%16
.21%
-22
.75%
Infla
tion
Core
Infla
tion
Port
folio
4Pr
e ta
x-0
.57%
3.37
%3.
86%
11.6
1%14
.20%
30.2
6%-
36.9
9%
Post
tax
-0.7
0%3.
05%
3.96
%11
.28%
13.8
8%37
.32%
-47
.75%
Prop
erty
Infla
tion
Port
folio
1Pr
e ta
x0.
83%
3.52
%8.
31%
15.0
6%17
.85%
39.9
7%-
46.6
9%
Post
tax
0.58
%3.
08%
7.27
%14
.37%
15.9
0%33
.78%
-39
.63%
Equi
ty In
flatio
n Po
rtfo
lio4
Pre
tax
-0.9
4%3.
75%
6.67
%14
.88%
21.3
5%34
.43%
-40
.91%
Post
tax
-0.9
8%3.
88%
7.12
%15
.47%
23.3
9%56
.06%
-10
3.67
%
Grow
th
Core
Gro
wth
Com
posi
te S
trat
egy6
Pre
tax
0.33
%7.
81%
10.9
5%19
.15%
38.6
3%40
.64%
92.6
6%16
3.85
%8
Post
tax
-0.1
1%6.
71%
8.42
%15
.99%
34.0
1%33
.39%
-n/
a
Glo
bal M
ulti-
Asse
tG
row
th P
ortf
olio
9
Pre
tax
-2.8
1%-1
.87%
-10.
09%
-16.
27%
-18.
20%
--
-22.
58%
Post
tax
-3.0
7%-3
.00%
-11.
78%
-18.
26%
-20.
11%
--
-24.
37%
Glo
bal E
quity
Gro
wth
Com
posi
te S
trat
egy5
Pre
tax
1.19
%8.
83%
16.6
2%27
.32%
42.5
9%39
.46%
91.8
6%21
6.97
%8
Post
tax
0.82
%7.
81%
14.3
8%23
.55%
37.8
4%34
.02%
-n/
a
Div
iden
d an
d G
row
thCo
mpo
site
Str
ateg
y7
Pre
tax
-0.2
1%6.
36%
13.5
7%18
.08%
24.4
3%41
.24%
60.2
3%51
8.52
%8
Post
tax
-0.7
8%5.
92%
12.7
7%16
.90%
21.0
2%36
.99%
-n/
a
Capi
tal O
ppor
tuni
ties
Port
folio
3
Pre
tax
0.28
%3.
24%
3.33
%10
.86%
28.1
6%11
2.74
%-
108.
16%
Post
tax
-0.0
7%2.
69%
2.90
%10
.59%
23.2
2%79
.78%
-91
.26%
IMPO
RTAN
T: P
leas
e re
fer t
o pa
ge 1
0 of
this
sum
mar
y fo
r the
foot
note
s rel
atin
g to
this
pag
e.
Past
per
form
ance
is n
ot n
eces
saril
y an
indi
catio
n of
futu
re re
turn
s.
Cum
ulat
ive
retu
rns t
o 31
Mar
ch 2
015

Man
aged
Por
tfol
io S
ervi
ce: P
erfo
rman
ce (P
art 2
)
Man
aged
Por
tfol
io S
ervi
ceAc
tual
Por
tfol
io R
etur
nsHi
stor
ic In
vest
men
t Pr
ofile
Ret
urns
Cate
gory
Port
folio
1 m
onth
3 m
onth
s6
mon
ths
1 ye
ar2
year
s5
year
s10
yea
rsSi
nce
in
cept
ion
Cash
Core
Cas
h Po
rtfo
lio2
Pre
tax
0.30
%0.
87%
1.76
%3.
42%
3.01
%2.
71%
-3.
34%
Post
tax
0.22
%0.
62%
1.26
%2.
45%
2.16
%1.
94%
-2.
36%
Inco
me
Core
Inco
me
Port
folio
3Pr
e ta
x0.
21%
1.49
%2.
98%
6.17
%4.
70%
5.56
%-
5.49
%
Post
tax
0.15
%1.
07%
2.14
%4.
41%
3.37
%3.
96%
-3.
90%
Glo
bal I
ncom
e Po
rtfo
lio1
Pre
tax
0.10
%0.
58%
1.39
%3.
89%
2.83
%4.
28%
-4.
59%
Post
tax
-0.0
3%0.
26%
0.91
%2.
80%
2.04
%3.
05%
-3.
25%
Infla
tion
Core
Infla
tion
Port
folio
4Pr
e ta
x-0
.57%
3.37
%3.
86%
11.6
1%6.
86%
5.43
%-
5.03
%
Post
tax
-0.7
0%3.
05%
3.96
%11
.28%
6.71
%6.
55%
-6.
27%
Prop
erty
Infla
tion
Port
folio
1Pr
e ta
x0.
83%
3.52
%8.
31%
15.0
6%8.
56%
6.96
%-
6.15
%
Post
tax
0.58
%3.
08%
7.27
%14
.37%
7.66
%5.
99%
-5.
34%
Equi
ty In
flatio
n Po
rtfo
lio4
Pre
tax
-0.9
4%3.
75%
6.67
%14
.88%
10.1
6%6.
10%
-5.
49%
Post
tax
-0.9
8%3.
88%
7.12
%15
.47%
11.0
8%9.
31%
-11
.72%
Grow
th
Core
Gro
wth
Com
posi
te S
trat
egy6
Pre
tax
0.33
%7.
81%
10.9
5%19
.15%
17.7
4%7.
06%
6.78
%8.
48%
8
Post
tax
-0.1
1%6.
71%
8.42
%15
.99%
15.7
6%5.
93%
-n/
a
Glo
bal M
ulti-
Asse
tG
row
th P
ortf
olio
9
Pre
tax
-2.8
1%-1
.87%
-10.
09%
-16.
27%
-9.5
6%-
--7
.26%
Post
tax
-3.0
7%-3
.00%
-11.
78%
-18.
26%
-10.
62%
--
-7.8
9%
Glo
bal E
quity
Gro
wth
Com
posi
te S
trat
egy5
Pre
tax
1.19
%8.
83%
16.6
2%27
.32%
19.4
1%6.
88%
6.73
%6.
23%
8
Post
tax
0.82
%7.
81%
14.3
8%23
.55%
17.4
1%6.
03%
-n/
a
Div
iden
d an
d G
row
thCo
mpo
site
Str
ateg
y7
Pre
tax
-0.2
1%6.
36%
13.5
7%18
.08%
11.5
5%7.
15%
4.83
%8.
50%
8
Post
tax
-0.7
8%5.
92%
12.7
7%16
.90%
10.0
1%6.
50%
-n/
a
Capi
tal O
ppor
tuni
ties
Port
folio
3
Pre
tax
0.28
%3.
24%
3.33
%10
.86%
13.2
1%16
.30%
-11
.58%
Post
tax
-0.0
7%2.
69%
2.90
%10
.59%
11.0
0%12
.45%
-10
.18%
IMPO
RTAN
T: P
leas
e re
fer t
o pa
ge 1
0 fo
r the
foot
note
s rel
atin
g to
this
pag
e.
Past
per
form
ance
is n
ot n
eces
saril
y an
indi
catio
n of
futu
re re
turn
s.
Annu
alis
ed re
turn
s to
31 M
arch
201
5

Man
aged
Por
tfol
io S
ervi
ce: N
otes
Retu
rns
Pre
tax
retu
rns a
re st
ated
aft
er P
ortf
olio
fees
and
exp
ense
s, b
ut b
efor
e an
y ad
viso
ry
fees
or i
nves
tor t
ax. P
ost t
ax re
turn
s are
stat
ed a
fter
Por
tfol
io fe
es a
nd e
xpen
ses a
nd
inve
stor
tax
at th
e hi
ghes
t Pre
scrib
ed In
vest
or R
ate
(PIR
). Fro
m 1
Oct
ober
200
8 to
30
Sept
embe
r 201
0 th
e hi
ghes
t PIR
was
30%
. Sin
ce 1
Oct
ober
201
0 th
e hi
ghes
t PIR
has
be
en 2
8%. P
ast p
erfo
rman
ce is
not
nec
essa
rily a
n in
dica
tion
of fu
ture
retu
rns.
Com
posi
te S
trat
egie
s Th
e Co
mpo
site
Str
ateg
ies h
ave
been
dev
elop
ed to
illu
stra
te th
e lo
ng-t
erm
per
form
ance
of
the
inve
stm
ent c
ateg
orie
s rep
rese
nted
by
the
rele
vant
Por
tfol
ios.
The
Com
posi
te S
trat
egie
s are
not
the
hist
oric
retu
rns o
f the
Por
tfol
ios.
They
illu
stra
te th
e hi
stor
ical
per
form
ance
of t
he N
Z Fu
nds a
ppro
ach
of m
anag
ing
asse
ts
of th
e ty
pe h
eld
with
in th
e re
spec
tive
NZ
Fund
s Man
aged
Por
tfol
io S
ervi
ce P
ortf
olio
to
whi
ch e
ach
Com
posi
te S
trat
egy
rela
tes.
The
Com
posi
te S
trat
egie
s are
tax-
adju
sted
to re
mov
e, a
s muc
h as
pos
sibl
e, th
e im
pact
of
the
diff
eren
t tax
regi
mes
that
app
lied
durin
g th
e ca
lcul
atio
n pe
riod.
The
pre
tax
retu
rns a
re
also
stat
ed a
fter
Por
tfol
io fe
es a
nd e
xpen
ses,
but b
efor
e an
y adv
isor
y fee
s or i
nves
tor t
ax.
The
post
tax
retu
rns a
re st
ated
aft
er P
ortf
olio
fees
and
exp
ense
s and
inve
stor
tax
at th
e hi
ghes
t Pre
scrib
ed In
vest
or R
ate
(PIR
).
For m
ore
deta
il on
the
calc
ulat
ion
of e
ach
of th
e Co
mpo
site
Str
ateg
ies p
leas
e co
ntac
t NZ
Fund
s.
The
perf
orm
ance
of t
he C
ompo
site
Str
ateg
ies i
s not
an
indi
catio
n of
futu
re P
ortf
olio
re
turn
s.
Foot
note
s for
pag
es 8
& 9
1
In
cept
ion
date
was
31
Oct
ober
200
8.
2
Ince
ptio
n da
te w
as 2
8 Fe
brua
ry 2
008.
3
Ince
ptio
n da
te w
as 2
3 Ju
ly 2
008.
4
Perf
orm
ance
is m
easu
red
sinc
e th
e la
unch
of t
he A
PS p
latf
orm
(now
kno
wn
as
NZ
Fund
s Man
aged
Por
tfol
io S
ervi
ce) o
n 31
Oct
ober
200
8. T
he p
ost t
ax si
nce
ince
ptio
n re
turn
s for
the
Core
Infla
tion
Port
folio
and
the
Equi
ty In
flatio
n Po
rtfo
lio
incl
ude
the
bene
fit o
f for
mat
ion
tax
loss
es u
nder
the
PIE
rule
s. F
or m
ore
deta
il, p
leas
e co
ntac
t NZ
Fund
s.
5
Com
posi
te st
rate
gy in
cept
ion
was
6 M
arch
199
6.
6
Com
posi
te st
rate
gy in
cept
ion
was
1 M
ay 2
003.
7
Com
posi
te st
rate
gy in
cept
ion
was
2 D
ecem
ber 1
992.
8
Pre
tax
equi
vale
nt g
ross
retu
rn (f
or m
ore
deta
il, re
fer t
o th
e pe
rfor
man
ce
page
for e
ach
Port
folio
/Com
posi
te S
trat
egy)
.
9 In
cept
ion
date
was
7 N
ovem
ber 2
011.
NZ
Fund
s Kiw
iSav
er S
chem
e: P
erfo
rman
ce (P
art 1
)
NZ
Fund
s Ki
wiS
aver
Sch
eme
Retu
rns
Stra
tegy
1 m
onth
3 m
onth
s6
mon
ths
1 ye
ar2
year
s3
year
sSi
nce
Ince
ptio
n
Inco
me
Pre
tax
0.15
%0.
69%
1.60
%4.
36%
6.82
%13
.80%
21.2
4%
Post
tax
0.01
%0.
33%
1.05
%3.
14%
4.92
%9.
81%
14.7
9%
Infla
tion
Pre
tax
-0.4
8%3.
66%
4.59
%13
.19%
17.7
8%31
.52%
36.0
7%
Post
tax
-0.6
4%3.
26%
4.47
%12
.41%
16.4
4%28
.37%
30.5
2%
Grow
thPr
e ta
x0.
75%
9.39
%16
.64%
25.1
4%45
.07%
68.1
5%63
.78%
Post
tax
0.40
%8.
08%
14.0
1%21
.66%
39.2
1%59
.78%
54.2
9%
Cum
ulat
ive
retu
rns t
o 31
Mar
ch 2
015
Pre
tax
retu
rns a
re st
ated
aft
er S
trat
egy
fees
and
exp
ense
s, b
ut b
efor
e an
y ad
viso
ry fe
es o
r inv
esto
r tax
. Aft
er ta
x re
turn
s are
stat
ed a
fter
Str
ateg
y fe
es a
nd e
xpen
ses a
nd in
vest
or ta
x at
the
high
est P
resc
ribed
Inve
stor
Rat
e (P
IR).
Fro
m 1
Oct
ober
200
8 to
30
Sept
embe
r 201
0 th
e hi
ghes
t PIR
was
30%
. Sin
ce 1
Oct
ober
201
0 th
e hi
ghes
t PIR
has
bee
n 28
%. P
ast p
erfo
rman
ce is
not
nec
essa
rily
an in
dica
tion
of fu
ture
retu
rns.
NZ
Fund
s Kiw
iSav
er S
chem
e: P
erfo
rman
ce (P
art 2
)
NZ
Fund
s Ki
wiS
aver
Sch
eme
Retu
rns
Stra
tegy
1 m
onth
3 m
onth
s6
mon
ths
1 ye
ar2
year
s3
year
sSi
nce
Ince
ptio
n
Inco
me
Pre
tax
0.15
%0.
69%
1.60
%4.
36%
3.35
%4.
40%
4.46
%
Post
tax
0.01
%0.
33%
1.05
%3.
14%
2.43
%3.
17%
3.17
%
Infla
tion
Pre
tax
-0.4
8%3.
66%
4.59
%13
.19%
8.53
%9.
56%
7.23
%
Post
tax
-0.6
4%3.
26%
4.47
%12
.41%
7.91
%8.
68%
6.22
%
Grow
thPr
e ta
x0.
75%
9.39
%16
.64%
25.1
4%20
.44%
18.9
1%11
.83%
Post
tax
0.40
%8.
08%
14.0
1%21
.66%
17.9
9%16
.91%
10.3
2%
Annu
alis
ed re
turn
s to
31 M
arch
201
5
Pre
tax
retu
rns a
re st
ated
aft
er S
trat
egy
fees
and
exp
ense
s, b
ut b
efor
e an
y ad
viso
ry fe
es o
r inv
esto
r tax
. Aft
er ta
x re
turn
s are
stat
ed a
fter
Str
ateg
y fe
es a
nd e
xpen
ses a
nd in
vest
or ta
x at
the
high
est P
resc
ribed
Inve
stor
Rat
e (P
IR).
Fro
m 1
Oct
ober
200
8 to
30
Sept
embe
r 201
0 th
e hi
ghes
t PIR
was
30%
. Sin
ce 1
Oct
ober
201
0 th
e hi
ghes
t PIR
has
bee
n 28
%. P
ast p
erfo
rman
ce is
not
nec
essa
rily
an in
dica
tion
of fu
ture
retu
rns.
14
Executive summaryThis paper investigates potential rivals that could eat into the market share of Chorus’ new fibre lines. It tries to determine if within the next 10 years Chorus will have a virtual monopoly or operate in a crowded market.
New cellular technology is the most likely threat to fibre. New generation 4G will be capable of supplying most households with good quality internet even with increases in usage, including internet TV becoming widespread. While this is far from a certainty it is technologically possible. However, to be a viable threat it will need to be of sufficient quality and cheaper. If there is a far greater demand for the internet such as a move to 4k or 8k TV, then it is unlikely that wireless will be able to keep up due to physical constraints of the usable wireless spectrum. Up to a point smarter and cheaper new technology cell towers could be added to many residential streets, but as volumes increase the amount of trenching required, or the need to tap into the Chorus’ network, would make this impractical and Chorus a better solution.
Another issue examined is whether Chorus’ fibre network will need to be replaced in the foreseeable future. It appears this is unlikely to be the case.
What alternative technologies are available?
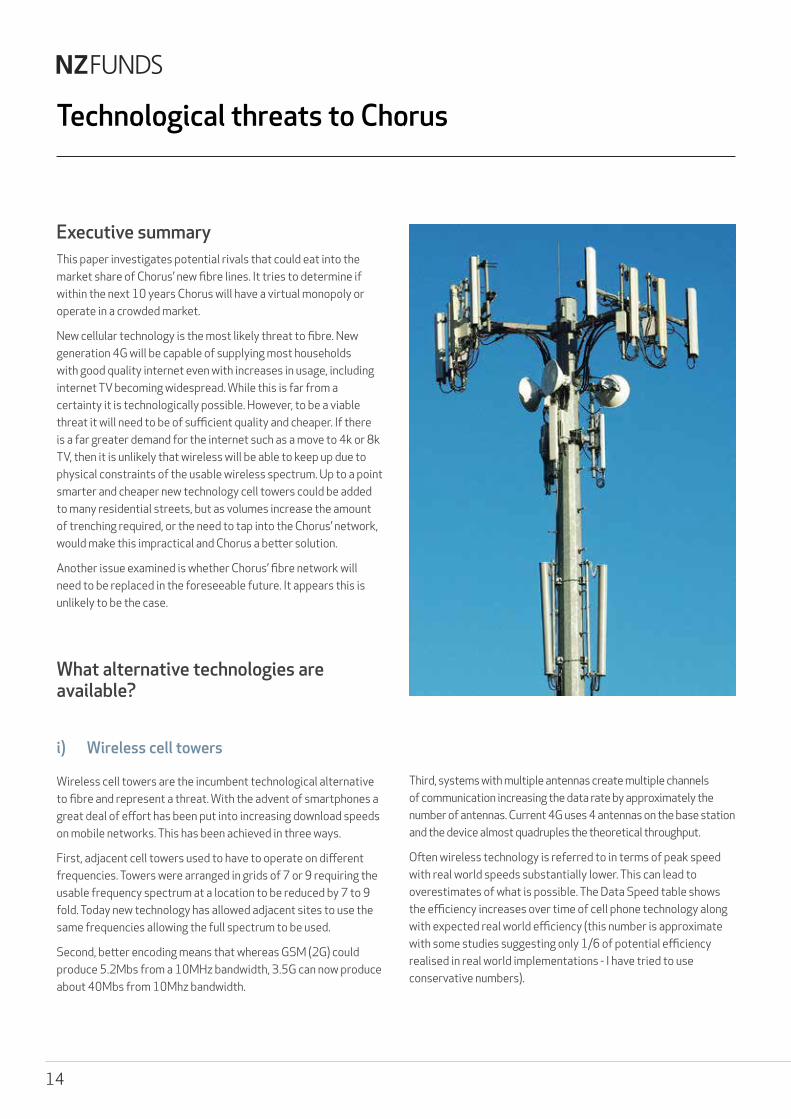
i) Wireless cell towers
Wireless cell towers are the incumbent technological alternative to fibre and represent a threat. With the advent of smartphones a great deal of effort has been put into increasing download speeds on mobile networks. This has been achieved in three ways.
First, adjacent cell towers used to have to operate on different frequencies. Towers were arranged in grids of 7 or 9 requiring the usable frequency spectrum at a location to be reduced by 7 to 9 fold. Today new technology has allowed adjacent sites to use the same frequencies allowing the full spectrum to be used.
Second, better encoding means that whereas GSM (2G) could produce 5.2Mbs from a 10MHz bandwidth, 3.5G can now produce about 40Mbs from 10Mhz bandwidth.
Technological threats to Chorus
Third, systems with multiple antennas create multiple channels of communication increasing the data rate by approximately the number of antennas. Current 4G uses 4 antennas on the base station and the device almost quadruples the theoretical throughput.
Often wireless technology is referred to in terms of peak speed with real world speeds substantially lower. This can lead to overestimates of what is possible. The Data Speed table shows the efficiency increases over time of cell phone technology along with expected real world efficiency (this number is approximate with some studies suggesting only 1/6 of potential efficiency realised in real world implementations - I have tried to use conservative numbers).
15
Executive summaryThis paper investigates potential rivals that could eat into the market share of Chorus’ new fibre lines. It tries to determine if within the next 10 years Chorus will have a virtual monopoly or operate in a crowded market.
New cellular technology is the most likely threat to fibre. New generation 4G will be capable of supplying most households with good quality internet even with increases in usage, including internet TV becoming widespread. While this is far from a certainty it is technologically possible. However, to be a viable threat it will need to be of sufficient quality and cheaper. If there is a far greater demand for the internet such as a move to 4k or 8k TV, then it is unlikely that wireless will be able to keep up due to physical constraints of the usable wireless spectrum. Up to a point smarter and cheaper new technology cell towers could be added to many residential streets, but as volumes increase the amount of trenching required, or the need to tap into the Chorus’ network, would make this impractical and Chorus a better solution.
Another issue examined is whether Chorus’ fibre network will need to be replaced in the foreseeable future. It appears this is unlikely to be the case.
What alternative technologies are available?
i) Wireless cell towers
Wireless cell towers are the incumbent technological alternative to fibre and represent a threat. With the advent of smartphones a great deal of effort has been put into increasing download speeds on mobile networks. This has been achieved in three ways.
First, adjacent cell towers used to have to operate on different frequencies. Towers were arranged in grids of 7 or 9 requiring the usable frequency spectrum at a location to be reduced by 7 to 9 fold. Today new technology has allowed adjacent sites to use the same frequencies allowing the full spectrum to be used.
Second, better encoding means that whereas GSM (2G) could produce 5.2Mbs from a 10MHz bandwidth, 3.5G can now produce about 40Mbs from 10Mhz bandwidth.
Technological threats to Chorus
Third, systems with multiple antennas create multiple channels of communication increasing the data rate by approximately the number of antennas. Current 4G uses 4 antennas on the base station and the device almost quadruples the theoretical throughput.
Often wireless technology is referred to in terms of peak speed with real world speeds substantially lower. This can lead to overestimates of what is possible. The Data Speed table shows the efficiency increases over time of cell phone technology along with expected real world efficiency (this number is approximate with some studies suggesting only 1/6 of potential efficiency realised in real world implementations - I have tried to use conservative numbers).
Data speeds of various technologies
Technology Launched Efficiency(bit/s)/hz
Approximate realised efficiency
2G GSM 1991 00.057
2.75G 2000 00.450
WiMax 2004 01.200
3.5G 2007 04.220
4G LTE 2009 16.320
4G LTE Advanced 2013 30.000 10
The question is whether this exponential growth in efficiency can be maintained. Shannon’s law states the maximum capacity a communications channel can provide given a certain bandwidth and signal to noise ratio.
C = B log2 ( )1 + SN
The maximum data throughput a cell site can produce has now exceeded Shannon’s law, something few would have thought possible earlier. The way this has happened is by clever technology allowing multiple antennas on a site to use the same frequencies, thereby opening new channels. The law was not broken but the assumptions on how many channels a cell tower can operate on now needs to be revised.
Given this I am not aware of a law that gives a theoretical maximum on what is possible from a single cell site. However, according to CNN “You can try to be more efficient, but we’re really nearing the end of that,” says Ken Rehbehn, an analyst with Yankee Group. “It’s reaching the point of diminishing returns as we push up against the boundaries of physics.”
As a consequence existing technology – mobile networks – pose a threat to fibre. The upcoming “true” 4G technology (LTE-Advanced) uses technological innovations, along with structural improvements to the network including using vastly improved small cells. These are small boxes deployable on existing infrastructure such as power poles. These are therefore cheap and do not require resource consent; however, they still require connection to a fixed network. To deploy these down residential streets would require expensive trenching (new fibre in the ground) or connection to Chorus’ network.
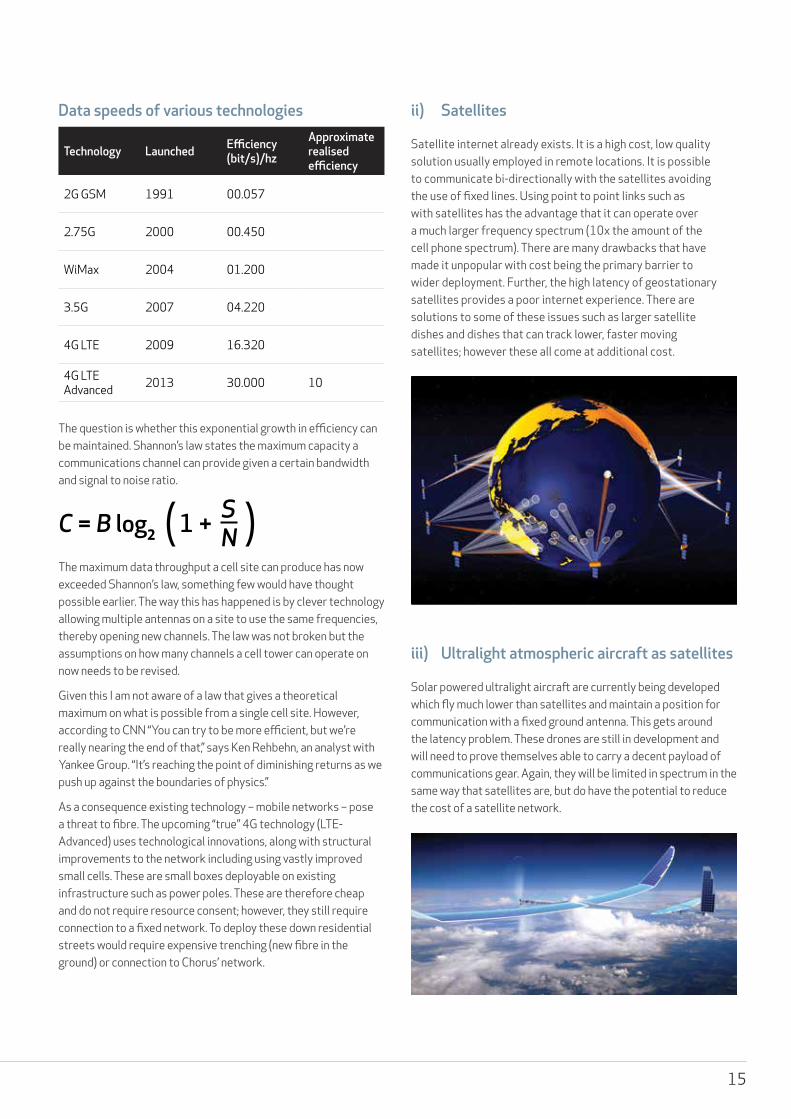
ii) Satellites
Satellite internet already exists. It is a high cost, low quality solution usually employed in remote locations. It is possible to communicate bi-directionally with the satellites avoiding the use of fixed lines. Using point to point links such as with satellites has the advantage that it can operate over a much larger frequency spectrum (10x the amount of the cell phone spectrum). There are many drawbacks that have made it unpopular with cost being the primary barrier to wider deployment. Further, the high latency of geostationary satellites provides a poor internet experience. There are solutions to some of these issues such as larger satellite dishes and dishes that can track lower, faster moving satellites; however these all come at additional cost.
iii) Ultralight atmospheric aircraft as satellites
Solar powered ultralight aircraft are currently being developed which fly much lower than satellites and maintain a position for communication with a fixed ground antenna. This gets around the latency problem. These drones are still in development and will need to prove themselves able to carry a decent payload of communications gear. Again, they will be limited in spectrum in the same way that satellites are, but do have the potential to reduce the cost of a satellite network.

16
Will Chorus’ fibre need upgrading?
The other threat to fibre is that it might need to be upgraded to meet future demands. Current speeds for fibre are low compared to what it is capable of. With Chorus’ current network it is the equipment at each end of the fibre that is the limiting factor, not the fibre itself. The bandwidth of visible light is immense and researchers have already sent 100,000,000 Mbs through fibre optic cables.
The question becomes whether Chorus has sufficiently future-proofed its system by using enough cables and the right quality cables. From reading on the web it appears that individual cables are connected between roadside cabinets and houses and that it is high quality single mode fibres that have been deployed. To substantially upgrade the laid capacity more fibres may need to be threaded between the cabinets and exchanges. These types of upgrades have occurred in the past and are far less drastic than relaying connections to individual houses. It appears that the fibre is therefore well future-proofed.
Forecasting fibre usage
It is hard to predict what the requirements of broadband will be in the future. Most people assume it will be very high. But there have also been precedents for data requirements becoming smaller, such as people choosing the convenience of MP3 rather than the higher quality of CD or its supposed replacement the SACD which few of us ever ended up using. Typically though, with technology, when more capacity is available, it tends to get used.
Currently the big users are streaming television broadcasts (Netflix and Hulu) and internet video (YouTube). To get an idea of current requirements, Netflix suggests 5Mbs for 720p, while full HD (1080p) would require about 10Mbs. 4k Netflix requires 25Mbs. Interestingly, increases in TV size requires exponential increases in data requirements. For example, NHK in Japan is experimenting with Ultra High Definition TV (4320p / 8k) which would require a bitstream of 48,000Mbs that is compressed down to 500Mbs for transmission. If we moved to this standard we would probably require a 1.5Gbs connection for a house if two users wanted to watch different channels, and still have spare capacity for the internet. There could also be a lot of future development in this area, and new currently unthought of technologies that will move into this high bandwidth space.
Forecasting bandwidth requirements
In this section I investigate potential bandwidth requirement and make assumptions about whether the most likely rival technology - cellular networks - can provide it. I make the assumption there are no new speed increases in wireless technology but make generous assumptions about tower use and the availability frequency to use on them. How the future looks will in part depend on how a lounge looks in the future, whether it be users with personal devices such as iPads or centered around home networks and ultra high definition televisions.
If all the future requires is that users want to watch Netflix at 5Mbs, and we assume we have two TVs running per house plus a download going, we will require around 15Mbs. If we used 1000MHz (around one third of UHF) then 670 homes could potentially be serviced per cell site. This is similar to the roughly 600 houses served per cell site in the central North Shore region of Kaipatiki.
However, going to 8k UHDTV we would require 1000Mbs for two TV sets. Under such an assumption ten homes could be serviced. This seems an expensive and inappropriate way to deliver TV or other large bandwidth services.
Moving up a notch into Super High frequency, there is a potential total of 27,000MHz of spectrum, which is suitable for line of sight only, such as satellite communications. This spectrum is currently fully utilised but displacing everyone would allow up to 270 homes to be serviced. This assumes the same efficiency gains could be applied to satellite communications and that satellites could be suitably directional.
Moving up the frequency spectrum again, to the Extra High Frequency, there is another tenfold increase in capacity, but in moving towards the visible light spectrum we begin to experience some of its disadvantages such as being affected by precipitation. This would seriously reduce the reliability of the system.
Possible future scenarios
Scenario 1 The world moves to very high speed internet with the starting point in Gbs. If very high speed internet was ubiquitous, it is likely that fibre will be the transmission mechanism; wireless is unlikely to be competitive in this space. While it could compete on a limited basis the physical constraints imposed would mean few customers could be serviced without massively expanding the network by trenching or tapping into the Chorus network, making Chorus the likely winner.
Scenario 2 Usage of the internet doesn’t extend much beyond current usage and some further uptake of Netflix-like services. In this case wireless is a severe threat which would require careful management by providers to maintain quality, but the possibility of utilising more frequency and further gains in efficiency could see large numbers watching internet TV from their home wirelessly. There still would need to be a catalyst for change as often lower cost solutions aren’t taken up due to inertia. Chorus is likely to remain relevant and competitive.
Scenario 3 The internet becomes balkanised. There is a split between high data consumers on fibre and cost-conscious consumers opting for wireless. This scenario depends on the future of the lounge, with some users browsing iPads and watching standard definition TV and others having ultra high definition TV coming in via the internet. In this scenario Chorus also plays a role, but its addressable market is a fraction of scenario 1.
Appendices
Electromagnetic Radiation
Electromagnetic Radiation(EM) encompasses light, radio waves and x-rays. EM is measured is in Hertz(Hz) which equates to cycles/second. The amount of bandwidth available or the range of Hz is a good measure of the amount of information that can be transmitted. Radio waves are at the low end of the EM spectrum, and are used to transmit signals wirelessly. Lower frequencies can be transmitted greater distances and have the ability to bend around obstacles. Higher frequencies such as microwave have
more available bandwidth and are useful for point to point links such as satellite communications. Ultra High Frequency band that encompasses 300MHz to 3000MHz is suitable for cell phone communications due to its ability to bend. Much further up the frequency spectrum is visible light with a bandwidth of 320,000,000Mhz. Radio has physical limitations imposed by the available spectrum, light is constrained by the hardware used to transmit and receive.
Fibre Optics
A fibre optic is a very thin glass fibre that relies on internal reflection to transmit light over very long distances with minimal loss. The technology is not new: fibre optics were patented for data communication in 1966 by which time lasers were already commercial. Due to the high frequency and bandwidth of light and the low noise characteristics of the fibre, vast amounts of information can be transmitted. The standard plans for fibre in New Zealand is 100Mb/s to a residential address and 1Gb/s to a business. There are 14 fibres connecting New Zealand to the rest of the world through the Southern Cross Link, the current system potential is thought to be >12TBs which per fibre is over 8,000 times faster than 100Mbs currently in use by most households.

17
Will Chorus’ fibre need upgrading?
The other threat to fibre is that it might need to be upgraded to meet future demands. Current speeds for fibre are low compared to what it is capable of. With Chorus’ current network it is the equipment at each end of the fibre that is the limiting factor, not the fibre itself. The bandwidth of visible light is immense and researchers have already sent 100,000,000 Mbs through fibre optic cables.
The question becomes whether Chorus has sufficiently future-proofed its system by using enough cables and the right quality cables. From reading on the web it appears that individual cables are connected between roadside cabinets and houses and that it is high quality single mode fibres that have been deployed. To substantially upgrade the laid capacity more fibres may need to be threaded between the cabinets and exchanges. These types of upgrades have occurred in the past and are far less drastic than relaying connections to individual houses. It appears that the fibre is therefore well future-proofed.
Forecasting fibre usage
It is hard to predict what the requirements of broadband will be in the future. Most people assume it will be very high. But there have also been precedents for data requirements becoming smaller, such as people choosing the convenience of MP3 rather than the higher quality of CD or its supposed replacement the SACD which few of us ever ended up using. Typically though, with technology, when more capacity is available, it tends to get used.
Currently the big users are streaming television broadcasts (Netflix and Hulu) and internet video (YouTube). To get an idea of current requirements, Netflix suggests 5Mbs for 720p, while full HD (1080p) would require about 10Mbs. 4k Netflix requires 25Mbs. Interestingly, increases in TV size requires exponential increases in data requirements. For example, NHK in Japan is experimenting with Ultra High Definition TV (4320p / 8k) which would require a bitstream of 48,000Mbs that is compressed down to 500Mbs for transmission. If we moved to this standard we would probably require a 1.5Gbs connection for a house if two users wanted to watch different channels, and still have spare capacity for the internet. There could also be a lot of future development in this area, and new currently unthought of technologies that will move into this high bandwidth space.
Forecasting bandwidth requirements
In this section I investigate potential bandwidth requirement and make assumptions about whether the most likely rival technology - cellular networks - can provide it. I make the assumption there are no new speed increases in wireless technology but make generous assumptions about tower use and the availability frequency to use on them. How the future looks will in part depend on how a lounge looks in the future, whether it be users with personal devices such as iPads or centered around home networks and ultra high definition televisions.
If all the future requires is that users want to watch Netflix at 5Mbs, and we assume we have two TVs running per house plus a download going, we will require around 15Mbs. If we used 1000MHz (around one third of UHF) then 670 homes could potentially be serviced per cell site. This is similar to the roughly 600 houses served per cell site in the central North Shore region of Kaipatiki.
However, going to 8k UHDTV we would require 1000Mbs for two TV sets. Under such an assumption ten homes could be serviced. This seems an expensive and inappropriate way to deliver TV or other large bandwidth services.
Moving up a notch into Super High frequency, there is a potential total of 27,000MHz of spectrum, which is suitable for line of sight only, such as satellite communications. This spectrum is currently fully utilised but displacing everyone would allow up to 270 homes to be serviced. This assumes the same efficiency gains could be applied to satellite communications and that satellites could be suitably directional.
Moving up the frequency spectrum again, to the Extra High Frequency, there is another tenfold increase in capacity, but in moving towards the visible light spectrum we begin to experience some of its disadvantages such as being affected by precipitation. This would seriously reduce the reliability of the system.
Possible future scenarios
Scenario 1 The world moves to very high speed internet with the starting point in Gbs. If very high speed internet was ubiquitous, it is likely that fibre will be the transmission mechanism; wireless is unlikely to be competitive in this space. While it could compete on a limited basis the physical constraints imposed would mean few customers could be serviced without massively expanding the network by trenching or tapping into the Chorus network, making Chorus the likely winner.
Scenario 2 Usage of the internet doesn’t extend much beyond current usage and some further uptake of Netflix-like services. In this case wireless is a severe threat which would require careful management by providers to maintain quality, but the possibility of utilising more frequency and further gains in efficiency could see large numbers watching internet TV from their home wirelessly. There still would need to be a catalyst for change as often lower cost solutions aren’t taken up due to inertia. Chorus is likely to remain relevant and competitive.
Scenario 3 The internet becomes balkanised. There is a split between high data consumers on fibre and cost-conscious consumers opting for wireless. This scenario depends on the future of the lounge, with some users browsing iPads and watching standard definition TV and others having ultra high definition TV coming in via the internet. In this scenario Chorus also plays a role, but its addressable market is a fraction of scenario 1.
Appendices
Electromagnetic Radiation
Electromagnetic Radiation(EM) encompasses light, radio waves and x-rays. EM is measured is in Hertz(Hz) which equates to cycles/second. The amount of bandwidth available or the range of Hz is a good measure of the amount of information that can be transmitted. Radio waves are at the low end of the EM spectrum, and are used to transmit signals wirelessly. Lower frequencies can be transmitted greater distances and have the ability to bend around obstacles. Higher frequencies such as microwave have
more available bandwidth and are useful for point to point links such as satellite communications. Ultra High Frequency band that encompasses 300MHz to 3000MHz is suitable for cell phone communications due to its ability to bend. Much further up the frequency spectrum is visible light with a bandwidth of 320,000,000Mhz. Radio has physical limitations imposed by the available spectrum, light is constrained by the hardware used to transmit and receive.
Fibre Optics
A fibre optic is a very thin glass fibre that relies on internal reflection to transmit light over very long distances with minimal loss. The technology is not new: fibre optics were patented for data communication in 1966 by which time lasers were already commercial. Due to the high frequency and bandwidth of light and the low noise characteristics of the fibre, vast amounts of information can be transmitted. The standard plans for fibre in New Zealand is 100Mb/s to a residential address and 1Gb/s to a business. There are 14 fibres connecting New Zealand to the rest of the world through the Southern Cross Link, the current system potential is thought to be >12TBs which per fibre is over 8,000 times faster than 100Mbs currently in use by most households.
18
Radio Spectrum Allocations in New Zealand Standard Frequency 20kHz
3 kHz 9 kHz 90 kHz 190 kHz 300 kHz
Standard Frequency 2500 kHz
300 kHz 415 kHz 521 kHz 1690 kHz 2000 kHz 2107 kHz 2194 kHz 2850 kHz 3000 kHz
405 kHz 472 kHz 1612 kHz 1800 kHz 1950 kHz 2065 kHz 2170 kHz 2300 kHz 2495 kHz
Standard Frequency 5000 kHz Standard Frequency 10 MHz Standard Frequency 15 MHz Standard Frequency 20 MHz Standard Frequency 25 MHz
3000 kHz 4438 kHz 5450 kHz 7000 kHz 8100 kHz 9400 kHz 10.150 MHz 11.175 MHz 12.230 MHz 13.870 MHz 14.990 MHz 16.200 MHz 18.030 MHz 19.680MHz 21.450 MHz 22.855 MHz 24.000 MHz 26.100 MHz 28.000 MHz 30 MHz
3155 kHz 4650 kHz 5730 kHz 8800 kHz 9900 kHz 11.400 MHz 14.000 MHz 15.600 MHz 17.410MHz 19.020MHz 21.000 MHz 22.000 MHz 23.200 MHz 27.500 MHz
30 MHz 40 MHz 50 MHz 68 MHz 87 MHz 100 MHz 117.975 MHz 138 MHz 148 MHz 161.9625 MHz 230 MHz 300 MHz
108 MHz 137 MHz 144 MHz 156.4875 MHz 174 MHz 235 MHz
Standard Frequency 400 MHz300 MHz 399.9 MHz 502 MHz 694 MHz 806 MHz 960 MHz 1240 MHz 1350 MHz 1461.5 MHz 1610 MHz 1710 MHz 2010 MHz 2170 MHz 2395 MHz 2500 MHz 2690 MHz 2900 MHz 3000 MHz
328.6 MHz 470 MHz 825.015 MHz 1215 MHz 1300 MHz 1400 MHz 1525 MHz 1660 MHz 1980 MHz 2200 MHz 2450 MHz 2700 MHz
3.00 GHz 4.2 GHz 5 GHz 5.725 GHz 8.5 GHz 9.2 GHz 10.0 GHz 10.68 GHz 11.7 GHz 12.75 GHz 13.75 GHz 15.35 GHz 16.6 GHz 17.7 GHz 19.7 GHz 21.2 GHz 23.6 GHz 24.65 GHz 28.35 GHz 30 GHz
3.4 GHz 4.4 GHz 5.15 GHz 5.85 GHz 7.075 GHz 8.75 GHz 10.5 GHz 12.2 GHz 13.4 GHz 14.5 GHz 15.4 GHz 17.2 GHz 22.0 GHz 24.25 GHz 25.5 GHz 27.0 GHz 29.5 GHz
30 GHz 43.5 GHz 54.25 GHz 66 GHz 76 GHz 119.98 GHz 241 GHz 250 GHz
300+ GHz
40 GHz 50.4GHz 57 GHz 71 GHz 81 GHz 134 GHz 248 GHz
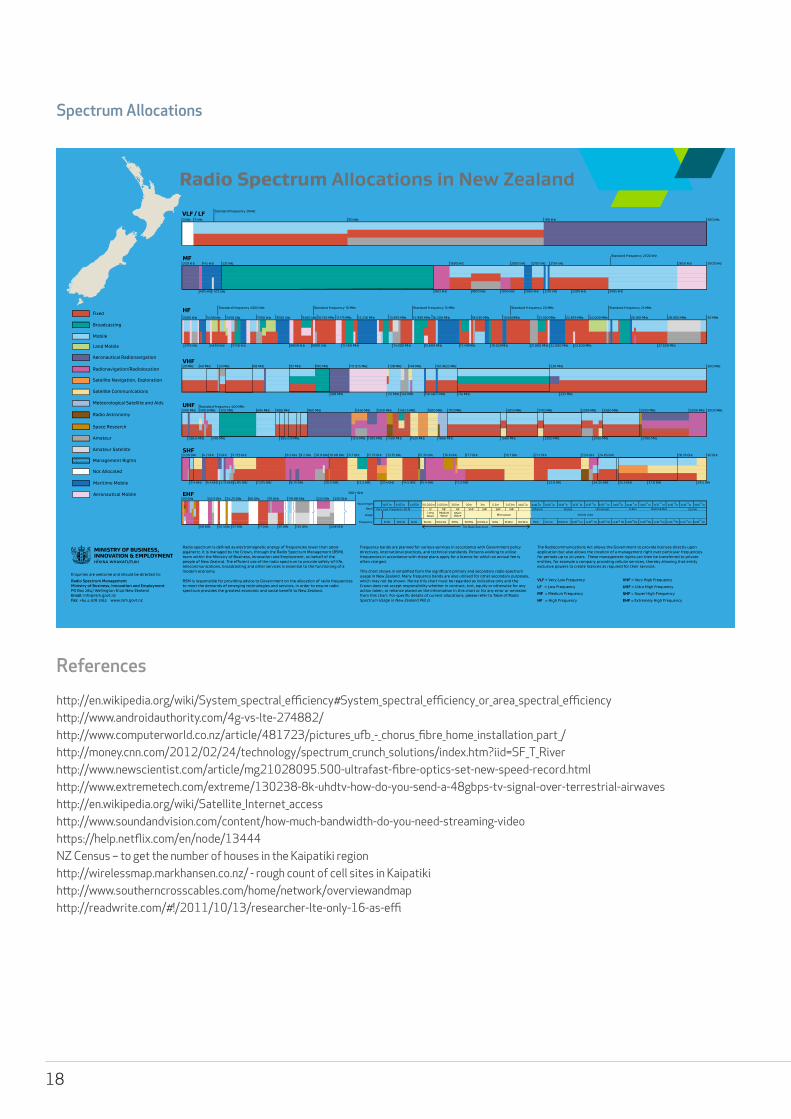
Radio spectrum is defined as electromagnetic energy of frequencies lower than 3000 gigahertz. It is managed by the Crown, through the Radio Spectrum Management (RSM) team within the Ministry of Business, Innovation and Employment, on behalf of the people of New Zealand. The efficient use of the radio spectrum to provide safety-of-life, telecommunications, broadcasting and other services is essential to the functioning of a modern economy.
RSM is responsible for providing advice to Government on the allocation of radio frequencies to meet the demands of emerging technologies and services, in order to ensure radio spectrum provides the greatest economic and social benefit to New Zealand.
Frequency bands are planned for various services in accordance with Government policy directives, international practices, and technical standards. Persons wishing to utilise frequencies in accordance with these plans apply for a licence for which an annual fee is often charged.
This chart shows in simplified form the significant primary and secondary radio spectrum usage in New Zealand. Many frequency bands are also utilised for other secondary purposes, which may not be shown. Hence this chart must be regarded as indicative only and the Crown does not accept responsibility whether in contract, tort, equity or otherwise for any action taken, or reliance placed on the information in this chart or for any error or omission from this chart. For specific details of current allocations, please refer to Table of Radio Spectrum Usage in New Zealand PIB 21.
The Radiocommunications Act allows the Government to provide licences directly upon application but also allows the creation of a management right over particular frequencies for periods up to 20 years. These management rights can then be transferred to private entities, for example a company providing cellular services, thereby allowing that entity exclusive powers to create licences as required for their services.
Very Low Frequency (VLF)
Usage
Band
Frequency
Wavelength 3x10-13
m 3x10-14
m 3x10-15
m 3x10-16
mLF MF HF VHF UHF SHF EHF Visible Ultraviolet Cosmic
0.03m 3x10⁻³m 3x10
-4m 3x10⁻⁵
m 3x10⁻⁶ m 3x10⁻⁷ m 3x10⁻⁸ m 3x10 -9 m3m
1 x10²³ Hz 1 x10
24 Hz
Short Wave
Medium Wave
Long Wave Microwave Visible Light
10 GHz 100 GHz 1 THz 10 THz 100 THz 1 x10¹⁵ Hz 1 x10¹⁶ Hz 1 x10¹⁷ Hz 1 x10¹⁸ Hz10 Hz 100 Hz 1 kHz
3x10-12
m3x10-10
m3x10 7m 3x10⁶ m 3 x10 5 m 30,000m 3,000m 300m 30m 0.3m 3x10
-11m
The Radio Spectrum
1 x10¹⁹ Hz 1 x10²⁰ Hz10 kHz 100 kHz 1 MHz 10 MHz 100 MHz 1 GHz
Gamma-RayX-Ray
1 x10 21 Hz 1 x10²² Hz
Infrared
VLF / LF
MF
HF
VHF
UHF
SHF
EHF
VLF = Very Low Frequency
LF = Low Frequency
MF = Medium Frequency
HF = High Frequency
VHF = Very High Frequency
UHF = Ultra High Frequency
SHF = Super High Frequency
EHF = Extremely High Frequency
Fixed
Land Mobile
Broadcasting
Maritime Mobile
Mobile
Aeronautical Mobile
Aeronautical Radionavigation
Radionavigation/Radiolocation
Radio Astronomy
Space Research
Amateur
Amateur Satellite
Management Rights
Not Allocated
Satellite Navigation, Exploration
Satellite Communications
Meteorological Satellite and Aids
Enquiries are welcome and should be directed to:
Radio Spectrum ManagementMinistry of Business, Innovation and EmploymentPO Box 2847 Wellington 6140 New ZealandEmail: [email protected]: +64 4 978 3162 www.rsm.govt.nzM
B127
04_
14
Spectrum Allocations
References
http://en.wikipedia.org/wiki/System_spectral_efficiency#System_spectral_efficiency_or_area_spectral_efficiencyhttp://www.androidauthority.com/4g-vs-lte-274882/http://www.computerworld.co.nz/article/481723/pictures_ufb_-_chorus_fibre_home_installation_part_/http://money.cnn.com/2012/02/24/technology/spectrum_crunch_solutions/index.htm?iid=SF_T_Riverhttp://www.newscientist.com/article/mg21028095.500-ultrafast-fibre-optics-set-new-speed-record.htmlhttp://www.extremetech.com/extreme/130238-8k-uhdtv-how-do-you-send-a-48gbps-tv-signal-over-terrestrial-airwaveshttp://en.wikipedia.org/wiki/Satellite_Internet_accesshttp://www.soundandvision.com/content/how-much-bandwidth-do-you-need-streaming-videohttps://help.netflix.com/en/node/13444NZ Census – to get the number of houses in the Kaipatiki regionhttp://wirelessmap.markhansen.co.nz/ - rough count of cell sites in Kaipatikihttp://www.southerncrosscables.com/home/network/overviewandmaphttp://readwrite.com/#!/2011/10/13/researcher-lte-only-16-as-effi

Radio Spectrum Allocations in New Zealand Standard Frequency 20kHz
3 kHz 9 kHz 90 kHz 190 kHz 300 kHz
Standard Frequency 2500 kHz
300 kHz 415 kHz 521 kHz 1690 kHz 2000 kHz 2107 kHz 2194 kHz 2850 kHz 3000 kHz
405 kHz 472 kHz 1612 kHz 1800 kHz 1950 kHz 2065 kHz 2170 kHz 2300 kHz 2495 kHz
Standard Frequency 5000 kHz Standard Frequency 10 MHz Standard Frequency 15 MHz Standard Frequency 20 MHz Standard Frequency 25 MHz
3000 kHz 4438 kHz 5450 kHz 7000 kHz 8100 kHz 9400 kHz 10.150 MHz 11.175 MHz 12.230 MHz 13.870 MHz 14.990 MHz 16.200 MHz 18.030 MHz 19.680MHz 21.450 MHz 22.855 MHz 24.000 MHz 26.100 MHz 28.000 MHz 30 MHz
3155 kHz 4650 kHz 5730 kHz 8800 kHz 9900 kHz 11.400 MHz 14.000 MHz 15.600 MHz 17.410MHz 19.020MHz 21.000 MHz 22.000 MHz 23.200 MHz 27.500 MHz
30 MHz 40 MHz 50 MHz 68 MHz 87 MHz 100 MHz 117.975 MHz 138 MHz 148 MHz 161.9625 MHz 230 MHz 300 MHz
108 MHz 137 MHz 144 MHz 156.4875 MHz 174 MHz 235 MHz
Standard Frequency 400 MHz300 MHz 399.9 MHz 502 MHz 694 MHz 806 MHz 960 MHz 1240 MHz 1350 MHz 1461.5 MHz 1610 MHz 1710 MHz 2010 MHz 2170 MHz 2395 MHz 2500 MHz 2690 MHz 2900 MHz 3000 MHz
328.6 MHz 470 MHz 825.015 MHz 1215 MHz 1300 MHz 1400 MHz 1525 MHz 1660 MHz 1980 MHz 2200 MHz 2450 MHz 2700 MHz
3.00 GHz 4.2 GHz 5 GHz 5.725 GHz 8.5 GHz 9.2 GHz 10.0 GHz 10.68 GHz 11.7 GHz 12.75 GHz 13.75 GHz 15.35 GHz 16.6 GHz 17.7 GHz 19.7 GHz 21.2 GHz 23.6 GHz 24.65 GHz 28.35 GHz 30 GHz
3.4 GHz 4.4 GHz 5.15 GHz 5.85 GHz 7.075 GHz 8.75 GHz 10.5 GHz 12.2 GHz 13.4 GHz 14.5 GHz 15.4 GHz 17.2 GHz 22.0 GHz 24.25 GHz 25.5 GHz 27.0 GHz 29.5 GHz
30 GHz 43.5 GHz 54.25 GHz 66 GHz 76 GHz 119.98 GHz 241 GHz 250 GHz
300+ GHz
40 GHz 50.4GHz 57 GHz 71 GHz 81 GHz 134 GHz 248 GHz
Radio spectrum is defined as electromagnetic energy of frequencies lower than 3000 gigahertz. It is managed by the Crown, through the Radio Spectrum Management (RSM) team within the Ministry of Business, Innovation and Employment, on behalf of the people of New Zealand. The efficient use of the radio spectrum to provide safety-of-life, telecommunications, broadcasting and other services is essential to the functioning of a modern economy.
RSM is responsible for providing advice to Government on the allocation of radio frequencies to meet the demands of emerging technologies and services, in order to ensure radio spectrum provides the greatest economic and social benefit to New Zealand.
Frequency bands are planned for various services in accordance with Government policy directives, international practices, and technical standards. Persons wishing to utilise frequencies in accordance with these plans apply for a licence for which an annual fee is often charged.
This chart shows in simplified form the significant primary and secondary radio spectrum usage in New Zealand. Many frequency bands are also utilised for other secondary purposes, which may not be shown. Hence this chart must be regarded as indicative only and the Crown does not accept responsibility whether in contract, tort, equity or otherwise for any action taken, or reliance placed on the information in this chart or for any error or omission from this chart. For specific details of current allocations, please refer to Table of Radio Spectrum Usage in New Zealand PIB 21.
The Radiocommunications Act allows the Government to provide licences directly upon application but also allows the creation of a management right over particular frequencies for periods up to 20 years. These management rights can then be transferred to private entities, for example a company providing cellular services, thereby allowing that entity exclusive powers to create licences as required for their services.
Very Low Frequency (VLF)
Usage
Band
Frequency
Wavelength 3x10-13
m 3x10-14
m 3x10-15
m 3x10-16
mLF MF HF VHF UHF SHF EHF Visible Ultraviolet Cosmic
0.03m 3x10⁻³m 3x10
-4m 3x10⁻⁵
m 3x10⁻⁶ m 3x10⁻⁷ m 3x10⁻⁸ m 3x10 -9 m3m
1 x10²³ Hz 1 x10
24 Hz
Short Wave
Medium Wave
Long Wave Microwave Visible Light
10 GHz 100 GHz 1 THz 10 THz 100 THz 1 x10¹⁵ Hz 1 x10¹⁶ Hz 1 x10¹⁷ Hz 1 x10¹⁸ Hz10 Hz 100 Hz 1 kHz
3x10-12
m3x10-10
m3x10 7m 3x10⁶ m 3 x10 5 m 30,000m 3,000m 300m 30m 0.3m 3x10
-11m
The Radio Spectrum
1 x10¹⁹ Hz 1 x10²⁰ Hz10 kHz 100 kHz 1 MHz 10 MHz 100 MHz 1 GHz
Gamma-RayX-Ray
1 x10 21 Hz 1 x10²² Hz
Infrared
VLF / LF
MF
HF
VHF
UHF
SHF
EHF
VLF = Very Low Frequency
LF = Low Frequency
MF = Medium Frequency
HF = High Frequency
VHF = Very High Frequency
UHF = Ultra High Frequency
SHF = Super High Frequency
EHF = Extremely High Frequency
Fixed
Land Mobile
Broadcasting
Maritime Mobile
Mobile
Aeronautical Mobile
Aeronautical Radionavigation
Radionavigation/Radiolocation
Radio Astronomy
Space Research
Amateur
Amateur Satellite
Management Rights
Not Allocated
Satellite Navigation, Exploration
Satellite Communications
Meteorological Satellite and Aids
Enquiries are welcome and should be directed to:
Radio Spectrum ManagementMinistry of Business, Innovation and EmploymentPO Box 2847 Wellington 6140 New ZealandEmail: [email protected]: +64 4 978 3162 www.rsm.govt.nzM
B127
04_
14
Spectrum Allocations
References
http://en.wikipedia.org/wiki/System_spectral_efficiency#System_spectral_efficiency_or_area_spectral_efficiencyhttp://www.androidauthority.com/4g-vs-lte-274882/http://www.computerworld.co.nz/article/481723/pictures_ufb_-_chorus_fibre_home_installation_part_/http://money.cnn.com/2012/02/24/technology/spectrum_crunch_solutions/index.htm?iid=SF_T_Riverhttp://www.newscientist.com/article/mg21028095.500-ultrafast-fibre-optics-set-new-speed-record.htmlhttp://www.extremetech.com/extreme/130238-8k-uhdtv-how-do-you-send-a-48gbps-tv-signal-over-terrestrial-airwaveshttp://en.wikipedia.org/wiki/Satellite_Internet_accesshttp://www.soundandvision.com/content/how-much-bandwidth-do-you-need-streaming-videohttps://help.netflix.com/en/node/13444NZ Census – to get the number of houses in the Kaipatiki regionhttp://wirelessmap.markhansen.co.nz/ - rough count of cell sites in Kaipatikihttp://www.southerncrosscables.com/home/network/overviewandmaphttp://readwrite.com/#!/2011/10/13/researcher-lte-only-16-as-effi
Please note that this Report has been provided for information purposes only. The content of this document is not intended as a substitute for specific professional advice on investments, financial planning or any other matter.
While the information provided in this document is stated accurately to the best of our knowledge and belief, New Zealand Funds Management Limited, its directors, employees and related parties accept no liability or responsibility for any loss, damage, claim or expense suffered or incurred by any party as a result of reliance on the information provided and opinions expressed in these Portfolio Insights except as required by law.
Please also note that past performance is not necessarily an indication of future returns. For further information or to request a copy of the NZ Funds Managed Portfolio Service Investment Statement or the NZ Funds KiwiSaver Scheme Investment Statement, please contact New Zealand Funds Management Limited.
NZ Funds is an active investment manager. Accordingly, any securities discussed above may or may not be held by the Portfolio at any given point in time.

20
Image: Bay of Islands Cricket Photographer: Steve Clancy
New Zealand Funds Management Limitedwww.nzfunds.co.nz