cincinnati, oh 45221 marwan f. al-rjoub in-vitro study ahmad reza dibaji department of mechanical...
TRANSCRIPT

Seyed Ahmad Reza DibajiDepartment of Mechanical
and Materials Engineering,
College of Engineering and Applied Science,
University of Cincinnati,
2600 Clifton Avenue,
Cincinnati, OH 45221
Marwan F. Al-RjoubDepartment of Mechanical
and Materials Engineering,
College of Engineering and Applied Science,
University of Cincinnati,
2600 Clifton Avenue,
Cincinnati, OH 45221
Matthew R. MyersDivision of Solid and Fluid Mechanics,
Center for Devices and Radiological Health,
U. S. Food and Drug Administration,
10903 New Hampshire Avenue,
Silver Spring, MD 20993
Rupak K. Banerjee1
Department of Mechanical
and Materials Engineering,
College of Engineering and Applied Science,
University of Cincinnati,
598 Rhodes Hall,
P.O. Box 210072,
Cincinnati, OH 45221
e-mail: [email protected]
Enhanced Heat Transfer andThermal Dose Using MagneticNanoparticles During HIFUThermal Ablation—AnIn-Vitro StudyAvoiding collateral damage to healthy tissues during the high intensity focused ultra-sound (HIFU) ablation of malignant tumors is one of the major challenges for effectivethermal therapy. Such collateral damage can originate out of the need for using higheracoustic powers to treat deep seated or highly vascularized tumors. The objective of thisstudy is to assess the utility of using magnetic nanoparticles (mNPs) during HIFU proce-dures to locally enhance heating at low powers, thereby reducing the likelihood of col-lateral thermal damage and undesired destruction due to cavitation. Tissue phantomswith 0% (control), 1% and 3% mNPs concentrations by volume were fabricated. Eachtissue phantom was embedded with four thermocouples (TCs) and sonicated using trans-ducer acoustic powers of 5.15 W, 9.17 W, and 14.26 W. The temperature profiles duringthe heating and cooling periods were recorded for each embedded TC. The measuredtransient temperature profiles were used for thermal-dose calculations. The increase inthe concentration of mNPs in the tissue phantoms, from 0% to 3%, resulted in the rise inthe peak temperatures for all the TCs for each acoustic power. The thermal dose alsoincreased with the rise in the concentration of mNPs in the tissue phantoms. For thehighest applied acoustic power (14.26 W), the peak temperature at TC 1 (T1) in tissuephantoms with 1% and 3% mNPs concentrations increased (with respect to tissue phan-tom with 0% (control) mNPs concentration) by 1.59� and 2.09�, respectively. For anacoustic power of 14.26 W, the time required to achieve cellular necrosis as defined by a240 equivalent min thermal dose was approximately 75 s in the absence of mNPs, 14 sfor the 1% concentration, and 8 s for the 3% concentration. Magnetic nanoparticleshave the potential to significantly reduce the time for HIFU thermal-ablation proce-dures. They can also decrease the likelihood of collateral damage by the propagatingbeam in HIFU procedures by reducing the intensity required to achieve cellularnecrosis. [DOI: 10.1115/1.4027340]
1 Introduction
HIFU is a noninvasive medical procedure with a significantpotential for a variety of therapeutic applications. Some of themedical applications of HIFU include tumors ablation, drugdelivery, hemostasis, and gene activation [1]. Unlike other hyper-thermia techniques, HIFU ablation is completely noninvasivewith minimum patient recovery time [2]. During HIFU ablationprocedures, the mechanical energy of acoustic waves converts tothermal energy as the ultrasound propagates through the tissue.The localized temperature rise causes rapid cell death, or necro-sis, in the targeted region [2]. In order to ensure safety and effi-cacy of HIFU devices, preclinical evaluations of the thermal andacoustic field generated by the HIFU transducers are necessary.Preclinical testing of HIFU systems has been performed usingcomputational modeling [3–7], ex-vivo [8–11] or in-vivo [12–15]animal tissues, and tissue phantoms [16–19]. The advantage ofusing phantoms with tissue mimicking material (TMM) is thatsuch test sections can be reused repeatedly without affectingacoustical and thermal properties, which can be made similar tothat of human tissue [20].
Despite the advancements of HIFU in recent years, there arestill several factors limiting its application in thermal ablation. Forexample, the efficacy of HIFU in ablating the larger and deepertumors can be low, as the ultrasound intensity attenuates exponen-tially with the increase of depth in tissue [21,22]. In addition, theblood flow through a large vessel can significantly reduce the tem-perature elevation, when the HIFU focus is close to the vesselwall [23–25]. The HIFU energy deposition in larger or highly vas-cularized tumors can be enhanced by increasing either the ultra-sound power or sonication time [22,26]. However, increasing theacoustic power or exposure time can lead to unnecessary heatingof surrounding normal tissues, causing collateral damage tohealthy tissues such as nerve injury and skin burns [26]. There-fore, it is advantageous to seek methods for better efficacy ofHIFU thermal therapy using low ultrasound power and shortexposure time.
Ultrasound contrast agents can be used to improve thetherapeutic efficacy of HIFU procedures. In the studies by Luoet al. [26] and Tung et al. [27], microbubbles were used asultrasound contrast agents to enhance energy deposition in theHIFU focal region. The presence of microbubbles near the HIFUfocus also resulted in larger lesions [28]. Similarly, Tran et al.[29] reported that the requisite ultrasound intensity and exposuretime can be reduced by the administration of contrastmicrobubbles.
In addition to ultrasound contrast agents, mNPs can also beused to enhance the HIFU thermal ablation of cancer tumors. In
1Corresponding author.Manuscript received January 20, 2014; final manuscript received March 19, 2014;
published online April 15, 2014. Assoc. Editor: Sumanta Acharya.This material is declared a work of the US Government and is not subject to
copyright protection in the United States. Approved for public release; distribution isunlimited.
Journal of Nanotechnology in Engineering and Medicine NOVEMBER 2013, Vol. 4 / 041003-1Copyright VC 2013 by ASME
Downloaded From: http://nanoengineeringmedical.asmedigitalcollection.asme.org/ on 07/14/2014 Terms of Use: http://asme.org/terms
the study by Quanyi et al. [30], mNPs were incorporated into aninterface layer in an egg white phantom radiated by HIFU. It wasreported that the lesion volume was enlarged when the acousticfocal region was close to the interface. More recently, Ho et al.[31] examined the effect of magnetic (Fe3O4) nanoparticleagglomerates on the destruction of tumor spheroids using HIFUablation. Hela multicellular spheroids were insonated in the pres-ence and absence of mNPs agglomerates. They found that themagnetic nanoparticle agglomerates can increase the degree ofHIFU induced inertial cavitation, possibly at higher temperatures,and consequently enhance the rate of destruction of tumor sphe-roids. However, no examination was performed to investigate theeffect of mNPs on the HIFU induced temperature rise in theabsence of inertial cavitation. In another study, supermagneticpoly(lactic-co-glycolic) acid (PLGA) microcapsules (Fe3O4/PLGA) were administered into a rabbit breast cancer model toevaluate the in-vivo HIFU synergistic ablation efficiency causedby the introduction of such microcapsules [32]. It was found thatthe volume of coagulative necrosis was substantially larger afterthe injection of Fe3O4/PLGA microcapsules compared to thegroup without this agent. The results showed that Fe3O4/PLGAmicrocapsules could improve the ablation efficiency of HIFU at alower power and shorter exposure duration. However, the impactof using different amounts of Fe3O4 in the synthesis process wasnot studied.
Gold nanoparticles-coated, perfluorohexane-encapsulated, andPEGylated mesoporous silica nanocapsule-based enhancementagents (MSNC@Au-PFH-PEG, abb. as MAPP), were also used asan intensified ultrasound-guided HIFU enhancement agent [33]. Itwas found that the ultrasound-guided HIFU therapy ex-vivo andin-vivo with MAPP can be highly efficient on rabbit VX2 xeno-graft tumor ablation due to both thermal energy accumulation andPFH bubble cavitation.
In the present study, the effect of mNPs (Fe3O4) on the HIFUinduced temperature rise and thermal dose was assessed. Tissuephantoms with 0% (control), 1% and 3% mNPs concentrations byvolume were fabricated. Each tissue phantom was embeddedwith four TCs and sonicated using transducer acoustic powers of5.15 W, 9.17 W, and 14.26 W. The temperature profiles during theheating and cooling periods were recorded at each embedded TC.The measured transient temperature profiles were used for thermaldose calculation. The temperature profiles as well as the thermaldoses at each TC were compared for the three different concentra-tions for each acoustic power to quantify the effect of mNPs.
2 Methods
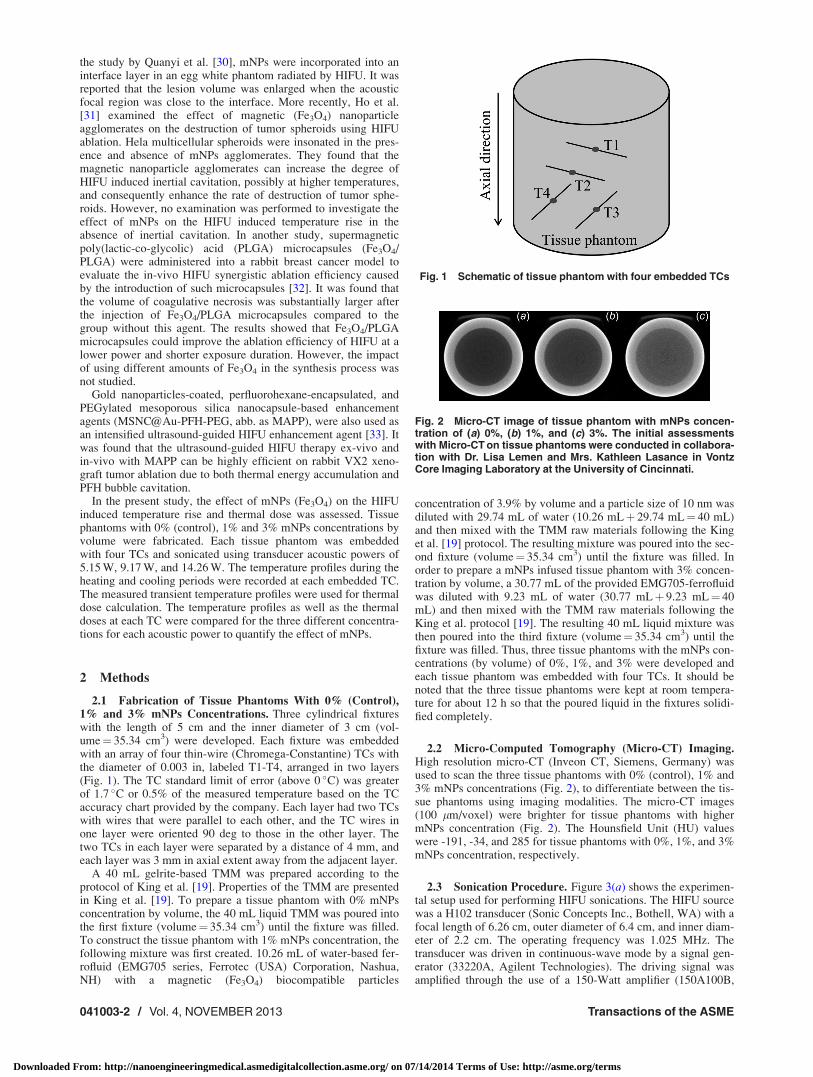
2.1 Fabrication of Tissue Phantoms With 0% (Control),1% and 3% mNPs Concentrations. Three cylindrical fixtureswith the length of 5 cm and the inner diameter of 3 cm (vol-ume¼ 35.34 cm3) were developed. Each fixture was embeddedwith an array of four thin-wire (Chromega-Constantine) TCs withthe diameter of 0.003 in, labeled T1-T4, arranged in two layers(Fig. 1). The TC standard limit of error (above 0 �C) was greaterof 1.7 �C or 0.5% of the measured temperature based on the TCaccuracy chart provided by the company. Each layer had two TCswith wires that were parallel to each other, and the TC wires inone layer were oriented 90 deg to those in the other layer. Thetwo TCs in each layer were separated by a distance of 4 mm, andeach layer was 3 mm in axial extent away from the adjacent layer.
A 40 mL gelrite-based TMM was prepared according to theprotocol of King et al. [19]. Properties of the TMM are presentedin King et al. [19]. To prepare a tissue phantom with 0% mNPsconcentration by volume, the 40 mL liquid TMM was poured intothe first fixture (volume¼ 35.34 cm3) until the fixture was filled.To construct the tissue phantom with 1% mNPs concentration, thefollowing mixture was first created. 10.26 mL of water-based fer-rofluid (EMG705 series, Ferrotec (USA) Corporation, Nashua,NH) with a magnetic (Fe3O4) biocompatible particles
concentration of 3.9% by volume and a particle size of 10 nm wasdiluted with 29.74 mL of water (10.26 mLþ 29.74 mL¼ 40 mL)and then mixed with the TMM raw materials following the Kinget al. [19] protocol. The resulting mixture was poured into the sec-ond fixture (volume¼ 35.34 cm3) until the fixture was filled. Inorder to prepare a mNPs infused tissue phantom with 3% concen-tration by volume, a 30.77 mL of the provided EMG705-ferrofluidwas diluted with 9.23 mL of water (30.77 mLþ 9.23 mL¼ 40mL) and then mixed with the TMM raw materials following theKing et al. protocol [19]. The resulting 40 mL liquid mixture wasthen poured into the third fixture (volume¼ 35.34 cm3) until thefixture was filled. Thus, three tissue phantoms with the mNPs con-centrations (by volume) of 0%, 1%, and 3% were developed andeach tissue phantom was embedded with four TCs. It should benoted that the three tissue phantoms were kept at room tempera-ture for about 12 h so that the poured liquid in the fixtures solidi-fied completely.
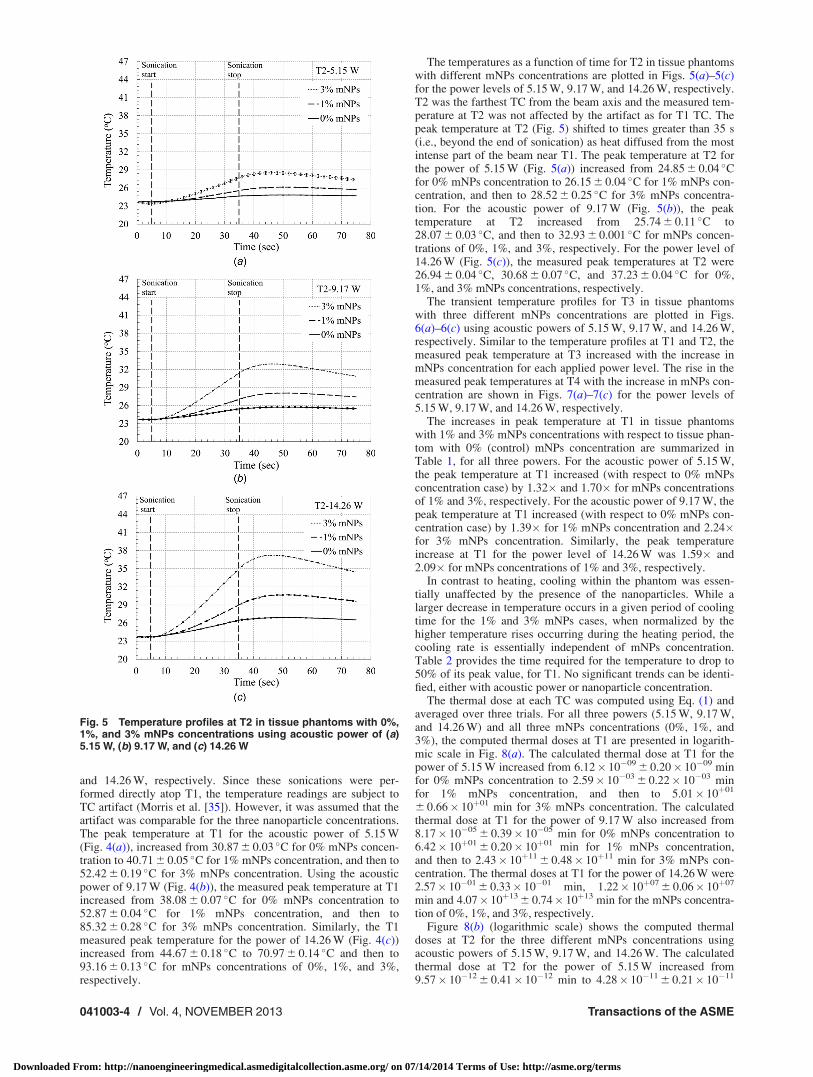
2.2 Micro-Computed Tomography (Micro-CT) Imaging.High resolution micro-CT (Inveon CT, Siemens, Germany) wasused to scan the three tissue phantoms with 0% (control), 1% and3% mNPs concentrations (Fig. 2), to differentiate between the tis-sue phantoms using imaging modalities. The micro-CT images(100 lm/voxel) were brighter for tissue phantoms with highermNPs concentration (Fig. 2). The Hounsfield Unit (HU) valueswere -191, -34, and 285 for tissue phantoms with 0%, 1%, and 3%mNPs concentration, respectively.
2.3 Sonication Procedure. Figure 3(a) shows the experimen-tal setup used for performing HIFU sonications. The HIFU sourcewas a H102 transducer (Sonic Concepts Inc., Bothell, WA) with afocal length of 6.26 cm, outer diameter of 6.4 cm, and inner diam-eter of 2.2 cm. The operating frequency was 1.025 MHz. Thetransducer was driven in continuous-wave mode by a signal gen-erator (33220A, Agilent Technologies). The driving signal wasamplified through the use of a 150-Watt amplifier (150A100B,
Fig. 1 Schematic of tissue phantom with four embedded TCs
Fig. 2 Micro-CT image of tissue phantom with mNPs concen-tration of (a) 0%, (b) 1%, and (c) 3%. The initial assessmentswith Micro-CT on tissue phantoms were conducted in collabora-tion with Dr. Lisa Lemen and Mrs. Kathleen Lasance in VontzCore Imaging Laboratory at the University of Cincinnati.
041003-2 / Vol. 4, NOVEMBER 2013 Transactions of the ASME
Downloaded From: http://nanoengineeringmedical.asmedigitalcollection.asme.org/ on 07/14/2014 Terms of Use: http://asme.org/terms

Amplifier Research). The transducer and the tissue phantomsresided in a tank of degassed water. A holding rod was mountedto the transducer housing and was parallel to the transducer axisof symmetry (Fig. 3(a)). The holding rod was attached to an x-y-zpositioning system that was capable of adjusting any of the coor-dinates in discrete 0.025 mm increments.
The following procedure was performed for sonicating each ofthe phantoms. First, the rod holding the transducer, the tissuephantom axis of symmetry and the z-axis of the positioning sys-tem were placed parallel to each other (Fig. 3(a)). The HIFUbeam axis was thus parallel to the axis of symmetry of tissuephantom, while the TC wires were perpendicular to the beam axis.T1 and T2 TC wires were parallel to the y-axis while T3 and T4wires were parallel to the x-axis of the positioning system (Fig.3(b)). In order to find the T1 junction, the beam was moved insidethe tissue phantom, using the 3D positioning system, until themaximum temperature rise for T1 was observed during a briefsonication period (10 s). After positioning the beam on the T1junction (Fig. 3(b)), the transducer was activated in a continuous-wave mode at a time of 5 s for a period of 30 s. The temperatureon the full array, i.e., T1, T2, T3, and T4, was recorded using anOMB-DAQ-56 (Omega Engg. Inc., Stamford, CT) data acquisi-tion system over the 5 s presonication period, 30 s heating period,and 40 s cooling period (total time¼ 75 s). The temporal resolu-tion of the temperature measurements was 0.5 s. A heating periodof 30 s was chosen because it yielded a temperature just short ofboiling when the highest power and highest mNPs concentrationwere used. Three transducer acoustic powers of 5.15 W, 9.17 W,and 14.26 W were used. These powers correspond to values atwhich the transducer was previously calibrated using a radiation-force balance. Three trials (n¼ 3) were performed for each powerlevel. After each trial, the tissue phantoms were allowed to cooldown to the ambient water temperature.
2.4 Thermal Dose. The thermal dose at each TC (T1, T2, T3,and T4) was calculated using the corresponding transient tempera-ture profile, according to the method developed by Sapareto andDewey [34]. The thermal dose parameter is expressed as
t43ðx; y; zÞ ¼ðt¼tfinal
t¼0
R43�TðtÞdt (1)
where t43 is the thermal dose at the reference temperature of43 �C, tfinal is the treatment (sonication) time, T(t) is the tempera-ture (in �C) as a function of time obtained experimentally, and
R ¼ 0:5 if TðtÞ � 43 �C0:25 otherwise
� �
A trapezoidal scheme was used to perform the integration shownin Eq. (1) with dt¼ 0.5 s.
3 Results
The HIFU induced temperature rise was measured using em-bedded TCs in tissue phantoms with three different mNPs concen-trations (0% (control), 1% and 3%). The temperatures of thedegassed water and the presonication tissue phantoms were23.6 �C. The measured temperatures at each TC (T1, T2, T3, andT4) were averaged over three trials for each acoustic power level(5.15 W, 9.17 W, and 14.26 W). Although the temporal resolutionof measurements was 0.5 s, the error bars were shown at every 2 sfor all the temperature plots to provide better clarity. Results arepresented as mean 6 SD.
Figures 4(a)–4(c) show the HIFU induced transient temperatureprofiles at T1 in tissue phantoms with various mNPs concentra-tions (0%, 1%, and 3%) using acoustic powers of 5.15 W, 9.17 W,
Fig. 3 (a) Schematic of the experimental setup showing theHIFU transducer aligned with the tissue phantom in degassedwater medium. (b) Schematic of the HIFU beam positioning onT1 junction.
Fig. 4 Temperature profiles at T1 in tissue phantoms with 0%,1%, and 3% mNPs concentrations using acoustic power of (a)5.15 W, (b) 9.17 W, and (c) 14.26 W
Journal of Nanotechnology in Engineering and Medicine NOVEMBER 2013, Vol. 4 / 041003-3
Downloaded From: http://nanoengineeringmedical.asmedigitalcollection.asme.org/ on 07/14/2014 Terms of Use: http://asme.org/terms
and 14.26 W, respectively. Since these sonications were per-formed directly atop T1, the temperature readings are subject toTC artifact (Morris et al. [35]). However, it was assumed that theartifact was comparable for the three nanoparticle concentrations.The peak temperature at T1 for the acoustic power of 5.15 W(Fig. 4(a)), increased from 30.87 6 0.03 �C for 0% mNPs concen-tration to 40.71 6 0.05 �C for 1% mNPs concentration, and then to52.42 6 0.19 �C for 3% mNPs concentration. Using the acousticpower of 9.17 W (Fig. 4(b)), the measured peak temperature at T1increased from 38.08 6 0.07 �C for 0% mNPs concentration to52.87 6 0.04 �C for 1% mNPs concentration, and then to85.32 6 0.28 �C for 3% mNPs concentration. Similarly, the T1measured peak temperature for the power of 14.26 W (Fig. 4(c))increased from 44.67 6 0.18 �C to 70.97 6 0.14 �C and then to93.16 6 0.13 �C for mNPs concentrations of 0%, 1%, and 3%,respectively.
The temperatures as a function of time for T2 in tissue phantomswith different mNPs concentrations are plotted in Figs. 5(a)–5(c)for the power levels of 5.15 W, 9.17 W, and 14.26 W, respectively.T2 was the farthest TC from the beam axis and the measured tem-perature at T2 was not affected by the artifact as for T1 TC. Thepeak temperature at T2 (Fig. 5) shifted to times greater than 35 s(i.e., beyond the end of sonication) as heat diffused from the mostintense part of the beam near T1. The peak temperature at T2 forthe power of 5.15 W (Fig. 5(a)) increased from 24.85 6 0.04 �Cfor 0% mNPs concentration to 26.15 6 0.04 �C for 1% mNPs con-centration, and then to 28.52 6 0.25 �C for 3% mNPs concentra-tion. For the acoustic power of 9.17 W (Fig. 5(b)), the peaktemperature at T2 increased from 25.74 6 0.11 �C to28.07 6 0.03 �C, and then to 32.93 6 0.001 �C for mNPs concen-trations of 0%, 1%, and 3%, respectively. For the power level of14.26 W (Fig. 5(c)), the measured peak temperatures at T2 were26.94 6 0.04 �C, 30.68 6 0.07 �C, and 37.23 6 0.04 �C for 0%,1%, and 3% mNPs concentrations, respectively.
The transient temperature profiles for T3 in tissue phantomswith three different mNPs concentrations are plotted in Figs.6(a)–6(c) using acoustic powers of 5.15 W, 9.17 W, and 14.26 W,respectively. Similar to the temperature profiles at T1 and T2, themeasured peak temperature at T3 increased with the increase inmNPs concentration for each applied power level. The rise in themeasured peak temperatures at T4 with the increase in mNPs con-centration are shown in Figs. 7(a)–7(c) for the power levels of5.15 W, 9.17 W, and 14.26 W, respectively.
The increases in peak temperature at T1 in tissue phantomswith 1% and 3% mNPs concentrations with respect to tissue phan-tom with 0% (control) mNPs concentration are summarized inTable 1, for all three powers. For the acoustic power of 5.15 W,the peak temperature at T1 increased (with respect to 0% mNPsconcentration case) by 1.32� and 1.70� for mNPs concentrationsof 1% and 3%, respectively. For the acoustic power of 9.17 W, thepeak temperature at T1 increased (with respect to 0% mNPs con-centration case) by 1.39� for 1% mNPs concentration and 2.24�for 3% mNPs concentration. Similarly, the peak temperatureincrease at T1 for the power level of 14.26 W was 1.59� and2.09� for mNPs concentrations of 1% and 3%, respectively.
In contrast to heating, cooling within the phantom was essen-tially unaffected by the presence of the nanoparticles. While alarger decrease in temperature occurs in a given period of coolingtime for the 1% and 3% mNPs cases, when normalized by thehigher temperature rises occurring during the heating period, thecooling rate is essentially independent of mNPs concentration.Table 2 provides the time required for the temperature to drop to50% of its peak value, for T1. No significant trends can be identi-fied, either with acoustic power or nanoparticle concentration.
The thermal dose at each TC was computed using Eq. (1) andaveraged over three trials. For all three powers (5.15 W, 9.17 W,and 14.26 W) and all three mNPs concentrations (0%, 1%, and3%), the computed thermal doses at T1 are presented in logarith-mic scale in Fig. 8(a). The calculated thermal dose at T1 for thepower of 5.15 W increased from 6.12� 10�09 6 0.20� 10�09 minfor 0% mNPs concentration to 2.59� 10�03 6 0.22� 10�03 minfor 1% mNPs concentration, and then to 5.01� 10þ01
6 0.66� 10þ01 min for 3% mNPs concentration. The calculatedthermal dose at T1 for the power of 9.17 W also increased from8.17� 10�05 6 0.39� 10�05 min for 0% mNPs concentration to6.42� 10þ01 6 0.20� 10þ01 min for 1% mNPs concentration,and then to 2.43� 10þ11 6 0.48� 10þ11 min for 3% mNPs con-centration. The thermal doses at T1 for the power of 14.26 W were2.57� 10�01 6 0.33� 10�01 min, 1.22� 10þ07 6 0.06� 10þ07
min and 4.07� 10þ13 6 0.74� 10þ13 min for the mNPs concentra-tion of 0%, 1%, and 3%, respectively.
Figure 8(b) (logarithmic scale) shows the computed thermaldoses at T2 for the three different mNPs concentrations usingacoustic powers of 5.15 W, 9.17 W, and 14.26 W. The calculatedthermal dose at T2 for the power of 5.15 W increased from9.57� 10�12 6 0.41� 10�12 min to 4.28� 10�11 6 0.21� 10�11
Fig. 5 Temperature profiles at T2 in tissue phantoms with 0%,1%, and 3% mNPs concentrations using acoustic power of (a)5.15 W, (b) 9.17 W, and (c) 14.26 W
041003-4 / Vol. 4, NOVEMBER 2013 Transactions of the ASME
Downloaded From: http://nanoengineeringmedical.asmedigitalcollection.asme.org/ on 07/14/2014 Terms of Use: http://asme.org/terms

min, and then to 8.47� 10�10 6 2.68� 10�10 min for the mNPsconcentrations of 0%, 1%, and 3%, respectively. The thermal doseelevated from 2.81� 10�11 6 0.44� 10�11 min for 0% mNPsconcentration to 5.09� 10�10 6 0.14� 10�10 min for 1% mNPsconcentration, and then to 2.70� 10�7 6 0.02� 10�7 min for 3%mNPs concentration for the power of 9.17 W. Similarly, the ther-mal dose value at T2 for the power of 14.26 W increased from1.27� 10�10 6 0.08� 10�10 min to 1.55� 10�08 6 0.16� 10�08
min, and then to 8.47� 10�05 6 0.30� 10�05 min for the mNPsconcentrations of 0%, 1%, and 3%, respectively.
Using acoustic powers of 5.15 W, 9.17 W, and 14.26 W, thecomputed thermal doses at T3 and T4 in tissue phantoms withthree different mNPs concentrations are plotted in logarithmicscale in Figs. 8(c) and 8(d), respectively. Similar to T1 and T2,the thermal doses for both T3 and T4 increased with the increasein mNPs concentration for each applied power.
In addition to thermal doses, the time required to achieve cellu-lar necrosis—defined as a thermal dose of 240 equivalent min—was also computed. In cases (low power or low mNPs concentra-tion) where the temperature rise was insufficient to produce anequivalent dose of 240 min, the heating curve was extrapolated tolonger times using a curve-fitting procedure. A logarithmic fittingfunction was used; the regression coefficient R2 was greater than0.98 in each case. The time to achieve cellular necrosis was com-puted only for T1; the other locations were remote enough fromthe beam that necrosis was not achieved for the powers consid-ered. In principle, the threshold for cell necrosis established forthe particular organ and species should be used in thermal dosecalculations. As these values are often not available, a value of240 equivalent min is usually used. In the HIFU ablation studiesby Righetti et al. [36] involving excised livers, a thermal dose of243 min (�240 min) was used as the threshold for cell necrosis.
Fig. 6 Temperature profiles at T3 in tissue phantoms with 0%,1%, and 3% mNPs concentrations using acoustic power of (a)5.15 W, (b) 9.17 W, and (c) 14.26 W
Fig. 7 Temperature profiles at T4 in tissue phantoms with 0%,1%, and 3% mNPs concentrations using acoustic power of (a)5.15 W, (b) 9.17 W, and (c) 14.26 W
Journal of Nanotechnology in Engineering and Medicine NOVEMBER 2013, Vol. 4 / 041003-5
Downloaded From: http://nanoengineeringmedical.asmedigitalcollection.asme.org/ on 07/14/2014 Terms of Use: http://asme.org/terms

The time to achieve cellular necrosis is shown in Table 3. Atthe lowest power (5.15 W), a 100-fold decrease in the necrosistime was observed between the 0% concentration and the 3%concentration. At the highest power (14.26 W), the reduction intime-to-necrosis achieved by using a 3% mNPs concentration (rel-ative to no nanoparticles) was less than at lower powers, but stillabout a factor of 10.
4 Discussion
The increases in temperature rise and thermal dose (Figs. 4–8)associated with small concentrations of nanoparticles are manifes-tations of a substantial increase in acoustic attenuation due to thepresence of mNPs. Dabek et al. [37] report an increase of morethan a factor of 2 in the acoustic attenuation of a liquid nanopar-ticle suspension, when the concentration of Fe3O4 is increased toonly 1%. Dabek et al. [37] cite two contributions to the attenua-tion that increase with increasing nanoparticle concentration: aviscous component, involving the difference in density betweenthe nanoparticles and the surrounding medium, and a thermalattenuation, involving the difference in thermal propertiesbetween the nanoparticles and their surroundings. Given the smallparticle size relative to the acoustic wavelength, enhanced scatter-ing due to the presence of the nanoparticles can be neglected,though this may not be possible if the nanoparticles form agglom-erations within the phantom.
The increase in heat production associated with the enhancedattenuation can be observed in the initial slope of the temperaturetraces in Figs. 4–7. For short times during early phase of sonica-tion, thermal diffusion can be neglected, and the change in tem-perature is due solely to the absorption of acoustic energy.Mathematically, the temperature rise is linearly proportional tothe heat production for small values of time. Table 4 provides theratio of the initial slope of the temperature trace for a given nano-particle concentration, normalized by the slope for the case of 0%mNPs. An initial time of 2.5 s was chosen to compute the initialslopes. The 2.5 s time was chosen because it was long enough that
Table 1 The increase in peak temperature at T1 in tissue phan-toms with 1% and 3% mNPs concentrations with respect to tis-sue phantom with 0% (control) mNPs concentration. 3; times.
Tissue phantom with1% mNPs concentration
Tissue phantom with3% mNPs concentration
5.15 W 1.32� 1.70�9.17 W 1.39� 2.24�14.26 W 1.59� 2.09�
Table 2 The time required for the temperature at T1 to drop to50% of its peak value
0% mNPs 1% mNPs 3% mNPs
5.15 W 10.2 s 8.2 s 8.8 s9.17 W 8.6 s 8.8 s 5.6 s14.26 W 9.6 s 8.6 s 10.1 s
Fig. 8 Thermal doses at (a) T1, (b) T2, (c) T3, and (d) T4 in tissue phantoms with 0%, 1%, and 3% mNPs concentrations usingacoustic powers of 5.15 W, 9.17 W, and 14.26 W
041003-6 / Vol. 4, NOVEMBER 2013 Transactions of the ASME
Downloaded From: http://nanoengineeringmedical.asmedigitalcollection.asme.org/ on 07/14/2014 Terms of Use: http://asme.org/terms

the temperature rise due to ultrasound attenuation elevated abovethe TC noise level on the remote TCs, yet short enough that appre-ciable diffusion had not yet occurred. For T1, heat production inthe presence of nanoparticles is between 1.7 and 6 as intense asthe heat production without nanoparticles. For the 3% concentra-tion, the heat-production ratio (with nanoparticles compared towithout) greater than 1 for all TCs. At the 1% concentration, ratiosless than 1 were observed on T2 and T4; this was likely due to thefact that the beam was positioned slightly closer to T2 and T4,and this positioning difference overwhelmed the effect of theincreased attenuation in the presence of the mNPs. Given thisuncertainty due to positioning differences, exact numerical valuesshould not be inferred from Table 4, however the trend of increasein heat production with increasing nanoparticle concentrationseems clear.
Besides uncertainties associated with positioning the beam atopa given thermocouple, slight differences in thermocouple locationbetween fixtures is an additional source of uncertainty in the com-parison between the experiments with and without nanoparticles.Care was taken to construct all phantoms in the same manner, andto pour the liquid gel into the fixtures without directly contactingthermocouples. Still, some thermocouple displacement during thefabrication process was possible. One measure indicating thatthermocouples were located in approximately the same location inthe different phantoms is the time required for the peak tempera-ture to occur at remote thermocouple locations. At the locationsremote from the beam, the peak temperature appeared at approxi-mately the same time for the three fixtures. These times were laterthan the end of sonication time, since the peak temperatureresulted from diffusion of heat generated near the beam axis. Inthe future, experiments will be performed using the same fixturewith and without nanoparticles. After the control experimentswithout nanoparticles, nanoparticles will be injected into theregion of interest with a syringe.
Further work is required to expand the single-location thermal-dose computations featured in Fig. 8 into actual lesion volumes.This could be done with an expanded array, in conjunction withtechniques for interpolating values within the array [38]. Theresults of Fig. 8 do indicate that mNPs infusion can decrease theacoustic power required to achieve cellular necrosis, therebyreducing the risk of collateral damage. This advantage is
particularly valuable for deep seated or highly vascularizedtumors. An additional advantage of nanoparticle infusion can beseen in the necrosis times in Table 3: the presence of mNPs hasthe potential to substantially reduce the time for HIFU thermalablation procedures. This is particularly valuable for large-tumorablation [21].
5 Conclusion
The HIFU induced temperature rise was measured using em-bedded TCs in tissue phantoms with different concentrations ofmNPs for three distinct acoustic powers. The transient tempera-ture profiles were then used to calculate the thermal doses foreach power level. The mNPs increased the attenuation of tissuephantoms so that higher peak temperatures were achieved for theTMMs with greater concentrations of mNPs for all differentpowers. Consequently, higher thermal doses were obtained forgreater concentrations of mNPs for all the applied powers. There-fore, in the presence of mNPs, lower acoustic powers can be usedto achieve higher thermal doses. Thus, the required power toobtain the adequate thermal dose that is capable of causing cellnecrosis in tumors can be reduced substantially with the use ofmNPs. This could reduce the likelihood of damage to the healthytissues caused by the application of higher acoustic powers forthermal therapy of deep seated or highly vascularized tumors. Itcan also reduce the time required for HIFU ablation procedures.
Acknowledgment
Financial support from the National Science Foundation (GrantNo. 1137166) is gratefully acknowledged. The initial assessmentswith Micro-CT on tissue phantoms were conducted in collabora-tion with Dr. Lisa Lemen and Mrs. Kathleen Lasance in VontzCore Imaging Laboratory at the University of Cincinnati. Weappreciate Mr. Dushyanth Giridhar for helping us in developingtissue phantoms and performing HIFU sonications.
References[1] Curra, F. P., and Crum, L. A., 2003, “Therapeutic Ultrasound: Surgery and
Drug Delivery,” Acoust. Sci. Technol., 24(6), pp. 343–348.[2] Ter Haar, G., 2001, “Acoustic Surgery,” Phys. Today, 54(12), pp. 29–34.[3] Wu, J., and Du, G., 1990, “Temperature Elevation Generated by a Focused
Gaussian Beam of Ultrasound,” Ultrasound Med. Biol., 16(5), pp. 489–498.[4] Curra, F. P., Mourad, P. D., Khokhlova, V. A., Cleveland, R. O., and Crum, L.
A., 2000, “Numerical Simulations of Heating Patterns and Tissue TemperatureResponse Due to High-Intensity Focused Ultrasound,” IEEE Trans. Ultrason.Ferroelectr. Freq. Control, 47(4), pp. 1077–1089.
[5] Soneson, J. E., 2009, “A User-Friendly Software Package for HIFU Simu-lation,” AIP Conf. Proc., 1113(1), pp. 165–169.
[6] Myers, M. R., and Soneson, J. E., 2009, “Temperature Modes for NonlinearGaussian Beams,” J. Acoust. Soc. Am., 126(1), pp. 425–433.
[7] Dibaji, S. A. R., Banerjee, R. K., Soneson, J. E., and Myers, M. R., 2013,“Nonlinear Derating of High-Intensity Focused Ultrasound Beams Using Gaus-sian Modal Sums,” J. Acoust. Soc. Am., 134(5), pp. 3435–3445.
[8] Bailey, M. R., Couret, L. N., Sapozhnikov, O. A., Khokhlova, V. A., ter Haar,G., Vaezy, S., Shi, X., Martin, R., and Crum, L. A., 2001, “Use of Overpressureto Assess the Role of Bubbles in Focused Ultrasound Lesion Shape in vitro,”Ultrasound Med. Biol., 27(5), pp. 695–708.
[9] McLaughlan, J., Rivens, I., Leighton, T., and ter Haar, G., 2010, “A Study ofBubble Activity Generated in Ex Vivo Tissue by High Intensity Focused Ultra-sound,” Ultrasound Med. Biol., 36(8), pp. 1327–1344.
[10] Kyriakou, Z., Corral-Baques, M. I., Amat, A., and Coussios, C.-C., 2011,“HIFU-Induced Cavitation and Heating in Ex Vivo Porcine Subcutaneous Fat,”Ultrasound Med. Biol., 37(4), pp. 568–579.
[11] Dasgupta, S., Das, P., Wansapura, J., Hariharan, P., Pratt, R., Witte, D., Myers,M. R., and Banerjee, R. K., 2011, “Reduction of Noise From MR ThermometryMeasurements During HIFU Characterization Procedures,” ASME J. Nanotech-nol. Eng. Med., 2(2), p. 024501.
[12] Mesiwala, A. H., Farrell, L., Wenzel, H. J., Silbergeld, D. L., Crum, L. A.,Winn, H. R., and Mourad, P. D., 2002, “High-Intensity Focused UltrasoundSelectively Disrupts the Blood-Brain Barrier in vivo,” Ultrasound Med. Biol.,28(3), pp. 389–400.
[13] Solomon, S. B., Nicol, T. L., Chan, D. Y., Fjield, T., Fried, N., and Kavoussi,L. R., 2003, “Histologic Evolution of High-Intensity Focused Ultrasound inRabbit Muscle,” Invest. Radiol., 38(5), pp. 293–301.
[14] K€ohler, M. O., Mougenot, C., Quesson, B., Enholm, J., Le Bail, B., Laurent, C.,Moonen, C. T. W., and Ehnholm, G. J., 2009, “Volumetric HIFU Ablation
Table 3 The estimated sonication time required to obtain thethermal dose of 240 equivalent min at T1. The sonication timefor complete cell necrosis for “*” can be achieved below theheating period of 30 s selected for this study.
0% mNPs 1% mNPs 3% mNPs
5.15 W 3147.4 s 133.8 s 35.3 s9.17 W 229.4 s 34.7 s 5.0 s*14.26 W 75.3 s 14.3 s* 8.0 s*
Table 4 The ratio of the initial slope of the temperature trace,normalized by the slope for the case of 0% mNPs at eachselected power. The “1” is indicative of increase in initial slopeof the temperature trace signifying enhanced acoustic attenua-tion with elevated mNPs concentration.
5.15 W 9.17 W 14.26 W
T13% mNPs 3.8þ 5.9þ 2.6þ
1% mNPs 2.5 1.7 1.9
T23% mNPs 1.3þ 1.3þ 1.4þ
1% mNPs 0.7 0.3 0.4
T33% mNPs 2.3þ 2.3þ 2.6þ
1% mNPs 1.2 1.3 1.3
T43% mNPs 2.1þ 2.1þ 2.2þ
1% mNPs �1.0 0.8 0.9
Journal of Nanotechnology in Engineering and Medicine NOVEMBER 2013, Vol. 4 / 041003-7
Downloaded From: http://nanoengineeringmedical.asmedigitalcollection.asme.org/ on 07/14/2014 Terms of Use: http://asme.org/terms

Under 3D Guidance of Rapid MRI Thermometry,” Med. Phys., 36(8),pp. 3521–3535.
[15] Quesson, B., Laurent, C., Maclair, G., de Senneville, B. D., Mougenot, C.,Ries, M., Carteret, T., Rullier, A., and Moonen, C. T. W., 2011, “Real-TimeVolumetric MRI Thermometry of Focused Ultrasound Ablation in vivo: AFeasibility Study in Pig Liver and Kidney,” NMR Biomed., 24(2), pp.145–153.
[16] Canney, M. S., Bailey, M. R., Crum, L. A., Khokhlova, V. A., and Sapozhni-kov, O. A., 2008, “Acoustic Characterization of High Intensity Focused Ultra-sound Fields: A Combined Measurement and Modeling Approach,” J. Acoust.Soc. Am., 124(4), pp. 2406–2420.
[17] Chen, D., Fan, T., Zhang, D., and Wu, J., 2009, “A Feasibility Study of Tem-perature Rise Measurement in a Tissue Phantom as an Alternative Way forCharacterization of the Therapeutic High Intensity Focused Ultrasonic Field,”Ultrasonics, 49(8), pp. 733–742.
[18] Farny, C. H., Holt, R. G., and Roy, R. A., 2009, “Temporal and Spatial Detec-tion of HIFU-Induced Inertial and Hot-Vapor Cavitation With a DiagnosticUltrasound System,” Ultrasound Med. Biol., 35(4), pp. 603–615.
[19] King, R. L., Yunbo, L., Maruvada, S., Herman, B. A., Wear, K. A., and Harris,G. R., 2011, “Development and Characterization of a Tissue-Mimicking Mate-rial for High-Intensity Focused Ultrasound,” IEEE Trans. Ultrason. Ferroelectr.Freq. Control, 58(7), pp. 1397–1405.
[20] Maruvada, S., Liu, Y., Pritchard, W., Herman, B., and Harris, G., 2012,“Comparative Study of Temperature Measurements in Ex Vivo Swine Muscleand a Tissue-Mimicking Material during High Intensity Focused UltrasoundExposures,” Phys. Med. Biol., 57(1), pp. 1–19.
[21] Kennedy, J. E., 2005, “High-Intensity Focused Ultrasound in the Treatment ofSolid Tumours,” Nat. Rev. Cancer, 5(4), pp. 321–327.
[22] Dasgupta, S., Wansapura, J., Hariharan, P., Pratt, R., Witte, D., Myers, M. R.,and Banerjee, R. K., 2010, “HIFU Lesion Volume as a Function of SonicationTime, as Determined by MRI, Histology, and Computations,” ASME J. Bio-mech. Eng., 132(8), p. 081005.
[23] Huang, J., Holt, R. G., Cleveland, R. O., and Roy, R. A., 2004, “ExperimentalValidation of a Tractable Numerical Model for Focused Ultrasound Heating inFlow-Through Tissue Phantoms,” J. Acoust. Soc. Am., 116(4), pp. 2451–2458.
[24] ter Haar, G., 2008, “Harnessing the Interaction of Ultrasound With Tissue forTherapeutic Benefit: High-Intensity Focused Ultrasound,” Ultrasound Obstet.Gynecol., 32(5), pp. 601–604.
[25] Dasgupta, S., Banerjee, R. K., Hariharan, P., and Myers, M. R., 2011, “BeamLocalization in HIFU Temperature Measurements Using Thermocouples, WithApplication to Cooling by Large Blood Vessels,” Ultrasonics, 51(2), pp.171–180.
[26] Luo, W., Zhou, X., Tian, X., Ren, X., Zheng, M., Gu, K., and He, G., 2006,“Enhancement of Ultrasound Contrast Agent in High-Intensity Focused Ultra-sound Ablation,” Adv. Ther., 23(6), pp. 861–868.
[27] Tung, Y.-S., Liu, H.-L., Wu, C.-C., Ju, K.-C., Chen, W.-S., and Lin, W.-L.,2006, “Contrast-Agent-Enhanced Ultrasound Thermal Ablation,” UltrasoundMed. Biol., 32(7), pp. 1103–1110.
[28] Yu, T., Wang, G., Hu, K., Ma, P., Bai, J., and Wang, Z., 2004, “A MicrobubbleAgent Improves the Therapeutic Efficiency of High Intensity Focused Ultra-sound: A Rabbit Kidney Study,” Urol. Res., 32(1), pp. 14–19.
[29] Tran, B. C., Jongbum, S., Hall, T. L., Fowlkes, J. B., and Cain, C. A., 2003,“Microbubble-Enhanced Cavitation for Noninvasive Ultrasound Surgery,”IEEE Trans. Ultrason. Ferroelectr. Freq. Control, 50(10), pp. 1296–1304.
[30] Quanyi, L., Liyuan, F., Yan, Q., Faqi, L., and Zhibiao, W., 2008, “Role ofAcoustic Interface Layer during High Intensity Focused UltrasoundTherapeutics,” J. Med. Coll. PLA, 23(4), pp. 223–227.
[31] Ho, V. H. B., Smith, M. J., and Slater, N. K. H., 2011, “Effect of MagnetiteNanoparticle Agglomerates on the Destruction of Tumor Spheroids Using HighIntensity Focused Ultrasound,” Ultrasound Med. Biol, 37(1), pp. 169–175.
[32] Sun, Y., Zheng, Y., Ran, H., Zhou, Y., Shen, H., Chen, Y., Chen, H., Krupka,T. M., Li, A., Li, P., Wang, Z., and Wang, Z., 2012, “SuperparamagneticPLGA-Iron Oxide Microcapsules for Dual-Modality US/MR Imaging and HighIntensity Focused US Breast Cancer Ablation,” Biomaterials, 33(24),pp. 5854–5864.
[33] Wang, X., Chen, H., Zheng, Y., Ma, M., Chen, Y., Zhang, K., Zeng, D., andShi, J., 2013, “Au-Nanoparticle Coated Mesoporous Silica Nanocapsule-BasedMultifunctional Platform for Ultrasound Mediated Imaging, Cytoclasis and Tu-mor Ablation,” Biomaterials, 34(8), pp. 2057–2068.
[34] Sapareto, S. A., and Dewey, W. C., 1984, “Thermal Dose Determination inCancer Therapy,” Int. J. Radiat. Oncol., Biol., Phys., 10(6), pp. 787–800.
[35] Morris, H., Rivens, I., Shaw, A., and Haar, G. T., 2008, “Investigation of theViscous Heating Artefact Arising from the Use of Thermocouples in a FocusedUltrasound Field,” Phys. Med. Biol., 53(17), pp. 4759–4776.
[36] Righetti, R., Kallel, F., Stafford, R. J., Price, R. E., Krouskop, T. A.,Hazle, J. D., and Ophir, J., 1999, “Elastographic Characterization ofHIFU-Induced Lesions in Canine Livers,” Ultrasound Med. Biol., 25(7),pp. 1099–1113.
[37] Dabek, L., Hornowski, T., J�ozefczak, A., and Skumiel, A., 2013, “UltrasonicProperties of Magnetic Nanoparticles with an Additional Biocompatible Dex-trane Layer,” Arch. Acoust., 38(1), pp. 93–98.
[38] Hariharan, P., Dibaji, S. A. R., Banerjee, R. K., Nagaraja, S., and Myers, M. R.,2014, “Evaluation of Targeting Accuracy in Focused-Ultrasound Procedures,Using Remote Thermocouple Arrays,” J. Acoust. Soc. Am. (submitted).
041003-8 / Vol. 4, NOVEMBER 2013 Transactions of the ASME
Downloaded From: http://nanoengineeringmedical.asmedigitalcollection.asme.org/ on 07/14/2014 Terms of Use: http://asme.org/terms