cimb-principal balanced income fund …€¦ · cimb-principal balanced income fund unaudited...
TRANSCRIPT

CIMB-PRINCIPAL BALANCED INCOME FUND UNAUDITED FINANCIAL STATEMENTS FOR THE SIX MONTHS FINANCIAL PERIOD ENDED 28 FEBRUARY 2018

CIMB-PRINCIPAL BALANCED INCOME FUND
CONTENTS PAGE(S)
INVESTORS' LETTER 1
MANAGER’S REPORT 2 - 8
Fund Objective and Policy
Performance Data
Market Review
Fund Performance
Portfolio Structure
Market Outlook
Investment Strategy
Unit Holdings Statistics
Soft Commissions and Rebates
STATEMENT BY MANAGER 9
TRUSTEE'S REPORT 10
UNAUDITED STATEMENT OF COMPREHENSIVE INCOME 11
UNAUDITED STATEMENT OF FINANCIAL POSITION 12
UNAUDITED STATEMENT OF CHANGES IN EQUITY 13
UNAUDITED STATEMENT OF CASH FLOWS 14
NOTES TO THE FINANCIAL STATEMENTS 15 - 44
DIRECTORY 45

CIMB-PRINCIPAL BALANCED INCOME FUND
1
INVESTORS' LETTER Dear Valued Investor, Thank you for your continued support and for the confidence that you have placed in us. We are pleased to share that CIMB-Principal Asset Management Berhad ("CIMB-Principal") Malaysia concluded the 1st Quarter of 2018 with RM52.06 billion in Asset under Management (“AUM”). Our AUM for Private Retirement Scheme ("PRS") business increased by 33% year-on-year to RM541 million as at 31 March 2018. We continue to achieve prestigious recognitions from The Edge | Thomson Reuters Lipper Fund Awards as follows: The Edge| Thomson Reuters Lipper Malaysia Fund Awards 2018
Best Fund Over 5 Years, Equity Global - Malaysia : CIMB-Principal Global Titans Fund
Best Fund Over 5 Years, Equity Asia Pacific ex Japan - Malaysia : CIMB-Principal Asian Equity Fund
Best Fund Over 5 Years, Equity Asia Pacific ex Japan - Malaysia : CIMB Islamic Asia Pacific Equity Fund
Best Fund Over 5 Years, Equity Malaysia Diversified - Malaysia : CIMB-Principal Equity Growth & Income Fund
Best Fund Over 5 Years, Mixed Asset MYR Bal - Malaysia : CIMB-Principal Income Plus Balance
Best Fund Over 3 Years, Equity Global - Malaysia : CIMB-Principal Global Titans Thomson Reuters Lipper Fund Award Global Islamic 2017
Best Equity Asia Pacific Ex-Japan (Islamic), Best Fund over 5 years : CIMB Islamic Asia Pacific Equity Fund
These prestigious awards are a celebration of the trust that you have placed in us and testament to our capability in bringing potential value to your financial goals and needs. CIMB-Principal was also awarded Fund House of the Year in Malaysia by AsianInvestor for the Asset Management Awards 2017, its second consecutive win and The Employees' Provident Fund ("EPF") External Portfolio Managers Awards 2017 for the Best Global Bond Portfolio Manager. These industry recognitions reflect our success in scaling up our investment capabilities while building a solid track record and earning the trust of our clients over time. Thank you. Yours faithfully, for CIMB-Principal Asset Management Berhad
Munirah Khairuddin Chief Executive Officer/Executive Director

CIMB-PRINCIPAL BALANCED INCOME FUND
2
MANAGER’S REPORT FUND OBJECTIVE AND POLICY What is the investment objective of the Fund? The investment objective of the Fund is to seek long-term growth in capital and income by investing in all types of investments. Has the fund achieved its objective? For the financial period under review, the Fund is in line with its stated objective. What are the fund investment policy and its strategy? The Fund aims to invest in a diversified portfolio of equities and fixed income investments. In line with the objective of the Fund, the investment policy and strategy of the Fund will be to maintain a balanced portfolio between equities and fixed income investments in the ratio of 60:40. The fixed income portion of the Fund is to provide some capital stability to the Fund whilst the equity portion will provide the added return in a rising market. The investments by the Fund in equity securities shall not exceed 60% of the Net Asset Value (“NAV”) of the Fund and investments in fixed income securities and liquid assets shall not be less than 40% of its NAV with a minimum credit rating of “BBB3” or “P2” by RAM Ratings (“RAM”) or equivalent rating by Malaysia Rating Corporation Berhad (“MARC”) or by local rating agency (ies) of the country of issuance or “BBB-” by S&P or equivalent rating by Moody’s or Fitch. The Fund may invest up to 40% of its NAV in Unrated Fixed Income Securities*. The fixed income portion will provide capital stability to the Fund whilst the equity portion will provide the added return in a rising market. The Fund may opt to seek investment exposure via Collective Investment Scheme that is in line with the Fund’s objective, subject to the requirement of the SC Guidelines. * With effective 1
st December 2017, the investment limit in Unrated Fixed Income Securities will be changed from 25% to
40%.
Fund category/type Balanced/Growth and Income How long should you invest for? Recommended 5 years or more Indication of short-term risk (low, moderate, high) Moderate When was the Fund launched? 10 August 1995 What was the size of the Fund as at 28 February 2018? RM242.90 million (322.97 million units) What is the fund’s benchmark? 60% Financial Times Stock Exchange (“FTSE”) Bursa Malaysia (“FBM”) Top100 (“FBM100”) Index + 40% CIMB Bank 1-Month Fixed Deposit Rate Note: The benchmark is customised as such to align it closer to the structure of the portfolio and the objective of the Fund. The 1-Month Fixed Deposit Rate is reflective of the objective to provide a steady stream of distribution. Thus, investors are cautioned that the risk profile of the Fund is higher than investing in fixed deposits.
What is the fund distribution policy? The Manager has the discretion to distribute part or all of the Fund’s distributable income. The distribution (if any) may vary from period to period depending on the investment objective and the performance of the Fund.
CIMB-PRINCIPAL BALANCED INCOME FUND
3
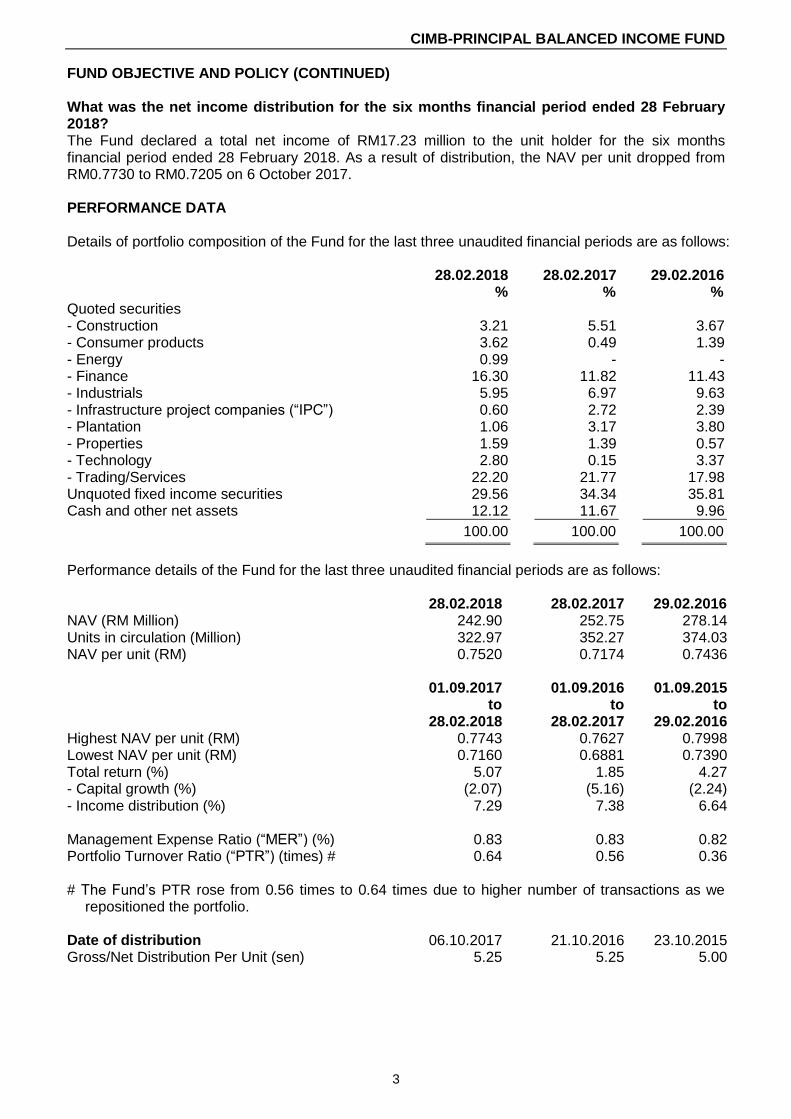
FUND OBJECTIVE AND POLICY (CONTINUED) What was the net income distribution for the six months financial period ended 28 February 2018? The Fund declared a total net income of RM17.23 million to the unit holder for the six months financial period ended 28 February 2018. As a result of distribution, the NAV per unit dropped from RM0.7730 to RM0.7205 on 6 October 2017. PERFORMANCE DATA Details of portfolio composition of the Fund for the last three unaudited financial periods are as follows: 28.02.2018 28.02.2017 29.02.2016 % % % Quoted securities - Construction 3.21 5.51 3.67 - Consumer products 3.62 0.49 1.39 - Energy 0.99 - - - Finance 16.30 11.82 11.43 - Industrials 5.95 6.97 9.63 - Infrastructure project companies (“IPC”) 0.60 2.72 2.39 - Plantation 1.06 3.17 3.80 - Properties 1.59 1.39 0.57 - Technology 2.80 0.15 3.37 - Trading/Services 22.20 21.77 17.98 Unquoted fixed income securities 29.56 34.34 35.81 Cash and other net assets 12.12 11.67 9.96
100.00 100.00 100.00
Performance details of the Fund for the last three unaudited financial periods are as follows: 28.02.2018 28.02.2017 29.02.2016 NAV (RM Million) 242.90 252.75 278.14 Units in circulation (Million) 322.97 352.27 374.03 NAV per unit (RM) 0.7520 0.7174 0.7436 01.09.2017
to 28.02.2018
01.09.2016 to
28.02.2017
01.09.2015 to
29.02.2016
Highest NAV per unit (RM) 0.7743 0.7627 0.7998 Lowest NAV per unit (RM) 0.7160 0.6881 0.7390 Total return (%) 5.07 1.85 4.27 - Capital growth (%) (2.07) (5.16) (2.24) - Income distribution (%) 7.29 7.38 6.64 Management Expense Ratio (“MER”) (%) 0.83 0.83 0.82 Portfolio Turnover Ratio (“PTR”) (times) # 0.64 0.56 0.36 # The Fund’s PTR rose from 0.56 times to 0.64 times due to higher number of transactions as we
repositioned the portfolio. Date of distribution 06.10.2017 21.10.2016 23.10.2015 Gross/Net Distribution Per Unit (sen) 5.25 5.25 5.00

CIMB-PRINCIPAL BALANCED INCOME FUND
4
PERFORMANCE DATA (CONTINUED)
28.02.2018
28.02.2017
29.02.2016 28.02.2015 28.02.2014
% % % % % Annual total return 12.46 3.61 (0.14) 0.22 13.04 (Launch date: 10 August 1995) Past performance is not necessarily indicative of future performance and that unit prices and investment returns may go down, as well as up. All performance figures have been extracted from Lipper.
MARKET REVIEW (1 SEPTEMBER 2017 TO 28 FEBRUARY 2018) Equities During the financial period under review, the FBM100 Index (the “Index”) rose 641.1 points or 5.2% to close at 12,922.76 points. The Index fell 92.41 points or 0.8% in September 2017 as foreign institutions sold RM0.7 billion. The Index continued to prove resilient in absorbing negative shocks despite the rise of external uncertainties during the period. In August 2017 inflation jumped to 3.7% from 3.2% in July 2017, pushed by the run-up in oil prices which saw the West Texas Intermediate closing up 9.4% at USD51.67 per barrel from USD47.23 per barrel a month earlier. As the higher inflation was cost-pushed, Bank Negara Malaysia (“BNM”) kept the Overnight Policy Rate (“OPR”) unchanged at 3.00%. Malaysian Ringgit (“MYR”) traded to a low of RM4.1875 during the month before closing the month at RM4.2205. In October 2017, the Index rose 43.87 points or 0.4% to 12,233.12 points, although we saw net foreign outflows of RM0.3 billion. Brent crude oil touched a high of USD61.37 per barrel on 31 October 2017, while the MYR closed at RM4.23. As expected, Budget 2018, tabled on 27 October 2017, was both expansionary and people-centric. Fiscal discipline was maintained as shown by a smaller deficit target of 2.8% for 2018 from 3.0% this year. In November 2017, the Index fell 163.6 points or 1.3% to 12,069.46 points. The third quarter of 2017 result season failed to re-rate the market. In addition to this, the Sime Darby Bhd demerger exercise failed to lift sentiments in the market. But the Index bounced back 4.5% in December 2017 to close the year at 12,614.2 points on the back of window dressing activities, driven by banking and technology stocks. January 2018 was another strong month as the Index jumped 3.6% on the back of a stronger Ringgit, higher oil prices, net foreign inflows, hike in OPR and overall stronger economies. In January 2018, foreign investors were net buyers of RM3.4 billion versus RM10.3 billion in the whole of 2017. Brent crude oil price closed at USD69.05 per barrel, while the Ringgit appreciated 3.8% to close at RM3.8985. However, February 2018 was a volatile month as investors began re-pricing more interest rate hikes in the United States, earlier than expected, on the back of higher inflation expectations. In line with the global rout, the Index corrected 140.4 points or 1.1% to 12,922.76 points. The Index had fallen sharply from a high of 13,071.7 points (February 2, 2018) to a low of 12,642.0 (February 6, 2018), before recouping most of its losses by month end. Consumer price inflation eased in January 2018 to 2.7% (3.5% y-o-y in December 2017) due to currency gains and a higher base, as fuel prices and electricity tariffs were raised a year ago. In February 2018, foreign investors net sold circa RM1.1 billion bringing year-to-date (“YTD”) net inflows to RM2.2 billion.

CIMB-PRINCIPAL BALANCED INCOME FUND
5
MARKET REVIEW (1 SEPTEMBER 2017 TO 28 FEBRUARY 2018) (CONTINUED) Fixed Income During the six months financial period under review, the sovereign yield curve steepened with the 3-year and 10-year spreads widened from 59 basis points (“bps”) to 65 bps. We saw the benchmark 3-year, 5-year 10-year, 15-year and 30-year Malaysian Government Securities (“MGS”) yields close at 3.41%, 3.74%, 4.06%, 4.45% and 4.86% respectively as of February 2018. The rise in yields across the MGS curve in February 2018 was in tandem with the rising global bond yields. However, buying interests appeared towards the end of the February 2018 amid a rebound in sentiment as the global bond sell-off appeared to have stalled and higher yield levels start to attract investors. In Budget 2018, the Government’s commitment to fiscal consolidation remains firm and aims to reduce the fiscal deficit to 2.8% of Gross Domestic Product (“GDP”) at RM39.79 billion in 2018 while maintaining 3.0% target for 2017. With an average Brent crude oil price forecast of USD52 per barrel, the Government projects its revenue to grow by 6.4% in 2018 to RM239.9 billion from a growth of 6.1% in 2017 with total expenditure easing slightly to 5.4% at RM279.7 billion in 2018 (versus 5.7% in 2017) on the back of a slowdown in development expenditure to 0.1% or RM46 billion in 2018 from 9.4% in 2017. The Government foresees the economy remains resilient in 2018, albeit at a moderate pace, with a real GDP growth of 5% to 5.5% in 2018 as compared with a 5.2% to 5.7% projected growth in 2017. Inflation is expected to moderate to 2.5% to 3.5% in 2018 from the 3.0% to 4.0% projected range for 2017. With a budget deficit of RM39.79 billion and sizeable maturity of Government bonds totalling RM66.8 billion, the gross MGS/Government Investment Issues (“GII”) supply in 2018 is estimated to be relatively stable at RM106.6 billion (2017: RM107.1 billion). We think overall the budget is supportive of Malaysia’s sovereign rating as the Government remains on course in its fiscal consolidation drive in 2017 and 2018. Malaysia real GDP growth moderates to 5.9% y-o-y for the fourth quarter of 2017 from 6.2% in the third quarter in 2017, implying full year 2017 growth of 5.9% (2016: 4.2%). The overall growth in the fourth quarter of 2017 was broad based, with stable private consumption (rising 7.0% versus 7.2% in the third quarter in 2017), increased in Government spending (+6.9% versus 3.9%) and net exports (+0.5% versus 0.2%) that helped offset the moderations in fixed asset investment (+4.3% versus 6.7%). Meanwhile, inflation rate slowed to 1.4% y-o-y in February 2018 from 2.7% in January 2018, the lowest rate in 16 months. The drop in inflation was mainly due to a decline in transportation costs during the month while food and beverage, and housing eased due to base effects. BNM raised the OPR by 25 bps to 3.25% on 25 January 2018, citing the steady growth path for the economy and as a pre-emptive move to prevent a build-up of risks that could arise from low interest rates for a prolonged period of time. BNM views that global growth will accelerate in 2018. It views that the global economy has continued to strengthen, with global trade performing at a sustained pace. On the domestic front, BNM expects the strong growth momentum to carry on into 2018, on the back of spillovers from the external sector to the domestic economy. On the price front, the Central Bank expects the inflation rate to moderate in 2018, on account of a reduced effect of global cost factors, while the stronger Ringgit would also translate to lower import prices. Foreign ownership in Malaysian securities declined in February 2018 with an outflow of RM3.9 billion. During the month, MGS, GII and discount instruments all reported outflow with only corporate bonds saw a marginal increase of RM0.7 billion net inflow from foreign investors. On a percentage basis, foreign ownership of MGS and GII dropped to 45.4% and 6.7% in February 2018 from January 2018’s levels of 45.7% and 7.0% respectively.

CIMB-PRINCIPAL BALANCED INCOME FUND
6
FUND PERFORMANCE
6 months to
28.02.2018 1 year to
28.02.2018 3 years to
28.02.2018 5 years to 28.02.2018
Since Inception to
28.02.2018
Income (%) 7.29 7.29 22.86 39.08 233.59 Capital (%) (2.07) 4.82 (5.29) (5.22) 41.96
Total Return (%) 5.07 12.46 16.36 31.82 373.51
Benchmark (%) 3.76 7.77 7.38 17.46 157.25 Average Total Return (%) N/A 12.46 5.18 5.68 7.13
The Fund rose by 5.07% during the financial period under review, while the benchmark was up by a narrower 3.76%. On a 3-year and 5-year basis, the Fund appreciated 16.36% and 31.82% respectively, outperforming the benchmark return in both financial periods.
Changes in Net Asset Value (“NAV”) 28.02.2018 28.02.2017 Changes %
NAV (RM million) 242.90 252.75 (3.90) NAV/Unit (RM) 0.7520 0.7174 4.82 NAV per unit rose by 4.82% in the financial period under review on better Fund performance but the NAV of the Fund fell by 3.90% due to net redemptions. Performance data represents the combined income and capital return as a result of holding units in the fund for the specified length of time, based on NAV to NAV price. The performance data assumes that all earnings from the fund are reinvested and are net of management and trustee fees. Past performance is not reflective of future performance and income distributions are not guaranteed. Unit prices and income distributions, if any, may fall and rise. All performance figures have been extracted from Lipper.
70%
110%
150%
190%
230%
270%
310%
350%
CIMB-Principal Balanced Income Fund
60% FBM100 Index + 40% CIMB Bank 1-Month Fixed Deposit Rate

CIMB-PRINCIPAL BALANCED INCOME FUND
7
PORTFOLIO STRUCTURE Asset allocation
(% of NAV) 28.02.2018 28.02.2017
Quoted securities 58.32 53.99
Unquoted fixed income securities 29.56 34.34
Cash and other net assets 12.12 11.67
TOTAL 100.00 100.00
Investment in unquoted fixed income securities reduced from 34.34% a year ago to 29.56%. On the contrary, investment in quoted securities rose from 53.99% to 58.32% as we were more bullish on the local equity market on the back of net inflow of foreign funds, expectations on earnings upgrades and news on Government Linked Companies (“GLC”) restructuring. MARKET OUTLOOK Equity
We remain optimistic on the Malaysian market. Market will remain volatile as investors monitor inflation expectations and watch global Central Banks dial back their balance sheets. While markets may correct, we are of the view that these corrections are not the start of a bear market. Fixed income After signaling a possible monetary policy normalisation in its Monetary Policy Committee (“MPC”) meeting in November 2017, BNM decided to raise its OPR by 25 bps to 3.25% on 25 January 2018 citing that it was a pre-emptive move to prevent the build-up of risks that could arise from low interest rates for a prolonged period of time. It also stated that at the current OPR level, the stance of monetary policy “remains accommodative”. We believe that BNM will pause for the rest of 2018 but we will re-assess the outlook in the second half of 2018 taking into consideration the 2018 first two quarters domestic GDP growth and core inflation. Net supply of Government bonds for the second quarter of 2018 is expected to be high with only one GII maturity of RM7.5 billion while the gross supply is estimated to be around RM29 billion. With the window for calling the general election narrowing, markets are likely to trade sideways as major local players will avoid taking on large positions and trading sentiment may slowly ebb. In the primary issuance space, the corporate bonds supply pipeline is expected to remain active with issuances primarily from the high grade segments. The influx of supply from primary issuances could pave way for higher adjusted yields. * This market outlook does not constitute an offer, invitation, commitment, advice or recommendation to make a purchase of
any investment. The information given in this article represents the views of CIMB-Principal or based on data obtained from sources believed to be reliable by CIMB-Principal. Whilst every care has been taken in preparing this, CIMB-Principal makes no guarantee, representation or warranty and is under no circumstances liable for any loss or damage caused by reliance on, any opinion, advice or statement made in this market outlook.

CIMB-PRINCIPAL BALANCED INCOME FUND
8
INVESTMENT STRATEGY Equity We will stay invested, but will continue to trim portfolio risk by reducing exposure to stocks which have risen exponentially. These include selective construction stocks, as well as some politically-linked names. We will rotate into more liquid large cap names to raise portfolio liquidity. We continue to like financials, tourism and industrials. We have also lowered our exposure to selective e-commerce/logistics names. Fixed income We continue to maintain overweight on corporate bonds relative to sovereign for a more stable and higher yield pick-up. We expect secondary demand to remain supported. We have a preference on AA- rated corporate bonds for better total return as we expect potentially less issuances relative to the GGs and AAA- rated in 2018 UNIT HOLDING STATISTICS Breakdown of unit holdings by size as at 28 February 2018 are as follows:
Size of holdings(units)
No. of unit holders No. of units held (million)
% of units held
5,000 and below 54,704 5.52 1.71
5,001-10,000 1,555 11.47 3.55
10,001-50,000 4,356 105.14 32.55
50,001-500,000 1,444 152.84 47.33
Above 500,000 24 48.00 14.86
Total 62,082 322.97 100.00
SOFT COMMISSIONS AND REBATES CIMB-Principal Asset Management Berhad (the "Manager") and the Trustee (including their officers) will not retain any form of rebate or soft commission from, or otherwise share in any commission with, any broker in consideration for directing dealings in the investments of the Funds unless the soft commission received is retained in the form of goods and services such as financial wire services and stock quotations system incidental to investment management of the Funds. All dealings with brokers are executed on best available terms. During the financial period under review, the Manager and the Trustee did not receive any rebates from the brokers or dealers but have retained soft commission in the form of goods and services such as financial wire services and stock quotations system incidental to investment management of the Funds.

CIMB-PRINCIPAL BALANCED INCOME FUND
9
STATEMENT BY MANAGER TO THE UNIT HOLDERS OF CIMB-PRINCIPAL BALANCED INCOME FUND We, being the Directors of CIMB-Principal Asset Management Berhad (the "Manager"), do hereby state that, in the opinion of the Manager, the accompanying unaudited financial statements set out on pages 11 to 43 are drawn up in accordance with the provisions of the Deeds and give a true and fair view of the financial position of the Fund as at 28 February 2018 of its financial performance, changes in equity and cash flows for the financial period then ended in accordance with Malaysian Financial Reporting Standards (“MFRS”) 134 - Interim Financial Reporting and International Accounting Standards ("IAS") 34 - Interim Financial Reporting. For and on behalf of the Manager CIMB-Principal Asset Management Berhad (Company No.: 304078-K) MUNIRAH KHAIRUDDIN ALEJANDRO ECHEGORRI Chief Executive Officer/Executive Director Executive Director Kuala Lumpur 16 April 2018

CIMB-PRINCIPAL BALANCED INCOME FUND
10
TRUSTEE’S REPORT TO THE UNIT HOLDERS OF CIMB-PRINCIPAL BALANCED INCOME FUND We have acted as the Trustee of CIMB-Principal Balanced Income Fund (the “Fund”) for the financial period ended 28 February 2018. To the best of our knowledge, CIMB-Principal Asset Management Berhad (the “Manager”), has operated and managed the Fund in accordance with the following: a) limitations imposed on the investment powers of the Manager and the Trustee under the Deed, the
Securities Commission’s Guidelines on Unit Trust Funds, the Capital Markets and Services Act 2007 and other applicable laws;
b) valuation/pricing for the Fund is carried out in accordance with the Deed of the Fund and any
regulatory requirements; and c) creation and cancellation of units for the Fund are carried out in accordance with the Deed of the
Fund and applicable regulatory requirements.
During the financial period, a total distribution of 5.25 sen per unit (gross) has been distributed to the unit holders of the Fund. We are of the view that the distribution is consistent with the objective of the Fund.
For and on behalf of the Trustee UNIVERSAL TRUSTEE (MALAYSIA) BERHAD ONG TEE VANN Chief Executive Officer Kuala Lumpur 16 April 2018

CIMB-PRINCIPAL BALANCED INCOME FUND
11
UNAUDITED STATEMENT OF COMPREHENSIVE INCOME FOR THE SIX MONTHS FINANCIAL PERIOD ENDED 28 FEBRUARY 2018
01.09.2017 to 28.02.2018
01.09.2016 to 28.02.2017
Note RM
RM
INVESTMENT INCOME Dividend income
1,924,290
1,944,052
Interest income 4 2,182,058
2,406,900 Net gain on financial assets at fair value through profit or loss 9 10,655,531
3,011,937
Net foreign exchange (loss)/gain
(85,052)
12,857
14,676,827
7,375,746
EXPENSES Management fee 5 1,835,234
1,920,142
Trustee’s and custodian fees 6 27,112
38,066
Audit fee
5,610
2,731 Tax agent’s fee
5,706
1,750
Transaction costs
444,497
592,006
Other expenses
179,066
196,789
2,497,225
2,751,484
PROFIT BEFORE TAXATION
12,179,602
4,624,262
Taxation 8 -
-
PROFIT AFTER TAXATION AND TOTAL COMPREHENSIVE INCOME FOR THE FINANCIAL PERIOD
12,179,602
4,624,262
Profit after taxation is made up as follows:
Realised amount
10,818,080
3,557,576
Unrealised amount
1,361,522
1,066,686
12,179,602
4,624,262
The accompanying notes to the financial statements form an integral part of the unaudited financial statements.

CIMB-PRINCIPAL BALANCED INCOME FUND
12
UNAUDITED STATEMENT OF FINANCIAL POSITION AS AT 28 FEBRUARY 2018 28.02.2018 31.08.2017
Audited Note RM RM
CURRENT ASSETS
Cash and cash equivalents 10 28,039,561
21,330,591
Financial assets at fair value through profit or loss 9 213,413,971
231,174,837
Amount due from stockbrokers
5,547,338
400,563
Amount due from Manager
64,182
17,064
Dividend receivable
61,261
97,692
TOTAL ASSETS
247,126,313
253,020,747
CURRENT LIABILITIES Amount due to stockbrokers
3,490,939
2,716,480
Amount due to Manager
405,066
795,905
Accrued management fee
280,408
319,021 Amount due to Trustee
4,171
8,008
Distribution payable 3,463 8,562
Other payables and accruals
45,239
56,913
TOTAL LIABILITIES
4,229,286
3,904,889
NET ASSET VALUE OF THE FUND
242,897,027
249,115,858
EQUITY Unit holders’ capital
153,627,165
154,791,278
Retained earnings
89,269,862
94,324,580
NET ASSETS ATTRIBUTABLE TO UNIT HOLDERS
242,897,027
249,115,858
NUMBER OF UNITS IN CIRCULATION (UNITS) 11 322,974,595
324,398,069
NET ASSET VALUE PER UNIT (RM)
0.7520
0.7679
The accompanying notes to the financial statements form an integral part of the unaudited financial statements.

CIMB-PRINCIPAL BALANCED INCOME FUND
13
UNAUDITED STATEMENT OF CHANGES IN EQUITY FOR THE SIX MONTHS FINANCIAL PERIOD ENDED 28 FEBRUARY 2018
Unit holders’ capital
Retained earnings
Total
Note RM RM RM
Balance as at 1 September 2017
154,791,278 94,324,580 249,115,858 Movement in unit holders’ contributions:
- Creation of units from applications
10,787,015 - 10,787,015
- Creation of units from distribution
16,857,612 - 16,857,612
- Cancellation of units
(28,808,740) - (28,808,740)
Total comprehensive income for the
financial period
- 12,179,602 12,179,602 Distribution 7 - (17,234,320) (17,234,320)
Balance as at 28 February 2018
153,627,165 89,269,862 242,897,027
Balance as at 1 September 2016
176,562,876 90,612,280 267,175,156 Movement in unit holders’ contributions:
- Creation of units from applications 2,853,674 - 2,853,674 - Creation of units from distribution 17,679,667 - 17,679,667
- Cancellation of units (21,376,259) - (21,376,259)
Total comprehensive income for the
financial period
- 4,624,262 4,624,262
Distribution 7 - (18,201,756) (18,201,756)
Balance as at 28 February 2017
175,719,958 77,034,786 252,754,744
The accompanying notes to the financial statements form an integral part of the unaudited financial statements.

CIMB-PRINCIPAL BALANCED INCOME FUND
14
UNAUDITED STATEMENT OF CASH FLOWS FOR THE SIX MONTHS FINANCIAL PERIOD ENDED 28 FEBRUARY 2018
01.09.2017 to 28.02.2018
01.09.2016 to 28.02.2017
RM
RM
CASH FLOWS FROM OPERATING ACTIVITIES Proceeds from disposal of quoted securities
80,575,823
107,002,744
Purchase of quoted securities
(71,026,432)
(104,556,312)
Proceeds from disposal of unquoted fixed income securities
85,295,914
42,975,058 Proceeds from redemption of unquoted fixed income
securities
6,012,044
21,034,767
Purchase of unquoted fixed income securities
(77,197,967)
(35,891,945)
Dividend income received
1,960,721
1,976,739 Interest income received from deposits with licensed
financial institutions 333,025 336,443 Interest income received from unquoted fixed income
securities
1,801,279
2,295,318
Management fee paid
(1,873,847)
(1,968,128)
Trustee’s and custodian fees paid
(30,949)
(38,625)
Payments for other fees and expenses
(202,056)
(205,139)
Net cash generated from operating activities
25,647,555
32,960,920
CASH FLOWS FROM FINANCING ACTIVITIES Cash proceeds from units created
10,739,897
2,898,574
Payments for cancellation of units
(29,199,579)
(21,686,326)
Distribution paid
(381,807)
(513,177)
Net cash used in financing activities
(18,841,489)
(19,300,929)
Net increase in cash and cash equivalents
6,806,066
13,659,991
Effects of foreign exchange differences
(97,096)
12,858 Cash and cash equivalents at the beginning of the financial
period
21,330,591
16,621,314
Cash and cash equivalents at the end of the financial period
28,039,561
30,294,163
Cash and cash equivalents comprised of: Bank balances
5,594,682
277,649 Deposits in licensed financial institutions
22,444,879
30,016,514
Cash and cash equivalents at the end of financial period
28,039,561
30,294,163
The accompanying notes to the financial statements form an integral part of the unaudited financial statements.

CIMB-PRINCIPAL BALANCED INCOME FUND
15
NOTES TO THE FINANCIAL STATEMENTS FOR THE SIX MONTHS FINANCIAL PERIOD ENDED 28 FEBRUARY 2018 1. THE FUND, THE MANAGER AND ITS PRINCIPAL ACTIVITY CIMB-Principal Balanced Income Fund (the “Fund”) is governed by a Principal Master Deed
dated 15 May 2008, a First Supplemental Master Deed dated 25 June 2008, a Supplemental Master Deed dated 14 July 2008 and an Eighteenth supplemental Master Deed dated 25 March 2015 (collectively referred to as the “Deeds”), between CIMB-Principal Asset Management Berhad (the “Manager”) and Universal Trustee (Malaysia) Berhad (the “Trustee”).
The Fund aims to invest in a diversified portfolio of equities and fixed income investments. In line with the objective of the Fund, the investment policy and strategy of the Fund will be to maintain a balanced portfolio between equities and fixed income investments in the ratio of 60:40. The fixed income portion of the Fund is to provide some capital stability to the Fund whilst the equity portion will provide the added return in a rising market. The investments by the Fund in equity securities shall not exceed 60% of the NAV of the Fund and investments in fixed income securities and liquid assets shall not be less than 40% of its NAV with a minimum credit rating of “BBB3” or “P2” by RAM or equivalent rating by MARC or by local rating agency(ies) of the country or “BBB” by S&P or equivalent rating by Moody‟s or Fitch. The Fund may invest up to 25% of its NAV in unrated fixed income securities. The fixed income portion will provide capital stability to the Fund whilst the equity portion will provide the added return in a rising market.
All investments will be subjected to the Securities Commission Malaysia (“SC”) Guidelines on Unit Trust Funds, SC requirements, the Deeds, except where exemptions or variations have been approved by the SC, internal policies and procedures and the Fund’s objective.
The Manager, a company incorporated in Malaysia, is a subsidiary of CIMB Group Sdn Bhd
and regards CIMB Group Holdings Berhad as its ultimate holding company. The Manager is also an associate of Principal International (Asia) Limited, which is a subsidiary of Principal Financial Group Inc. The principal activities of the Manager are the establishment and management of unit trust funds and fund management activities.
2. SUMMARY OF SIGNIFICANT ACCOUNTING POLICIES
The following accounting policies have been used consistently in dealing with items which are considered material in relation to the financial statements: (a) Basis of preparation
The financial statements have been prepared in accordance with the provisions of the MFRS and International Financial Reporting Standards (“IFRS”). The financial statements have been prepared under the historical cost convention, as modified by financial assets at fair value through profit or loss. The preparation of financial statements in conformity with MFRS and IFRS requires the use of certain critical accounting estimates and assumptions that affect the reported amounts of assets and liabilities and disclosure of contingent assets and liabilities at the date of the financial statements, and the reported amounts of revenue and expenses during the reported period. It also requires the Manager to exercise their judgment in the process of applying the Fund’s accounting policies. Although these estimates and judgment are based on the Manager’s best knowledge of current events and actions, actual results may differ.

CIMB-PRINCIPAL BALANCED INCOME FUND
16
2. SUMMARY OF SIGNIFICANT ACCOUNTING POLICIES (CONTINUED)
(a) Basis of preparation (continued)
The areas involving a higher degree of judgment or complexity, or areas where estimates and assumptions are significant to the financial statements are disclosed in Note 2(l).
Standards, amendments to published standards and interpretations to existing standards that are effective: The Fund has applied the following amendments for the first time for the financial year beginning 1 September 2017 :
Amendments to MFRS 107 ‘‘Statement of Cash Flows – Disclosure Initiative’’ introduce an additional disclosure on changes in liabilities arising from financing activities.
The adoption of these amendments did not have any impact on the current financial period or any prior period and is not likely to affect future periods.
The standards, amendments to published standards and interpretations to existing standards that are applicable to the Fund but not yet effective and have not been early adopted are as follows:
(i) Financial year beginning on/after 1 September 2018
MFRS 9 "Financial Instruments" (effective from 1 January 2018) will replace MFRS 139 "Financial Instruments: Recognition and Measurement". MFRS 9 retains but simplifies the mixed measurement model in MFRS 139 and establishes three primary measurement categories for financial assets: amortised cost, fair value through profit or loss and fair value through other comprehensive income (“OCI”). The basis of classification depends on the entity's business model and the contractual cash flow characteristics of the financial asset. Investments in equity instruments are always measured at fair value through profit or loss with an irrevocable option at inception to present changes in fair value in OCI (provided the instrument is not held for trading). A debt instrument is easured at amortised cost only if the entity is holding it to collect contractual cash flows and the cash flows represent principal and interest. For liabilities, the standard retains most of the MFRS 139 requirements. These include amortised cost accounting for most financial liabilities, with bifurcation of embedded derivatives. The main change is that, in cases where the fair value option is taken for financial liabilities, the part of a fair value change due to an entity’s own credit risk is recorded in OCI rather than the income statement, unless this creates an accounting mismatch. MFRS 9 introduces an expected credit loss (“ECL”) model on impairment that replaces the incurred loss impairment model used in MFRS 139. The expected credit loss model is forward-looking and eliminates the need for a trigger event to have occurred before credit losses are recognised.

CIMB-PRINCIPAL BALANCED INCOME FUND
17
2. SUMMARY OF SIGNIFICANT ACCOUNTING POLICIES (CONTINUED)
(a) Basis of preparation (continued)
(i) Financial year beginning on/after 1 September 2018 (continued)
The Fund has reviewed its financial assets and liabilities and is expecting the following impact from the adoption of the new standard on 1 January 2018:
There will be no impact on the Fund's accounting for financial assets as the Fund's equity investments currently measured at fair value through profit or loss will continue to be measured on the same basis under MFRS 9.
There will be no impact on the Fund's accounting for financial liabilities as the new requirements only affect the accounting for financial liabilities that are designated at fair value through profit or loss and the Fund does not have any such liabilities.
The new impairment model requires the recognition of impairment provisions based on ECL rather than only incurred credit losses as is the case under MFRS 139. It applies to financial assets classified at amortised cost. Based on the assessments undertaken to date, the Fund does not expect any loss allowance to be recognised upon adoption of MFRS 9.
(b) Financial assets and financial liabilities
Classification The Fund designates its investments in quoted securities and unquoted fixed income securities as financial assets at fair value through profit or loss at inception. Financial assets are designated at fair value through profit or loss when they are managed and their performance evaluated on a fair value basis. Loans and receivables are non-derivative financial assets with fixed or determinable payments that are not quoted in an active market and have been included in current assets. The Fund’s loans and receivables comprise cash and cash equivalents, amount due from stockbrokers, amount due from Manager and dividends receivable. Financial liabilities are classified according to the substance of the contractual arrangements entered into and the definitions of a financial liability. The Fund classifies amount due to stockbrokers, amount due to Manager, accrued management fee, amount due to Trustee, other payables and accruals, and distribution payable as other financial liabilities. Recognition and measurement Regular purchases and sales of financial assets are recognised on the trade-date, the date on which the Fund commits to purchase or sell the asset. Investments are initially recognised at fair value. Transaction costs are expensed in the statement of comprehensive income. Financial liabilities, within the scope of MFRS 139, are recognised in the statement of financial position when, and only when, the Fund becomes a party to the contractual provisions of the financial instrument.

CIMB-PRINCIPAL BALANCED INCOME FUND
18
2. SUMMARY OF SIGNIFICANT ACCOUNTING POLICIES (CONTINUED)
(b) Financial assets and financial liabilities (continued) Recognition and measurement (continued)
Financial assets are derecognised when the rights to receive cash flows from the investments have expired or have been transferred and the Fund has transferred substantially all risks and rewards of ownership. Financial liabilities are derecognised when it is extinguished, i.e. when the obligation specified in the contract is discharged or cancelled or expired.
Unrealised gains or losses arising from changes in the fair value of the financial assets at fair value through profit or loss are presented in the statement of comprehensive income within net gain or loss on financial assets at fair value through profit or loss in the financial period which they arise.
Dividend income from financial assets at fair value through profit or loss is recognised in the statement of comprehensive income as part of gross dividend income when the Fund’s right to receive payments is established. Quoted securities in Malaysia are valued at the last done market price quoted on Bursa Malaysia Securities Berhad (“Bursa Securities”) at the date of the statement of financial position.
If a valuation based on the market price does not represent the fair value of the securities, for example during abnormal market conditions or when no market price is available, including in the event of a suspension in the quotation of the securities for a period exceeding 14 days, or such shorter period as agreed by the Trustee, then the securities are valued as determined in good faith by the Manager, based on the methods or basis approved by the Trustee after appropriate technical consultation.
Unquoted fixed income securities denominated in Ringgit Malaysia (“RM”) are revalued on a daily basis based on fair value prices quoted by a Bond Pricing Agency (“BPA”) registered with the SC as per the SC Guidelines on Unit Trust Funds. Refer to Note 2(l) for further explanation. Deposits with licensed financial institutions are stated at cost plus accrued interest calculated on the effective interest method over the period from the date of placement to the date of maturity of the respective deposits. Loans and receivables and other financial liabilities are subsequently carried at amortised cost using the effective interest method. Impairment for assets carried at amortised costs For assets carried at amortised cost, the Fund assesses at the end of the reporting year whether there is objective evidence that a financial asset or group of financial assets is impaired. A financial asset or a group of financial assets is impaired and impairment losses are incurred only if there is objective evidence of impairment as a result of one or more events that occurred after the initial recognition of the asset (a ‘loss event’) and that loss event (or events) has an impact on the estimated future cash flows of the financial asset or group of financial assets that can be reliably estimated.

CIMB-PRINCIPAL BALANCED INCOME FUND
19
2. SUMMARY OF SIGNIFICANT ACCOUNTING POLICIES (CONTINUED)
(b) Financial assets and financial liabilities (continued) Impairment for assets carried at amortised costs (continued)
The amount of the loss is measured as the difference between the asset’s carrying amount and the present value of estimated future cash flows (excluding future credit losses that have not been incurred) discounted at the financial asset’s original effective interest rate. The asset’s carrying amount is reduced and the amount of the loss is recognised in statement of comprehensive income. If ‘loans and receivables’ has a variable interest rate, the discount rate for measuring any impairment loss is the current effective interest rate determined under the contract. As a practical expedient, the Fund may measure impairment on the basis of an instrument’s fair value using an observable market price. If, in a subsequent financial period, the amount of the impairment loss decreases and the decrease can be related objectively to an event occurring after the impairment was recognised (such as an improvement in the debtor’s credit rating), the reversal of the previously recognised impairment loss is recognised in statement of comprehensive income. When an asset is uncollectible, it is written off against the related allowance account. Such assets are written off after all the necessary procedures have been completed and the amount of the loss has been determined.
(c) Foreign currency
Functional and presentation currency
Items included in the financial statements of the Fund are measured using the currency of the primary economic environment in which the Fund operates (the “functional currency”). The financial statements are presented in RM, which is the Fund’s functional and presentation currency. Due to mixed factors in determining the functional currency of the Fund, the Manager has used its judgement to determine the functional currency that most faithfully represents the economic effects of the underlying transactions, events and conditions and have determined the functional currency to be in RM primarily due to the following factors: i) The Fund's units are denominated in RM. ii) Significant portion of the Fund’s expenses are denominated in RM. Transactions and balances Foreign currency transactions are translated into the functional currency using the exchange rates prevailing at the dates of the transactions or valuation where items are remeasured. Foreign exchange gains and losses resulting from the settlement of such transactions and from the translation at financial year-end exchange rates of monetary assets and liabilities denominated in foreign currencies are recognised in statement of comprehensive income.

CIMB-PRINCIPAL BALANCED INCOME FUND
20
2. SUMMARY OF SIGNIFICANT ACCOUNTING POLICIES (CONTINUED)
(d) Income recognition
Dividend income is recognised on the ex-dividend date when the right to receive payment is established.
Interest income from deposits with licensed financial institutions and unquoted fixed
income securities are recognised on a time proportionate basis using effective interest rate method on an accrual basis.
Realised gain or loss on disposal of quoted securities is accounted for as the difference
between the net disposal proceeds and the carrying amount of quoted securities, determined on a weighted average cost basis.
Realised gain or loss on disposal of unquoted fixed income securities is accounted for
as the difference between the net disposal proceeds and the carrying amount of unquoted fixed income securities, determined on cost adjusted for accretion of discount or amortisation of premium.
(e) Cash and cash equivalents
For the purpose of statement of cash flows, cash and cash equivalents comprise bank balances and deposits held in highly liquid investments that are readily convertible to known amounts of cash and which are subject to an insignificant risk of changes in value.
(f) Amount due from/to stockbrokers
Amounts due from and amount due to stockbrokers represent receivables for investments sold and payables for investments purchased that have been contracted for but not yet settled or delivered on the statement of financial position date respectively. These amounts are recognised initially at fair value and subsequently measured at amortised cost using the effective interest rate method, less provision for impairment for amounts due from stockbrokers. A provision for impairment of amounts due from stockbrokers is established when there is objective evidence that the Fund will not be able to collect all amounts due from the relevant stockbroker. Significant financial difficulties of the stockbroker, probability that the stockbroker will enter bankruptcy or financial reorganisation, and default in payments are considered indicators that the amount due from stockbrokers is impaired. Once a financial asset or a group of similar financial assets has been written down as a result of an impairment loss, interest rate income is recognised using the rate of interest rate used to discount the future cash flows for the purpose of measuring the impairment loss.
(g) Taxation Current tax expense is determined according to Malaysian tax laws at the current rate
based upon the taxable profit earned during the financial period. Tax on dividend income from foreign quoted securities and interest income from foreign
unquoted fixed income securities is based on the tax regime of the respective countries that the Fund invests in.
(h) Distribution A distribution to the Fund’s unit holders is accounted for as a deduction from realised
reserve. A proposed distribution is recognised as a liability in the financial year in which it is approved by the Trustee.

CIMB-PRINCIPAL BALANCED INCOME FUND
21
2. SUMMARY OF SIGNIFICANT ACCOUNTING POLICIES (CONTINUED)
(i) Transaction costs Transaction costs are costs incurred to acquire or dispose financial assets or liabilities at
fair value through profit or loss. They include fees and commissions paid to agents, advisors, brokers and dealers. Transaction costs, when incurred, are immediately recognised in the statement of comprehensive income as expenses.
(j) Unit holders’ capital
The unit holders’ contributions to the Fund meet the criteria to be classified as equity instruments under MFRS 132 “Financial Instruments: Presentation”. Those criteria include:
the units entitle the holder to a proportionate share of the Fund’s NAV;
the units are the most subordinated class and class features are identical;
there is no contractual obligations to deliver cash or another financial asset other than the obligation on the Fund to repurchase; and
the total expected cash flows from the units over its life are based substantially on the profit or loss of the Fund.
The outstanding units are carried at the redemption amount that is payable at each
financial year if unit holder exercises the right to put the unit back to the Fund. Units are created and cancelled at prices based on the Fund’s NAV per unit at the time
of creation or cancellation. The Fund’s NAV per unit is calculated by dividing the net assets attributable to unit holders with the total number of outstanding units.
(k) Segment information Operating segments are reported in a manner consistent with the internal reporting used
by the chief operating decision-maker. The chief operating decision-maker is responsible for allocating resources and assessing performance of the operating segments.
(l) Critical accounting estimates and judgments in applying accounting policies
The Fund makes estimates and assumptions concerning the future. The resulting accounting estimates will, by definition, rarely equal the related actual results. To enhance the information content of the estimates, certain key variables that are anticipated to have material impact to the Fund’s results and financial position are tested for sensitivity to changes in the underlying parameters. Estimates and judgment are continually evaluated by the Manager and are based on historical experience and other factors, including expectations of future events that are believed to be reasonable under the circumstances. Estimate of fair value of unquoted fixed income securities In undertaking any of the Fund’s investment, the Manager will ensure that all assets of the Fund under management will be valued appropriately, that is at fair value and in compliance with the SC Guidelines on Unit Trust Funds. Ringgit-denominated unquoted fixed income securities are valued using fair value prices quoted by a BPA. Where the Manager is of the view that the price quoted by BPA for a specific unquoted fixed income securities differs from the market price by more than 20 bps, the Manager may use market price, provided that the Manager records its basis for using a non-BPA price, obtains necessary internal approvals to use the non-BPA price, and keeps an audit trail of all decisions and basis for adopting the use of non-BPA price.

CIMB-PRINCIPAL BALANCED INCOME FUND
22
3. RISK MANAGEMENT OBJECTIVES AND POLICIES The investment objective of the Fund is to seek long-term growth in capital and income by investing in all types of investments.
The Fund is exposed to a variety of risks which include market risk (inclusive of price risk,
interest rate risk and currency risk), credit risk and liquidity risk. Financial risk management is carried out through internal control process adopted by the
Manager and adherence to the investment restrictions as stipulated in the Deeds and SC Guidelines on Unit Trust Funds. (a) Market risk
(i) Price risk Price risk is the risk that the fair value of an investment in quoted securities and unquoted fixed income securities will fluctuate because of changes in market prices (other than those arising from interest rate risk and currency risk). The value of investments may fluctuate according to the activities of individual companies, sector and overall political and economic conditions. Such fluctuation may cause the Fund's NAV and prices of units to fall as well as rise, and income produced by the Fund may also fluctuate. The price risk is managed through diversification and selection of quoted securities and unquoted fixed income securities and other financial instruments within specific limits according to the Deeds.
(ii) Interest rate risk
In general, when interest rates rise, unquoted fixed income securities prices will tend to fall and vice versa. Therefore, the NAV of the Fund may also tend to fall when interest rates rise or are expected to rise. However, investors should be aware that should the Fund holds an unquoted fixed income securities till maturity, such price fluctuations would dissipate as it approaches maturity, and thus the growth of the NAV shall not be affected at maturity. In order to mitigate interest rates exposure of the Fund, the Manager will manage the duration of the portfolio via shorter or longer tenured assets depending on the view of the future interest rate trend of the Manager, which is based on its continuous fundamental research and analysis. Investors should note that the movement in prices of unquoted fixed income securities and money market instruments are benchmarked against interest rates. As such, the investments are exposed to the movement of the interest rates. This risk is crucial since unquoted fixed income securities portfolio management depends on forecasting interest rate movements. Prices of unquoted fixed income securities move inversely to interest rate movements, therefore as interest rates rise, the prices of unquoted fixed income securities decrease and vice versa. Furthermore, unquoted fixed income securities with longer maturity and lower yield coupon rates are more susceptible to interest rate movements. Such investments may be subject to unanticipated rise in interest rates which may impair the ability of the issuers to make payments of interest income and principal, especially if the issuers are highly leveraged. An increase in interest rates may therefore increase the potential for default by an issuer.

CIMB-PRINCIPAL BALANCED INCOME FUND
23
3. RISK MANAGEMENT OBJECTIVES AND POLICIES (CONTINUED)
(a) Market risk (continued)
(ii) Interest rate risk (continued) The Fund’s exposure to interest rates associated with deposits with licensed financial institutions is not material as the deposits are held on short-term basis.
(iii) Currency risk Currency risk is associated with investments that are quoted and/or priced in foreign currency denomination. Foreign currency risk is the risk that the value of financial instruments will fluctuate due to changes in foreign exchange rates. The Manager will evaluate the likely directions of a foreign currency versus RM based on considerations of economic fundamentals such as interest rate differentials, balance of payments position, debt levels, and technical chart considerations.
(b) Credit risk Credit risk refers to the risk that a counter party will default on its contractual obligation resulting in financial loss to the Fund. Investment in unquoted fixed income securities may involve a certain degree of credit/default risk with regards to the issuers. Generally, credit risk or default risk is the risk of loss due to the issuer’s non-payment or untimely payment of the investment amount as well as the returns on investment. This will cause a decline in value of the defaulted unquoted fixed income securities and subsequently depress the NAV of the Fund. Usually credit risk is more apparent for an investment with a longer tenure, i.e. the longer the duration, the higher the credit risk. Credit risk can be managed by performing continuous fundamental credit research and analysis to ascertain the creditworthiness of its issuer. In addition, the Manager imposes a minimum rating requirement as rated by either local and/or foreign rating agencies and manages the duration of the investment in accordance with the objective of the Fund. For this Fund, the investments in unquoted fixed income securities must satisfy a minimum credit rating requirement of at least “BBB3” or “P2” by RAM or equivalent rating by MARC or by local rating agency(ies) of the country or “BBB” by S&P or equivalent rating by Moody‟s or Fitch. The credit risk arising from placements of deposits in licensed financial institutions is managed by ensuring that the Fund will only place deposits in reputable licensed financial institutions. For amount due from Manager, the settlement terms of the proceeds from the creation of units receivable from the Manager are governed by the SC Guidelines on Unit Trust Funds. For amount due from stockbrokers, the settlement terms are governed by the relevant rules and regulations as prescribed by respective stock exchange. The credit risk is minimal as all transactions in unquoted fixed income securities are settled/paid upon delivery using approved brokers.

CIMB-PRINCIPAL BALANCED INCOME FUND
24
3. FINANCIAL INSTRUMENTS AND RISK MANAGEMENT OBJECTIVES AND POLICIES (CONTINUED)
(c) Liquidity risk
Liquidity risk is the risk that the Fund will encounter difficulty in meeting its financial obligations.
The Manager manages this risk by maintaining sufficient level of liquid assets to meet anticipated payments and cancellations of the units by unit holders. Liquid assets comprise bank balance, deposits with licensed financial institutions and other instruments, which are capable of being converted into cash within 7 business days. Generally, all investments are subject to a certain degree of liquidity risk depending on the nature of the investment instruments, market, sector and other factors. For the purpose of the Fund, the Manager will attempt to balance the entire portfolio by investing in a mix of assets with satisfactory trading volume and those that occasionally could encounter poor liquidity. This is expected to reduce the risks for the entire portfolio without limiting the Fund’s growth potentials.
(d) Capital risk management
The capital of the fund is represented by equity consisting of unit holders’ capital of RM153,627,165 (31.08.2017: RM154,791,278) and retained earnings of RM89,269,862 (31.08.2017: RM94,324,580). The amount of capital can change significantly on a daily basis as the Fund is subject to daily subscriptions and redemptions at the discretion of unit holders. The Fund’s objective when managing capital is to safeguard the Fund’s ability to continue as a going concern in order to provide returns to unit holders and benefits for other stakeholders and to maintain a strong capital base to support the development of the investment activities of the Fund.
(e) Fair value estimation
Fair value is defined as the price that would be received to sell an asset or paid to transfer a liability in an orderly transaction between market participants at the measurement date (i.e. an exit price). The fair value of financial assets traded in active markets (such as trading securities) is based on quoted market prices at the close of trading on the financial year end date. The Fund utilises the last traded market price for financial assets where the last traded price falls within the bid-ask spread. In circumstances where the last traded market price is not within the bid-ask spread, the Manager will determine the point within the bid-ask spread that is most representative of the fair value. An active market is a market in which transactions for the asset or liability take place with sufficient frequency and volume to provide pricing information on an ongoing basis. The fair value of financial assets that are not traded in an active market is determined by using valuation techniques.

CIMB-PRINCIPAL BALANCED INCOME FUND
25
3. FINANCIAL INSTRUMENTS AND RISK MANAGEMENT OBJECTIVES AND POLICIES (CONTINUED) (e) Fair value estimation (continued)
(i) Fair value hierarchy
The table below analyses financial instruments carried at fair value. The different levels have been defined as follows:
Quoted prices (unadjusted) in active market for identical assets or liabilities (Level 1)
Inputs other than quoted prices included within Level 1 that are observable for the asset or liability, either directly (that is, as prices) or indirectly (that is, derived from prices) (Level 2)
Inputs for the asset and liability that are not based on observable market data (that is, unobservable inputs) (Level 3)
The level in the fair value hierarchy within which the fair value measurement is categorised in its entirety is determined on the basis of the lowest level input that is significant to the fair value measurement in its entirety. For this purpose, the significance of an input is assessed against the fair value measurement in its entirety.
If a fair value measurement uses observable inputs that require significant adjustment based on unobservable inputs, that measurement is a Level 3 measurement.
Assessing the significance of a particular input to the fair value measurement in its entirety requires judgment, considering factors specific to the asset or liability.
The determination of what constitutes ‘observable’ requires significant judgment by the Fund. The Fund considers observable data to be that market data that is readily available, regularly distributed or updated, reliable and verifiable, not proprietary, and provided by independent sources that are actively involved in the relevant market.
Level 1 Level 2 Level 3 Total
RM RM RM RM
28.02.2018 Financial assets at fair value through profit or
loss:
- Quoted securities 141,653,263
-
-
141,653,263 - Unquoted fixed
income securities -
71,760,708
-
71,760,708
141,653,263 71,760,708 - 213,413,971

CIMB-PRINCIPAL BALANCED INCOME FUND
26
3. FINANCIAL INSTRUMENTS AND RISK MANAGEMENT OBJECTIVES AND POLICIES (CONTINUED) (d) Fair value estimation (continued)
(i) Fair value hierarchy (continued)
Level 1 Level 2 Level 3 Total
RM RM RM RM
31.08.2017
Audited Financial assets at fair value through profit or
loss:
- Quoted securities 145,187,271
-
-
145,187,271
- Unquoted fixed income securities -
85,987,566
-
85,987,566
145,187,271 85,987,566 - 231,174,837
Investments whose values are based on quoted market prices in active markets, and are therefore classified within Level 1, include active listed equities. The Fund does not adjust the quoted prices for these instruments. The Fund’s policies on valuation of these financial assets are stated in Note 2(b). Financial instruments that trade in markets that are not considered to be active but are valued based on quoted market prices, dealer quotations or alternative pricing sources supported by observable inputs are classified within Level 2. These include unquoted fixed income securities. As Level 2 instruments include positions that are not traded in active markets and/or are subject to transfer restrictions, valuations may be adjusted to reflect illiquidity and/or non-transferability, which are generally based on available market information. The Fund’s policies on valuation of these financial assets are stated in Note 2(b).
(ii) The carrying values of cash and cash equivalents, amount due from Manager,
amount due from stockbrokers, dividends receivable and all current liabilities are a reasonable approximation of their fair values due to their short term nature.
4. INTEREST INCOME
01.09.2017
to 28.02.2018 01.09.2016
to 28.02.2017
RM RM
Interest income from unquoted fixed income securities 1,849,033 2,070,456 Interest income from deposits with licensed financial institutions 333,025 336,444
2,182,058 2,406,900
CIMB-PRINCIPAL BALANCED INCOME FUND
27
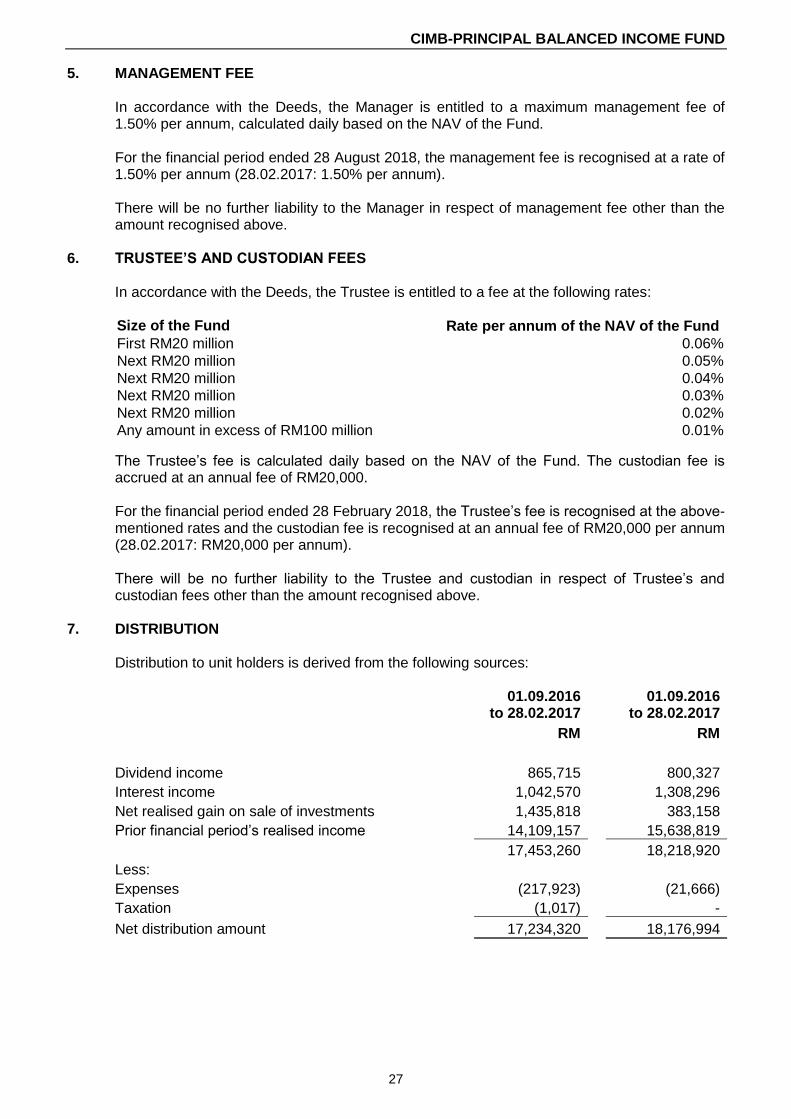
5. MANAGEMENT FEE
In accordance with the Deeds, the Manager is entitled to a maximum management fee of 1.50% per annum, calculated daily based on the NAV of the Fund.
For the financial period ended 28 August 2018, the management fee is recognised at a rate of 1.50% per annum (28.02.2017: 1.50% per annum).
There will be no further liability to the Manager in respect of management fee other than the amount recognised above.
6. TRUSTEE’S AND CUSTODIAN FEES
In accordance with the Deeds, the Trustee is entitled to a fee at the following rates: Size of the Fund Rate per annum of the NAV of the Fund
First RM20 million 0.06%
Next RM20 million 0.05%
Next RM20 million 0.04%
Next RM20 million 0.03%
Next RM20 million 0.02%
Any amount in excess of RM100 million 0.01%
The Trustee’s fee is calculated daily based on the NAV of the Fund. The custodian fee is accrued at an annual fee of RM20,000. For the financial period ended 28 February 2018, the Trustee’s fee is recognised at the above-mentioned rates and the custodian fee is recognised at an annual fee of RM20,000 per annum (28.02.2017: RM20,000 per annum). There will be no further liability to the Trustee and custodian in respect of Trustee’s and custodian fees other than the amount recognised above.
7. DISTRIBUTION Distribution to unit holders is derived from the following sources:
01.09.2016
to 28.02.2017 01.09.2016
to 28.02.2017
RM RM
Dividend income 865,715 800,327
Interest income 1,042,570 1,308,296
Net realised gain on sale of investments 1,435,818 383,158
Prior financial period’s realised income 14,109,157 15,638,819
17,453,260 18,218,920
Less:
Expenses (217,923) (21,666)
Taxation (1,017) -
Net distribution amount 17,234,320 18,176,994

CIMB-PRINCIPAL BALANCED INCOME FUND
28
7. DISTRIBUTION (CONTINUED)
01.09.2016
to 28.02.2017 01.09.2016
to 28.02.2017
Distribution on 6 October 2017
Gross distribution per unit (sen) 5.25 -
Net distribution per unit (sen) 5.25 -
Distribution on 21 October 2016
Gross distribution per unit (sen) - 5.25
Net distribution per unit (sen) - 5.25
Gross distribution is derived using total income less total expenses. Net distribution above is
sourced from current financial year’s realised income. Gross distribution per unit is derived from gross realised income less expenses, divided by the
number of units in circulation. Net distribution for unit is derived from gross realised income less expenses and taxation, divided by the number of units in circulation.
8. TAXATION
01.09.2017 to 28.02.2018
01.09.2016 to 28.02.2017
RM RM
Tax charged for the financial period:
- Over provision in prior financial period - -
A numerical reconciliation between the profit before taxation multiplied by the Malaysian statutory income tax rate and tax expense of the Fund is as follows:
01.09.2017
to 28.02.2018 01.09.2016
to 28.02.2017
RM RM
Profit before taxation 12,179,602 4,626,117
Taxation at Malaysian statutory rate of 24% (28.02.2017: 24%) 2,923,104 1,110,268
Tax effects of:
Investment income not subject to tax (3,522,438) (1,770,179)
Expenses not deductible for tax purposes 123,482 170,595 Restriction on tax deductible expenses for Unit Trust Funds 475,852 489,316
Taxation - -

CIMB-PRINCIPAL BALANCED INCOME FUND
29
9. FINANCIAL ASSETS AT FAIR VALUE THROUGH PROFIT OR LOSS
28.02.2018
31.08.2017 Audited
RM RM
Designated at fair value through profit or loss at inception: - Quoted securities - local 137,941,992 145,077,514 - Quoted securities - foreign 3,711,271 109,757 - Unquoted fixed income securities 71,760,708 85,987,566
213,413,971 231,174,837
01.09.2017 to 28.02.2018
01.09.2016 to 28.02.2017
RM RM Net gain on financial assets at fair value through profit
or loss: - Realised gain on disposals 8,238,760 1,951,576 - Unrealised fair value gain 2,416,771 1,060,361
10,655,531 3,011,937
Aggregate
Market
Percentage
Name of counter Quantity
cost
value
of NAV
Units
RM
RM
%
28.02.2018
QUOTED SECURITIES - LOCAL
Construction
Gamuda Bhd 153,100 753,459 759,376 0.31
IJM Corporation Bhd 916,000 2,760,250 2,491,520 1.03 Kerjaya Prospek Group
Bhd 140,080 161,342 221,326 0.09 Kerjaya Prospek Group
Bhd - Warrant 28,020 - - - Muhibbah Engineering
M Bhd 738,700 1,925,432 2,289,970 0.94 Sunway Construction
Group Bhd 401,000 878,250 962,400 0.4
WCT Holdings Bhd 687,967 1,588,778 1,059,470 0.44
3,064,867 8,067,511 7,784,062 3.21
Consumer Products Fraser & Neave
Holdings Bhd 121,400 3,644,144 3,714,840 1.53
Oldtown Bhd 587,500 1,516,930 1,856,500 0.76
Padini Holdings Bhd 247,200 1,265,561 1,226,112 0.5 UMW Holdings Bhd 122,800 701,188 798,201 0.33
1,078,900 7,127,823 7,595,653 3.12

CIMB-PRINCIPAL BALANCED INCOME FUND
30
9. FINANCIAL ASSETS AT FAIR VALUE THROUGH PROFIT OR LOSS (CONTINUED)
Aggregate Market Percentage
Name of counter Quantity cost value of NAV
Units RM RM %
28.02.2018 (CONTINUED)
QUOTED SECURITIES - LOCAL (CONTINUED)
Finance Alliance Bank Malaysia
Bhd 474,300 1,898,995 1,954,116 0.80 CIMB Group Holdings
Bhd 1,713,368 9,621,500 12,319,116 5.07
Hong Leong Bank Bhd 165,100 2,312,544 3,305,302 1.36
Malayan Banking Bhd 1,492,331 13,052,272 15,609,782 6.43
Public Bank Bhd 274,230 5,551,840 6,307,290 2.60
RHB Capital Bhd 289,700 - - -
4,409,029 32,437,151 39,495,606 16.26
Industrials
Heveaboard Bhd 654,400 1,062,252 602,048 0.25 Petronas Chemicals
Group Bhd 815,600 5,830,703 6,598,204 2.72 Thong Guan Industries
Bhd 196,200 850,047 608,220 0.25
Top Glove Corp Bhd 366,600 2,771,057 3,559,686 1.47
V.S. Industry Bhd 1,034,900 3,151,046 3,063,304 1.26
3,067,700 13,665,105 14,431,462 5.95
IPC
Time dotCom Bhd 175,300 1,017,477 1,463,755 0.60
Plantations IOI Corporation Bhd 550,300 2,532,521 2,580,907 1.06
Properties
LBS Bina Group Bhd 1,128,560 930,927 1,151,131 0.47 LBS Bina Group Bhd -
PA 160,140 176,154 179,357 0.07 Malaysian Resources
Corporation Bhd 1,561,600 1,802,308 1,686,528 0.69
SP Setia Bhd 187,754 579,786 636,486 0.26
SP Setia Bhd - PS 221,280 221,280 232,344 0.10
3,259,334 3,710,455 3,885,846 1.59
Technology Binasat
Communications Bhd 1,842,700 1,071,169 902,923 0.37 Globetronics
Technology Bhd 177,800 1,179,549 1,102,360 0.45 Inari Amertron Bhd 712,900 2,084,313 2,409,602 0.99 Pentamaster
Corporation Bhd 957,792 1,558,189 2,394,480 0.99
3,691,192 5,893,220 6,809,365 2.80

CIMB-PRINCIPAL BALANCED INCOME FUND
31
9. FINANCIAL ASSETS AT FAIR VALUE THROUGH PROFIT OR LOSS (CONTINUED)
Aggregate Market Percentage
Name of counter Quantity cost value of NAV
Units RM RM %
28.02.2018 (CONTINUED)
QUOTED SECURITIES - LOCAL (CONTINUED)
Trading/Services
Airasia Bhd 873,800 2,988,075 3,827,244 1.58
Axiata Group Bhd 894,872 4,754,035 4,832,309 1.99
Bermaz Auto Bhd 1,621,000 3,545,444 3,452,730 1.42 Dialog Group Bhd 442,200 824,359 1,171,830 0.48
Genting Bhd 669,300 6,038,812 5,923,305 2.44
Genting Malaysia Bhd 688,800 3,713,351 3,629,976 1.49
IHH Healthcare Bhd 348,500 2,049,916 2,059,635 0.85 Malaysia Airports
Holdings Bhd 264,500 1,830,885 2,301,150 0.95
MISC Bhd 189,700 1,533,786 1,301,342 0.54
My Eg Services Bhd 488,300 1,207,597 1,313,527 0.54 Only World Group
Holdings Bhd 1,067,600 1,206,388 1,398,556 0.58
Sime Darby Bhd 686,300 1,427,968 1,894,188 0.78 Telekom Malaysia Bhd 397,743 2,624,884 2,346,684 0.97
Tenaga Nasional Bhd 801,300 10,923,144 12,580,410 5.18
YINSON Holdings Bhd 1,379,400 4,195,255 5,862,450 2.41
10,813,315 48,863,899 53,895,336 22.20
TOTAL QUOTED SECURITIES - LOCAL 30,109,937 123,315,162 137,941,992 56.79
QUOTED SECURITIES
- FOREIGN INDONESIA
Finance PT Bank CIMB Niaga
TBK 247,570 38,294 97,095 0.04
TOTAL INDONESIA 247,570 38,294 97,095 0.04
SINGAPORE
Energy
Keppel Corporation Ltd 101,600 2,407,077 2,411,332 0.99
TOTAL SINGAPORE 101,600 2,407,077 2,411,332 0.99

CIMB-PRINCIPAL BALANCED INCOME FUND
32
9. FINANCIAL ASSETS AT FAIR VALUE THROUGH PROFIT OR LOSS (CONTINUED)
Aggregate Market Percentage
Name of counter Quantity cost value of NAV
Units RM RM %
28.02.2018 (CONTINUED)
QUOTED SECURITIES - FOREIGN (CONTINUED)
THAILAND
Consumer Products Central Plaza Hotel PCL
– NVDR* 188,500 1,200,924 1,202,844 0.50
TOTAL THAILAND 188,500 1,200,924 1,202,844 0.50
TOTAL QUOTED SECURITIES – FOREIGN 537,670 3,646,295 3,711,271 1.53
TOTAL QUOTED SECURITIES 30,647,607 126,961,457 141,653,263 58.32
ACCUMULATED UNREALISED GAIN ON QUOTED SECURITIES ASSETS AT FAIR VALUE THROUGH PROFIT OR LOSS 14,691,806
TOTAL QUOTED SECURITIES AT FAIR VALUE THROUGH PROFIT OR LOSS 141,653,263

CIMB-PRINCIPAL BALANCED INCOME FUND
33
9. FINANCIAL ASSETS AT FAIR VALUE THROUGH PROFIT OR LOSS (CONTINUED)
Name of issuer Nominal
value Aggregate
cost Market
value Percentage
of NAV RM RM RM % 28.02.2017
(CONTINUED)
UNQUOTED FIXED
INCOME SECURITIES
Al Dzahab Assets Bhd 5.00% 21.06.2019
2,000,000
2,018,800
2,033,838 0.84
AMMB Holdings Bhd 5.20% 15/3/2027 (A1)
5,000,000
5,026,500
5,165,159 2.13
Bank Islam Malaysia Bhd 5.50% 15/12/2025 (A1)
2,500,000
2,564,250
2,590,655 1.07
Fortune Premiere Sdn Bhd 4.65% 21/12/2022 (AA-)
2,500,000
2,500,000
2,522,895 1.04
GB Services Bhd 5.30% 08/11/2019 (AAA)
1,000,000
1,028,200
1,029,943 0.42
Government Investment Issue Murabahah 4.045% 15/8./024 #
2,000,000
2,015,220
2,004,249 0.83
Golden Assets International Finance Ltd 4.75% 03/08/2018 (A1)
1,000,000
979,600
1,002,273 0.41
Golden Assets International Finance Ltd 5.350% 05/08/2019 (A1)
1,500,000
1,503,900
1,509,822 0.62
GovCo Holdings Bhd 4.88% 28/9/2032 #
2,500,000
2,505,250
2,551,899 1.05
Hong Leong Bank Bhd 4.50% 21/06/2024 (AA1)
10,000,000
10,023,000
10,107,968 4.16
Hong Leong Financial Group 4.50% 30/11/2018 (AA)
1,500,000
1,502,625
1,518,489 0.63
Malaysia Government Securities 3.90% 30/11/2026 #
13,000,000
13,368,190
13,031,720 5.37
Malaysia Government Securities 4.254 31/05/2035 #
3,000,000
2,977,830
2,930,415 1.21
Perbadanan Kemajuan Negeri Selangor 4.50% 03/12/2018 (AA3)
5,000,000
5,002,500
5,061,911 2.08
Projek Lebuhraya Usahasama Bhd 4.08% 11/01/2019 (AAA)
5,000,000
5,005,000
5,029,727 2.07
Talam Transform Berhad 0% 28/06/19 (BB3)
3,609,917
147,223
3,498,501 1.44
TAQA Abu Dhabi National Energy 4.65% 03/03/2022 (NR)
3,000,000
2,992,828
3,055,828 1.26
UEM Sunrise Bhd 4.8% 11/12/2020 (AA-)
5,000,000
5,017,000
5,069,153 2.09

CIMB-PRINCIPAL BALANCED INCOME FUND
34
9. FINANCIAL ASSETS AT FAIR VALUE THROUGH PROFIT OR LOSS (CONTINUED)
Name of issuer Nominal
value Aggregate
cost Market
value Percentage
of NAV RM RM RM % 28.02.2017
(CONTINUED)
UNQUOTED FIXED
INCOME SECURITIES (CONTINUED)
WCT Holdings Bhd
5.32% 11/5/2022 (AA-)
2,000,000
2,015,600
2,046,263 0.84
TOTAL UNQUOTED FIXED INCOME SECURITIES 71,109,917 68,193,516 71,760,708 29.56
ACCUMULATED UNREALISED
GAIN ON UNQUOTED FIXED INCOME SECURITIES AT FAIR VALUE THROUGH PROFIT OR LOSS
3,567,192
TOTAL UNQUOTED FIXED INCOME SECURITIES AT
FAIR VALUE THROUGH PROFIT OR LOSS
71,760,708
CIMB-PRINCIPAL BALANCED INCOME FUND
35
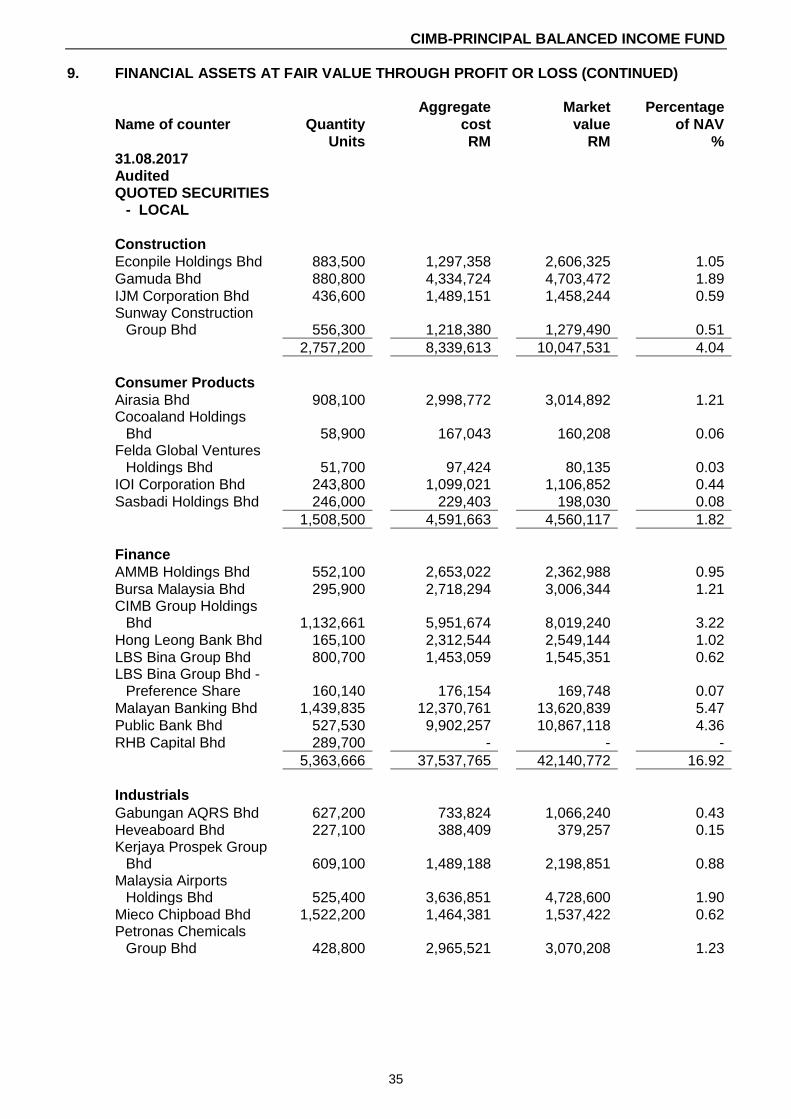
9. FINANCIAL ASSETS AT FAIR VALUE THROUGH PROFIT OR LOSS (CONTINUED)
Aggregate
Market
Percentage
Name of counter Quantity
cost
value
of NAV
Units
RM
RM
%
31.08.2017
Audited
QUOTED SECURITIES - LOCAL
Construction
Econpile Holdings Bhd 883,500 1,297,358 2,606,325 1.05
Gamuda Bhd 880,800 4,334,724 4,703,472 1.89
IJM Corporation Bhd 436,600 1,489,151 1,458,244 0.59 Sunway Construction
Group Bhd 556,300 1,218,380 1,279,490 0.51
2,757,200 8,339,613 10,047,531 4.04
Consumer Products
Airasia Bhd 908,100 2,998,772 3,014,892 1.21 Cocoaland Holdings
Bhd 58,900 167,043 160,208 0.06 Felda Global Ventures
Holdings Bhd 51,700 97,424 80,135 0.03 IOI Corporation Bhd 243,800 1,099,021 1,106,852 0.44
Sasbadi Holdings Bhd 246,000 229,403 198,030 0.08
1,508,500 4,591,663 4,560,117 1.82
Finance
AMMB Holdings Bhd 552,100 2,653,022 2,362,988 0.95
Bursa Malaysia Bhd 295,900 2,718,294 3,006,344 1.21 CIMB Group Holdings
Bhd 1,132,661 5,951,674 8,019,240 3.22
Hong Leong Bank Bhd 165,100 2,312,544 2,549,144 1.02
LBS Bina Group Bhd 800,700 1,453,059 1,545,351 0.62 LBS Bina Group Bhd -
Preference Share 160,140 176,154 169,748 0.07
Malayan Banking Bhd 1,439,835 12,370,761 13,620,839 5.47
Public Bank Bhd 527,530 9,902,257 10,867,118 4.36
RHB Capital Bhd 289,700 - - -
5,363,666 37,537,765 42,140,772 16.92
Industrials
Gabungan AQRS Bhd 627,200 733,824 1,066,240 0.43 Heveaboard Bhd 227,100 388,409 379,257 0.15 Kerjaya Prospek Group
Bhd 609,100 1,489,188 2,198,851 0.88 Malaysia Airports
Holdings Bhd 525,400 3,636,851 4,728,600 1.90
Mieco Chipboad Bhd 1,522,200 1,464,381 1,537,422 0.62 Petronas Chemicals
Group Bhd 428,800 2,965,521 3,070,208 1.23

CIMB-PRINCIPAL BALANCED INCOME FUND
36
9. FINANCIAL ASSETS AT FAIR VALUE THROUGH PROFIT OR LOSS (CONTINUED)
Aggregate
Market
Percentage
Name of counter Quantity
cost
value
of NAV
Units
RM
RM
%
31.08.2017 (CONTINUED)
Audited (continued)
QUOTED SECURITIES - LOCAL (CONTINUED)
Industrials (Continued) Serba Dinamik Holdings
Bhd 185,800 301,282 390,180 0.16
SKP Resources Bhd 1,536,900 2,109,021 2,274,612 0.91 Thong Guan Industries
Bhd 370,300 1,604,345 1,547,854 0.62
V.S. Industry Bhd 996,700 2,058,833 2,362,179 0.95
WCT Holdings Bhd 1,040,467 2,402,835 1,820,817 0.73
8,069,967 19,154,490 21,376,220 8.58
IPC
Time dotCom Bhd 309,400 1,795,822 3,063,060 1.23
Plantation
Genting Plantations Bhd 131,300 1,402,254 1,397,032 0.56 Kuala Lumpur Kepong
Bhd 60,800 1,431,496 1,492,032 0.60
192,100 2,833,750 2,889,064 1.16
Properties
SP Setia Bhd 366,171 1,331,006 1,230,335 0.49 SP Setia Bhd -
Preference Share 221,280 221,280 247,834 0.10
UOA Development Bhd 510,400 1,117,269 1,327,040 0.53
1,097,851 2,669,555 2,805,209 1.12
Technology
Inari Amertron Bhd 578,000 1,499,562 1,468,120 0.59 Unisem (M) Bhd 274,100 976,413 1,123,810 0.45
852,100 2,475,975 2,591,930 1.04
Trading/Services Axiata Group Bhd 779,257 4,134,060 3,841,737 1.54
Berjaya Food Bhd 665,100 1,132,981 977,697 0.39
Bermaz Auto Bhd 742,800 1,629,424 1,389,036 0.56
Bumi Armada Bhd 2,118,400 1,615,446 1,557,024 0.63
Dialog Group Bhd 1,968,600 3,669,909 4,035,630 1.62
Genting Bhd 636,600 5,701,713 6,181,386 2.48

CIMB-PRINCIPAL BALANCED INCOME FUND
37
9. FINANCIAL ASSETS AT FAIR VALUE THROUGH PROFIT OR LOSS (CONTINUED)
Aggregate
Market
Percentage
Name of counter Quantity
cost
value
of NAV
Units
RM
RM
%
31.08.2017 (CONTINUED)
Audited (continued)
QUOTED SECURITIES LOCAL - (CONTINUED)
Trading/Services
(continued) George Kent (M) Bhd 221,550 616,220 615,909 0.25
MISC Bhd 189,700 1,533,786 1,411,368 0.57 Muhibbah Engineering
Malaysia Bhd 788,200 2,023,281 2,246,370 0.90 Pentamaster
Corporation Bhd 646,500 2,195,749 3,193,710 1.28
Pos (M) Bhd 92,500 508,080 508,750 0.20
Sapura Energy Bhd 512,700 1,008,770 707,526 0.28
SCGM Bhd 737,333 1,869,813 2,219,372 0.89
SCGM Bhd - Warrant 73,733 - 34,655 0.01
Sime Darby Bhd 642,900 5,313,853 5,786,100 2.32
Telekom Malaysia Bhd 689,543 4,550,603 4,433,762 1.78 Tenaga Nasional Bhd 801,300 10,923,144 11,442,564 4.59
Yinson Holdings Bhd 1,379,400 4,195,255 5,021,015 2.02
13,686,116 52,622,087 55,603,611 22.31
TOTAL QUOTED
SECURITIES - LOCAL 33,836,900 132,020,720 145,077,514 58.22
QUOTED SECURITIES
- FOREIGN
INDONESIA
Finance
PT CIMB Niaga TBK 247,570 38,294 109,757 0.04
TOTAL INDONESIA 247,570 38,294 109,757 0.04
TOTAL QUOTED SECURITIES -
FOREIGN 247,570 38,294 109,757 0.04
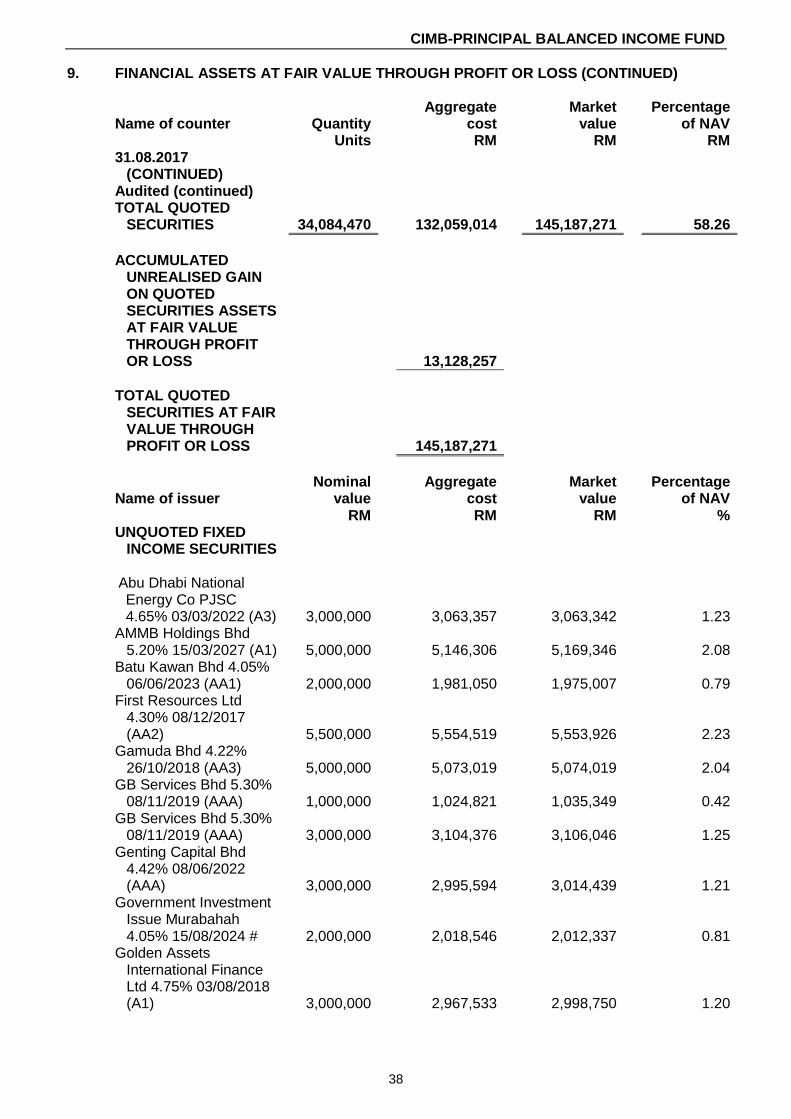
CIMB-PRINCIPAL BALANCED INCOME FUND
38
9. FINANCIAL ASSETS AT FAIR VALUE THROUGH PROFIT OR LOSS (CONTINUED)
Name of counter
Quantity
Aggregate cost
Market value
Percentage of NAV
Units RM RM RM 31.08.2017
(CONTINUED) Audited (continued) TOTAL QUOTED
SECURITIES 34,084,470 132,059,014 145,187,271 58.26
ACCUMULATED
UNREALISED GAIN ON QUOTED SECURITIES ASSETS AT FAIR VALUE THROUGH PROFIT OR LOSS 13,128,257
TOTAL QUOTED
SECURITIES AT FAIR VALUE THROUGH PROFIT OR LOSS 145,187,271
Name of issuer Nominal
value Aggregate
cost Market
value Percentage
of NAV RM RM RM % UNQUOTED FIXED
INCOME SECURITIES
Abu Dhabi National Energy Co PJSC 4.65% 03/03/2022 (A3) 3,000,000 3,063,357 3,063,342 1.23
AMMB Holdings Bhd 5.20% 15/03/2027 (A1) 5,000,000 5,146,306 5,169,346 2.08
Batu Kawan Bhd 4.05% 06/06/2023 (AA1) 2,000,000 1,981,050 1,975,007 0.79
First Resources Ltd 4.30% 08/12/2017 (AA2) 5,500,000 5,554,519 5,553,926 2.23
Gamuda Bhd 4.22% 26/10/2018 (AA3) 5,000,000 5,073,019 5,074,019 2.04
GB Services Bhd 5.30% 08/11/2019 (AAA) 1,000,000 1,024,821 1,035,349 0.42
GB Services Bhd 5.30% 08/11/2019 (AAA) 3,000,000 3,104,376 3,106,046 1.25
Genting Capital Bhd 4.42% 08/06/2022 (AAA) 3,000,000 2,995,594 3,014,439 1.21
Government Investment Issue Murabahah 4.05% 15/08/2024 # 2,000,000 2,018,546 2,012,337 0.81
Golden Assets International Finance Ltd 4.75% 03/08/2018 (A1) 3,000,000 2,967,533 2,998,750 1.20

CIMB-PRINCIPAL BALANCED INCOME FUND
39
9. FINANCIAL ASSETS AT FAIR VALUE THROUGH PROFIT OR LOSS (CONTINUED)
Nominal
Aggregate
Market
Percentage
Name of issuer value
cost
value
of NAV
RM
RM
RM
% 31.08.2017 (CONTINUED)
Audited (continued) UNQUOTED FIXED
INCOME SECURITIES (CONTINUED)
Government
Investment Issues 4.36% 26/07/2027 # 6,000,000
6,150,276
6,127,687
2.46
Malakoff Power Bhd 4.90% 17/12/2018 (AA3) 5,500,000
5,576,637
5,593,688
2.25
Malakoff Power Bhd 5.35% 16/12/2022 (AA3) 2,500,000
2,604,775
2,606,391
1.05 Malaysia Government Securities 3.90% 30/11/2026 # 13,000,000
13,466,171
13,149,758
5.28 Malaysia Government Securities 4.25% 31/05/2035 # 3,000,000
3,010,844
2,967,598
1.19 Malaysia Government Securities 4.76% 07/04/2037 # 6,000,000
6,262,156
6,287,516
2.52 Malaysian Government 3.49% 31/03/2020 # 5,000,000
5,116,838
5,100,071
2.05 RHB Bank Bhd 4.40% 30/11/2022 (AA3) 3,500,000
3,540,748
3,542,460
1.42 Sabah Credit Corporation Bhd 4.77% 05/05/2022 (AA1) 2,500,000
2,550,449
2,549,204
1.02 Talam Transform Bhd 0% 28/06/2019 (BB3) 3,609,917
436,177
3,425,724
1.38 UMW Holdings Bhd 4.83% 22/06/2022 (AA2) 500,000
505,291
506,829
0.20 UniTapah Sdn Bhd 6.15% 12/12/2030 (AA2) 1,000,000
1,124,113
1,128,079
0.45

CIMB-PRINCIPAL BALANCED INCOME FUND
40
9. FINANCIAL ASSETS AT FAIR VALUE THROUGH PROFIT OR LOSS (CONTINUED)
Nominal
Aggregate
Market
Percentage
Name of issuer value
cost
value
of NAV
RM
RM
RM
% 31.08.2017 (CONTINUED)
Audited (continued) UNQUOTED FIXED
INCOME SECURITIES (CONTINUED)
TOTAL UNQUOTED FIXED INCOME SECURITIES 84,609,917 83,273,596 85,987,566 34.53
ACCUMULATED UNREALISED
GAIN ON UNQUOTED FIXED INCOME SECURITIES AT FAIR VALUE THROUGH PROFIT OR LOSS
2,713,970
TOTAL UNQUOTED FIXED INCOME SECURITIES AT
FAIR VALUE THROUGH PROFIT OR LOSS
85,987,566
* NVDR, or non-voting depository receipt, is a trading instrument issued by Thai NVDR
Company Limited, a subsidiary wholly owned by the Stock Exchange of Thailand (“SET”). It is a valid security as specified by the United States Securities and Exchange Commission (“SEC”) and is automatically regarded as a listed security by the SET. The underlying security is a listed security in the SET.
# The unquoted fixed income securities which are not rated as at the end of each financial period are issued, backed or guaranteed by governments or government agencies.

CIMB-PRINCIPAL BALANCED INCOME FUND
41
10. CASH AND CASH EQUIVALENTS
28.02.2018 31.08.2017
Audited
RM RM
Deposits with licensed financial institutions 22,444,879 19,403,029
Bank balances 5,594,682 1,927,562
28,039,561 21,330,591
The weighted average effective interest rate per annum is as follows:
28.02.2018 31.08.2017
Audited
% %
Deposits with licensed financial institutions 3.27 3.42
Deposits with licensed financial institutions of the Fund have an average maturity of 4 days (31.08.2017: 5 days).
11. NUMBER OF UNITS IN CIRCULATION (UNITS)
01.09.2017 to 29.02.2018
01.09.2016 to 31.08.2017
Audited
No. of units No. of units
At the beginning of the financial period/year 324,398,069 353,167,478
Add : Creation of units from applications 14,242,967 9,261,602
Add : Creation of units from distribution 23,397,101 24,862,420
Less : Cancellation of units (39,063,542) (62,893,431)
At the end of the financial period/year 322,974,595 324,398,069
12. MANAGEMENT EXPENSE RATIO (“MER”)
01.09.2017 to 28.02.2018
01.09.2016 to 28.02.2017
% %
MER 0.83 0.83
MER is derived based on the following calculation: MER = (A + B + C + D + E) x 100 F A = Management fee B = Trustee’s and custodian fees C = Audit fee D = Tax agent’s fee E = Other expenses excluding GST on transaction costs F = Average NAV of the Fund calculated on a daily basis The average NAV of the Fund for the financial period calculated on a daily basis is RM246,589,960 (28.02.2017: RM258,530,368).

CIMB-PRINCIPAL BALANCED INCOME FUND
42
13. PORTFOLIO TURNOVER RATIO (“PTR”) 01.09.2017
to 28.02.2018 01.09.2016
to 28.02.2017
PTR (times) 0.64 0.56
PTR is derived from the following calculation:
(Total acquisition for the financial period + total disposal for the financial period) 2 Average NAV of the Fund for the financial period calculated on a daily basis
where: total acquisition for the financial period = RM147,833,181 (28.02.2017: RM138,999,276) total disposal for the financial period = RM170,097,669 (28.02.2017: RM149,680,654)
14. UNITS HELD BY THE MANAGER, PARTIES RELATED TO THE MANAGER, AND
SIGNIFICANT RELATED PARTY TRANSACTIONS AND BALANCES The related parties and their relationship with the Fund are as follows: Related parties Relationship CIMB-Principal Asset Management Bhd The Manager CIMB Group Sdn Bhd Holding company of the Manager CIMB Group Holdings Bhd (“CIMB”) Ultimate holding company of the Manager CIMB Bank Bhd Fellow related party to the Manager CIMB Investment Bank Bhd Fellow related party to the Manager Subsidiaries and associates of CIMB Subsidiary and associated companies of as disclosed in its financial statements the ultimate holding company of the Manager
Units held by the Manager and parties related to the Manager
28.02.2018
31.08.2017
Audited
No. of units RM No. of units RM
Manager CIMB-Principal Asset Management Bhd 159,507 119,949 97,867 75,152
In the opinion of the Manager, the above units were transacted at the prevailing market price.
The units are held beneficially by the Manager for booking purposes. Other than the above,
there were no units held by the Directors or parties related to the Manager.

CIMB-PRINCIPAL BALANCED INCOME FUND
43
14. UNITS HELD BY THE MANAGER, PARTIES RELATED TO THE MANAGER, AND SIGNIFICANT RELATED PARTY TRANSACTIONS AND BALANCES (CONTINUED)
In addition to related party disclosures mentioned elsewhere in the financial statements, set
out below are other significant related party transactions and balances. The Manager is of the opinion that all transactions with the related companies have been entered into in the normal course of business at agreed terms between the related parties.
01.09.2017
to 28.02.2018 01.09.2016
to 28.02.2017
RM RM
Significant related party transactions
Interest income from deposits with licensed financial institutions:
- CIMB Bank Bhd 22,419 54,900
Cash placement with licensed financial institution:
- CIMB Bank Bhd 62,432,000 108,081,000
28.02.2018 31.08.2017
Audited RM RM
Significant related party balances
Deposits with licensed financial institutions:
- CIMB Bank Bhd 4,753,000 -
15. TRANSACTIONS WITH BROKERS/DEALERS
Details of transactions with the top 10 brokers/dealers for the six months financial period ended 28 February 2018 are as follows:
Brokers/Dealers Value of
trades
Percentage of total trades
Brokerage fees
Percentage of total
brokerage fees
RM % RM %
RHB Bank Bhd 74,474,564 23.42 - - RHB Investment Bank Bhd 43,111,171 13.56 41,326 12.14
CIMB Investment Bank Bhd # 25,077,852 7.89 58,473 17.18
CIMB Bank Bhd # 21,319,060 6.71 - - Maybank Investment Bank
Bhd 18,612,703 5.85 48,225 14.17 Credit Suisse (Malaysia) Sdn
Bhd 15,366,907 4.83 34,605 10.17
Hong Leong Bank Bhd 13,689,200 4.31 - - JPMorgan Securities
(Malaysia) Sdn Bhd 13,611,855 4.28 30,080 8.84 Affin Hwang Investment Bank
Bhd 13,373,696 4.21 16,304 4.79 CLSA Securities (Malaysia)
Sdn Bhd 13,229,869 4.16 29,767 8.75
Others 66,063,973 20.78 81,531 23.96
317,930,850 100.00 340,311 100.00

CIMB-PRINCIPAL BALANCED INCOME FUND
44
15. TRANSACTIONS WITH BROKERS/DEALERS (CONTINUED) Details of transactions with the top 10 brokers/dealers for the six months financial period ended 28 February 2017 are as follows:
Brokers/Dealers Value of
trades
Percentage of total trades
Brokerage fees
Percentage of total
brokerage fees
RM % RM %
RHB Investment Bank Bhd 56,570,770 19.60 51,515 11.25
Maybank Securities Bhd 33,928,163 11.75 60,040 13.11
Macquarie Malaysia Sdn Bhd 26,708,987 9.25 59,533 13.00 JPMorgan Securities
Malaysia Sdn Bhd 23,475,793 8.13 52,839 11.54 Hong Leong Investment Bank
Bhd 23,245,299 8.05 30,210 6.60 CLSA Securities Malaysia
Sdn Bhd 22,427,193 7.77 49,974 10.91 Credit Suisse Malaysia Sdn
Bhd 20,420,500 7.07 45,946 10.03
CIMB Investment Bank Bhd # 18,101,027 6.27 40,758 8.90
Malayan Banking Bhd 15,821,250 5.48 - - UBS Securities Malaysia Sdn
Bhd 14,508,102 5.03 32,643 7.12 Others # 33,472,846 11.60 34,603 7.54
288,679,930 100.00 458,061 100.00
# Included in the transactions are trades conducted with CIMB Investment Berhad and CIMB
Bank Berhad, fellow subsidiaries to the Manager amounting to RM25,077,852 (28.02.2017: RM18,101,027) and RM21,319,060 (28.02.2017: RM2,977,830) respectively. The Manager is of the opinion that all transactions with the related companies have been entered into in the normal course of business at agreed terms between the related parties.
16. SEGMENT INFORMATION
The internal reporting provided to the chief operating decision-maker for the Fund’s assets, liabilities and performance is prepared on a consistent basis with the measurement and recognition principles of MFRS and IFRS. The chief operating decision-maker is responsible for the performance of the Fund and considers the business to have a single operating segment located in Malaysia. Asset allocation decisions are based on a single, integrated investment strategy and the Fund’s performance is evaluated on an overall basis. The investment objective of the Fund is to seek long-term growth in capital and income by investing in all types of investments. The reportable operating segment derives its income by seeking investments to achieve targeted returns consummate with an acceptable level of risk within the portfolio. These returns consist of interest income and dividend income earned from investments and gains on the appreciation in the value of investments, which are derived from Ringgit denominated deposits with licensed financial institutions in Malaysia, quoted securities listed on the Bursa Securities, Malaysia, Bursa Efek Jakarta, Indonesia and unquoted fixed income securities traded in Malaysia and Singapore. There were no changes in reportable operating segment during the financial period.

CIMB-PRINCIPAL BALANCED INCOME FUND
45
DIRECTORY
Head office of the Manager CIMB-Principal Asset Management Berhad (Company No.: 304078-K) 10th Floor, Bangunan CIMB, Jalan Semantan, Damansara Heights, 50490 Kuala Lumpur, MALAYSIA. Tel: (03) 2084 8888 Postal address CIMB-Principal Asset Management Berhad (Company No.: 304078-K) P.O.Box 10571, 50718 Kuala Lumpur, MALAYSIA. Website www.cimb-principal.com.my E-mail address [email protected] General investment enquiries (03) 7718 3100 Trustee for the CIMB-Principal Balanced Income Fund Universal Trustee (Malaysia) Berhad (Company No.:17540-D) No. 1 Jalan Ampang (3rd Floor), 50450 Kuala Lumpur, MALAYSIA. Tel: (03) 2619 1188 Fax: (03) 2691 3513, (03) 2691 3245