cimb ftse china 25 unaudited quarterly report for the … report 30092012 - ftse china25 fin… ·...
TRANSCRIPT

CIMB FTSE CHINA 25 UNAUDITED QUARTERLY REPORT FOR THE FINANCIAL PERIOD FROM 1 JULY 2012 TO 30 SEPTEMBER 2012

CONTENTS PAGE INVESTOR LETTER 1 - 3 MANAGER’S REPORT 4 - 9
Fund objective and policy
Trust Directory Corporate Directory Additional Information Performance Data Market review Fund performance Portfolio structure Market outlook Investment strategy Unit holding statistics Rebates and soft commissions
STATEMENT BY MANAGER 10 UNAUDITED STATEMENT OF COMPREHENSIVE INCOME 11 UNAUDITED STATEMENT OF FINANCIAL POSITION 12 UNAUDITED STATEMENT OF CHANGES IN EQUITY 13 UNAUDITED STATEMENT OF CASH FLOWS 14 UNAUDITED NOTES TO THE FINANCIAL STATEMENTS 15 - 37 DIRECTORY 38

CIMB FTSE CHINA 25
1
INVESTOR LETTER Dear Valued Investors,
We invite you to celebrate with us!
CIMB-Principal Asset Management Berhad has won the Overall Fund Group Category Award from The Edge-Lipper Malaysia Fund Awards 2012. This is a wonderful recognition and
acknowledgement of our overall investment performance across our entire fund family over the last 3
years. In addition the following funds also won their respective categories for the year ended
December 31, 2011:
1. Winner, Equity Malaysia, 3 years - CIMB-Principal Equity Fund
2. Winner, Equity Malaysia, 10 years - CIMB-Principal Equity Fund
3. Winner, Equity Asia Pacific ex-Japan (Islamic), 3 years - CIMB Islamic Equity Fund
4. Winner, Equity Asia Pacific ex-Japan, 3 years - CIMB Islamic Equity Fund
5. Winner, Mixed Asset MYR Balance – Malaysia (Islamic), 3 years - CIMB Islamic Balanced
Growth Fund
6. Winner, Mixed Asset MYR Balance – Malaysia (Islamic), 10 years - CIMB Islamic
Balanced Fund
These awards are important because it means that the consistent investment process we have in
place, supported by strong portfolio risk management and oversight practices, has yielded top-
performing investment results for our loyal investors.
In addition Asia Asset Management from Hong Kong, has just recognised CIMB-Principal Asset
Management Berhad as “ETF Manager of the Year” and honoured me with “CEO of the Year”
award, however it is my firm belief that this latter award is really a reflection of the hardworking and
talented people at the Company.
Our focus on becoming ASEAN’s most valued investment manager has been recognized by the
industry with the Company being named
• “Asset Management Company of the Year, Southeast Asia” by The Asset Triple A Investment
Awards
• “Best Asset Manager in Southeast Asia” by Alpha Southeast Asia

CIMB FTSE CHINA 25
2
INVESTOR LETTER (CONTINUED)
We are also emerging within Asia’s investment industry, having being named to the 2011 Asia Manager Power 50 List. That being said, we also continue to receive recognition from regional
publications for our continued excellence in Malaysia. Last year AsianInvestor awarded us “Best Onshore Fund House”. The CIMB Islamic Enhanced Sukuk Fund was also recognised as “Best Islamic Bond Fund” by the Islamic Finance News Awards in its Islamic Investor Poll 2011.
At the end of the day, the industry accolades we received are incidental to our reason for being: to
grow and manage the money you have entrusted with us responsibly, with the appropriate risk
management controls in place. I’m happy to share that, 80% of our total AUM for unit trust funds are
in the top 50% of their respective fund categories1.
The investment team performed admirably in an uncertain and volatile 2011, with an average 3.95%
return across our domestic conventional equity funds2, outperforming the FTSE Bursa Malaysia KLCI
by a significant 3.17% last year.
Our domestic Shariah equity funds3 did even better, with an average return of 8.01%, outperforming
the FTSE Bursa Malaysia EMAS Shariah Index by 5.6%. In particular, the CIMB-Principal Equity
Fund and CIMB Islamic DALI Equity Growth Fund both outperformed their respective index by 4.6%
and 6.5% in 2011.
We have also revamped our website to better position ourselves as a regional asset manager.
Investors can now access different country websites in a single regional site at www.cimb-
principal.com. This website has been improved to make it easier for investors to search for specific
funds across different categories and asset classes.
Taking a longer-term investment view over the last 3 years, I’m happy to share that the ASEAN
markets have proven resilient with a performance growth of 97.3%, relative to the United States at
34%.6 and Europe at 13.9%4. ASEAN equities are trading at 12.6x price-to-earnings ratio (“P/E”)
versus 10x P/E in for Asia ex-Japan. This valuation premium continues to persist as investors believe
that ASEAN provides better earnings certainty. That said, we expect consolidation in the coming
months which will give us an opportunity to buy quality stocks, when earnings forecasts are adjusted
to more realistic levels.

CIMB FTSE CHINA 25
3
INVESTOR LETTER (CONTINUED) Looking ahead, there are forecasts of potential further global economic slowdown and signs of
tougher times ahead with the impending recession in the Eurozone. Germany, the region’s strongest
economy, is working hard to stabilize the region, but volatility seems unlikely to decline as the
region’s sovereign debt problem is still not completely resolved. We expect market uncertainty to
persist in this challenging time. We are focused on how we can take advantage of the volatility.
This year we remain focused on our regional presence in ASEAN and will leverage our local
investment expertise to find investment opportunities for our investors. I would like to take this
opportunity to thank you for your continuous support and look forward to a rewarding 2012. We will
continuously strive to provide the best in both services and products to investors.
On another note, in conjunction with our renewal exercise of the Master Prospectus, the section of
"specific risks associated with the investment portfolio of the Fund" as contained in the Risk Factors
Chapter has been updated. Please refer to the Master Prospectus dated 30 June 2012 for further
details.
Happy Investing!
Campbell Tupling
Chief Executive Officer
CIMB-Principal Asset Management Berhad
Source:
1. Lipper Hindsight as at end Dec 2011. 80% of Assets Under Management of CIMB-Principal Unit Trust Funds in the Top 2 Quartiles
2. CIMB-Principal Equity Aggressive Fund 3, CIMB-Principal Equity Aggressive Fund 1, CIMB-Principal Equity Fund, CIMB-Principal Equity Fund 2, CIMB-Principal Wholesale Equity Fund
3. CIMB Islamic Equity Aggressive Fund, CIMB Islamic DALI Equity Theme Fund, CIMB Islamic DALI Equity Growth Fund
4. FTSE/ASEAN Index, FTSE United States of America Index, FTSE Europe Index (Cumulative growth 31 Jan 09 - 31 Jan 12)

CIMB FTSE CHINA 25
4
MANAGER’S REPORT What is the investment objective of the Fund? To provide investment results that closely correspond to the performance of the Benchmark Index, regardless of its performance. Has the Fund achieved its objective? For the year under review, the Fund is in line with its stated objective and the details are shown under ‘Fund Performance’ section. What are the Fund investment policy and its strategy? A passive strategy whereby the Manager may adopt either a Replication Strategy or a Representative Sampling Strategy. Replication Strategy In managing the Fund, the Manager will generally adopt a Replication Strategy. Using a Replication Strategy, the Fund will invest in substantially all the Index Securities in substantially the same weightings (i.e. proportions) as the Benchmark Index (to the extent possible). If the Manager is of the opinion there exists liquidity constraints with the Index Securities, the Fund may substitute the Index Securities (in part or in whole) with one or more derivatives of the Index Securities which are likely to behave in a manner consistent with the investment objective of the Fund as determined by the Manager. Representative Sampling Strategy The Manager may decide to adopt a Representative Sampling Strategy if various circumstances make it impossible or impracticable to adopt a Replication Strategy. The Fund’s policies on investments were carried out in accordance with the Deed and it will continue its operations until terminated in accordance with the provisions of the Deed. Fund category/ type Exchange-traded fund / Equity / Index Tracking How long should you invest for? Recommended 3 to 5 years. Indication of short-term risk (low, moderate, high) High When was the Fund launched? 9 July 2010* What was the size of the Fund as at 30 September 2012? RM 14.84 million (17.55 million units) What is the Fund’s benchmark? FTSE China 25 Index or such replacement index as may be determined by the Manager, subject to the approval of the Securities Commission Malaysia. What is the fund distribution policy? Annually, subject to the discretion of the Manager. What was the net income distribution for the financial period ended 30 September 2012? No distribution was declared for the year ended 30 September 2012. • Listing date
CIMB FTSE CHINA 25
5
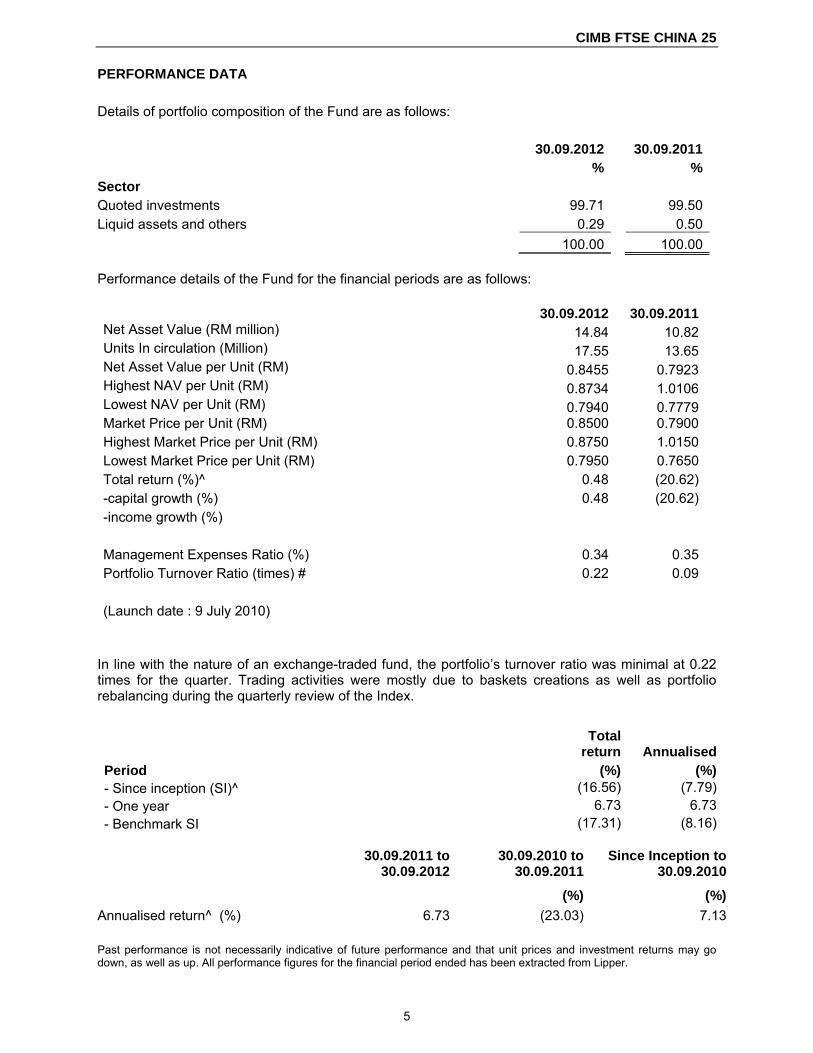
Performance details of the Fund for the financial periods are as follows: 30.09.2012 30.09.2011Net Asset Value (RM million) 14.84 10.82Units In circulation (Million) 17.55 13.65Net Asset Value per Unit (RM) 0.8455 0.7923Highest NAV per Unit (RM) 0.8734 1.0106Lowest NAV per Unit (RM) 0.7940 0.7779Market Price per Unit (RM) 0.8500 0.7900Highest Market Price per Unit (RM) 0.8750 1.0150Lowest Market Price per Unit (RM) 0.7950 0.7650Total return (%)^ 0.48 (20.62)-capital growth (%) 0.48 (20.62)-income growth (%) Management Expenses Ratio (%) 0.34 0.35Portfolio Turnover Ratio (times) # 0.22 0.09 (Launch date : 9 July 2010)
In line with the nature of an exchange-traded fund, the portfolio’s turnover ratio was minimal at 0.22 times for the quarter. Trading activities were mostly due to baskets creations as well as portfolio rebalancing during the quarterly review of the Index.
30.09.2011 to
30.09.201230.09.2010 to
30.09.2011 Since Inception to
30.09.2010 (%) (%)Annualised return^ (%) 6.73 (23.03) 7.13 Past performance is not necessarily indicative of future performance and that unit prices and investment returns may go down, as well as up. All performance figures for the financial period ended has been extracted from Lipper.
PERFORMANCE DATA Details of portfolio composition of the Fund are as follows: 30.09.2012 30.09.2011 % %Sector Quoted investments 99.71 99.50Liquid assets and others 0.29 0.50 100.00 100.00
Total return Annualised
Period (%) (%)- Since inception (SI)^ (16.56) (7.79)- One year 6.73 6.73- Benchmark SI (17.31) (8.16)
CIMB FTSE CHINA 25
6
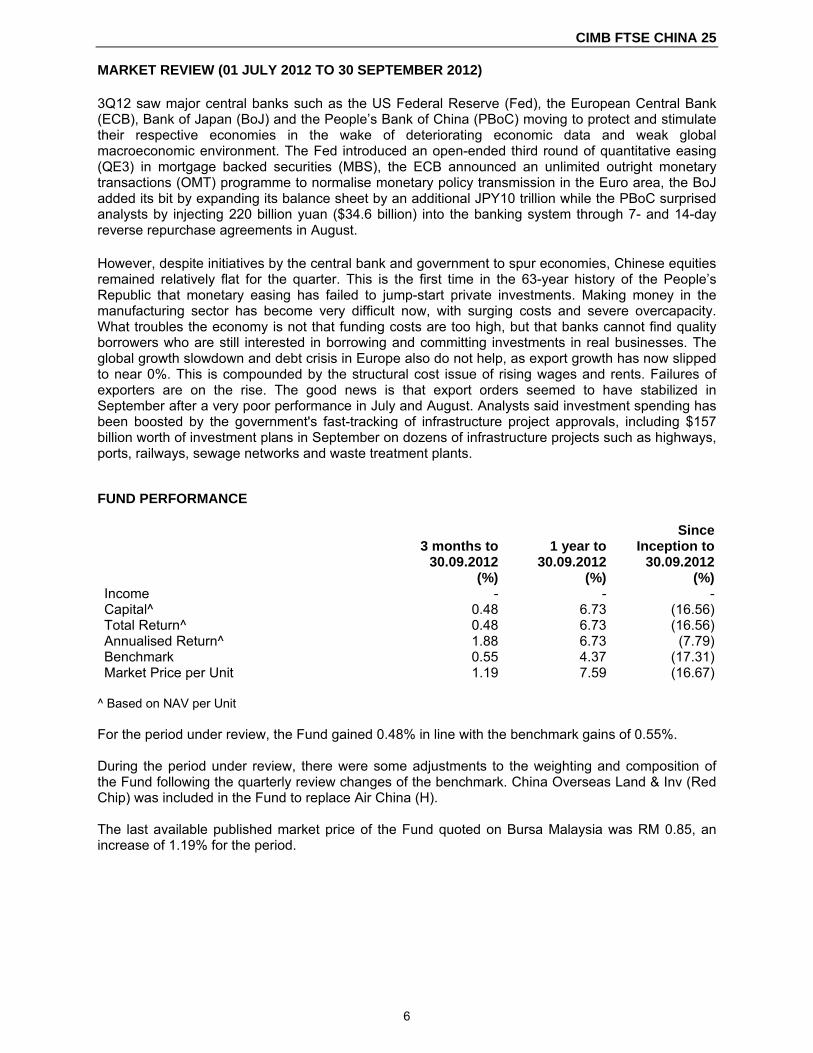
MARKET REVIEW (01 JULY 2012 TO 30 SEPTEMBER 2012)
3Q12 saw major central banks such as the US Federal Reserve (Fed), the European Central Bank (ECB), Bank of Japan (BoJ) and the People’s Bank of China (PBoC) moving to protect and stimulate their respective economies in the wake of deteriorating economic data and weak global macroeconomic environment. The Fed introduced an open-ended third round of quantitative easing (QE3) in mortgage backed securities (MBS), the ECB announced an unlimited outright monetary transactions (OMT) programme to normalise monetary policy transmission in the Euro area, the BoJ added its bit by expanding its balance sheet by an additional JPY10 trillion while the PBoC surprised analysts by injecting 220 billion yuan ($34.6 billion) into the banking system through 7- and 14-day reverse repurchase agreements in August.
However, despite initiatives by the central bank and government to spur economies, Chinese equities remained relatively flat for the quarter. This is the first time in the 63-year history of the People’s Republic that monetary easing has failed to jump-start private investments. Making money in the manufacturing sector has become very difficult now, with surging costs and severe overcapacity. What troubles the economy is not that funding costs are too high, but that banks cannot find quality borrowers who are still interested in borrowing and committing investments in real businesses. The global growth slowdown and debt crisis in Europe also do not help, as export growth has now slipped to near 0%. This is compounded by the structural cost issue of rising wages and rents. Failures of exporters are on the rise. The good news is that export orders seemed to have stabilized in September after a very poor performance in July and August. Analysts said investment spending has been boosted by the government's fast-tracking of infrastructure project approvals, including $157 billion worth of investment plans in September on dozens of infrastructure projects such as highways, ports, railways, sewage networks and waste treatment plants. FUND PERFORMANCE
3 months to 30.09.2012
(%)
1 year to 30.09.2012
(%)
Since Inception to
30.09.2012(%)
Income - - -Capital^ 0.48 6.73 (16.56)Total Return^ 0.48 6.73 (16.56)Annualised Return^ 1.88 6.73 (7.79)Benchmark 0.55 4.37 (17.31)Market Price per Unit 1.19 7.59 (16.67)
^ Based on NAV per Unit For the period under review, the Fund gained 0.48% in line with the benchmark gains of 0.55%. During the period under review, there were some adjustments to the weighting and composition of the Fund following the quarterly review changes of the benchmark. China Overseas Land & Inv (Red Chip) was included in the Fund to replace Air China (H). The last available published market price of the Fund quoted on Bursa Malaysia was RM 0.85, an increase of 1.19% for the period.

CIMB FTSE CHINA 25
7
FUND PERFORMANCE (CONTINUED)
-25%
-20%
-15%
-10%
-5%
0%
5%
10%
Jul-1
0
Sep-10
Nov-10
Jan-11
Mar-11
May-11
Jul-1
1
Sep-11
Nov-11
Jan-12
Mar-12
May-12
Jul-1
2
Sep-12
FTSE China 25 Index
CIMB FTSE China 25
Changes in Net Asset Value (“NAV”) 30.09.2012 30.09.2011 % changes Net Asset Value (“NAV”) (RM Million) 14.84 10.82 37.15 NAV/unit (RM) 0.8455 0.7923 6.71 Both NAV and NAV per unit registered positive trend for the 1-year period. On top of the encouraging performance of the Chinese equities for the year, the Fund saw commendable units creations which boosted the total NAV for the Fund by 37.15%. Performance data represents the combined income and capital return as a result of holding units in the Fund for the specified length of time, based on NAV to NAV price. The performance data assumes that all earnings from the Fund are reinvested and are net of management and trustee fees. Past performance is not reflective of future performance and income distributions are not guaranteed. Unit prices and income distributions, if any, may fall and rise. All performance figures have been extracted from Lipper.

CIMB FTSE CHINA 25
8
PORTFOLIO STRUCTURE Asset allocation
(% of NAV) 30 September 2012 30 September 2011
Underlying Fund 99.71 99.50
Liquid assets and others 0.29 0.50
TOTAL 100.00 100.00 The Fund remained fully invested during the period under review. A minimal level of liquid assets was maintained primarily for liquidity purposes.
Underlying Fund99.71%
Liquid assets and others0.29%
MARKET OUTLOOK We believe the slowdown in the Chinese economy has likely bottomed. The recent cyclical slowdown to some extent reflects choices of policy designed to improve social stability. Nevertheless, the country faces several structural challenges, including avoiding the middle-income trap, engineering a deleveraging of the economy, and dealing with weaker growth in the working age population. On top of these, the lack of investment interest (outside the property sector) from the private sector continues to be a drag on the growth recovery. These structural concerns suggest that China is heading into a sustained period of slower growth than it scored over the past decade. For all of 2012, China's economy is forecast by 27 analysts to grow 7.7%, just ahead of the government's 7.5% target but nonetheless the slackest pace since 1999, when growth hit 7.6%. Nevertheless, many believe the worst may have passed after a surprisingly strong bounce in China's exports in September, alongside factory output, investment and retail sales which all pulled slightly ahead of expectations suggested the economy may be turning the corner. The further increase in October headline PMI to 50.2, which was the first time since July the PMI has broken above the 50-benchmark is positive to the economy. This indicates the manufacturing sector has returned to month-on-month expansion. The PMI new orders index was also up by 0.6% to 50.4, returning to the monthly expansionary zone for the first time since April.

CIMB FTSE CHINA 25
9
MARKET OUTLOOK (CONTINUED) Over the near term, we believe growth should be supported by the following factors: 1) increased property market transaction and construction activities; 2) increased infrastructure investments; 3) a pick-up in export orders from the US; and 4) resilient consumption. Although growth staying at around 7% is mediocre by Chinese standards, the reduced risk of a hard landing should be market positive, in our view. We do not anticipate a strong rebound in growth in the coming quarters. In our view, the core problem for the economy is the disappearance of private investment, prompted by surging costs and over-capacity. Re-engaging private investment is crucial for China to get back on the right track for growth, but structural reforms, such as corporate tax cuts and the opening of the service sector to private capital, will take time and require strong political will. We believe public spending is not a substitute for private investment and that monetary easing cannot resolve the structural difficulties. INVESTMENT STRATEGY As this is an exchange-traded fund, the Fund will continue to remain fully invested in the benchmark index stocks with minimal cash kept for liquidity purposes in order to track the performance of the benchmark. UNIT HOLDING STATISTICS Breakdown of unit holdings by size as at 30 September 2012 are as follows:
Size of unit holding No of unit
holdersNo of units Held
(million) % of units
held5,000 and below 135 0.39 2.20 5,001 to 10,000 69 0.62 3.53 10,001 to 50,000 99 2.57 14.67 50,001 to 500,000 28 3.75 21.39 500,001 and above 7 10.22 58.22 338 17.55 100.00
SOFT COMMISSIONS AND REBATES CIMB-Principal Asset Management Berhad and CIMB-Principal Asset Management (S) Pte Ltd and the Trustees (including their officers) will not retain any form of rebate or soft commission from, or otherwise share in any commission with, any broker in consideration for directing dealings in the investments of the Funds unless the soft commission received is retained in the form of goods and services such as financial wire services and stock quotations system incidental to investment management of the Funds. All dealings with brokers are executed on best available terms.

CIMB FTSE CHINA 25
10
STATEMENT BY MANAGER TO THE UNIT HOLDERS OF CIMB FTSE CHINA 25 We, being the Directors of CIMB-Principal Asset Management Berhad, do hereby state that, in the opinion of the Manager, the accompanying unaudited financial statements set out on pages 11 to 37 are drawn up in accordance with the provisions of the Deed and give a true and fair view of the financial position of the Fund as at 30 September 2012 and of its financial performance, changes in equity and cash flows of the Fund for the financial period ended on that date in accordance with Financial Reporting Standards and the Securities Commission Guidelines. For and on behalf of the Manager CIMB-PRINCIPAL ASSET MANAGEMENT BERHAD (Company No.: 304078-K)
For and on behalf of the Manager CIMB-PRINCIPAL ASSET MANAGEMENT BERHAD (Company No.: 304078-K) JOHN CAMPBELL TUPLING DATUK NORIPAH KAMSO Chief Executive Officer / Director Director Kuala Lumpur 15 November 2012

CIMB FTSE CHINA 25
11
UNAUDITED STATEMENT OF COMPREHENSIVE INCOME FOR FINANCIAL PERIOD FROM 1 JULY 2011 TO 30 SEPTEMBER 2012
01.07.2012 to
30.09.2012
01.07.2011 to
30.09.2011 Note RM RMINCOME Dividend income 70,559 42,586Net realised gain/(loss) on sale of investments 8 67,558 (3,541,434)Net foreign currency exchange loss (18,090) 716,378 120,027 (2,782,470) LESS: EXPENSES Management fee 4 17,630 18,511Trustee fee 5 3,025 4,537 Audit Fee 4 6,301 6,301Tax Agent Fee 4 935 2,294 Other expenses 11,762 12,004 39,653 43,647 PROFIT/(LOSS) BEFORE TAXATION 80,374 (2,826,117) TAXATION 7 (2,964) (17,027) PROFIT/(LOSS) AFTER TAXATION 77,410 (2,809,090) Profit/(loss) after taxation is made up as follows: Realised amount (171,898) (43,648) Unrealised amount 249,308 (2,765,442) 77,410 (2,809,090) The accompanying notes to the financial statements form an integral part of the unaudited financial statements.

CIMB FTSE CHINA 25
12
UNAUDITED STATEMENT OF FINANCIAL POSITION AS AT 30 SEPTEMBER 2012 30.09.2012 30.09.2011 Note RM RM CURRENT ASSETS Financial assets at fair value through profit or loss 8 14,796,251 10,761,951Cash and cash equivalents 9 52,999 24,242Due from broker - 37,127Dividend receivables 41,296 43,272TOTAL ASSETS 14,890,546 10,866,592 CURRENT LIABILITIES Management fee payable 5,903 5,633Amount due to trustee 986 1,480Other payables and accruals 10 44,744 44,037TOTAL LIABILITIES 51,633 51,150 NET ASSET VALUE OF THE FUND 11 14,838,913 10,815,442 EQUITY Unitholders' capital 16,749,915 13,476,255Accumulated losses (1,911,002) (2,660,813)NET ASSETS ATTRIBUTABLE TO UNITHOLDERS 11 14,838,913 10,815,442
NUMBER OF UNITS IN CIRCULATION (UNITS) 11 17,550,000 13,650,000 NET ASSET VALUE PER UNIT 0.8455 0.7923 The accompanying notes to the financial statements form an integral part of the unaudited financial statements.

CIMB FTSE CHINA 25
13
UNAUDITED STATEMENT OF CHANGES IN EQUITY FOR THE FINANCIAL PERIOD FROM 1 JULY 2012 TO 30 SEPTEMBER 2012 Unitholders' Retained capital earnings Total RM RM RM Balance as at 1 July 2012 13,476,255 (1,988,412) 11,487,843Movement in unitholders' contribution: Creation of units 3,273,660 - 3,273,660Cancellation of units - - -Total comprehensive income for the financial period - 77,410 77,410Balance as at 30 September 2012 16,749,915 (1,911,002) 14,838,913
Balance as at 1 July 2011 13,476,255 148,277 13,624,532Movement in unitholders' contribution: Creation of units - - -Cancellation of units - - -Total comprehensive income for the financial period - (2,809,090) (2,809,090)Balance as at 30 September 2011 13,476,255 (2,660,813) 10,815,442
The accompanying notes to the financial statements form an integral part of the unaudited financial statements.

CIMB FTSE CHINA 25
14
UNAUDITED STATEMENT OF CASH FLOW FOR THE FINANCIAL PERIOD FROM 1 JULY 2012 TO 30 SEPTEMBER 2012
01.07.2012
to 30.09.2012
01.07.2011 to
30.09.2011 Note RM RMCASH FLOW FROM OPERATING ACTIVITIES Proceeds from sales of investments 797,198 1,135,806Purchase of investments (4,281,366) (1,217,628)Dividends received 293,700 242,442Trustee’s fee paid (3,025) (4,537)Manager’s fee paid (17,299) (19,563)Tax paid (2,964) -Payments for other fees and expenses (10,765) (269,975)Net cash outflow from operating activities (3,224,521) (133,455) CASH FLOW FROM FINANCING ACTIVITIES Cash proceeds from units created 3,273,660 -Payments for cancellation of units - -Net cash inflow from financing activities 3,273,660 - Net increase in cash and cash equivalents 49,139 (133,455)Effect of unrealised foreign exchange 21,950 1,073Cash and cash equivalents at the beginning of the financial period (18,090) 156,624Cash and cash equivalents at the end of the financial period 9 52,999 24,242
The accompanying notes to the financial statements form an integral part of the unaudited financial statements.
CIMB FTSE CHINA 25
15
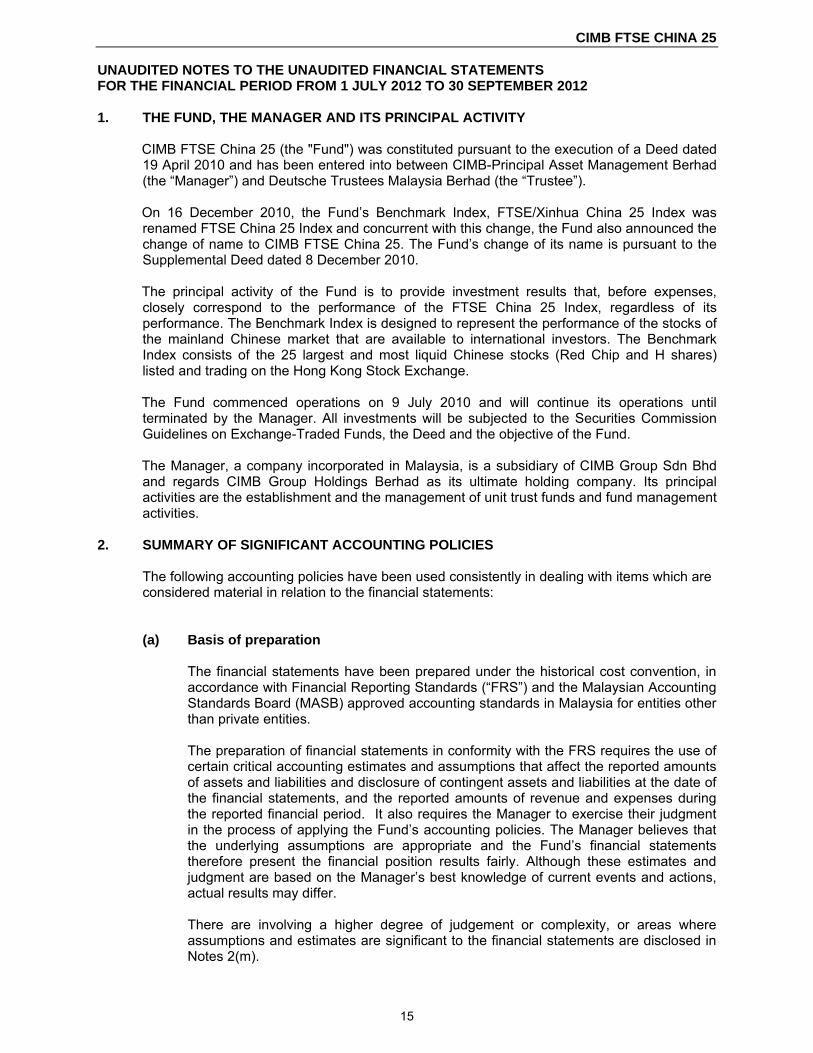
UNAUDITED NOTES TO THE UNAUDITED FINANCIAL STATEMENTS FOR THE FINANCIAL PERIOD FROM 1 JULY 2012 TO 30 SEPTEMBER 2012 1. THE FUND, THE MANAGER AND ITS PRINCIPAL ACTIVITY
CIMB FTSE China 25 (the "Fund") was constituted pursuant to the execution of a Deed dated 19 April 2010 and has been entered into between CIMB-Principal Asset Management Berhad (the “Manager”) and Deutsche Trustees Malaysia Berhad (the “Trustee”). On 16 December 2010, the Fund’s Benchmark Index, FTSE/Xinhua China 25 Index was renamed FTSE China 25 Index and concurrent with this change, the Fund also announced the change of name to CIMB FTSE China 25. The Fund’s change of its name is pursuant to the Supplemental Deed dated 8 December 2010. The principal activity of the Fund is to provide investment results that, before expenses, closely correspond to the performance of the FTSE China 25 Index, regardless of its performance. The Benchmark Index is designed to represent the performance of the stocks of the mainland Chinese market that are available to international investors. The Benchmark Index consists of the 25 largest and most liquid Chinese stocks (Red Chip and H shares) listed and trading on the Hong Kong Stock Exchange. The Fund commenced operations on 9 July 2010 and will continue its operations until terminated by the Manager. All investments will be subjected to the Securities Commission Guidelines on Exchange-Traded Funds, the Deed and the objective of the Fund. The Manager, a company incorporated in Malaysia, is a subsidiary of CIMB Group Sdn Bhd and regards CIMB Group Holdings Berhad as its ultimate holding company. Its principal activities are the establishment and the management of unit trust funds and fund management activities.
2. SUMMARY OF SIGNIFICANT ACCOUNTING POLICIES
The following accounting policies have been used consistently in dealing with items which are considered material in relation to the financial statements:
(a) Basis of preparation
The financial statements have been prepared under the historical cost convention, in accordance with Financial Reporting Standards (“FRS”) and the Malaysian Accounting Standards Board (MASB) approved accounting standards in Malaysia for entities other than private entities. The preparation of financial statements in conformity with the FRS requires the use of certain critical accounting estimates and assumptions that affect the reported amounts of assets and liabilities and disclosure of contingent assets and liabilities at the date of the financial statements, and the reported amounts of revenue and expenses during the reported financial period. It also requires the Manager to exercise their judgment in the process of applying the Fund’s accounting policies. The Manager believes that the underlying assumptions are appropriate and the Fund’s financial statements therefore present the financial position results fairly. Although these estimates and judgment are based on the Manager’s best knowledge of current events and actions, actual results may differ. There are involving a higher degree of judgement or complexity, or areas where assumptions and estimates are significant to the financial statements are disclosed in Notes 2(m).

CIMB FTSE CHINA 25
16
2. SUMMARY OF SIGNIFICANT ACCOUNTING POLICIES (CONTINUED) (a) Basis of preparation (continued)
(i) The amendments to published standards that are applicable and effective for Fund’s financial year beginning on or after 1 October 2011 are as follows:
• Amendments to FRS 7 “Financial instruments: Disclosures” (effective 1
January 2011) requires enhanced disclosures about fair value measurement and liquidity risk. In particular, the amendment requires disclosure of fair value measurements by level of a fair value measurement hierarchy. This amendment does not have any impact on the classification and valuation of the Fund’s financial statements.
(ii) The standards, amendments to published standards and interpretations to
existing standards that are applicable to the Fund but not yet effective and have not been early adopted are as follows:
• Financial year beginning on/after 1 October 2012
In the financial year beginning on 1 September 2012, the Fund will be
adopting the new IFRS-compliant framework, Malaysian Financial Reporting Standards (“MFRS”). MFRS 1 “First-time adoption of MFRS” provides for certain optional exemptions and certain mandatory exceptions for first-time MFRS adopters. There is no significant impact to the Fund’s financial statements arising from the transition of existing FRSs to MFRSs.
• Financial year beginning on/after 1 October 2013
MFRS 13 “Fair value measurement” (effective from 1 January 2013) aims to improve consistency and reduce complexity by providing a precise definition of fair value and a single source of fair value measurement and disclosure requirements for use across MFRSs. The requirements do not extend the use of fair value accounting but provide guidance on how it should be applied where its use is already required or permitted by other standards. The enhanced disclosure requirements are similar to those in MFRS 7 “Financial instruments: Disclosures”, but apply to all assets and liabilities measured at fair value, not just financial ones. The Fund will apply this standard when effective. This standard is not expected to have a significant impact on the Fund’s financial statements.
• Financial year beginning on/after 1 October 2015
MFRS 9 “Financial instruments - classification and measurement of financial assets and financial liabilities” (effective from 1 January 2015) replaces the multiple classification and measurement models in MFRS 139 with a single model that has only two classification categories: amortised cost and fair value. The basis of classification depends on the entity’s business model for managing the financial assets and the contractual cash flow characteristics of the financial asset.

CIMB FTSE CHINA 25
17
2. SUMMARY OF SIGNIFICANT ACCOUNTING POLICIES (CONTINUED)
(a) Basis of preparation (continued)
• Financial year beginning on/after 1 October 2015 (continued)
The accounting and presentation for financial liabilities and for de- recognising financial instruments has been relocated from MFRS 139, without change, except for financial liabilities that are designated at fair value through profit or loss (“FVTPL”). Entities with financial liabilities designated at FVTPL recognise changes in the fair value due to changes in the liability’s credit risk directly in other comprehensive income (OCI). There is no subsequent recycling of the amounts in OCI to profit or loss, but accumulated gains or losses may be transferred within equity. The guidance in MFRS 139 on impairment of financial assets and hedge accounting continues to apply. The Fund will apply this standard when effective. MFRS 7 requires disclosure on transition from MFRS 139 to MFRS 9. This standard is not expected to have a significant impact on the Fund’s financial statements.
(b) Financial assets and liabilities
Classification The Fund designates its investment in quoted investments as financial assets at fair value through profit or loss at inception. Financial assets are designated at fair value through profit or loss when they are managed and their performance evaluated on a fair value basis. Loans and receivables are non-derivative financial assets with fixed or determinable payments that are not quoted in an active market and have been included in current assets. The Fund’s loans and receivables comprise dividend receivable, cash and cash equivalents. The Fund classifies amount due to Manager, amount due to Trustee, other payables and accruals as other financial liabilities. Recognition and measurement Regular purchases and sales of financial assets are recognised on the trade date, the date on which the Fund commits to purchase or sell the asset. Investments are initially recognised at fair value. Transaction costs are expensed in the statement of comprehensive income.

CIMB FTSE CHINA 25
18
2. SUMMARY OF SIGNIFICANT ACCOUNTING POLICIES (CONTINUED)
(b) Financial assets and liabilities (continued) Recognition and measurement (continued) Financial liabilities, within the scope of FRS 139, are recognised in the statement of financial position when, and only when, the Fund becomes a party to the contractual provisions of the financial instrument. Financial assets are derecognised when the rights to receive cash flows from the investments have expired or have been transferred and the Fund has transferred substantially all risks and rewards of ownership. Financial liabilities are derecognised when it is extinguished, i.e. when the obligation specified in the contract is discharged or cancelled or expires. Gains or losses arising from changes in the fair value of the investments including the effect of currency translation are presented in the statement of comprehensive income within net gain or loss on financial assets at fair value through profit or loss in the period which they arise. Dividend income from financial assets at fair value through profit or loss is recognised in the statement of comprehensive income as part of gross dividend income when the Fund’s right to receive payments is established. Foreign quoted investments are valued at the bid prices quoted on the respective foreign stock exchanges at the close of the business day of the respective foreign stock exchanges. Loans and receivables and other financial liabilities are subsequently carried at amortised cost using the effective interest method. For assets carried at amortised cost, the Fund assesses at the end of the reporting period whether there is objective evidence that a financial asset or group of financial assets is impaired. A financial asset or a group of financial assets is impaired and impairment losses are incurred only if there is objective evidence of impairment as a result of one or more events that occurred after the initial recognition of the asset (a ‘loss event’) and that loss event (or events) has an impact on the estimated future cash flows of the financial asset or group of financial assets that can be reliably estimated. The amount of the loss is measured as the difference between the asset’s carrying amount and the present value of estimated future cash flows (excluding future credit losses that have not been incurred) discounted at the financial asset’s original effective interest rate. The asset’s carrying amount of the asset is reduced and the amount of the loss is recognised in profit or loss. If ‘loans and receivables’ or a ‘held-to-maturity investment’ has a variable profit rate, the discount rate for measuring any impairment loss is the current effective profit rate determined under the contract. As a practical expedient, the Fund may measure impairment on the basis of an instrument’s fair value using an observable market price.

CIMB FTSE CHINA 25
19
2. SUMMARY OF SIGNIFICANT ACCOUNTING POLICIES (CONTINUED)
(b) Financial assets and liabilities (continued)
Recognition and measurement (continued) If, in a subsequent period, the amount of the impairment loss decreases and the decrease can be related objectively to an event occurring after the impairment was recognised (such as an improvement in the debtor’s credit rating), the reversal of the previously recognised impairment loss is recognised in statement of comprehensive income. When an asset is uncollectible, it is written off against the related allowance account. Such assets are written off after all the necessary procedures have been completed and the amount of the loss has been determined.
(c) Income recognition Dividend income is recognised on the ex-dividend date. Interest on deposits is recognised on accruals basis using the effective interest
method. Realised gain or loss on sale of investments is accounted for as the difference
between the net disposal proceeds and the carrying amount of investments, determined on a weighted average cost basis.
(d) Foreign currencies Functional and presentation currency Items included in the financial statements of the Fund are measured using the
currency of the primary economic environment in which the Fund operates (the “functional currency”). The financial statements are presented in Ringgit Malaysia, which is the Fund’s functional and presentation currency.
Transactions and balances Foreign currency transactions are translated into the functional currency using the
exchange rates prevailing at the dates of the transactions or valuation where items are remeasured. Foreign exchange gains and losses resulting from the settlement of such transactions and from the translation at period-end exchange rates of monetary assets and liabilities denominated in foreign currencies are recognised in profit or loss, except when deferred in other comprehensive income as qualifying cash flow hedges.
(e) Creation and cancellation of units The Fund issues cancellable units, which are cancelled upon accepted redemption
applications submitted by Participating Dealer to the Manager in accordance with the terms of a Participating Dealer Agreement and the Deed, and are classified as equity. Cancellable units can be returned to the Fund at any Dealing Day for cash equal to a proportionate share of the Fund’s net asset value (“NAV”). The outstanding units are carried at the redemption amount that is payable at the statement of financial position date if the unitholder exercises the right to return the unit to the Fund.

CIMB FTSE CHINA 25
20
2. SUMMARY OF SIGNIFICANT ACCOUNTING POLICIES (CONTINUED) (e) Creation and cancellation of units (continued)
Units are created and cancelled at the Participating Dealer’s option at prices based on the Fund’s NAV per unit at the time of creation or cancellation. The Fund’s NAV per unit is calculated by dividing the net assets attributable to unit holders with the total number of outstanding units. The units in the Fund are puttable instruments which entitle the unitholders to a pro-rata share of the net asset of the Fund. The units are subordinated and have identical features. There is no contractual obligations to deliver cash or another financial asset other than the obligation on the Fund to repurchase the units. The total expected cash flows from the units in the Fund over the life of the units are based on the change in the net asset of the Fund.
(f) Cash and cash equivalents
For the purpose of statement of cash flows, cash and cash equivalents comprise cash, bank balances and deposits held in highly liquid investments that are readily convertible to known amounts of cash and which are subject to an insignificant risk of changes in value.
(g) Taxation Current tax expense is determined according to Malaysian tax laws at the current rate
based upon the taxable profit earned during the financial period. Tax on dividend income from foreign quoted investments is based on the tax regime of the respective countries that the Fund invests in.
(h) Amount due from / to stockbrokers
Amounts due from/to brokers represent receivables for securities sold and payables for securities purchased that have been contracted for but not yet settled or delivered on the statement of financial position date respectively. These amounts are recognised initially at fair value and subsequently measured at amortised cost using the effective interest method, less provision for impairment for amounts due from brokers. A provision for impairment of amounts due from brokers is established when there is objective evidence that the Fund will not be able to collect all amounts due from the relevant broker. Significant financial difficulties of the broker, probability that the broker will enter bankruptcy or financial reorganisation, and default in payments are considered indicators that the amount due from brokers is impaired. Once a financial asset or a group of similar financial assets has been written down as a result of an impairment loss, interest income is recognised using the interest rate used to discount the future cash flows for the purpose of measuring the impairment loss. The effective interest method is a method of calculating the amortised cost of a financial asset or financial liability and of allocating the interest income or interest expense over the relevant period. The effective interest rate is the rate that exactly discounts estimated future cash payments or receipts throughout the expected life of the financial instrument, or, when appropriate, a shorter period, to the net carrying amount of the financial asset or financial liability. When calculating the effective interest rate, the Fund estimates cash flows considering all contractual terms of the financial instrument but does not consider future credit losses. The calculation includes all fees and points paid or received between parties to the contract that are an integral part of the effective interest rate, transaction costs and all other premiums or discounts.

CIMB FTSE CHINA 25
21
2. SUMMARY OF SIGNIFICANT ACCOUNTING POLICIES (CONTINUED)
(i) Transaction costs Transaction costs are costs incurred to acquire financial assets or liabilities at fair value
through profit or loss. They include the bid-ask spread, fees and commissions paid to agents, advisors, brokers and dealers. Transaction costs, when incurred, are immediately recognised in the statement of comprehensive income as expenses.
(j) Segmental information A business segment is a group of assets and operations engaged in providing
products or services that are subject to risks and returns that are different from those of other business segments. A geographic segment is engaged in providing products or services within a particular economic environment that are subject to risks and returns that are different from those of segments operating in other economic environments.
Operating segments are reported in a manner consistent with the internal reporting
used by the chief operating decision-maker. The chief operating decision-maker, who is responsible for allocating resources and assessing performance of the operating segments, has been identified as the Investment Committee of the Fund’s manager that undertakes strategic decisions for the Fund.
(k) Financial instruments
Financial instruments comprise financial assets and financial liabilities. Fair value is the amount at which a financial asset could be exchanged between knowledgeable and willing parties in an arm’s length transaction. The information presented herein represents the estimates of fair values as at the date of the statement of financial position. Financial instruments of the Fund are as follows:
Financial assets Loans and at fair value through
receivables profit or loss Total30.09.2012 RM RM RMFinancial assets at fair value through profit or loss (Note 8) - 14,796,251 14,796,251Cash and cash equivalents (Note 9) 52,999 - 52,999Amount due to broker - - -Dividend receivables 41,296 - 41,296 94,295 14,796,251 14,890,546
30.09.2011 Financial assets at fair value through profit or loss (Note 8) - 10,761,951 10,761,951Cash and cash equivalents (Note 9) 24,242 - 24,242Amount due to broker 37,127 - 37,127Dividend receivables 43,272 - 43,272 104,641 10,761,951 10,866,592 All current liabilities are financial liabilities which are carried at amortised cost.

CIMB FTSE CHINA 25
22
2. SUMMARY OF SIGNIFICANT ACCOUNTING POLICIES (CONTINUED)
(l) Realised and unrealised portions of net income after tax
The analysis of realised and unrealised net income after tax as presented on the statement of comprehensive income is prepared in accordance with Securities Commission Guidelines on Exchange-Traded Funds.
(m) Critical accounting estimates and judgments in applying accounting policies The preparation of financial statements in conformity with FRS and requires the use of
estimates and assumptions that affect the reported amounts of assets and liabilities at the date of the financial statements, and the reported amounts of income and expenses during the reported financial period. Although these estimates are based on the Manager’s best knowledge of current events and actions, actual results may differ from those estimates.
Estimates and judgments are continually evaluated by the Manager and are based on
historical experience and other factors, including expectations of future events that are believed to be reasonable under the circumstances.
The Fund makes estimates and assumptions concerning the future. The resulting
accounting estimates will, by definition, rarely equal the related actual results. To enhance the information content of the estimates, certain key variables that are anticipated to have material impact to the Funds’ results and financial position are tested for sensitivity to changes in the underlying parameters.
3. RISK MANAGEMENT OBJECTIVES AND POLICIES
The investment objective of the Fund is to provide investment results that, before expenses, closely correspond to the performance of the FTSE China 25 Index, regardless of its performance. Therefore, the Manager adopts a passive strategy in the management of the Fund. The Fund is exposed to a variety of risks which include market risk (price risk, interest rate risk and currency risk), credit risk, liquidity risk, single issuer risk, non-compliance risk and capital risk. Financial risk management is carried out through internal control process adopted by the Manager and adherence to the investment restrictions as stipulated by the Securities Commission Guidelines on Exchange-Traded Fund.

CIMB FTSE CHINA 25
23
3. RISK MANAGEMENT OBJECTIVES AND POLICIES (CONTINUED) (a) Market risk
(i) Price risk The Fund is exposed to equity securities price risk arising from investments held by the Fund for which prices in the future are uncertain. The very nature of an exchange-traded fund, however, helps mitigate this risk because a fund would generally hold a well-diversified portfolio of securities from different market sectors so that the collapse of any one security or any one market sector would not impact too greatly on the value of the fund. The Fund’s overall exposures to price risk were as follows: 30.09.2012 30.09.2011 RM RM Financial assets at fair value through profit and loss 14,796,251 10,761,951 ════════ ════════ The table below summarises the sensitivity of the Fund’s net asset value to movements in prices of FTSE China 25 Index (the “Underlying Index”). The analysis is based on the assumptions that the Underlying Index fluctuates by 31.58% (30.09.2011:18.80%), which is the standard deviation of the daily fluctuation of the Underlying Index, with all other variables held constant, and that the fair value of the investments moved in the same quantum with the fluctuation in the Index. This represents management’s best estimate of a reasonable possible shift in the fair value through profit and loss, having regard to the historical volatility of the prices. The Underlying Index is used as the Fund is designed to provide investment results that closely correspond to the performance of the Underlying Index.
% Change in
underlying index
Underlyingindex
Market value
RM
Change in net asset
value/profit after tax
RM30.09.2012
-31.58% 10,123,595 (4,672,656)0.00% 14,796,251 -
31.58% 19,468,907 4,672,656════════ ════════ ════════ ════════
30.09.2011
-18.80% 15,290 8,738,704 (2,023,247)0.00% 18,830 10,761,951 -
18.80% 22,370 12,785,198 2,023,247════════ ════════ ════════ ════════

CIMB FTSE CHINA 25
24
3. RISK MANAGEMENT OBJECTIVES AND POLICIES (CONTINUED)
(a) Market risk (continued)
(ii) Currency risk The Fund’s investments are denominated in foreign currencies. Foreign currency risk is the risk that the value of financial instruments will fluctuate due to changes in foreign exchange rates. The Manager will evaluate the likely directions of a foreign currency versus Ringgit Malaysia based on considerations of economic fundamentals such as interest rate differentials, balance of payments position, debt levels, and technical chart considerations. The following table sets out the foreign currency risk concentrations of the Fund arising from the denomination of the Fund’s financial instruments in foreign currency.
The table below summarises the sensitivity of the Fund's investments, cash and cash equivalent fair value to changes in foreign exchange movements for the Fund. The analysis is based on the assumption that the foreign exchange rate fluctuates by 7.49% (2011: 6.20%), which is the standard deviation of the daily fluctuation of the exchange rate of HKD against MYR, with all other variables remain constants. This represents management's best estimate of a reasonable possible shift in the foreign exchange rate, having regard to historical volatility of this rate. Any fluctuation in foreign exchange rate will result in a corresponding increase/decrease in the net assets attributable to unitholders by approximately 7.49% (2011: 6.20%). Disclosures below are shown in absolute terms, changes and impacts could be positive or negative. Change in
foreignexchange rate
Impact on net asset value/ profit after tax
% RM30.09.2012 HKD 7.49 1,109,639 ═════════ ═════════
30.09.2011 HKD 6.20 668,292 ═════════ ═════════
Financial
assets at fair value through profit or loss
Cash and cash
equivalents Total30.09.2012 RM RM
RM
HKD 14,796,251 18,690 14,814,941 ══════════ ══════════ ══════════
30.09.2011 HKD 10,761,951 16,951 10,778,902 ══════════ ══════════ ══════════

CIMB FTSE CHINA 25
25
3. RISK MANAGEMENT OBJECTIVES AND POLICIES (CONTINUED)
(b) Credit risk Credit risk refers to the risk that a counterparty will default on its contractual obligations
resulting in financial loss to the Fund. The credit risk arising from placements of deposits in licensed financial institutions is
managed by ensuring that the Fund will only place deposits in reputable licensed financial institutions. The settlement terms of the proceeds from the creation of units receivable from the Manager are governed by the Securities Commission Guidelines on Exchange-Traded Funds.
Bank balances of the Fund are placed with a licensed bank with a credit rating AA1 (2011: AA1).
The following table sets out the credit risk concentrations of the Fund:
All financial assets of the Fund are neither past due nor impaired. At the end of each reporting period, all cash and cash equivalents are placed with Deutsche Bank.
Industry
Cash and cash
equivalents
Amount due from
brokerDividends
receivables Total RM RM RM RM30.09.2012 Energy - - 20,267 20,267Finance 52,999 - - 52,999Telecommunications - - 19,827 19,827Insurance - - 1,202 1,202 ─────── ─────── ─────── ───────Total 52,999 - 41,296 94,295 ═══════ ═══════ ═══════ ═══════30.09.2011 Energy - - 19,204 19,204Finance 24,242 37,127 - 61,369Telecommunications - - 24,068 24,068 ─────── ─────── ─────── ───────Total 24,242 37,127 43,272 104,641 ═══════ ═══════ ═══════ ═══════

CIMB FTSE CHINA 25
26
3. RISK MANAGEMENT OBJECTIVES AND POLICIES (CONTINUED) (c) Liquidity risk
Liquidity risk can be defined as the ease with which a security can be sold at or near its fair value depending on the volume traded in the market. If a security encounters a liquidity crunch, the security may need to be sold at a discount to the market fair value of the security. This in turn would depress the NAV and/or growth of the Fund. Generally, all investments are subject to a certain degree of liquidity risk depending on the nature of the investment instruments, market, sector and other factors. For the purpose of the Fund, the fund manager will attempt to balance the entire portfolio by investing in a mix of assets with satisfactory trading volume and those that occasionally could encounter poor liquidity. This is expected to reduce the risks for the entire portfolio without limiting the Fund’s growth potentials. The Manager manages this risk by maintaining sufficient level of liquid assets to meet anticipated payments and cancellations of the units by unitholders. Liquid assets comprise bank balance, deposits with licensed financial institutions and other instruments, which are capable of being converted into cash within 7 business days. The Fund has a policy of maintaining a minimum level of 2% of liquid assets at all times to reduce the liquidity risk. The table below summarises the Fund’s financial liabilities into relevant maturity groupings based on the remaining period as at the end of the reporting period to the contractual maturity date. The amounts in the table are the contractual undiscounted cash flows.
(d) Non-compliance risk Non-compliance risk arises when the Manager and others associated with the Fund do
not follow the rules set out in the Fund’s constitution, or the law that govern the Fund, or act fraudulently or dishonestly. It also includes the risk of the Manager not complying with internal control procedures. The non-compliance may expose the Fund to higher risks which may result in a fall in the value of the Fund which in turn may affect its investment goals. However, the risk can be mitigated by the internal controls and compliance monitoring undertaken by the manager.
Less than Less than 1 month 1 year Total RM RM RM30.09.2012 Amount due to trustee 986 - 986Other payables and accruals 5,903 44,744 44,744
───── ───── ─────Contractual cash out flows 6,889 44,744 51,633 ═══════ ═══════ ═══════
30.09.2011 Amount due to trustee 1,480 - 1,480Other payables and accruals 5,633 44,037 49,670
───── ───── ─────Contractual cash out flows 7,113 44,037 51,150 ═══════ ═══════ ═══════

CIMB FTSE CHINA 25
27
3. RISK MANAGEMENT OBJECTIVES AND POLICIES (CONTINUED) (e) Capital risk management
The capital of the Fund is represented by equity consisting of unitholders’ capital and retained earnings. The amount of equity can change significantly on a daily basis as the Fund is subject to daily subscriptions and redemptions at the discretion of unitholders. The Manager will provide In-Kind Creation Basket which comprises a portfolio of the Underlying Index shares in substantially the same composition and weighting as the Underlying Index and cash component to be delivered by the Participating Dealer in the case of creations and to be transferred to the Participating Dealer in the case of cancellations. The Fund maintains sufficient quantity of shares and cash in proportion to the In-Kind Basket. The Fund’s objective when managing capital is to safeguard the Fund’s ability to continue as a going concern in order to provide returns for shareholders and benefits for other stakeholders and to maintain a strong capital base to support the development of the investment activities of the Fund.
(f) Fair value estimation The fair value of financial assets and liabilities traded in active market (such as publicly traded derivatives and trading securities) are based on quoted market prices at the close of trading on the year end date. The quoted market price used for financial assets by the Fund is the current bid price; the appropriate quoted market price for financial liabilities is the current asking price. A financial instrument is regarded as quoted in an active market if quoted prices are readily and regularly available from an exchange, dealer, broker, industry group, pricing service, or regulatory agency, and those prices represent actual and regularly occurring market transactions on an arm’s length basis. The fair value of financial assets and liabilities that are not traded in an active market is determined by using valuation techniques. The Fund uses a variety of methods and makes assumptions that are based on market conditions existing at each period end date. Valuation techniques used for non-standardised financial instruments such as options, currency swaps and other over-the-counter derivatives, include the use of comparable recent arm’s length transactions, reference to other instruments that are substantially the same, discounted cash flow analysis, option pricing models and other valuation techniques commonly used by market participants making the maximum use of market inputs and relying as little as possible on entity-specific inputs. For instruments for which there is no active market, the Fund may use internally developed models, which are usually based on valuation methods and techniques generally recognised as standard within the industry. Valuation models are used primarily to value unlisted equity, debt securities and other debt instruments for which market were or have been inactive during the financial period. Some of the inputs to these models may not be market observable and are therefore estimated based on assumptions. The output of a model is always an estimate or approximation of a value that cannot be determined with certainty, and valuation techniques employed may not fully reflect all factors relevant to the positions the Fund holds. Valuations are therefore adjusted, where appropriate, to allow for additional factors including model risk, liquidity risk and counterparty risk.

CIMB FTSE CHINA 25
28
3. RISK MANAGEMENT OBJECTIVES AND POLICIES (CONTINUED)
(f) Fair value estimation (continued) The fair value are based on the following methodology and assumptions: (i) Bank balance and deposits and placements with financial institutions with
maturities less than 1 year, the carrying value is a reasonable estimate of fair value.
(ii) The carrying value less impairment provision of receivables and payables are assumed to approximate their fair values. The carrying value of the financial assets and financial liabilities approximate their fair value due to their short term nature.
Fair value hierarchy The Fund adopted the amendments to FRS 7, effective 1 January 2011. This requires the Fund to classify fair value measurements using a fair value hierarchy that reflects the significance of the inputs used in making the measurements. The fair value hierarchy has the following levels: • Quoted prices (unadjusted) in active market for identical assets or liabilities
(Level 1) • Inputs other than quoted prices included within Level 1 that are observable for
the asset or liability, either directly (that is, as prices) or indirectly (that is, derived from prices) (Level 2)
• Inputs for the asset and liability that are not based on observable market data (that is, unobservable inputs) (Level 3)
The level in the fair value hierarchy within which the fair value measurement is categorized in its entirety is determined on the basis of the lowest level input that is significant to the fair value measurement in its entirety. For this purpose, the significance of an input is assessed against the fair value measurement in its entirety. If a fair value measurement uses observable inputs that require significant adjustment based on unobservable inputs, that measurement is a Level 3 measurement. Assessing the significance of a particular input to the fair value measurement in its entirety requires judgment, considering factors specific to the asset or liability. The determination of what constitutes ‘observable’ requires significant judgment by the Fund. The Fund considers observable data to be that market data that is readily available, regularly distributed or updated, reliable and verifiable, not proprietary, and provided by independent sources that are actively involved in the relevant market.
Investments whose values are based on quoted market prices in active markets, and are therefore classified within Level 1, include active listed equities. The Fund does not adjust the quoted prices for these instruments. The Fund’s policies on valuation of these financial assets are stated in Note 2(b).
Level 1 Level 2 Level 3 Total RM RM RM RMFinancial assets at fair value through profit or loss:
- Quoted securities 14,796,251 - - 14,796,251

CIMB FTSE CHINA 25
29
4. MANAGEMENT FEE
In accordance with Clause 15.1 of the Deed, the Manager is entitled to a fee of up to 3.00% per annum calculated and accrued daily based on the net asset value of the Fund. For the financial period ended 30 September 2012, the management fee is recognised at a rate of 0.60% per annum (2011: 0.60%).
There will be no further liability to the Manager in respect of management fee other than the amounts recognised above.
5. TRUSTEE FEE
In accordance with Clause 15.2 of the Deed, the Trustee is entitled to a fee not exceeding a maximum 0.20% per annum, calculated based on the net asset value of the Fund, subject to a minimum fee of RM18,000 per annum, excluding foreign sub-custodian fees and charges. For the financial period ended 30 September 2012, the Trustee fee is recognised at a rate of 0.08% per annum (2011: 0.08%). The Trustee’s fee for the financial period ended 30 June 2011 was calculated prorate based on the minimum fees of RM 18,000 per annum. The Trustee has changed the minimum fees to RM12,000 per annum with effect from 1 June 2012.
There will be no further liability to the Trustee in respect of trustee fee other than the amounts recognised above.
6. LICENSE FEE
License fee is payable to FTSE International Limited, the Underlying Index provider. For the financial period ended 30 September 2012, the License fee was recognised at a rate of 0.04% per annum of the net asset value of the Fund, calculated on daily basis. There will be no further liability to the FTSE International Limited in respect of license fee other than the amounts recognised above.
CIMB FTSE CHINA 25
30
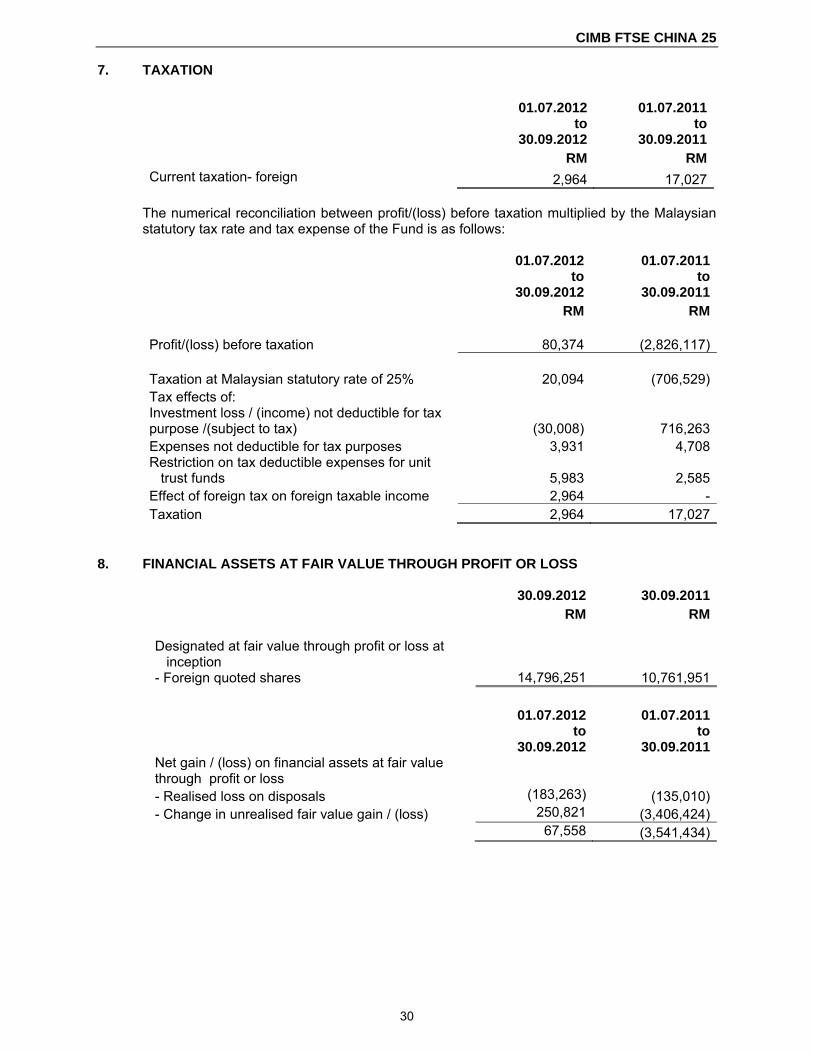
7. TAXATION
01.07.2012
to 30.09.2012
01.07.2011 to
30.09.2011 RM RMCurrent taxation- foreign 2,964 17,027
The numerical reconciliation between profit/(loss) before taxation multiplied by the Malaysian statutory tax rate and tax expense of the Fund is as follows:
01.07.2012 to
30.09.2012
01.07.2011 to
30.09.2011 RM RM Profit/(loss) before taxation 80,374 (2,826,117) Taxation at Malaysian statutory rate of 25% 20,094 (706,529)Tax effects of: Investment loss / (income) not deductible for tax purpose /(subject to tax) (30,008) 716,263Expenses not deductible for tax purposes 3,931 4,708Restriction on tax deductible expenses for unit trust funds 5,983 2,585Effect of foreign tax on foreign taxable income 2,964 -Taxation 2,964 17,027
8. FINANCIAL ASSETS AT FAIR VALUE THROUGH PROFIT OR LOSS
30.09.2012 30.09.2011 RM RM Designated at fair value through profit or loss at inception - Foreign quoted shares 14,796,251 10,761,951
01.07.2012 to
30.09.2012
01.07.2011 to
30.09.2011Net gain / (loss) on financial assets at fair value through profit or loss - Realised loss on disposals (183,263) (135,010)- Change in unrealised fair value gain / (loss) 250,821 (3,406,424) 67,558 (3,541,434)

CIMB FTSE CHINA 25
31
8. FINANCIAL ASSETS AT FAIR VALUE THROUGH PROFIT OR LOSS (CONTINUED)
As at 30.09.2012 Percentage
Aggregate Market of net asset cost value value
Quantity RM RM % Agricultural Bank of China 518,400 754,313 618,243 4.17Aluminium Corporation Of ChinaLtd 89,100 200,271 112,946 0.76Anhui Conch Cement CorporationLtd 29,700 292,711 283,244 1.91
Bank of China Ltd 766,800 1,057,247 893,287 6.02Bank of CommunicationCorporation Ltd 243,000 657,309 504,753 3.40
China CITIC Bank Corporation Ltd 261,900 487,093 380,601 2.56China Coal Energy Corporation Ltd 94,500 367,929 264,212 1.78China Construction BankCorporation Ltd 645,300 1,581,954 1,370,980 9.24
China Life Insurance CorporationLtd 64,800 739,195 573,205 3.86China Merchants Bank 91,800 644,760 473,449 3.19China Minsheng BankingCorporation Ltd 135,000 361,102 326,266 2.20
China Mobile Ltd 43,200 1,401,934 1,466,280 9.88China Overseas Land & Investment Ltd 75,600 586,287 588,730 3.97
China Pacific Insurance 54,000 599,118 500,062 3.37China Petroleum & Chemical
Corporation (SINOPEC) 202,500 541,611 578,963 3.90
China Shenhua Energy CompanyLtd 48,600 579,870 577,683 3.89
China Telecom Corporation Ltd 310,500 511,158 549,322 3.70China Unicom 113,400 537,010 569,623 3.84CNOOC Ltd 170,100 1,001,035 1,068,043 7.20Industrial and Commercial Bank of China Ltd 680,400 1,461,297 1,230,600 8.29
Petrochina Corporation Ltd 151,200 573,312 606,642 4.09PICC Property and Casualty Company Ltd 86,400 372,667 324,816 2.19
Ping An Insurance Group Corp of China Ltd 24,300 689,827 562,330 3.79
Yanzhou Coal Mining Corporation Ltd 43,200 369,452 201,645 1.36
Zijin Mining Group Corporation Ltd 137,800 200,673 170,326 1.15
TOTAL QUOTED INVESTMENTS 5,081,500 16,569,135 14,796,251 99.71
UNREALISED GAIN ON FINANCIAL ASSETS AT FAIR VALUE THROUGH PROFIT OR LOSS
(1,447,043)
EFFECT OF UNREALISED FOREIGN EXCHANGE DIFFERENCES
(325,841)
TOTAL FINANCIAL ASSETS AT FAIR VALUE THROUGH PROFIT OR LOSS
14,796,251
═════════

CIMB FTSE CHINA 25
32
8. FINANCIAL ASSETS AT FAIR VALUE THROUGH PROFIT OR LOSS (CONTINUED)
As at 30.09.2011 Percentage Aggregate Market of net asset cost value value Quantity RM RM %Agricultural Bank of China 378,000 601,758 399,068 3.69Air China Ltd 48,300 174,183 108,506 1.00Aluminium Corporation Of China Ltd
84,000 211,990 119,617 1.11
Anhui Conch Cement Corporation Ltd
27,300 269,869 241,297 2.23
Bank of China Ltd 399,000 641,890 400,014 3.70Bank of Communication Corporation Ltd
189,000 575,561 362,719 3.35
China CITIC Bank Corporation Ltd 231,000 457,884 305,316 2.82China Coal Energy Corporation Ltd 84,000 352,985 243,016 2.25China Construction Bank Corporation Ltd
483,000 1,256,744 946,713 8.75
China COSCO Holdings 52,500 170,220 69,605 0.64China Life Insurance Corporation Ltd
63,000 771,638 484,656 4.48
China Merchants Bank 73,500 570,084 360,313 3.33China Minsheng Banking Corporation Ltd
84,000 224,450 164,646 1.52
China Mobile Ltd 37,800 1,208,460 1,192,564 11.03China Pacific Insurance 37,800 467,228 351,892 3.25China Petroleum & Chemical Corporation (SINOPEC)
159,600 415,265 501,568 4.64
China Shenhua Energy Company Ltd
35,700 428,583 453,592 4.19
China Telecom Corporation Ltd 231,000 358,989 468,845 4.34China Unicom 67,200 296,797 446,572 4.13CNOOC Ltd 153,300 886,857 815,495 7.54Industrial and Commercial Bank of China Ltd
504,000 1,158,328 787,825 7.28
Petrochina Corporation Ltd 189,000 697,279 747,866 6.92Ping An Insurance Group Corp of China Ltd
21,000 627,619 379,819 3.51
Yanzhou Coal Mining Corporation Ltd
42,000 413,869 294,231 2.72
Zijin Mining Group Corporation Ltd 124,000 189,158 116,196 1.08TOTAL QUOTED INVESTMENTS 3,799,000 13,427,688 10,761,951 99.50 UNREALISED GAIN ON FINANCIAL ASSETS AT FAIR VALUE THROUGH PROFIT OR LOSS 144,163 EFFECT OF UNREALISED FOREIGN EXCHANGE DIFFERENCES (2,809,900)
─────────
TOTAL FINANCIAL ASSETS AT FAIR VALUE THROUGH PROFIT OR LOSS 10,761,951 ═════════

CIMB FTSE CHINA 25
33
9. CASH AND CASH EQUIVALENTS 30.09.2012 30.09.2011 RM RM
Bank balances in a licensed bank 52,999 24,242 The currency profile of cash and cash equivalents is as follows:
30.09.2012 30.09.2011 RM RM - Ringgit Malaysia 35,009 7,291- Hong Kong Dollar 17,990 16,951 52,999 24,242
10. OTHER PAYABLES AND ACCRUALS
30.09.2012 30.09.2011 RM RMProvision for audit fee 28,551 31,301Provision for tax agent fee 2,457 3,756Other accruals 13,736 8,980 44,744 44,037

CIMB FTSE CHINA 25
34
11. NUMBER OF UNITS IN CIRCULATION AND NET ASSETS ATTRIBUTABLE TO UNITHOLDERS Net Asset Value (NAV) attributable to unit holders is represented by:
Note 30.09.2012 30.09.2011 RM RMUnit holders’ contribution (a) 16,749,915 13,476,255Accumulated losses (1,911,002) (2,660,813) 14,838,913 10,815,442
(a) UNIT HOLDERS’ CONTRIBUTION/ UNIT IN CIRCULATION
30.09.2012 30.09.2011 No of units RM No of units RM At the beginning of the financial period 13,650,000 11,487,843 13,650,000 13,624,532Add: Creations arising from application 3,900,000 3,273,660 - -Less: Cancellation of units - -Total comprehensive income income for the financial period - 77,410 - (2,809,090)At end of the financial period 17,550,000 14,838,913 13,650,000 10,815,442 Approved size of the Fund 500,000,000 500,000,000
In accordance with the Deed, the Manager may increase the size of the Fund from time to time with the approval of the Trustee and the Securities Commission. The maximum number of units that can be issued out for circulation of the Fund is 500,000,000. As at 30 September 2012 the number of units not yet issued is 482,450,000 (30.09.2011: 486,350,000).
The Manager, CIMB-Principal Asset Management Berhad, did not hold any units in the Fund
as at 30 September 2012.
CIMB FTSE CHINA 25
35
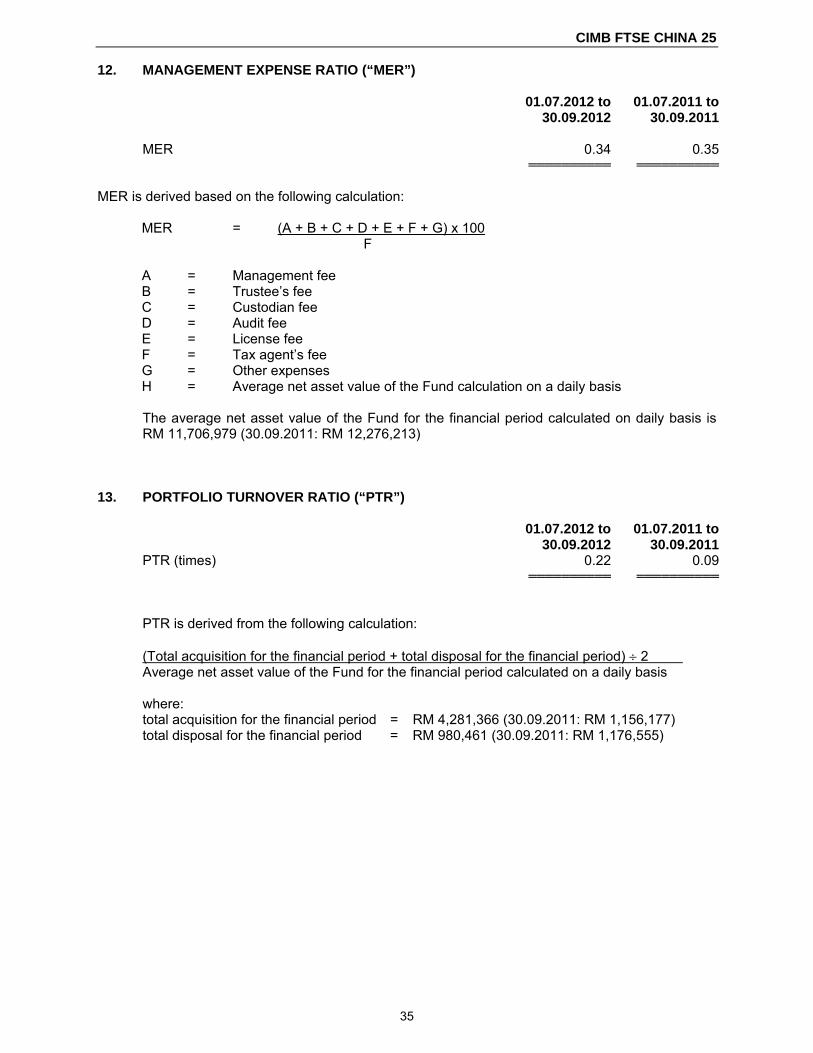
12. MANAGEMENT EXPENSE RATIO (“MER”) 01.07.2012 to 01.07.2011 to 30.09.2012 30.09.2011
MER 0.34 0.35 ══════════ ══════════
MER is derived based on the following calculation:
MER = (A + B + C + D + E + F + G) x 100 F A = Management fee B = Trustee’s fee C = Custodian fee D = Audit fee E = License fee F = Tax agent’s fee G = Other expenses H = Average net asset value of the Fund calculation on a daily basis The average net asset value of the Fund for the financial period calculated on daily basis is RM 11,706,979 (30.09.2011: RM 12,276,213)
13. PORTFOLIO TURNOVER RATIO (“PTR”) 01.07.2012 to 01.07.2011 to 30.09.2012 30.09.2011
PTR (times) 0.22 0.09 ══════════ ══════════
PTR is derived from the following calculation: (Total acquisition for the financial period + total disposal for the financial period) ÷ 2 . Average net asset value of the Fund for the financial period calculated on a daily basis where: total acquisition for the financial period = RM 4,281,366 (30.09.2011: RM 1,156,177) total disposal for the financial period = RM 980,461 (30.09.2011: RM 1,176,555)

CIMB FTSE CHINA 25
36
14. UNITS HELD BY THE MANAGER AND RELATED PARTIES TRANSACTIONS AND BALANCES
The related parties and their relationship with the Fund are as follows: Related parties Relationship CIMB-Principal Asset Management Berhad The Manager
CIMB Group Sdn Berhad Holding company of the Manager
CIMB Group Holdings Berhad (“CIMB”) Ultimate holding company of the Manager
CIMB Bank Berhad Fellow subsidiary to the Manager
CIMB Investment Bank Berhad Fellow subsidiary of the Manager
Subsidiaries and associates of CIMB as Subsidiary and associated companies disclosed in its financial statements of the ultimate holding company of the Manager
Units held by the Manager and parties related to the Manager There were no units held by the Manager and parties related to the Manager as at the end of the financial year/period.
In addition to related party disclosure mentioned elsewhere in the financial statements, there
are no other significant related party transactions and balances. 15. TRANSACTIONS WITH BROKERS/DEALERS
Details of transactions with all brokers for the financial period ended 30 September 2012 are as follows:
Value of
trades
Percentage of total trades
Brokerage fees
Percentage of total
brokerage fees
Brokers/dealers RM % RM %BNP Paribas Securities Asia Ltd 3,263,088 64.26 5,813 90.42Citigroup Global Markets Asia Ltd (Hk) 1,525,854 30.04 2,416 2.11China International Capital Corp Hk Securities Ltd 289,622 5.70 1,038 7.47 5,078,564 100.00 9,267 100.00

CIMB FTSE CHINA 25
37
15. TRANSACTIONS WITH BROKERS/DEALERS (CONTINUED) Details of transactions with all brokers for the financial period ended 30 September 2011 are as follows:
Value of
trades
Percentage of total trades
Brokerage fees
Percentage of total
brokerage fees
Brokers/dealers RM % RM %Citigroup Global Markets Asia Ltd (Hk) 1,839,173 78.87 5,667 76.23China International Capital Corp Hk Securities Ltd 492,775 21.13 1,767 23.77 2,331,948 100.00 7,434 100.00
16. SEGMENT INFORMATION
The Fund is designed to provide investment results that, before expenses, closely correspond to the performance of the FTSE China 25 Index, regardless of its performance. In managing the Fund, the Manager attempts to achieve a high positive correlation and a low tracking error between the net asset value of the Fund’s portfolio and the Underlying Index. The internal reporting provided to the chief operating decision maker for the fund’s assets, liabilities and performance is prepared on a consistent basis with the measurement and recognition principles of FRS. The chief operating decision maker is responsible for the performance of the fund and considers the business to have a single operating segment.

CIMB FTSE CHINA 25
38
DIRECTORY Head office of the Manager CIMB-Principal Asset Management Sdn Berhad (Company No.: 304078-K) Level 5, Menara Milenium, 8, Jalan Damanlela, Bukit Damansara. 50490 Kuala Lumpur, MALAYSIA. Postal address CIMB-Principal Asset Management Sdn Berhad (Company No.: 304078-K) P.O.Box 10571, 50718 Kuala Lumpur, MALAYSIA. Internet site www.cimb-principal.com.my E-mail address [email protected] General investment enquiries (03) 7718 3100 Trustee for the CIMB FTSE CHINA 25 Deutsche Trustees Malaysia Berhad (Co. No. 763590-H) Level 20, Menara IMC, 8, Jalan Sultan Ismail, 50250 Kuala Lumpur, MALAYSIA