cigr handbook of agricultural engineering volume ii
TRANSCRIPT

CIGR Handbookof Agricultural Engineering
Volume II
i

ii
CIGR Handbookof Agricultural Engineering
Volume IIAnimal Production &
Aquacultural Engineering
Edited by CIGR–The InternationalCommission of Agricultural Engineering
Part I Livestock Housing and EnvironmentVolume Editor:
El Houssine BartaliHassan II IAVM, Morocco
Co-Editors:Aad Jongebreur
IMAG-DLO, Netherlands
David MoffittUnited States Department of Agriculture–NRCS, USA
Part II Aquaculture EngineeringVolume Editor:
Frederick WheatonUniversity of Maryland, USA
Published by the American Society of Agricultural Engineers
iii
Front Matter
Table of Contents
➤
➤

Copyright c© 1999 by the American Society of Agricultural EngineersAll Rights Reserved
LCCN 98-93767 ISBN 0-929355-98-9
This book may not be reproduced in whole or in part by any means (with the exceptionof short quotes for the purpose of review) without the permission of the publisher.
For Information, contact:
Manufactured in the United States of America
The American Society of Agriculture Engineers is not responsible for the statements andopinions advanced in its meetings or printed in its publications. They represent the viewsof the individuals to whom they are credited and are not binding on the society as a whole.
iv

Editors and Authors
Part I Livestock Housing and Environment
Volume EditorEl Houssine BartaliDepartment of Agricultural Engineering, Hassan II Institute of Agronomy andVeterinary Medicine, B.P. 6202 Rabat Instituts, Rabat, Morocco
Co-EditorsAad JongebreurAgricultural Research Department, Institute of Agricultural and EnvironmentalEngineering (IMAG-DLO), Ministry of Agriculture, Nature Management andFisheries, Mansholtlan 10-12, P.O. Box 43, NL-6700 AA Wageningen, The Netherlands
David MoffittUnited States Department of Agriculture–Natural Resources Conservation Service,South Central Regional Office, P.O. Box 6459, Fort Worth, TX 76115, USA
AuthorsEl Houssine BartaliDepartment of Agricultural Engineering, Hassan II Institute of Agronomy andVeterinary Medicine, B.P. 6202 Rabat Instituts Rabat, Morocco
James M. BruceScottish Agricultural College, 581 King Street, Aberdeen AB9 1UD, Scotland,United Kingdom
Carl-Magnus DolbyContinuing Education, Swedish University of Agricultural Sciences, Box 45,230 53 Alnarp, Sweden
Vincenzo MenellaFaculty of Agriculture, Institute of Agricultural Mechanisation and Land, University ofPerugia, Borgo XX Giugno, 74, 06121 Perugia, Italy
David H. O’NeillWrest Park, Silsoe Research Institute, Beds MK 45 4 HS, United Kingdom
Soeren PedersenDanish Institute of Agricultural Sciences, Research Center Bygholm., Box 536,8700 Horsens, Denmark
Krister SallvikDepartment of Agricultural Biosystems and Technology, Swedish University ofAgricultural Sciences, P.O. Box 59, 230 59 Alnarp, Sweden
v

vi Editors and Authors
Shahab S. SokhansanjDepartment of Agricultural and Bioresource Engineering, University of Saskatchwan,1 Building 57 Campus Drive AO3 ENG, Saskatoon, SK S7N 5A3, Canada
Jean Claude SoutyMinistere de l’Agriculture et de la peche, DEPSE 13, 19 Avenue du Maine,75015 Paris Cedex 15, France
Michel Tillie6, rue Pasteur, 62217 Beaurains, France
Part II Aquaculture Engineering
Volume EditorFrederick WheatonDepartment of Biological Resources Engineering, University of Maryland, CollegePark, MD 20742, USA
AuthorsDavid E. BruneAgr & Bio Engineering Department, Clemson University, 116 McAdams Hall,Clemson, SC 29634-0357, USA
John HochheimerNCQA, 2000 L Street, N.W., Suite 500, Washington, D.C. 20036, USA
Odd-Ivar LekangDepartment of Agricultural Engineering, Agricultural University of Norway,AS, Norway
John G. RileyBioresource Engineering Department, University of Maine, 5710 Bioresource, Orono,ME 04469-5710, USA
Sahdev SinghDepartment of Biological Resources Engineering, University of Maryland, CollegePark, MD 20742, USA
Steven T. SummerfeltFresh Water Institute, P.O. Box 1746, Shepherdstown, WV 25443, USA
Michael B. TimmonsAgr & Bio Engineering Department, Riley Robb Hall, Cornell University, Ithaca,NY 14853, USA
Frederick WheatonDepartment of Biological Resources Engineering, University of Maryland, CollegePark, MD 20742, USA

Editorial BoardFred W. Bakker-Arkema, Editor of Vol. IVDepartment of Agricultural EngineeringMichigan State UniversityMichigan, USA
El Houssine Bartali, Editor of Vol. II (Part 1)Department of Agricultural EngineeringInstitute of AgronomyHassan II, Rabat, Morocco
Egil BergeDepartment of Agricultural EngineeringUniversity of Norway, Norway
Jan DaelemansNational Institute of Agricultural EngineeringMerelbeke, Belgium
Tetuo HaraDepartment Engenharia AgricolaUniversidade Federal de Vicosa36570-000 Vicosa, MG, Brazil
Donna M. HullAmerican Society of Agricultural EngineersMichigan 49085-9659, USA
A. A. JongebreurIMAG-DLOWageningen, The Netherlands
Osamu Kitani, Editor-in-Chief and Editor of Vol. VDepartment of Bioenvironmental and Agricultural EngineeringNihon UniversityKameino 1866Fujisawa, 252-8510 Japan
Hubert N. van Lier, Editor of Vol. IChairgroup Land Use PlanningLaboratory for Special Analysis, Planning and DesignDepartment of Environmental SciencesAgricultural UniversityWageningen, The Netherlands
vii

viii Editorial Board
A. G. RijkAsian Development BankP.O. Box 7890980 Manila, Philippines
W. SchmidO.R.L. Institute, E.T.H.Z.HongerbergZurich, Switzerland
The late Richard A. SprayAgricultural and Biological Engineering DepartmentClemson UniversityClemson, South Carolina 29634-0357, USA
Bill A. Stout, Editor of Vol. IIIDepartment of Agricultural EngineeringTexas A & M UniversityTexas, USA
Fred W. Wheaton, Editor of Vol. II (Part 2)Agricultural Engineering DepartmentUniversity of MarylandMaryland, USA
ContentsPart I Livestock Housing and Environment
Foreword xvAcknowledgments xviiPreface xix
1 Characteristics and Performances of Construction Materials 31.1 Concrete and Steel 3
1.1.1 Concrete 31.1.2 Reinforced Concrete 61.1.3 Steel Construction 7
1.2 Masonry and Blocks 91.2.1 Concrete Blocks 91.2.2 Earth Concrete Blocks 91.2.3 Burnt-Clay Bricks 10
1.3 Wood as a Construction Material for Farm Buildings 101.3.1 Wood as a Material 101.3.2 Structures in Timber 131.3.3 Joints 181.3.4 Panel Products 201.3.5 Wall Coverings 231.3.6 Thermal Insulation 28
2 Environment for Animals 312.1 Animal Environment Requirements 31
2.1.1 Thermal 322.1.2 Thermoneutral Zone 322.1.3 Heat Balance at Animal Level 33
2.2 Animal Heat and Moisture Production 412.2.1 Equations for Total Heat Production,8tot 412.2.2 Proportion Between Sensible and Latent Heat Dissipation 442.2.3 Conversion of Latent Heat to Moisture Dissipation 462.2.4 Heat and Moisture Production at House Level 462.2.5 Diurnal Variation in Heat and Moisture Production
at House Level 502.3 Environmental Control of Livestock Housing 54
2.3.1 Natural Ventilation 542.3.2 Forced Ventilation 68
3 Livestock Housing 893.1 Sheep Housing 89
3.1.1 Types of Holdings 893.1.2 Reference Background 903.1.3 Process and Product Characteristics 90
ix
x Contents
3.1.4 Criteria for the Defining of Building Systems 913.1.5 Building Systems for Intensive Milk-Production Holdings 923.1.6 Planning Parameters 963.1.7 Building Systems for Meat-Production Holdings 973.1.8 Planning Parameters 1003.1.9 Conclusion 101
3.2 Pig Housing 1013.2.1 Reference Scenario 1013.2.2 Types of Pig Holdings 1023.2.3 Criteria for Defining the Building System 1033.2.4 Systems Planning and Integration Parameters 1053.2.5 Closed-Cycle Pig-Breeding Center 106
4 Equipment and Control 1154.1 Feed and Supply Distribution 115
4.1.1 Intensive Conditions 1154.1.2 Extensive Conditions 128
4.2 Feed Mixers and Intake Control 1304.2.1 Cattle Breeding 1304.2.2 Sheep Production 133
4.3 Watering Equipment 1334.3.1 Cattle Breeding [8] 1334.3.2 Goats and Sheep 1354.3.3 Pig Breeding [9] 1384.3.4 Poultry [6] 138
4.4 Milk Storage and Control [11] 1424.4.1 General Points 1424.4.2 Influence of Refrigeration on the Microbial Flora 1424.4.3 Refrigeration Systems 1434.4.4 Tank Equipment 1444.4.5 Control of Coolers 144
5 Storing Forages and Forage Products 1475.1 Introduction 1475.2 Losses in Swath 1485.3 Losses During Storage of Square-Baled Hay 1485.4 Losses During Storage of Round-Baled Hay 1505.5 Storage of Cubes 1525.6 Storage of Alfalfa Pellets 1545.7 Storage of Loose Hay 1565.8 Cube Spoilage During Transport 158
6 Waste Management and Recycling of Organic Matter 1636.1 Waste Management 163
6.1.1 Effects of Manure on the Water Resource 163
Contents xi
6.1.2 Effects of Manure on the Air Resource 1676.1.3 Effects of Manure on the Animal Resource 1706.1.4 Manure Characteristics 1706.1.5 Manure-Management Systems 178
6.2 Recycling of Organic Matter 1876.2.1 Land Application 1876.2.2 Energy Production 193
7 Draught Animals 1977.1 Utilization 197
7.1.1 Principles of Animal Traction 1977.1.2 Tasks Performed 2007.1.3 Species 2027.1.4 Work Performance 202
7.2 Husbandry and Work Performance 2047.2.1 Body Condition 2047.2.2 Work Schedules 2057.2.3 Multipurpose Animals 206
7.3 Draught Animals in Farming Systems 206
Part II Aquacultural Engineering
8 Aquacultural Systems 2118.1 Introduction 2118.2 System Types 211
8.2.1 Ponds 2128.2.2 Raceways 2138.2.3 Net Pens and Cages 2148.2.4 Tanks and Recirculating Aquacultural Systems 214
9 Environmental Requirements 2199.1 Primary Constraints in Aquacultural Systems 219
9.1.1 Properties of Water 2199.1.2 Oxygen as a Constraint 2209.1.3 Other 221
9.2 Environmental Needs of Aquatic Organisms 223
10 Materials for Aquacultural Facilities 23110.1 Considerations in Material Selection Process 231
10.1.1 Weight of Water 23110.1.2 Corrosion 23110.1.3 Biofouling 23210.1.4 Ozone as a Constraint in Material Selection 235
10.2 System Components and Material Selection 23610.2.1 Tanks 23610.2.2 Raceways 236

xii Contents
10.2.3 Waterproof Lining 23610.2.4 Screen Mesh 23710.2.5 Nets 23710.2.6 Ozone Unit 237
10.3 Advantages and Disadvantages of Various Materials 23710.3.1 Masonry 23810.3.2 Metals 23910.3.3 Plastics/Rubber Compounds 24010.3.4 Wood 24210.3.5 Others 243
11 Facilities Design 24511.1 Introduction 24511.2 Ponds 246
11.2.1 Pond Photosynthesis 24711.2.2 Diurnal Limits 24711.2.3 Productive Systems and Polyculture 24811.2.4 pH Limits 24911.2.5 Nitrogen Control 24911.2.6 Pond Types 249
11.3 Raceways 25211.3.1 Design Densities and Loadings (Raceways or Tanks) 25211.3.2 Raceway Length 25411.3.3 Fish Growth 25511.3.4 Design Principles and Considerations 256
11.4 Net Pens 26311.4.1 Site Selection 26411.4.2 Net-Pen Design and Construction 26511.4.3 Net-pen summary 270
11.5 Tanks 27111.5.1 Biomass Loading 27111.5.2 Labor Requirements 27111.5.3 Tank Shapes and Sizes 27211.5.4 Water Inlet 27411.5.5 Water Outlet 275
12 Equipment and Controls 28112.1 Feeding Equipment 281
12.1.1 Hand Feeding 28312.1.2 Automatic Feeders 28412.1.3 Demand Feeders 287
12.2 Pumps 28812.2.1 Types of Pumps 28912.2.2 Power Source 293

Contents xiii
12.3 Harvest Equipment 29512.3.1 Types of Harvesting Equipment 296
12.4 Monitoring Equipment 30012.4.1 Sensors 30112.4.2 Monitoring and Control Systems 304
13 Waste-Handling Systems 30913.1 Introduction 309
13.1.1 Effluent regulations 31013.2 Materials to Remove 311
13.2.1 Nitrogenous Compounds 31213.2.2 Solids 31313.2.3 Dissolved Matter 31413.2.4 Carbon Dioxide 31413.2.5 Pathogens and Chemicals Used in Aquaculture 31513.2.6 Nutrients 315
13.3 Methods to Remove Ammonia 31613.3.1 Microbial Action 31613.3.2 Media 32013.3.3 Submerged Filters 32113.3.4 Trickling Filters 32213.3.5 Rotating Biological Contactors 32213.3.6 Pressurized-Bead Filters 32313.3.7 Fluidized-Bed Biofilters 32313.3.8 Biofilter Comparison 326
13.4 Methods to Remove Solids 32713.4.1 Settling Basins 32713.4.2 Microscreen Filters 33013.4.3 Granular Media Filters 33213.4.4 Dissolved Air Flotation and Foam Fractionation 33213.4.5 Ozonation 33313.4.6 Discussion of Solids-Removal Options 334
13.5 Methods to Dispose of Solids 33413.6 Methods to Remove Dissolved and Colloidal Organic Matter 33513.7 Methods to Remove Carbon Dioxide 336
13.7.1 Air Stripping 33613.7.2 Chemical Addition 337
Index 351

xiv

ForewordThis handbook has been edited and published as a contribution to world agriculture atpresent as well as for the coming century. More than half of the world’s population isengaged in agriculture to meet total world food demand. In developed countries, theeconomic weight of agriculture has been decreasing. However, a global view indicatesthat agriculture is still the largest industry and will remain so in the coming century.
Agriculture is one of the few industries that creates resources continuously fromnature in a sustainable way because it creates organic matter and its derivatives byutilizing solar energy and other material cycles in nature. Continuity or sustainabilityis the very basis for securing global prosperity over many generations—the commonobjective of humankind.
Agricultural engineering has been applying scientific principles for the optimal con-version of natural resources into agricultural land, machinery, structure, processes, andsystems for the benefit of man. Machinery, for example, multiplies the tiny power (about0.07 kW) of a farmer into the 70 kW power of a tractor which makes possible theproduction of food several hundred times more than what a farmen can produce manu-ally. Processing technology reduces food loss and adds much more nutritional values toagricultural products than they originally had.
The role of agricultural engineering is increasing with the dawning of a new century.Agriculture will have to supply not only food, but also other materials such as bio-fuels,organic feedstocks for secondary industries of destruction, and even medical ingredients.Furthermore, new agricultural technology is also expected to helpreduceenvironmentaldestruction.
This handbook is designed to cover the major fields of agricultural engineering suchas soil and water, machinery and its management, farm structures and processing agri-cultural, as well as other emerging fields. Information on technology for rural planningand farming systems, aquaculture, environmental technology for plant and animal pro-duction, energy and biomass engineering is also incorporated in this handbook. Theseemerging technologies will play more and more important roles in the future as bothtraditional and new technologies are used to supply food for an increasing world popula-tion and to manage decreasing fossil resources. Agricultural technologies are especiallyimportant in developing regions of the world where the demand for food and feedstockswill need boosting in parallel with the population growth and the rise of living standards.
It is not easy to cover all of the important topics in agricultural engineering in alimited number of pages. We regretfully had to drop some topics during the planningand editorial processes. There will be other requests from the readers in due course. Wewould like to make a continuous effort to improve the contents of the handbook and, inthe near future, to issue the next edition.
This handbook will be useful to many agricultural engineers and students as well asto those who are working in relevant fields. It is my sincere desire that this handbook willbe used worldwide to promote agricultural production and related industrial activities.
Osamu KitaniEditor-in-Chief
xv

xvi

AcknowledgmentsAt the World Congress in Milan, the CIGR Handbook project was formally started underthe initiative of Prof. Giussepe Pellizzi, the President of CIGR at that time. Deep gratitudeis expressed for his strong initiative to promote this project.
To the members of the Editorial Board, co-editors, and to all the authors of thehandbook, my sincerest thanks for the great endeavors and contributions to this handbook.
To support the CIGR Handbook project, the following organizations have made gen-erous donations. Without their support, this handbook would not have been edited andpublished.
Iseki & Co., Ltd.Japan Tabacco IncorporationThe Kajima FoundationKubota CorporationNihon Kaken Co., Ltd.Satake Mfg. CorporationThe Tokyo Electric Power Co., Inc.Yanmar Agricultural Equipment Co., Ltd.Last but not least, sincere gratitude is expressed to the publisher, ASAE; especially
to Mrs. Donna M. Hull, Director of Publication, and Ms. Sandy Nalepa for their greateffort in publishing and distributing this handbook.
Osamu KitaniCIGR President of 1997–98
xvii

xviii

PrefaceThe first part of this volume deals with livestock housing and environment. It is intendedto be a useful tool in the hands of engineers, architects, educators, material and equipmentsuppliers, students, and others. There has been very significant progress in many areas oflivestock housing and environment in the past years. This indicated a need for a volumeof theCIGR Handbook on Agricultural Engineeringdevoted to this subject.
Information incorporated in this volume is of a nature that could be valuable inmaking decisions in this field: characteristics of construction materials, environmentcontrol, livestock housing design, silage storage, equipment and waste management,and draught animals husbandry. Frequent reference is made to other sources whereadditional detailed information can be obtained because of space limitations, a carefulselection of topics has been made.
The chapters have been written by experts from research institutions, managementdepartments, and universities recognized as outstanding authorities in their respectivefields. The authors’ wide experience has resulted in concise chapters geared towardpractical application in planning, design, and management of livestock housing.
The editors are especially grateful to the contributors, not only because they appreciatethe great value of their contributions but also because they are keenly aware of theirconsiderable efforts in taking time to prepare their manuscripts.
The editor of Part II expresses his sincere appreciation to Dr. Sahdev Singh for hisvaluable assistance in editing Part II. Without Dr. Singh’s time, expertise, and attentionto detail, Part II would not have been completed.
El Houssine Bartali and Frederick WheatonEditors of the Volume II
xix

PART I Livestock Housing andEnvironment
1

2

1Characteristics andPerformances ofConstruction Materials
1.1 Concrete and SteelEl Houssine Bartali
1.1.1 Concrete
Concrete as MaterialPlain concrete is obtained by adequately mixing in specific proportions aggregates
(gravel and sand), Portland cement, and water. Plain or reinforced concrete is used inlivestock housing for structures, foundations, floors, and walls. It is a durable materialthat can resist attack by water, animal manure, chemicals, and fire. High-quality concreteis recommended for milk-, silage-, or manure-containing structures.
Properties of ConcreteTwo main properties of concrete are strength and workability.The strength of concrete depends on various factors, mainly the proportions and qual-
ity of the ingredients and the temperature and moisture under which it is placed andcured. The methods for proportioning and placing concrete to achieve a preset requiredstrength can be found in the literature. Concrete can develop a very high compres-sive strength equivalent to two to five times that of wood [1]. Compressive strengthof concrete increases with its age. This is measured by crushing cubes or cylinders ofstandard sizes. Concrete design is based on the characteristic strength values at 28 daysof age. Its tensile strength remains weak, however, about one tenth of its compres-sive. For this reason, steel rods (rebars) are combined with concrete. In reinforced con-crete, the area and positioning of steel bars determined according to applicable standardcodes.
Workability of concrete relates to its ability to be poured in forms and to properlyflow around steel bars. This measured by a slump test. For slump values less than 2 cm,concrete needs strong vibration in order to be properly put in place. For values of slumpbetween 10 and 14 cm, concrete is very soft and may need slight stitching [2]. Concreteis placed in forms. This operation is undertaken either on the construction site or in aprefabrication plant.
3

4 Characteristics and Performances of Construction Materials
Composition of Concrete
CementPortland cement is obtained from blending a mixture of calcareous (75%) and clayey
(25%) materials, which are ground and burnt (at about 1450◦C) to produce clinker. Thelatter is cooled and reground with the addition of gypsum into a very fine powder. Therole of gypsum is to control the rate of set of concrete [3].
Two main categories of cement can be distinguished: artificial Portland cements, con-taining at least 97% clinker and blended Portland cements, which include pozzolona andcontain not less that 65% clinker. This second category is obtained by adding pozzolanicmaterials to clinker. These materials include natural pozzolana, volcanic ash, fly ash,and blast-furnace slag.
Cement is sold in 40- or 50-kg paper bags or in bulk. Cement should be protected andkept in dry places away from ground moisture or damp air. If not lumps, may develop andreduce its strength. Main types of Portland cement include ordinary Portland cement;rapid-hardening Portland cement, which is very finely ground, develops strength morerapidly, and is suitable for early stripping of form work and early loading of buildings;and low heat Portland cement which avoids excess heat generated by chemical reactionsand cracking in large structures. Ordinary Portland cement is suitable for most farm andall normal purposes.
Five classes of cement are distinguished and based on minimum compressive strengthsat 28 days of age. These values vary from 32.5 MPa to 52.5 MPa.
When water is added to cement, the hydration process of cement starts. The strengthof concrete is heavily dependent on cement–water ratio. Excess water makes concreteweak because it leaves voids after it evaporates.
AggregatesAggregates include gravel and sand. These are inert materials. They may be classified
into the following size categories in millimeters: 0.08, 4, 6.3, 10, 20, 31.5, 40, 63, and80 [4].
The size of a mesh screen that distinguishes between sand or small aggregate andgravel or coarse aggregate is about 6 mm. Larger particles should allow concrete to passbetween reinforcement bars and must not exceed one quarter of the minimum thicknessof the concrete member. Maximum particle size is usually 20 to 25 mm.
Nature, size distribution, and shape of aggregates affect strength, workability, andcost of concrete. Concrete strength is improved if sharp, flat, rough aggregates are used;however, this requires more cement paste. An adequate size distribution helps savecement. The proportion of cement needed varies with both total surface area of aggregatesand volume of voids. A fairly even distribution of sizes with a well-graded aggregateleaves a minimum volume of voids to be filled with cement.
Aggregates are glued together by cured cement paste. It is important that aggregatesbe hard, strong, and clean, free of organic material and silt.
The presence of excessive quantities of silt and organic matter in the material willprevent cement from properly binding the aggregates. Silt tests and organic-matter testsare used to assess suitability of aggregates for concrete. These tests make it possible to

Concrete and Steel 5
know if material can be used as it is, or if it is necessary to wash material before usingit or to reject it [5].
Naturally moist sand can contain 2.5% to 5.5% moisture content. This much water istaken into account when determining the concrete mixture.
In livestock housing one can use usual aggregates: natural deposit materials such assand, gravel, hard limestone, silicolimestone, or crushed stone. Density of sand and stonevaries from 2600 to 2700 kg/m3. One can also use lightweight aggregates: expanded clayor expanded shale.
WaterThe strength of concrete is very dependent on the amount of water (water–cement
ratio) and on its quality. Enough water is needed to allow curing of cement based onchemical reactions. It is recommended that the water–cement ratio should not be lowerthan 0.4:1. On the other hand, any excess water is bound to evaporate and to inducecracking in concrete.
Clean water is needed. Attention should be given to its content of suspended material,organic matter, and salt. Suspended materials should not exceed a few grams per liter, andthe amount of soluble salts should not exceed 30 g/L for plain or slightly reinforced con-crete. Water fit for drinking is best. Sea water may be used but not for reinforced concrete.Sulfate-resistant cement may be needed for use with sulfate-containing water [3].
AdmixturesAdmixtures are added in small quantities to concrete immediately after or before its
mixing in order to improve some properties of the material. The list of such products in-cludes accelerating products, retarding products, water-reducing products, air-entrainingproducts to improve resistance to freezing and thawing, superplasticizers, and pozzolans.
Batching and MixingProportions of concrete ingredients may vary according to the use, workability, and
level of strength desired for the concrete. For ordinary concrete, the following quantitiesof ingredients may be used: per cubic meter, 800 L of gravel, 400 L of sand, 350 L ofcement, and 150 L of water [6].
Other recommended trial mixes .of concrete are available in the literature [3]. Nominalmixes, which are represented by proportions of cement, sand, and stone may be used todesignate a given grade of concrete. Specific grades used range from a grade as low asC7, presenting a characteristic crushing strength of 7 MPa, having a nominal mix 1:3:8,and suitable for strip footings and trench fill, to C60 used for prestressed concrete [4].
Mixing can take place on the construction site or in a factory, after which concretemust be placed within 30 min in forms either poured in place or used for precast units.Mixing can be made by power mixer or by hand depending on batch size. Enough mixingis needed in order to make a homogeneous distribution of ingredients. Excess mixingmay induce a decrease in concrete strength or a loss in slump. A concrete mix withlow workability will require more compaction. For most farm livestock constructions,manual compaction is used. Workability can be improved by using rounded aggregateswith a suitable selection of sand and stone proportions.

6 Characteristics and Performances of Construction Materials
CuringIn order to allow chemical reaction between cement and water to be completed, the
concrete surface must be watered or protected by grass, sacks, sand, or polythene layer.These measures, which should take place within 10 h of casting, aim at preventing waterfrom evaporating and may last for at least a week. They are particularly important in hotclimates.
1.1.2 Reinforced Concrete
Reinforcing steel bars or mesh are systematically necessary to support traction in thetensile zone. Bars may also be needed in some cases to help concrete support excessivecompression loads. Design of reinforced concrete structures is carried out in compliancewith design codes specified in each country. Reinforced concrete presents the followingadvantages compared with steel: better rigidity and fire resistance. However, reinforcedconcrete structures are heavier than steel structures. Density of concrete is usually takenas about 24 kN/m3 and that of reinforced concrete as 25 kN/m3 (kilo-newtons per m3).
Reinforcing BarsSteel rods are available as plain bars or deformed bars; the latter have a better bonding
with concrete. Welded mesh also is used particularly as reinforcement of flat slabs and isavailable in rolls of 30× 1.5 m. Steel bars are designated by their diameter in millimetersor their number. They are available with an indication of their characteristic strength suchas 400 MPa in FeE-400 or their minimum yield strength such as 41 MPa in type 40 steel.
In order to ensure resistance of structures, steel rods should be rust-free and dirt-free and properly surrounded by concrete. Cover thickness should be around 30 mmto 40 mm in order to avoid rusting due to liquids and air. Any cracks in concrete mayallow corrosion and therefore expansion and weakening of bars. When assessing qualityof reinforcement disposition, one has to check that bars are properly positioned in thetensile zone, adequately hooked, well overlapped over a joining distance of at least 40times the bar diameter for adequate load transfer, well supported and tied together, andproperly imbedded in concrete.
Concrete Floors
FoundationA building should be located in a well-drained site with no risk of sliding of bearing
soil layers. Foundations are the elements of construction in contact with bearing soil, towhich they convey superstructure loads. They should be made of materials that resistpressure and humidity. Foundations under walls are about 0.30 m thick and 0.2 to 0.3 mhigh. In order to protect them from frost, they are placed at a depth of 0.5 m to 1 m.
Buildings should always be founded on good soil in order to avoid structural disordersthat can be induced by differential settlement. Physical and mechanical characteristicsof soil should be determined by adequate soil and site investigation. Careful attentionshould be given to the presence of the water table because it may generate loss in soilresistance, wash away fine particles of soil, and attack concrete. Design of foundationtakes into account the combination of dead and live loads applied to the construction and

Concrete and Steel 7
the strength of bearing soil. Loads applied by livestock buildings to soils are usually notexcessive. Such buildings usually rest on superficial concrete foundations under wallsor columns.
PavingPaving is reinforced concrete slabs (about 0.12 m thick) resting on a subgrade made
of a layer of cement gravel, stones, or stabilized earth (0.2 to 0.40 m), meant to dis-tribute applied concentrated loads or to act as a draining layer. A water-proof mate-rial can be incorporated beneath the slab to avoid soil water moving upward. Thisreduces the chance of cracking induced by temperature changes. Joints are added tokeep the area of slab sections under 70 m2 in order to reduce cracking due to concreteshrinkage [5].
Floor slab can be reinforced with welded mesh or chicken wire. Its design takes intoaccount applied live concentrated or distributed loads and bearing capacity of soil. Thefloor surface is usually not flat. It is provided with slopes, gutters, and hallways. Floorsshould be waterproof, resistant enough to animal waste and easy to clean and to disinfect.The floor surface should not slippery.
1.1.3 Steel Construction
Barns may be designed as steel warehouses. The latter do not usually have a symmetricshape unless they are not used to store straw and hay. The cost per square meter of awarehouse increases generally with the building span. For a span less than 15 m, steelwarehouses may be more cost-competitive than timber warehouses.
Steel is used in livestock housing as hot-rolled or cold-formed shapes. It is used inthe form of iron sheet for walls, partitions, or roofing. It is also found as the structuralelement for beams, columns, or trusses in various forms such as I-beams, angles, orpipes. Because of their thinner elements, cold-formed shapes are more susceptible tolocal buckling than hot-rolled sections.
In agricultural buildings in general and in livestock housing in particular, light-gaugesteel FeE-24 and A36 are the most commonly used, with a limit stress of 24 MPa.
Steel-bearing elements are generally made of hot-rolled steel. The most commonshapes are IPN, IPE (standard I shape sections) corner, and tubular (circular, square,rectangular). Other shapes may be obtained by welding and formage of flat products.All these elements are assembled through bolts or welding.
Steel for Roofs and WallsIron sheets, corrugated or nervurated, used for roofs or walls are commonly 0.75 to
0.80 mm thick for roofing and 0.65 to 0.75 mm thick for walling. These iron sheets needto be protected against corrosion using galvanization, paint, or lacquer. The main typesfound are steel galvanized by hot immersion, galvanized steel prelacquered in oven,painted galvanized steel, and painted steel [5].
Selection of shapes and their types of protection is made in terms of type of roofingused and weather encountered. Nervuration provides iron sheets with resistance to bend-ing, which is variable with shape, height, and spacing. Selection of nervuration takes intoaccount distance between rafters and climatic loads of the region under consideration.

8 Characteristics and Performances of Construction Materials
In low-height and close warehouses, the use of corrugated galvanized iron sheet shouldbe avoided due to risks of condensation.
It may be more advantageous to use aluminum, which presents several advantageousqualities: light weight, lack of alterability, high sunlight-reflecting potential, and lowcost. Disadvantages of aluminum include that it is noisy under hail or heavy rain ortemperature changes, which frightens animals.
Steel Protection Against CorrosionSteel surfaces are sensitive to outside conditions. Weather aggressively induces ox-
idation of the surface of steel. This progressive alteration reduces strength, which maycause failure of steel elements if no measure of protection is taken. Aggressiveness ofthe environment is variable with hygrometry, temperature, and presence of dirt and somegases in ambient air.
Thus, in order to ensure adequate behavior of steel, it is necessary to adopt a protectionsystem against corrosion adapted to the nature and intensity of the alteration to be avoided.The lower edges of steel columns and frames are inserted in concrete pipes in order toprotect them against corrosion from manure. The space between steel columns andconcrete pipes are filled with cement. Steel rusts when exposed to atmospheres above acritical relative humidity of about 70%. Serious corrosion occurs at normal temperaturesonly in the presence of both oxygen and water, both of which must be replenishedcontinually. To select a paint system for corrosion protection, therefore, it is necessaryto begin with the function of the structure, its environment, maintenance practices, andappearance requirements [7].
The manager of livestock housing needs to proceed about every 2 years to a thoroughvisual control of all steel elements in order to detect any corrosion. Then it is necessaryto brush all attacked zones and to apply a new protection to them immediately.
Various painting protections are available on the market. To allow a reliable anddurable protection such paints should include a primary layer, an intermediate layer,and one or more finishing layers. Before any application of paint, the steel should bebrushed by hand or power to remove loose mill scale, loose rust, weld slug, flux deposit,dirt, and foreign matter. Oil and grease should be removed by solvent. Paint applicationshould follow immediately because unprotected steel is very sensitive to oxidation.
Protection by zinc often is used for agricultural buildings. It may be applied throughgalvanization by immersion of steel in hot zinc (450◦C), metalization by projection offinely pulverized zinc onto the surface to be protected, or paints rich in zinc, whichrepresent a good base for fixing finishing paints.
Prelacquered ShapesPrelacquered shapes provide important supplementary protection against corrosion. It
is important to make an adequate choice of lacquer to ensure sufficient protection againstaggressive atmosphere. Availability of different colors of lacquers makes it possible tomake a building better fit in a given landscape [5]. Prelacquering is in general done in acontinuous manner. It consists of applying on a surface initially galvanized a lining madeof polymerized plastic binders that have been oven-cooked. The main types of lacquersare acrylics, siliconed acrylics, and syliconed polyesters.

Masonry and Blocks 9
1.2 Masonry and BlocksEl Houssine Bartali
1.2.1 Concrete Blocks
Concrete blocks are economical, adaptable, and readily available. However, they aredifficult to insulate. Blocks may be used in buildings and manure storage tanks, amongother places. They can be hollow or solid and load-bearing or non–load bearing and areavailable in various shapes and sizes. Lightweight aggregates such as pumice, volcaniccinders, and scoria or ordinary heavy weight aggregate can be used for their production[1]. Compressive strength levels at 28 days of age for heavyweight blocks can vary from4 MPa for hollow blocks to 16 MPa for solid blocks. These levels range respectivelyfrom 2.5 MPa to 7 Mpa for lightweight concrete blocks.
Mortar is needed to bond blocks together and provide strength and waterproofing toa wall. Good water retention is an important characteristic for a mortar. It is influencedby the quality of sand, binder, and dosage. Recommended mortar mixes are available inthe literature [5].
Mortars are masonry cement, made of a mixture of Portland cement, lime or hydratedlime, and sand. Hydrated lime improves water-retention capacity, workability, and ad-herence of mortar. It is recommended to avoid excess cement in mortar. The strength ofmortar should be in harmony with the strength of the block. To insure desired compres-sive and tensile strengths of a masonry wall, one should specify a full bed of mortar,with each course well hammered down, and all joints completely filled with mortar.
Such blocks are made of the following ingredients, for which common proportionsused are indicated: cement (50 L); gravel (120 L) and sand (90 L). Sizes in centimetersusually encountered include 5×20×40, 10×20×40, 15×20×40, 20×20×40, and25× 20× 20. In livestock housing, blocks may be used over the full area or a section ofwalls. Concrete blocks are used instead of iron sheets wherever walls have to withstandimpact loads or pressure from animals or where walls are in contact with stacked manure.Walls of barns may be composed of concrete blocks about 1 m high at their bottom edge,on top of which iron sheets are used.
In order to allow slight movement of walls and avoid random cracking, verticalcontrol joints are used. Such joints are efficient in relieving stress caused by expansion,contraction, or differential settlement. These joints are placed around doors and windowsand at the intersection of bearing walls.
Reinforcing is used to increase the strength of concrete-block walls. Horizontal rein-forcing can be achieved with horizontal bars placed in mortar joints or with bond beams.Vertically reinforcing steel is incorporated in blocks. Pilasters are needed to supporthollow-block walls.
1.2.2 Earth Concrete Blocks
Such blocks present the advantages of low cost and better heat insulation properties.The fabrication process includes mixing, which can be done by hand or mechanicallyand should create a homogeneous mix; and moulding and compacting, which can be
10 Characteristics and Performances of Construction Materials
undertaken by compaction material. Rate of daily block production varies with equipmentused. It can be in the range of 600 blocks per day for 15× 23× 29 cm blocks. Earthconcrete blocks need be dried in a covered and well-ventilated area and over a suficientperiod of time of up to 4 weeks.
As an indication composition of earth concrete blocks may be as follows: lateriteearth, 0.5 m3; clay, 0.5 m3; sand, 0.2 m3; and cement, 50 kg. Percentage of cement inthe mix may vary from 3% to 12% depending on the percentage of clay used. One cubicmeter of mix can yield 83 blocks of 15× 20× 40 or 125 blocks of 10× 20× 40. Jointsare made of cement mortar. Because of the vulnerability of earth concrete blocks to rainwater, walls should be protected on their external surface with a cement mortar, andfoundations and lower sections of walls should be made of concrete or stones.
1.2.3 Burnt-Clay Bricks
Such bricks are made of clay earth free of any plant material. Ingredients used includeclay, silt, and fine sand. They can be locally made or produced in a factory. The lattercase ensures better quality bricks. Clay paste is burnt at a temperature ranging from550◦C to 1200◦C. Sizes of bricks in centimeters commonly found include 22×11×5.5,30× 15× 8, and 30× 11× 11.
Advantages offered by burnt-clay bricks include affordable cost, good thermal insu-lation, and resistance to moisture, erosion, and insects. Their compressive strength ismedium to high. Livestock housing built with such bricks has lasted for several years invarious locations.
References
1. Midwest Plan Service. 1983.Structures and Environment Handbook, 11 ed. Ames,IA: Iowa State University.
2. Renaud, H., and Letertre, F. 1992.Ouvrages Beton Arme Ed. Paris: Foucher.3. Lindley, J. A., and Whitaker, J. H. 1996.Agricultural Buildings and Structures, rev.
ed. St. Joseph, MI: ASAE.4. FAO. 1986.Farm Structures in Tropical Climates. Rome: Author.5. CATED. 1982.Les Batiments Agricoles. Paris: Author.6. Institut de l’Elevage and ITAVI. 1996.Batiments d’Elevage Bovin, Porcin et Avicole.
Reglementation et preconisations relativesa l’environnement. Paris: Author.7. Merritt, F. S. 1976.Standard Handbook for Civil Engineers. New York: McGraw-Hill.
1.3 Wood as a Construction Material for Farm Buildings
Carl-Magnus Dolby
1.3.1 Wood as a Material
Wood StructureWood is the only major building material that is a renewable resource. It is constantly
renewed by natural methods every 60 to 120 years. Wood is a cellular material principally

Wood as a Construction Material for Farm Buildings 11
Figure 1.1. Cross-section of softwood logshowing bark, wood, and pith.
comprising long, tube-like cells or fibers. These cells are mainly cellulose and bondedtogether with lignin. Most cells are oriented vertically in the tree. The new layers of cellsproduced at the outer active region of the tree make up the sapwood; the inner regionof dying cells make up the heartwood (Fig. 1.1). Throughout its life in the tree, woodremains moist or “green,” with the amount of moisture depending on the species, thepart of the tree and whether it is sapwood or heartwood.
Species of trees are divided into two broad classes, coniferous trees (softwoods),which have needle-like leaves, and broad-leaved trees (hardwoods). Coniferous trees(pine and spruce) are the principal timbers for construction.
Advantages of TimberTimber is the most easily worked of all structural materials. There is a reason why
timber has remained a primary construction material for thousands of years. The reasonis simply that no comparative material has all the advantages of timber.
Timber is light. The density of coniferous trees is approximately 500 kg/m3, which,compared with the density of steel and concrete, is just about 1/16 and 1/5 respectively.The lightness of timber means that timber buildings do not require such solid foundationsas buildings constructed of heavier materials.
Timber is strong. For its weight timber is stronger than any other building material.For example, stress-graded timber is available with a greater strength/weight ratio thanmild steel.
Timber withstands impact. It is excellent at absorbing impact and usually only sufferslocal indentation. Timber is therefore suitable for uses such as external and internalboarding, flooring, and partition walls.
Timber is not a fire hazard. Contrary to popular belief timber is an excellent structuralmaterial when exposed to fire. Large timber members burn slowly and form char on thesurface. Their strength is reduced gradually during a fire, and collapse does not takeplace until a very advanced stage of the fire.
12 Characteristics and Performances of Construction Materials
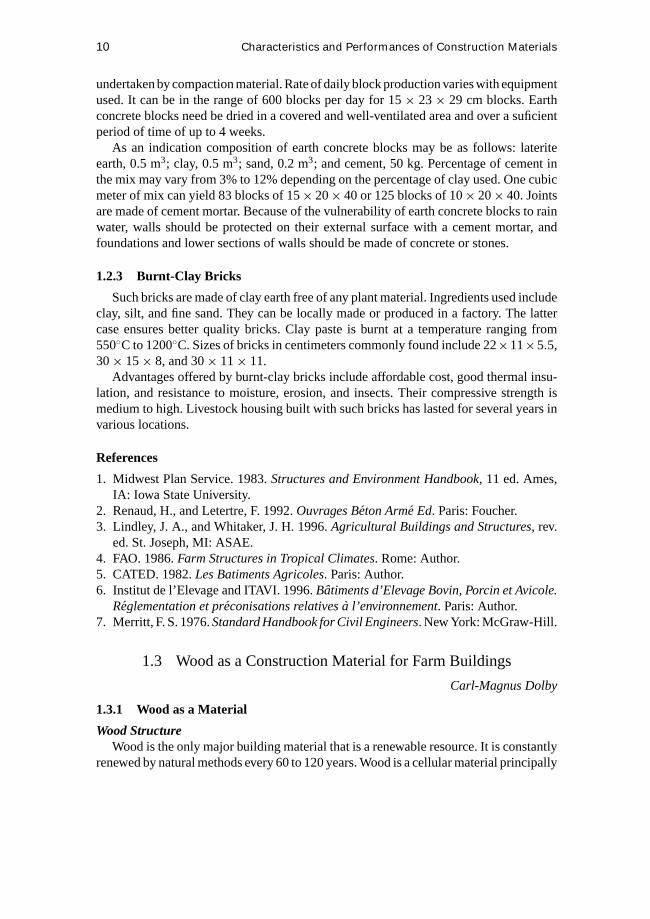
Figure 1.2. Sawn timber and roundwood.
Timber is easily worked. There are many simple ways of assembling timber parts andof joining timber to other materials. The material suits do-it-yourself builders very well.Alterations and additions are simple.
Timber is durable. A correctly designed and detailed timber structure is extremelydurable. There are timber buildings in existence today that are over 1000 years old. Ina well-designed timber structure there is little risk of excessive moisture movements ordecay. Resistance to chemicals makes timber a valuable structural material in severelyexposed environments.
Timber is attractive. It has a natural association with life and warmth and has appeal.The texture and characteristics are highly expressive. The attraction is enhanced with age.
Sawn TimberTimber is sawn wood, a material obtained from trees. Timber has been used by builders
and craftsmen for centuries and has been an important building material throughouthistory across the whole world. Timber can provide a structural frame as strong anddurable as steel and concrete.
For a complete specification of sawn timber (Fig. 1.2) the following should alwaysbe stated:• Purpose for which the timber is used• Species• Condition of seasoning• Sizes• Grade• Surfacing• Preservative treatment

Wood as a Construction Material for Farm Buildings 13
• Special requirements• Packing
RoundwoodRound timber poles are strong, versatile, and economic elements of building con-
struction and have been one of the most valuable building materials throughout history.Round timber is stronger than sawn timber of equal cross-sectional area because fibersflow smothly around natural defects and are not terminated as sloping grain at cut sur-faces. A round pole possesses a very high proportion of the basic strength of its species,because knots have less effect on the strength of naturally round timbers compared withsawn sections. The cost and wastage of sawing are eliminated.
Roundwood is strong parallel to its grain, relatively light, and economic and uses verylittle energy in its processing. For instance, the cost of sawn timber is approximately twoto three times the cost of unsawn round timber of equivalent strength because a largertree must be selected for a sawn and planed rectangular section. Its performance overtime depends on its natural durability or suitability for preservation and on its inherentstrength. These properties vary from species and in case of strength within species.Round timber poles are available in a wide range of sizes. The diameter is usually called“small-end diameter,” with common sizes from 100 to 350 mm.
Glue-Laminated TimberGlue-laminated timber (glulam) is frequently used in place of sawn timber for beams,
columns, frames, and arches. In relation to weight and price it is practically the strongestmaterial used. Glue-laminated timbers are manufactured of three or more layers of woodglued together with the grain of all layers or laminations approximately parallel. Thelaminations may vary depending on species, number, size, shape, and thickness. Glue-laminated timbers made of laminations of a certain (Fig. 1.3) grade have generally higherallowable unit stresses than solid members of the same grade. These higher stresses resultespecially from the dispersion of defects in a laminated member and the advantage ofhigher strength of dried wood in certain types of service. Proper fabrication of glulammembers requires special equipment and manufacturing facilities, skilled workmanship,and a high standard of quality control.
Glulam can have a straight or curved shape or can be made with a variable sectionas in tapered beams or portal frames. For exposed conditions glulam can be treated withpreservative in a manner similar to solid sections. Glulam is resistant to chemical attackand is often used in structures involved with corrosive substances such as fertilizers.
Depending on specific loading conditions a steel beam may be 20% heavier and areinforced concrete beam 600% heavier than an equivalent glulam beam to carry thesame load. The resulting lighter structure can lead to significant economy in foundationconstruction.
1.3.2 Structures in Timber
Structural SystemsTimber has been used for rural structures for centuries. In prehistoric time wood was
the only material capable of spanning large distances. Development of the construction

14 Characteristics and Performances of Construction Materials
Figure 1.3. Glue-laminated timber.
techniques in wood was done by generations of carpenters who continually discoveredefficient systems of support. Nowadays steel and concrete compete hard with timber asstructural materials and current conditions for timber are quite different from conditionsin the past. However, timber has maintained its position very well in agriculture and fitsquite satisfactorily in the rural environment. See reference 1.
In general, three categories of load-carrying structural systems can be distinguished,namely free-span trusses supported by wall framing, post and beam constructions, andportals and arches. Each structural system can be composed of different structural com-ponents, which is evident from Fig. 1.4. In all timber structures the structural formand use of material depends on the vision of the designer, the technical constraints, themotivation to overcome imposed conditions, and ultimately the cost.
Factors Influencing Choice of Structural SystemThe choice of a particular structural system will generally be determined by the cost
and fitness for purpose. In agriculture the design of a new production building and hencethe selection of a structural system is governed by following factors:• The farmer’s intentions
Type of productionSize of production buildingTechnical installationsThe site of buildingFinancial solutions
• Codes, regulations, guidelinesLoads

Wood as a Construction Material for Farm Buildings 15
Figure 1.4. Structural systems in timber.
16 Characteristics and Performances of Construction Materials
Environmental aspectsFire-risk considerations
• Choice of materials and building procedureDurabilityPriceUse of own timberOwn labor inputPossibilities for transport and erection
BeamsBeams like rafters, purlins, joists, and lintels are the basic elements that support
roofs or floors of buildings. They must be strong enough to carry the loads safely andstiff enough to prevent sagging or undesirable movement. The most economical cross-section for a timber beam is one that is deep and slender. Cantilever beam systems arevery economical for covering large areas with multiple spans.
ColumnsColumns (or posts) are used to support roof and floor elements such as beams, arches,
and trusses and to transfer the loads from these members down to the foundation. Themost efficient section shape for a free-standing timber column is circular or square.
Post and Beam ConstructionThe simplest arrangement of beams and columns to resist loads is a “post and beam”
construction in which rafters bear on beams, which rest squarely on top of posts. Struc-tures containing posts and beams comprise many levels of construction performance(Fig. 1.5). Post-and-beam constructions range up to 30 m span and are very cost-effectivefor spans between 7 and 20 meters. Cantilever construction is a simple form of post-and-beam construction in which the columns are cantilevered from the ground to providelateral load resistance.
Truss BuildingsTrusses perform the same function as beams in a building but use material more
efficiently. They can be made almost any size or shape and the components can be joinedtogether in various ways (Fig. 1.6). Free-span trusses can be supported by a timber wallframing consisting of hinged or fixed columns. Free-span trusses normally range up toabout 20 m but are most cost-effective between 10 and 15 m.
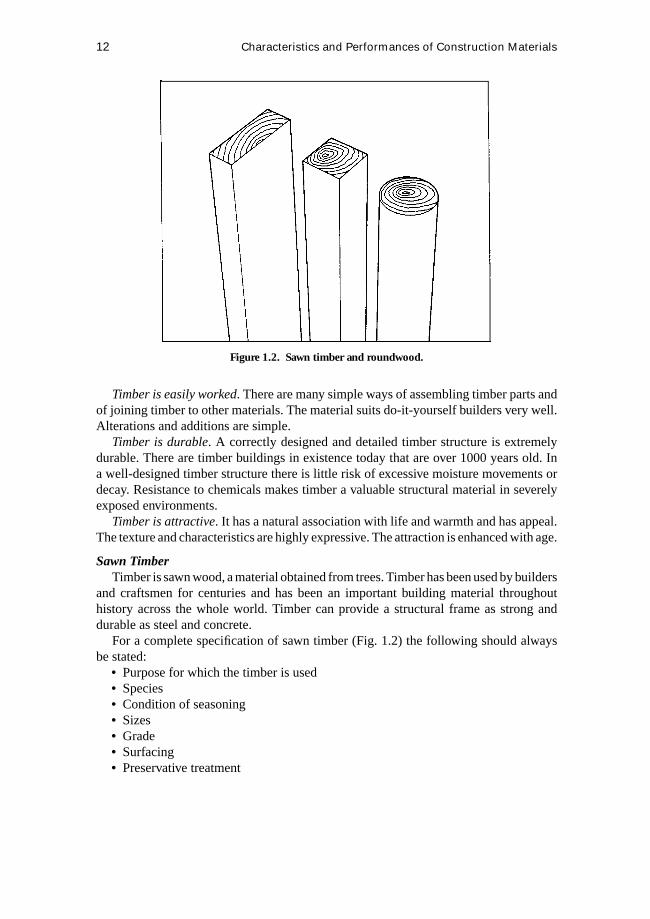
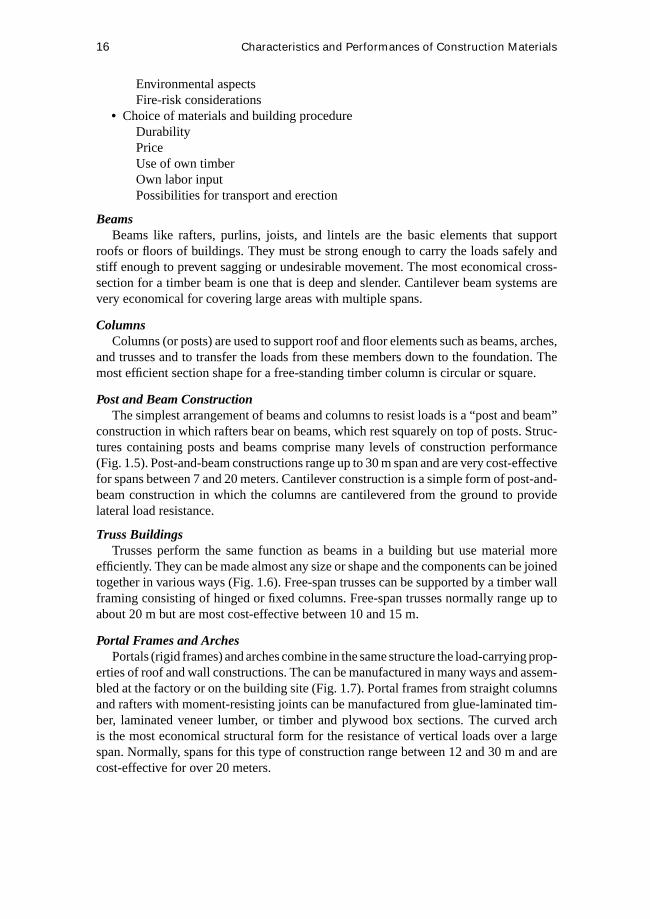
Portal Frames and ArchesPortals (rigid frames) and arches combine in the same structure the load-carrying prop-
erties of roof and wall constructions. The can be manufactured in many ways and assem-bled at the factory or on the building site (Fig. 1.7). Portal frames from straight columnsand rafters with moment-resisting joints can be manufactured from glue-laminated tim-ber, laminated veneer lumber, or timber and plywood box sections. The curved archis the most economical structural form for the resistance of vertical loads over a largespan. Normally, spans for this type of construction range between 12 and 30 m and arecost-effective for over 20 meters.

Wood as a Construction Material for Farm Buildings 17
Figure 1.5. Example of beam and post construction in roundwood.
Figure 1.6. Example of truss building.
18 Characteristics and Performances of Construction Materials
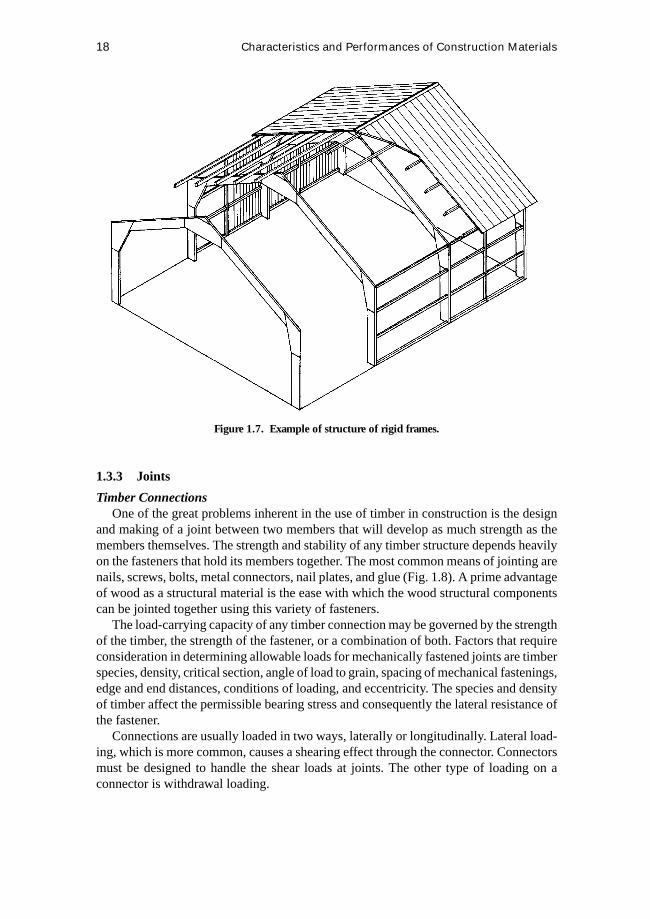
Figure 1.7. Example of structure of rigid frames.
1.3.3 Joints
Timber ConnectionsOne of the great problems inherent in the use of timber in construction is the design
and making of a joint between two members that will develop as much strength as themembers themselves. The strength and stability of any timber structure depends heavilyon the fasteners that hold its members together. The most common means of jointing arenails, screws, bolts, metal connectors, nail plates, and glue (Fig. 1.8). A prime advantageof wood as a structural material is the ease with which the wood structural componentscan be jointed together using this variety of fasteners.
The load-carrying capacity of any timber connection may be governed by the strengthof the timber, the strength of the fastener, or a combination of both. Factors that requireconsideration in determining allowable loads for mechanically fastened joints are timberspecies, density, critical section, angle of load to grain, spacing of mechanical fastenings,edge and end distances, conditions of loading, and eccentricity. The species and densityof timber affect the permissible bearing stress and consequently the lateral resistance ofthe fastener.
Connections are usually loaded in two ways, laterally or longitudinally. Lateral load-ing, which is more common, causes a shearing effect through the connector. Connectorsmust be designed to handle the shear loads at joints. The other type of loading on aconnector is withdrawal loading.

Wood as a Construction Material for Farm Buildings 19
Figure 1.8. Different kinds of fasteners.
Selection of FastenersThere are many interrelated factors that affect the selection of fasteners for a partic-
ular construction. The main considerations are the load-carrying capacity required, thethickness of timber, the method of manufacture, the type of loading, and assembly orerection procedures. The use of nails is very well suited to do-it-yourself constructions,but for heavy framed assemblies the choice of bolts and metal connectors is preferable.The size of members in a connection is often determined not by stress considerationsbut by the spacing and edge-distance requirements of the fixings. The use of glue inparticular requires high-quality workmanship and strict quality-control procedures.
NailsNails are the most common mechanical fasteners in rural constructions. They are used
to join solid timber members together or wood-based sheathing or steel plates to solidwood. There are many types, sizes, and shapes of nails, which can be used in a variety ofapplications. In farm buildings, nails with corrosion-resistant coatings are recommendedbecause of moisture conditions. Gun nails or air-driven nails permit an economic fixingof a large number of nails in shearwalls or moment-resisting joints. The ultimate strengthof a nailed joint depends on the nail penetration, coating, and diameter.

20 Characteristics and Performances of Construction Materials
BoltsBolts are often used in roof trusses or in connections with beams of large dimensions.
They can be used alone but are commonly used together with metal connectors in orderto increase the load-carrying capacity and to reduce deformations. The metal connectorsare installed only in the outer fibers and do not bend or deform.
Nail PlatesConnectors of sheet metal with or without punched nails are mostly fixed to the
outside of wood members during assembly. They are used in the manufacture of trussedrafters or on building sites. Punched metal plates consist of 1.0- to 1.5-mm thick hot dipgalvanized metal plates with nails punched out from the plate by a stamping process. Thenails are short, slender, and closely spaced. The teeth of the nail plates are forced intothe wood members by pressure equipment. Roundwood members can be joined togetherby using molded pre holed hand nail plates.
Glued JointsThe fabrication of glued joints should be done under factory-controlled conditions.
This is because there are several factors that affect the strength of the glued joint. Woodmembers to be glued should have clean, machined, and dry surfaces that fit well together.The moisture content in the wood should not exceed 15%. The glued pieces are pressedtogether by clamping or nailing and kept in a room with suitable temperature and humidityfor the curing period. The advantages of glued joints are that, if properly made, theyare quite strong and rigid. A well-manufactured glue joint exhibits fatigue behaviorsimilar to the wood that it is joining. When choosing adhesive for rural constructionssome essential factors such as weather resistance, resistance to microorganisms, effectof preservative treatments, effect of heat (fire), durability, and cost factors should betaken into account. Two types of synthetic resin adhesives can be expected to satisfy thementioned requirements, namely resorcinol formaldehyde and phenol formaldehyde.
1.3.4 Panel Products
Types of Panel ProductWood-based sheet materials can satisfactorily be used in new farm buildings as well
as in rebuilding, maintaining, or repairing old ones. The many uses include cladding,flooring, sheet bracing in walls and ceilings, and components such as web in I-beamsand box beams. Panel products consist of processed wood material (veneers, sawdust,chips, strips, shavings, flakes, and fibers) of various sizes, geometries, and species boundtogether to form sheets. The categories usually recognized within this group of panelproducts are plywood, particleboards, and fiberboards.
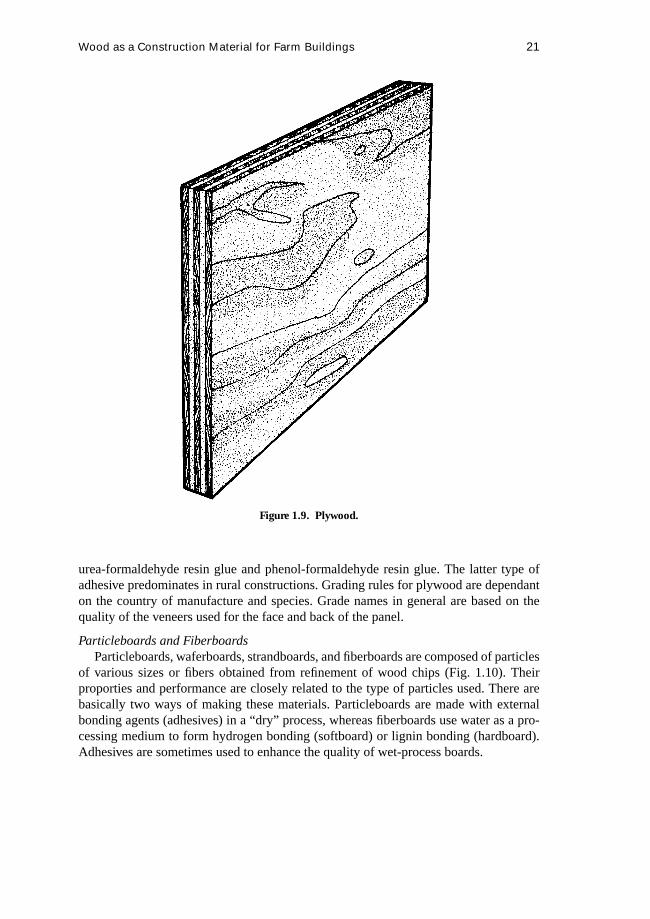
PlywoodPlywood is an assembled product comprising thin layers of wood (veneers or plies)
bonded together with the grain usually at right angles (Fig. 1.9). Selected logs arerotary-peeled in a lathe to form a ribbon of veneer, which is dried, clipped to sheetwidths, graded, and glued together. At production two types of adhesives are used,
Wood as a Construction Material for Farm Buildings 21
Figure 1.9. Plywood.
urea-formaldehyde resin glue and phenol-formaldehyde resin glue. The latter type ofadhesive predominates in rural constructions. Grading rules for plywood are dependanton the country of manufacture and species. Grade names in general are based on thequality of the veneers used for the face and back of the panel.
Particleboards and FiberboardsParticleboards, waferboards, strandboards, and fiberboards are composed of particles
of various sizes or fibers obtained from refinement of wood chips (Fig. 1.10). Theirproporties and performance are closely related to the type of particles used. There arebasically two ways of making these materials. Particleboards are made with externalbonding agents (adhesives) in a “dry” process, whereas fiberboards use water as a pro-cessing medium to form hydrogen bonding (softboard) or lignin bonding (hardboard).Adhesives are sometimes used to enhance the quality of wet-process boards.

22 Characteristics and Performances of Construction Materials
Figure 1.10. Particleboard.
PropertiesWood-based sheet materials are classified according to climate, strength, and surface
fineness. Plywood has in relation to its weight high strength and stiffness. Its ability towithstand concentrated and impact loads is better than other wood material. The boardproperties are influenced by particle size and orientation, distribution of particles in theboard, binder type, additives such as wax or emulsifiers, final density, and a range ofpressing variables. Panel products are in some respects less sensitive to moisture thanwood, but dimensional changes such as swelling and shrinking should be noticed.
ApplicationsWood-based sheet materials can be used for a wide variety of applications in agricul-
ture. They are most often used as flooring or sheathing to carry face loads that are appliedperpendicular to the surface. The selection of material depends on a lot of factors includ-ing demands, material properties, and costs. A complete specification for purchasingwood-based sheet materials should include the following items: purpose, construction,

Wood as a Construction Material for Farm Buildings 23
thickness, size, quality, type of bond, and method of finishing. Fiberboards are as a rulethe cheapest material, followed by particleboards. Plywood is expensive but is oftenthe most cost-effective panel product due to its strength in load-carrying constructions,durability, and maintenance.
1.3.5 Wall Coverings
Aspects of DesignToday a lot of different cladding materials with a wide spectrum of colors, profiles,
and textures are available on the market. It is necessary to choose cladding materials withskill and care so that they are in harmony with the surrounding landscape and existingbuildings. A badly chosen exterior cladding material can devastate the appearance of theentire farmstead. It is important to remember that some materials weather well and theirappearances improve with age. Others become faded and blotchy. Nonwood materialssuch as metal sheets, fibercement sheets and similar are available and commonly used.
Exterior wood cladding is light and durable. A correctly applied wooden facade hasa long lifespan even with poor maintenance. The lifetime of a wooden facade dependson construction methods, surface treatment, timber quality, and climate. It is importantthat the facade is protected from permanent moisture and earth contact is well ventilated.The timber cladding also is easily repaired and replaced.
Weather BoardingThere are different ways of covering the wall with timber dependent on tradition
and design, for example vertical and horizontal boarding (Fig. 1.11), diagonal sidings,and application of plywood or particleboard. Interesting effects can be achieved withthe use of a combination of profiled boards. Plywood sheetings are easy to use andgive interesting surface lines. A timber cladding combined with other materials such asconcrete or bricks is common in farm building.
Vertical boarding is traditional in many countries and vertical spaced boarding espe-cially is used in buildings in which good ventilation is needed. The spaced board is thenoften combined with a concrete or masonry wall. Whether horizontal or vertical boardingis technically preferable may be less important than correct detailing and nailing. Thenails should be corrosion-resistant, that is, galvanized, to insure spot-free siding underadverse conditions.
FinishingWood-based sheet materials and weather boarding are best protected through a combi-
nation of constructive protection and painting. All surfaces to be finished should be cleanand dry. Painting in intense sunshine should be avoided. Surfaces of wood claddings aregiven a prime coat as early as possible after setting up. The primer should be spreadabundantly on the surface. Alkyd paints can be used as a priming paint. Two coats ofgood-quality latex, alkyd, or oil-based paint should be used over the nonporous primer.This is particularly important for surfaces that are fully exposed to weather or wet con-ditions. In order to avoid future separation between coats of paint or intercoat peelingthe first topcoat should be applied within 2 weeks of the application of the primer andthe second coat within 2 weeks of the application of the first coat.

Figure 1.11. Different types of vertical and horizontal boarding.
24
Wood as a Construction Material for Farm Buildings 25
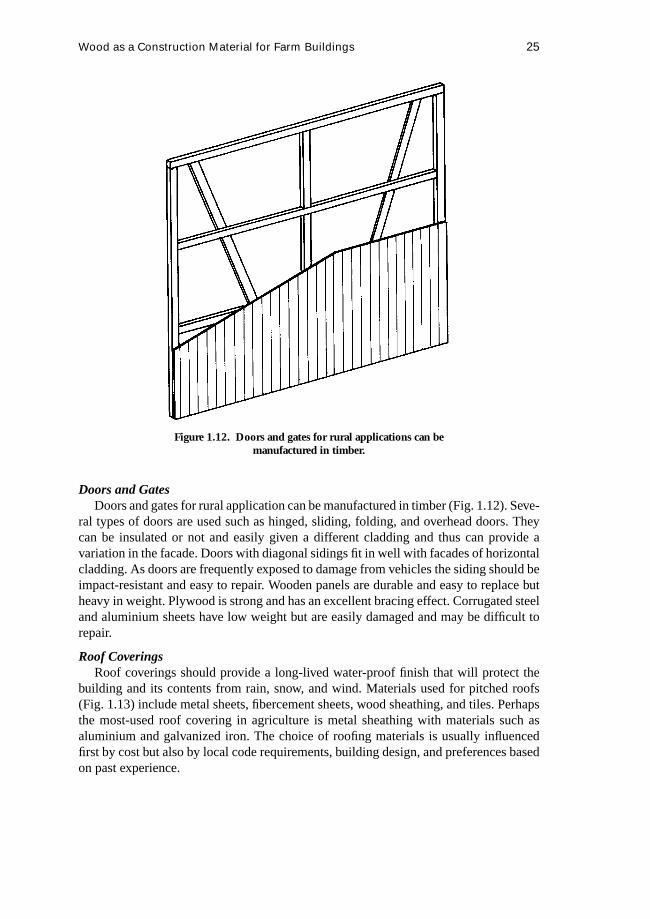
Figure 1.12. Doors and gates for rural applications can bemanufactured in timber.
Doors and GatesDoors and gates for rural application can be manufactured in timber (Fig. 1.12). Seve-
ral types of doors are used such as hinged, sliding, folding, and overhead doors. Theycan be insulated or not and easily given a different cladding and thus can provide avariation in the facade. Doors with diagonal sidings fit in well with facades of horizontalcladding. As doors are frequently exposed to damage from vehicles the siding should beimpact-resistant and easy to repair. Wooden panels are durable and easy to replace butheavy in weight. Plywood is strong and has an excellent bracing effect. Corrugated steeland aluminium sheets have low weight but are easily damaged and may be difficult torepair.
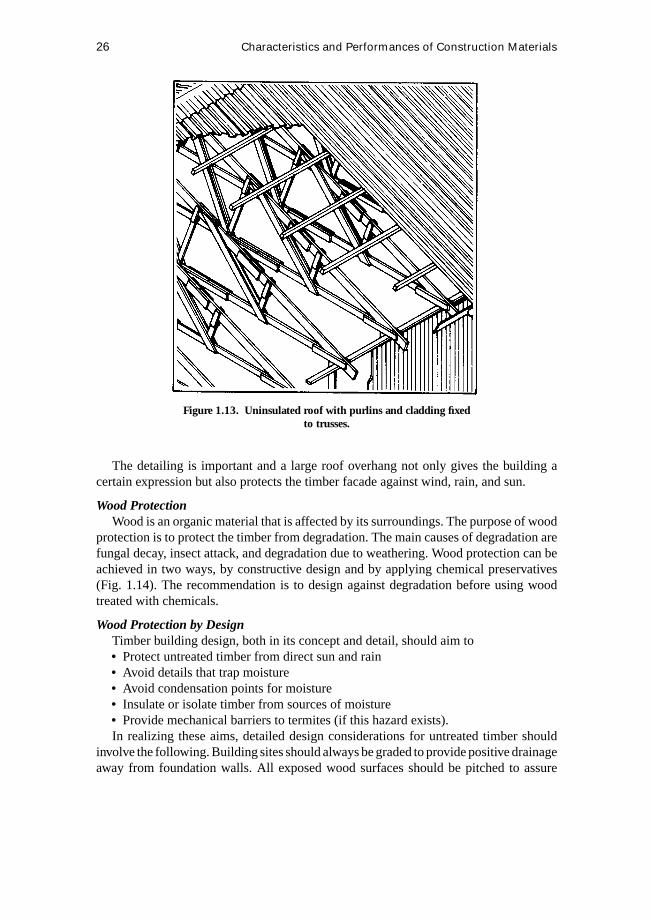
Roof CoveringsRoof coverings should provide a long-lived water-proof finish that will protect the
building and its contents from rain, snow, and wind. Materials used for pitched roofs(Fig. 1.13) include metal sheets, fibercement sheets, wood sheathing, and tiles. Perhapsthe most-used roof covering in agriculture is metal sheathing with materials such asaluminium and galvanized iron. The choice of roofing materials is usually influencedfirst by cost but also by local code requirements, building design, and preferences basedon past experience.
26 Characteristics and Performances of Construction Materials
Figure 1.13. Uninsulated roof with purlins and cladding fixedto trusses.
The detailing is important and a large roof overhang not only gives the building acertain expression but also protects the timber facade against wind, rain, and sun.
Wood ProtectionWood is an organic material that is affected by its surroundings. The purpose of wood
protection is to protect the timber from degradation. The main causes of degradation arefungal decay, insect attack, and degradation due to weathering. Wood protection can beachieved in two ways, by constructive design and by applying chemical preservatives(Fig. 1.14). The recommendation is to design against degradation before using woodtreated with chemicals.
Wood Protection by DesignTimber building design, both in its concept and detail, should aim to• Protect untreated timber from direct sun and rain• Avoid details that trap moisture• Avoid condensation points for moisture• Insulate or isolate timber from sources of moisture• Provide mechanical barriers to termites (if this hazard exists).In realizing these aims, detailed design considerations for untreated timber should
involve the following. Building sites should always be graded to provide positive drainageaway from foundation walls. All exposed wood surfaces should be pitched to assure

Wood as a Construction Material for Farm Buildings 27
Figure 1.14. Wood protection by design or preservative treatments.
rapid runoff of water. Construction details that tend to trap moisture in end grain mustbe avoided. A fairly wide roof overhang with well designed gutters and downpipesis desirable. Wood in contact with concrete near the ground should be protected bya moisture-proof membrane such as heavy asphalt paper. In most cases preservativetreatment of wood in actual contact with the concrete is advisable. Vapor barriers, ifinstalled, should be near the warm face of insulated walls and ceilings. Roofs must beweathertight and attic cross-ventilation is desirable.
Chemical Wood PreservationWood can be protected from attack by fungi and insects by means of treatment
with preservatives. The level of protection can be varied to match particular hazards byaltering the type of preservative, its concentration in the wood, and its penetration intothe wood. There are various methods of applying wood preservatives, some providingbetter penetration than others. The penetration also depends on the wood species, and inmost cases heartwood is more resistant to treatment than sapwood.
Types of PreservativesWood preservatives are generally divided into three main groups, water-borne preser-
vatives, organic-solvent preservatives, and creosotes or coal-tar types. Examples of types

28 Characteristics and Performances of Construction Materials
of water-borne preservatives are boric (mixtures of compounds such as boric acid andborax) and CCA (salts or oxides of Copper, Chronium, and Arsenic).
Preservation ProcessesWood-preservation treatments can be divided into two types, nonpressure processes
and pressure processes. The nonpressure methods, for instance brushing, spraying, anddipping, differ widely in the penetration and retention of preservatives and consequentlyin the degree of protection. The pressure process obtain a deeper penetration and a higherretention, and accordingly the wood gets a better protection.
1.3.6 Thermal Insulation
In many farm buildings it is desirable to keep the heat transmission through the roof,walls, and floor to a minimum. Insulation of the constructions will help to reduce the heattransmission from the warm side to the cold side. It will keep the building warmer or, ifnecessary, cooler in hot climates. For buildings in which an internal temperature similarto the external temperature is acceptable, insulation is not necessary. Such buildingsinclude housing for cattle, calves, and sheep and storage of hay and straw.
Other buildings housing pigs and poultry may need supplementary heating to maintainthe correct temperature. In these cases the cost of insulation and its installation must becompared with the expenditure on energy, that is, fuel costs and the efficiency of theheating and control system. As long as the value of savings in energy expenditure ishigher than the annual cost of insulation it is profitable to insulate.
MaterialsA wide variety of materials is suitable for use as insulation. Most common is insulation
made from low-density materials such as glass or mineral wool, expanded polystyrene,and polyurethane foam. The insulation material can be rigid, flexible, loose-fill, or re-flective. Rigid insulation is usually made of polystyrene or polyurathane and availablein board form. Flexible insulation consists of either blankets or batts.The materials usedare mineral wools, which are fibrous materials made from glass or rock. Because flexibleinsulation has no rigidity it must be applied in spaces between other structural members.Loose-fill insulation is made from materials similar to those for rigid and flexible insula-tions. Loose-fill material requires a complete enclosure such as ceilings or wall cavitiesto hold it in place (Fig. 1.15). This insulation is available in bags. Relective insulationconsists of metal foil or other reflective surfaces.
Selection of MaterialsFor most applications the insulation will only be effective if the insulation material is• Unaffected by high levels of humidity• Fire resistant• Easy to clean• Easy to fix over large areas• Strong enough to withstand rough handling during and after installation.
These requirements should be considered in addition to the insulation value and cost.

Wood as a Construction Material for Farm Buildings 29
Figure 1.15. Thermal insulation of glass or mineralwool in stud frame wall.
Reference
1. Dolby, C.-M., A. Hammer, and K.-H. Jeppsson. 1988.Rural Constructions in Timber.Alnarp, Sweden: Swedish University of Agricultural Sciences.

30
2 Environment for Animals
Some terms used in the livestock environment field are more conceptual than precise.Some authors have used a very broad sense of the termenvironmentto include all non-genetic factors influencing the animal. In this case we have used a restricted definitionto include only thermal factors, aerial factors, floor, and fittings influencing the animals.Housing of livestock is originally motivated to reduce climatic impacts on productionand to facilitate management including control of diseases and improvement of health.Since the 1960s the general concern about the environment and pollution has madedesirable control of the runoff or emission originating from animal wastes. Under realcircumstances there are two main bases for practices: strict economic and animal wel-fare. Functional relationships between animal performance and weather parameters aretherefore necessary to establish.
2.1 Animal Environment RequirementsKrister Sallvik
In many countries there has been a lot of work done to state “animal rights” or“welfare codes of practice,” [1, 2]. These rights are both ethical and scientific. Withinour definition of environment some key issues are• Adequate fresh air• Food, sufficient and of type to keep the animal in full health and vigor• Freedom of movement (including the ability freely turn around and exercise limbs)• Comfort of immediate environment (e.g., freedom from draughts, a bedded area)• Freedom to follow innate behavior patterns except if there denial cannot reasonable
be avoided.Most of the codes of practice issued can be divided into four basic sections:• Housing, which includes control of ventilation, air speed, temperature, humidity,
gases, dust, noise, and lighting• Space allowance and other critical measures for animals depending on species, age,
sex, and system of husbandry• The provision of food, water, and bedding in both intensive and extensive systems• Management and planning, which include isolation facilities for culling, medical
treatment, isolation, and outside shelters in extensive systems
31
32 Environment for Animals
2.1.1 Thermal
All farm animals are homeothermic, exhibiting a relatively constant long-term bodytemperature under the most varying conditions with large variations of internal heatproduction due to metabolism (for maintenance and production) and variation in thesurrounding thermal environment (temperature, air velocity, radiation, bedding, etc). Thesurrounding environment can also add heat to an animal if the ambient air temperatureexceeds its body temperature or by direct or indirect solar radiation. Consequently it isessential for agricultural engineers to understand animal heat balance from the animaland physiological view. It is recognized [3], however, that short-term fluctuations inbody temperature occur because of metabolic processes, physiological changes, andenvironmental stressors. There is a diurnal rhythm (circadian) that largely reflects activityand feeding during the day and rest at night. There is even a rhythm of body temperaturefor ad-lib fed animals that is monophasic, with the maximum near midnight and theminimum in late morning to early afternoon. During hot conditions the range can bearound 2◦C. The brain substance cannot be exposed to temperature higher than 45◦Cwithout severe damages.
2.1.2 Thermoneutral Zone
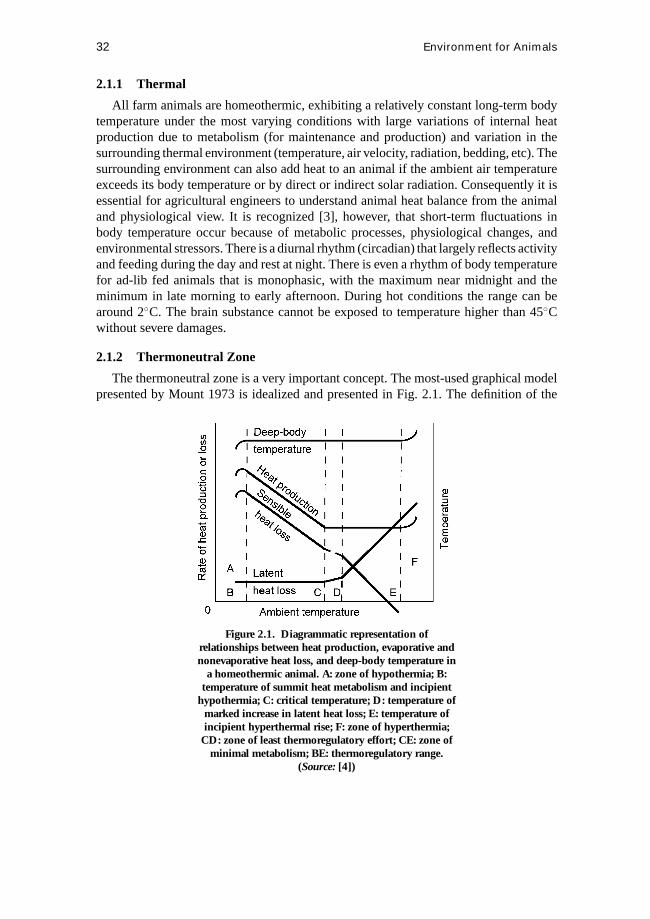
The thermoneutral zone is a very important concept. The most-used graphical modelpresented by Mount 1973 is idealized and presented in Fig. 2.1. The definition of the
Figure 2.1. Diagrammatic representation ofrelationships between heat production, evaporative andnonevaporative heat loss, and deep-body temperature in
a homeothermic animal. A: zone of hypothermia; B:temperature of summit heat metabolism and incipient
hypothermia; C: critical temperature; D: temperature ofmarked increase in latent heat loss; E: temperature ofincipient hyperthermal rise; F: zone of hyperthermia;
CD: zone of least thermoregulatory effort; CE: zone ofminimal metabolism; BE: thermoregulatory range.
(Source: [4])

Animal Environment Requirements 33
thermoneutral zone is the range of environmental temperatures within which the meta-bolic rate is minimum and independent of temperature. The temperatures that boundthis zone are known asupperandlower critical temperatures. The lower is well defined(and also marked in Fig. 2.3). For the upper critical temperature there does not exist anyagreement as to an absolute definition [5].
In a thermoneutral environment, animal total heat production can be calculated as thedifference between the input of metabolizabled energy and energy retained in productsand growth of body tissue [6]:
φtot = [Em + (1− Ky) · Ey + (1− K p) · Ep + (1− Kg) · Eg] · 11.57 (2.1)
where
φtot=Thermoneutral total heat production of the animal (W)Em=Metabolizable energy required for maintenance (MJ/d)Ky=Efficiency of utilization for milk productionEy=Metabolizable energy required for milk production (MJ/d)K p=Efficiency of utilization for pregnancyEp=Metabolizable energy required for pregnancy (MJ/d)Kg=Efficiency of utilization for growthEg=Metabolizable energy required for growth (MJ/d).
The coefficients of utilization depend on the metabolizability of the feed. To calculate thetotal heat production equations from “the nutrient requirements of ruminant livestock”(ARC, 1980 or NRC, 1981) can be used.
There are two different situations for the animal thermoregulatory system, short andmedium/long-term. Intensity and duration of thermal stressors as well as cycling or con-stant thermal environment must be considered. A dramatic change in thermal conditionsmust be taken care of by an alarm reaction known as stress [9]. For some species be-havioral patterns are very important. The long-term responses to thermal environmentinclude adaptation of feed and water intake, change of metabolism, and fur or coatinsulation.
The concept of a variable setpoint temperature is found useful by physiologists toexplain regulation of body temperature. The setpoint temperature apparently is modifiedby such factors as microbial infections and the thermal environment.
Until now the calculations of the thermoneutral zone by heat balance equations is staticand assume steady-state conditions. The thermoregulatory system are, in the animals,however, much more sophisticated than that. These systems have been developed toguarantee survival of animals under very sever weather conditions, which means that thecontrol system both integrates thermal signals and must prepare for even more severeconditions. This is shown in both beef and dairy cattle, in which increased feed intakeoccurs at higher temperatures than indicated by calculating lower critical temperature.
2.1.3 Heat Balance at Animal Level
The metabolic heat production of a homeothermic animal must be balanced byheat losses of the same magnitude. Thus, when examining an animal by heat-balance
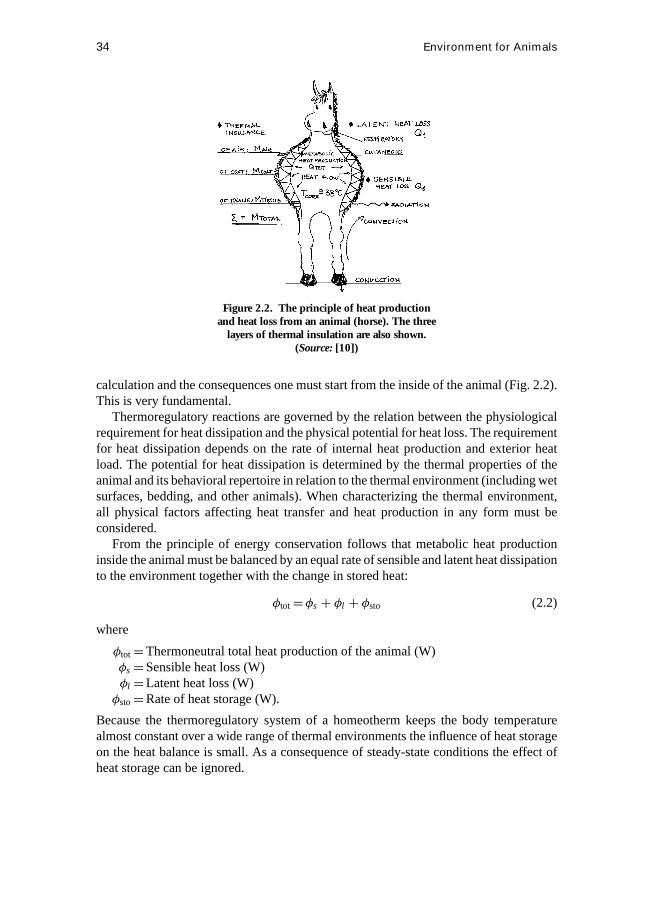
34 Environment for Animals
Figure 2.2. The principle of heat productionand heat loss from an animal (horse). The three
layers of thermal insulation are also shown.(Source: [10])
calculation and the consequences one must start from the inside of the animal (Fig. 2.2).This is very fundamental.
Thermoregulatory reactions are governed by the relation between the physiologicalrequirement for heat dissipation and the physical potential for heat loss. The requirementfor heat dissipation depends on the rate of internal heat production and exterior heatload. The potential for heat dissipation is determined by the thermal properties of theanimal and its behavioral repertoire in relation to the thermal environment (including wetsurfaces, bedding, and other animals). When characterizing the thermal environment,all physical factors affecting heat transfer and heat production in any form must beconsidered.
From the principle of energy conservation follows that metabolic heat productioninside the animal must be balanced by an equal rate of sensible and latent heat dissipationto the environment together with the change in stored heat:
φtot=φs + φl + φsto (2.2)
where
φtot=Thermoneutral total heat production of the animal (W)φs=Sensible heat loss (W)φl =Latent heat loss (W)φsto=Rate of heat storage (W).
Because the thermoregulatory system of a homeotherm keeps the body temperaturealmost constant over a wide range of thermal environments the influence of heat storageon the heat balance is small. As a consequence of steady-state conditions the effect ofheat storage can be ignored.

Animal Environment Requirements 35
Sensible Heat LossThe rate of sensible heat loss for a standing animal depends on the difference between
the body temperature and the ambient temperature together with the thermal resistanceof the body:
φs = tbody− tamb
Rbody(2.3)
where
φs=Sensible heat loss (W)tbody=Deep body temperature (◦C)tamb=Ambient temperature (◦C)
Rbody=Total thermal resistance of the body (K/W).
The thermal resistance of the body depends on the surface area of the body together withthe thermal insulances of the tissue, coat, and boundary layers:
Rbody= mtiss+mcoat+ma
Abody(2.4)
where
Rbody=Total thermal resistance of the body (K/W)mtiss=Thermal insulance of the body-tissue layer (m2K/W) (Table 2.1)mcoat=Thermal insulance of hair–coat layer (m2K/W) (Table 2.2)
ma=Surface thermal insulance of the surface–air boundary layer (m2K/W)(see Eq. 2.4)
Abody=Surface area of the body (m2) (Table 2.3).
The surface thermal insulance of the surface-air boundary layer is depending on radi-ant and convective conditions. Physicial properties in surroundings and for the animalinfluencing this is air velocity, surface temperatures and emission factors and the trunkdiameter of the animal. The latter a function of body weight. Gustafsson [22] analysed
Table 2.1. Thermal insulance of body-tissue layer
mtiss(m2K/W)
Animal Maximum Minimum Source
Cattle 0.03 ·m0.33 [11]Cattle 0.017 ·m0.41 0.02 [12]Bull 0.14 0.039 [13]Calf 0.094 0.039 [13]Horse 0.100 [10]Pig 0.02 ·m0.35 0.01 ·m0.35 [14]Piglet 0.065 0.029 [15]Weaner 0.10 0.057 [15]Pig adult 0.30 [15]Sheep 0.2 0.078 [16]
Note. m = body weight (kg).

36 Environment for Animals
Table 2.2. Different classes of coats and their thermal insulance
Thermal InsulanceType of Coat Depth of Coat (mm) (m2K/W)
Cattle, kept outdoorsVery heavy winter coat 30–40 0.25Heavy winter coat 20–30 0.20Winter coat 15–20 0.15
Cattle kept indoorsVery heavy coat 15–20 0.15Heavy dense coat 10–15 0.12Medium to dense coat 10–15 0.10Light coat 5–10 0.06Very light, close-cut coat 0.03 0.03
Cattle, general d ·10-30.15
Horse 0.12Sheep (Merino) 10 0.22
20 0.3130 0.40
Sheep (Cheviot) 10 0.12Chicken 5 0.10
10 0.2020 0.40
Note. Data for windspeed < 0.2 m/s.Sources: [10, 12, 13, 16].
Table 2.3. Expressions for body surface area of Ab,different animals
Animal Surface area, Ab (m2) Source
General 0.06 ·m0.67 [7]Cow 0.12 ·m0.60 [9]Beef cow 0.13 ·m0.56 [17]Pig 0.09 ·m0.66 [18]Pig 0.097 ·m0.633 [17]Growing pig 0.09 ·m0.633 [19]Horse 1.09+ 0.008m [20]
Chicken 0.10 ·m0.67 [21]
Note. m= body weight (kg).
the radiative conditions and proposed the heat transfer coefficient for radiation to be5.4 W/m2K under normal housing conditions. Bruce and Clark [19] proposed followingexpression for the heat-transfer coefficient for convection:
αconv= 15.7v0.6
m0.13(W/m2K) (2.5)
wherev = air velocity (m/s).

Animal Environment Requirements 37
Figure 2.3. Basic thermoregulatory responses inrelation to ambient temperature. ZM, ZS, and ZL
are temperature zones with different types ofregulation (metabolic, sensible, and latent
regulation, respectively). LCT: lower criticaltemperature. (Source: [23])
The total thermal insulance of the surface–air boundary layer is then
ma = 1
5.4+ 15.7(v0.6
m0.13
) (m2 K/W). (2.6)
Figure 2.3 shows how the thermoregulatory reactions of an animal are restricted by thelimits imposed by the laws of physics. The line between points 1 and 3 correspondsto the lowest possible rate of sensible heat loss that corresponds to maximum thermalresistance of the body. Similarly, the line between 2 and 3 shows the highest possiblerate of sensible heat loss with minimum thermal resistance. No sensible loss is possibleif ambient (air and radiant) temperature is equal to body temperature.
Convective heat transfer depends on external windspeed (forced convection) or ther-mal buoyancy (free convection). Radiative heat losses are influenced by surface tem-peratures, radiating areas, and emission factors. There are many references with exper-iments and calculation of the heat transfer by convection and radiation, [12, 13, 19, 22,24, 25].
Figure 2.4 shows how convective heat loss increases with increasing air speed. In thecalculation both free and forced convection are taken into account. The convective heatdissipation lowers the coat surface temperature and the net result is that the increasingconvective loss is partly compensated for by radiant heat dissipation. This compensatingmechanism also moderates the effect of latent heat loss from the skin.
In Tables 2.1, 2.2, 2.3 some of these basic parameters are given for different types ofanimals.
For a lying or recumbent animal one must also consider conduction heat losses to thefloor and the thermal properties of the floor including the bedding. Animal behavioralpatterns and the number of animals in a group, resulting in reduced exposed area, mustalso be considered.

38 Environment for Animals
Figure 2.4. Convective, radiant, and total sensible heatdissipation from the surface of an animal. Convective heat
loss considers both natural and forced convection.(Source: [12])
If ambient temperature rises above the limit at which the thermal resistance of thebody is at its minimum (upper limit of ZS in Fig. 2.3), sensible heat loss decreaseslinearly because the governing temperature difference between the environment and thebody decreases and the requirement of heat balance can only be met by increasing latentheat dissipation.
In a cooler environment the thermal resistance of the body increases (by increasing thethermal insulance or decreasing the exposed surface area) until it reaches its maximumlevel. The ambient temperature at which the thermal resistance is maximal correspondsto the lower limit of the thermoneutral zone. In Fig. 2.3 the range of temperatures withinwhich the thermal resistance of the body gradually changes from its maximum to itsminimum level is called the zone with sensible thermoregulatory control (ZS).
Even in a cool environment, some heat is lost through evaporation to the air from therespiratory tract and water-vapor diffusion through the skin. In the following subsectionsthe latent loss at lower critical temperature is calledminimum latent heat loss.
Latent Heat LossThe theory of thermodynamics shows that water-vapor pressure differences rather
than temperature differences govern latent heat transfer. The water-vapor pressure atthe skin surface depends on the rate of diffusion through the skin and the rate of secre-tion from the sweat glands. Water also evaporates from the respiratory tract. Increasingthe air exchange rate (“thermal panting”) can increase this evaporation rate. The ther-moregulatory system has a wide range of control over both sweat-gland activity andrespiratory rate. Thus, from a physiological viewpoint the rate of latent heat loss is gov-erned by the heat-dissipation requirement rather than the water-vapor pressure of theambient air.
Experimental data (e.g., [26, 27]) indicate that the thermoregulatory system usesregulation of sensible heat loss instead of latent heat loss whenever possible. Thus, in thelower range of the thermoneutral zone heat balance is attained mainly through sensible

Animal Environment Requirements 39
regulation, while latent heat-loss regulation dominates the upper range. Mount [4] refersto the lower range as the “zone of least thermoregulatory effort.”
The thermal resistance of the body depends only on its size and the thermal propertiesof the insulating layers and is not related to the requirement of cooling caused by thetotal heat production. Thus, in a specific thermal environment (in the upper range ofthe thermoneutral zone) animals with the same rate of sensible heat loss, the rate oflatent heat loss will depend on their total heat production. This has been demonstratedexperimentally by Blaxter et al. [26], who made measurements on sheep at differentfeeding levels and over a wide range of temperatures.
Minimal Latent Heat LossThis parameter is needed to calculate the lower critical temperature for the animal,
and it determines the level of evaporative heat loss in the zone with metabolic thermoreg-ulatory control (ZM) and (ZS). Based on a literature review [12, 28], the minimal latentheat loss from cattle can be calculated as
φl min = 10 · Ab + 0.07 · φtot (2.7)
where
φl min=Latent heat loss (W)Ab=Surface area of the body (m2)φtot=Thermoneutral total heat production of the animal (W).
This equation was chosen because it models both moisture diffusion through the skin(which is related to the body surface area) and respiratory heat loss. The respiratory heatloss depends on the rate of air exchange, which is related to the metabolic rate. Theequation gives a minimal latent heat loss of 10% to 20% of the total heat productiondepending on the relation between body surface area and total heat production.
For pigs Bruce and Clark [19] give the following expression for minimum latent heatloss:
φl min = 0.09(8.0+ 0.07m)m0.67 (W). (2.8)
Cold EnvironmentWhen ambient temperature decreases below the thermoneutral zone (below lower
critical temperature), sensible loss increases due to the increasing temperature differencebetween the body and the environment. This induces an increase in metabolic heatproduction. Obviously, this increase in metabolic rate requires an adequate supply ofmetabolisable energy. The temperature range in which body temperature is controlledby regulating the metabolic rate is called the zone with metabolic thermoregulatoryregulation (ZM) (see Fig. 2.2).
Hot EnvironmentAcute heat stress often increases the total heat production due to the muscle activ-
ity associated with panting [29]. After some time, the heat-stressed animal adapts bydecreasing its metabolism and consequently its total heat production. At the present, itdoes not seem possible to calculate the upper limit of the thermoneutral zone using onlythe basic thermal properties of the body and the metabolic rate.

40 Environment for Animals
ModelsBruce and Clark [19] have presented a fundamental and widely used models for heat
production and critical temperature for growing pigs. Sterrenburg and Ouwerkerk [18]have presented a computerized model known as “BEZOVA” for pigs. For cattle Ehrlemarkand Sallvik [23] have presented “ANIBAL.” Morgan [10] deals with horses; Bruce [11]with beef cattle; and Bruce, Broadbent, and Topps [30] with lactating and pregnant sows.Information on parameters, assumptions, and computer programs for calculating animalheat balances is many times available directly from the authors. However, there are veryfew new basic studies on physical and physiological parameters.
The models can be used to illustrate lower critical temperature under differences inconditions such as production or feed intake level, air velocity, coat condition, floor andbedding, or number of animals in a group.
Tables 2.4 and 2.5. Illustrate for cattle and pigs respectively very big differences inlower critical temperature.
Table 2.4. Lower critical temperature (LCT) for cattle
Body Weight Production LCTAnimal (kg) (kg/d) (◦C)
Milking cow 240-d pregnant 500 0 −18Milking cow 500 15 −30Milking cow 500 35 −50Beef cattle 75 0.7 10Beef cattle 150 0.9 −5Beef cattle 500 0.9 −20Replac heifer 250 0.55 0Replac heifer 240-d pregnant 500 0.5 −20Calf 50 0.5 10
Note. Assumptions: air speed 0.1 m/s coat depth for cattle 10 mm.Source: [23]
Table 2.5. Lower critical temperature (LCT) for piglets
LCT (◦C), LCT (◦C), LCT (◦C),Concrete Floor Expanded Metal Floor Straw Bedding
Pig Weight(kg) 1 Pig/Pen 10 Pigs/Pen 1 Pig/Pen 10 Pigs/Pen 1 Pig/Pen 10 Pigs/Pen
2*maintenance1 31 29 28 26 27 235 28 23 26 24 24 20
10 27 24 25 22 23 184*maintenance
1 27 24 23 20 22 175 23 20 20 17 18 12
10 21 17 18 15 16 9
Source: [31].
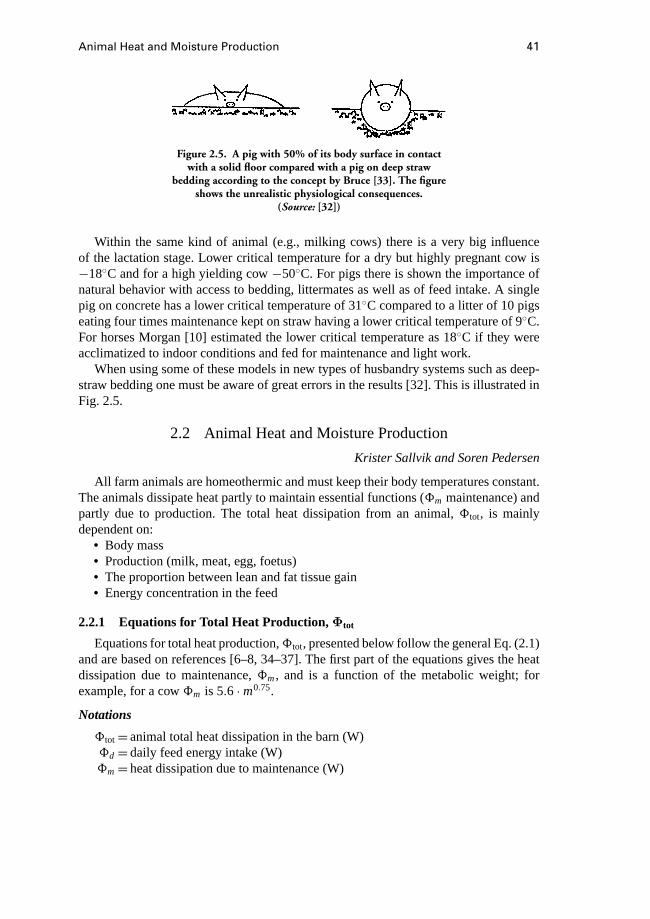
Animal Heat and Moisture Production 41
Figure 2.5. A pig with 50% of its body surface in contactwith a solid floor compared with a pig on deep straw
bedding according to the concept by Bruce [33]. The figureshows the unrealistic physiological consequences.
(Source: [32])
Within the same kind of animal (e.g., milking cows) there is a very big influenceof the lactation stage. Lower critical temperature for a dry but highly pregnant cow is−18◦C and for a high yielding cow−50◦C. For pigs there is shown the importance ofnatural behavior with access to bedding, littermates as well as of feed intake. A singlepig on concrete has a lower critical temperature of 31◦C compared to a litter of 10 pigseating four times maintenance kept on straw having a lower critical temperature of 9◦C.For horses Morgan [10] estimated the lower critical temperature as 18◦C if they wereacclimatized to indoor conditions and fed for maintenance and light work.
When using some of these models in new types of husbandry systems such as deep-straw bedding one must be aware of great errors in the results [32]. This is illustrated inFig. 2.5.
2.2 Animal Heat and Moisture Production
Krister Sallvik and Soren Pedersen
All farm animals are homeothermic and must keep their body temperatures constant.The animals dissipate heat partly to maintain essential functions (8m maintenance) andpartly due to production. The total heat dissipation from an animal,8tot, is mainlydependent on:• Body mass• Production (milk, meat, egg, foetus)• The proportion between lean and fat tissue gain• Energy concentration in the feed
2.2.1 Equations for Total Heat Production,Φtot
Equations for total heat production,8tot, presented below follow the general Eq. (2.1)and are based on references [6–8, 34–37]. The first part of the equations gives the heatdissipation due to maintenance,8m, and is a function of the metabolic weight; forexample, for a cow8m is 5.6 ·m0.75.
Notations
8tot=animal total heat dissipation in the barn (W)8d=daily feed energy intake (W)8m=heat dissipation due to maintenance (W)
42 Environment for Animals
8prod=heat dissipation due to the production by the animal (W)m=animal weight (kg)n=daily feed energy in relation to8m
K = factor for additional heat dissipation from horsesKt = coefficient for proportioning between sensible and latent heat dissipationKy= coefficient of efficiency at weight gainY1=milk production (kg/d)Y2=meat and egg production (kg/d)M = concentration of energy in feed, MJ/kgdry matter
p=number of days pregnant
CattleCalf:
8tot = 6.44m0.70+ 13.3Y2(6.28+ 0.0188m)
1− 0.3Y2
Y2 is normally 0.5 kg/d.Veal calf, beef cattle:
8tot = 7.64m0.69+ Y2
[23
M− 1
][57.27+ 0.302m
1− 0.171Y2
]Y2 = 0.7− 1.1 kg/dayM for roughage= 10 MJ/kgdry matter
M for concentrate= 11− 12 MJ/kgdry matter
Cow replacement:
8tot = 7.64m0.69+ Y2
[23
M− 1
][57.27+ 0.302m
1− 0.171Y2
]+ 1.6 · 10−6 p3
Y2 = 0.6 kg/d.M is according to veal calf and beef cattleCow:
8tot = 6.6m0.75+ 22Y1+ 1.6 · 10−6 p3
PigsPiglet:
8tot = 7.4m0.66+ (1− Ky)(8d −8m)
Ky = 0.47+ 0.003m8d = n ·8m
Fattening pig:
8tot = 5.09m0.75+ (1− KY)(8d −8m)
Ky and8d are according to piglet.

Animal Heat and Moisture Production 43
Sow, boar, gilt:
8tot = 5.5m0.76+ 28Y1+ 2 · 10−6 p3+ 76Y2
Y2, pregnant sow= 0.18 kg/dY2, pregnant gilt= 0.62 kg/d
Nursing sow:
8tot = 5.5m0.76+ 28Y1
Y1 = 6 kg/d
Other Kinds of AnimalsHorse:
8tot = 6.1m0.76+ K ·8m
K =0 for horses in little work/trainingK =0.25 for horses in moderate work/trainingK =0.50 for horses in hard work/training
Laying hen, in cage:
8tot = 6.28m0.76+ 25Y2
Laying hen, on floor:
8tot = 6.8m0.76+ 25Y2
Broiler:
8tot = 10m0.75
Sheep:
8tot = 6.4m0.76+ 33Y12.4 · 10−5 · p3
Y1 nursing ewe= 1− 1.5 kg/d
Lamb:
8tot = 6.4m0.76+ 145Y2
Y2 = 0.25 kg/day
Heat Producing UnitIn the previous text, the animal total heat production refers to a single animal under
thermoneutral conditions. Sometimes, it is more convenient to refer to a specificheatproduction unit, e.g. as used below, defined as a quantity of animals producing 1000 Win total heat at 20◦C [6]. To illustrate an animal’s adjustment of feed intake due to lowand high temperatures respectively, and its effect on the total heat production, Eq. (2.9)according to [6] can be used. However it should be understood that Eq. (2.9) does not

44 Environment for Animals
take into account neither size of animal nor production level i.e. the actual upper andlower critical temperature.
8tot = 1000[1+ 4 · 10−5(t + 10)4] (2.9)
In this way Eq. (2.9) expresses the animal total heat production at different indoortemperatures.
2.2.2 Proportion Between Sensible and Latent Heat Dissipation
It is essential to separate sensible and latent heat dissipation when calculating venti-lation demand and judging animal comfort. Experimental results on sensible and latentheat production are rare because normally experiments are focused on total heat. InFig. 2.3 it is shown that
8tot = 8s +8l . (2.10)
8s is dissipated proportional to the temperature difference between the animal surfaceand the ambient air. Consequently8s is zero if the surrounding air temperature is equalto animal surface temperature, that is, around 40◦C.8l is dissipated in the form of moisture. To maintain animal heat balance and body
temperature,8l increases with increasing temperature. The proportion between8s and8l is affected also by kind of animal, production, surface area, fur, and dryness of the skin.
To calculate heat and moisture dissipation in the barn,8tot must be distributed between8s and8l . The proportional sensible heat is given by
8s = 8tot[0,8− α(tx − Kt )4] (2.11)
where
Kt = coefficient when proportioning between sensible and latent heat dissipationcould be the same numerical value as lower critical temperature
tx =measured or assumed ambient temperatureα=nondimensional factorα= 0.8
(40− Kt )4
If Kt is unknown, one should choose
Kt =−10α=1.28 · 10−7
One can get a model of how an animal dissipates sensible heat by using normal heat-transfer equations as shown in Fig. 2.3. The following example shows this.
ExampleAssumptions for one fattening pig are as follows:
Body mass=45 kgDaily feed intake=3.5 times maintenance
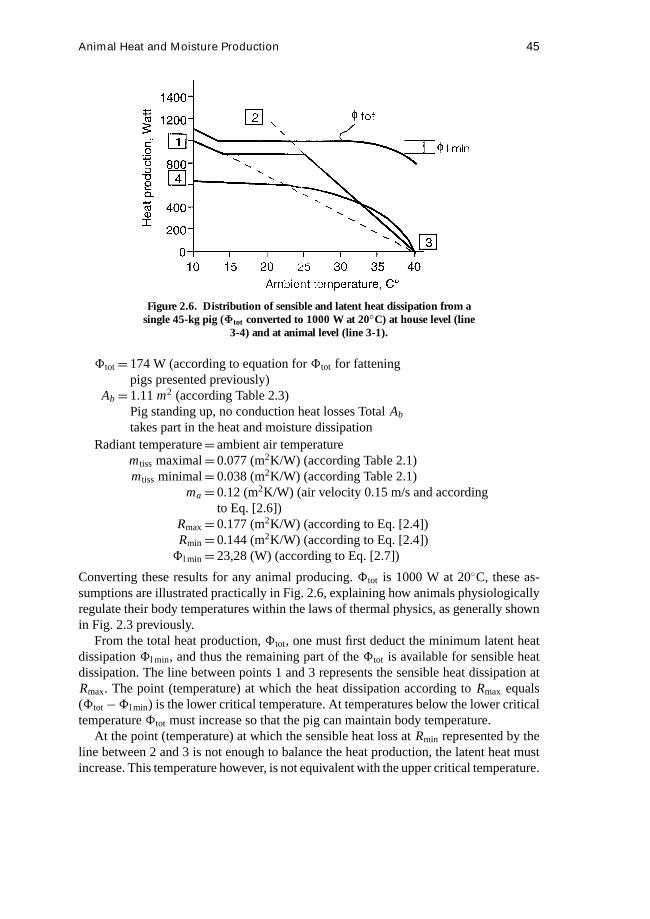
Animal Heat and Moisture Production 45
Figure 2.6. Distribution of sensible and latent heat dissipation from asingle 45-kg pig (Φtot converted to 1000 W at 20◦C) at house level (line
3-4) and at animal level (line 3-1).
8tot=174 W (according to equation for8tot for fatteningpigs presented previously)
Ab=1.11m2 (according Table 2.3)Pig standing up, no conduction heat losses TotalAb
takes part in the heat and moisture dissipationRadiant temperature=ambient air temperature
mtiss maximal=0.077 (m2K/W) (according Table 2.1)mtiss minimal=0.038 (m2K/W) (according Table 2.1)
ma=0.12 (m2K/W) (air velocity 0.15 m/s and accordingto Eq. [2.6])
Rmax=0.177 (m2K/W) (according to Eq. [2.4])Rmin=0.144 (m2K/W) (according to Eq. [2.4])8l min=23,28 (W) (according to Eq. [2.7])
Converting these results for any animal producing.8tot is 1000 W at 20◦C, these as-sumptions are illustrated practically in Fig. 2.6, explaining how animals physiologicallyregulate their body temperatures within the laws of thermal physics, as generally shownin Fig. 2.3 previously.
From the total heat production,8tot, one must first deduct the minimum latent heatdissipation8l min, and thus the remaining part of the8tot is available for sensible heatdissipation. The line between points 1 and 3 represents the sensible heat dissipation atRmax. The point (temperature) at which the heat dissipation according toRmax equals(8tot−8l min) is the lower critical temperature. At temperatures below the lower criticaltemperature8tot must increase so that the pig can maintain body temperature.
At the point (temperature) at which the sensible heat loss atRmin represented by theline between 2 and 3 is not enough to balance the heat production, the latent heat mustincrease. This temperature however, is not equivalent with the upper critical temperature.

46 Environment for Animals
In reality animals perform a much smoother transfer between these principles for thethermoregulation of their body temperature.
At house level some of the sensible heat is used to evaporate water from wet surfaces,feed, and manure. This changes the proportion between8s and8t . This is exemplifiedby the line between 3 and 4. See also Section 2.2.4.
2.2.3 Conversion of Latent Heat to Moisture Dissipation
The latent heat dissipation,8l , in watts is transferred to moisture dissipation,F , ingrams per hour and is calculated according to following:
F = 8l
r(2.12)
wherer = 0.680 Wh/g water at 20◦C
2.2.4 Heat and Moisture Production at House Level
The heat and moisture production at house level is based on animal level of heat andmoisture production and then the influences of various factors. These factors mean thatmore moisture evaporates with heat from the animal’s sensible heat. Factors includeflooring system, stocking, density, watering, moisture content of the feed and feedingsystem, animal activity, and relative humidity.
In Fig. 2.6 the line between 1 and 3 represents8s at animal level at vasoconstriction;the line between 2 and 3 represents8s at vasodilation. The upper curve is8tot.
The difference between the lines for8tot and8l min is 8l , which with increasingtemperature increases according to the line between 2 and 3. At house level8s isdissipated according the line between 3 and 4.
Equation 2.13 gives a general expression of the sensible heat dissipation at houselevel within the ambient temperature range from 10◦C to 40◦C under housing conditionssimilar to what are standard in Northern Europe
8s = a+ btamb+ ct2amb+ dt3amb (2.13)
wherea, b, c, andd are coefficients (see Table 2.6) andtamb is ambient temperature incentigrades or◦C. The result is shown in Figs. 2.7 through 2.12.
The figures are mainly based on results with indoor temperatures in the normal rangeof 15 of 30◦C.
Table 2.6. Coefficients for Eq. (2.13) on sensible heat
Layers
Coefficients Basic Cattle Pigs Cages Floor Broiler
a 884 752 876 982 681 805b −7,404 −6,294 −42,597 −46,984 −1,190 −39,216c −0,0381 −0,0324 2,4200 2,6788 −0,3111 2,2288d −0,0082 −0,0070 −0,0475 −0,0529 −0,0021 −0,0438
Note. Coefficients defined for ambient temperatures in the range of 10◦ to 40◦C

Animal Heat and Moisture Production 47
Figure 2.7. Sensible and latent heat dissipation at house level. General animal house.
Figure 2.8. Sensible and latent heat dissipation at house level. House for cattle.
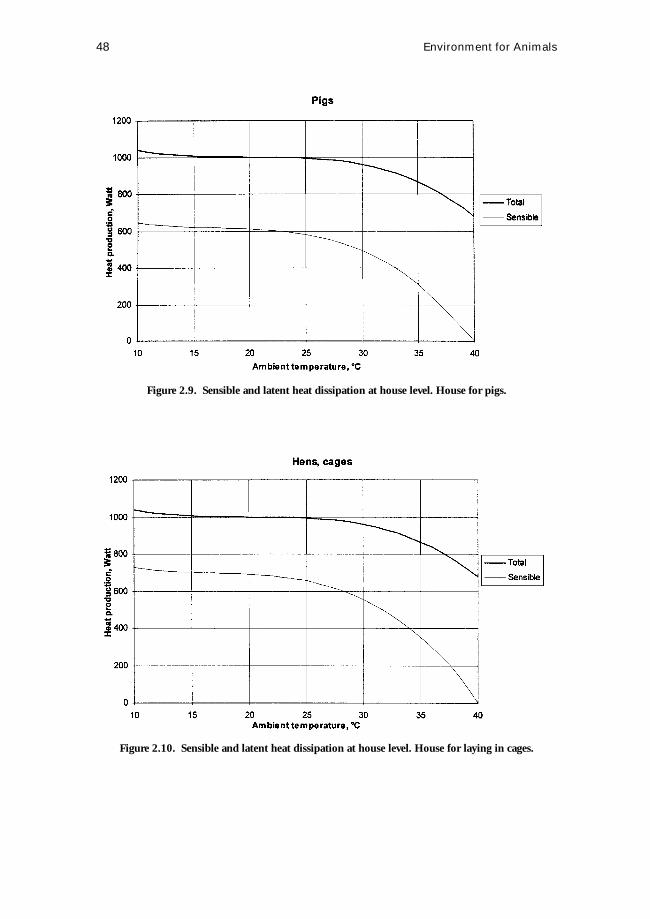
48 Environment for Animals
Figure 2.9. Sensible and latent heat dissipation at house level. House for pigs.
Figure 2.10. Sensible and latent heat dissipation at house level. House for laying in cages.

Animal Heat and Moisture Production 49
Figure 2.11. Sensible and latent heat dissipation at house level. House for hens or floor.
Figure 2.12. Sensible and latent heat dissipation at house level. House for broilers.

50 Environment for Animals
Figure 2.13. The diurnal variation between animal activity (measured by passive infrareddetector) in a house for fattening pigs and the animal total heat dissipation and production of
carbon dioxide. (Source: [39])
2.2.5 Diurnal Variation in Heat and Moisture Production at House Level
Normally, animal heat production is expressed by steady state equations, as shownpreviously. In commercial animal houses, there are various reasons why heat productionvaries during the 24-h cycle, for example because of feeding intervals, working routines,or light regimes. It is not possible at present to give worldwide equations for adjustment ofanimal heat production according to diurnal rhythm, but for some well-defined housingand management situations information is available based on animal activity recordings.For other specific production systems it is expected to be possible in the future to makediurnal corrections. The variation in heat dissipation is very closed related to variationin animal activity, which can be registered by passive infrared detector, a techniquepresented by Pedersen [38]. In Fig. 2.13 an example of the close relation between animalactivity and the production of heat,8tot, and carbon dioxide is shown [39].
The correlation,R2, between animal activity and heat production for pigs is about60%. Ouwerkerk and Pedersen [40] expressed the diurnal variation in activity and8tot
by the following equation:
A = a+ b · sin[(2 · π/24) · (t + 6− hmin)] (2.14)
where
A= animal activitya = constant (average over 24 h)b= constant (maximum and minimum deviation from average activity)hmin = time with minimum activityt = timetime displacement= 6

Animal Heat and Moisture Production 51
Figure 2.14. The diurnal variation of animal activity (measured by passiveinfrared detector technique) in houses for dairy cows. (Source: [41])
Figure 2.15. The diurnal variation of animal activity (measured by passiveinfrared detector technique) in houses laying hens. (Source: [41])

52 Environment for Animals
A more sophisticated equation would be one that takes into account two activity peaksduring the daytime for conditions with restricted feeding two times a day, as in Fig. 2.14for dairy cows [36].
The importance of taking animal activity into account is that there is a good relationbetween animal activity and carbon dioxide and heat production as shown in Fig. 2.13in a house with ad-lib feeding of fattening pigs. Dividing into day periods from 6:00 to18:00 and night periods from 18:00 to 6:00, the night activity accounts for approximately70% of the activity during daytime. For carbon dioxide and heat production, the figuresare in both cases approximately 75%, showing that carbon dioxide and heat productionare much higher during day than during night. For layers with ad-lib feeding, basedon groups of identical houses (Fig. 2.15), the animal activity over the day period ismore constant; the activity during the night sometimes is only one third of the 24-hmean activity [36]. These two examples clearly show that steady-state equations are notsufficient for simulation of climatic conditions in animal houses.
References
1. Phillips, C., and Piggins, D. 1992.Farm Animals and the Environment. WallingfordC.A.B International cop.
2. Moss, R. (ed.). 1992.Livestock, health and welfare. Harlow Longman.3. Hahn, G. L., Nienaber, J. A., Klemcke, H. G., and Gose, G. L. 1986. Body tem-
perature fluctuations in meat animals. ASAE Paper No. 86-4009. St. Joseph, MI:ASAE.
4. Mount, L. E. 1973. The concept of thermal neutrality. InHeat Loss of Animals andMan—Assessment and Control(ed. J. L. Monteith and L. E. Mount) pp. 424–435.London: Butterworths.
5. Webster, A. J. F. 1991. Metabolic responses of farm animals to high temperature.EAAP Publication No. 55, pp. 15–22.
6. CIGR. 1984. Climatization of animal houses. Report of Working Group. Aberdeen,Scotland: Scottish Farm Buildings Investigation Unit.
7. NRC. 1981. Nutrient requirements of beef cattle. National Research Council. Na-tional Academic Press, Washington DC.
8. ARC. 1980.The Nutrient Requirement of Ruminant livestock. Slough England:Agricultural Research Council, Commonwealth Agricultural Bureaux.
9. Webster, A. J. F. 1976. The influence of the climatic environment on metabolismin cattle. InPrinciples of Cattle Production. Easter School in Agricultural Science,Proceedings 23(ed. H. Swan and W. H. Broster), pp. 103–120. London: Butter-worths.
10. Morgan, K. 1996. Short-term thermoregulatory responses of horses to brief changesin ambient temperature. Swedish University of Agricultural Sciences, Departmentof Agricultural Engineering, Report 4, Dissertation, Uppsala, Sweden.
11. Bruce, J. M. 1986. Lower critical temperatures for housed beef cattle.Farm Buil-ding ProgressApril:23–28. Scottish Farm Building Investigation Unit. Aberdeen,Scotland.

Animal Heat and Moisture Production 53
12. Ehrlemark, A. 1988. Calculation of sensible heat and moisture loss from housedcattle using a heat balance model. Swedish University of Agricultural Sciences,Department of Farm Buildings, Report 60, Uppsala, Sweden.
13. Blaxter, K. L. 1969.The Energy, Metabolism of Ruminants, 2 ed. London: Hutchin-son.
14. Bruce, J. M. 1979.Heat Loss from Animals to Floors. Farm Building Progress No.55. Scottish Farm Building Investigation Unit. Aberdeen, Scotland.
15. Stombaugh, D. P. 1976. Thermoregulation in swine. ASAE Paper No. 76-5009. St.Joseph, MI: ASAE.
16. McArthur, A. J. 1981. Thermal insulation and heat loss from animals. InEnvironmen-tal Aspects of Housing for Animal Production, pp. 37–60. London: Butterworths.
17. Brody, S. 1945.Bioenergetics and Growth. New York: Reinhold Publishing Corpo-ration.
18. Sterrenburg, P., and Ouwerkerk, E. N. J. 1986. Rekenmodel voor de bepaling vande thermische behaagliijkeidszone van verkens (BEZOVA). Instituut voor mecha-nisatatie, arbeiden gebouwen, IMAG, Rapport 78, Wageningen, The Netherlands.
19. Bruce, J. M., and Clark, J. J. 1979. Models of heat production and critical temperaturefor growing pigs.Animal Production28:353–369.
20. Hugdson, D. R., McCutcheon, J. L., Byrd, S. K., Brown, W. S., Bayly, W. M.,Brengelmann, G. L., and Gollnick, P. D. 1993. Dissipation of metabolic heat in thehorse during exercise.Journal of Applied Physiology. 74:1161–1170.
21. Leighton and Siegel, 1966.22. Gustafsson, G. 1988.Air and heat balances in animal houses, Swedish University
of Agricultural Sciences, Department of Farm Buildings, Report 59. Dissertation.Lund, Sweden.
23. Ehrlemark, A. G., and S¨allvik, K. G. 1996. A model of heat and moisture dissipationfrom cattle based on thermal properties.Transactions of the ASAE39(1):187–194.
24. Mount, L. E. 1977. The use of heat transfer coefficients in estimating sensible heatloss from the pig.Animal Production25:271–279.
25. Wiersma, F., and Nelson, G. L. 1967. Nonevaporative convective heat transfer fromthe surface of a bovine.Transaction of the ASAE10:733–737.
26. Blaxter, K. L., McGraham, N. C., Wainman, F. W., and Armstrong, D. G. 1959.Environmental temperature, energy metabolism and heat regulation in sheep: II. Thepartition of heat losses in closely clipped sheep.Journal of Agricultural Science.52:25–49.
27. Gebremedhin, K. G., Cramer, C. O., and Porter, W. P. 1981. Predictions and mea-surements of heat production and food and water requirements of Holstein calvesin different environments.Transactions of the ASAE24(3):715–720.
28. Ehrlemark, A. 1991. Heat and moisture dissipation from cattle. Measurements andsimulation model. Swedish University of Agricultural Sciences, Department of FarmBuilding, Dissertation, Report 77, Uppsala, Sweden.
29. Yousef, M. K. 1985. Heat production: Mechanisms and regulation. InStress Phys-iology of Livestock, vol. 1: Basic Principles(ed. M. K. Yousef ). Boca Raton, FL:CRC Press.

54 Environment for Animals
30. Bruce, J. M., Broadbent, P. J., and Topps, J. H. 1984. A model of the energy systemof lactating and pregnant cows.Animal Production38:351–362.
31. Bruce, J., and Blaxter, 1979.32. Sallvik, K., and Wejfeldt, B. 1993. Lower critical temperature for fattening pigs on
deep straw bedding. ASAE IV Livestock Environment Symposium, University ofWarwick, Coventry, U.K.
33. Bruce, J. M. 1977.Conductive heat loss from the recumbent animal. Farm BuildingR & D studies, vol. 8February, pp. 9–15.
34. Swedish Standard. 1992.Farm Buildings - Ventilation, heating and climatic analysisin insulated animal houses - Calculations. SS 95 10 50. Stockholm, Sweden.
35. CIGR. 1992. Climatization of animal houses. 2nd Report of Working Group. Facultyof Agricultural Sciences, State University of Ghent, Belgium.
36. Pedersen, S., Takai, H., Johnsen, J. O., Metz, J. H. M., Groot Koerkamp, P. W. G.,Uenk, G. H., Phillips, V. R., Holden, M. R., Sneath, R. W., Short, J. L., White,R. P., Hartung, J., Seedorf, J., Schroeder, M., Linkert, K. H., and Wathes, C. M.1998.A Comparison of Three Balance Methods for Calculating Ventilation FlowRates in Livestock Buildings. Journal of Agricultural Engineering Research. Volume70, Number 1, Special Issue, pp. 25–37, May 1998.
37. Pedersen, S., and Thomsen, M. G. 1998.Heat and Moisture Production for Broilerson Straw Bedding. In progress.
38. Pedersen, S. 1993. Time based variation in airborne dust in respect to animal activity.Fourth International Livestock Environmental Symposium, Coventry, U.K.
39. Pedersen, S., and Rom, H. B. 1998.Diurnal Variation in Heat Production from Pigsin Relation to Animal Activity. AgEng International Conference, Oslo 98. Paper98-B-025.
40. van Ouwerkerk, E. N. J., and Pedersen, S. 1984.Application of the carbon dioxidemass balance method to evaluate ventilation rates in livestock buildings. XII CIGRWorld Congress Agricultural Engineering, Milan. Proceedings, vol. 1, 1994:516–529.
41. Pedersen, S. 1996. Døgnvariationer i dyrenes aktivitet i kvæg-, svine- ogfjerkræstalde. Delresultater fra EU-projekt PL 900703.Diurnal variation in ani-mal activity in livestock buildings for cattle, pigs and poultry. Subresults from EU-project PL 900703.(In Danish). National Institute of Animal Science, Denmark,Intern rapport Nr. 66, 33 pp., 1996.
2.3 Environmental Control of Livestock Housing
2.3.1 Natural VentilationJames M. Bruce
All ventilation systems once were natural but, with the availability of electricityon farms and a blossoming control technology, mechanical or fan-powered ventilationtook over. This shift from natural to mechanical ventilation took place mainly becausebuilding designers felt that the performance of mechanical systems was predictable,
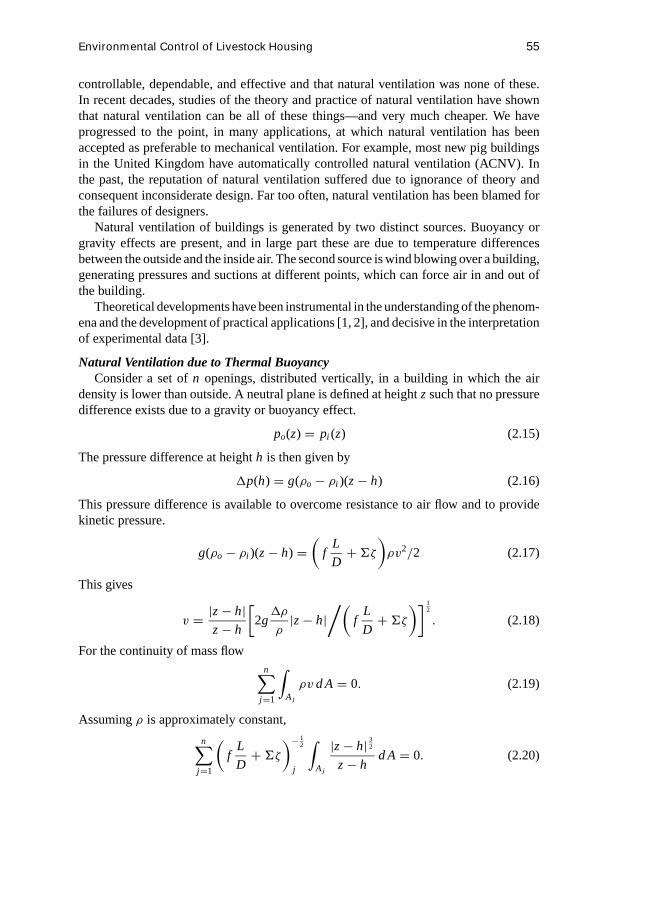
Environmental Control of Livestock Housing 55
controllable, dependable, and effective and that natural ventilation was none of these.In recent decades, studies of the theory and practice of natural ventilation have shownthat natural ventilation can be all of these things—and very much cheaper. We haveprogressed to the point, in many applications, at which natural ventilation has beenaccepted as preferable to mechanical ventilation. For example, most new pig buildingsin the United Kingdom have automatically controlled natural ventilation (ACNV). Inthe past, the reputation of natural ventilation suffered due to ignorance of theory andconsequent inconsiderate design. Far too often, natural ventilation has been blamed forthe failures of designers.
Natural ventilation of buildings is generated by two distinct sources. Buoyancy orgravity effects are present, and in large part these are due to temperature differencesbetween the outside and the inside air. The second source is wind blowing over a building,generating pressures and suctions at different points, which can force air in and out ofthe building.
Theoretical developments have been instrumental in the understanding of the phenom-ena and the development of practical applications [1, 2], and decisive in the interpretationof experimental data [3].
Natural Ventilation due to Thermal BuoyancyConsider a set ofn openings, distributed vertically, in a building in which the air
density is lower than outside. A neutral plane is defined at heightz such that no pressuredifference exists due to a gravity or buoyancy effect.
po(z) = pi (z) (2.15)
The pressure difference at heighth is then given by
1p(h) = g(ρo − ρi )(z− h) (2.16)
This pressure difference is available to overcome resistance to air flow and to providekinetic pressure.
g(ρo − ρi )(z− h) =(
fL
D+6ζ
)ρv2/2 (2.17)
This gives
v = |z− h|z− h
[2g1ρ
ρ|z− h|
/(f
L
D+6ζ
)] 12
. (2.18)
For the continuity of mass flown∑
j=1
∫Aj
ρv d A= 0. (2.19)
Assumingρ is approximately constant,
n∑j=1
(f
L
D+6ζ
)− 12
j
∫Aj
|z− h| 32z− h
d A= 0. (2.20)

56 Environment for Animals
It is necessary to solve Eq. (2.20) to findz. The ventilation rate for the building is thenfound from
V =(
2g1T
T
) 12 n∑
j=1
(f
L
D+6ζ
)− 12
j
∫Aj (z)
|z− h| 32z− h
d A (2.21)
where1ρ/ρ has been replaced by1T/T . By treating air as a perfect gas it is readilyshown for approximately constant pressure and small1T that1ρ/ρ = 1T/T .
The following relationship can be used to evaluate the integral in Eq. (2.21):∫|a− y|p(a− y)qdy= − 1
p+ q + 1|a− y|p(a− y)q+1 (2.22)
for p+ q 6= −1For a given set of openings
V = K1T1/2, (2.23)
K being found from Eq. (2.21).For a building the heat balance can be written
8 = (ρcV +6k A)1T (2.24)
Substituting Eq. (2.23) into Eq. (2.24) and rearranging gives
V3+ 6k A
ρcV2− K 28
ρc= 0 (2.25)
which must be solved to giveV , the ventilation rate.
Example 1Consider a single vertical rectangular opening of heightH and areaA. From Eq. (2.20)
or from symmetryz= H/2. Evaluating Eq. (2.21) gives
V = ζ− 12
A
3
(g1T
TH
) 12
. (2.26)
Typically ζ−1/2 ≈ 0.6 for sharp-edged openings.Therefore
V = 0.2A
(g1T
TH
) 12
≈ 0.04A(1T H)12 . (2.27)
For a doorway 0.9 m wide and 2.1 m high with a temperature difference of 10 K theventilation rate would be
V = 0.04× 0.9× 2.1(10× 21)1/2 = 0.35 m3s−1. (2.28)
From Eq. (2.18) the velocity profile can be derived to be
v = 0.50
∣∣ H2 − h
∣∣ 32
H2 − h
= 0.50|1.05− h| 32
1.05− h. (2.29)
Equation (2.29) is shown in Fig. 2.16.

Environmental Control of Livestock Housing 57
Figure 2.16. Velocity profile at the vertical opening.
Figure 2.17. Building cross-section.
Example 2Consider a building 30 m long with a cross-section as shown in Fig. 2.17. The building
contains 400 pigs producing 100 W of sensible heat each. The heat-loss rate from thebuilding is given by
6k A= 500 WK−1 (2.30)
Assuming that the height between the openings is 3.3 m and that the height of theeaves openings is negligible, the height of the neutral plane above the eaves openings is

58 Environment for Animals
found using Eq. (2.20):∫Ae
|z− h| 32z− h
d A+∫
Ar
|z− h| 32z− h
d A= 0. (2.31)
Integrating gives
|z| 32z
Ae+ |z− 3.3| 32z− 3.3
Ar = 0 (2.32)
z= 3.3/1+(
Ae
Ar
)2
= 0.66 m (2.33)
The constant in Eq. (2.21) is evaluated thus:
V =(
2× 9.81
273
) 12
0.6× 0.6612 (2× .02× 30)1T
12 = 1.61T1/2. (2.34)
Substituting into Eq. (2.25) gives
V3+ 500
1.2× 10¹⁰V2− 1.62× 400× 100
1.2× 1010= 0
V3+ 0.41V2− 84.5 = 0
from which
V = 4.26 m3s−1 (2.35)
and
1T = (4.26/1.6)2 = 7.1 K. (2.36)
If the building were poorly insulated so that
6k A= 5000 WK−1 (2.37)
then
V3+ 4.1V2− 84.5= 0
from which
V = 3.36 m3s−1 (2.38)
and
1T = 4.4 K (2.39)
If all the openings were reduced by half then the ventilation rates and temperaturedifferences for the insulated and poorly insulated cases would be
V = 2.63 m3s−1 with 1T = 10.8 K (2.40)
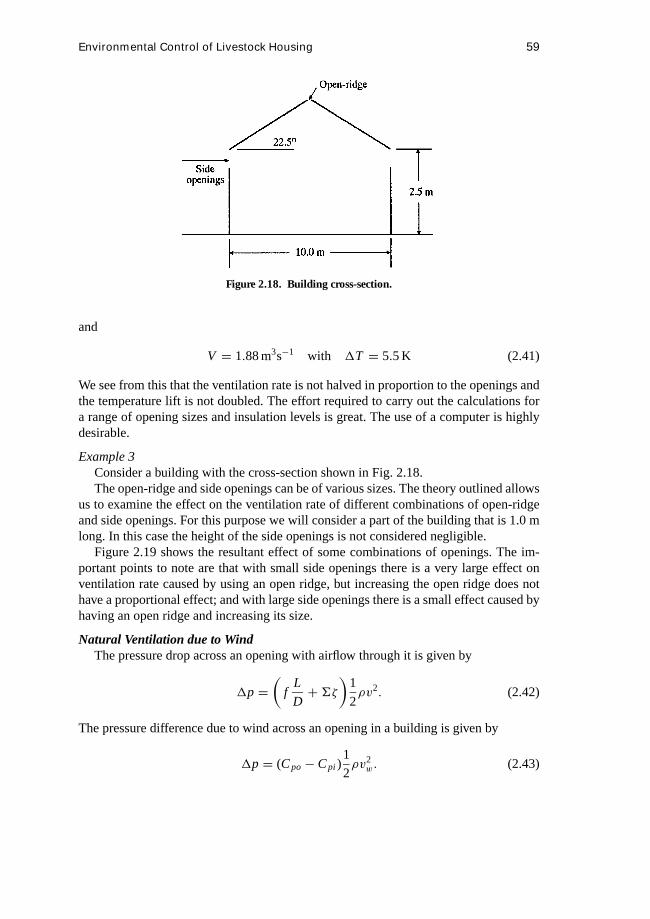
Environmental Control of Livestock Housing 59
Figure 2.18. Building cross-section.
and
V = 1.88 m3s−1 with 1T = 5.5 K (2.41)
We see from this that the ventilation rate is not halved in proportion to the openings andthe temperature lift is not doubled. The effort required to carry out the calculations fora range of opening sizes and insulation levels is great. The use of a computer is highlydesirable.
Example 3Consider a building with the cross-section shown in Fig. 2.18.The open-ridge and side openings can be of various sizes. The theory outlined allows
us to examine the effect on the ventilation rate of different combinations of open-ridgeand side openings. For this purpose we will consider a part of the building that is 1.0 mlong. In this case the height of the side openings is not considered negligible.
Figure 2.19 shows the resultant effect of some combinations of openings. The im-portant points to note are that with small side openings there is a very large effect onventilation rate caused by using an open ridge, but increasing the open ridge does nothave a proportional effect; and with large side openings there is a small effect caused byhaving an open ridge and increasing its size.
Natural Ventilation due to WindThe pressure drop across an opening with airflow through it is given by
1p =(
fL
D+6ζ
)1
2ρv2. (2.42)
The pressure difference due to wind across an opening in a building is given by
1p = (Cpo− Cpi )1
2ρv2
w. (2.43)

60 Environment for Animals
Figure 2.19. Ventilation rate due to a temperature difference of 1 K.
Combining Eqs. (2.42) and (2.43) gives
v2 = v2w
Cpo− Cpi
f LD +6ζ
. (2.44)
Taking account of the direction of flow through the opening, the solution is
v = vw |Cpo− Cpi | 32Cpo− Cpi
(f
L
D+6ζ
)− 12
. (2.45)

Environmental Control of Livestock Housing 61
Figure 2.20. Building cross-section.
For continuity of mass flow in a building withn openings,
n∑j=1
Aj v j = 0 (2.46)
whenρ ≈ constant.Given the external pressure coefficients, the areas, and resistance characteristics at
each opening, the problem reduces to solving Eq. (2.46) to findCpi . OnceCpi is foundthe ventilation rate can be calculated from
V =n∑
j=1
Aj v j for v j > 0 only. (2.47)
For more than a few openings the calculations are tedious and a computer is essential.
Example 1Assume a wind of 3 ms−1 blowing across the same building shown in Fig. 2.17.
Figure 2.20 illustrates the case.The openings are sharp-edged, soζ−1/2 = 0.6. Equation (2.46) becomes
|0.5− Cpi | 320.5− Cpi
+ |−0.4− Cpi | 32−0.4− Cpi
+ | − 0.5− Cpi | 32−0.5− Cpi
= 6 = 0 (2.48)
Successive guesses forCpi give
Cpi 6
−0.1 −0.41
−0.2 −0.16
−0.3 +0.13
−0.26 +0.01.

62 Environment for Animals
This is nearly zero; thereforeCpi =−0.26. The inlet ventilation rate is therefore given by
A1vw(Cpo1− Cpi )1/2ζ−1/2 = 6× 3× (0.5+ 0.26)1/2× 0.6= 9.4 m3s−1. (2.49)
The outlet ventilation can also be calculated as a check:
6× 3× (|−0.4+ 0.26|1/2+ |−0.5+ 0.26|1/2)× 0.6= 9.3 m3s−1. (2.50)
This is sufficiently good agreement.This ventilation rate is two to three times that calculated due to thermal buoyancy.
The wind can easily dominate buoyancy effects.
Example 2Figure 2.21 illustrates the effect on wind-induced ventilation of different combinations
of openings in the building described in Fig. 2.18.Again, a unit length of 1.0 m is taken. The effect of the size of the open ridge is greater
with small side openings than with large side openings. This was observed with buoyancyeffects. Generally, however, the ventilation rate due to buoyancy shows a greater responseto the size of the open ridge than does the wind-induced ventilation.
Combined Effects of Thermal Buoyancy and Wind [4]For the sake of simplicity (f L
D +6ζ ) is replaced byζ alone.Following Eqs. (2.17), (2.42) and (2.43) gives
ζ1
2ρv2 = 1
2ρv2
w(Cpo− Cpi )+ g(ρo − ρi )(z− h). (2.51)
This results in
v = ζ− 12
∣∣(Cpo− Cpi )v2w + 2g1T
T (z− h)∣∣ 3
2
(Cpo− Cpi )v2w + 2g1T
T (z− h)
(2.52)
or
v = ζ− 12
(Cpo− Cpi )v2w + 2g1T
T (z− h)∣∣(Cpo− Cpi )V2w + 2g1T
T (z− h)∣∣ 1
2
. (2.53)
The same continuity constraint and heat balance apply as before but the solution ismuch more difficult and a computer is required even for a simple case.
Example 1The same building shown in Figs. 2.17 and 2.20 will be used. First consider the effect
of temperature lift with a constant wind of 1 ms−1. Figure 2.22 shows the relationshipbetween ventilation rate and temperature difference. There appear to be two distinctdomains. At low temperature differences only the windward opening,A1, is an inlet,with A2 andA3 acting as outlets. At some temperature difference between 3 K and 4 KbothA1 andA2 become inlets, so a new relationship develops. For the building concerned,
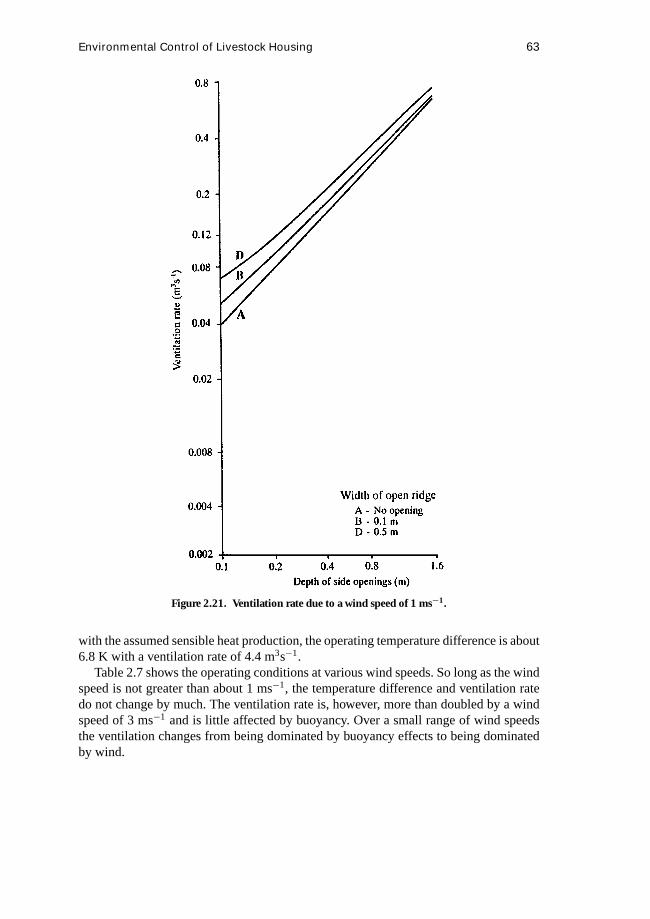
Environmental Control of Livestock Housing 63
Figure 2.21. Ventilation rate due to a wind speed of 1 ms−1.
with the assumed sensible heat production, the operating temperature difference is about6.8 K with a ventilation rate of 4.4 m3s−1.
Table 2.7 shows the operating conditions at various wind speeds. So long as the windspeed is not greater than about 1 ms−1, the temperature difference and ventilation ratedo not change by much. The ventilation rate is, however, more than doubled by a windspeed of 3 ms−1 and is little affected by buoyancy. Over a small range of wind speedsthe ventilation changes from being dominated by buoyancy effects to being dominatedby wind.

64 Environment for Animals
Table 2.7. Operating conditions at various wind speeds
Wind Speed Temperature Ventilation Rate(ms−1) Difference (K) (m3s−1)
0 7.1 4.30.5 7.1 4.31.0 6.8 4.42.0 4.7 6.63.0 3.3 9.63.0 No heat 9.4
Example 2In this example, the same building shown in Fig. 2.18 is used, where the height of the
side openings is not considered to be negligible.Figure 2.23 shows the ventilation rate for buoyancy and wind forces acting alone and
combined. With small side openings, buoyancy is dominant, whereas with large sideopenings the wind is dominant. With intermediate values there is a transition. It is clearthat it would be wrong simply to add the buoyant and wind-induced ventilation rates.
Figures 2.24 and 2.25 show the ventilation rates due to the combined action of buoy-ancy and wind for small side openings. Of course the ventilation rates are much higherwith the large side openings, but the shape of the graph also changes.
Figure 2.22. Ventilation rate for combined wind andthermal buoyancy effects.

Environmental Control of Livestock Housing 65
Figure 2.23. Ventilation rate due to buoyancy, wind, andcombined effects.
ConclusionsTheories for the calculation of natural ventilation due to thermal buoyancy and wind
have been presented and their use illustrated by examples. Neither theory is simple toapply. The combined effects of thermal buoyancy and wind can be calculated, but foreven very simple cases a computer is essential. The combined effect of buoyancy andwind can be complex even for simple systems. From a practical point of view it wouldseem desirable to base design procedures either on thermal buoyancy or on wind actingseparately. In this way manageable design methods are feasible.
Notation
A areaA(z) area below the neutral planeCp pressure coefficientc specific heatD equivalent diameter

66 Environment for Animals
Figure 2.24. Ventilation rate for combined wind and thermalbuoyancy effects.
f friction factorg acceleration due to gravityh variable heightK coefficientk heat transfer coefficientL lengthn number of openingsp pressureT absolute temperatureV ventilation ratev velocityz height of neutral plane
Subscripts:
e eavesi insidej jth elemento outsider ridgew windρ density

Environmental Control of Livestock Housing 67
Figure 2.25. Ventilation rate for combined wind andthermal buoyancy effects.
ζ resistance factor1, 2, etc. identifying number
All the dimensions of the variables are standard SI.
References
1. Bruce, J. M. 1975. A computer program for the calculation of natural ventilation dueto wind.Farm Building R&D StudiesNovember.
2. Bruce, J. M. 1978. Natural convection through openings and its application to cattlebuilding ventilation.J. Agric. Eng. Research23:151–167.
3. Bruce, J. M. 1982. Ventilation of a model livestock building by thermal buoyancy.Trans. ASAE25:1724–1726.
4. Bruce, J. M. 1986. Theory of natural ventilation due to thermal buoyancy and wind:Pig, rabbit and small birds housing. CIGR Section II Seminar, Rennes, France.

68 Environment for Animals
2.3.2 Forced Ventilation
Soeren Pedersen
Forced ventilation means that the air-exchange rate in ventilated rooms is establishedby means of fans. It differs from natural ventilation in being less dependent on windvelocity and buoyancy and in the continued energy consumption.
A ventilation system always includes two main parts: inlet and outlet. In the case offorced ventilation at least one of them contains fans. If the fan is placed in the outletsystem, it is called anegative-pressure system. If the fan is placed in the inlet, it is calleda positive-pressure system, and if there are fans in both inlet and outlet it is called anequal-pressure system. The three principles are illustrated in Fig. 2.26.
Air InletsThe airflow pattern at an inlet is completely different from the airflow pattern at an
outlet, because the air stream from an inlet is unidirectional and therefore able to travela long distance before it is discharged, contrary to the conditions at the outlet, wherethe air is sucked in from all directions. Normally, air inlets are shaped as inlet valvesor nozzles with well-defined jets. They can also be shaped as porous surfaces, such asmineral wool ceilings, where the incoming air will have a very low velocity.
Free JetFigure 2.27 shows a free jet, which in principle means a jet thrown into an infinite
room. The jet consists of a cone-shaped core with constant velocity and a mixing zonein which the velocity decreases both with the distance from the opening and with thedistance from the central line of the jet. As shown in Fig. 2.27, the cone-shaped mixingzone has a summit somewhere behind the opening, depending on the shape of the inletopening. For practical use this point can be neglected, and the distance can be measuredjust from the opening. There is no sharp boundary between the mixing zone and theroom air, but normally the jet is defined as the part that is inside a mixing cone with a topangle of 24 degrees. At this distance the velocity is reduced to about 8% of the velocityat the central line [1].
For a jet from a circular opening the air velocity at different distances can be calculatedby the following equation:
vc = Cvo
x
√A
αε(2.54)
Figure 2.26. Ventilation principles.
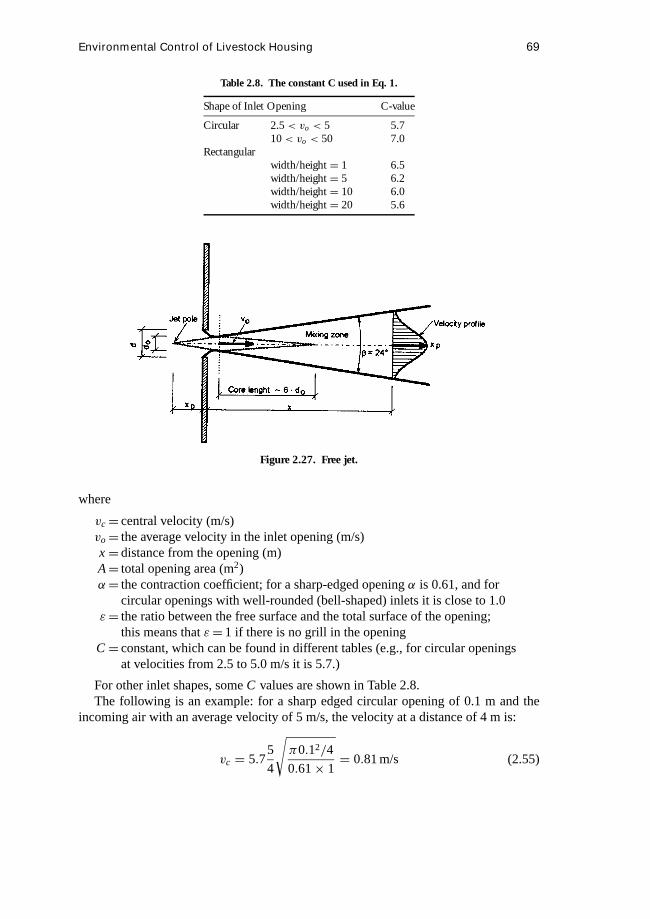
Environmental Control of Livestock Housing 69
Table 2.8. The constant C used in Eq. 1.
Shape of Inlet Opening C-value
Circular 2.5 < vo < 5 5.710 < vo < 50 7.0
Rectangularwidth/height = 1 6.5width/height = 5 6.2width/height = 10 6.0width/height = 20 5.6
Figure 2.27. Free jet.
where
vc= central velocity (m/s)vo= the average velocity in the inlet opening (m/s)x=distance from the opening (m)A= total opening area (m2)α= the contraction coefficient; for a sharp-edged openingα is 0.61, and for
circular openings with well-rounded (bell-shaped) inlets it is close to 1.0ε= the ratio between the free surface and the total surface of the opening;
this means thatε=1 if there is no grill in the openingC= constant, which can be found in different tables (e.g., for circular openings
at velocities from 2.5 to 5.0 m/s it is 5.7.)
For other inlet shapes, someC values are shown in Table 2.8.The following is an example: for a sharp edged circular opening of 0.1 m and the
incoming air with an average velocity of 5 m/s, the velocity at a distance of 4 m is:
vc = 5.75
4
√π0.12/4
0.61× 1= 0.81 m/s (2.55)

70 Environment for Animals
To avoid draught in the living zone of the animals, the central velocity has to be dischargedto below 0.2 m/s. In the example given, the velocity was reduced to 0.2 m/s at a distanceof about 16 m.
Wall JetFor a wall jet, which means a jet blown along and close to a plane, the velocity of the
jet is√
2 higher than that of a free jet, as shown in the following equation:
vc =√
2Cvo
x
√A
αε(2.56)
For the wall jet, the angle of the mixing zone has been increased to 33 degrees. Forother types of jets, see reference [1].
Diffuse InletsDiffuse inlet systems use porous materials like mineral wool or textiles for the air-inlet
system. This method was initially used in Norway in the 1970s [2], and later on it wasadopted in many other places. The advantage is that there is nearly no air velocity whenthe air leaves the porous material, and therefore the risk of draught is negligible. Thisis for instance of interest in weaner and farrowing houses, where it is very important toavoid draught. On the other hand, it is not appropriate under housing conditions whereit is advantageous to have air-jet cooling, for example in fattening houses with indoortemperatures above that of the comfort zone. Figure 2.28 shows the pressure drop neededacross the material to obtain different flow rates. It is remarkable that the pressure dropfor porous materials such as mineral wool increases in proportion to the increase involume flow. For the aluminum sheet with 4.5 mm slots [3], the pressure drop increases
Figure 2.28. Air capacities for porous ceiling at different negative pressures.

Environmental Control of Livestock Housing 71
Figure 2.29. Nonisothermal jets.
progressively, but not in the second power as for a jet. Porous inlets differ from othertypes of inlets in not being adjustable by means of dampers according to the variousneeds of fresh air. Because the ratio of minimum to maximum capacity in a livestockbuilding can be 1:10 or more, there can be design problems, because the range in pressuredrop will also be 1:10 for materials with fine pores and up to 1:100 for materials withholes. Therefore, for a system based only on a porous ceiling, the pressure drop willeither be rather low at minimum capacity or very high at maximum capacity, therebycausing problems for the fans.
Nonisothermal JetsFor nonisothermal conditions, the jet will deviate from the initial central line [4]. If
the temperature of the jet is higher than the room temperature, the jet will rise, and ifthe temperature in the jet is lower, the jet will fall. The deviation can be calculated byEq. (2.57). Figure 2.29 shows the results of a test [5] with a nonisothermal jet from a0.63× 0.27 m air inlet, with a one-quarter open damper and a temperature differenceof 20◦C at pressure drops of 5, 10, and 20 Pa, respectively. The turning of the curve isgreatest for the lowest pressure drop.
y
d= 0.0022
1td
v2o
(x
d
)3
(2.57)
or
y = 0.00221t
v2o
x3
d(2.58)
72 Environment for Animals
where
y= vertical deviation from center line (m)d=diameter of the opening (m)1t =difference between indoor and outdoor temperature (◦C)vo= inlet velocity (m/s)x=distance from the opening (m)
Pressure Loss in Ventilation ComponentsEach part of a component in a ventilation plant will cause pressure losses. For a single
component, such as an inlet valve, the pressure drop is given by the following equation:
P = ζ × 1
2× ρ × v2 (2.59)
P=pressure drop (Pa)ζ = local loss coefficient for a specific unit (for wall inletsζ is often about 1.5)ρ=density of air (1.22 kg/m3 at 15◦C)v=average air velocity in the outlet (m/s)
For rough calculations Eq. (2.59) can be simplified to
P = ζ × v2/1.6 (2.60)
The equation shows that the pressure increases with the velocity in the second power.The same is the case for the outdoor wind pressure, taking into account the actualcorrection factors for different shapes of the building. There is a positive pressure onthe windward side and normally also a negative pressure on the leeward side. Therefore,it can be perceived that the velocity in side wall inlets can be affected very much byoutdoor wind. How much depends on the local loss coefficient for the used side-wallinlet. The greater the loss coefficient, the greater the pressure drop for a given flow,and the smaller the wind effect on the inlet velocity. On the other hand, the energyconsumption increases with an increased loss coefficient. Another way to prevent thiseffect is to use windbreakers.
WindbreakersBy utilization of the ejector principle, different hoods and windbreakers can be used
for reduction of the wind effect on side wall inlets. Figure 2.30 shows an example ofsuch a construction [6]. The investigation is carried out in the laboratory with a 1:10scale model as well as in a full-scale barn.
The effect of the windbreaker in the laboratory with a fixed inlet opening and constantwindspeed perpendicular to the side-wall inlet is shown in Fig. 2.31, in which the inletvelocity ratioVw/Vo is defined as the inlet velocity with wind,Vw, divided by the inletvelocity with no wind,Vo. The wind ratioW/Vo is defined as the wind velocityW dividedby the inlet velocity at no wind. The figure clearly shows that the potential maximumeffect at high wind velocities is considerable. The results from the full-scale experimentshave shown an effect as well, although smaller, among other reasons because the wind

Environmental Control of Livestock Housing 73
Figure 2.30. Side wallinlet with windbreaker.
Figure 2.31. Velocity ratio for side wall inlets with and without windbreakers.
Figure 2.32. Inlet duct with nozzles.
is only partly perpendicular to the wall, and the opening area of the inlet valve varies independence of the animal density and the outdoor air temperature.
Inlet Ducts with NozzlesIn some cases the air is distributed by ducts with inlet slots or nozzles (Fig. 2.32).
For such a duct the problem is to get an even air distribution through all openings alongthe duct, because the flow is normally highest at the farthest end of the fan section. Thereason for this is that the total pressure in the duct closest to the fan section mainly occurs

74 Environment for Animals
Figure 2.33. Air velocities along inlet duct with nozzles.
as dynamic pressure, and so the static pressure needed to move air through the side ductis low. At a certain distance from the fan section, the velocity in the main duct will bereduced when air is released through side ducts, and part of the dynamic pressure willbe converted into static pressure. Even though there is some friction loss in the mainchannel, which reduces the static pressure, the airflow is normally highest in the farthestside ducts. Figure 2.33 shows the results from a test with a 10 m long sided duct withan air velocity three times higher at the farthest end of the fan section than at the fansection.
This means that an even air distribution requires dampers in each nozzle for adjustmentof the air flow. Another complication is that by use of axial flow fans, the air normallyrotates inside the main duct, and so it is difficult to make reliable calculations of theair distribution. The undesirable rotation of the air flow, however, can be reduced byinsertion of air rectifiers between the fan section and the first side nozzle. As a rule ofthumb, the total side-opening area should be smaller than the sectional area of the duct,if no dampers in the inlets are available.
Discharge of Jet Meeting ObstructionsWhen air is blown into a room, the jet will at some distance meet obstructions such
as walls, poles, or light fittings, which will influence the jet and cause risks of draught.Therefore, it is very important to consider what the jet will meet on its way until it isdischarged [7–9]. Figure 2.34 shows schematically how a jet is disturbed by a beam.
Figure 2.35 shows the discharge of an isothermal horizontal jet from a 0.1 m circularopening with a distance of 6 m to a wall and with velocities from 2 to 10 m/s. As shown,the discharge follows the rule of thumb closely. The velocity in a free jet at differentdistances from the opening corresponds to the velocity at a distance of 1 m divided by

Environmental Control of Livestock Housing 75
Figure 2.34. Air jet disturbed by a transverse ceiling beam.
Figure 2.35. Discharge of a jet.

76 Environment for Animals
Figure 2.36. Abrupt termination of jet due to lack of space for thereturn air.
the distance in meters, as can also be seen from Eq. 2.54. Close to the wall the horizontalvelocity decreases. The jet deflects downward towards the floor, where it deflects again.Between the two deflections the jet regains most of its velocity.
Air Distribution in the RoomFigure 2.36 shows another situation in which the inlets are placed one-sided in the
outer wall, and the outlet is placed in the roof. Here, it is important to consider thenecessary space for the return air. For a linear attached jet the expansion is approximately0.3 m for each metre the jet moves downstream [10]. Taking into account that the centerline velocity is relatively high, most of the air movement takes place inside a much smallerpart, and the effective extension can be set to 0.15 m per metre. This means that it will benecessary to include a space of 0.3 m per metre, regardless of the velocity of discharge.
OutletsExhaust fans can be placed in the walls, down the roof surface, or at the ridge of the
roof. Figure 2.37 [11] shows the air velocities around the exhaust opening of a fan.Although there is a well-defined jet at an inlet opening, there is no directional jet at
the outlet opening. Therefore, it can be concluded that the positions of the exhaust fansnormally have a negligible influence on the air flow in a ventilated room at distances ofmore than 1 m from the suction opening.
In regions with small wind velocities it does not matter if the outlets are placed inthe walls or at the roof, but in windy regions the wind pressure will disturb the airflowstability of exhaust fans if placed in walls. Therefore, it is recommendable to place thefans at the ridge of the roof with their outlet placed at least 0.5 m above the highest pointof the roof.
By means of suction from the manure pit below slatted floors it is possible to removea considerable part of the volatile gases (e.g., NH3, H2S) and bad odors released fromanimals, manure, and urine before they get whirled up in the breathing zone of animalsand humans. Figure 2.38 shows the layout of an underfloor suction system [12, 13],which consists of a main air channel parallel to the manure channel and some side ducts.The main problem is to obtain a homogeneous flow all over the slatted floor. In theory,

Environmental Control of Livestock Housing 77
Figure 2.37. Air flow near the exhaust fan.
Figure 2.38. Principle of underfloor suction.

78 Environment for Animals
Figure 2.39. Air velocity ratio in side ducts at different ratios between totalside-duct area and air-duct area.
the computation of the main air channel and the side ducts is time-consuming, becausethe suction is highest nearest to the fan and lowest furthest from the fan. The larger theair channel compared with the sum of the cross-area of the side ducts, the more equalthe suction along the air channel, as shown in Fig. 2.39.
The following can therefore be concluded:The total side duct area must be smallerthan the main air channel.
If that is so, the velocity ratio will not be higher than 1.6, which in most cases isacceptable. Another rule to take into account is as follows:The air velocity in the mainduct should be below 3 m/s in order to restrict the energy consumption.
In some cases it is too expensive to make enough space for the main air duct to keepthe velocity below 3 m/s. It therefore may be appropriate to increase the side duct areato, for example, 1.5 times the main duct area, and in such cases the velocity ratio will be2.5 according to Fig. 2.40, which is an extract of Fig. 2.39. In that case, the side ductsshould be placed at a 2.5 times greater distance to the fan than at the opposite end.
Ventilation Principles
Negative Pressured VentilationThe termnegative pressured ventilationcovers many different combinations of inlet
and exhaust types. The inlets can e.g. be inlet valves in walls or ceilings, inlet slots alongthe overhang, distribution channels with nozzles, porous ducts or ceilings, and so forth.The exhaust fans can be placed in the outer wall, in the roof, or as a part of an exhaustsystem under a slatted floor. Common to all combinations is that fresh air is suppliedto the room by a negative pressure created by exhaust fans. The size of the negative

Environmental Control of Livestock Housing 79
Figure 2.40. Extract of Fig. 2.39.
pressure depends on the used inlet velocity and the inlet air resistance. Normally, theindoor pressure is−5 to−15 Pa.
The advantages of negative pressured ventilation are the guarantee that humid indoorair will not pass walls and roof leakages and the fact that the energy consumption islow compared with equal pressured systems. The disadvantage is that the outdoor windspeed can influence the inlet jets, for example if wall inlets are used.
Equal Pressured VentilationEqual pressured ventilationmeans a system in which the capacities of the inlet and
the exhaust fans at any time are the same. The inlet part normally consists of inlet ductsor heads with nozzles. It can eventually be combined with simple gable fans withoutany real distribution system. The exhaust fans can be of the same types as for a negativepressured system.
The advantages are that the system is only slightly dependent on wind, and that theinlet velocity can be kept at a certain level regardless of the building tightness. Becausethe ventilation flow rate is well controlled, no unnecessary energy loss of artificial heatoccurs.
The disadvantages of the system are that it is more complicated and costly to maintain,and that the energy consumption is approximately twice as high as for negative pressuredsystems.
Positive Pressured VentilationIn Positive pressured ventilationsystems the ventilation flow rate is controlled by
fans and the outlet air leaves the chimneys by means of low positive pressures of a few

80 Environment for Animals
Figure 2.41. Airflow rate for exhaust fan unit equipped with fan wheels withdifferent blade angles.
pascals. The same types of inlet systems as those used for equal pressured ventilationcan be used.
The advantages are that the inlets are well controlled, as seen for equal pressuredsystems, and that the energy consumption is low. The disadvantage is the risk of pressingmoist air into the building construction.
Fan CapacityBecause systems with forced ventilation in livestock buildings are normally catego-
rized as low pressure systems, axial-type fans are normally used. Only in some specialcases with pressure drops of 50 Pa or more centrifugal fans are used. The fan capacitydepends on the dimension of the fan wheel, the number of blades, the blade angles, andthe rotational speed. The more blades used and the larger the blade angles, the more air ismoved. Figure 2.41 [14] shows how the blade angle affects the airflow rate, and Fig. 2.42shows the energy consumption and the rotational speed for a basic unit with a diameterof 615 mm, with 10 blades and blade angles varying from 25 degrees to 45 degrees.The figures show that if the blade angle is increased from 25 degrees to 45 degrees, theventilation flow rate at 10 Pa will more than double, and the energy consumption willincrease by more than three times.
Another way to increase the capacity is to increase the number of blades. For thesame basic unit [15] the number of blades was 4 and 8, respectively, and the air flow ata 20 Pa pressure drop was increased by about 23%. Likewise, the fan capacity at a highpressure drop was increased. In cases with high pressure losses, the most efficient wayto increase the pressure is to increase the fan speed. Most fans use so-called four-pole

Environmental Control of Livestock Housing 81
Figure 2.42. Power consumption and speed of the fans in Fig. 2.41.
motors, with a speed of about 920 rpm at 50 Hz (1100 rpm at 60 Hz). The influence of thefan speed on ventilation flow, pressure drop, and energy consumption can be calculatedby the below fan laws:
Air flow = k1n (m3/s) (2.61)
Pressure drop= k2n2 (Pa) (2.62)
Effect= k3n3 (W) (2.63)
wherek1, k2 andk3 are constants, andn is fan velocity, s−1.The laws show that the flow rate increases proportionally with the speed, and the
pressure increases with the speed in the second power. This means, for example, thatfor a flow rate of 6000 m3/h with a pressure of 20 Pa at 920 rpm, the flow rate for atwo-pole motor at 1450 rpm is 9500 m3/h with a pressure drop of (1450/920)2×20= 50Pa. Because of the increased noise, it is normally not recommendable to increase thespeed.
On the basis of a sample of fans, empirical equations for noise are given in a commonfan-test procedure for Germany, the Netherlands, and Denmark [16]:
Wall fans: N = 39.8+ 0.77× u (2.64)
Roof fans: N = 49.0+ 0.57× u (2.65)
where
N= the noise at a distance of 2 m from the outlet opening and at an angleof 45 degrees, (dB(A))
u= the peripheral speed at a nominal voltage and a pressure drop of 0 Pa.
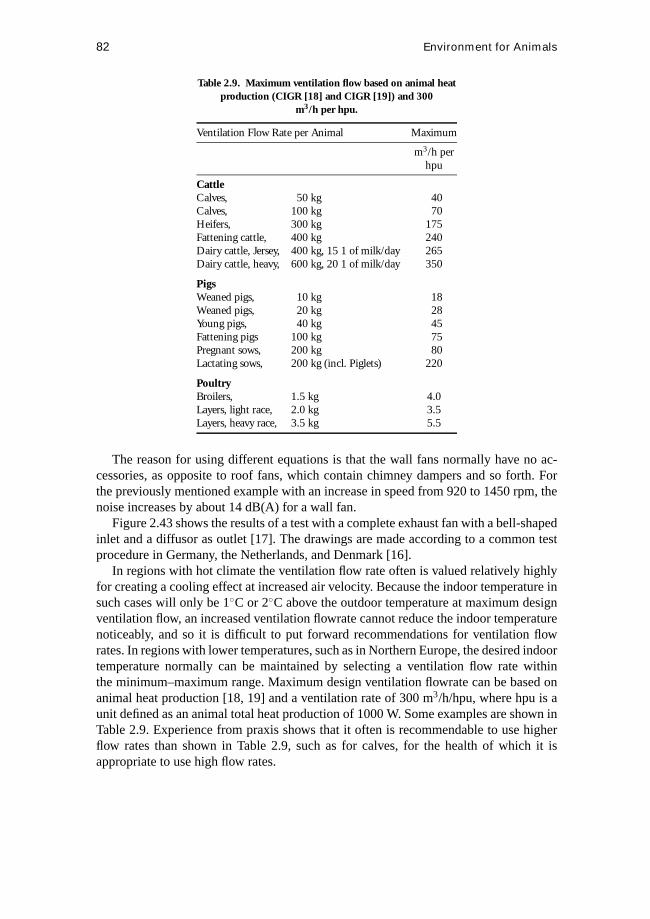
82 Environment for Animals
Table 2.9. Maximum ventilation flow based on animal heatproduction (CIGR [18] and CIGR [19]) and 300
m3/h per hpu.
Ventilation Flow Rate per Animal Maximum
m3/h perhpu
CattleCalves, 50 kg 40Calves, 100 kg 70Heifers, 300 kg 175Fattening cattle, 400 kg 240Dairy cattle, Jersey, 400 kg, 15 1 of milk/day 265Dairy cattle, heavy, 600 kg, 20 1 of milk/day 350
PigsWeaned pigs, 10 kg 18Weaned pigs, 20 kg 28Young pigs, 40 kg 45Fattening pigs 100 kg 75Pregnant sows, 200 kg 80Lactating sows, 200 kg (incl. Piglets) 220
PoultryBroilers, 1.5 kg 4.0Layers, light race, 2.0 kg 3.5Layers, heavy race, 3.5 kg 5.5
The reason for using different equations is that the wall fans normally have no ac-cessories, as opposite to roof fans, which contain chimney dampers and so forth. Forthe previously mentioned example with an increase in speed from 920 to 1450 rpm, thenoise increases by about 14 dB(A) for a wall fan.
Figure 2.43 shows the results of a test with a complete exhaust fan with a bell-shapedinlet and a diffusor as outlet [17]. The drawings are made according to a common testprocedure in Germany, the Netherlands, and Denmark [16].
In regions with hot climate the ventilation flow rate often is valued relatively highlyfor creating a cooling effect at increased air velocity. Because the indoor temperature insuch cases will only be 1◦C or 2◦C above the outdoor temperature at maximum designventilation flow, an increased ventilation flowrate cannot reduce the indoor temperaturenoticeably, and so it is difficult to put forward recommendations for ventilation flowrates. In regions with lower temperatures, such as in Northern Europe, the desired indoortemperature normally can be maintained by selecting a ventilation flow rate withinthe minimum–maximum range. Maximum design ventilation flowrate can be based onanimal heat production [18, 19] and a ventilation rate of 300 m3/h/hpu, where hpu is aunit defined as an animal total heat production of 1000 W. Some examples are shown inTable 2.9. Experience from praxis shows that it often is recommendable to use higherflow rates than shown in Table 2.9, such as for calves, for the health of which it isappropriate to use high flow rates.
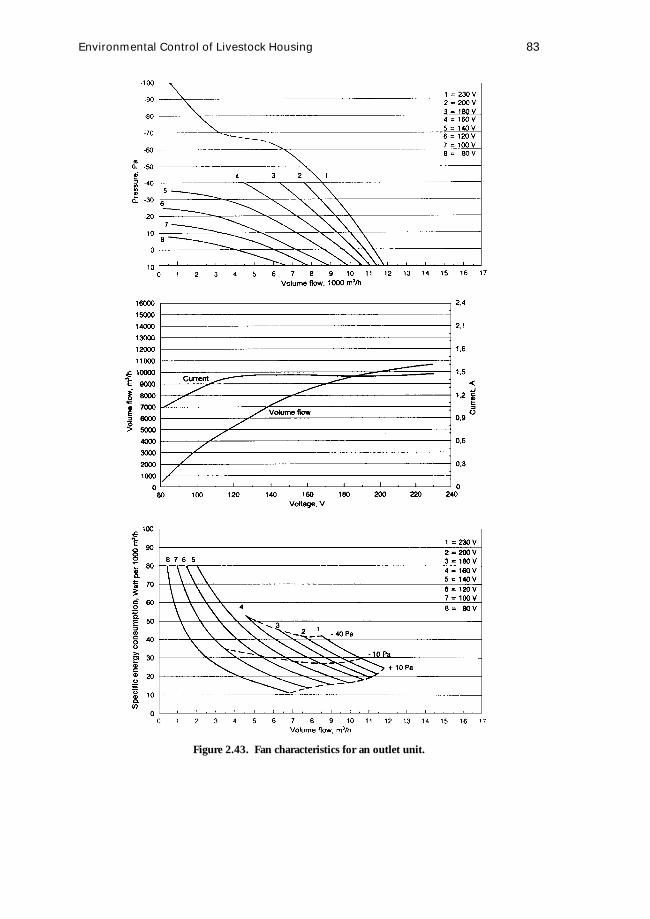
Environmental Control of Livestock Housing 83
Figure 2.43. Fan characteristics for an outlet unit.

84 Environment for Animals
Figure 2.44. Airflow rate and specific energy consumption for a basic fan section equipped withbell-shaped inlets and different types of outlet.
Energy ConsumptionThe energy consumption depends on the layout of the ventilating system. For more
complicated units, the determination of the energy consumption needs careful calcula-tion, because the energy consumption very much depends on the shape of bends, grids,dampers, and so forth.
For components such as inlet valves and outlet units with characteristics known, forexample, from official tests, the energy consumption can be calculated [20]. An exampleof the variation in energy consumption for outlet units is shown in Fig. 2.44 [21].
The fundamental unit used is a 1 m long 0.64 m pipe with a 0.20 kW motor equippedwith five 37.5-degree blades. As shown in the figure the unit is equipped with a bell-shaped inlet and an outlet with hood or diffuser.
Compared with the fundamental unit, the volume flow and the specific flow aredecreased by use of a high-velocity cone or hood; by use of a diffuser they are increasedconsiderably.
The longer the diffuser, the higher the flow rate and the specific flow, as shown inFig. 2.45. Figure 2.46 shows the effect of a fan with a 30% lower flow rate inserted inthe same fundamental pipe as in Fig. 2.45. The figure shows that the specific volumeflow increases by about 75%. This illustrates that it is possible to reduce the energy costby selecting a fan with a lower flow rate, but of course there will be an increase in theinvestment in fans in order to obtain the same total flow rate.
Operating PointIn the simplest way the air exchange is controlled by means of an on/off thermostat
(Fig. 2.47a), but nowadays it is usually done in a stepless manner.Up to the 1960s, most forced-ventilation systems were controlled by on/off ther-
mostats. In the 1970s and 1980s it became common to vary the flowrate in steps, bymeans of special thermostats or by using stepless control. The latter could be achieved
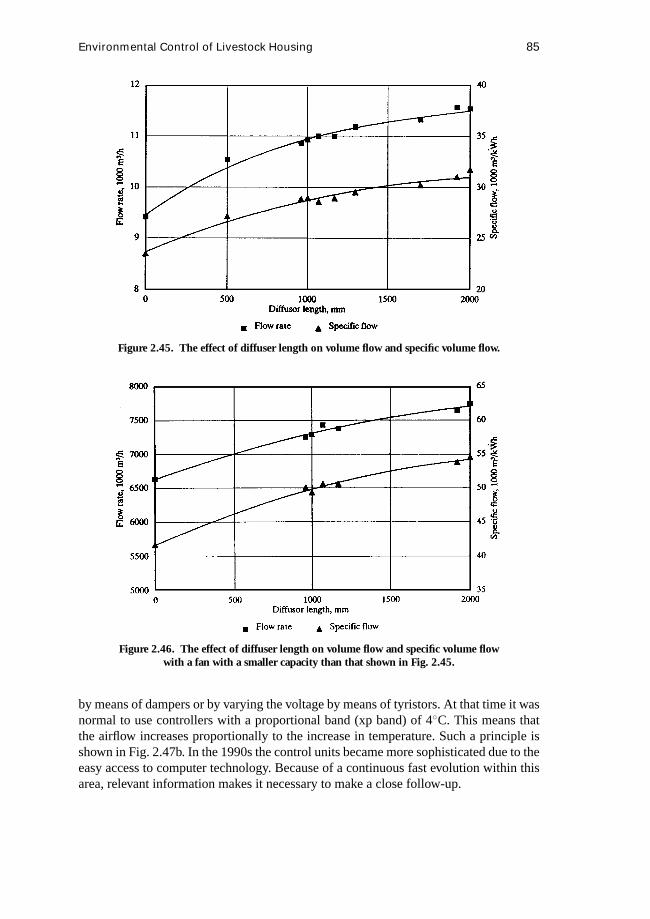
Environmental Control of Livestock Housing 85
Figure 2.45. The effect of diffuser length on volume flow and specific volume flow.
Figure 2.46. The effect of diffuser length on volume flow and specific volume flowwith a fan with a smaller capacity than that shown in Fig. 2.45.
by means of dampers or by varying the voltage by means of tyristors. At that time it wasnormal to use controllers with a proportional band (xp band) of 4◦C. This means thatthe airflow increases proportionally to the increase in temperature. Such a principle isshown in Fig. 2.47b. In the 1990s the control units became more sophisticated due to theeasy access to computer technology. Because of a continuous fast evolution within thisarea, relevant information makes it necessary to make a close follow-up.

86 Environment for Animals
Figure 2.47. Characteristics for (a) on/off, (b) proportional,and (c) computerized control of ventilation flow rate.
One of the advantages of computer technology is that the ventilation rate inside theproportional (xp) band can be selected individually. This can be done in such a waythat the flow increases slowly with the indoor temperature in the low end and faster inthe high end, as shown in Fig. 2.47c. This way, compensation can be done for the greatcooling effect, when the temperature difference between indoor and outdoor is high.
Because the different parts of ventilation systems can easily be controlled individuallyby climate computers, it can be determined how to correlate the increase of fan capacitywith the opening.
References
1. ASHRAE. 1997.ASHRAE Handbook, Fundamentals, SI Edition. Atlanta, GA:American Society of Heating, Refrigerating and Air-conditioning Engineers.
2. Graee, T. 1974. Breathing Building Constructions. ASAE Paper 74-4057. St. Joseph,MI: ASAE.

Environmental Control of Livestock Housing 87
3. Test Report No. 740. 1989. Diffust luftindtag (Porous air inlets). Horsens, Denmark:Research Centre Bygholm.
4. Koestel, A. 1955. Paths of horizontally projected heated and chilled air jets.ASHVETransactions. 61:213–232.
5. Test Report No. 874. 1993. VSV vaegventil (VSV side wall inlet). Horsens, Den-mark: Research Centre Bygholm.
6. Stroem, J. S., and Morsing, S. 1997.Wind Protection of Side Wall Inlets: A NewWindbreak Design. Fifth International Livestock Environment Symposium, Vol-ume II 851–858.
7. Nielsen, P. V. 1983. Air diffusion in rooms with ceiling-mounted obstacles and two-dimensional isothermal flow. 16th International Congress of Refrigeration, Com-mission EL, Paris.
8. Holmes, M. J., and Sachariewics, E. 1993. The effect of ceiling beams and lightfittings on ventilating jets. Laboratory Report No.79, HVRA.
9. Nielsen, P. V., Evensen, L., Grabau, P., and Thulesen-Dahl, J. H. 1987. Air distri-bution in rooms with ceiling-mounted obstacles and three-dimensional isothermalflow. Room Vent 87, International Conference on Air Distribution in VentilatedSpaces, Stockholm.
10. Morsing, S., Stroem, J. S., and Zhang, G. Q. 1996. Make space for the return air inventilated rooms. Paper 96B-057, AgEng, Madrid.
11. Pedersen, S. 1997. Velocities around an exhaust opening of a fan [unpublished].Horsens, Denmark: Research Centre Bygholm.
12. Pedersen, S. 1978. Luftfordeling i gulvudsugningsanlæg til spaltegulvsstalde (Airdistribution in livestock buildings with air exhaust through slatted floors). Ugeskriftfor Agronomer, Hortonomer, Forstkandidater og Licentiater No. 1/2, Denmark.
13. Pedersen, S. 1997. Exhaust through slatted floors [unpublished]. Horsens, Denmark:Research Centre Bygholm.
14. Test Report No. 898. 1994. Rotor udsugningsenheder—Fantom (Rotor exhaustfans). Horsens, Denmark: Research Centre Bygholm.
15. Test Report No. 852, 1991. Echberg udsugningsenheder (Echberg exhaust fans)Horsens, Denmark: Research Centre Bygholm.
16. DLG/IMAG-DLO/SJF. 1993. Gebrauchswertpr¨ufung von Stallventilatoren sowievon Zuluft-und Ablufteinheiten mit eingebauten Ventilatoren. DLG Pr¨ufprogrammD/81. Deutsche Landwirt schafts-Gesellschaft e.V., Frankfurt am Main, Germany.
17. Test Report No. 908. 1996. Rotor udsugningsenheder (Rotor exhaust fans). Horsens,Denmark: Research Centre Bygholm.
18. CIGR. 1984. Report of the CIGR Working Group on Climatization of AnimalHouses. Scottish Farm Building Investigation Unit, Aberdeen, Scotland.
19. CIGR. 1992. Report of the CIGR Working Group, Climatization of Animal Houses.State University of Ghent, Belgium.
20. Pedersen, S., and Stroem, J. S. 1995. Performance testing of complete ventilationunits.American Society of Agricultural Engineers11(1):131–136.
21. Pedersen, S. 1997. Exhaust fans with diffusor outlets [unpublished]. Horsens, Den-mark: Research Centre Bygholm.

88

3 Livestock Housing
Vincenzo Mennella
3.1 Sheep Housing
In sheepfarming more than in other livestock sectors, buildings and related facilitiesare of a strategic importance in general breeding-management practice.
Buildings must therefore have a number of requisites, in order to satisfy the conditionsof animal well-being in conformity with recent directives; allow an advanced level ofmechanization and automation of production and management activities; have effecton the organization of the labor; permit management and equipment costs which arecompatible with the livestock-breeding investments; and make the building compatiblewith the environment and the surrounding area in conformity with the new regulatoryrestrictions.
Thus, what are needed are not building volume units that can later be adapted accordingto the needs of the animal species being raised, but rather buildings that are characterizedby and strictly correlated to the raising system utilized, the type of equipment used, andthe degree to which it is to be automated.
A priority in the planning of building systems for sheep-raising centers is the studyand analysis of topics that are fundamental for the innovation of planning procedures,such as the type of holding, production objectives, and farm reference models.
3.1.1 Types of Holdings
The most common types of sheep holdings are the following.
Semiopen GrazingCharacterized by direct grazing in the fields, where the flock spends almost all of
its time. Fences mark the boundaries of the sheep’s living space, which is also theirprincipal feeding space. Feed supplements are provided in structures that have no specialfunctional or constructional requirements. Protection from bad weather is provided, if atall, by simple shelters. Equipment and systems for feed supplements also may be moreelaborate.
Extensive–ConfinedThe flock spends part of the year in pasture and is brought and kept inside the building
for a certain period of the year (e.g., autumn–winter). This system is based on the
89

90 Livestock Housing
possibility of dividing pastures into sectors and on the construction of buildings thatgive priority to economy over functionality, because they are not utilized year-round.The building functions include housing as well as feed preparation and distribution. Aminimum degree of mechanization and labor organization is necessary for guaranteeingsufficient functionality and for limiting operating costs.
Extensive–Confined with Housing OvernightThe flock comes in every evening throughout the year and in the afternoon during the
warmest periods. The building must allow the same functions as in the previous example,but for every day of the year.
Intensive–ConfinedThe flock stays permanently inside the building, which must permit all sheep-raising
activities to be carried out: housing, feeding and controlling of the animals, removal ofwastes, temperature control, and ventilation. The higher investment for buildings andequipment is compensated in this case by the higher revenues that can be obtained withmore prolific and productive breeds.
3.1.2 Reference Background
Measures designed to promote the improving of livestock raising conditions andmore efficient work organization have led today to the construction of large, specializedbuildings.
For the defining of building models, the following parameters should be consideredas references for a systematic approach: livestock husbandry (genetic improvement,diet, sanitation, healthcare and disease prevention); agronomics (crop organization andproductivity, rational utilization of pastures); and management and economic aspects(building type, degree of mechanization, production process, profitability, compatibilitywith environment/regulations) [1].
The goal of sheepfarming lies in getting the highest performance in terms of pro-duction. Therefore the buildings for housing the animals must allow many activitiesto be organized and carried out in spaces defined as rationally as possible and also becompatible with the requirements of mechanization and automation.
3.1.3 Process and Product Characteristics
In defining a building system (number and type of buildings) for raising sheep, thefirst things to be considered and evaluated are the type of production and the number ofanimals in the holding.
Production types may be the following:
Sheep-Raising Specialized for Milk ProductionMilk is the main product, and the main activities are centered around milk production.
Necessary in this type of sheepfarming are milking parlor and cheesemaking and otherfacilities.

Sheep Housing 91
The production of lambs is a secondary part, because it entails different needs, labor,and organization that the holding is not set up for. In addition, unless bottlefeeding isdone, the lambs drink the ewes’ milk, which takes away from milk production and thusindirectly causes a lower yield.
Production of Both Milk and MeatThis farm is a complete-cycle type. The overall organization must take into con-
sideration the needs of two production lines, and the breed of sheep must be suit-able for both milk and meat production. The organization of the farm must take intoconsideration the specific dietary needs of the young animals, as they directly in-fluence production and require special attention, especially in the first period oflife.
Meat ProductionThis is essentially the production of lambs for fattening in confined, highly mecha-
nized environments. In the Mediterranean area, small lambs weighing 13 to 16 kg areproduced and consumed; there is increasing production of heavy lambs weighing 30 kgat 90 days after birth.
Wool ProductionIn general, with the exception of a few countries, the wool-production cycle is almost
always combined on a secondary or equal level with milk production.
3.1.4 Criteria for the Defining of Building Systems
In each of the production types, animals that have a variety of needs, which differamong them, are made to live together, and the building in which they are housed mustsatisfy those needs. In order to define the quality, the number, and the characteristics ofthe individual buildings that form the overall system, it is necessary to identify the needsof each group of animals and the number of animals that it may contain, and to take intoconsideration organizational factors.
One design concept that may provide a suitable answer to the demands of the sheep-production world is that which is based on a systematic method, which makes it possibleto identify specific reference parameters and guidelines by organizing functional, struc-tural and installation aspects [2].
Although often involving building systems of considerable complexity in the func-tional organization of spaces, in most cases livestock building projects have simple,linear, single-level structures. The design procedure for defining the contents and size ofthe livestock buildings at the start provide the individuation of the fundamental spatialelements that constitute variants of each production type for each different species oflivestock. The elementary activities linked with the subjects (person, animal, machine)involved in the production process constitute the input for the definition of the spatialelements.
Following is a list of the spatial elements that characterize the activities of sheep-holding:
92 Livestock Housing
SE1 Feeding SE20 Farm-machinery moving (inside)SE2 Covered sheds SE21 Tool room (inside workshop)SE3 Open-air pens SE22 Equipment and material storageSE4 Corrals (inside workshop)SE5 Lambing sheds E SE23 Animal-feed storageSE6 Alleys and passageways SE24 Handling of animal feedSE7 Milking SE25 LunchroomSE8 Shearing areas SE26 OfficesSE9 Dipping vats SE27 PantrySE10 Feed storage and preparation SE28 KitchenSE11 Product storage SE29 Overnight quartersSE12 Fenced-in treatment areas SE30 First aid–emergencySE13 Installations and control rooms SE31 Sitting roomSE14 Manure-carrying space (outside) SE32 Lavatories/changing roomSE15 Manure-storage area (outside) SE33 Connection areasSE16 Liquid-waste storage SE34 RoadsSE17 Waste removal SE35 Parking areasSE18 Equipment area (purification) SE36 System- and installation-controlSE19 Farm-machinery parking rooms (outside)
The aggregation of coexisting elementary activities that are similar from a spatial–functional viewpoint and require a portion of space having the necessary characteristicsfor carrying out the activities in the correct manner createsarea units(Fig. 3.1).
The area units can be repeated and aggregated by means of relational matrices andsuitable models for the analysis of the flow of animals, people, material, and machinery inspatial systems of varying complexity that formmaximum aggregation unitsor functionalareas. These are the result of all the valid possibilities for the aggregating of area unitsand constitute autonomous functional layouts, therefore making the structural links ofthe buildings.
In this way integrated systems of area units take shape that are an answer to thecarrying out of various activities, making possible the completing of a well-defined timecycle (meat production, feed preparation, etc.).
The final aggregation level,functional line, which is also identified by means ofrelational matrices among functional areas, constitutes the spatial models (Fig. 3.2).
3.1.5 Building Systems for Intensive Milk-Production Holdings
A diagram of the stages of the production process for obtaining milk for the primaryproduction and lamb for the secondary production is given in Fig. 3.3. Consequently itis possible to define a production program that allows the identifying of the number ofhead in each single production stage, the total quantities of the end products, and thedesired period in which they are to be obtained.
For this, the following factors must be taken into consideration: initial resources,number of sheep, the length of the individual production stages, the daily weight increase

Sheep Housing 93
Figure 3.1. The area units (AU) in the picture are the portion of space having the necessarycharacteristics for carrying out the coexisting elementary activities in the correct manner.

94 Livestock Housing
Figure 3.2. Outline for the defining of spatial models; constitutes the building system.
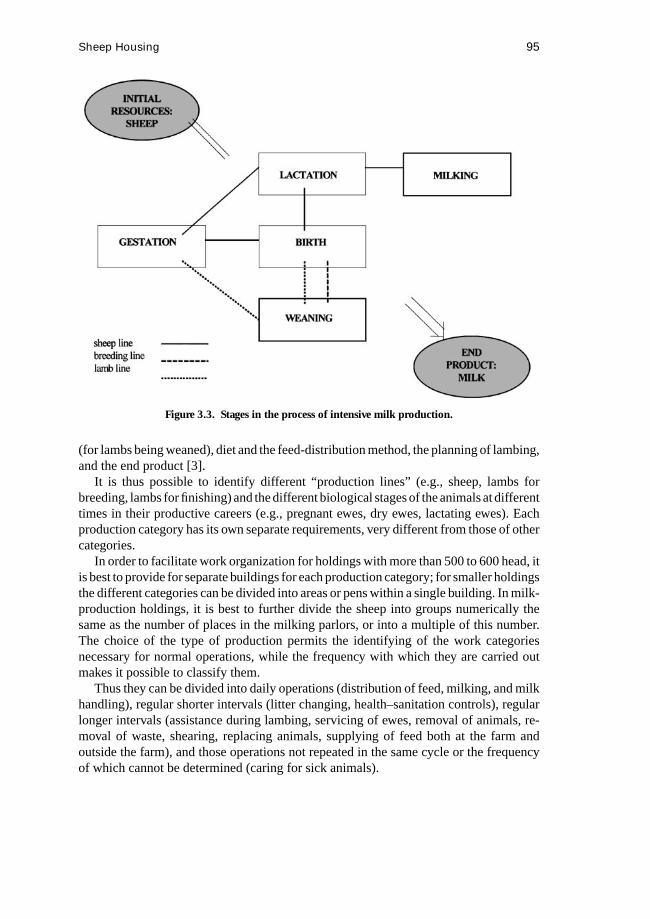
Sheep Housing 95
Figure 3.3. Stages in the process of intensive milk production.
(for lambs being weaned), diet and the feed-distribution method, the planning of lambing,and the end product [3].
It is thus possible to identify different “production lines” (e.g., sheep, lambs forbreeding, lambs for finishing) and the different biological stages of the animals at differenttimes in their productive careers (e.g., pregnant ewes, dry ewes, lactating ewes). Eachproduction category has its own separate requirements, very different from those of othercategories.
In order to facilitate work organization for holdings with more than 500 to 600 head, itis best to provide for separate buildings for each production category; for smaller holdingsthe different categories can be divided into areas or pens within a single building. In milk-production holdings, it is best to further divide the sheep into groups numerically thesame as the number of places in the milking parlors, or into a multiple of this number.The choice of the type of production permits the identifying of the work categoriesnecessary for normal operations, while the frequency with which they are carried outmakes it possible to classify them.
Thus they can be divided into daily operations (distribution of feed, milking, and milkhandling), regular shorter intervals (litter changing, health–sanitation controls), regularlonger intervals (assistance during lambing, servicing of ewes, removal of animals, re-moval of waste, shearing, replacing animals, supplying of feed both at the farm andoutside the farm), and those operations not repeated in the same cycle or the frequencyof which cannot be determined (caring for sick animals).

96 Livestock Housing
Figure 3.4. Outline of internal flows among the functional areas (milk production).
The production operationsare made up of a number of activities carried out at thesame time and sequentially in the area units. These aggregations of spatial elements aredefined also by the type of environment and technological parameters that describe thecarrying out of animal functions.
The defining of more complex functional spaces is done by the analysis and deter-mining of flows, or of those values that express the number of movements of animals,workers, and machines in a given period of time. These emphasize the relationships ofspatial–functional interdependency among the various area units in order to optimizeand simplify all production operations and the use of labor, thus making the productiveprocess economically valid.
The analysis of flows leads through different correlational levels (contiguity, vicinity,distance, lack of connection, exclusion) to the classification and spatial compositionof the functional areas (Fig. 3.4). At the same time, the connections from the analysisof flows among the functional areas make it possible to plan the layout of the milkcycle (Fig. 3.5, 3.6), with synthesis of different possibilities for distributive–functionalaggregations of the predefined functional areas.
3.1.6 Planning Parameters
The characterizing of the entire building system arises from the identifying of plan-ning parameters, which provide a technological and dimensional definition of the spatialconfigurations. The possible combinations of various basic modules (area units) vary

Sheep Housing 97
Figure 3.5. Outline of flows among the functional areas for defining the functional line.
Table 3.1. Standard sizes of area units
Feed-Trough Feeding and ServiceArea Unit Covered Area (m2/animal) Width (m/animal) Passage Width (m)
Rest/feeding 1.85–2.35 0.35–0.40 3.0/0.8Exercise 2.00 — 2.5Lambing 2.5–3.0 Individual troughs 2.00Weaning 0.3 0.10 2/0.8Rams 2.5–4.0 Individual troughs 2.00Animal treatments 5.0 —Milking 2.0 Individual troughs 0.8
according to planning choices, which must necessarily take different factors into con-sideration (production techniques, degree of automation, type of systems, etc.).
Tables 3.1 and 3.2 give the standard sizes of area units in buildings for sheep raisedfor milk production [4–8].
3.1.7 Building Systems for Meat-Production Holdings
The entire cycle is geared toward meat production and is characterized by five stages:housing of breeding ewes, dropping and natural weaning of lambs, fattening (feed withconcentrates), breeding, carrying and storage of manure, as outlined in Fig. 3.7 [9].
Production-line requirements can be established in the same way as for sheep for milkproduction. Once the activities taking place in the area units are defined, they are aggre-gated according to function and correlation, making up the functional areas (Fig. 3.8).
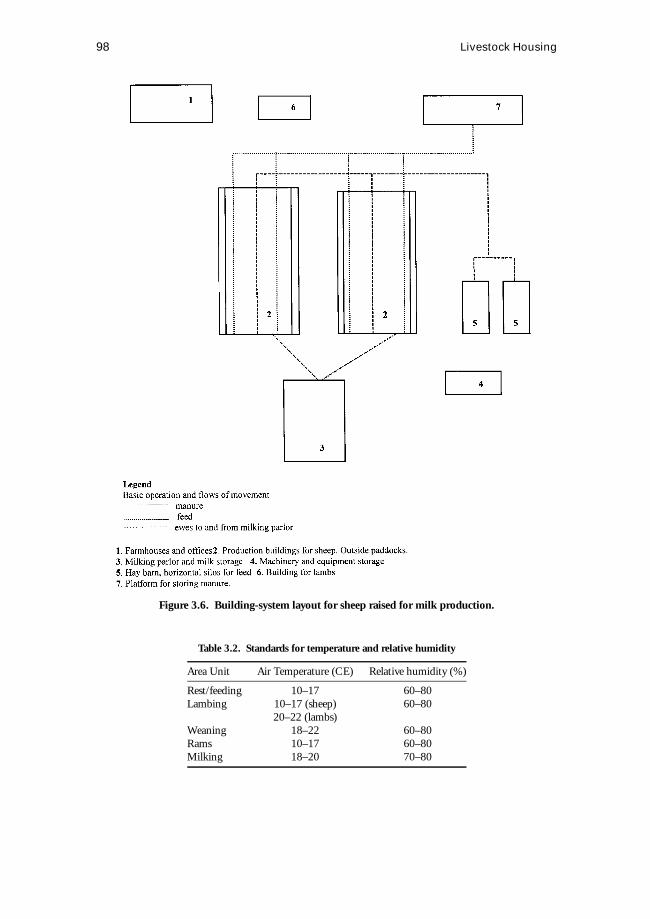
98 Livestock Housing
Figure 3.6. Building-system layout for sheep raised for milk production.
Table 3.2. Standards for temperature and relative humidity
Area Unit Air Temperature (CE) Relative humidity (%)
Rest/feeding 10–17 60–80Lambing 10–17 (sheep) 60–80
20–22 (lambs)Weaning 18–22 60–80Rams 10–17 60–80Milking 18–20 70–80

Sheep Housing 99
Figure 3.7. Stages of the production process for intensive sheep raising for meat.
Figure 3.8. Outline of internal flows among the functional areas (meat production).

100 Livestock Housing
Figure 3.9. Building-system layout for intensive sheep raising for meat.
The connections between functional areas characterize and determine the boundariesof the building-system layout for intensive sheep raising for meat (Fig. 3.9).
3.1.8 Planning Parameters
Table 3.3 gives the standard sizes of buildings for sheep raised for meat production[9].
Table 3.3. Standard sizes
Feed Trough Width Feeding and ServiceArea Unit Covered Area (m2/animal) (m/animal) Passage Width (m)
Rest/feeding 1.30–1.70 0.35–0.45 3.80Exercise 2.00 0.35 2.50Lambing 2.5–3.0 Individual troughs 1.50–2.00Weaning 0.3 0.2 2.80Rams 2.5–4.0 Individual troughs 2.00Fattening 0.6–0.8 0.2–0.3 3.80

Pig Housing 101
3.1.9 Conclusion
In recent years livestock breeders have begun computerizing the management andoperation of systems and installations (feeding, temperature control, waste removal,etc.) through the use of complete automated systems. They also have introduced newfunctions (automatic distribution of feed, installations management, milking machines,etc.) inside buildings. It has become necessary to consider new requirements starting inthe building-planning stage.
In this setting of technological change, the necessity to integrate the distribution ofspace and technological elements is clearly a fundamental basis for the defining of anytype of productive structure. The procedure outlined here satisfies requirements becauseit overcomes the stiffness of predetermined layouts.
References
1. American Society of Agricultural Engineers. 1981.Agricultural Engineers Yearbook1981–1982. ASAE. St. Joseph, MI:
2. Chiappini, U., Fichera, C., and Mennella, V. (1994).Metaprogettazione per l’ediliziazootecnica. Milano, Italy: BE-MA Editrice.
3. Mennella, V., and Borghi, P. 1985. Criteri progettuali e modalit`a costruttive per larealizzazione di centri di allevamento ovino da latte. Sheep and goats journal.IlVergaro9/85.
4. Barnes, M., and Mander, C. 1986.Farm Building Construction. Ipswich, England:Farming Press.
5. Bryson, T. 1985.The Sheep Housing Handbook. Ipswich, England: Farming Press.6. De Montis, S. 1983.Edifici pre l’allevamento ovino. Bologna, Italy: Edagricole.7. Fearghal, O., and Farrel, B. 1985.Sheep Housing and Handling Handbook. Dublin,
Ireland: Farm Structures and Environment Department Agriculture Institute.8. Mennella, V., and Borghi, P. 1983. Moduli edilizi per l’allevamento intensivo della
capra da latte.Il Vergaro9/83.9. Mennella, V., and Borghi, P. 1985. Criteri progettuali e modalit`a costruttive per la
realizzazione di centri di allevamento ovino da carne. Sheep and goats journal EditricePoligrafica Roma I, II, III, IV parte (5/85, 6/85, 7/85, 9/85).Il Vergaro.
3.2 Pig Housing
3.2.1 Reference Scenario
In almost all countries, pig breeding is shifting toward intensive breeding systems,with a high number of animals and a reduced utilization of human resources. This mustnecessarily lead to greater attention on the part of the breeder, who raises the animalsusing industrial management methods, to the inspiring principles of animal protectionin order to guarantee conditions that provide the maximum respect for the physiologicaland behavioral needs of the species of animal being raised.
It is only by analyzing needs in ethological terms that breeding systems can becreated that respect the “natural” lifecycle of animals without reducing productivity.

102 Livestock Housing
Furthermore, when designing buildings, especially those that are large, the form of thebuilding and its relationship to the environment in which it is to be placed are aspectsthat cannot be neglected.
This does not mean that these aspects are more important than those regarding func-tionality and productivity; however, working with this approach makes it possible to findsolutions that allow both of these types of requirements to be satisfied, without takingaway from either.
The building system must, in its separate elements and as a whole, satisfy the require-ments of the end user, understood as the explication of needs determined by means ofparameters to which the building environment must be adapted. These parameters arethe result of a complex procedure using a metadesign approach to translate the needsexpressed by the user into requirements correlated to the areas of the building compound.
Along with these parameters that characterize each area unit, it is appropriate toprovide indications concerning the relationships among the various units. These rela-tionships are formulated by means of the analysis and quantification of flows (of persons,animals, vehicles, and materials) and contribute to the defining of the building layout.
The various models for the aggregating of area units must be able to satisfy thedifferent needs, expressed in building terms as requirements (well-being, protection,etc.). Thus the performance characteristics regarding heating, cooling, humidity, airflowvelocity, and noise-level requirements (in relation to the animal species and the particularstage of the production cycle) must be considered for the different area units and are alsoindispensable parameters for building design.
Once the various aggregation models are defined, it is also necessary to evaluatethe various solutions through the determining of certain cost categories upon whichone aggregation criterion might have an effect, while another might not. Examples ofthese are costs for land usage, construction, systems installation, operations, energy, andmaintenance.
Along with the area system, the analysis requires that legal regulations, which arefundamental in the defining of a technological system, be taken into consideration. Theparameters in this case are determined in relation to a given technological category, suchas inner partitions, flooring, or roofing.
3.2.2 Types of Pig Holdings
The continual evolution of livestock technology and the achieving of productionresults once considered inconceivable require the availability of specific, appropriatebuildings with advanced features, which naturally vary according to the type of pigholding. Production activities are divided into two main types, closed- or open-cycle,depending on whether the holding is for breeding or fattening. The former requires awide range of units, for housing piglet production, growth, and fattening; the latter onlya unit for fattening.
Thus the types of pig holdings can be identified as• Sow breeding. This requires careful, expert management, as well as excellent orga-
nizational skills, for producing a large number of pigs at low cost.• Fattening. This does not require any sophisticated management techniques, but

Pig Housing 103
rather business skill in purchasing quality animals and feed at low cost and inselling mature animals at the right time and for the right price.
• Breeding and fattening. This requires both sets of abilities and capacities alreadydescribed and especially good organizational skills to produce and breed pigs at aprofit.
The area units follow the different life stages of the pig, which are birth; weaning;stimulation, waiting, heat, and covering of sows and the first stage of gestation, up untilthe diagnosing of pregnancy; the second stage of gestation; growth and fattening stage;and replacement.
3.2.3 Criteria for Defining the Building System
Because the needs of the animals to be housed are several and diverse according tothe various living conditions, it is necessary to set up a design plan based on a systematicmethod that is capable of responding to the functional, structural, and installational needs.
Thearea units, which can be repeated and aggregated in simple or complex spatialsystems, are the basic elements of the structural grid, or the “building skeleton.” Althoughit involves highly complex organizational–functional systems, in most cases pig breedingrequires a fairly simple, linear, single-floor structural grid.
There are two categories of project input: area and technological. The former includethe dimensional characteristics of the basic invariants (area units) of the building system.In fact, these are represented by reference modules composed of boxes or pens havingthe same dimensions, installations, and equipment, in which an entire stage of the animalproduction cycle takes place (birth area unit, fattening area unit, etc.).
The technological input includes the level of technological complexity of the instal-lations and equipment and the types of installations and systems; the organization ofbuilding areas and volumes must first of all take into consideration the spaces allottedfor installation and system networks. For example, the type of ventilation system for pigbreeding must also be chosen on the basis of other technological subsystems, such asthe type of flooring (solid floor, grated flooring over drainage channels on the ground);whether or not there are other systems installed (such as for the distribution feed, theremoval of wastes); and the type of roofing (the presence of false ceilings). Thus, if inthe metadesign stage the structural grids of the area units or, rather, of their aggrega-tion are defined on the basis of the area and technological requirements, the adaptationsnecessary both at the level of planning and of construction will be limited.
For livestock structures, the metadesign analysis of the area system provides standardarea modules, which are of a size that remains constant according to the type of animalbeing raised and the specific stage of the production cycle. For example, the birth areaunit for pigs makes use of modules composed of 8 to 10 boxes arranged in two rowsalong a central passageway. The limiting to only 8 to 10 boxes, which can be repeatedmodularly in one or two rows, derives from needs for better control of temperature, forventilation, and above all to guarantee a peaceful environment for the sows and pigletsduring birthing and weaning.
In order to formulate the structural module, the size characteristics of the individ-ual standard units are taken into consideration, and for each of these a definition is

104 Livestock Housing
provided for the various uses, the temperature and humidity characteristics, the installingof systems, the space for the separate activities taking place there, and so forth. The ag-gregation of the Structural Modules into more complex forms for the various Unitstherefore is based on two separate stages: the organization of space distribution and theverifying of compatibility with system installations.
The organization of space leads to numerous possibilities for the aggregation of baseunits. These aggregations also are dependent upon the type of structure that may containone or more area units, either identical or of different types.
Truss-type structures offer solutions with a lateral passageway for access to severalarea modules along a row. Structures with intermediate supports also allow for largeropenings (16–20 m), with a layout of a double row of modules with a wide centralpassageway.
The stage of verifying compatibility with system installations requires suitable inte-gration between the structural type chosen (the size of the structural span) and the housingof system networks. For intensive-breeding buildings, in which temperature, humidity,and sanitary and feeding conditions are the basic elements for obtaining satisfactoryproduction cycles, the appropriate arrangement of ventilation, heating, food-distribution,and waste-removal systems is fundamental for the organization of the building structuralgrids.
The planning of installation networks must therefore be based on some basic infor-mational data, which are provided for the most part by the metadesign charts:• The type of system, according to the species being raised and the type of production.• The analysis of technological requirements, referring to each subsystem and to each
technological class, which must direct design choices towards the most satisfactorytechnical solution. For the animals, the requirements refer to the needs of well-being and protection; for operators, the requirements regard production (efficiencyof service), energy saving, and the maintenance, integrability, reparability, andinspectionability of systems.
• The analysis of system-distribution organization, which requires the defining oftechnical volumes, that is, the planning of suitable housings in relation to the typeof system, as well as the organizational needs of the spaces already determined(module aggregations).
In pig breeding, for example, the air-conditioning system often requires false ceilingsand raised floors, which are necessary for the removal of waste that falls into the drainagechannels below. False ceilings usually provide space for housing air ducts or for areas inwhich air is introduced under pressure and is then sent into the breeding boxes at variousspeeds and volumes.
For heating systems, the water is distributed in pipes that are sometimes placed underthe floor, and if the floor is made from gratings over drainage channels, it is necessary tointegrate these technological subsystems. The automatic distribution of feed is largelyused in pig buildings in which feed is supplied in increasing amounts in close relationwith the cycle of animal development during the growth stage. The positioning of thissystem also requires careful planning for the functional organization of space, size,technical volumes, and, in this specific case, also the measurement of the volume of thecentral feed units (silos for various types of feed, mixing tanks, etc.).

Pig Housing 105
3.2.4 Systems Planning and Integration Parameters
The characterization of the entire livestock building structure must arise from thedetermining of planning parameters that are able to provide those guidelines necessaryfor spatial and technological planning.
In the previous section, reference was made to the ways of transferring the informationfurnished by the results of the metadesign process (charts, diagrams, matrixes, flowcharts)for the planning of a livestock-breeding center. In the following, the procedure is givenfor the formulating of a plan, applied to a specific case (closed-cycle pig-breeding center).The reference parameters can be taken from the results of metadesigning, starting withthe area units. They are used, according to the different applications, either alone or inaggregates to form the base modules, which are dimensionally defined.
The possible combinations vary in relation to the planning choices, which must nec-essarily account for various factors (breeding techniques, degree of automation, type ofsystems, etc.). The aggregation of several similar or different base modules, put togetheraccording to functional, spatial, and organizational relationships, defines a spatial mod-ule. In the relational system, the spatial module corresponds to a functional area, wherethe latter is exclusively the place where a complex function is carried out following thedefining of the spatial layout.
The models are obtained by aggregating spatial modules (functional areas), so as toobtain multifunctional spaces that define the closed-cycle pig-breeding center (functionalsectors) (Fig. 3.10). The size variables of the different base modules and their combi-nations provide a first indication of the development of building systems, leaving openmany possibilities for linear aggregation structures. The factors to take into considerationfor aggregation are:
Figure 3.10. Outline for the defining of spatial models.
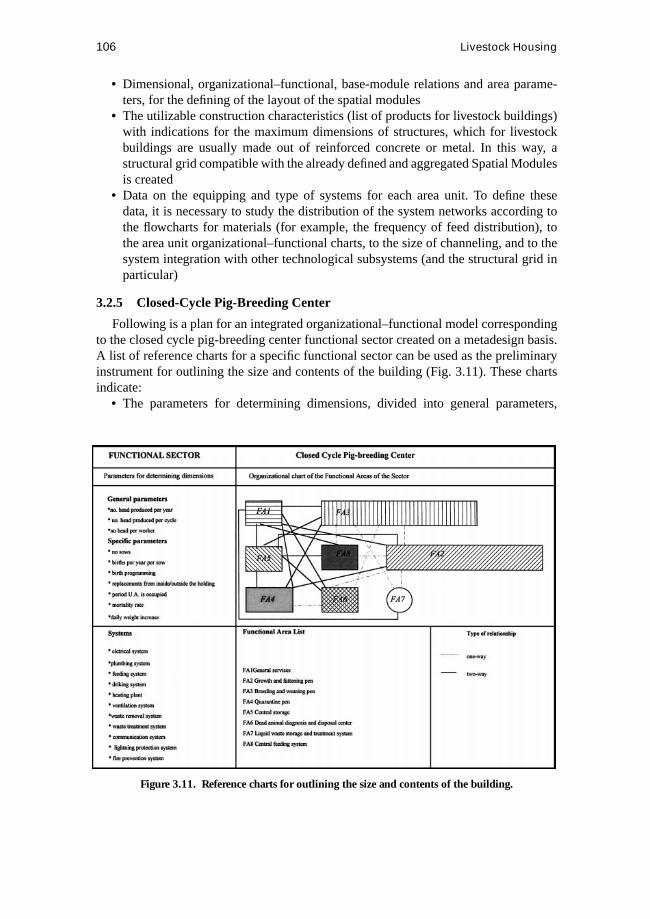
106 Livestock Housing
• Dimensional, organizational–functional, base-module relations and area parame-ters, for the defining of the layout of the spatial modules
• The utilizable construction characteristics (list of products for livestock buildings)with indications for the maximum dimensions of structures, which for livestockbuildings are usually made out of reinforced concrete or metal. In this way, astructural grid compatible with the already defined and aggregated Spatial Modulesis created
• Data on the equipping and type of systems for each area unit. To define thesedata, it is necessary to study the distribution of the system networks according tothe flowcharts for materials (for example, the frequency of feed distribution), tothe area unit organizational–functional charts, to the size of channeling, and to thesystem integration with other technological subsystems (and the structural grid inparticular)
3.2.5 Closed-Cycle Pig-Breeding Center
Following is a plan for an integrated organizational–functional model correspondingto the closed cycle pig-breeding center functional sector created on a metadesign basis.A list of reference charts for a specific functional sector can be used as the preliminaryinstrument for outlining the size and contents of the building (Fig. 3.11). These chartsindicate:• The parameters for determining dimensions, divided into general parameters,
Figure 3.11. Reference charts for outlining the size and contents of the building.

Pig Housing 107
referring to the overall building system and common to all functional areas, andspecific parameters, which identify the type of production
• The organizational–functional diagrams of the functional sector, with indicationsas to the relations between the functional areas
• The systems and installations• The main and secondary area units, the dimensions, and the number of animals and
operators present.For the specific case of the closed-cycle pig-breeding center, the data are those givenin Table 3.4, which are used to determine the organizational diagram of the functionalsector, starting with the area units and, generally, with the minimum characteristics thatthe area and technological systems may possess.
In order to transpose the metadesign results into the planning level, reference may bemade to the diagram in Fig. 3.12; subsequently, it is necessary to individuate and definethe production program in detail. To do this, the following factors may be taken intoconsideration: final product, the final weight of the pigs to be put on the market; initialproduct: the number of sows and type of replacement; the duration of the individual stages(e.g., very early/early/traditional weaning, etc.), from the daily body weight increase;type of feed; feed-distribution method; birth programming; empty stage—disinfecting.
For example, for a closed-cycle pig-breeding center, starting with 160 sows andcarrying out programmed births and the completely empty/completely full technique,the holding will have 270 sucking piglets, 570 weaning piglets, 570 growing pigs, 660fattening pigs, and 64 young replacement sows, and thus the center buildings must bemade big enough to hold a total of 2300 pigs, corresponding to an annual production of3440 pigs weighing 100 to 110 kg.
Thus one is able to determine the elements necessary for defining the number of areaunits for each base module (the base modules can be made up of a single or, in somecases, several area units), the size of the base module and the number of base modulesthat make up a spatial module corresponding to each functional area (Figs. 3.13–3.21).
Figure 3.12. Production program for a closed-cycle pig-breeding center.
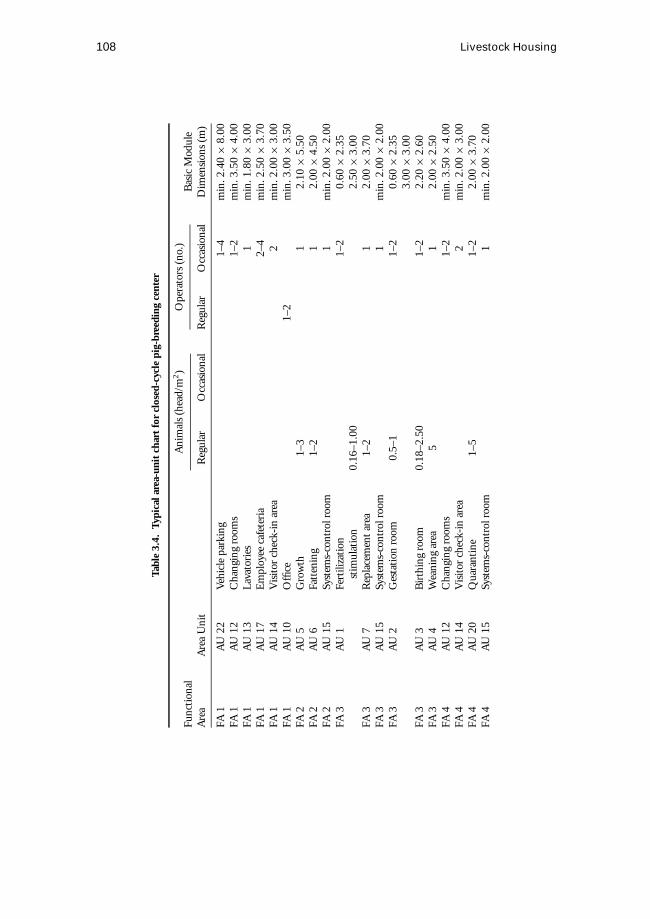
108 Livestock Housing
Tabl
e3.
4.Ty
pica
lare
a-un
itch
art
for
clos
ed-c
ycle
pig-
bree
ding
cent
er
Ani
mal
s(h
ead/
m2)
Ope
rato
rs(n
o.)
Func
tion
alA
rea
Are
aU
nit
Reg
ular
Occ
asio
nal
Reg
ular
Occ
asio
nal
Bas
icM
odul
eD
imen
sion
s(m
)
FA1
AU
22V
ehic
lepa
rkin
g1–
4m
in.2
.40
×8.
00FA
1A
U12
Cha
ngin
gro
oms
1–2
min
.3.5
0×
4.00
FA1
AU
13La
vato
ries
1m
in.1
.80
×3.
00FA
1A
U17
Em
ploy
eeca
fete
ria
2–4
min
.2.5
0×
3.70
FA1
AU
14V
isit
orch
eck-
inar
ea2
min
.2.0
0×
3.00
FA1
AU
10O
ffice
1–2
min
.3.0
0×
3.50
FA2
AU
5G
row
th1–
31
2.10
×5.
50FA
2A
U6
Fatt
enin
g1–
21
2.00
×4.
50FA
2A
U15
Syst
ems-
cont
rolr
oom
1m
in.2
.00
×2.
00FA
3A
U1
Fert
iliza
tion
1–2
0.60
×2.
35st
imul
atio
n0.
16–1
.00
2.50
×3.
00FA
3A
U7
Rep
lace
men
tare
a1–
21
2.00
×3.
70FA
3A
U15
Syst
ems-
cont
rolr
oom
1m
in.2
.00
×2.
00FA
3A
U2
Ges
tati
onro
om0.
5–1
1–2
0.60
×2.
353.
00×
3.00
FA3
AU
3B
irth
ing
room
0.18
–2.5
01–
22.
20×
2.60
FA3
AU
4W
eani
ngar
ea5
12.
00×
2.50
FA4
AU
12C
hang
ing
room
s1–
2m
in.3
.50
×4.
00FA
4A
U14
Vis
itor
chec
k-in
area
2m
in.2
.00
×3.
00FA
4A
U20
Qua
rant
ine
1–5
1–2
2.00
×3.
70FA
4A
U15
Syst
ems-
cont
rolr
oom
1m
in.2
.00
×2.
00

Pig Housing 109
FA4
AU
21Q
uara
ntin
ew
aste
min
.r=
2.50
accu
mul
atio
nFA
5A
U22
Veh
icle
park
ing
1–4
min
.2.4
0×
8.00
FA5
AU
16E
quip
men
tsto
rage
1–2
min
.2.7
5×
3.50
FA5
AU
12C
hang
ing
room
s1–
2m
in.3
.50
×4.
00FA
5A
U13
Lava
tori
es1
min
.1.8
0×
3.00
FA5
AU
8Fe
edpr
epar
atio
n1–
2m
in.1
.80
×2.
70FA
5A
U9
Feed
stor
age
1–2
min
.2.0
0×
3.00
FA6
AU
14V
isit
orch
eck-
inar
ea2
min
.2.0
0×
3.00
FA6
AU
12C
hang
ing
room
s1–
2m
in.3
.50
×4.
00FA
6A
U13
Lava
tori
es1
min
.1.8
0×
3.00
FA6
AU
11La
bora
tory
11
min
.1.8
0×
2.80
FA6
AU
18Po
stm
orte
m1
min
.2.8
0×
4.00
exam
inat
ion
room
1FA
6A
U19
Inci
nera
tor
1–2
min
.2.2
5×
2.50
FA7
AU
23Li
quid
was
tes
trea
tmen
tm
inr=
5.30
stor
age
tank
FA7
AU
15Sy
stem
s-co
ntro
lroo
m1
min
.2.0
0×
2.00
FA8
AU
8Fe
edpr
epar
atio
n1–
2m
in.1
.80
×2.
70FA
8A
U9
Feed
stor
age
1–2
min
.2.0
0×
3.00
FA8
AU
15Sy
stem
s-co
ntro
lroo
m1
min
.2.0
0×
2.00
Not
e.m
in.,
min
imum
.
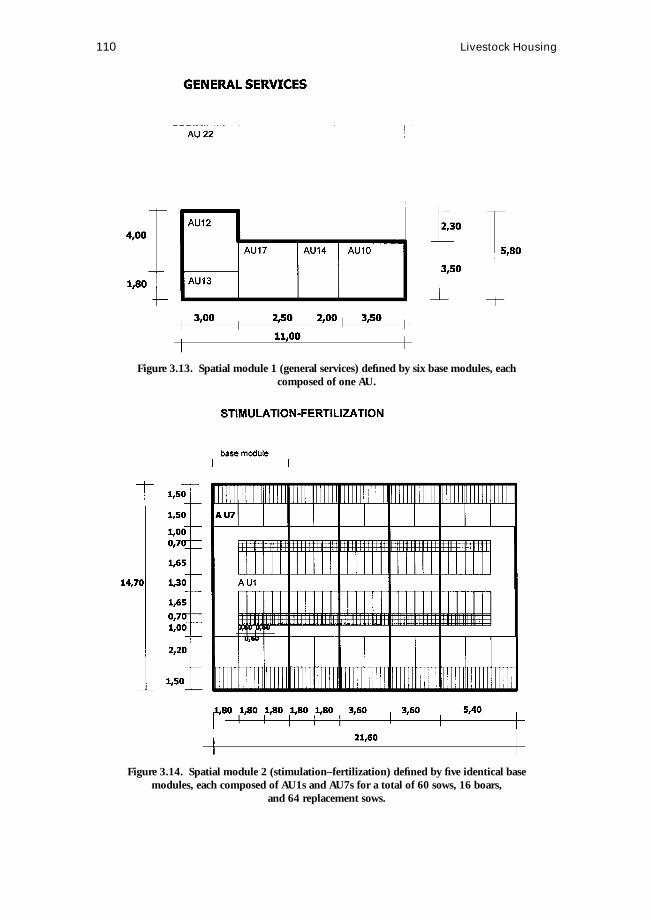
110 Livestock Housing
Figure 3.13. Spatial module 1 (general services) defined by six base modules, eachcomposed of one AU.
Figure 3.14. Spatial module 2 (stimulation–fertilization) defined by five identical basemodules, each composed of AU1s and AU7s for a total of 60 sows, 16 boars,
and 64 replacement sows.

Pig Housing 111
Figure 3.15. Spatial module 2A (gestation) defined by 12 identical base modules,each composed of eight AU2s, for a total of 96 sows.
Figure 3.16. Spatial module 2B (birth) defined by six identical base modules, each composedof eight AU3s, for a total of 48 sows.

112 Livestock Housing
Figure 3.17. Spatial module 2C (weaning) defined by 10 identical base modules,each composed of four AU4s, for a total of 650 piglets up to 30 kg live weight.
Figure 3.18. Spatial module 3 (growth) defined by 12 identical base modules, eachcomposed of four eight AU5s, for a total of 680 animals up to 60 kg live weight.

Pig Housing 113
Figure 3.19. Spatial module 3A (fattening) defined by 12 identical base modules, eachcomposed of six AU6s, for a total of 720 animals from 60 to 110 kg live weight.
Figure 3.20. Spatial module 4 (quarantine) defined by four identical basemodules, each composed of 10 AU20.
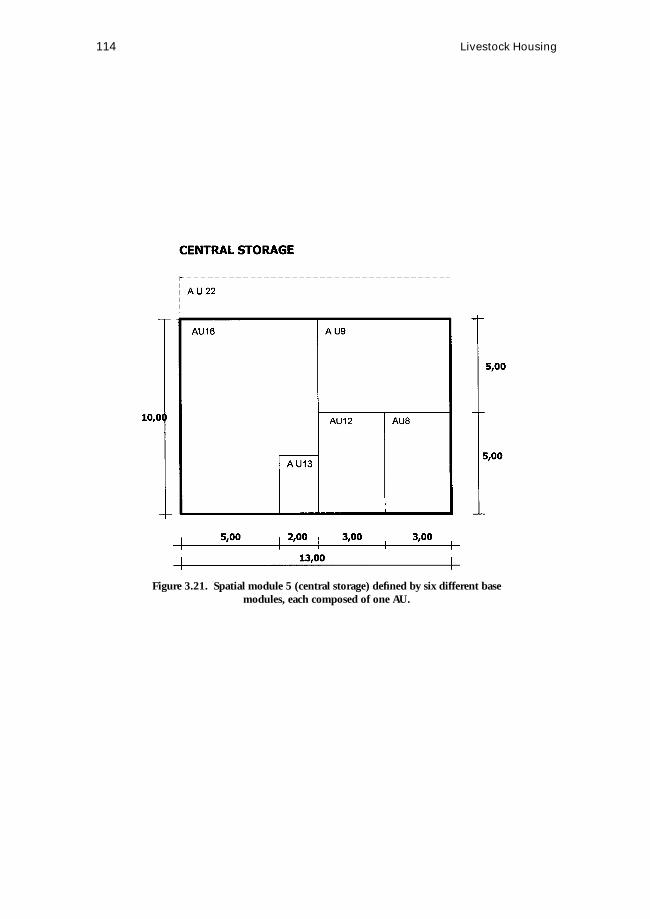
114 Livestock Housing
Figure 3.21. Spatial module 5 (central storage) defined by six different basemodules, each composed of one AU.

4 Equipment and Control
Michel Tillie
4.1 Feed and Supply Distribution
The means of feed and drink supply are specific to each species. They should beadapted to the height of the animals so that they can satisfy the vital needs of food anddrink. Regarding working conditions the means should also meet the requirements ofthe person who takes care of the herd, and, finally, they should meet the requirements ofthe economic situation of the farm.
Equipment may be quite different according to the breeding system. Intensive systemsgenerally are high in investment expenses; extensive systems are generally lower.
4.1.1 Intensive Conditions
Cattle Breeding [1]Adult cattle spend about 5 hours per day eating. In order to avoid competition, frus-
tration, and aggression, there should be sufficient feeding places for all animals to feed atthe same time, particularly with dairy cows. Any restriction in the number of places may,depending on quality and quantity of the feed, result in low-ranking animals receivinginsufficient feed, and as a consequence they will produce less milk.
Feeding barriers and mangers for cattle should provide access to a large volumeof feed, prevent bullying, prevent feed wastage, and be noninjurious to the animals.Configurations should not cause discomfort or injury, while offering maximum forwardreach.
Feeding AlleyThe alley must be of some minimum width that allows for unrestricted circulation
and agonistic social behavior. Passage sizing is considered in terms of passage width.The minimum width required depends on the body size plus a minimum clearance forcirculation. The minimum dimension (W p) of a feeding alley is given by the followingequation:
W p= L + 2.7 ·W
whereL is body length andW is withers width of animal in meters (Fig. 4.1).
115

116 Equipment and Control
Figure 4.1. Width of passage.
Figure 4.2. Post-and-railbarrier dimensions.
TroughsIt is important to allow all animals to feed. The minimum length (FL) of trough per
animal is:Ad-lib self feed: FL= 0.5 ·WSemi restricted feed: FL=WRestricted feed: FL= 1.15·WFor pregnant female: FL= 1.25·W
Feed BarriersResearch has shown that inclining the barrier by 20 degrees towards the manger in-
creases the volume of food within reach without causing injuries (see Fig. 4.2). Thewithers of cattle are particularly sensitive and prone to injury, which means that posi-tioning of the equipment is crucial. The spacing between cattle places (CS) is given bythe following equation:
CS= k ·Wwherek = 1.15.However, with female animals, if a large percentage of cows in a groupare likely to be pregnant at the same time, thenk = 1.25.
A post-and-rail barrieris very simple. It is composed of horizontal bar fixed to postsand a board close to ground. The dimensions are given in Fig. 4.2.
A diagonal barrierforces cattle to angle their heads to gain access. The angle of thebars prevents food wastage. Sideways movement is limited to some extent. For maximumreach and minimum feed wastage the angle should be 65 degrees. Dimensions are givenin Fig. 4.3 (H is the height at the withers).
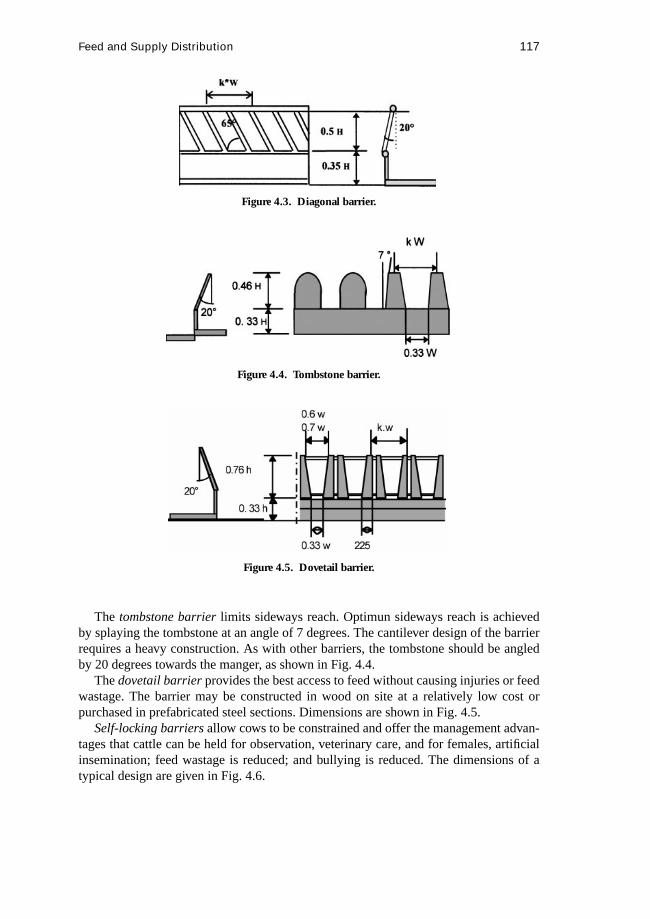
Feed and Supply Distribution 117
Figure 4.3. Diagonal barrier.
Figure 4.4. Tombstone barrier.
Figure 4.5. Dovetail barrier.
The tombstone barrierlimits sideways reach. Optimun sideways reach is achievedby splaying the tombstone at an angle of 7 degrees. The cantilever design of the barrierrequires a heavy construction. As with other barriers, the tombstone should be angledby 20 degrees towards the manger, as shown in Fig. 4.4.
Thedovetail barrierprovides the best access to feed without causing injuries or feedwastage. The barrier may be constructed in wood on site at a relatively low cost orpurchased in prefabricated steel sections. Dimensions are shown in Fig. 4.5.
Self-locking barriersallow cows to be constrained and offer the management advan-tages that cattle can be held for observation, veterinary care, and for females, artificialinsemination; feed wastage is reduced; and bullying is reduced. The dimensions of atypical design are given in Fig. 4.6.

118 Equipment and Control
Figure 4.6. Typical self-locking barrier.
Automatic Concentrate Feeders [2]A concentrate feeder should not deliver too-small portions, otherwise feeding mo-
tivation is reduced. The availability of feed should also be very predictable, to avoidunrewarded visits. If the animals know when they can get concentrates and when not,they will quickly learn the relationship between visiting the feeder and obtaining con-centrates (Fig. 4.7).
In such systems the concentrate feeder should be located in the feeding area, near thefeed barrier, in rows of cubicles, or in an (exterior) exercise yard rather than in the lyingarea. The advantages of the automatic feeder are the possibility to control the quantityof concentrates taken by animals each day and a decrease of labor for the cowman.
Hay RacksHay racks consist of two main compartments: one in which the hay is placed and one
in which the animals pull the hay before eating. The two compartments are separated byvertical bars spaced by 140 to 160 cm. A manger at the base of the eating compartment
Figure 4.7. Automatic feeders.

Feed and Supply Distribution 119
Figure 4.8. Hay rack.
collects the hay dropped by the animals and this is eaten subsequently. The cattle gainaccess to the feeding compartment through a feed barrier (Fig. 4.8).
Sheep Breeding [3]The materials used for feeding equipment for sheep are very simple. Generally they
are made of wood and are movable.
Technical RequirementsTo allow each animal to feed according to its needs, depending on breeds, 30 to 45
cm per ewe are required, that is, five to six ewes for each 2-m element. But for pregnantewes 8% to 10% more length is required. For lambs, 20 to 30 cm are necessary, that is,eight lambs for each 2-m element.
Feeding Alleys and TroughsThe trough and the feed-distribution alley can be one movable element (Fig. 4.9).
Dimensions for ewes are shown in Fig. 4.10, and for lambs in Fig. 4.11.
Figure 4.9. Alley trough made together width (section).
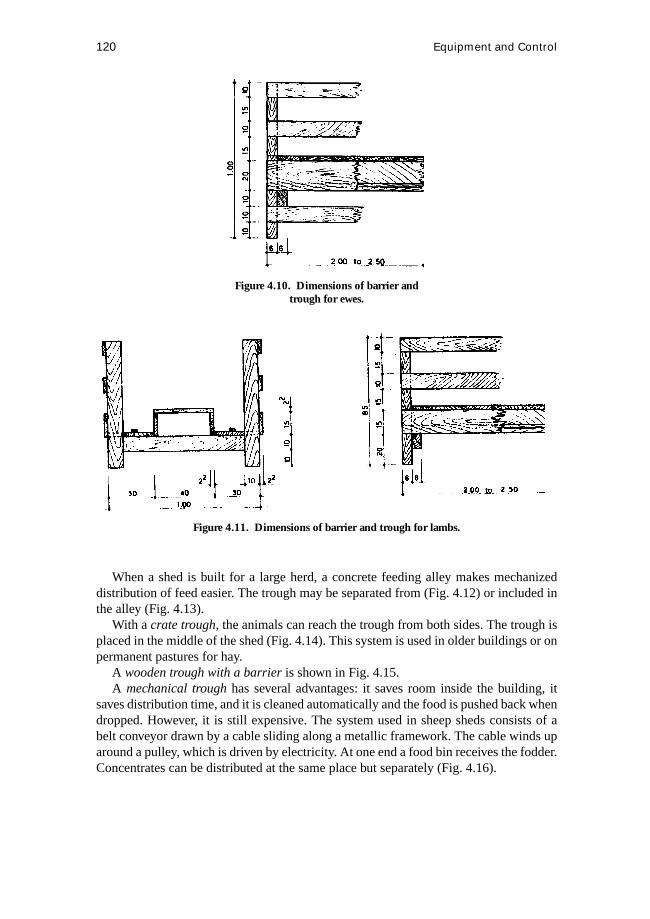
120 Equipment and Control
Figure 4.10. Dimensions of barrier andtrough for ewes.
Figure 4.11. Dimensions of barrier and trough for lambs.
When a shed is built for a large herd, a concrete feeding alley makes mechanizeddistribution of feed easier. The trough may be separated from (Fig. 4.12) or included inthe alley (Fig. 4.13).
With acrate trough, the animals can reach the trough from both sides. The trough isplaced in the middle of the shed (Fig. 4.14). This system is used in older buildings or onpermanent pastures for hay.
A wooden trough with a barrieris shown in Fig. 4.15.A mechanical troughhas several advantages: it saves room inside the building, it
saves distribution time, and it is cleaned automatically and the food is pushed back whendropped. However, it is still expensive. The system used in sheep sheds consists of abelt conveyor drawn by a cable sliding along a metallic framework. The cable winds uparound a pulley, which is driven by electricity. At one end a food bin receives the fodder.Concentrates can be distributed at the same place but separately (Fig. 4.16).

Feed and Supply Distribution 121
Figure 4.12. Alley with separate troughs.
Figure 4.13. Concrete feeding alley.
Figure 4.14. One-row wood trough.
RacksRacks are necessary for hay. Their size must be adapted to the type of bales that are
used.A rack can be placed over the trough. It is used only for bulk hay or small bales
(Fig. 4.17). In that case, metal is used as building material.Using round bales implies large-size racks (Fig. 4.18). They are round or square in
shape, and a fixed yoke is set at the base. The basic principle is the same as for cattleracks (see Fig. 4.8).

122 Equipment and Control
Figure 4.15. Wood trough with barrier.
Figure 4.16. Mechanical feeding trough.
Blocking Systems for Access to the TroughWhen concentrates are distributed, the flock is kept quiet by preventing the animals
from getting access to the trough. Two ways of blocking are available: yokes with thesame closing system as for cattle (Fig. 4.19), or a board that is placed between horizontalelements of the trough barrier. The operating principle and dimensions are shown inFig. 4.20.
Goat BreedingEquipment should be designed to maintain the animals inside their lots. The device
depends on the managing system. Self-blocking yokes or individual closing systems arerecommended (Figs. 4.21, 4.22).
Technical requirements for goat breeding are as follow: The feeding space per goatis 0.40 m, that is, six goats per 2.50-m yoke. The space between the closed bar of theyoke should be 0.09 m for the neck to be held. The trough is 0.40 m wide at its bottomand 0.60 m at brim level, so that no fodder is dropped over.

Feed and Supply Distribution 123
Figure 4.17. Trough with rack forlittle ball.
Figure 4.18. Round ball rack for sheep.
Figure 4.19. Locking yoke in wood.
The poles holding the yokes are fixed about 0.35 m deep into the ground along thepassage. Three solutions are available (Fig. 4.23):• A yoke with a trough opening 1.50 m wide on the passage if distribution is made
with a wheelbarrow, 3 m wide if it ismechanized• A yoke without a trough; the passage is used for feed distribution (3 m wide)• A yoke with a belt conveyor or chain conveyor similar to those that are used for
sheep (see Fig. 4.16).

124 Equipment and Control
Figure 4.20. Closing system with a plank.
Figure 4.21. Closing system for fixed yoke.
Figure 4.22. Locking yoke.
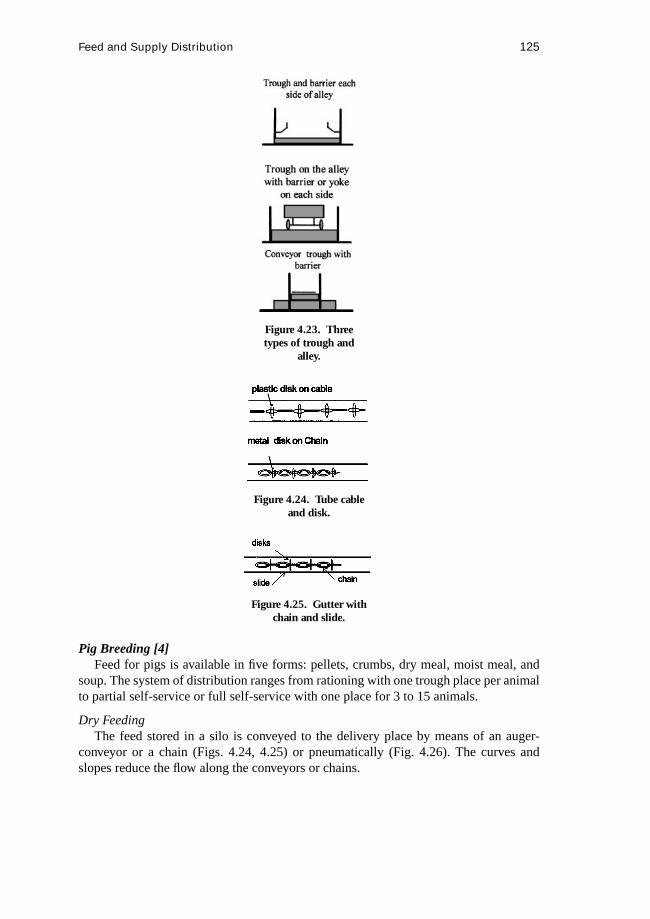
Feed and Supply Distribution 125
Figure 4.23. Threetypes of trough and
alley.
Figure 4.24. Tube cableand disk.
Figure 4.25. Gutter withchain and slide.
Pig Breeding [4]Feed for pigs is available in five forms: pellets, crumbs, dry meal, moist meal, and
soup. The system of distribution ranges from rationing with one trough place per animalto partial self-service or full self-service with one place for 3 to 15 animals.
Dry FeedingThe feed stored in a silo is conveyed to the delivery place by means of an auger-
conveyor or a chain (Figs. 4.24, 4.25) or pneumatically (Fig. 4.26). The curves andslopes reduce the flow along the conveyors or chains.

126 Equipment and Control
Figure 4.26. Pneumaticdistribution.
Figure 4.27. Rotorsystem (turbomat).
Feeders generally are used in ad-lib feeding systems. Rationing is possible by limitingthe access time or by delivering a daily ration. In that case, it is necesssary to set apartmales from females and to provide one trough space for two or three pigs.
A soup feeder is a single-place feeder fit with a nipple. The feed is diluted in a ratioof 2.0 to 2.2 L of water per kilogram of feed. It is used mostly in self-service systems,with one device for 12 to 15 piglets.
In a turbomat the feed runs down into a circular tray, 75 cm in diameter, when thepig acts upon a rotor (Fig. 4.27). Five nipples are located below the trough and providedrinking water simultaneously. There should be one device for 20 to 25 pigs, or three tofive per batch of 60 to 100 pigs. The dilution ratio is 1.8 to 2.21 L of water per kilogramof feed, which reduces the volume of slurry production. Delivery is clock-programmed.
In the Apor System the feed is delivered in a double-sided auger by means of a rotorplaced on a slotted tray (Fig. 4.28). The auger is fitted with push-button drinkers. Thereshould be one device for 50 animals, or 25 pigs per pen, the auger being located acrosstwo cubicles.
Liquid SystemIn a liquid system the feed is conveyed to the delivery place by centrifugal, spiral, or
piston pumps, by means of pipes.With centrifugal pumps, the flow rate is sensitive to head losses and depends on
the viscosity of the product. With volumetric spiral pumps, the flow rate is constant.They are suitable for long circuits but tend to deteriorate if there are any foreign bodies,

Feed and Supply Distribution 127
Figure 4.28. Rotativetray.
such as stones. With piston pumps, the flow rate shows little sensitivity to head losses.Their operation is volumetrical and similar to that of a syringe, each stroke of the pistonreleasing the desired volume of feed.
Delivery into the augers is operated through a shutter, either hand-worked or automaticwith compressed air. The feed quantities for each pen are controlled before conveyingby load cells located under the mixing tank.
To reduce the quantities of nitrogen and phosphorus outputs in slurry, multiphasesystems are used. Two diets are mixed in varying proportions corresponding to the needsof pigs and conveyed in the trough.
Poultry [5]
Laying HensIn ground-level breeding every 1000 hens should have trays in the starting period and
40 m of chain, that is, 8 cm of auger length per fowl, or 40 trays. Three systems are used:a spiral, a flat chain, or a trolley.
In a spiral system, the auger and the conveying device are one. The spiral lies at thebottom of the auger (Fig. 4.29). It is operated by a clock.
The flat chain moves along the bottom of the auger. The forwarding speed is 12 m/min.There are two types of feeding trolleys: a trolley with only one feeding box placed
above the cages, in which a conveyor pushes the feed towards the downward pipes; anda side trolley with a feed box for each level on each side. The trolley moves along rails.The rails, placed on the lower part of the batteries, reduce the strain laid on the cages.According to the type, it is possible to adjust the amount of feed in the augers.
Figure 4.29. Spiral in auger.

128 Equipment and Control
Amount control is ensured by a weighing system either on the silo or automatically.Electronic weighing at the cage level allows one to determine the daily intake throughpermanent control over a sample of cages. This system gives a precision of 99% andprovides a very significant daily weight. The size of the sample is determined statistically.
Computer calculation allows one to calculate the intake according to several parame-ters: weight of the fowls, temperature of the building, laying performances, and feathercondition. Usually the same computer provides the technical management of the unitand the monitoring of each batch of hens, as well as the calculation of the variousratios.
BroilersIn the starting period for broilers, one feeding plate or tray for 100 chicks should be
set. In the breeding period, one plate for 70 fowls and access along 50 m for 1000 fowlsis needed.
Aerial conveyors are not used. A tubular ground chain fitted with a tray is better. It iscomposed of a 125- to 175-L feed box (storage) with an agitator and a monitoring systemin order to avoid loadless running. The dispensing line consists of a spiral inside a pipe(diameter: 45 mm). The trays are distributed according to the width of the building thenumber of lines. Synthetic materials are preferred to metallic ones. The diameter of thetrays ranges from 32 to 38 cm. The height above ground is 6 to 8 cm.
Turkeys [6]One tray to 40 fowls is to be supplied. The mangers should be placed above the backs
of the fowls.For the starting period there should be feeding trays for the fattening period, the
mangers are set in lines and fitted with first-age plates 0.30 to 0.40 m up to 6 weeks, thenwith adult plates 0.50 m.
4.1.2 Extensive Conditions
Cattle BreedingFor outdoor breeding or an extensive system, equipment consists only of the devices
necessary for feed addition, generally hay and concentrates. Hay is distributed in racks.Concentrates are available in augers or by means of conveyors.
RacksHay racks are similar to the one in Fig. 4.18 but are under shelter or have their own
built-in roof (Fig. 4.30). For dimensions, see Fig. 4.8.
Figure 4.30. Covered rack.
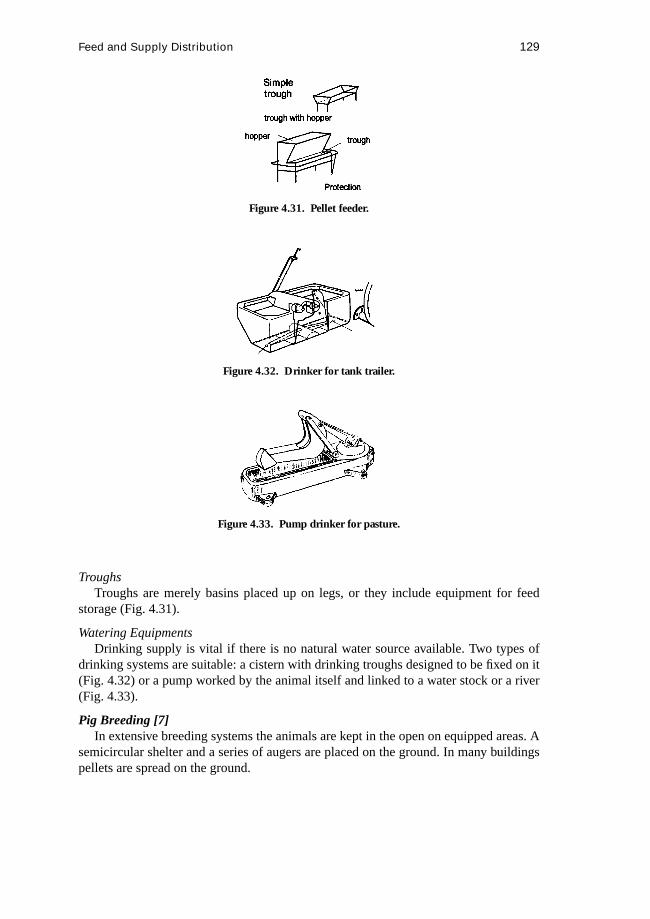
Feed and Supply Distribution 129
Figure 4.31. Pellet feeder.
Figure 4.32. Drinker for tank trailer.
Figure 4.33. Pump drinker for pasture.
TroughsTroughs are merely basins placed up on legs, or they include equipment for feed
storage (Fig. 4.31).
Watering EquipmentsDrinking supply is vital if there is no natural water source available. Two types of
drinking systems are suitable: a cistern with drinking troughs designed to be fixed on it(Fig. 4.32) or a pump worked by the animal itself and linked to a water stock or a river(Fig. 4.33).
Pig Breeding [7]In extensive breeding systems the animals are kept in the open on equipped areas. A
semicircular shelter and a series of augers are placed on the ground. In many buildingspellets are spread on the ground.

130 Equipment and Control
Sheep and Goat BreedingIt is important that salt and minerals can be supplied. Gutter troughs are used for bulk
feed and licking blocks. The blocks are either placed in basins on the ground or attachedto a pole, depending on the shape.
Supplementary hay is brought in racks similar to those used in sheep breeding.
4.2 Feed Mixers and Intake Control
4.2.1 Cattle Breeding
Feed distribution is generally an important time and labor factor in breeding activities.Even though self-service from the silo is possible in small dairy herds, in most cases thefeed is distributed mechanically in throughs.
The breeder seeks efficient and easy distribution solutions that require as little labortime as possible. Complete diet feeding is more and more widely used but requirestechnical means regarding silage and concentrate mixing.
Feeding Trailers
TrailersThe distribution trailer consists of a container for the feed whose bottom is mobile,
and a screw or a side conveyor that drops the fodder into the trough (Fig. 4.34). Withthis type of equipment the feed cannot be mixed.
Mounted Silo UnloadersA simple version of this system is available: a distributing silo unloader (Fig. 4.35).
This machine can take the fodder from the silo and distribute it into the troughs. At thebottom of the machine a chain conveyor and slats throw the fodder sideways.
Figure 4.34. Feeding trailer.

Feed Mixers and Intake Control 131
Figure 4.35. Fodder loadingand spreading.
Figure 4.36. Hydraulic fork.
Figure 4.37. Mixer trailers.
Trailers and silo unloaders can include a system for distribution on both sides. Thehay is either cut or torn from the silo. These machines generally can work at heightsbetween 2 and 3 m.
Hydraulic ForkThe hydraulic fork is the simplest means for taking and distributing silage. However,
it is impossible to spread the feed in the trough. It has to be piled first and spread later(Fig. 4.36).
Mixer Trailers (Complete Diet)Mixing distributing trailers have a system for mixing the feed so that a complete
diet can be prepared (Fig. 4.37). A weighing system with a gauge constraint allowsfor measurement of the quantities of feed put into the trailer. The mixing of feed andconcentrates is achieved by one or several screws that move the fodder.

132 Equipment and Control
Figure 4.38. Screw in auger.
Figure 4.39. Screw in auger.
Figure 4.40. Mechanical auger with rotary brush.
Fixed Feeding SystemsIn large breeding units feed distribution can be mechanized with a conveyor. This is a
fixed piece of equipment that conveys and distributes the feed into a trough. Distributionis best with short minced feed. Generally these pieces of equipment are limited in length,especially those with screws.
ScrewsThere are two types of screw systems: Either the trough is fixed, in which case
a distributor is placed below and throws the fodder to the right or left of the trough(Fig. 4.38), or the trough is mobile vertically and the feed falls into a prism shape intothe trough (Fig. 4.39).
ConveyorsIn this system the feed is carried along on a conveyor and a brush pushes it into the
trough (Fig. 4.40).

Watering Equipment 133
Figure 4.41. Mechanical auger with slats.
Chains with SlatsThe feed is pushed forward by means of paddles, which are moved along a conveyor
by chains (Fig. 4.41).
4.2.2 Sheep Production
Generally, the type of equipment used for sheep is the same as for cattle (see materialon feeding alleys and troughs in the subsections on sheep and goat breeeding).
4.3 Watering Equipment
Water is very important for animals, and lack of water significantly affects production.Consequently, good-quality water supplied through adequate and accessible drinkingfacilities must be provided.
4.3.1 Cattle Breeding [8]
Drinking-Water RequirementsThe quantities of water absorbed depend on various factors: production, dry-matter
content of the feed, stage of lactation, and ambient temperature. The following equa-tion [9] predicts water requirements:
y = 2.53x1+ 0.45x2− 15.3 (±8.31)
where
y=water requirement (kg/d)x1=milk production (kg/d)x2=dry matter content of feed (%).
Drinking-Water Equipment
Water BowlBowl-type drinkers may be used, provided they have a minimum surface area of
0.06 m2 (Figs. 4.42, 4.43) and a water inlet flow rate of 0.16 L/s. The height of the bowlabove the floor is 0.55 times the height of the animal withers (Fig. 4.44).

134 Equipment and Control
Figure 4.42.Constant-level
water bowl.
Figure 4.43.Water bowlwith stop
valve.
Figure 4.44. Bowlin tie stall.
Figure 4.45. Watertrough.
Water TroughWater troughs are recommended for loose housing, with a capacity of about 200 L.
The size of the trough allows cows that may take in 0.2 to 0.33 L/s to drink regulary. Atrough 2 m length, 400 mm wide, and 400 mm deep is sufficient. Troughs should presenta water surface to the cows at a height of 0.61 times the height of the animal withers(about 850 mm) from the floor (Fig. 4.45).
Number of BowlsThe number of water bowls provided should be equivalent to 15% of the number of
animals. The number of water troughs should be equivalent to one per 25 cows.
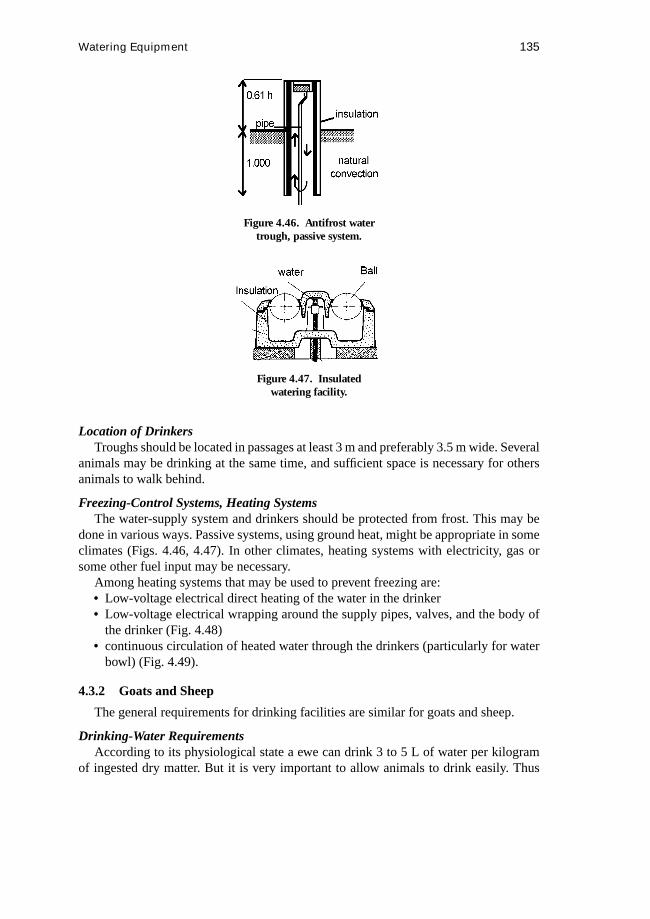
Watering Equipment 135
Figure 4.46. Antifrost watertrough, passive system.
Figure 4.47. Insulatedwatering facility.
Location of DrinkersTroughs should be located in passages at least 3 m and preferably 3.5 m wide. Several
animals may be drinking at the same time, and sufficient space is necessary for othersanimals to walk behind.
Freezing-Control Systems, Heating SystemsThe water-supply system and drinkers should be protected from frost. This may be
done in various ways. Passive systems, using ground heat, might be appropriate in someclimates (Figs. 4.46, 4.47). In other climates, heating systems with electricity, gas orsome other fuel input may be necessary.
Among heating systems that may be used to prevent freezing are:• Low-voltage electrical direct heating of the water in the drinker• Low-voltage electrical wrapping around the supply pipes, valves, and the body of
the drinker (Fig. 4.48)• continuous circulation of heated water through the drinkers (particularly for water
bowl) (Fig. 4.49).
4.3.2 Goats and Sheep
The general requirements for drinking facilities are similar for goats and sheep.
Drinking-Water RequirementsAccording to its physiological state a ewe can drink 3 to 5 L of water per kilogram
of ingested dry matter. But it is very important to allow animals to drink easily. Thus

136 Equipment and Control
Figure 4.48. Low-voltageheating system.
Figure 4.49. Continuous-circulationwater.
three conditions must be respected: the shape of the drinking facility, its location, andits height. For these animals a water bowl is generally used (Fig. 4.50). Cleanliness ofthe water is very important. Sheep are reluctant to drink soiled water, and the drinkersshould be cleaned very often.
Number of BowlsThe number of water bowls provided should be equivalent to 2.5% of the number of
animals.
Location of BowlsThe bowls should be located on the opposite side of feeding trough. The height of
the bowl should be at least 70 cm from the floor (Fig. 4.51). According to the thicknessof the litter it may be necessary to adjust the position of the watering facility. A flexiblepipe should be provided between the bowl and the water installation (Fig. 4.52).

Watering Equipment 137
Figure 4.50. Water bowl for sheep.
Figure 4.51. Drinker height position.
Figure 4.52. Flexible pipeadjusting height of the bowl.

138 Equipment and Control
Figure 4.53. Siphoning drinkerfor piglets.
Figure 4.54. Tube drinker.
Figure 4.55. Suckling drinker.
4.3.3 Pig Breeding [9]
In pig breeding the water is supplied by drinking facilities in different ways: waterbowl, water-tube system, water-suckling system, or directly with the feed.
Water RequirementsThe recommendations are shown in the Table 4.1.
Drinking-Water EquipmentA siphoning drinking bowl for piglets can also deliver artificial milk. The water is at
room temperature (Fig. 4.53). A tube drinker is easy to use, has no wastage, and staysclean (Fig. 4.54). A suckling drinker is easily learned by the animals, but a lot of wateris wasted (Fig. 4.55). A constant-level drinker has little wastage, but the water gets dirty(Fig. 4.56). A finger drinker easily learned, has little wastage, and stays clean (Fig. 4.57).
4.3.4 Poultry [6]
Drinking Water RequirementsPoultry should be provided with sufficient cool drinking water without wastage. The
drinking trough should be easily reached. The quality of the water should meet the localstandards for drinking water. Tables 4.2 and 4.3 show the number and the type of devicesneeded.

Watering Equipment 139
Tabl
e4.
1.R
ecom
men
dati
ons
offl
owra
tean
dpo
siti
onof
drin
king
syst
ems
Hei
ghto
fDri
nkin
gSy
stem
from
the
Floo
r(c
m)
Wit
hSt
epA
nim
alan
dPh
ysio
logy
Stag
es
Type
ofD
rink
ing
Syst
emFl
owR
ate
(l/6
0s)
Wit
hout
Step
Tota
lHei
ght
Step
Hei
ght
Max
imum
Num
ber
ofA
nim
als
per
Uni
t
Pigl
etB
owl
0.5–
1.0
815
5—
Suck
ling
syst
em0.
520
305
—W
eani
ngpi
gsB
owl
1.0–
1.2
1220
1018
Suck
ling
syst
em0.
5–1.
030
3510
10Fa
tten
ing
pigs
Bow
l0.
8–1.
220
3515
18Su
cklin
gsy
stem
0.5–
1.0
5060
1510
Sow
sin
colle
ctiv
ebo
xB
owl
3.0
3045
2010
Suck
ling
syst
em1.
570
8020
5So
ws
inin
divi
dual
box
Suck
ling
syst
em>
0.30
5–10
——
—

140 Equipment and Control
Figure 4.56. Constant-level drinker.
Figure 4.57. Finger drinker.
Water-Supply Systems
Laying HensIn cage-breeding systems the dripping system is used (Fig. 4.58) or the suckling
drinker into which the water is led by gravity from constant-level tanks located at theend of each battery.
In the cage two drippers should be available to each hen. A device for water recovery(cup or gutter) is fitted below each drinker (Fig. 4.59). This contributes to obtaining drydroppings.
BroilersDripping systems (pipette) fixed on a feeding pipe and hanging inside the building,
supplied through gravity, or round drinkers can be used. Height above floor level dependson the size of the fowls and on the period (either starting or breeding).
Table 4.2. Number of drinking points for starting poultry by drinker type
Breeding Type Dripping Minidrinker Little Bell Dripping
Battery 1 for 10 1 for 50 — —Floor — — 10 80
Table 4.3. Number of drinking points for poultryby drinker type in various climates
Number of Points
Climate Bell Linear Dripping
Mild 10 8 80Warm 13 10 100
Note. Data for floor breeding in the period from 1 to 17weeks.

Watering Equipment 141
Figure 4.58. Drop drinking
Figure 4.59. Cup for water recovery.
Figure 4.60. Bell drinker.
TurkeysAutomatic round drinking bowls (Fig. 4.60) can be used. A flap system regulates the
water level and prevents overrunning, thus keeping the litter dry. The number of drinkingbowls depends on the age of the fowls (Table 4.4). The drinkers are either hanging or seton the floor. For a 1000-m2 building, 96 turkey-type drinking bowls are provided.
Table 4.4. Number and type of drinkersaccording to age of the fowls
Age
0 to 6 More thanWeeks 6 Weeks
Type of Little bell Bellsdrinkers
Number of 1 per 80 1 per 120drinkers to 150

142 Equipment and Control
Table 4.5. Influence of initial contamination and storage temperature of milk on its bacterial quality
After 24 Hours After 48 HoursInitialContamination(germs/mL)
StorageTemperature (◦C)
MultiplicationRate Germs/mL
MultiplicationRate Germs/mL
4,300 4.5 1 4,100 1 4,50010 3 14,000 30 12,80016 372 1,600,000 8000 33,000,000
40,000 4.5 2 88,000 3 127,00010 5 180,000 21 830,00016 113 4,500,000 2500 100,000,000
140,000 4.5 2 280,000 4 540,00010 8 1,200,000 100 14,000,00016 180 25,000,000 4300 600,000,000
Source: [12].
4.4 Milk Storage and Control [11]
4.4.1 General Points
Refrigeration of milk is necessary to avoid the development of microorganisms in themilk while it is stored on the farm, before collection. Refrigeration will not improve thebacteriologic quality of milk, it will at best maintain it, provided the milk cooler worksproperly and the tank is clean.
Within the European Union, specific regulations for hygiene define storage and cool-ing conditions for milk (see 85/397/EC, 89/362/EC, 92/46/EC).1 These texts have beenadapted by each member country to its own legal system, so it is recommended to referto local regulations that indicate among other things the temperature for milk storage ac-cording to the intervals between collecting, and to the norm ISO 5708/19832 concerningbulk milk coolers.
4.4.2 Influence of Refrigeration on the Microbial Flora
Milk naturally contains antibacterial substances apt to stop contaminating flora fromevolving if it is stored at ambient temperature. But this protection is effective only fora few hours and does not last enough for the storage time on the farm. Refrigeration isused for stopping or slowing down the activity of microorganisms. This bacteriostaticeffect depends on three factors:• Level of initial contamination• Cooling speed• Storage temperature
The influence of these factors is shown in Table 4.5.The effect of refrigeration is not the same on all the germs contained in the milk:
psychotropic bacteria, and especiallyPseudomonas fluorescens, can develop below 4◦C.
1EC: European Community.2International Standard Organization.

Milk Storage and Control [11] 143
Figure 4.61. Simplified sketch of refreshing milk tank(S.B. Spencer).1
Figure 4.62. Refrigerator unit by expansion system.
4.4.3 Refrigeration Systems
A milk cooler works on the same principle as a home refrigerator. A cold-generatingfluid in liquid form is distended into an evaporator and produces cold (Fig. 4.61). The heatcreated by the compression–condensation system is evacuated by means of a ventilator.The cooling level is regulated at the beginning by the mass of milk and then by athermostat that stops the compressor when the milk has reached the desired temperature.
Direct-Distension CoolersIn a direct-distension cooler, the evaporator is in direct contact with the sides of the
tank in which the milk is stored (Fig. 4.62).
Ice-Accumulation CoolersThe evaporator in an ice-accumulation cooler is in contact with a water tank in which
ice is produced and accumulated. This water tank is around the tank that contains themilk; icy water is pumped to the tank (Fig. 4.63).
An agitator ensures uniform cooling of the milk and homogeinization so that thefat does not all come up to the surface. This system includes a blade set on an axismoved by a speed-reducer -; it should turn slowly so as to avoid churning and risks offat desintegration.
1S. B. Spencer Prof. College of Agri. Sciences Coop. Extension. Dairy and Animal Science. PennsylvaniaState-University.

144 Equipment and Control
Figure 4.63. Refrigerator unit by water cooling.
4.4.4 Tank Equipment
Milk MeasurementIn some countries, storage tanks must include a system for milk measurement, usually
a graduated ruler or an electronic gauge. If the measurement system is used for tradingtransactions, it is controlled by an official service.
Other EquipmentA thermometer tells of anything going wrong in the equipment. A cleaning automat
is necessary for tanks containing over 2000 L and closed-cylinder tanks, the principle issimilar to that of a cleaning automat for milking machines. A heat exchanger recuperatesthe calories produced by the condenser–compressor system, which are used to warm upwater in a tank.
4.4.5 Control of Coolers
Technical controls of the coolers are conducted to make sure that the equipmentmeets the demands of established norms. The points to be controlled are the maximumduration of milk cooling, conservation (average temperature of the milk between coolingperiods), isothermy (average rise of temperature when the compressor and the agitatorare not functioning), deep freezing of the milk (no ice should appear on the surface ofthe milk if the tank contains between 10% and 100% of its total capacity).
References
1. CIGR Section II.1, Working Group No. 14. 1994.Cattle Housing1994. ADASBridgets Dairy Research Center FBRT.
2. Ministere de l’Agriculture Paris La stabulation libre pour vaches laiti`eres. S´erieConstruction rurales.
3. Institut de l’Elevage Paris Bergerie Moderne. 1985. Plans type FNGEDA–ITOVIC1980.
4. Manuel de l’eleveur de porc ITP 1995.5. La Pondeuse ITAVI Re-issue in progress1998.6. L’Elevage des volailles ITAVI 1997.7. Manuel de l’eleveur de porc ITP 1995.

Milk Storage and Control [11] 145
8. CIGR Section II 1995 Recommandations of the Cattle Group.9. Castle, M. E., and Thomas, T. P. 1975. The water intake of British Friesian cows on
rations containing various forage.Animal Production20:181–189.10. Manuel de l’eleveur de porc ITP. 1995.11. Institut de l’Elevage Paris. 1995. R´eferences techniques pour l’hygi´ene en production
laitiere bovine.12. Davis and Killmeier. 1959. New method for determining the quality of bulk tank
milk. Milk Review21:37.

146
5 Storing Forages andForage Products
Shahab S. Sokhansanj
5.1 Introduction
Losses in processed alfalfa from harvest to the time it is used can be mechanical,physical, or nutritional. This chapter focuses on losses during the storage of alfalfa andits products and considers only the losses due to biotic conditions. Harvest losses due tomechanical shattering of the leaves are discussed elsewhere [1, 2].
The chemical composition of alfalfa includes water, nitrogenous compounds, carbo-hydrates and pectin, lignin, lipids, organic acids, pigments, vitamins, and minerals. Thegrowing plant contains 70% to 90% water, and often the proportion of chemicals inplant material is expressed on a dry-matter basis. Proteins are found in a soluble formin the cytoplasm and in a granular form in the chloroplasts. Carbohydrates in the plantare divided into structural and nonstructural. Structural carbohydrates consist of the cellwalls and other tissues that give rigidity to the plant. Cellulose, hemicellulose, and ligninare structural carbohydrates. Nonstructural carbohydrates include digestible sugars andstarches. Chlorophyll and carotenoids constitute the main pigments in alfalfa. Greenchlorophyll that has no direct nutritional value often is associated with high proteinand high carotene content. The beta carotene in alfalfa is the precursor to vitamin A.Carotene is a very unstable compound whose oxidative destruction commences as soonas the plant is cut.
The analysis of alfalfa as a feed starts with the determination of the moisture content,which is expressed in percent of the original weight of the material. Other compoundsfound then are expressed on a dry-matter basis (original weight minus water content).Crude protein content is the proportion of nitrogen multiplied by 6.25. Crude proteindoes not indicate the nutritional quality of protein and the value of the essential aminoacids. To determine the fiber content of the plant material the neutral-detergent and acid-detergent fiber procedures are used. The neutral-detergent fiber provides the contentsof the cell wall, which include cellulose, hemicellulose, and lignin. The acid-detergentfiber separates hemicellulose from the fiber, and thus the value does not contain thecomponent of hemicellulose. The quality of forages also are given in the form of energyintake. A portion of this energy is digestible (often more than 50%), out of which abouthalf of it is the metabolized energy.
147

148 Storing Forages and Forage Products
Canadian data on production of hay in general and that of alfalfa in specific are diffi-cult to compile. Table 5.1 lists the published statistical data on the production of cultivatedhay in Canada, which includes alfalfa and other forages. Canada’s annual production ofhay is about 33 million tons, covering an area of about 8.5 million ha. About half ofthe balers are deployed in Western Canada, while the majority of forage harvesters arein Eastern Canada. In Saskatchewan about 10% of the hay produced is processed intocubes and pellets mainly for export. The percentage of the forage processed in Albertais smaller than in Saskatchewan, as most of the hay is fed directly to the livestock.
5.2 Losses in Swath
The quality of field-cured hay depends upon such factors as maturity at the time of cut,method of handling, moisture content, and weather conditions during harvest. In additionto mechanical losses (loss of leaves), enzymatic and oxidative losses also occur duringfield drying. Dry-matter losses from respiration (enzyme activity) have been reportedto be up to 15% of the plant weight. With the slow field drying, as much as 80% ofthe vitamin A (beta carotene) in the alfalfa plant is lost due to exposure to sun [3]. Sunbleaching of cut forages generally increases the loss of vitamin A. Vitamin D contentof the cut plant, however, increases as a result of the synthesis of the vitamin from plantsterols in the presence of sunlight and ultraviolet rays.
Bruhn and Oliver [4] tested hay stored outside for tocopherols (vitamin E) and carotene(vitamin A) contents. Tocopherol is known to protect lipids from oxidation in foods andfeeds. Swathed and baled hay samples were kept outside over a period of 18 weeks. Thehay was tested for dry matter, tocopherol, and carotene content in California (presumablyaround Davis). A linear fit to the test data was obtained showing that the dry matterincreased from 88% to about 92%, theγ -tocopherol decreased from 90 to 80µg/g, theα-tocopherol decreased from 84 to 50µg/g and the carotene decreased from 58 to 18µg/gduring the 18 weeks of outside storage. Because the climatic conditions during storagewere not reported, we may assume that the losses probably were due to sun curing.
Losses in protein occur during field curing as the activity of the enzyme proteasedecreases N-protein (estimated protein based on the total nitrogen content) but increasesthe amount of soluble proteins, peptides, amino acids, amides, and other compounds.However, changes in N-protein are small and inconsequential with respect to the feedingquality of hay.
5.3 Losses During Storage of Square-Baled Hay
During field drying (curing), considerable losses in dry matter and nutritional valueoccur due to respiration, leaching, bleaching, microbial activity, and mechanical handling[5]. Stable storage of hay in rectangular bales requires that the hay have less than 18%moisture content. Buckmaster et al. [5] investigated the storage stability of baled haystored in a hay shed in Michigan. They monitored the dry-matter loss, ash content, fibercontent, crude protein, and development of insoluble proteins in the bales of alfalfa thatvaried in moisture content and density.

Losses During Storage of Square-Baled Hay 149
Tabl
e5.
1.St
atis
tics
onfo
rage
prod
ucti
on,y
ield
,are
aun
der
cult
ivat
ion,
num
ber
ofba
lers
and
fora
geha
rves
ters
inC
anad
a(1
990)
and
prod
ucti
onof
proc
esse
dfo
rgag
es(1
992–
1993
)
Prod
ucti
onY
ield
Are
aN
o.N
o.Fo
rage
Pelle
tsC
ubes
Com
pact
Bal
esPr
ovin
ces
(t×
1000
)(t
/ha)
(ha×
1000
)B
aler
sH
arve
ster
s(t
×10
00)
(t×
1000
)(t
×10
00)
New
Foun
dlan
d24
4.63
154
30Pr
ince
Edw
ard
Isla
nd29
05.
1518
4433
9N
ove
Scot
ia43
56.
3223
7941
6N
ewB
runs
wic
k41
75.
8621
5138
2Q
uebe
c70
007.
0626
,247
8402
Ont
ario
7439
7.21
37,2
8214
,513
Eas
tern
Can
ada
15,6
056.
0670
,057
24,0
8220
10b
Man
itob
a30
844.
6238
415
,137
978
19a
Sask
atch
ewan
2722
3.20
5949
30,6
4015
6023
35b
Alb
erta
9525
5.06
2104
37,5
7834
4919
240
b
Bri
tish
Col
umbi
a21
776.
1885
7484
1863
—C
anad
ato
tal
33,1
135.
5485
2216
1,07
631
,936
464
286
55b
aIn
clud
esB
riti
shC
olum
bia.
bE
stim
ated
for
1993
–199
4cr
opye
ar.

150 Storing Forages and Forage Products
Table 5.2. Storage stability of baled hay
Moisture content range (%) 10–15 15–20 20–25 25–30
Stack number∗ 1 2 5 3 3 2 1 2Moisture content (%) 11.5 14.4 17.7 16.8 24.0 22.4 27.7 26.4Density (kg/m3) 111 173 87 188 101 227 106 230dry matter loss (%) 2.1 2.5 3.1 3.0 4.4 4.4 5.8 9.4Maximum temp. (◦C) 26 25 26 37 29 43 27 47Average temp. (◦C) 17 18 21 25 18 29 21 34Ash (%) 7.2 8.3 8.9 8.2Retention ratio 1.04 0.99 1.02 1.00ADF (%) 42.5 34.3 31.2 37.5Retention ratio 0.92 0.99 1.06 0.95CP (%) 13.9 17.0 20.1 15.3Retention ratio 1.07 0.99 0.97 1.05ADIP (%) 1.13 1.01 1.07 1.12Retention ratio 0.99 1.02 1.13 1.20
∗ Stack number is the location of the bale in a stack of bales of 5 rows.
The results obtained by Buckmaster et al. [5] cover a moisture range for the baledalfalfa from 11.5% to 48.0%. Because most alfalfa is baled when moisture content isless than 20%, Table 5.2 lists part of the results published by Buckmaster et al. Eachmoisture range includes at least two moisture contents. The bales were stacked in fiverows and three columns; columns were separated by styrofoam insulation board. Thelocation of the tested bale in the stack is identified by the stack number.
Buckmaster et al. found that dry-matter loss was directly correlated with moisturecontent of the bales but could be considered independent of the bale density. The densebales, however, showed a higher temperature during storage than the loose hay (referto Table 5.2 and compare the maximum or average temperature of the dense bale tothat of the loose bale). Increased baling moisture content resulted in an increase in theconcentration of crude protein, ash, and acid-detergent fiber when removed from storage.Quality retention ratios indicated that ash and acid-detergent fiber did not change, butthe amount of insoluble protein increased with moisture content.
5.4 Losses During Storage of Round-Baled Hay
Rider et al. [6] classified different portions of a round bale according to susceptibilityof each portion to deterioration. Figure 5.1 depicts the divisions in a round bale. As around bale settles, approximately one third of the circumference contacts the ground; asubstantial amount of moisture can be absorbed through the bottom of the bale resultingin spoilage as far up as 30 cm. If the weather affects only the outer 15 cm of the roundbale not in contact with the ground plus an additional 15 cm at the bottom, 42% of thebale volume can be affected. Assuming a uniform bale density, the outer 15 cm of around bale accounts for more than 20% of the total bale mass.
Rider et al. [6] investigated six types of storage of round bales: inside a barn; unshel-tered, with a black polyethylene wrap around the circumference of each bale; unsheltered,

Losses During Storage of Round-Baled Hay 151
Figure 5.1. Division of a round bale.
with direct ground contact; unsheltered, with black polyethylene under the bale contactarea; unsheltered, with black polyethylene under the projected bale contact area; and un-sheltered, with a black polyethylene ground cover on the entire storage area. The resultsof the tests are summarized in Table 5.3. In Western Canada the losses in dry matter inround bales as a result of outdoor storage were reported to be 4% to 8% [7]. Schodt [8] in-vestigated the losses in wrapped and unwrapped round bales in Manitoba. Hay, consistingof 60% alfalfa and remainder timothy and brome, was baled in July. The hard-core baleswere stored using five storage treatments. Two were wrapped with polyethylene with endsleft open (wrap in Table 5.4); three unwrapped bales included bales stored horizontally,end-to-end in a single row; bales stored vertically with the bottom bale on its end and thetop bale on its side; and bales protected from weather inside an enclosed building (barn).Outside bales were stored in a well-drained area. Bales were monitored for 16 months,during which 423 mm of rain was recorded. Table 5.4 lists a summary of the results.
Dry-matter loss was calculated based on weighing the bales before and after storage,and spoilage was judged as not being fit for consumption by livestock. Table 5.4 shows
Table 5.3. Changes in alfalfa bale quality for the six storage types
Percent Change in Crude Protein Percent Change in Digestible DryStorage Type from Initial 24.3% Matter from Initial 64.4%
Barn −17.9 −4.2Wrap −21.4 −12.2Ground −29.2 −23.4Contact area cover −29.3 −20.9Projected area cover −25.6 −24.0Total ground cover −27.7 −22.5

152 Storing Forages and Forage Products
Table 5.4. Results of tests conducted by PAMI on storage of round bales in Manitoba
Storage Type Dry-Matter Loss Spoilage Loss Total Loss
In barn Nil Nil NilWrap 3.7 3.8 7.8Single row unprotected 0.8 5.6 6.4Vertical 9.8 1.0 10.8
Source: [8]
that storing in the barn kept the bales safe during the storage period. Not much differencewas noticed in the total losses in dry matter among those bales wrapped and not wrapped.The vertical storage losess were mainly in the bottom row, and spoilage losses werecentered around the bottom portion of each bale. The moisture content of the bales atthe time of storage was not given by the author.
5.5 Storage of Cubes
Chaplin and Tetlow [13] studied the storage stability of both whole and ground sam-ples of several grasses including alfalfa. The tests were conducted in a laboratory at atemperature of 21◦C in a controlled humidity chamber over sulfuric-acid solutions (tomaintain humidities). The samples initially at 8◦C were brought to equilibrium with rel-ative humidities ranging from 50% to 90%. Some samples were treated with propionicacids and some were prepared with binders (calcium lignosulphonate). Table 5.5 listsa summary of the results of Chaplin and Tetlow’s experiments. Mold development hasbeen found to be slower on pure protein than on pure starch, and much slower on purefiber substrates. Compared with the starch grain, it appears that mold growth on foragesis slower. The use of a binding agent had little effect on the mold growth. Propionicacid sprayed on samples improved the storage time. The molds were identified on mostsamples were from theAspergillus glaucusgroup.A. ruber, A. repens, andA. chevalieralso were identified on a few samples.
Chaplin and Tetlow [9] also studied the moisture uptake of wafers in bulk by exposingthem to a change in humidity of the air. First a bulk of wafers 0.3 m was exposed to 90%
Table 5.5. Equilibrium moisture content and number of days before the firstappearance of mycelium and spores for various treatments at 21◦C
Treatments Moisture content 8.2 10.0 13.3 — 18.1 27.9Relative humidity 49.6 58 70 75 79 89
No treatment Spores 350 83 20Mycelium 222 69 — —
Binding agent Spores 210 75 20Mycelium 141 45 —
Fungus inhibitor Spores 141Mycelium 102
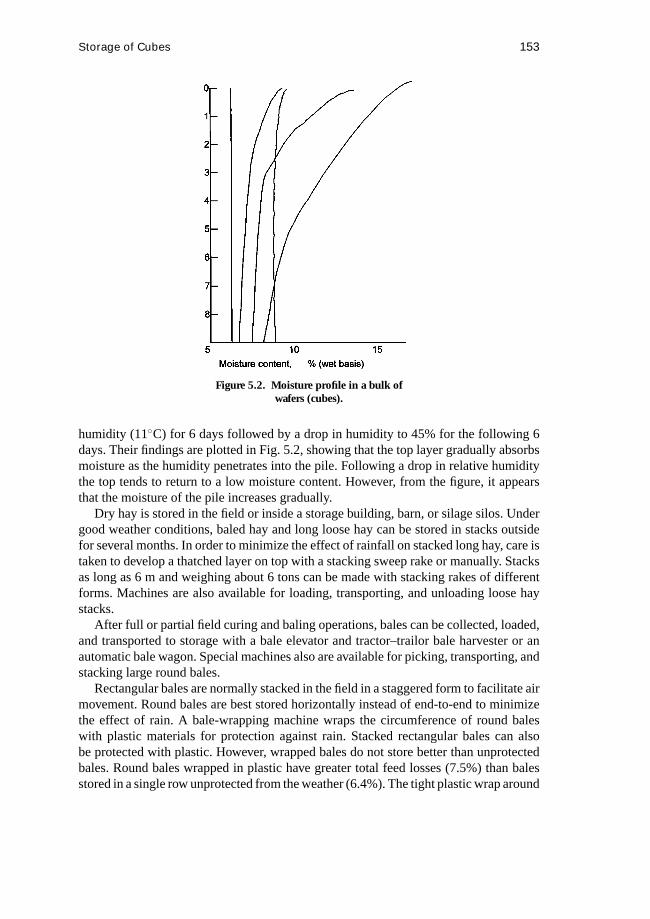
Storage of Cubes 153
Figure 5.2. Moisture profile in a bulk ofwafers (cubes).
humidity (11◦C) for 6 days followed by a drop in humidity to 45% for the following 6days. Their findings are plotted in Fig. 5.2, showing that the top layer gradually absorbsmoisture as the humidity penetrates into the pile. Following a drop in relative humiditythe top tends to return to a low moisture content. However, from the figure, it appearsthat the moisture of the pile increases gradually.
Dry hay is stored in the field or inside a storage building, barn, or silage silos. Undergood weather conditions, baled hay and long loose hay can be stored in stacks outsidefor several months. In order to minimize the effect of rainfall on stacked long hay, care istaken to develop a thatched layer on top with a stacking sweep rake or manually. Stacksas long as 6 m and weighing about 6 tons can be made with stacking rakes of differentforms. Machines are also available for loading, transporting, and unloading loose haystacks.
After full or partial field curing and baling operations, bales can be collected, loaded,and transported to storage with a bale elevator and tractor–trailor bale harvester or anautomatic bale wagon. Special machines also are available for picking, transporting, andstacking large round bales.
Rectangular bales are normally stacked in the field in a staggered form to facilitate airmovement. Round bales are best stored horizontally instead of end-to-end to minimizethe effect of rain. A bale-wrapping machine wraps the circumference of round baleswith plastic materials for protection against rain. Stacked rectangular bales can alsobe protected with plastic. However, wrapped bales do not store better than unprotectedbales. Round bales wrapped in plastic have greater total feed losses (7.5%) than balesstored in a single row unprotected from the weather (6.4%). The tight plastic wrap around
154 Storing Forages and Forage Products
the circumference prevents moisture that has penetrated into the bales from escaping.Consequently, considerable moisture collects in the bottom of wrapped bales, resultingin deterioration of hay and dry-matter losses.
Dry-matter and quality losses occur during the storage of hay in the field and inbuildings.The losses are dependent on the moisture content of the hay entering thestorage, and the environmental conditions surrounding the hay. Under normal conditions,loose and baled hay below 30% to 35% moisture content lose very little dry matter due torespiration during storage. Molds or fungi are only active in storage when the relativehumidity of the air in the interstitial spaces exceeds about 70%, and the temperature issufficiently high. Bacteria require a relative humidity of at least 95% to grow. Theequilibrium moisture content of hay at 70% relative humidity is about 18%. In temperateregions in North America and Europe, hay, particularly with baled crops, can be storedin the field at a moisture content of 20% to 25% without molding for several months dueto a combination of temperature, which for a greater part of the storage period is lowerthan 20◦C, and storage conditions that allow free air circulation.
The higher the relative humidity, the moisture content of the hay, and the ambienttemperature in the storage, the greater are the dry-matter and nutrient losses. For properlyfield-cured and barn-dried hay, the moisture content of the hay is low, and even relativelyhigh humidities and temperatures are unlikely to cause the growth of molds and bacteria.
Chemical additives such as organic phosphate compounds and propionic acid causea reduction of 5% to 25% in dry-matter and nutrient losses, and an increase in the dryingrate and the suppression of respiration and of mold growth during field and barn storage ofhay. The chemical additives are used primarily to suppress respiration and mold growthduring storage but have the additional benefit of allowing the hay to be baled at a highermoisture content (up to 35%). A reduction in the dry matter loss of 600 kg/ha has beenrecorded by using propionic and acetic acids and ammonium buyrate.
As discussed previously, hay can be baled at a moisture content of 35% to 40% if it isto be dried by continuous ventilation with heated or unheated air. Intermittent ventilationis applied during subsequent storage. If the exhaust air temperature is not greater than theinlet air temperature when ventilation is applied during storage (1 to 2 d after drying),then the stack is sufficiently dry for safe storage. If the exhaust temperature is higherthan inlet temperature, ventilation should be supplied for a reasonable length of time(1 to 3 d) to remove the hot spots in the hay.
5.6 Storage of Alfalfa Pellets
Cubes and pellets at moisture contents of 7% to 10% are susceptible to moistureabsorption if exposed to humid conditions during transportation to and storage at exportdestinations. The process of moisture absorption by agricultural materials often resultsin the loss of quality. The rate at which the quality change occurs in stored products isdependent on the affinity of a material for moisture and on the ambient conditions.
Mold, yeast, and bacterial and other microbial activities increase rapidly at relativehumidities above 70%. Nutrients in stored products are utilized by microorganisms for

Storage of Alfalfa Pellets 155
respiratory purposes. The heat of sorption can be an indicator of the product’s affinityfor moisture.
Alfalfa pellets and cubes initially at 7% to 10% moisture content can absorb up to 6%to 8% moisture when stored at 70% to 90% relative humidity and 10◦C to 40◦C. Thisis typical of the conditions existing in the Pacific regions that import alfalfa pellets andcubes. Moisture absorption also occurs when a temperature difference exists betweenthe storage silo (and transit container) and the surroundings. A volume increase of 20%may result if pellets and cubes absorb about 6% to 8% of moisture. This has obviousimplications for the economics of handling and storage of pellets and cubes since thepotential expansion and moisture uptake of pellets and cubes affects the design of storagesilos and transit containers. Also, the storability of pellets and cubes at 14% to 18%moisture content is limited.
Forage products have a higher affinity for moisture sorption than cereal grains, and thusmore stringent measures than presently used for the commercial handling and storage ofgrains should be taken to prevent moisture sorption by forage pellets, cubes, and wafers.
Headly published a set of moisture content and relative humidity of dehydrated alfalfapellets (6 mm diameter). Table 5.6 shows that at 21◦C and rh of 76% the pellets are at14% m.c. which may be considered a safe moisture content for storage. When the rhincreases to 80% at the same temperature, the moisture content of the pellets increasesto 16%. The equilibrium moisture content of pellets were higher at cooler temperatures.
Headly [9] also investigated the moisture uptake by pellets in a humid environmentand the resulting increase in the volume of the pellets. Table 5.7 shows the percentexpansion of dehydrated .025-in pellets initially at 7% to 9% moisture content. Thestorage temperature for these pellets was 11◦C. The original graph presented by Headlyindicated that stored at 58% and 75% relative humidity, pellets approached the maximumexpansion after 2 weeks. The percent expansion at relative humidity of 93% after 2 weekswas within 90% of the asymptote value.
Headly investigated the effect of storing pellets at high humidity and the developmentof mold on the pellets. He observed that storing pellets with 7% to 9% moisture contentin relative humidity greater than 75% and temperature of 11◦C resulted in moldiness.
Table 5.6. Equilibrium moisture content and relative humidityof dehydrated alfalfa pellets
Temp, ◦C11 r.h., % 25.0 40.0 58.0 75.0 82.0 93.0
m.c., % 6.9 7.5 14.1 17.3 20.4 25.7
21 r.h., % 23.0 35.0 55.0 76.0 80.0m.c.,% 6.8 7.1 12.0 14.3 16.3
32 r.h., % 22.0 32.0 51.0 76.0m.c., % 5.9 8.8 12.0 14.2
Source: [9]

156 Storing Forages and Forage Products
Table 5.7. Volume expansion of the dehydrated alfalfa pelletsstored in 11◦C environment
Volume Expansion (%)
Relative Humidity (%) 1-Week Storage 3-Week Storage
93 16 3075 5 1058 5 6
Note. Initial moisture content of pellets 7%–9%Source: [9]
Figure 5.3. Conditions for safe storage of pellets initially at7% to 9% m.c. The criteria is mold.
Figure 5.3 shows that regardless of the temperature, when pellets are stored at relativehumidities less than 75%, the probability of mold growth is nil. In the same study,Headly [9] performed a limited number of durability tests on pellets stored in differentenvironments. The data showed that storing at relative humidity between 55% to 75%produced most durable pellets. Pellets stored at higher or lower relative humidities wereless durable and thus broke more easily.
5.7 Storage of Loose Hay
Unlike for dense hay, generally extensive research work has been conducted on theequilibrium moisture content of loose hay, particularly alfalfa. Early data provided byZink [10] and Dexter et al. [11] have been used extensively. Table 5.8 is a summary ofthe combined data from these researchers showing that, on the average, the equilibriummoisture content of the second-cut hay is less than that of the first cut. The second-cut hay has more stems than the first cut and thus is less hygroscopic. The first-cuthay is more leafy than the second cut and contains more protein. Proteins not only ab-sorb moisture readily but also degrade easily. An interesting feature of the equilibriummoisture-content data as shown in Table 5.8 is the sudden increase in moisture content

Tabl
e5.
8.E
quili
briu
mm
oist
ure
cont
ent
for
the
alfa
lfa
hay
at22
◦ C
Moi
stur
eC
onta
nt(%
)
20%
Rel
ativ
e40
%R
elat
ive
50%
Rel
ativ
e60
%R
elat
ive
70%
Rel
ativ
e80
%R
elat
ive
90%
Rel
ativ
eH
umid
ity
Hum
idit
yH
umid
ity
Hum
idit
yH
umid
ity
Hum
idit
yH
umid
ity
Firs
tcut
(dri
ed)
10.2
11.7
11.0
12.0
16.0
17.8
20.7
a
Seco
ndcu
t(dr
ied)
5.7
8.5
9.0
10.6
15.0
14.9
18.4
a
Fres
hcu
t(un
drie
d)7.
49.
810
.612
.815
.718
.6a
36.8
b
Fres
hcu
t(dr
ied)
6.4
9.4
—13
.3—
19.0
a23
.5b
Stem
s(d
ried
)—
—9.
4—
12.5
15.8
21.7
a
Leav
es(d
ried
)—
—10
.4—
13.8
17.5
24.8
a
aM
oldy
.b
Ver
ym
oldy
.
157
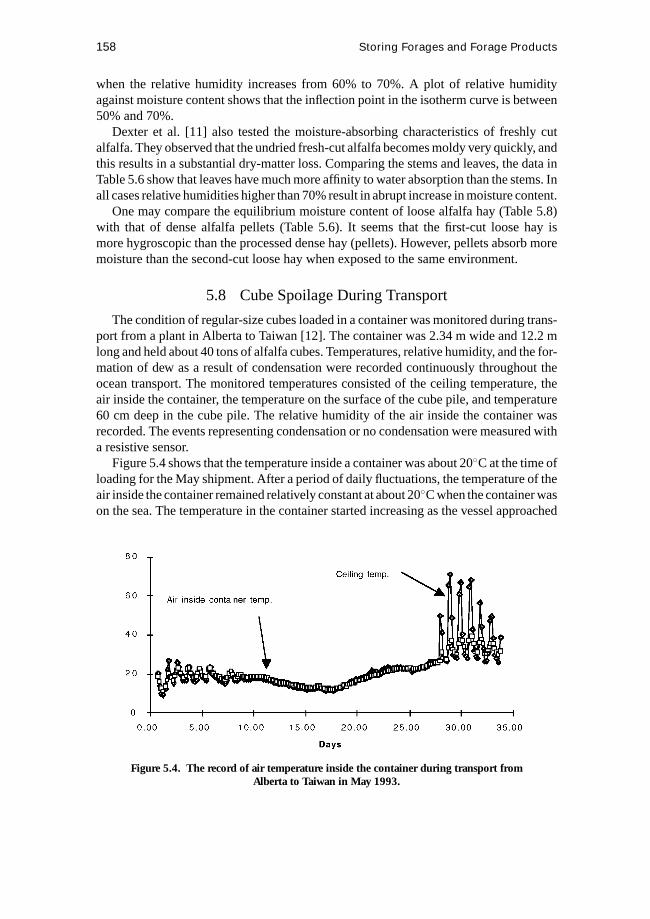
158 Storing Forages and Forage Products
when the relative humidity increases from 60% to 70%. A plot of relative humidityagainst moisture content shows that the inflection point in the isotherm curve is between50% and 70%.
Dexter et al. [11] also tested the moisture-absorbing characteristics of freshly cutalfalfa. They observed that the undried fresh-cut alfalfa becomes moldy very quickly, andthis results in a substantial dry-matter loss. Comparing the stems and leaves, the data inTable 5.6 show that leaves have much more affinity to water absorption than the stems. Inall cases relative humidities higher than 70% result in abrupt increase in moisture content.
One may compare the equilibrium moisture content of loose alfalfa hay (Table 5.8)with that of dense alfalfa pellets (Table 5.6). It seems that the first-cut loose hay ismore hygroscopic than the processed dense hay (pellets). However, pellets absorb moremoisture than the second-cut loose hay when exposed to the same environment.
5.8 Cube Spoilage During Transport
The condition of regular-size cubes loaded in a container was monitored during trans-port from a plant in Alberta to Taiwan [12]. The container was 2.34 m wide and 12.2 mlong and held about 40 tons of alfalfa cubes. Temperatures, relative humidity, and the for-mation of dew as a result of condensation were recorded continuously throughout theocean transport. The monitored temperatures consisted of the ceiling temperature, theair inside the container, the temperature on the surface of the cube pile, and temperature60 cm deep in the cube pile. The relative humidity of the air inside the container wasrecorded. The events representing condensation or no condensation were measured witha resistive sensor.
Figure 5.4 shows that the temperature inside a container was about 20◦C at the time ofloading for the May shipment. After a period of daily fluctuations, the temperature of theair inside the container remained relatively constant at about 20◦C when the container wason the sea. The temperature in the container started increasing as the vessel approached
Figure 5.4. The record of air temperature inside the container during transport fromAlberta to Taiwan in May 1993.

Cube Spoilage During Transport 159
its destination. Temperature fluctuations were again observed when the container wasunloaded at the port of destination. The container ceiling temperature reached as highas 60◦C during the day and dropped as low as 20◦C during the night at the port ofdestination.
The data for a July shipment is summarized in Table 5.9. Roof temperature reached ahigh of 32.2◦C while in transit. The cube temperature at the 60-cm depth in the pile did notfluctuate rapidly but gradually increased from 19.4◦C to 26.9◦C at the port of destination.Maximum relative humidity was attained at minimum temperature. In Canada, when thetemperature was high (30.0◦C), the humidity in the room was low (63%). Conversely,when the temperature was low (18.1◦C) the relative humidity was high (86%). Theseconditions are not conducive to mold growth. At the destination, however, the minimumtemperature of 27◦C was observed at a high relative humidity of 79%, which accordingto Fig. 5.3 could provide an ideal environment for mold growth.
During the transit the temperature of the cube remained low (about 17.8◦C), andconsequently the mold development was minimal. The temperature of cubes 60 mmdeep remained relatively low, and thus the cubes at this depth remained mold-free forthe greater part of the journey. The temperature of the cubes at 60 cm rose to about 27◦Cwhile in transit near the destination, and this condition is conducive to mold development.
Data on condensation showed that condensation on the ceiling of the container started7 days after loading, and the water droplets remained on the ceiling during the entire trip.It is assumed that the humidity sensor functioned properly. The condensation data onthe cube surface indicated that condensation occurred almost daily after loading the con-tainer. However, the condensation disappeared during the ocean trip. The condensationcycle reappeared when the load arrived at the port of destination.
Figure 5.5 is a plot of temperature versus corresponding relative humidity inside thecontainer. The safe temperature and relative humidity can be superimposed on this chart
Figure 5.5. Relative humidity of the air inside the container and temperature of the airinside the container for the July shipment.
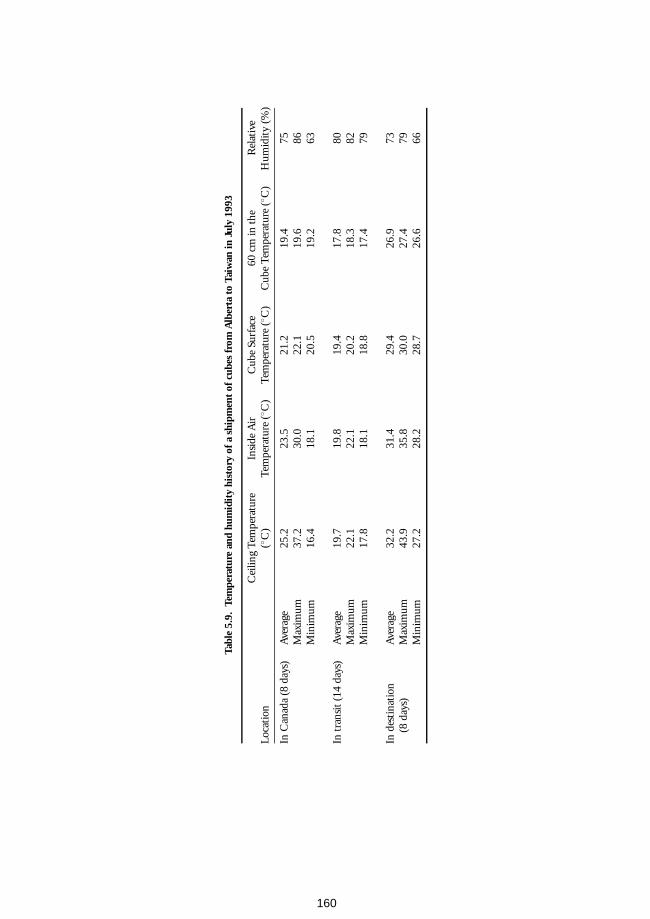
Tabl
e5.
9.Te
mpe
ratu
rean
dhu
mid
ity
hist
ory
ofa
ship
men
tof
cube
sfr
omA
lber
tato
Taiw
anin
July
1993
Cei
ling
Tem
pera
ture
Insi
deA
irC
ube
Surf
ace
60cm
inth
eR
elat
ive
Loca
tion
(◦ C)
Tem
pera
ture
(◦ C)
Tem
pera
ture
(◦ C)
Cub
eTe
mpe
ratu
re(◦ C
)H
umid
ity
(%)
InC
anad
a(8
days
)A
vera
ge25
.223
.521
.219
.475
Max
imum
37.2
30.0
22.1
19.6
86M
inim
um16
.418
.120
.519
.263
Intr
ansi
t(14
days
)A
vera
ge19
.719
.819
.417
.880
Max
imum
22.1
22.1
20.2
18.3
82M
inim
um17
.818
.118
.817
.479
Inde
stin
atio
nA
vera
ge32
.231
.429
.426
.973
(8da
ys)
Max
imum
43.9
35.8
30.0
27.4
79M
inim
um27
.228
.228
.726
.666
160

Cube Spoilage During Transport 161
to show the potential for cube spoilage during transport. This graph indicates that theincidence of the unfavorable storage conditions was primarily during shipment.
References
1. Arinze, E. A., Sokhansanj, S., and Schoenau, G. J. 1993. Simulation of naturaland solar-heated air hay drying system.Computers and Electronics in Agriculture8:325–345.
2. Sokhansanj, S., Arinze, E. A., and Schoenau, G. J. 1993.Forage drying and storage.In Handbook of Crop Drying and Storage(ed. Bakker-Arkema and Maier). In pressto be published by Marcel Decker. (Copies of the chapter are available at the De-partment of Agricultural and Bioresource Engineering University of SaskatchewanSaskatoon, SK S7N 5A9 Canada)
3. Church, D. C. 1991.Livestock Feeds and Feeding. Toronto: Prentice-Hall Canada.4. Bruhn, J. C., and Oliver, J. C. 1978. Effect of storage on tocopherol and carotene
concentration in alfalfa hay.Journal of Dairy Science61:980–982.5. Buckmaster, D. R., Rotz, C. A., and Martens, D. R. 1989. A model of alfalfa hay
storage.Transactions of the ASAE32:30–36.6. Rider, A. O., Bachhelder, D., and McMurphy, W. 1979. Effects of long term storage
on round bales. ASAE Paper no. 79-1538. St. Joseph, MI: ASAE.7. Hesslop, L. C., and Bilanski, W. K. 1986. Economic benefit of weather protection
for large round bales.Canadian Agricultural Engineering28(2):131–135.8. Schodt, R. 1989. Wrapped round bales store no better than unprotected bales.
PAMI Notes. Prairie Agricultural Machinery Institute, Portage, Laprairie, Manitoba(1-800-567-PAMI).
9. Headly, V. E. 1969. Equilibrium moisture content of some pelleted feeds and itseffect on pellet durability index.Transactions of the ASAE12(1):9–12.
10. Zink, F. J. 1935. Equilibrium moistures of some hay.Agricultural Engineering16:451–452.
11. Dexter, S. T., Sheldon, W. H., and Waldron, D. I. 1947. Equilibrium moisture contentof alfalfa hay.Agricultural Engineering. 28(7):295–296.
12. Sokhansanj, S. M. H., Khoshteghaza, W. J., Crerar, E. Z., Jan, A., McNeil and A.,Penner. 1996. Moisture migration in containerized alfalfa cubes during overseasshipment. Special report, Dept. of Agric. & Bioresource Eng. Univ. SaskatchewanSaskatoon, Canada, 57 p.
13. Chaplin, R. V., and R. M., Tetlow. 1971. Storage of dried grass wafers: moisture rela-tionship, safe storage periods and changes in durability.Journal of Stored ProductsResearch7:171–180.

162

6Waste Managementand Recycling ofOrganic Matter
6.1 Waste Management
David Moffitt
Manure management is a critical concern in many parts of the world where theexpanding livestock and poultry industry is concentrating. In past literature manure andrelated animal-production residues often have been referred to or classified as “waste.” Inthis presentation, the term waste is replaced bymanureandresiduesas much as possiblein an effort to maintain the concept that manure is a resource to be used rather than aproduct to be wasted.
Much of the discussion that follows was adapted from the United States Department ofAgriculture, Natural Resources Conservation Service’s Agricultural Waste ManagementField Handbook [1], to which the author was a major contributor.
6.1.1 Effects of Manure on the Water Resource
This section focuses on the effects that agricultural manure can have on water, air, andanimal resources. Special emphasis is placed on the reactions of particular contaminantswithin the aquatic environment (how they change and how they affect aquatic life andhuman health).
Animal manure contains a number of contaminants that can adversely affect surfaceand ground water. In addition, certain constituents in manure can impact grazing animals,harm terrestrial plants, and impair air quality. However, where manure is applied toagricultural land at acceptable rates, crops can receive adequate nutrients without theaddition of commercial fertilizer. In addition, soil erosion can be substantially reducedand the water-holding capacity of the soil can be improved if organic matter from animalmanure is incorporated into the soil.
The principal constituents of animal manure that impact surface and ground water areorganic matter, nutrients, and fecal bacteria. Manure may also increase the amount ofsuspended material in the water and affect the color either directly through the manureitself or indirectly through the production of algae. Indirect effects on surface water canalso occur if sediment enters streams from feedlots or overgrazed pastures and fromeroded streambanks at unprotected cattle crossings. The impact that these contaminants
163

164 Waste Management and Recycling of Organic Matter
have on the aquatic environment is related to the amount and type of each pollutantentering the system and the characteristics of the receiving water.
All organic matter contains carbon in combination with one or more other elements.All substances of animal or vegetable origin contain carbon compounds and are, there-fore, organic.
When plants and animals die, they begin to decay. The decay process is simplyvarious naturally occurring microorganisms converting the organic matter—the plantand body tissue—to simpler compounds. Some of these simpler compounds may beother forms of organic matter or they may be nonorganic compounds, such as nitrateand orthophosphate, or gases, such as nitrogen gas (N2), ammonia (NH3), and hydrogensulfide (H2S).
In a natural environment the breakdown of organic matter is a function of complex,interrelated, and mixed biological populations. However, the organisms principally re-sponsible for the decomposition process are bacteria. The size of the bacterial communitydepends on its food supply and other environmental factors including temperature andpH. Theoretically, the bacterial population doubles with each simultaneous division ofthe individual bacteria; thus, one divides to become two, two becomes four, four becomeseight, and so forth. The generation time, or the time required for each division, may varyfrom a few days to less than 30 minutes. One bacterium with a 30-minute generationtime could yield 16,777,216 new bacteria in just 12 hours.
The principal nutrients of concern in the aquatic environment are nitrogen and phos-phorus. An understanding of how these nutrients react in the environment is importantto understanding the control processes discussed in subsequent sections.
Nitrogen occurs throughout the environment—in the soil, water, and surrounding air.In fact, 78% of the air we breathe is nitrogen. It is also a part of all living organisms.When plants and animals die or when manure products are excreted, nitrogen returns tothe environment and is cycled back to the land, water, and air and eventually back toother plants and animals.
Figure 6.1 depicts the nitrogen cycle. It shows the flow from one form of nitro-gen to another. The various forms of nitrogen can have different effects on our naturalresources—some good and some bad. The conversion from one form of nitrogen to an-other is usually the result of bacterial processes. Some conversions require the presence ofoxygen (aerobic systems), while others require no oxygen (anaerobic systems). Moisturecontent of the manure or soil, temperature, and pH speed or impede conversions.
In water-quality analyses, total nitrogen includes the organic, total ammonia (NH3 +NH4), nitrite (NO2), and nitrate (NO3) forms. Total Kjeldahl nitrogen includes the totalorganic and total ammonia nitrogen. The ammonia, nitrite, and nitrate forms of nitrogenmay be expressed in terms of the concentration of N (NO3-N or NH4-N) or in terms ofthe concentration of the particular ion or molecule (NO3 or NH4). Thus, 45 mg/L of NO3is equivalent to 10 mg/L of NO3-N.
Nitrogen in fresh manure is mostly in the organic form (60%–80% of total N). Inan anaerobic lagoon, the organic fraction is typically 20% to 30% of total N. Organicnitrogen in the solid fraction (feces) of most animal manure is usually in the form ofcomplex molecules associated with digested food, while that in the liquid fraction is inthe form of urea.

Waste Management 165
Figure 6.1. The nitrogen cycle.
Ammonium nitrogen is relatively immobile in the soil. The positively charged NH4
tends to attach to the negatively charged clay particles and generally remains in placeuntil converted to other forms.
Nitrite is normally a transitory phase in the nitrification and denitrification processes.Very little NO2 is normally detected in the soil or in most natural waters.
The nitrate form of nitrogen is the end product of the nitrification process (the conver-sion of N from the ammonia form to nitrite and then to nitrate under aerobic conditions).The nitrate form of N is soluble in water and is readily used by plants.
The United States Environmental Protection Agency [2] established a criterion of10 mg/L of NO3-N for drinking water because of the health hazard that nitrites present forpregnant women and infants. Unborn babies and infants can contract methemoglobine-mia, or “blue-baby syndrome”, from ingesting water contaminated with nitrates. Inextreme cases, this can be fatal. Blue-baby syndrome generally effects only infantswho are less than 6 months old. The disease develops when nitrate is converted to

166 Waste Management and Recycling of Organic Matter
Figure 6.2. Phosphorus inputs and losses at a waste-application site and phosphorus transformationwithin the soil profile (abbreviated phosphorus cycle).
nitrite in the alkaline environment of the baby’s stomach. The nitrite then enters thebloodstream and interacts with the hemoglobin, converting it to methemoglobin[3–5].
Phosphorus is one of the major nutrients needed for plant growth, whether the plant isterrestrial or aquatic. Because phosphorus is used extensively in agriculture, the potentialfor pollution from this source is high. Water samples are often analyzed for only totalphosphorus; however, total phosphorus can include organic, soluble, or “bound” forms.An understanding of the relationship among these forms is important to understandingthe extent to which phosphorus can move within the environment and the methods for itscontrol. Figure 6.2 depicts the relationship between the phosphorus forms and illustratesways that phosphorus can be lost from manure application sites.
Organic phosphorus is a part of all living organisms, including microbial tissue andplant residue, and it is the principal form of P in the metabolic byproducts (manures)of most animals. About 73% of the phosphorus in the fresh manure of various types oflivestock is in the organic form.
Soluble phosphorus (also calledavailable or dissolvedP) is the form used by allplants. It is also the form that is subject to leaching. The soluble form generally accountsfor less than 15% of the total phosphorus in most soils.
Waste Management 167
Attached or mineral phosphorus includes those compounds that are formed when theanionic (negatively charged) forms of dissolved P become attached to cations, such asiron, aluminum, and calcium. Attached phosphorus includes labile, or loosely bound,forms and those that are “fixed,” or tightly adsorbed, on or within individual soil particles.It should be noted that the P that is loosely bound to the soil particles (labile P) remainsin equilibrium with the soluble P. Thus, when the concentration of soluble P is reducedbecause of the removal by plants, some of the labile P is converted to the soluble formto maintain the equilibrium.
A number of factors determine the extent to which phosphorus moves to surface orground water. Nearly all of these factors relate to the form and chemical nature of thephosphorus compounds. Some of the principal factors affecting movement of P to surfaceand ground waters are: degree of contact with the soil, soil pH, soil texture, and amountof manure applied. Other factors are the presence of erosion-control measures, degreeof phosphorus retention in soils, and the presence or absence of aerobic conditions.
The Environmental Protection Agency [6] reported the following regarding phospho-rus in natural water:• High phosphorus concentrations are associated with accelerated eutrophication of
water, if other growth-promoting factors are present.• Aquatic plant problems develop in reservoirs and other standing water at phosphorus
values lower than those critical in flowing streams.• Reservoirs and lakes collect phosphates from influent streams and store part of them
within consolidated sediment, thus serving as phosphate sinks.• Phosphorus concentrations critical to noxious plant growth vary, and nuisance
growths may result from a particular concentration of phosphate in one geographicarea, but not in another.
The excreta from warm-blooded animals have countless microorganisms, including bac-teria, viruses, parasites, and fungi. Some of the organisms are pathogenic (disease-causing), and many of the diseases carried by animals are transmittable to humans, andvice versa. Table 6.1 lists some of the diseases and parasites transmittable to humansfrom animal manure.
One indicator organism used widely to check for the presence of pathogens is a familyof bacteria known as the coliforms. The whole group of coliforms is associated with boththe feces of warm-blooded animals and with soils. However, the fecal coliform grouprepresents a part of the total coliforms and is easily differentiated from the total coliformsduring testing. A positive test for fecal coliform bacteria is a clear indication that pollutionfrom warm-blooded animals exists. A high count indicates a greater probability thatpathogenic organisms are present.
6.1.2 Effects of Manure on the Air Resource
Livestock-production facilities can be the source of gases, aerosols, vapors, and dustthat, individually or in combination, can create such air quality problems as nuisanceodors, health problems for animals in confined housing units, “greenhouse” effect [7],corrosion of materials, and the generation of deadly gases that can affect animals andhumans.
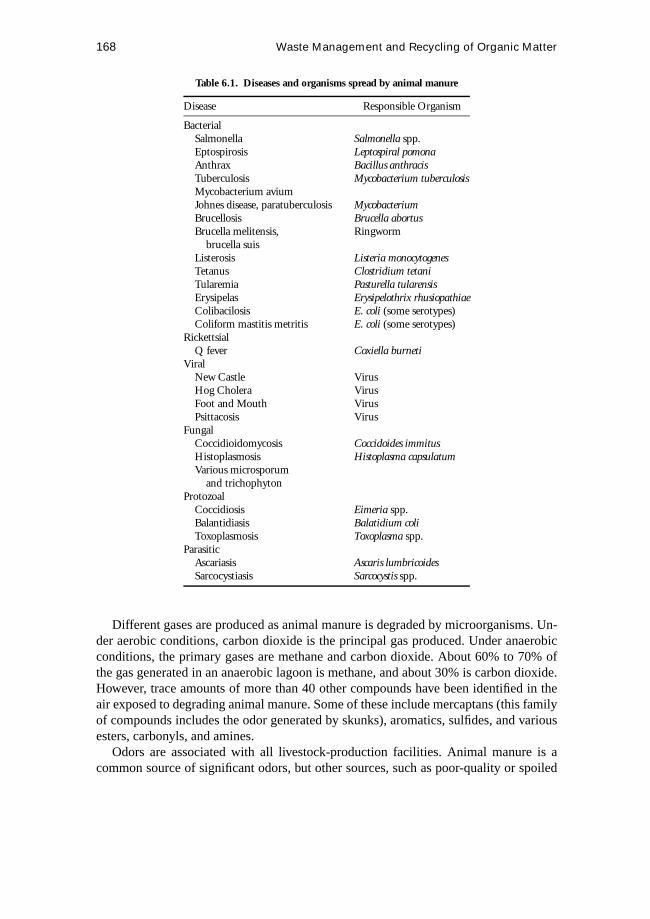
168 Waste Management and Recycling of Organic Matter
Table 6.1. Diseases and organisms spread by animal manure
Disease Responsible Organism
BacterialSalmonella Salmonella spp.Eptospirosis Leptospiral pomonaAnthrax Bacillus anthracisTuberculosis Mycobacterium tuberculosisMycobacterium aviumJohnes disease, paratuberculosis MycobacteriumBrucellosis Brucella abortusBrucella melitensis, Ringworm
brucella suisListerosis Listeria monocytogenesTetanus Clostridium tetaniTularemia Pasturella tularensisErysipelas Erysipelothrix rhusiopathiaeColibacilosis E. coli (some serotypes)Coliform mastitis metritis E. coli (some serotypes)
RickettsialQ fever Coxiella burneti
ViralNew Castle VirusHog Cholera VirusFoot and Mouth VirusPsittacosis Virus
FungalCoccidioidomycosis Coccidoides immitusHistoplasmosis Histoplasma capsulatumVarious microsporum
and trichophytonProtozoal
Coccidiosis Eimeria spp.Balantidiasis Balatidium coliToxoplasmosis Toxoplasma spp.
ParasiticAscariasis Ascaris lumbricoidesSarcocystiasis Sarcocystis spp.
Different gases are produced as animal manure is degraded by microorganisms. Un-der aerobic conditions, carbon dioxide is the principal gas produced. Under anaerobicconditions, the primary gases are methane and carbon dioxide. About 60% to 70% ofthe gas generated in an anaerobic lagoon is methane, and about 30% is carbon dioxide.However, trace amounts of more than 40 other compounds have been identified in theair exposed to degrading animal manure. Some of these include mercaptans (this familyof compounds includes the odor generated by skunks), aromatics, sulfides, and variousesters, carbonyls, and amines.
Odors are associated with all livestock-production facilities. Animal manure is acommon source of significant odors, but other sources, such as poor-quality or spoiled

Waste Management 169
Table 6.2. Properties and physiological effects of the most important gases produced from manure
Lighter thanGas Air Odor Class Comments
Ammonia Yes Sharp, pungent Irritant Irritation of eyes and throat at lowconcentrations; asphyxiating, couldbe fatal at high concentrationswith 30- to 40-min exposure
Carbon dioxide No None Asphyxiant < 20,000 mg/L = safe level;increased breathing, drowsiness,and headaches as concentrationincreases; could be fatal at300,000 mg/L for 30 min
Hydrogen sulfide No Rotten eggs Poison Headaches, dizziness at 200 mg/L for60 min; nausea, excitement,insomnia at 500 mg/L for 30 min;unconsciousness, death at1000 mg/L
Methane Yes None Asphyxiant, Headaches at 500,000 mg/Lflammable
feed and dead animals, can also be at fault. Freshly voided manure is seldom a cause ofobjectionable odor, but manure that accumulates or is stored under anaerobic conditionsdoes develop unpleasant odors. Such manures can cause complaints at the productionfacility when the manure is removed from storage or when it is spread on the fields.Manure-covered animals and ventilation air exhausted from production facilities can alsobe significant sources of odor. The best insurance against undesirable odor emissionsis manure management practices that quickly and thoroughly remove manures fromproduction facilities and place them in treatment or storage facilities or apply themdirectly to the soil [8].
The gases of most interest and concern in manure management are methane (CH4),carbon dioxide (CO2), ammonia (NH3), and hydrogen sulfide (H2S). Table 6.2 providesa summary of the most significant characteristics of ammonia, carbon dioxide, hydrogensulfide, and methane.
MethaneWhen manure is digested under anaerobic conditions, microbial fermentation pro-
duces methane. Methane is flammable, and in recent decades interest in using it as asource of energy on the farm has increased. Because methane is also explosive, ex-treme care is required when attempting to generate and capture this gas for on-farmuse.
The emissions of methane from manure are driven by the quantity of manure produced,how it is handled, and the temperature. Emissions vary from system to system andthroughout the year. In the United States, approximately 10% of the anthropogenicemissions of methane come from livestock manure, with swine and dairy accounting for80% of the emissions [7].
170 Waste Management and Recycling of Organic Matter
Carbon DioxideCarbon dioxide can be an asphyxiant if it displaces normal air in a confined facility.
Because CO2 is heavier than air, it remains in a tank or other well-sealed structure,gradually displacing the lighter gases.
AmmoniaAmmonia is primarily an irritant and has been known to create health problems in
animals in confinement buildings. Irritation of the eyes and respiratory tract are commonproblems from prolonged exposure to this gas. It is also associated with soil-acidificationprocesses.
Hydrogen SulfideHydrogen sulfide is deadly. Humans and farm animals have been killed by this gas
after falling into or entering a manure tank or being in a building in which a manuretank was being agitated. Although only small amounts of hydrogen sulfide are producedin a manure tank compared with the other major gases, this gas is heavier than air andbecomes more concentrated in the tank over time.
When tanks are agitated in preparation for pump-out, hydrogen sulfide can be releasedto the area overhead. If a tank is located beneath the animals in a building, forced-airventilation in the building is imperative before operating the agitation equipment. Anexhaust system should also be provided within the tank during agitation and pumping.
Hydrogen sulfide has the distinct odor of rotten eggs. At the first hint of this odor,the area around the tank should be immediately evacuated of all humans. H2S deadensthe olfactory nerves (the sense of smell); therefore, if the smell of rotten eggs appears tohave disappeared, this does not indicate that the area is not still contaminated with thishighly poisonous gas.
A person should never enter a manure-storage tank even to help rescue someone elsewho has succumbed to the hydrogen sulfide. Several lives have been lost attemptingsuch rescues. If a tank must be entered, the air in the tank should first be evacuatedusing a forced-air ventilation system. Self-contained breathing apparatus, safety lines,and sufficient personnel to man the lines are needed in all cases. A mechanical hoistingdevice is preferable.
6.1.3 Effects of Manure on the Animal Resource
Grazing animals can be adversely affected if animal manure is applied to forage cropsat an excessive rate [9]. Studies indicate that grass tetany, fescue toxicity, agalactia, and fatnecrosis appear to be associated, in part, with high rates of fertilization from poultry litteron cool-season grasses (especially fescue). Highlights of these disease problems are pro-vided in subsequent sections. Additional details on the clinical signs of these diseases andmethods to reverse or prevent their occurrence should be discussed with a veterinarian.
6.1.4 Manure Characteristics
Manure and other livestock and poultry production residue described in this sectionare of an organic nature and agricultural origin. Some other residues of nonagricultural

Waste Management 171
origin that may be managed within the agricultural sector are not included. Informationand data presented can be used for planning and designing manure-management systemsand system components and for selecting manure-handling equipment.
In most cases a single value is presented for a specific manure characteristic. Thisvalue is presented as a reasonable value for facility design and equipment selection forsituations in which site-specific data are not available. Manure characteristics are subjectto wide variation; both greater and lesser values than those presented can be expected.Therefore, much attention is given in this section to describing the reasons for datavariation and to giving planners and designers a basis for seeking and establishing moreappropriate values if justified by the situation [10].
Onsite manure sampling, testing, and data collection are valuable assets in manure-management system planning and design and should be used if possible [11]. Suchsampling can result in greater certainty and confidence in the system design and ineconomic benefit to the owner. However, caution must be exercised to assure that rep-resentative data and samples are collected. Characteristics of “as excreted” manure aregreatly influenced by the effects of weather, season, species, diet, degree of confinement,and stage of the production/reproduction cycle. Characteristics of stored and treated ma-nures are strongly affected by such actions as sedimentation, floatation, and biologicaldegradation in storage and treatment facilities.
Definitions of Manure Characterization TermsTable 6.3 gives definitions and descriptions of manure-characterization terms. It in-
cludes abbreviations, definitions, units of measurement, methods of measurement, andother considerations for the physical and chemical properties of manure and residue.
Manures are often given descriptive names that reflect their moisture content, suchas liquid, slurry, semi-solid and solid. Manures that have a moisture content of 95% ormore exhibit qualities very much like water and are calledliquid manure. Manures thathave moisture content of about 75% or less exhibit the properties of a solid and can bestacked and hold a definite angle of repose. They are calledsolid manure. Manures thathave between about 75% and 95% moisture content—25% and 5% solids—aresemi-liquid (slurry) or semi-solid. Because manures are heterogeneous and inconsistent intheir physical properties, the moisture content and ranges indicated must be consideredgeneralizations subject to variation and interpretation.
The termsmanure, wastes, andlivestockandpoultry production residuesare some-times used synonymously. In this section manure refers to combinations of feces andurine, and livestock and poultry production residues include manure plus other material,such as bedding, soil, spilled feed, and water that is spilled or used for sanitary andflushing purposes. Small amounts of spilled feed, water, dust, hair, and feathers are un-avoidably added to manure and are undetectable in the production facility. These smalladditions must be considered to be a part of manure and a part of the “as excreted”characteristics presented. Litter is a specific form of poultry manure that results from“floor” production of birds after an initial layer of a bedding material, such as woodshavings, is placed on the floor at the beginning of and perhaps during the productioncycle.

Tabl
e6.
3.D
efini
tion
san
dde
scri
ptio
nsof
man
ure
char
acte
riza
tion
term
s
Uni
tsof
Term
Abb
revi
atio
nM
easu
reD
efini
tion
Met
hod
ofM
easu
rem
ent
Rem
arks
Wei
ght(
mas
s)W
t.kg
Qua
ntit
yor
mas
sSc
ale
orba
lanc
eV
olum
eV
ol.
m3,L
Spac
eoc
cupi
edin
Plac
ein
orco
mpa
reto
cubi
cun
its
cont
aine
rof
know
nvo
lum
e;ca
lcul
ate
from
dim
ensi
ons
ofco
ntai
nmen
tfac
ility
Moi
stur
eco
nten
tM
C%
Tha
tpar
tofa
man
ure
Evap
orat
efr
eew
ater
onst
eam
Moi
stur
eco
nten
t(%
)m
ater
ialr
emov
edby
tabl
ean
ddr
yin
oven
at10
3◦ Cpl
usto
tals
olid
s(%
)ev
apor
atio
nan
dov
enfo
r24
hor
unti
lcon
stan
teq
uals
100%
dryi
ngat
217◦ F
(103
◦ C)
wei
ght
Tota
lsol
ids
TS
%,%
w.b
.,%
d.w
.R
esid
uere
mai
ning
afte
rEv
apor
ate
free
wat
eron
stea
mTo
talo
fvol
atile
and
wat
eris
rem
oved
from
tabl
ean
ddr
yin
oven
at10
3◦ Cfix
edso
lids;
tota
lof
man
ure
mat
eria
lby
for
24h
orun
tilc
onst
ant
susp
ende
dan
dev
apor
atio
ndr
ym
atte
rw
eigh
tdi
ssol
ved
solid
sV
olat
ileso
lids
VS,
TV
S,%
d.w
.%
,%w
.b.
Tha
tpar
toft
otal
solid
sPl
ace
tota
lsol
ids
resi
due
infu
rnac
eV
olat
ileso
lids
dete
rmin
eddr
iven
offa
svo
lati
leat
600◦ C
for
atle
ast1
hfr
omdi
ffer
ence
ofto
tal
(com
bust
ible
)ga
ses
whe
nan
dfix
edso
lids
heat
edto
1112
◦ F(6
00◦ C
);or
gani
cm
atte
rFi
xed
solid
sFS
,TFS
%,%
w.b
.,%
d.w
.T
hatp
arto
ftot
also
lids
Det
erm
ine
wei
ght(
mas
s)of
Fixe
dso
lids
equa
lre
mai
ning
afte
rvo
lati
lega
ses
resi
due
afte
rvo
lati
leso
lids
have
tota
lsol
ids
min
usar
edr
iven
offa
t111
2◦ Fbe
enre
mov
edas
com
bust
ible
vola
tile
solid
s(6
00◦ C
);as
hga
ses
whe
nhe
ated
at60
0◦ Cfo
rat
leas
t1h
172

Dis
solv
edso
lids
DS,
TD
S%
%w
.b.,
%d.
w.
Tha
tpar
toft
otal
solid
sPa
ssa
mea
sure
dqu
anti
tyof
Tota
ldis
solv
edso
lids
pass
ing
thro
ugh
the
man
ure
mat
eria
lthr
ough
0.45
may
befu
rthe
rfil
ter
ina
filtr
atio
nm
icro
nfil
ter
usin
gap
prop
riat
ean
alyz
edfo
rvo
lati
lepr
oced
ure
proc
edur
e;ev
apor
ate
filtr
ate
solid
san
dfix
edan
ddr
yre
sidu
eto
cons
tant
diss
olve
dso
lids
part
sw
eigh
tat1
03◦ C
.Su
spen
ded
solid
sSS
,TSS
%,%
w.b
.,%
d.w
.T
hatp
arto
ftot
also
lids
May
bede
term
ined
bydi
ffer
ence
Tota
lsus
pend
edre
mov
edby
afil
trat
ion
betw
een
tota
lsol
ids
and
solid
sm
aybe
furt
her
proc
edur
e,di
ssol
ved
solid
san
alyz
edfo
rvo
lati
lean
dfix
edsu
spen
ded
solid
spa
rts
Not
e.%
w.b
.,pe
rcen
tmea
sure
don
aw
etba
sis;
%d.
b.,p
erce
ntm
easu
red
ona
dry
basi
s.
173
174 Waste Management and Recycling of Organic Matter
Because of the high moisture content of as-excreted manure and treated manure, theirspecific weight is very similar to that of water—1 kg/L. Some manure and residues thathave considerable solids content can have a specific weight of as much as 105% that ofwater. Some dry residues, such as litter, that have significant void space can have specificweight of much less than that of water. Assuming that wet and moist manures weigh0.96 to 1.04 kg/L is a convenient and useful estimate for planning manure-managementsystems.
Units of MeasureManure production from livestock is expressed in kilograms per day per 1000 kg of
livestock live weight (kg/d/1000 kg). Volume of manure materials is expressed in cubicmeters per day per 1000 kg of live weight (m3/d/1000 kg).
The concentration of various components in manure is commonly expressed as mil-ligrams per liter (mg/L). One milligram per liter is 1 milligram (weight) in 1 millionparts (volume); for example, 1 L. Occasionally, the concentration is expressed in per-cent. A 1% concentration equals 10,000 mg/L. Very low concentrations are sometimesexpressed as micrograms per liter (µg/L). A microgram is one millionth of a gram.
Various solid fractions of manure or residues, expressed in kilograms per day or as aconcentration, generally are measured on a wet-weight basis, a percentage of the “as is”or wet weight of the material. In some cases, however, data are recorded on a dry-weightbasis, a percentage of the dry weight of the material. The difference between these twovalues for a specific material is most likely very large. Nutrient and other chemicalfractions of a manure material, expressed as a concentration, may be on a wet-weight ordry-weight basis, or expressed as kilograms per 1000 L of manure.
Amounts of the major nutrients, nitrogen, phosphorus, and potassium are alwayspresented in terms of the nutrient itself. Only the nitrogen quantity in the ammoniumcompound NH4 is considered when expressed as ammonium nitrogen (NH4-N). Nutri-ents are discussed in more detail in the next section.
CharacteristicsWhenever locally derived values for manure characteristics are available, this in-
formation should be given preference over the more general data used in this section.Carbon-to-nitrogen ratios were established using the percent ash content (dry-weightbasis) to determine the carbon.
Daily as-excreted manure-production data are presented if possible in kilograms perday per 1000 kg livestock live weight (kg/d/1000 kg) for typical commercial animalsand birds. Units of liters per day per 1000 kg live weight (L/d/1000 kg) allow manureproduction to be calculated on a volumetric basis. Moisture content and total solids aregiven as a percentage of the total wet weight of the manure. Total solids are also givenin units of kg/d/1000 kg. Other solids data and the nutrient content of the manure arepresented in units of kilograms per day per 1000 kg on a wet-weight basis.
As-excreted manure characteristics are the most reliable data available. Manure andmanure properties resulting from other situations, such as flushed manure, feedlot manure,and poultry litter, are the result of certain “foreign” materials being added or somemanure components being lost from the as-excreted manure. Much of the variation

Waste Management 175
in livestock manure characterization data in this section and in other references resultslargely from the uncertain and unpredictable additions to and losses from the as-excretedmanure.
Livestock manure produced in confinement and semi-confinement facilities are ofprimary concern and are given the greatest consideration in this section. Manure fromunconfined animals and poultry, such as those on pasture or range, are of lesser signifi-cance because handling and distribution problems are not commonly encountered.
Foreign materials commonly added to manure in the production facility are bedding(litter), spilled feed and water, flush water, rainfall, and soil. These are often added insufficient quantities to change the basic physical and chemical characteristics of themanure. Dust, hair, and feathers are also added to manure in limited amounts. Hair andfeathers, especially, can cause clogging problems in manure-handling equipment andfacilities, although the quantities may be small. Other adulterants are various wood,glass, and plastic items and dead animals and birds.
Spilled feed has a great influence on the organic content of manure and residues. Feedconsumed by animals is 50% to 90% digested, but spilled feed is undigested. A kilogramof spilled feed results in as much manure equivalents as 2 to 10 kg of feed consumed.Small quantities, about 3%, of spilled feed are common and very difficult to see. Wastageof 5% is common and can be observed. Obvious feed wastage is indicative of 10% ormore being spilled.
Manure characteristics for lactating and dry cows and for heifers are listed in Table 6.4.These data are appropriate for herds of moderate to high milk production. Quantities ofdairy manure vary widely from small cows to large cows and between cows at low andhigh production levels. Dairy feeding systems and equipment often allow considerable
Table 6.4. Dairy manure characterization—as excreteda
Cow
Component Units Lactating Dry Heifer
Weight (Mass) kg/d/1000 kg 80.00 82.00 85.00Volume L/d/1000 kg 81 81 81Moisture % 87.50 88.40 89.30TS % on a wet basis 12.50 11.60 10.70
kg/d/1000 kg 10.00 9.50 9.14VS kg/d/1000 kg 8.50 8.10 7.77FS kg/d/1000 kg 1.50 1.40 1.37COD kg/d/1000 kg 8.90 8.50 8.30BOD5 kg/d/1000 kg 1.60 1.20 1.30N kg/d/1000 kg 0.45 0.36 0.31P kg/d/1000 kg 0.07 0.05 0.04K kg/d/1000 kg 0.26 0.23 0.24TDS 0.85C:N ratio 10 13 14
a Increase solids and nutrients by 4% for each 1% feed manure morethan 5%.

176 Waste Management and Recycling of Organic Matter
feed spillage, which in most cases is added to the manure. Feed spillage of 10% can resultin an additional 40% of total solids in a dairy manure. Dairy-cow stalls are often coveredwith bedding materials that improve animal comfort and cleanliness. Virtually all of theorganic and inorganic bedding materials used for this purpose eventually will be pushed,kicked, and carried from the stalls and added to the manure. The characteristics of thesebedding materials are imparted to the manure.
Milking centers—the milk house, milking parlor, and holding area—can produceabout 50% of the manure and residues volume, but only about 15% of the total solids ina dairy enterprise. Because this very dilute wastewater has different characteristics thanthe manure from the cow yard, it is sometimes managed by a different procedure.
About 20 to 40 L of fresh water per day for each cow milked are used in a milkingcenter in which flushing of manures is not practiced. However, if manure flush cleaningand automatic cow washing are used, water use can be 600 L/d per cow or more. Dairiesemploying flush cleaning systems use water in approximately the following percentagesfor various cleaning operations.
Parlor—cleanup and sanitation: 10%Cow washing: 30%Manure flushing: 50%Miscellaneous: 10%Table 6.5 lists characteristics of as-excreted beef manure. Beef manure of primary
concern is that from the feedlots. The characteristics of these solid manures vary widelybecause of such factors as climate, diet, feedlot surface, animal density, and cleaningfrequency. The soil in unsurfaced beef feedlots is readily incorporated with the manurebecause of the animal movement and cleaning operations. Spilled feed is an important
Table 6.5. Beef manure characterization—as excreteda
Feeder, Yearling 340 to 500 kg
High-Forage High-EnergyComponent Units Diet Diet 205 to 340 kg Cow
Weight (mass) kg/d/1000 kg 59.10 51.20 58.20 63.00Volume L/d/1000 kg 59 51 58 62Moisture % 88.40 88.40 87.00 88.40TS % on a wet 11.60 11.60 13.00 11.60
kg/d/1000 kg 6.78 5.91 7.54 7.30VS kg/d/1000 kg 6.04 5.44 6.41 6.20FS kg/d/1000 kg 0.74 0.47 1.13 1.10COD kg/d/1000 kg 6.11 5.61 6.00 6.00BOD5 kg/d/1000 kg 1.36 1.36 1.30 1.20N kg/d/1000 kg 0.31 0.30 0.30 0.33P kg/d/1000 kg 0.11 0.094 0.10 0.12K kg/d/1000 kg 0.24 0.21 0.20 0.26C:N ratio kg/d/1000 kg 11 10 12 10
a Average daily production for weight range noted. Increase solids and nutrients by 4% for each1% feed manure more than 5%.

Waste Management 177
Table 6.6. Beef manure characterization—feedlot manure
Surfaced Lotb
Unsurfaced High-Forage High-EnergyComponent Units Lota Diet Diet
Weight (mass) kg/d/1000 kg 17.50 11.70 5.30Moisture % 45.00 53.30 52.10TS % on a wet basis 55.00 46.70 47.90
kg/d/1000 kg 9.60 5.50 2.50VS kg/d/1000 kg 4.80 3.85 1.75FS kg/d/1000 kg 4.80 1.65 0.75N kg/d/1000 kg 0.21P kg/d/1000 kg 0.14K kg/d/1000 kg 0.03C:N ratio 13
a Dry climate (annual rainfall less than 60 cm); annual manure removal.b Dry climate; semiannual manure removal.
Table 6.7. Swine manure characterization—as excreteda
Sow
Component UnitsGrower
18–100 kgReplacement
Gilt Gestation Lactation Boar
Nursing/Nursery Pig
0–18 kg
Weight kg/d/1000 kg 63.40 32.80 27.20 60.00 20.50 106.00Volume L/d/1000 kg 62 33 27 60 21 106Moisture % 90.00 90.00 90.80 90. 00 90.70 90.00TS % a wet basis 10.00 10.00 9.20 10. 00 9.30 10.00
kg/d/1000 kg 6.34 3.28 2.50 6.00 1.90 10.60VS kg/d/1000 kg 5.40 2.92 2.13 5.40 1.70 8.80FS kg/d/1000 kg 0.94 0.36 0.37 0.60 0.30 1.80COD kg/d/1000 kg 6.06 3.12 2.37 5.73 1.37 9.80BOD5 kg/d/1000 kg 2.08 1.08 0.83 2.00 0.65 3.40N kg/d/1000 kg 0.42 0.24 0.19 0.47 0.15 0.60P kg/d/1000 kg 0.16 0.08 0.06 0.15 0.05 0.25K kg/d/1000 kg 0.22 0.13 0.12 0.30 0.10 0.35TDS 1.29C:N ratio 7 7 6 6 6 8
a Average daily production for weight range noted. Increase solids and nutrients by 4% for each 1% feedwaste more than 5%.
factor in the characterization of beef manures. Table 6.6 provides some representativevalues of manure as collected from a feedlot surface.
Swine manure and manure-management systems have been widely studied, andmuch has been reported on swine-manure properties. Table 6.7 lists characteristics ofas-excreted swine manure from feeding and breeding stock. Spilled feed significantlychanges manure characteristics. A 10% feed spillage increases manure total solids by40%. Ration components can make a significant difference in manure characteristics.

178 Waste Management and Recycling of Organic Matter
Table 6.8. Poultry manure characterization—as excreteda
Component Units Layer Pullet Broiler Turkey Duck
Weight (mass) kg/d/1000 kg 60.50 45.60 80.00 43.60Volume L/d/1000 kg 58 46 79 43Moisture % 75.00 75.00 75.00 75.00TS % on a wet basis 25.00 25.00 25.00 25.00
kg/d/1000 kg 15.10 11.40 20.00 10.90 12.0VS kg/d/1000 kg 10.80 9.70 15.00 9.70 7.0FS kg/d/1000 kg 4.30 1.70 5.00 1.25 5.0COD kg/d/1000 kg 13.70 12.20 19.00 12.30 9.5BOD5 kg/d/1000 kg 3.70 3.30 5.10 3.30 2.5N kg/d/1000 kg 0.83 0.62 1.10 0.74 0.7P kg/d/1000 kg 0.31 0.24 0.34 0.28 0.3K kg/d/1000 kg 0.34 0.26 0.46 0.28 0.5TDS 2.89C:N ratio 7 9 8 7 6
a Increase solids and nutrients by 4% for each 1% feed waste more than 5%.
Corn, the principal grain in swine rations, has a high digestibility (90%). Values inTable 6.7 were developed for corn-based rations. If a grain of lower digestibility, suchas barley (79%), is substituted for 50% of the corn in the ration, the total solids of themanure increase 41% and the volatile solids increase 43% above those of a ration basedon corn. Spilled feed further increases the necessary size of storage units and lagoonfacilities needed for manure from rations of lower digestibility.
Because of the high degree of industry integration, standardized rations, and com-plete confinement, layer and broiler manure characteristics vary less than those of otherspecies. Turkey production is approaching the same status. Table 6.8 presents manurecharacteristics for as-excreted poultry manure.
Table 6.9 lists data for poultry flocks that use a litter (floor) system. Bedding materials,whether wood, crop, or other residue, are largely organic matter that has little nutrientcomponent. Litter moisture in a well managed house generally is in the range of 25% to35%. Higher moisture levels in the litter result in greater weight and reduced levels ofnitrogen.
6.1.5 Manure-Management Systems
A manure-management system is a planned system in which all necessary compo-nents are installed and managed to control and use by-products of agricultural productionin a manner that sustains or enhances the quality of air, water, soil, plant, and animalresources. Manure-management systems must be developed using the total systems ap-proach. A total system accounts for all the manure associated with an agricultural enter-prise throughout the year from production to utilization. In short, it is the managementof all the manure, all the time, all the way.
The primary objective of most agricultural enterprises is the production of mar-ketable goods. To be successful the farm manager must balance limited resources among

Waste Management 179
Table 6.9. Poultry waste characterization—litter
Layer TurkeyComponent Units High-Risea Broiler Breederb Broiler Duckb
Weight kg/d/1000 kg 24.00 35.00 24.30Moisture % 50.00 24.00 34.00 34.00 11.20TS % w.b 50.00 76.00 66.00 66.00 88.80
kg/d/1000 kg 12.00 26.50 16.10VS kg/d/1000 kg 21.40 58.60FS kg/d/1000 kg 5.10 30.20N kg/d/1000 kg 0.425 0.68 0.88 1.06 2.31NH4-N kg/d/1000 kg 0.01P kg/d/1000 kg 0.275 0.34 0.40 1.32K kg/d/1000 kg 0.30 0.40 0.45 1.19C:N ratio 9 14
a No bedding or litter material added to waste.b All values % on a wet basis.
many complicated and interdependent systems, such as cropping systems, livestock-management systems, irrigation and drainage systems, nutrient-management systems,and pest-control systems. For a manure-management system to be practical, it mustinterface with these other systems.
Manure ConsistencyManures of different consistencies require different management techniques and han-
dling equipment. Manure may be in the form of a liquid, slurry, semi-solid, or solid. It canchange consistency throughout the system or throughout the year. The total solids concen-tration of manure is the main characteristic that indicates how the material can be handled.
Factors that influence the total solids concentration of excreted manure include theclimate, type of animal, amount of water consumed by the animal, and feed type. In mostsystems the consistency of the manure can be anticipated or determined. The total solidsconcentration of the manure can be increased by adding bedding to the manure, decreasedby adding water, and stabilized by protecting the manure from additional water. Figure 6.3illustrates how varying the total solids concentration for different animal manures affectsconsistency.
Manure-Management FunctionsA manure-management system consists of six basic functions: production, collection,
storage, treatment, transfer, and utilization. For a specific system these functions may becombined, repeated, eliminated, or arranged as necessary.
Production is the function of the amount and nature of manure generated by anagricultural enterprise. The manure requires management if quantities produced aresufficient enough to become a resource concern. A complete analysis of productionincludes the kind, consistency, volume, location, and timing of manure produced. Themanure-management system may need to accommodate seasonal variations in the rateof production.

180 Waste Management and Recycling of Organic Matter
Figure 6.3. Relative handling characteristics of different kinds of manure and percent total solids.
Collection is the initial capture and gathering of the manure from the point of originor deposition to a collection point. Design considerations include the volume and timingof manure and other livestock residues, the location and availability of power supplies,and the opportunity to use topographic features.
Storage is the temporary containment of the manure. The storage facility of a manure-management system is the tool that gives the manager control over the scheduling andtiming of the system functions. For example, with adequate storage the manager hasthe flexibility to schedule the land application of the manure when the spreading opera-tions do not interfere with other necessary tasks, when weather and field conditions aresuitable, and when the nutrients in the manure can best be used by the crop. Design con-siderations should include providing adequate capacity to contain the daily production,

Waste Management 181
such as manure, bedding, and wastewater, and normal runoff for the storage period, andsome volume to capture runoff from rarer storm events. The storage period should bedetermined by the utilization schedule.
Treatment is any function designed to reduce the pollution potential of the manure,including physical, biological, and chemical treatment. It includes activities that aresometimes considered pretreatment, such as the separation of solids. Design considera-tions include the “strength” of the manure, its consistency, and system objectives suchas the need to reduce odors or the desire to market the final product.
Transfer is the movement and transportation of the manure throughout the system.It includes the transfer of the manure from the collection point to the storage facility,to the treatment facility, and to the utilization site. The manure may require transfer asa solid, liquid, or slurry, depending on the total solids concentration. An appropriatedesign carefully weighs the economy of various transfer alternatives.
Utilization includes recycling reusable manure products and reintroducing nonreus-able manure products into the environment. Manures may be used as a source of energy,bedding, animal feed, mulch, organic matter, or plant nutrients [12]. Properly treated,they can be marketable.
A common practice is to recycle the nutrients in the manure through land application.A complete analysis of utilization through land application includes selecting the fields;scheduling applications; designing the distribution system; selecting necessary equip-ment; and determining application rates and volumes, value of the recycled products,and installation and management costs associated with the utilization process.
Typical Agricultural Manure-Management SystemsThe following discussion describes components of typical manure-management sys-
tems. Space does not permit the discussion of design procedures for specific components;however, those details are contained in references such as [1].
DairyDairy operations vary, and each operation presents its own unique problems. Many
older dairy operations were not designed with sufficient consideration given to manuremanagement. As a result, the design of a manure-management system may require majormodifications or alterations of existing facilities.
The dairy industry generally is concerned with the overall appearance of the dairyfarms. Dairy operations require high standards of sanitation and must prevent problemsassociated with flies. Operations near urban areas must manage the manure in a mannerthat minimizes odors.
Dairy animals are typically managed on pastures in partial confinement, although theindustry in many locations is moving toward total confinement of the milking string.While animals are on pasture, their manure should not be a resource concern if stockingrates are not excessive, grazing is evenly distributed, manure from other sources is notapplied, and grazing is not allowed during rainy periods when the soils are saturated[13]. To prevent manure from accumulating in feeding, watering, and shade areas, thefeeding facilities can be moved, the number of watering facilities can be increased,
182 Waste Management and Recycling of Organic Matter
and the livestock can be rotated between pastures. To reduce deposition of manure instreambeds, access to the stream may be restricted to stable stream crossings and accesspoints.
The manure in paved holding areas generally is easier to manage, and the areas areeasier to keep clean. If the holding areas are unpaved, the traffic of the livestock tendsto form a seal on the soil that prevents the downward movement of contaminated water.Care must be taken when removing manure from these lots so that damage to this sealis minimized.
Manure associated with dairy operations includes contaminated runoff, milk-housemanure, bedding, and spilled feed. The collection methods for dairy manure vary de-pending on the management of the dairy operation. Dairy animals may be partly, totally,or seasonally confined. Manure accumulates in confinement areas and in areas in whichthe dairy animals are concentrated before and after milking.
Unroofed confinement areas must have a system for collecting and confining contam-inated runoff. This can be accomplished by using curbs at the edge of the paved lots andreception pits where the runoff exits the lots. Paved lots generally produce more runoffthan unpaved lots. On unpaved lots, the runoff may be controlled by diversions, sedimentbasins, and underground outlets. The volume of runoff can be reduced by limiting thesize of the confinement area, and uncontaminated runoff can be diverted if a roof runoffmanagement system and diversions are used.
The manure and associated bedding accumulated in roofed confinement areas can becollected and stored as a solid. The manure can also be collected as a solid in unroofedlots in humid climates in which the manure is removed daily and in unroofed lots in dryclimates. Manure can be removed from paved areas by a flushing system. The volumeof contaminated water produced by the system can be greatly reduced if provisions aremade to recycle the flush water.
Manure, wash water from the milking house, and contaminated runoff should bestored as a liquid in a storage pond or structure. Manure may be stored as a slurry orliquid in a manure storage pond designed for that purpose or in a structural tank. It canbe stored as a semi-solid in an unroofed structure that allows for the drainage of excesswater and runoff or as a solid in a dry stacking facility. In humid areas the stackingfacility should have a roof.
Liquid manure can be treated in an aerobic or anaerobic lagoon, or other suitableliquid-manure treatment facilities. Solids in the manure often are composted or other-wise processed. Often solids are separated from the manure slurries before storage ortreatment.
The method used to transfer the manure depends largely on the consistency of themanure. Liquid and slurry manures can be transferred through open channels, pipes, or ina portable liquid tank. Pumps can be used to transfer liquid and sometimes slurry manureas needed. Solid and semi-solid manure can be transferred by mechanical conveyanceequipment, in solid manure spreaders, and by pushing it down curbed concrete alleys.Semi-solid manure has been transferred in large pipes through the use of gravity, pistonpumps, or air pressure.

Waste Management 183
Dairy manure is used as bedding for livestock, marketed as compost, and used asan energy source, but the most common form of utilization is through land application.Manure may be hauled and distributed over the land in a dry or liquid manure spreader.Liquid manure can be distributed through an irrigation system. Slurries may be distributedthrough an irrigation system equipped with nozzles that have large openings.
BeefBeef brood cows and calves less than 1 year old are usually held on pastures or
range. The calves are then finished in confined feeding facilities. While the animals areon pastures, their manure should not become a resource concern if the stocking ratesare not excessive and the grazing is evenly distributed [13]. To prevent manure fromaccumulating in feeding, watering, and shade areas, the feeding facilities can be moved,the number of watering facilities can be increased, and the livestock can be rotatedbetween pastures. To reduce deposition of manure in streambeds, access to the streammay be restricted to stable stream crossings and access points.
Wastes associated with confined beef operations includes manure, bedding, and con-taminated runoff.
Beef cattle can be confined on unpaved, partly paved, or totally paved lots. If thecattle are concentrated near wells, adequate protection must be provided to prevent wellcontamination. Because much of the manure is deposited around watering and feedingfacilities, paving these areas, which allows frequent scraping, may be desirable.
On unpaved lots, the traffic of the beef tends to form a seal on the soil that preventsthe downward movement of contaminated water. Care must be taken when removingmanure from these lots so that damage to this seal is minimized. The seal tends to breakdown after livestock are removed from the lot. To prevent possible contamination ofground water resources, all the manure should be removed from an abandoned lot.
Unroofed confinement areas must have a system for collecting and confining contam-inated runoff. On unpaved lots the runoff can be controlled by using diversions, sedimentbasins, and underground outlets. Paved lots generally produce more runoff than unpavedlots, but curbs at the edge of the lots and reception pits where the runoff exits the lotshelp to control the runoff. Solid/liquid separators or settling basins can be used to re-cover some of the solids in the runoff. The volume of runoff can be reduced by limitingthe size of the confinement area, and uncontaminated runoff can be excluded by use ofdiversions.
The manure in confinement areas that have a roof can be collected and stored as asolid. It may also be collected as a solid or semi-solid from open lots where the manureis removed daily and from open lots in a dry climate.
Manure can be stored as a bedded pack in the confinement area if bedding is addedin sufficient quantities. Manure removed from the confinement area can be stored as aliquid or slurry in an earthen pond or a structural tank, as a semi-solid in an unroofedstructure that allows drainage of excess water and runoff to a manure-storage pond, oras a solid in a dry stacking facility designed for storage. In areas of high precipitation,dry stacking facilities should be roofed. Contaminated runoff must be stored as a liquid

184 Waste Management and Recycling of Organic Matter
in a manure-storage pond or structure. All earthen storage and treatment facilities aresubject to seepage if not properly constructed and maintained [14].
Treatment of the manure in a lagoon is difficult for some livestock systems becauseof the volume of solids in the manure, but many of the solids can be removed beforetreatment. Liquid manure may be treated in an aerobic lagoon, an anaerobic lagoon,or other suitable liquid-manure treatment facilities. Solid manure can be composted.Constructed wetlands are another option for manure effluent treatment. Wetlands reducethe biochemical oxygen content of the effluent and other constituents such as nitrogencompounds [15].
The method used to transfer the manure depends largely on the consistency of themanure. Liquid manure and slurries can be transferred through open channels or pipesor in a portable liquid tank. Pumps can be used as needed. Solids and semi-solids may betransferred by using mechanical conveyance equipment, by pushing the manure downcurbed concrete alleys, and by transporting the manure in solid manure spreaders. Pistonpumps or air pressure can be used to transfer semi-solid manure through large pipes.
Beef-cattle manure can be used as bedding for livestock or as an energy source, or itcan be marketed as compost, but the most common form of utilization is land application.The manure can be hauled and distributed over the land in appropriate spreading devices.Liquid manure can be distributed through an irrigation system, and slurries can be appliedusing irrigation equipment with nozzles that have large openings.
SwineOpen systems (pastures, woodlots, and wetlands), feedlot systems, confinement sys-
tems, or a combination of these are used for raising swine. Raising hogs in an open systemmay have a low initial investment but often results in animal-health and pollution-controlproblems. Even if sufficient land is available, hogs tend to congregate and concentratetheir manure. Total-confinement systems eliminate the need to manage contaminatedrunoff and may allow for more automation in manure management.
Undesirable odors often are associated with swine operations. A swine manure-management system should incorporate odor-control measures if possible. A clean, neatappearance, an efficient management system, and positive public relations with thoseaffected by the odors eliminates many complaints [8].
Waste associated with swine operations includes manure and possibly contaminatedrunoff. In some systems provisions must be made to manage flush water. Hogs tend toplay with watering and feeding facilities, which can add to the manure load. The disposalof dead pigs may be a resource concern in some operations.
Swine manure can be collected by scraping or flushing. Scraped manure is collectedas a solid or slurry; flushed manure must be handled as a liquid. The flush water shouldbe recycled if possible so that the volume of contaminated water is kept to a minimum.The collection process can use automated equipment, or it can be as simple as raisingswine on slatted floors over manure storage pits.
Swine manure can be stored as a solid, slurry, or liquid. If stored as a solid, it shouldbe protected from precipitation. Above- or below-ground tanks or an earthen manure-storage pond can be used to store slurries or liquid manure.

Waste Management 185
Liquid manure from a swine operation is commonly treated in an anaerobic lagoon, butit can also be treated in an aerobic lagoon or oxidation ditch; however, these alternativesnormally have a prohibitive cost. Solid manure and dead pigs can be composted.
The method used to transfer the manure depends largely on the consistency of themanure. Liquid manure and slurries may be transferred through open channels, pipes,or in a portable liquid tank. Pumps can transfer liquid manure as needed. Solids andsemi-solids can be transferred by mechanical conveyance equipment. Piston pumps orair pressure can be used to transfer semi-solid manure through smooth pipes.
Swine manure is used as a feed supplement and an energy source through methaneproduction. With proper ventilation and sufficient bedding, the solid manure can becomposted in confinement facilities, and the heat generated from the composting processcan be used to supplement heat in the buildings.
The most common use of the nutrients in swine manure is through land application.The manure can be hauled and distributed over the land by spreading devices. If odors area problem, liquid manure can be injected below the soil surface. It can also be distributedthrough an irrigation system. Slurries can be distributed through an irrigation systemequipped with nozzles that have large openings.
PoultryThe two basic poultry-confinement facilities are those used to raise turkeys and broil-
ers used for meat and those used to house layers. Broilers and young turkeys are grownon floors on beds of litter shavings, sawdust, or peanut hulls. Layers are confined tocages. Fly control around layers is important to prevent spotting of the eggs. Diseasecontrol is important in both systems.
Waste associated with poultry operations include manure and dead poultry. Dependingupon the system, waste can also include litter, wash–flush water, and spilled feed.
The manure from broiler and turkey operations is allowed to accumulate on the floor,where it is mixed with the litter. Near watering facilities the manure–litter pack formsa “cake” that generally is removed between flocks. The rest of the litter pack generallyhas low moisture content and is removed once a year. The litter pack can be removedmore frequently to prevent disease transfer between flocks.
In layer houses, the manure that drops below the cage collects in deep stacks or isremoved frequently using either a shallow pit located beneath the cages for flushing orscraping or belt scrapers positioned directly beneath the cages.
Litter from broiler and turkey operations is stored on the floor of the housing facility.When it is removed, it can be transported directly to the field for land application. Iffield conditions are not suitable or spreading is delayed for other reasons, the litter mustbe stored outside the housing facility. In some areas the litter may be compacted in apile and stored in the open for a limited time; however, it generally is better to coverthe manure with a plastic or other waterproof cover until the litter can be used. If thespreading is to be delayed for an extended period of time, the litter should be stored ina roofed facility.
If the manure from layer operations is kept reasonably dry, it can be stored in a roofedfacility. If it is wet, it should be stored in a structural tank or an earthen storage pond.
186 Waste Management and Recycling of Organic Matter
Broiler and turkey litter can be composted. This stabilizes the litter into a relativelyodorless mass that is easier to market and also helps to kill disease organisms so that thelitter can be reused as bedding or supplemental feed to livestock. The litter can also bedried and burned directly as a fuel.
Liquid manure may be placed into an anaerobic digester to produce methane gas, orit can be treated in a lagoon. The high volatile solid content of the layer manure mayrequire an anaerobic lagoon of considerable size. If odors are a problem, aeration is analternative, albeit costly.
The method used to transfer the manure depends on the total solids content of the ma-nure. Liquid manure can be transferred in pipes, gutters, or tank wagons, and dried littercan be scraped, loaded, and hauled as a solid. If the distances between the poultry housesand the fields for application are great, the litter may require transportation in a truck.
The manure from poultry facilities is often applied to the land. If the owners of apoultry house do not have enough land suitable for application, they can often arrangeto apply the manure to a neighbor’s land. Because of the high nutrient value of the litter,many landowners are willing to pay for the litter to be spread on their land. Whether onthe owner’s land or the neighbor’s land, the manure must be spread for proper utilization.Poultry manure can also be used for the production of methane gas, burned directly as afuel, reused as bedding, or used as a feed supplement to livestock [16].
Because of the large numbers of dead birds associated with large poultry operations,the disposal of dead birds is a resource concern. Poultry facilities must have adequatemeans for disposal of dead birds in a sanitary manner. To prevent spread of disease, thedead birds often are collected daily by hand. Disposal alternatives include incineration,rendering, burial, dropping into a buried disposal tank, or composting, in which the deadbirds are mixed with litter and straw and composted, and the composted material is storeduntil it can be applied to the land.
References
1. United States Department of Agriculture, Natural Resources Conservation Service.1992. Agricultural Waste Management Field Handbook. Washington, DC.
2. United States Environmental Protection Agency. 1986. Quality criteria for water.EPA 440/5-86-001. Washington, DC.
3. Buchholz, D., DeFelice, K., and Wollenhaupt, N. 1989. Agricultural sources ofcontaminants in ground water. University of Missouri, Columbia, MO.
4. Daniel, T. C., Edwards, D. R., Wolf, D. C., Steele, K. C., and Chapman, S. L. Un-dated. Nitrate in Arkansas groundwater. Cooperative Extension Service, Universityof Arkansas, Fayetteville, AR.
5. Dixon, M. L., Tyson, A., and Segars, B. 1992. Your drinking water: Nitrates. Uni-versity of Georgia, Athens, GA.
6. United States Environmental Protection Agency. 1984. Technical support manual:Waterbody surveys and assessments for conducting use attainment. Washington,DC.
Recycling of Organic Matter 187
7. United States Environmental Protection Agency. 1993. Anthropogenic methaneemissions in the United States; Estimates for 1990. Report to Congress, Officeof Air and Radiation, Washington, DC.
8. Rieck, A., Carman, D., VanDevender, K., and Lansston, J. Undated. Managing alivestock operation to minimize odors. Cooperative Extension Service, Universityof Arkansas, Fayetteville, AR.
9. Davis, G. V. Jr., Hankins, B. J., Chapman, S. L., and Williams, R. 1989. Nitratepoisoning in cattle. Cooperative Extension Service, Fayetteville, AR.
10. Barth, C. L. 1985. Livestock manure characterization: A new approach. InAgricul-tural Manure Utilization and Management, Proceedings of the Fifth InternationalSymposium on Agricultural Manures. St. Joseph, MI: ASAE.
11. Rieck, A., VanDevender, K., and Langston, J. Undated. Liquid animal waste sam-pling. Cooperative Extension Service, University of Arkansas, Fayetteville, AR.
12. Westerman, P. W., Safley, L. M. Jr., Barker, J. C., and Chescheir, G. M. III. 1985.Available nutrients in livestock manure. InAgricultural Manure Utilization andManagement, Proceedings of the Fifth International Symposium on AgriculturalManures. St. Joseph, MI: ASAE.
13. Welch, T. G., Knight, R. W., Caudle, D., Garza, A., and Sweeten, J. M. 1991. Impactof grazing management on nonpoint source pollution. Texas Agricultural ExtensionService, College Station, TX.
14. Brichford, S., Janssen, C., Yahner, J., and Eigel, J. 1995. Livestock waste storage:Indiana farmstead assessment for drinking water protection. Cooperative ExtensionService, Purdue University, W. Lafayette, IN.
15. Riech, A., Langston, J., and VanDevender, K. Undated. Constructed wetlands: Anapproach for animal waste management. Cooperative Extension Service, Universityof Arkansas, Fayetteville, AR.
16. Stephenson, A. H., McCaskey, T. A., and Ruffin, B. G. 1989. Treatments to im-prove the feed nutrient value of deep stacked broiler litter.Journal of Dairy Science67(Suppl. 1):441.
6.2 Recycling of Organic Matter
Jean Claude Souty
6.2.1 Land Application
Environmental ChallengesFor a very long period, organic matter coming from livestock effluents, either mixed
or not with other materials such as straw, was considered only as an interesting fertilizerfor cultivated soils. However, in developed countries, intensification of most animalproduction, combined with new housing systems using no litter has contributed fora number of years—often in addition to other human activities—to the pollution ofunderground and subsurface waters. It is well known nowadays that too high a content ofnitrogen in drinking water may be a danger to human health, especially where babies are

188 Waste Management and Recycling of Organic Matter
concerned. An excess of phosphorus in subsurface water may also lead to eutrophicationand thus to the destruction of many fish populations.
To those drawbacks of the overuse of organic matters must be added those more re-cently put into light in relation to new methods of animal housing and manure spreading:air pollution by ammonial and other volatile emissions, and conflicts between farmersand other citizens, due to odors.
In many countries, authorities have been led to enforce various types of regulations,in some cases very sophisticated, to eliminate or at least reduce these hazards and draw-backs. Following such regulations, the farmers have to pay more and more attentionto the environmental impacts of their activities and to improving their practices for amore sustainable agriculture. The main points to be considered in this matter are storagecapacities for animal waste, distances from water sources and dwellings, at appropri-ate fertilization allowing a sufficient supply of nutrients (but not more) applied only atrelevant periods for crops.
Different Types of Animal WastesRegarding land spreading there are four main types of wastes:• Solid manure, which is generally a mixture of dung with enough straw for being
stored in dung-hill on stockyard• Liquid manure, which is either a mixture of dung, urine and water or a slurry
resulting from draining solid manure from the stockyard• Sewage from the milking parlor, which includes washing water for milking ma-
chines and exersize areas inside the parlor; these types of effluents, which representoften a large percentage of wastes in dairy farms, can either be stored with liquidmanure—but in this case storage capacities are more or less greatly increased—ortreated separately
• Seepage from silos, which is only to be considered for silage with less than 25%of dry matter (grass silage mainly); such seepage is never in great quantities but isvery pollutant and cannot be allowed to run out directly from the silos to the fieldsor the surface water; it has therefore to be spread with liquid manure, but it can bestored in the same tank or separately
Storage CapacitiesOne of the most important points is to have enough storage capacity for livestock
wastes in order to avoid spreading when periods are not favorable for crop growth.These capacities have to be determined considering total wastes coming from animals,from equipment such as milking parlors, and from various other origins (silage, rainfallon uncovered exersize areas, or washing water). Of course, sources of uncontrolledquantities of water (drinking bowls, roofs without eaves) must be eliminated.
These quantities have to be established for the duration required by national regulationor after analysis of the agronomic and climatic context. In France, the minimum durationof storage has been determined by national authorities to be 4 months, but local authoritiesare allowed to increase this minimum, often to 6 months or more and sometimes to 9months or even 1 year, as in northern countries of the European Union.
Basic data concerning quantities of animal wastes production—as excreted—aregiven in Tables 6.4 to 6.9. For calculation of storage capacities it is necessary to take into

Recycling of Organic Matter 189
Table 6.10. Examples of liquid manure storage capacities needed for 4 months
Animal Housing Capacity (m3)
Dairy cattle Loose housing(7000 L of milk per year) Cubicles entirely covered 7.5
Cubicles partially coveredSilage distributed 7.8a–9b.Silage in self-feeding 8.4a–10.8b
With strawyardconcrete exercise yard covered 5.4concrete exercice yard uncovered:
Silage distributed 5.6a–6.4b
Silage in self-feeding 6.2a–8.8b
Cowsheds without straw 7.2Beef cattle On slatted floor 3.2
With strawyard and concreteexercice yard covered 2.1
Pigs Suckling sow (per place) 2.4Fattening pigs on slatted floor (per place)
Fed with lactoserum 1.20Fed with concentrates and drinking bowl 0.80Soup feeder 0.48
Piglets 0.32
a Rainfall: 60 mm/monthb Rainfall: 120 mm/month
account a number of parameters concerning the type of housing, husbandry, rainfall, andso forth. Such data are available in reference [1], and Table 6.10 gives some examplesof such capacities.
Fertilization BalanceSufficient storage capacities are a necessary condition to avoid non–point source
pollution (as well as direct pollution resulting from overflowing manure). But it is alsonecessary to match the quantities of manure—especially nitrogen and phosphorus—thatare to be spread and the capacity of the soils and crops to utilize and transform theseelements.
If this capacity is not sufficient, animal wastes must be either spread on the land ofother farms or treated in order to reduce their nutrient contents. The first solution is notalways feasible, and treatments of animal wastes are generally very expensive. If thereare mainly pigs or poultry on the farm, a third solution may be considered, which consistsof lowering the amount of nitrogen produced by the animals themselves through alteringthe protein content of the feed during animal growth.
In any case, it is necessary to know as precisely as possible the quantities of nutrientsthat are to be spread and those likely to be absorbed by cultivated soils. The nutrientthat needs special attention regarding pollution hazards is nitrogen; hence it is stronglyrecommended to carry out at least one nitrogen balance. However, more and more oftenattention must also be paid to phosphorus.

190 Waste Management and Recycling of Organic Matter
Table 6.11. Nitrogen production per year by livestock
Type of Animal kg of Nitrogen Produced
CattleDairy cow 73Suckling cow 51.1Heifer (<1 year) 21.9Heifer (1–2 years) 43.8Heifer (>2 years) 58.4Beef cattle (<1 year) 21.9Beef cattle (1–2 years) 43.8Beef cattle (>2 years) 51.1Veal calf 2.1
PigsSow or boar 17.5Piglet (after weaning) 0.7
PoultryLaying hen 0.5Point of lay pullet 0.125Broiler 0.04Turkey (female) 1Future reproducing turkey 0.25Duck 0.069
SheepAdult ewes (>1 year) 10Lambs (6 months) 3Ewe lamb 5
RabbitsFemale in cage 4.5Rabbit produced 0.084
Source: [2, 3].
Data concerning animal-wastes nitrogen contents are given in Table 6.11. These dataallow an estimation of the quantities of nitrogen present in farm wastes. Some examplesof plant requirements are given in Table 6.12.
Calculations on such bases allow one to determine if nitrogen is structurally in excessor not for the total surface of the farm likely to receive livestock effluents. For a first andmore simple approach to this issue, in France we use the relevant European regulationthat requires one not to exceed 210 kg/ha of nitrogen coming from animal wastes.
Conditions for SpreadingIndependent of crop types and their yields, two sorts of parameters have to be consid-
ered regarding possibilities of spreading manure without risking pollution water directlyand making neighbors uneasy. These parameters may reduce, sometimes strongly, thetotal spreadable area: distances from dwelling houses and water surfaces or water catch-ments (Table 6.13 gives examples of what is required in France, but distances are oftensome what different in other countries), and slopes, which must not be too strong.

Recycling of Organic Matter 191
Table 6.12. Nutrient composition of crops
Crop N P2O5 K2O
Kg/9 harvestedSoft corn 1.9 0.9 0.7Oat 1.9 0.8 0.7Barley GRAIN 1.5 0.8 0.7Rye 1.4 1.0 0.6Maize 1.5 0.7 0.5Colza 3.5 1.4 1.0Sunflower 1.9 1.5 2.3
Soft corn 2.5 1.1 1.7Oat 2.5 1.1 1.9Barley GRAIN 2.1 1.0 1.9Rye + 2.0 1.3 1.8Maize STRAW 2.2 0.9 2.3Colza 7.0 2.5 10.0Sunflower 3.7 2.5 10.0
Potato 0.35 0.17 0.65
Kg/T of DM N P2O5 K2O
Maize silage 12.5 5.5 12.5Grass silage 20.0 6.0 25
Table 6.13. Minimum distances for spreading liquid manure(French regulation)
Water Captage for HumanConsumption Beach Fish Breeding
100∗ 50 200 500
∗ 50 m if odour reduction by treatment and 10 m if immediateburying by injection
In any case liquid manure may have to be spread on soils covered with snow or whenit rains strongly. More generally manure spreading has to be done when organic nitrogenmay be well mineralized and when crops are able to absorb quickly this nitrogen. Sogood decisions have to be taken in considering climate, crops, and soils and followingagronomist advices. On the other hand, spreading manure during periods in which touristsare numerous in these areas must be avoided.
Equipment for SpreadingThere are three main sorts of equipment for spreading animal wastes: spreaders,
vacuum tankers, and irrigation systems. They can be used according the dry-mattercontent of the product to be spread.

192 Waste Management and Recycling of Organic Matter
Figure 6.4. Spreader for solid manure.
Figure 6.5. Vacuum tanker.
SpreadersOnly solid manure can be spread by this type of equipment (Fig. 6.4), because the
percentage of dry matter must be at least 13%. Between 8% and 13% we find manurewith small quantities of straw, which requires same type of equipment but equipped witha watertight tank.
Vacuum TankersThis equipment (Fig. 6.5) is used for spreading slurry or liquid manure with no more
than 8% dry matter. Such tankers may be equipped with systems allowing one to buryliquid manure in the soil; the advantages of burying are both avoiding losses of NH3 inthe air and increasing spreadable land, because there are no odors while spreading andso it may be done nearer to dwelling areas.
Irrigation SystemsIf it is very diluted (less than 3%), liquid manure may be spread with equipment
similar to those used for irrigation, in order to avoid evaporation.
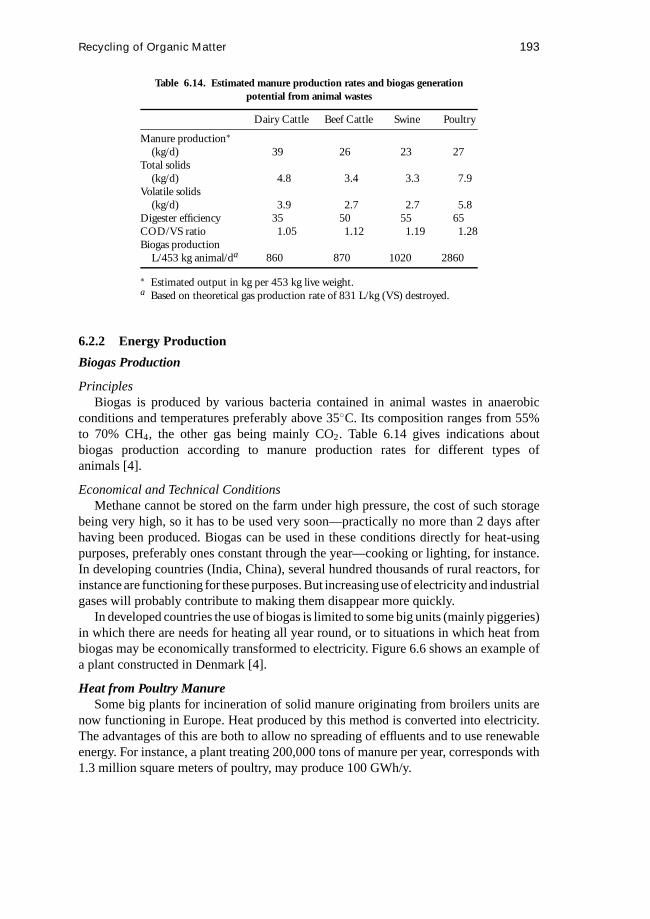
Recycling of Organic Matter 193
Table 6.14. Estimated manure production rates and biogas generationpotential from animal wastes
Dairy Cattle Beef Cattle Swine Poultry
Manure production∗(kg/d) 39 26 23 27
Total solids(kg/d) 4.8 3.4 3.3 7.9
Volatile solids(kg/d) 3.9 2.7 2.7 5.8
Digester efficiency 35 50 55 65COD/VS ratio 1.05 1.12 1.19 1.28Biogas production
L/453 kg animal/da 860 870 1020 2860
∗ Estimated output in kg per 453 kg live weight.a Based on theoretical gas production rate of 831 L/kg (VS) destroyed.
6.2.2 Energy Production
Biogas Production
PrinciplesBiogas is produced by various bacteria contained in animal wastes in anaerobic
conditions and temperatures preferably above 35◦C. Its composition ranges from 55%to 70% CH4, the other gas being mainly CO2. Table 6.14 gives indications aboutbiogas production according to manure production rates for different types ofanimals [4].
Economical and Technical ConditionsMethane cannot be stored on the farm under high pressure, the cost of such storage
being very high, so it has to be used very soon—practically no more than 2 days afterhaving been produced. Biogas can be used in these conditions directly for heat-usingpurposes, preferably ones constant through the year—cooking or lighting, for instance.In developing countries (India, China), several hundred thousands of rural reactors, forinstance are functioning for these purposes. But increasing use of electricity and industrialgases will probably contribute to making them disappear more quickly.
In developed countries the use of biogas is limited to some big units (mainly piggeries)in which there are needs for heating all year round, or to situations in which heat frombiogas may be economically transformed to electricity. Figure 6.6 shows an example ofa plant constructed in Denmark [4].
Heat from Poultry ManureSome big plants for incineration of solid manure originating from broilers units are
now functioning in Europe. Heat produced by this method is converted into electricity.The advantages of this are both to allow no spreading of effluents and to use renewableenergy. For instance, a plant treating 200,000 tons of manure per year, corresponds with1.3 million square meters of poultry, may produce 100 GWh/y.
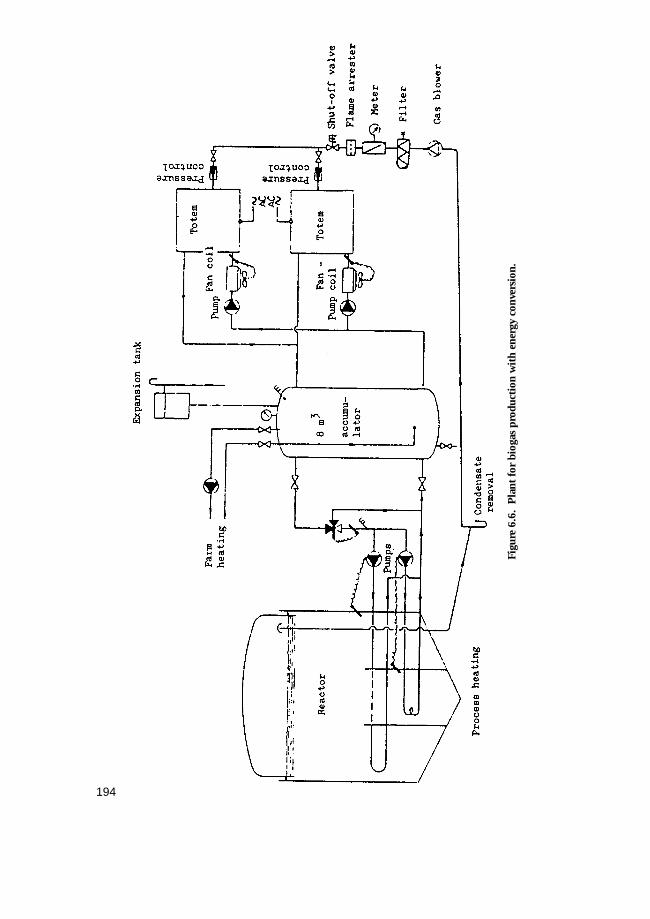
Figu
re6.
6.P
lant
for
biog
aspr
oduc
tion
wit
hen
ergy
conv
ersi
on.
194

Recycling of Organic Matter 195
References
1. Batiments d’elevage bovin, porcin et avicole. R´eglementation et pr´econisations rel-ativesa l’environnement, 1996. 140 p. PARIS: Minist`ere de l’agriculture de la pˆecheet de l’alimentation.
2. CORPEN, 1996.-Estimation des rejets d’azote et de phosphore des ´elevages de porcs.Impact des modifications de conduite alimentaire et des performances techniques,24 p. Paris : Minist`ere de l’agriculture de la pˆeche et de l’alimentatio, Minist`ere del’environnement.
3. CORPEN, 1988 - Bilan de l’azote `a l’exploitation, 35 p. Minist`ere de l’agricultureet de la peche, Ministere de l’environnement.
4. STAFFORD, D. A., WHEATLEY, B. I., HUGHES, D. E., 1980.-Anaerobic diges-tion, 528 p.- Londres: applied science publishers ltd.
Bibliography
AFGR, 1993. Batiments d’elevage et environnement. Enjeux et perspectives. Actes ducolloque, Nantes, 140 p.
Biskupek, B. Dohler, H. 1993. Environmentally acceptable manure utilization. KTBLseminar, Waltersdorf- Th¨uringen, 1992/11/26-27. KTBL Arbeitspapier, n◦ 182,153 p.
Chevalier, D. Wiart, J., 1992. Les mat´eriels d’epandage (valorisation agricole des bouesd’epuration et autres engrais de ferme: fumiers,lisiers, fientes) 50 p. Paris: Agencede l’environnement et de la maitrise de l’energie.
Coillard, J., 1997. Proc´edes de traitement des lisiers de porc ´etudies en France. Princi-pales techniques adapt´eesa la gestion des lisiers en zone d’exc´edent, Ing´enieries(10):17–33.
Coillard, J., Pradal, G., Buatier, C., 1995. Le traitement `a la ferme des lisiers de porc.Etude d’un proc´ede extensif de type “lagunage naturel”. CEMAGREF, TECHNI-PORC (1):17 p.
Corpen, 1988. Bilan de l’azote `a l’exploitation, 35 p. Minist`ere de l’agriculture et de lapeche, Ministere de l’environnement.
Costs of agricultural production of biogas. 1992. KTBL symposium, Darmstadt,1992/11/25-26. KTBL Arbeitspapier, N◦ 185, 138 p.
Dewi, I., Axford, R. F. E., Marai, I. F. M., Omed, H. M., 1993. Pollution in livestock pro-duction systems]. International symposium, University College of Wales, Bangor,1992/09, 463 p. Wallingford, UK: CAB International.
Galanos, E. Gray, K. R. Biddlestone, A. J. Thayanithy, K. 1995. The aerobic treatmentof silage effluent: effluent characterization and fermentation. J. Agric. Engng.Research 62(4):271–279.
Jones, D. I. H. Jones, R. 1995. The effect of crop characteristics and ensiling methodologyon grass silage effluent production. J. Agric. Engng. Research 60, (2):73–81.
Jones, D. I. H. Jones, R. 1996. The effect of in-silo effluent absorbents on effluentproduction and silage quality]. J. Agric. Engng. Research 64(3):173–186.
Maıtrise et prevention des pollutions dues aux ´elevages, 1994-Colloque SIMA,Villepinte, 16 fevrier 1994, 145 p. Antony: Cemagref.
196 Waste Management and Recycling of Organic Matter
Martinez, J. 1997. Solepur: A soil treatment process for pig slurry with subsequentdenitrification of drainage water. J. Agric. Engng. Research 66(1):51–62.
Michel-Combe, D., Loudec, J. L., Merillot, J. M., 1995. Le lisier de porc. Les m´ethodeset les finalites du traitement `a la ferme, 48 p. Paris : Minist`ere de l’Agricultureet de la Pˆeche.
Nitrogen flow in pig production and environnemental consequences. Symposium pro-ceedings, Wageningen, 1993/06/8-11. Wageningen: PUDOC.
Stafford, D. A., Wheatley, B. I., Hughes, D. E., 1980. Anaerobic digestion, 528 p.Londres: Applied Science Publishers Ltd.
Taiganides, E. P., 1992. Pig waste management and recycling: the Singapore experience,368 p. Ottawa, Canada: International Development Research Centre.
Texier Cl., 1997. Elevage porcin et respect de l’environnement, 110 p. Paris: InstitutTechnique du porc.
Tillie, M., Billon, P., Houdoy, D., Fevrier, D., 1995. Elevage bovin et environnement:Prevenir les risques de nuisance et de pollution, 103 p. Paris: Minist`ere del’Environnement, Institut de l’Elevage.
Tillie, M., Capdeville, J., 1992. Etude sur les d´ejections bovines: d´etermination de stock-age et composition des d´ejections bovines `a la ferme. 84 p. PARIS: Institut del’ Elevage.
Tveitnes, S. 1993. Animal wastes, 119 p. As, Norv`ege: Statens Fagteneste for Land-bruket.
University of Illinois, Department of Agricultural Engineering Cooperative Exten-sion Service. 1991. Livestock waste management conference. Livestock waste:maximum use with minimum problems. Urbana-Champaign, Illinois, USA,1991/03/19 .73 p.
Ziegler, D., Heduit, M., 1991. Engrais de ferme, valeur fertilisante, gestion, environ-nement, 35 p. Paris: ITP, ITCF, ITEB.

7 Draught Animals
David H. O’Neill
7.1 Utilization
7.1.1 Principles of Animal Traction
Two major activities in crop production are land preparation and weed control. Formost subsistence and smallholder farmers the energy, or power, needed to prepare thesoil for sowing or planting can be a major limitation on how much they can grow. Also,the time required to control the weeds, which compete with the crop for nutrients (andmoisture in the drier areas), can be a major constraint on the crop yield.
For both land preparation and weeding tasks, the use of draught animal power (DAP)can improve the timeliness of farmers’ operations by supplementing the farmers’ ownmuscle power (and that of their families) by providing the effort needed to pull a ploughor cultivator and to complete the task more quickly than would be possible by humanlabor alone. There is, therefore, a double benefit in that not only is drudgery reduced butimproved timeliness of ploughing and weeding leads to better crop yields. It is generallyconsidered that the landholding of a typical smallholder farmer (0.5 to 3.0 ha) would beinsufficient for a tractor to be economically feasible or sustainable.
The are no ostensible physical differences between draught animals and others of thesame species, although certain breeds are more renowned for their draught capabilities.Almost any bovine (including buffalo), equid, or camelid can become a draught animal,provided that it is reasonably healthy and responds to training. In general, the mostimportant criterion is body mass, or live weight. This gives an indication of the amountof muscle on the animal and, thus, its potential to exert a force or, more specifically, apull that the farmer can utilize through soil-working implements. A basic guide is that ananimal can pull about 10% to 15% of its weight for a working period of around 4 h. This isa useful starting point for drawing up the basic specification for a draught animal–basedcultivation system, although there is some variation among species, breeds and workingconditions. For example, bovines would be nearer to the 10% end of the range, whileequids and camelids would be at the higher end.
When putting animals to work together, good harnessing systems are essential toavoid unnecessary wastage of animals’ efforts and energy, and to reduce injuries, whichfurther impair work output. There are basically four types of harness (Fig. 7.1): the head,or neck, yoke (lashed to the animals’ horns); the withers, or shoulder, yoke (better suited
197

198 Draught Animals
Figure 7.1. Examples of common types of harness.
to Bos indicusas it rests against the hump as well as the shoulders); the collar harness;and the breast-band harness. Generally, collar-type harnesses are the most suitable forall species but they tend to be the most expensive. Yokes are simple and relatively cheapbut are not recommended for equids. Harnessing animals together increases the draughtcapability and work output, but losses are incurred. The addition of each extra animalbrings about a loss of around 5% to 10% of the combined individual capabilities. Thus,harnessing together more than 10 to 12 animals would be counterproductive unless theharnessing system is first-class. Several guides on the design and use of harnessingand hitching systems have been published, to which the reader is referred for furtherinformation (see References).
In mechanical terms, the work done by a draught animal is the product of the pullingforce (usually the horizontal component is used) and the distance moved while pulling(Fig. 7.2).
The force resisting the forward movement of the plough (R) is related to the force, ortension (T), in the draught chain or beam, as shown by the following equation:
R= T · cosα (7.1)

Utilization 199
Figure 7.2. Diagrammatic representation of an ox pulling a plough.
assuming that the force applied through the handles by the operator (O) is negligible.(If an implement is properly set, this is the case.) The vertical forces may be resolved ina similar way, again assumingO is negligible:
T · sinα = W −U (7.2)
whereW is the weight of the implement andU is the resultant uplifting force exertedby the soil.
The mechanical energy expended (E), or work done, is given by
E = T · cosα · D (7.3)
whereD is the distance moved.The energy expended can be assessed in two ways: either as the product of the average
draught force and the total distance moved, or as the sum of the instantaneous productsof force and distance. Generally speaking, the former is easier to measure with simpleinstruments (e.g., spring balance or dynamometer and tape measure); the latter is moreaccurate but requires more complex instrumentation.1
If the power consumption (P) is required, this (by definition) is the rate of energyexpenditure and can be calculated as the quotient of energy and time:
P = E/t = T · cosα · D/t (7.4a)
or
P = T · cosα · v (7.4b)
wheret is the time spent working andv is the speed. For greater accuracy, Eq. (7.4b)should be used, with the mean of the instantaneous products of force and speed computed.
If the force through the handles cannot be considered negligible, Eqs. (7.1) and(7.2) must be corrected by including terms forOH and OV respectively. In practice,this occurs most commonly when the operator presses down on the handles (OH hasthe same algebraic sign asW) to increase the working depth (d) in compensation foran incorrectly set implement. It should be noted that this effort makes control of the
1Such as the Silsoe Animal Traction Logger or the CTVM Ergometer—see section 7.1.4.

200 Draught Animals
implement involved (usually a plough) hard work for the operator. Such a situation canusually be avoided by proper use of the depth and width regulators.
The depth of working is another important parameter, as it has a direct effect on bothR andU . In practice,d is rarely constant but varies continuously (by as much as 25%)during a period of work because of changes in soil quality and field conditions. Generallyspeaking, an increase ind will bring about increases in bothR andU .
For draught animals, irrespective of species, to be used successfully, the local farm-ing system must have the capacity to support livestock and to sustain them in a healthycondition. In addition, the farmers must have some insight or predisposition toward thecare, husbandry, and training of animals. Furthermore, the fabrication, or at least mainte-nance, of animal-drawn implements must be within the capabilities of local blacksmiths.Despite the obvious attractions of DAP for smallholder farmers, not all farming systemsare suited to the application of DAP, and caution should be exercised if recommendingDAP as part of a mechanization strategy. The most obvious exceptions are tsetse-infectedareas (even with trypano-tolerant cattle) and low-yielding arid or semiarid productionsystems.
7.1.2 Tasks Performed
The greatest benefit of the use of DAP for smallholder farmers is land preparation,particularly primary cultivation at the start of the cropping cycle. The energeticallydemanding soil-manipulation tasks usually can be made less onerous to the farmer if he orshe uses animal traction. Primary land preparation is usually effected with a plough, mostwidely in the form of an ard. In some parts of southern Africa and Latin America, wherethe legacy of European colonizers remains, the mouldboard plough is more popular,for its apparently superior weed control. A useful catalogue of animal-drawn ploughs(and other implements) is available inTools for Agriculture[1]. A smaller but morefully annotated listing, giving performance specifications, of animal-drawn cultivatingimplements is available [2].
As discussed previously, weeding is a major constraint on crop production and yieldoptimization. The use of animal-drawn weeders (also calledcultivatorsandhoes) canexpedite the task of weeding (which, ideally, may be performed up to four times as acrop reaches maturity) and thereby enhance farmers’ outputs. Weeding is not usually anenergy- or draught-intensive task and can be carried out by a single ox or a pair of rela-tively light animals (e.g., donkeys), but it is entirely dependent on the crop being plantedin rows of suitable spacing. Broadcast crops are not suitable for animal-drawn weedingequipment and, as a consequence, animal-drawn seeders are an attractive proposition tofarmers. However, such devices are not very popular with farmers, as they tend to bemechanically unreliable. They are also relatively expensive in comparison with ploughsand cultivators because of the metering and spacing mechanisms required. Adding totheir complexity, by incorporating fertilizer dispensers for example, which improvestime economy has rarely proved successful.
The most successful approach to the use of DAP is to regard it as part of the continuumof available power sources, from human labor to tractor power, and to employ each power

Utilization 201
source where and when it is most appropriate. There are smallholder farmers who utilizea combination of human, animal, and engine power but use engine power only for theoperations demanding the highest draught. Thus, a farmer might hire or borrow a tractorto open up a fallow plot and then use a team of oxen for the subsequent operations tocreate the seed bed. Weed control operations would then be carried out both by animalspulling a cultivator and by hand hoe. The cultivator would be preferred for interrowweeding, provided that the crop were not damaged, and the hand hoe would be used forinterplant, or in-row, weeding, if the farmer chose to do so. As the draught requirementfor a plough is likely to exceed that for a cultivator (on the same plot), the farmer may beable to use a smaller team for weeding than for ploughing. For most smallholder farmersharvesting is generally carried out by manual labor and is an activity to which the wholefamily contributes.
The equipment typically used in draught-animal operations is listed in Table 7.1,together with relevant comments. Ploughs are the most universally owned and usedimplements, and it is not uncommon to find farmers who own a plough (or ploughs)yet do not own draught animals. Farmers who do not own cultivators are likely to usetheir ploughs for weeding as well as land preparation. If the farmer owns a mouldboard
Table 7.1. Equipment suitable for draught-animal power applications
Implement Comments
Traditional/ard ploughs Cut furrows and disturb soil without inverting itUsually made at local level, generally of wood but with a metal tip
Mouldboard ploughs Cut the soil and turn the furrow, burying weeds and trashMade of steel, usually in factories, but some blacksmiths capable of
fabrication; commonest share and mould board sizes for DAP are 6, 8, and10 in (150, 200, and 250 mm)
Should have adjustable hitch point and may have wheel or skid to improvestability
Puddlers Rotating blades for wet-land preparation to disturb the surface (by inversion)and break clods
Seeders Comprise furrow opener (tine), seed dispenser (if seed metered, called adrill), followed by furrow closer; may be combined with fertilizer dispenser;
Complex and expensive for smallholder farmersCultivators For interculture in row crops; tines vary in number (usually 3 to 5 for DAP)
and shape (e.g., flat, curved, spring rigid, sweep, duckfoot) and may befitted with width-adjusting mechanism
Some rotary cultivators suitable for DAP availableRidgers For making ridges, bunds, or raised beds by the action of mouldboards or
discsHarrows Comprise a number (usually 20 to 40 for DAP) of steel teeth/spikes mounted
on a metal frame (triangular, square, diamond, etc.)Tool bars Metal frame, usually with land wheel, to which different soil-working tools
(e.g., tines, shares mouldboards, ground-nut lifters) can be attachedWheeled tool carriers Platform with axle to which a wide range of tools can be attached; can often
be converted into a cartRather expensive for smallholder farmers
202 Draught Animals
plough (rather than an ard), she or he may weed using just the share with the mouldboardremoved. However, some recent research by Richeset al.[3] in Zimbabwe has suggestedthat, for maize, weeding is more effective if the mouldboard is not removed, as the soilbeing pushed over the in-row weeds smothers them.
Animals can also be used to power stationary equipment, such as for water-raising,or to expedite postharvest operations such as threshing, milling, or crushing (sugarcane). However, because of the complexity and cost (use of gears, robustness) andinconvenience, farmers favor the use of electric motors or small internal combustionengines and only resort to animal draught if there is no alternative. There is not a strongeconomic argument for using animals to power stationary equipment even if a farmeralready owns them and they are not in use elsewhere.
Animals are widely used for transporting goods and people and a wide range ofcarts (two-wheel) and wagons (four-wheel) designed to be pulled by animals is inuse around the world. All species of working animals are used to pull carts, but themain pack animals are equids and camelids, with bovines (including buffalo) rarelyused for this purpose. Sources of more information on transport are given in theReferences.
7.1.3 Species
Any large domestic animal may be used for draught, and farmers will choose thespecies that are available, fit in with their system of farming and are affordable. For thecrop and livestock farmers of sub-Saharan Africa who, typically, own cattle, oxen wouldbe the first choice. But, in the areas of southern Africa that have been most seriouslyaffected by droughts in the past decade where many cattle have perished, donkeys areincreasingly being used for crop production because, for smallholders, they are becomingmore available and affordable than cattle. In the drier Sahelian region, camels are thefirst choice but for how much longer smallholder farmers will be able to afford them isquestionable. In southeast Asia, particularly in the hot humid regions, buffalo are popularfor draught work. In Latin America and eastern Europe, horses, mules and oxen are thepreferred draught animals. In India, which probably has the largest population of draughtanimals in the world, oxen (usually calledbullocks) are the most popular, but in the morearid areas, such as Gujarat, camels are widely used.
7.1.4 Work Performance
As discussed previously the force an animal can exert is dependent mainly on its liveweight, and the work done, or energy expended, is calculated from the force appliedand the distance moved. Summaries of the approximate work capabilities of differentspecies are given in Tables 7.2 and 7.3. These are taken from different reference sourcesand indicate the wide range of values that can be expected.
The total amount of work that can be done depends on the animal’s energy reservesand the onset of fatigue, which, in turn, depend on the animal’s condition and nutritionalstatus. The energy cost of work can be found by measuring the animal’s metabolic ratewhile working. The most direct determinant of metabolic rate is the animal’s oxygen

Utilization 203
Table 7.2. Sustainable power of individual animals in good condition
Typical Typical EnergyTypical draught working Power Working output/day
Animal weight (kg) force (N) speed (m/s) output (W) hours/day (MJ)
Ox 450 500 0.9 450 6 10Buffalo 550 650 0.8 520 5 9.5Horse 400 500 1.0 500 10 18Donkey 150 200 1.0 200 4 3Mule 300 400 1.0 400 6 8.5Camel 500 650 1.0 650 6 14
Note. For animals of different weight the power output and energy output per day may beadjusted proportionately.
Source: [4].
Table 7.3. Draught capability and power outputs of various animals
ApproximateAverage Weight Draught Capability Average Speed Power Developed
Animal (kg) (N) (m/s) (W)
Bullock 500–900 600–800 0.56–0.83 560Cow 400–600 500–600 0.70 340Water buffalo 400–900 500–800 0.80–0.90 560Light horse 400–700 600–800 1.0 750Mule 350–500 500–600 0.9–1.0 520Donkey 200–300 300–400 0.70 260Camel 450–500 400–500 1.1 500Man 60–90 300 0.28 75
Source: [5].
consumption, but this is not easily measured, especially in field conditions. A less directbut more accessible determinant is heart rate, which varies linearly with metabolic rate.If an animal’s resting and maximum heart rates are known, the heart rate while workingis a good indicator of the stress caused by both the work and the thermal conditions.Furthermore, the heart-rate recovery during short breaks from work and after the end ofwork can indicate the fatigue induced by the work.
Equipment to measure work output in field conditions has been developed by SilsoeResearch Institute—the Animal Traction Logger; by the Centre for Tropical Veteri-nary Medicine (University of Edinburgh), the Ergometer; and by Centre de Coop´erationInternationale en Recherche Agronomique pour le D´eveloppement Syst`emes Agro-alimentaires et Ruraux, adapted from the Silsoe design. For measuring oxygen con-sumption, there is a modified version of the Silsoe device, and the Centre for TropicalVeterinary Medicine has developed a device based on the Oxylog.2 The Silsoe AnimalTraction Logger also has the ability to monitor working heart rate.
2Manufactured by P. K. Morgan Ltd., Kent, U.K., to monitor human oxygen uptake during exercise.

204 Draught Animals
7.2 Husbandry and Work Performance
7.2.1 Body Condition
The physical/physiological state of an animal, including its fitness for work, can bejudged reasonably effectively by visual examination. Experienced farmers who knowtheir animals have, of necessity, developed such a skill, and now systems of body-condition scoring have been developed. These are mainly to help extension workers andresearchers judge the condition of animals and have the added advantage of providinga consistency of appraisal. The body-condition score reflects, primarily, how healthy ananimal appears and integrates its level of nourishment and the presence of any obviousdisease or injury. One example is that proposed by Nicholson and Butterworth for oxen[6], which runs from 1 to 9, representing emaciated to obese. For work, body-conditionscores of between 4 and 6 would seem to be optimum. Oxen with a body condition ofmore than 6 may be too overweight to give optimum performance and may be moresusceptible to heat stress than leaner animals.
Working animals must be fed more than their nonworking counterparts because oftheir increased metabolic activity. A summary of the feed requirements of draught oxenis given in Table 7.4, which shows the work components separately.
The data in Table 7.4 have been in use for over 20 years, but more recent informationhas suggested that these are overestimates. Table 7.5 shows data from Pearson [8] onthe estimated energy expenditure, as a proportion of the maintenance requirement, forvarious draught tasks.
It is clear that these requirements are less than those given in Table 7.4, in which evenfor the medium workload the recommended feeding ration is double that for maintenance.
A number of factors must be considered with regard to the feeding of working animals.Does the working animal have enough time to feed? Is enough feed available and is itof sufficient quality in terms of both energy content and digestibility? Does work affectappetite and the passage of food through the body? If so, in what way and to what extent?For more details, see Pearson [8]. For horses, oxen, and buffalo, most of the questions
Table 7.4. Feed requirements for work oxen (adapted from FAO, 1972)
Light Work Medium Work Heavy Work
Weight Maintenance Work Total Work Total Work Totalof ox Ration Ration Ration Ration Ration Ration Ration(kg) (MJ) (MJ) (MJ) (MJ) (MJ) (MJ) (MJ)
250 29.9 15.6 45.5 29.9 59.8 45.5 75.4300 33.8 16.9 50.7 33.8 67.6 50.7 84.5350 37.7 19.5 57.2 37.7 75.4 57.2 94.9400 41.6 20.8 62.4 41.6 83.2 62.4 104.0450 45.5 23.4 68.9 45.5 91.0 68.9 114.4500 49.4 24.7 74.1 49.4 98.8 74.1 123.5
Note. 1 kg of maize or other cereal grain yields about 13 MJ of metabolizable energy.Adapted from [7].
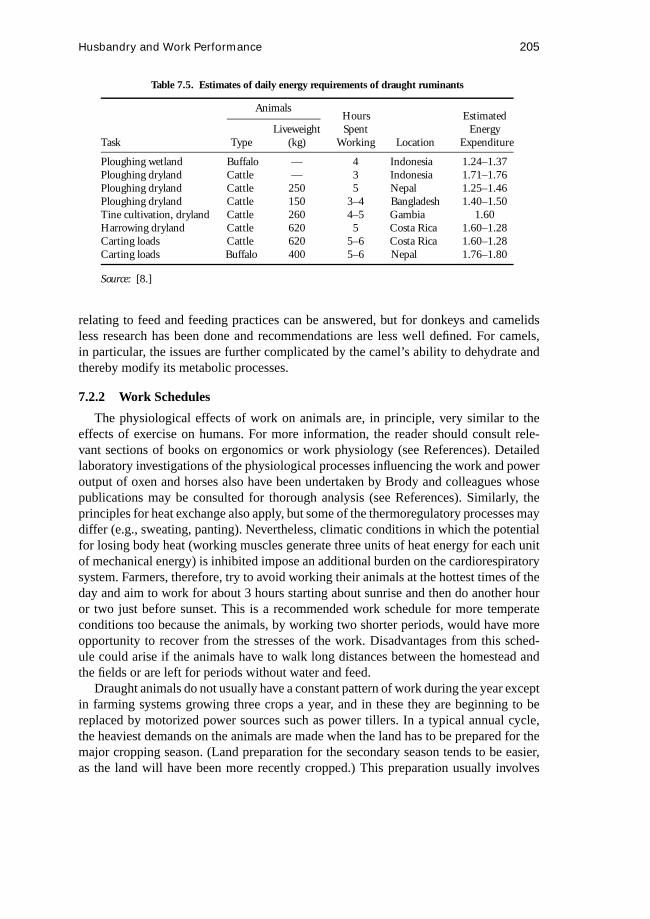
Husbandry and Work Performance 205
Table 7.5. Estimates of daily energy requirements of draught ruminants
Animals
LiveweightTask Type (kg)
HoursSpent
Working Location
EstimatedEnergy
Expenditure
Ploughing wetland Buffalo — 4 Indonesia 1.24–1.37Ploughing dryland Cattle — 3 Indonesia 1.71–1.76Ploughing dryland Cattle 250 5 Nepal 1.25–1.46Ploughing dryland Cattle 150 3–4 Bangladesh 1.40–1.50Tine cultivation, dryland Cattle 260 4–5 Gambia 1.60Harrowing dryland Cattle 620 5 Costa Rica 1.60–1.28Carting loads Cattle 620 5–6 Costa Rica 1.60–1.28Carting loads Buffalo 400 5–6 Nepal 1.76–1.80
Source: [8.]
relating to feed and feeding practices can be answered, but for donkeys and camelidsless research has been done and recommendations are less well defined. For camels,in particular, the issues are further complicated by the camel’s ability to dehydrate andthereby modify its metabolic processes.
7.2.2 Work Schedules
The physiological effects of work on animals are, in principle, very similar to theeffects of exercise on humans. For more information, the reader should consult rele-vant sections of books on ergonomics or work physiology (see References). Detailedlaboratory investigations of the physiological processes influencing the work and poweroutput of oxen and horses also have been undertaken by Brody and colleagues whosepublications may be consulted for thorough analysis (see References). Similarly, theprinciples for heat exchange also apply, but some of the thermoregulatory processes maydiffer (e.g., sweating, panting). Nevertheless, climatic conditions in which the potentialfor losing body heat (working muscles generate three units of heat energy for each unitof mechanical energy) is inhibited impose an additional burden on the cardiorespiratorysystem. Farmers, therefore, try to avoid working their animals at the hottest times of theday and aim to work for about 3 hours starting about sunrise and then do another houror two just before sunset. This is a recommended work schedule for more temperateconditions too because the animals, by working two shorter periods, would have moreopportunity to recover from the stresses of the work. Disadvantages from this sched-ule could arise if the animals have to walk long distances between the homestead andthe fields or are left for periods without water and feed.
Draught animals do not usually have a constant pattern of work during the year exceptin farming systems growing three crops a year, and in these they are beginning to bereplaced by motorized power sources such as power tillers. In a typical annual cycle,the heaviest demands on the animals are made when the land has to be prepared for themajor cropping season. (Land preparation for the secondary season tends to be easier,as the land will have been more recently cropped.) This preparation usually involves

206 Draught Animals
ploughing, and it coincides with the situation of low or exhausted feed stocks when theanimals are usually found to be in their poorest body condition. However, the extent towhich body condition may deteriorate without compromising work output or efficiencyis not yet fully understood. It would seem reasonable for farmers to save some feed duringthe year to give to their draught animals just before or during ploughing. However, thisrepresents a rather idealistic and rarely achieved situation for most smallholder farmers,and the benefits of doing so have not been quantified. There is some evidence to suggestthat the farmers who have been able to store feed would not give it to their draughtanimals anyway, as it would be used to greater economic advantage if fed to cows in-calfor with calves.
7.2.3 Multipurpose Animals
There is an almost universal complaint from smallholder farmers who rely on DAPthat there is insufficient draught power to meet everyone’s needs. Traditionally, farmerswho have used animals for draught work have kept some males specifically for thispurpose, but increasing pressures on land and feed, together with the underlying costs ofmaintaining and maybe purchasing them, have prompted a change. This is particularlythe case for farmers who own cattle, who have tried to economize by using cows forwork. It is still rare to find a farmer spanning cows exclusively, but it is not uncommonto find cows being spanned with oxen to make a team of two or four, where the farmercannot afford to buy or maintain a complete team of males. This raises the question ofhow much work a female animal can do before her milk production or, more seriously,her fertility is affected. If a cow is worked to the point of infertility, the outputs of milkand calves (or foals) are lost and the farmer has lost an asset of greater potential valuethan a working animal. Recently, research has been undertaken to evaluate the effectsof using cows for draught, but the results have not been conclusive. It is clear, however,that when milking cows are used for work supplementary feeding is essential.
The use of draught animals for transport is unlikely to be a problem, as the greatestdemand for transport occurs at and after harvest when there are few calls on the animals forland preparation or weeding tasks. In the farming systems in which there is a secondarycropping season, the cultivation operations are less arduous and there should be anadequate supply of feed.
In sub-Saharan Africa donkeys are becoming more widely used for cropping opera-tions. There are several possible reasons but the commonest is a shortage of suitableanimals: either the farmers cannot afford the purchase price or they cannot afford to keepthem.
7.3 Draught Animals in Farming Systems
The importance of draught animals in current food production in industrially devel-oping countries, and their role in increasing food production in the future, is clear fromthe FAO statistics given in Table 7.6.
DAP provides 23% of the mechanical energy used for crop production compared withonly 6% from tractors. Future improvements in crop production are likely to based on

Draught Animals in Farming Systems 207
Table 7.6. Proportional contributions to the totalenergy use for crop production in developing countries
Contributions (%)
Region Human Animal Tractor
North Africa 69 17 14Sub-Saharan Africa 89 10 1Asia (excluding China) 68 28 4Latin America 59 19 22Overall 71 23 6
Note. Animal and tractor contributions estimated byconverting to man-day equivalents per hectare.
Source: [9].
the transition from human labor to DAP, rather than from DAP to tractor power, but sucha change can occur only if farmers find it profitable to adopt or extend DAP.
The successful use, or introduction, of draught animals depends on a number offactors. These include the intensity of agricultural production, the local population den-sity, access to markets, soil type, and the length of the growing season [10]. As allthese factors increase or improve, the likelihood of DAP being economically viable andsustainable also increases. The attitudes towards the adoption of DAP may be more fa-vorable in cultures in which livestock have a social or socioeconomic function, such asfor dowries.
References
1. Tools for Agriculture. 1992. London: Intermediate Technology Publications.2. Mbanje, E., and O’Neill D. 1997.Database for Animal Drawn Tillage Implements.
In Ellis-Jones, J. Pearson, A. O’Neill, D., and Ndlovn, L. (eds.) “Improving theProductivity of Draught Animals in Sub-Saharan Africa”. Proceedings of a TechnicalWorkshop, 25–27 February 1997, Harare. International Development Group ReportIDG/97/7, Silsoe Research Institute, Silsoe UK pp. 77–119.
3. Riches C. R., Twomlow, S. J., and Dhliwayo, H. 1997. Low-input weed managementand conservation tillage in semi-arid Zimbabwe.Experimental Agricultural33:173–187.
4. Inns, F. 1992. Field power. InTools for Agriculture, pp. 9–18. London: IntermediateTechnology Publications.
5. Campbell, J. K. 1990.Dibble Sticks, Donkeys and Diesels. Philippines: InternationalRice Research Institute, Manila.
6. Nicholson, M. J., and Butterworth, M. 1986. A guide to condition scoring of Zebucattle. ILCA (International Livestock Centre for Africa). Addis Ababa, Ethiopia.36 p.
7. CEEMAT. 1972. The employment of draught animals in agriculture. Rome: FAO.8. Pearson, A. 1996. Feeding strategies for cattle and buffalo used for work.World
Animal Review87: 45–55.

208 Draught Animals
9. FAO. 1987.The Next 25 Years. Rome: Author.10. Ehui, S., and Polson, R. 1993. A review of the economic and ecological constraints
on animal draft cultivation in Sub-Saharan Africa.Soil and Tillage Research27:195–210.
Bibliography
Bakkoury, M., and Prentis, R. A. (eds.). 1994.Working equines. Proceedings of SecondInternational Colloquium, April 20–22, Rabat, Morocco. Rabat, Morocco: ActesEditions, Institut Agronomique et Veterinaire Hassan II.
Barwell, I., and Ayre, M. 1982.The Harnessing of Draught Animals. Intermediate Tech-nology Publications, London.
Bordet, D. 1988.Draft Animal Power Technology in French-Speaking West Africa.CEEMAT, France.
Brody, S. 1964.Bioenergetics and Growth. New York: Hafner Publishing Company.Conroy, D., and Barney, D. 1986.The Oxen Handbook. LaPorte, CO: Butler Publishing
& Tools.Dennis, R. 1996. Guidelines for the Design, Production and Testing of Animal-Drawn
Carts. London: Intermediate Technology Publications.Falvey, L. Undated.An Introduction to Working Animals. MPW, Melbourne, Australia.Fielding, D., and Pearson, R. A. (eds.). 1990. Donkeys, mules and horses in tropical
agricultural development. Proceedings of a Colloquium held September 3–6,Edinburgh, UK. Centre for Tropical Veterinary Medicine, University of Edin-burgh, UK.
Hoffmann, D., Nari, J., and Petheram, R. J. (eds.). 1989. Draught animals in rural devel-opment: Proceedings of an international research symposium. July 3–7, 1989,Cipanas, Indonesia. ACIAR Proceedings No. 27, ACIAR, Canberra.
Jones, P. A., 1991.Training Course Manual on the use of Donkeys in Agriculture inZimbabwe. Borrowdale, Harare, Zimbabwe: AGRITEX Institute of AgriculturalEngineering.
Lawrence, P. R., and Pearson, R. A. 1985. Factors affecting the measurement of draughtforce, work output and power of oxen.Journal of Agricultural Science105:703–714.
Munzinger, P. 1982.Animal Traction in Africa. Eschborn: GTZ.O’Neill, D. H., and Hendriksen, G. (eds.). 1993. Human and draught animal power
in crop production. Proceedings of an International Workshop, January 18–22,Rome: FAO.
O’Neill, D. H., and Kemp, D. C. 1989. A comparison of work outputs of draught oxen.Journal of Agricultural Engineering Research43: 33–44.
O’Neill, D. H., Wanders, A. A., and Mbanje, E. 1997.Technology for Donkey Utilisation.Paper to ATNESA (Animal Traction Network for Eastern and Southern Africa)Workshop “Improving Donkey Utilisation and Management”, 5–9 May 1997.Debre Zeit Ethiopia. (Proceedings in press, ATNESA c/o AGRITEX Institute ofAgricultural Engineering, Harare, Zimbabwe.)

Draught Animals in Farming Systems 209
Sims, B. G., and O’Neill, D. H. 1996. Draft animal power on fragile hillsides: Technologyfor environmental protection. Paper to International congress on Animal Traction,Havanna, Cuba, February 19–24.
Sims, B. G., and Starkey, P. 1996. Experiences with the introduction of draft animals andnew implements. Paper to International congress on Animal Traction, Havanna,Cuba, February 19–24.
Srivastava, N. S. L., and Ojha, T. P. 1987. Utilisation and economics of draught animalpower. Proceedings of the national seminar on status of animal energy utilisationheld at CIAE, Bhopal, January 24–25. Bhopal: CIAE.
Starkey, P., 1989.Harnessing and Implements for Animal traction. Eschborn: GTZ.Starkey, P., Mwenya, E., and Stares, J. (eds.). 1994. Improving animal traction technol-
ogy. Proceedings of first workshop of the Animal Traction Network for Easternand Southern Africa (ATNESA), January 18–23. Lusaka, Zambia. Wageningen,The Netherlands: Centre for Agriculture and Rural Cooperation.
Svendsen, E. D. 1986.The Professional Handbook of the Donkey. England: The DonkeySanctuary.
Upadhyay, R. C. 1990.Draught Animal Efficiency Limiting Factors. Mathur, India: SunilPublications.
Upadhyay, R. C., and Madan, M. L. 1985. Studies on blood acid-base status and musclemetabolism in working bullocks.Animal Production40: 11–16.
Vall, E. 1996. Les animaux de trait au Nord-Cameroun: zebu, ane et cheval. Performancesa l’effort et adaptations physiologiques. Document du travail du CIRAD-EMVTNo.1, Montpellier, France.
Zerbini, E., Gemeda, T. O’Neill, D. H., Howell, P. J., and Schroter, R. C. 1992. Rela-tionships between cardio-respiratory parameters and draught work output in F1
crossbred dairy cows under field conditions.Animal Production55: 1–10.

210

8 Aquacultural Systems
F. W. Wheaton and S. Singh
8.1 Introduction
According to Food and Agriculture Organization statistics, the 1994 world aquacul-tural production of finfish, shellfish, and aquatic plants was 25.5 million tons, valued atUS $39.83 billion [1]. These figures represented overall increases of 11.8% and 10.3%over the 1993 production in weight and value, respectively. Asian countries contributedalmost 90% of the total world aquacultural production in 1994. The Food and Agri-culture Organization further estimated that the combined output of ocean fisheries andaquaculture will grow 10% to 30% by the year 2010 and that aquaculture will continueto increase its share in the total production due in part to declining or stabilized oceanharvests in many parts of the world.
Nash [2] in a recent comprehensive review of world aquaculture reports that carp andtilapia production represents about 46% of the total world aquacultural production on aweight basis, salmon and trout 4%, shrimp and prawn 2.2%, oysters and mussels 37%,and catfish 2.2%. Lawson [3], based on a survey of recent government publications,reports that the freshwater production accounts for 80% to 90% of the world’s finfishproduction, and 95% of this is in ponds. Lawson [3] further reports that cage culturerepresents only 3% to 4% of freshwater finfish production, but about 40% of marine andbrackish water finfish production.
The aquaculture industry is the fastest growing segment of the U.S. agriculture. U.S.aquaculture production has been dominated by finfish production, particularly catfish,which represents about half of total U.S. finfish production [3]. However, the expandingaquaculture industry is now paying close attention to other fish species and many of themare showing commercial potential. Tilapia and hybrid striped bass are two such species.Lawson [3] and Stickney [4] discuss current culture practices of several commercialaquatic species and the changing pattern of U.S. aquaculture production.
8.2 System Types
An aquacultural production system can be described simply as production of mar-ketable aquatic organisms under controlled or semicontrolled conditions. Aquaculturalsystems are classified in a variety of ways depending upon the viewer’s perspective and
211
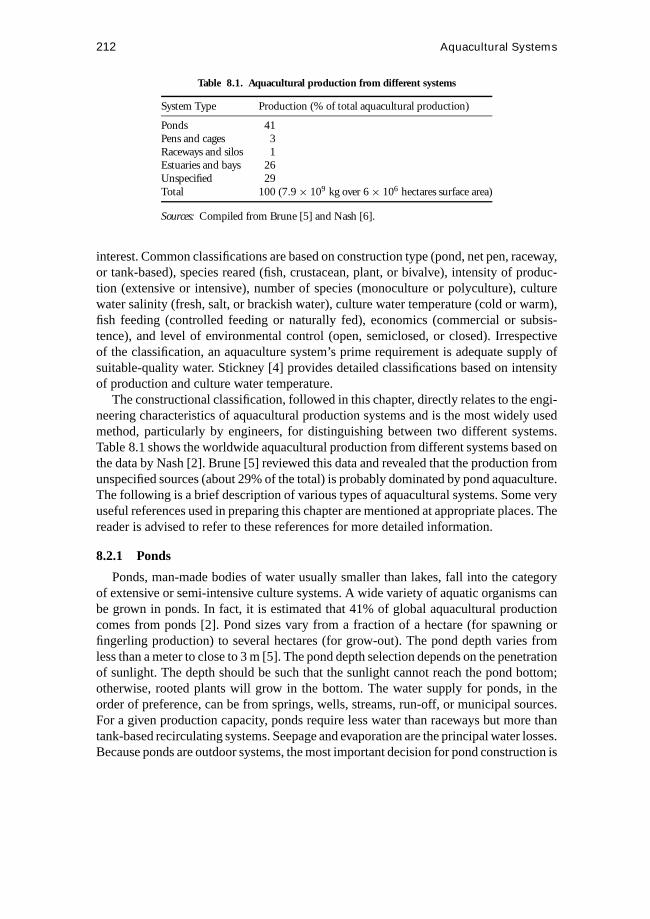
212 Aquacultural Systems
Table 8.1. Aquacultural production from different systems
System Type Production (% of total aquacultural production)
Ponds 41Pens and cages 3Raceways and silos 1Estuaries and bays 26Unspecified 29Total 100 (7.9× 10⁹ kg over 6× 10⁶ hectares surface area)
Sources: Compiled from Brune [5] and Nash [6].
interest. Common classifications are based on construction type (pond, net pen, raceway,or tank-based), species reared (fish, crustacean, plant, or bivalve), intensity of produc-tion (extensive or intensive), number of species (monoculture or polyculture), culturewater salinity (fresh, salt, or brackish water), culture water temperature (cold or warm),fish feeding (controlled feeding or naturally fed), economics (commercial or subsis-tence), and level of environmental control (open, semiclosed, or closed). Irrespectiveof the classification, an aquaculture system’s prime requirement is adequate supply ofsuitable-quality water. Stickney [4] provides detailed classifications based on intensityof production and culture water temperature.
The constructional classification, followed in this chapter, directly relates to the engi-neering characteristics of aquacultural production systems and is the most widely usedmethod, particularly by engineers, for distinguishing between two different systems.Table 8.1 shows the worldwide aquacultural production from different systems based onthe data by Nash [2]. Brune [5] reviewed this data and revealed that the production fromunspecified sources (about 29% of the total) is probably dominated by pond aquaculture.The following is a brief description of various types of aquacultural systems. Some veryuseful references used in preparing this chapter are mentioned at appropriate places. Thereader is advised to refer to these references for more detailed information.
8.2.1 Ponds
Ponds, man-made bodies of water usually smaller than lakes, fall into the categoryof extensive or semi-intensive culture systems. A wide variety of aquatic organisms canbe grown in ponds. In fact, it is estimated that 41% of global aquacultural productioncomes from ponds [2]. Pond sizes vary from a fraction of a hectare (for spawning orfingerling production) to several hectares (for grow-out). The pond depth varies fromless than a meter to close to 3 m [5]. The pond depth selection depends on the penetrationof sunlight. The depth should be such that the sunlight cannot reach the pond bottom;otherwise, rooted plants will grow in the bottom. The water supply for ponds, in theorder of preference, can be from springs, wells, streams, run-off, or municipal sources.For a given production capacity, ponds require less water than raceways but more thantank-based recirculating systems. Seepage and evaporation are the principal water losses.Because ponds are outdoor systems, the most important decision for pond construction is

System Types 213
the site selection. Ideally, the site should have an adequate supply of good quality waterand clay-rich soil to reduce losses from the pond. Where needed, a variety of pond sealersare available to reduce seepage. They do, however, increase pond construction costs.
Two primary types of ponds are embankment and excavated ponds. Embankmentponds are formed by building up a dam, dike, or similar above-ground structure to holdwater. Excavated ponds are constructed by removing soil from an area to form a depres-sion that can be filled with water. Embankment ponds are the type most commonly usedfor fish culture, as they can be constructed in a wide range of topographic conditions.In most situations, they also have other significant advantages over excavated pondsincluding simpler construction, lower pumping cost, and ease of harvesting. Primarydisadvantages of excavated ponds are their need to be constructed in an area of relativelyflat topography and the cost of removing the necessarily large amounts of soil. More-over, any water removed from an excavated pond must be pumped. Some ponds requireboth embankments and excavation to achieve the desired water-holding capacity. Con-siderations for pond construction include intensity of production, feeding and harvestingmethod, water supply and drainage, soil type, topography, conformation, dimensionsand slopes, maintenance, and aeration.
The feeding method in aquacultural ponds may be either natural (cultured organismsderive their food from algae or other naturally growing aquatic organisms in the pond)or manual with commercial diets. A combination of the two methods can also be used.In densely stocked ponds, some type of mechanical aeration may be needed to maintainproper oxygen concentration.
Production per unit area varies by a factor of 10 for different practices and species.Low-intensity and minimum-management ponds yield 500 to 1000 kg/ha, but yieldsabove 10,000 kg/ha are achievable using commercial practices [5].
8.2.2 Raceways
Raceways are single-pass, relatively shallow structures, typically with a rectangularcross-section, containing aquatic organisms. Significant water flow through a raceway isrequired to remove accumulated wastes, provide aeration, and maintain suitable environ-mental conditions for the species reared. Raceway culture is widely used in hatcheriesbecause flowing water minimizes metabolite concentration and enhances oxygen trans-fer. Intensity of production can be much higher in raceways than in ponds because thewater is changed continuously. Salmon and trout culture have been successfully prac-ticed in raceways. Raceways can utilize gravity flow of water to minimize pumping costs,provided the water supply is a freshwater spring and the raceways are located on thedownstream side.
There are two basic arrangements of raceways—series and parallel. The series ar-rangement requires less water than the parallel arrangement because the outlet waterfrom one raceway is used by the next one in the series. Design considerations for race-ways are a fish culture suitable for raceways, water supply for the raceway, shape,size, intensity, series or parallel flow, maintenance, and aeration. Design calculations in-clude water-exchange rate, stocking density, water velocity through the raceway, oxygen
214 Aquacultural Systems
concentration, and ammonia concentration. Soderberg [6] and Youngs and Timmons [7]illustrate these calculations.
8.2.3 Net Pens and Cages
Net pens and cages, terms often used interchangeably, are floating structures in openwater and are usually located within a pond, lake, reservoir, river, estuary, or openocean environments. Netting or plastic mesh material is used around a frame to form anenclosure for aquatic organisms intended for production. Beveridge [8] provides detailedinformation on various aspects of net-pen and cage aquaculture. Two primary types ofnet enclosure are used for fish culture. The first, the net pen, is employed in relativelyshallow waters (usually less than 10 m). This system consists of rigid poles, pilings, orother fixed structures driven into the bottom [9]. The rigid framework supports the netthat is stretched around it. The bottom of the enclosure is formed by the natural bottomof the water body. Net pens range in size from 1 m2 to several hectares in surface area[8]. In deeper water the closeness of spacing and size of the framework elements neededto withstand forces imposed on them become excessive. Construction and materialscosts also become prohibitive. Thus in deeper water anchored floating net enclosuresor cages are used. Cages are generally smaller than net pens and range in size from1 m2 to over 1000 m2 in surface area [8]. Primary design considerations of net retainingstructures are shape, size, stocking intensity, water flow, management method, materialsof construction, and loads.
The advantages of net-pen systems include low input and minimum-management.The main disadvantage is that the net pens are exposed to climatic disturbances thatmay cause severe structural damages and loss of fish. Also, net-pen systems may havesignificant detrimental effects on the natural environment. This often is reflected in thehigh cost of obtaining a permit for establishing net-pen operations in certain areas [10].
The fish are first produced in hatcheries and then transferred to cages as young fin-gerlings. One of the methods used by Beveridge [8] to classify cage culture is based onfeed inputs, such as extensive (natural foods such as plankton or detritus), semi-intensive(feed containing less than 10% protein), and intensive (feed containing more than 20%protein). Harvesting of fish from net retaining structures is done either by lifting a cageabove the water surface and emptying the cage or by crowding the fish into a smallarea.
8.2.4 Tanks and Recirculating Aquacultural Systems
Tank aquaculture has been in existence for a long time in the form of home aquari-ums, fingerling production units, and large public-display facilities. Although tank-basedaquaculture represents a very small fraction of world aquacultural production at present,the future of such systems is promising. This is because tank-based systems offer sev-eral advantages over other aquacultural systems. Higher intensity of production, betterenvironmental control, lower water usage, potential for low impact on the natural en-vironment, control of market time and size, and site-independence are the main bene-fits. Because of significant advances in materials technology, a wide variety of tanks,ranging from wooden tanks with liners to prefabricated fiberglass structures, are available

System Types 215
commercially in various shapes, sizes, and price ranges. Also, the availability of a widevariety of pipes and fittings makes installation of tank-based systems fast and easy. Tanksare smaller than ponds, for easy transportability and cleaning. Large tanks are usuallyassembled at the location.
Tank-based systems represent a significant shift in the way aquaculture is practiced byproviding a higher level of control over production and management operations. Appli-cations of sophisticated water treatment and electronic technologies in aquaculture areaccelerating this transformation. Recirculating aquaculture systems are at the forefrontof this technological transformation. National and international production figures forthese systems are not available, as recirculating systems are still in the developmentalstages and very few have been operating on commercial scale.
A recirculating aquaculture system is defined as an assemblage of parts and devicesused for husbandry of aquatic organisms in which water is continuously cleaned andrecycled. These systems are more complex in design and operation than any other systemdescribed here. They employ a variety of technologies to conserve water and providehigh-intensity production. The schematic of a recirculating system is shown in Fig. 8.1.Timmons and Losordo [11] provide a comprehensive collection of articles by severalexperts on various engineering and management aspects of recirculating aquaculturesystems.
The advantages offered by recirculating systems include control of fish environmentfor reduced stress, faster growth, better feed conversion ratio, reduced incidence of dis-eases, reduced water usage, lack of site limitations, year-round production, control ofmarket time and size, and consistency of quality and quantity of product. Main disad-vantages are that these systems are capital intensive; they need skilled management; anda limited number of treatment compounds are available for treating fish without harmingthe biofilters.
A typical recirculating aquaculture system is a configuration of several chemical,biological, and mechanical processes. Essential components include a fish-culture tank, a
Figure 8.1. Schematic of a recirculating aquacultural system.Note: Residence Time = Volume/Tank outflow = V/Qt; Replacement Time = Volume/Tankinflow = V/Qf; Recycle Ratio = Recycle flow/Tank outflow = Qr/Qt; Turnover Time = Tank
outflow/Volume = Qt/V = 1/Residence Time; Wastewater Discharge = Qw.

216 Aquacultural Systems
biofilter for ammonia removal, a particulate removal device, and an aeration/oxygenationsystem. Optional components or accessories may include an ozone-application devicefor disinfection, color, or odor control; a degassing device for carbon dioxide removal;and monitoring and control devices. For indoor systems heating, ventilation, and air-conditioning equipment may also be required.
Desirable characteristics of an aquaculture tank include a smooth interior, good cir-culation, ease of cleaning and sterilization, durability and strength, a nontoxic surface,and inexpensiveness. Commonly available shapes are circular, oval, rectangular, andsilo-shaped. Tanks can be made of a wide range of materials including concrete, plastics,wood with liner, steel, and fiberglass.
Particulates found in aquaculture systems are mostly feces, debris, feed, and bacterialmass. Particulate removal devices utilize one or more of the following properties of theparticulates to remove the particles from the culture water: density, size, electrical charge,and chemical and magnetic properties. Most common methods are gravity separationby a sedimentation chamber, multitube clarifier, and hydroclone. Physical separationof particulates from the culture water is also done using strainer devices such as sand,screens (either fixed or rotary), or other fixed-bed media.
Dissolved metabolites in the culture water consist mainly of organic compoundsand ammonia. Ammonia in its un-ionized form is extremely toxic to most aquacul-tural species. Detoxification and metabolite-removal devices usually depend on eitherchemical or biological methods.
Chemical filters work on the principle of adsorption (concentration of a substance ona surface or interface). Examples of chemical filters are granular activated carbon andion-exchange filters. Filter breakthrough and filter regeneration are important conceptsin the chemical filter design and operation.
Biofilters operate on the principle of biological conversion of toxic waste into nontoxicor much less toxic compounds by bacteria (heterotrophs and autotrophs) growing on amedium. Ideal biofilter media should have large surface area and high void fraction and bestable, durable, lightweight, and inexpensive. Commonly used biofilter media are sand,gravel, lime stone, crushed oyster shells, and plastics (PVC, Styrofoam, Polyethylene,Fiberglass, and Teflon). There are several different biofilter types including submergedbed (down-flow, up-flow, or horizontal flow), fluidized bed, bead filter, emerged bed ortrickling filter, and combination (reciprocating or rotating biological contactors). Biofilteroperation requires time on start-up to stabilize. After reaching steady-state, dissolvedoxygen, temperature, pH, nutrients, and inhibiting chemicals become the most importantoperational parameters. The biofilter efficiency also depends on media surface area, massloading, and hydraulic loading.
Aeration/oxygenation devices use either air or pure oxygen to maintain proper oxy-gen concentration in the culture water. Surface aerators, fine-pore diffusers, and u-tubeoxygenation devices are some of the common ones.
Although expensive, ozone treatment is sometimes used for disinfection, fine-particleremoval, dissolved-organics removal, or color removal. Dose, location, and time areimportant parameters for ozone application in recirculating aquaculture systems.

References 217
References
1. Aquaculture Magazine Buyer’s Guide ’97. 1997. pp. 6–26.2. Nash, C. E. 1988. A global overview of aquaculture production.Journal of the World
Aquaculture Society, 19(2).3. Lawson, T. B. 1995.Fundamentals of Aquacultural Engineering. Chapman and
Hall, New York.4. Stickney, R. R. 1994.Principles of Aquaculture. John Wiley and Sons, New York.5. Brune, D. E. 1991. Pond aquaculture. In: Engineering Aspects of Intensive Aquacul-
ture:Proceedings from the Aquaculture Symposium. Northeast Regional AgriculturalEngineering Service, Cornell University, Ithaca, NY, pp. 118–130.
6. Soderberg, R. W. 1995.Flowing Water Fish Culture. Boca Raton, FL: CRC Press,Inc. 147 pp.
7. Youngs, W. D. and M. B. Timmons. 1991. A historical perspective of raceway design.In: Engineering Aspects of Intensive Aquaculture. Northeast Regional AgriculturalEngineering Service, Ithaca, NY, pp. 160–169.
8. Beveridge, M. 1996.Cage Culture. Fishing News Books, Oxford, England.9. Wheaton, F. W. 1977.Aquacultural Engineering. John Wiley and Sons, New York.
10. Riley, J. 1991. Ocean net-pen culture of salmonids: engineering considerations. In:Engineering Aspects of Intensive Aquaculture:Proceedings from the AquacultureSymposium. Northeast Regional Agricultural Engineering Service, Cornell Univer-sity, Ithaca, NY, pp. 131–150.
11. Timmons, M. B. and T. M. Losordo. 1994.Aquaculture Water Reuse Systems: En-gineering Design and Management. Elsevier Science, Amsterdam.

218
9 EnvironmentalRequirements
S. Singh and F. W. Wheaton
9.1 Primary Constraints in Aquacultural Systems
9.1.1 Properties of Water
Water, the environment of all aquatic life, has some peculiar physical and chemicalproperties owing to its unique molecular structure. For example, the liquid nature ofwater is an anomaly among most inorganic compounds. Both melting and boiling pointsof water are unusual for liquids of similar molecular weight. Unlike most other liquids,the volume of a water mass increases by 11% to 12% upon freezing. Wheaton [1],Stickney [2], and Lawson [3] are good references for detailed information on the physicaland chemical properties of water from an aquaculture point of view. Some importantproperties are summarized in Table 9.1 and discussed here.
Water temperature is the most influential parameter in aquatic systems because of itssignificant effect on both the physiological processes of the aquatic life (most are cold-blooded) and the environment surrounding the aquatic life. For example, the metabolicrate of catfish doubles for each 10◦C rise in temperature over the range 0◦C to 35◦C [4].This effect is calledQ10 factorand applies to almost all cold-blooded aquatic organismsincluding bacteria, zooplankton, insects, and fish. Figure 9.1 demonstrates a generaleffect of temperature on an aquatic organism. Most aquatic organisms have a narrowtemperature range for optimum growth. In open or natural systems, solar radiation isthe prime source of thermal energy. The density of water varies with temperature and ismaximum at 3.94◦C. This property leads to the thermal stratification of the water col-umn in aquaculture ponds, which can cause resistance to circulation and oxygen transfer.Specific heat of water as compared with other liquids is high (4.186 kJ/kg·K), and there-fore it acts as a good heat-storage medium, protecting aquatic organisms against largetemperature fluctuations in outdoor aquacultural systems. However, this property alsorequires large amounts of heat for raising water temperature in controlled-environment,warm-water aquacultural systems. Water has a high viscosity relative to other liquids,which decreases with an increase in temperature. Viscosity affects sedimentation or sink-ing rate of plankton in ponds, sedimentation rate of sediments, and energy expenditureby fish for swimming.
219
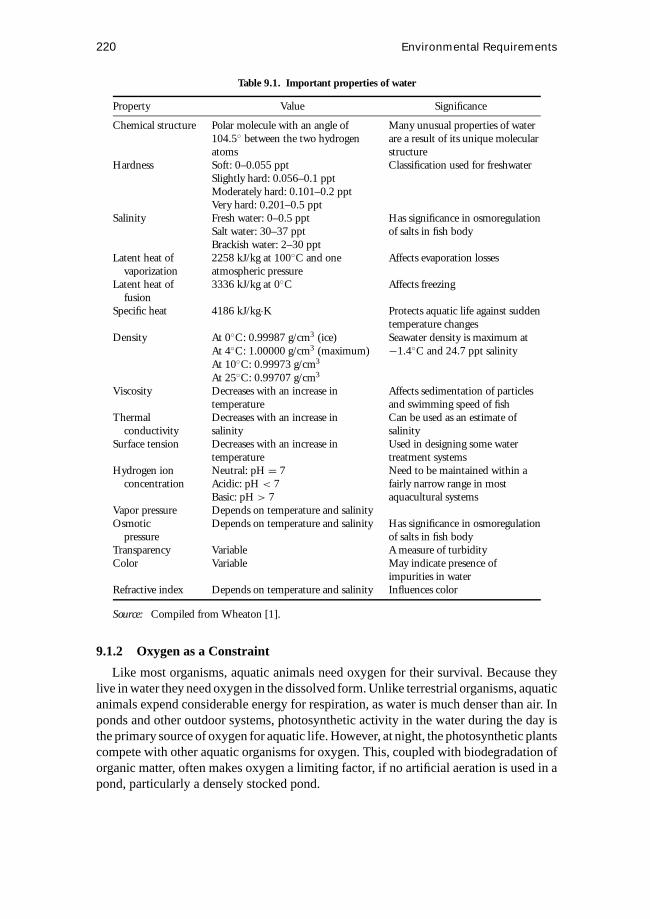
220 Environmental Requirements
Table 9.1. Important properties of water
Property Value Significance
Chemical structure Polar molecule with an angle of Many unusual properties of water104.5◦ between the two hydrogen are a result of its unique molecularatoms structure
Hardness Soft: 0–0.055 ppt Classification used for freshwaterSlightly hard: 0.056–0.1 pptModerately hard: 0.101–0.2 pptVery hard: 0.201–0.5 ppt
Salinity Fresh water: 0–0.5 ppt Has significance in osmoregulationSalt water: 30–37 ppt of salts in fish bodyBrackish water: 2–30 ppt
Latent heat of 2258 kJ/kg at 100◦C and one Affects evaporation lossesvaporization atmospheric pressure
Latent heat of 3336 kJ/kg at 0◦C Affects freezingfusion
Specific heat 4186 kJ/kg·K Protects aquatic life against suddentemperature changes
Density At 0◦C: 0.99987 g/cm3 (ice) Seawater density is maximum atAt 4◦C: 1.00000 g/cm3 (maximum) −1.4◦C and 24.7 ppt salinityAt 10◦C: 0.99973 g/cm3
At 25◦C: 0.99707 g/cm3
Viscosity Decreases with an increase in Affects sedimentation of particlestemperature and swimming speed of fish
Thermal Decreases with an increase in Can be used as an estimate ofconductivity salinity salinity
Surface tension Decreases with an increase in Used in designing some watertemperature treatment systems
Hydrogen ion Neutral: pH = 7 Need to be maintained within aconcentration Acidic: pH < 7 fairly narrow range in most
Basic: pH > 7 aquacultural systemsVapor pressure Depends on temperature and salinityOsmotic Depends on temperature and salinity Has significance in osmoregulation
pressure of salts in fish bodyTransparency Variable A measure of turbidityColor Variable May indicate presence of
impurities in waterRefractive index Depends on temperature and salinity Influences color
Source: Compiled from Wheaton [1].
9.1.2 Oxygen as a Constraint
Like most organisms, aquatic animals need oxygen for their survival. Because theylive in water they need oxygen in the dissolved form. Unlike terrestrial organisms, aquaticanimals expend considerable energy for respiration, as water is much denser than air. Inponds and other outdoor systems, photosynthetic activity in the water during the day isthe primary source of oxygen for aquatic life. However, at night, the photosynthetic plantscompete with other aquatic organisms for oxygen. This, coupled with biodegradation oforganic matter, often makes oxygen a limiting factor, if no artificial aeration is used in apond, particularly a densely stocked pond.

Primary Constraints in Aquacultural Systems 221
Figure 9.1. Hypothetical effect of water temperature on fish growth.
Oxygen transfer to water represents significant economic cost in most aquaculturalsystems. It can be achieved by several different methods such as mechanical or gravityaerators and pure oxygen injection. Table 9.2 lists oxygen-transfer rates of various oxy-genation devices used in modern aquacultural systems. The oxygen-transfer rate intoculture water directly depends on the saturation concentration of oxygen in the culturewater. The saturation concentration is influenced by temperature, elevation, barometricpressure, salinity, hydrostatic pressure, and oxygen concentration in the feed gas. It de-creases with an increase in water temperature, salinity, or elevation, and increases withan increase in barometric pressure, hydrostatic pressure, or oxygen concentration in thefeed gas. Table 9.3 provides the saturation concentration of dissolved oxygen in water incontact with air at different values of temperature and elevation. The solubility of prin-cipal components of atmospheric air in freshwater is shown in Table 9.4 as a function ofatmospheric pressure and gas composition. Some important observations can be madefrom this table. The solubility of oxygen doubles (from 10.08 mg/L to 20.32 mg/L) whenthe pressure is increased from 1 to 2 atm. Also, using pure oxygen as a feed gas, theoxygen solubility in the water can be increased almost five times that obtainable usingair as a feed gas. Because nitrogen solubility is higher than that of oxygen, the use ofair as a feed gas at higher pressures will result in water becoming quickly saturated withnitrogen, which is known to cause gas-bubble disease in fish.
9.1.3 Fish Waste
Water is considered a universal solvent (i.e., provided enough time, many substancesincluding some undesirable waste materials will dissolve in it). This causes direct phys-ical exposure of fish to their own waste. The dissolved portion of uneaten feed and

222 Environmental Requirements
Table 9.2. Oxygen transfer rates of various devices used in aquaculture
Transfer Rate (kg O2/kWh)
Aeration Device At 20◦C and 0.0 mg DO/L At 20◦C and 6 mg DO/L
Diffused-air systemsFine-bubble 1.2–2.0 0.25–0.42Medium-bubble 1.0–1.6 0.21–0.34Coarse-bubble 0.6–1.2 0.13–0.25
Pure-oxygen systemsFine-bubble 1.2–1.8Mechanical surface aeration 1.0–1.2Turbine-sparger 1.2–1.5
Low-speed surface with or without draft tube 1.2–2.4 0.25–0.50High-speed floating aerator 1.2–2.4 0.25–0.50Floating rotor aerator 1.2–2.4 0.25–0.50U-tube aerator
Zero head available 4.5 0.9530-cm head available 45.6 9.58
Gravity aerator 1.2–1.8 0.25–0.38Venturi aerator 1.2–2.4 0.25–0.50Static tube systems 1.2–1.6 0.25–0.34
Source: Compiled from Colt and Tchobanoglous [5].Note: DO, dissolved oxygen.
Table 9.3. Solubility of oxygen in fresh water to water-saturated air at varioustemperatures and elevations above mean sea level
Solubility by Elevation in Feet
Temperature (◦C) 0 500 1000 1500 2000 3000 4000
0 14.60 14.34 14.09 13.84 13.59 13.12 12.651 14.20 13.95 13.70 13.46 13.22 12.95 12.302 13.81 13.57 13.33 13.09 12.86 12.41 11.973 13.45 13.21 12.97 12.74 12.52 12.07 11.654 13.09 12.86 12.63 12.41 12.19 11.76 11.345 12.76 12.53 12.31 12.09 11.87 11.46 11.05
10 11.28 11.08 10.88 10.68 10.49 10.12 9.7615 10.07 9.89 9.71 9.54 9.37 9.04 8.7120 9.08 8.91 8.75 8.59 8.44 8.14 7.8425 8.24 8.09 7.95 7.80 7.66 7.38 7.1230 7.54 7.40 7.26 7.13 7.00 6.74 6.5035 6.93 6.81 6.68 6.55 6.43 6.19 5.9640 6.41 6.29 6.17 6.05 5.94 5.71 5.49
Source: Compiled from Weiss [6].

Environmental Needs of Aquatic Organisms 223
Table 9.4. Solubility of major components of air as a function ofpressure and feed gas composition at 15◦C
Gas Solubility (mg/L)Pressure Feed Gas(atm) Composition Oxygen Nitrogen Carbon Dioxide
1 Air 10.08 16.36 0.691 Pure oxygen 48.142 Air 20.32 33.00 1.382 Pure oxygen 97.02
Source: Compiled from Colt and Orwicz [7].
fish excretory wastes are the main concern. Suspended waste particles of greater thanabout 100µm in size can be easily removed by physical separation; however, dissolvedcompounds and fine waste particles require more sophisticated techniques (e.g., chemicaland biological methods) for their removal from the water.
9.2 Environmental Needs of Aquatic Organisms
Maintaining an optimum growth environment in an aquacultural system is basic to itslong-term commercial success. Meade [8] provides a general guideline for water qualityparameters for aquaculture (Table 9.5). The physical, chemical, and biological factorsof the aquatic environment have significant effect on survival, growth, and reproductivebehavior of the aquatic organisms [9]. Physical factors, such as temperature, changemore slowly than do chemical factors in outdoor systems. Chemical factors includedissolved gases, pH, nitrogenous metabolites, inorganic ions, hardness, alkalinity, andtoxic compounds. The chemistry of an aquatic environment can change significantlywithin a short period of time, causing stress or death to cultured organisms. Intrinsic andextrinsic biological factors of the cultured organisms and the organisms growing in thesame medium are of importance when designing aquacultural systems. However, verylittle control can be exercised on biological factors in isolation with physical or chemicalfactors [9].
In general, warmwater species of fish, such as tilapia, tolerate a wider range of en-vironmental conditions than coldwater species such as trout [9]. Stickney [2] defineswarmwater species as those with temperature optima at or above 25◦C and coldwateras those with temperature optima below 20◦C. Species that have their temperature op-tima within these two temperatures are considered midrange species. Table 9.6 providesoptimum temperature ranges for common aquatic organisms of interest for aquaculturalproduction.
Next to temperature, the most important water-quality parameter for aquaculture isdissolved-oxygen concentration. A minimum dissolved-oxygen concentration of 5 mg/Lis recommended for warmwater species and 6 mg/L for coldwater species ([3], [1]). Atlower concentrations than these, the fish will be stressed, resulting in slower growth.There are several factors that influence the oxygen-consumption rate of fish. Most

224 Environmental Requirements
Table 9.5. General water quality criteria for aquaculture
Parameter Concentration (mg/L except for pH)
Alkalinity 10–400Aluminum <0.01Ammonia <0.02Total Ammonia <1.0Arsenic <0.05Barium 5Cadmium
Alkalinity <100 mg/L 0.0005Alkalinity >100 mg/L 0.005
Calcium 4–160Carbon dioxide 0–10Chlorine <0.003Copper
Alkalinity <100 mg/L 0.006Alkalinity >100 mg/L 0.03
Dissolved oxygen 5 to saturationHardness, Total 10–400Hydrogen cyanide <0.005Hydrogen sulfide <0.003Iron <0.01Lead <0.02Magnesium <15Manganese <0.01Mercury <0.02Nitrogen (N2) <110% total gas pressure
<103% as nitrogen gasNitrite 0.1 in soft waterNitrate 0–3.0Nickel <0.01PCB’s <0.002pH 6.5–8.0Potassium <5Salinity <5%Selenium <0.01Silver <0.003Sodium 75Sulfate <50Sulfur <1Total dissolved solids <400Total suspended solids <80Uranium <0.1Vanadium <0.1Zinc <0.005Zirconium <0.01
Source: Compiled from Meade [8].
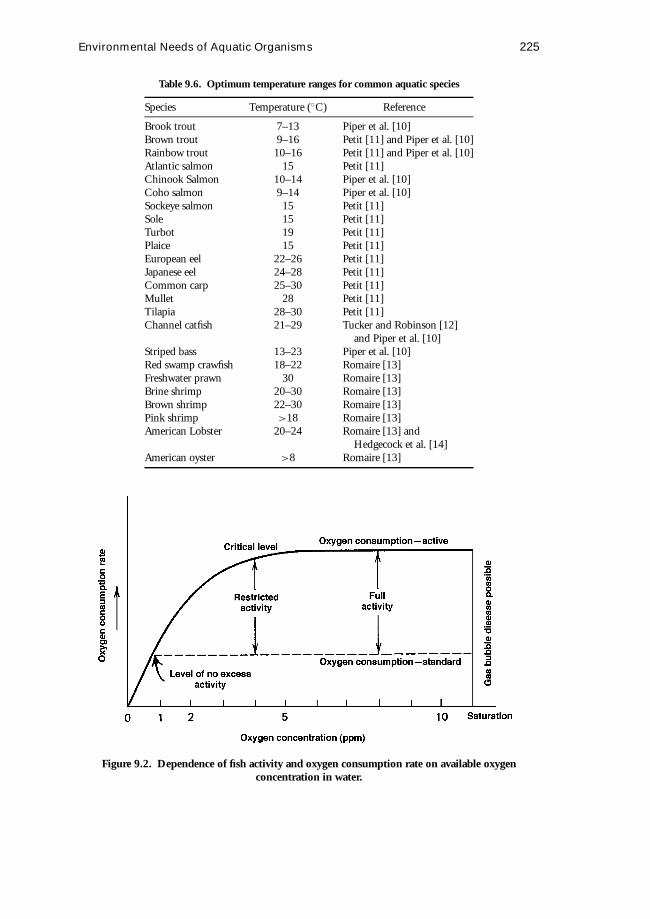
Environmental Needs of Aquatic Organisms 225
Table 9.6. Optimum temperature ranges for common aquatic species
Species Temperature (◦C) Reference
Brook trout 7–13 Piper et al. [10]Brown trout 9–16 Petit [11] and Piper et al. [10]Rainbow trout 10–16 Petit [11] and Piper et al. [10]Atlantic salmon 15 Petit [11]Chinook Salmon 10–14 Piper et al. [10]Coho salmon 9–14 Piper et al. [10]Sockeye salmon 15 Petit [11]Sole 15 Petit [11]Turbot 19 Petit [11]Plaice 15 Petit [11]European eel 22–26 Petit [11]Japanese eel 24–28 Petit [11]Common carp 25–30 Petit [11]Mullet 28 Petit [11]Tilapia 28–30 Petit [11]Channel catfish 21–29 Tucker and Robinson [12]
and Piper et al. [10]Striped bass 13–23 Piper et al. [10]Red swamp crawfish 18–22 Romaire [13]Freshwater prawn 30 Romaire [13]Brine shrimp 20–30 Romaire [13]Brown shrimp 22–30 Romaire [13]Pink shrimp >18 Romaire [13]American Lobster 20–24 Romaire [13] and
Hedgecock et al. [14]American oyster >8 Romaire [13]
Figure 9.2. Dependence of fish activity and oxygen consumption rate on available oxygenconcentration in water.

226 Environmental Requirements
Table 9.7. Oxygen consumption rate and dissolved oxygen concentrations corresponding to activity levels
Oxygen Consumption Rate Dissolved-Oxygen Level and Activity
Species kg O2/1000 kg fish·day Size (g) ppm Temperature (◦C) Activity
Rainbow trout 7.2 at 15◦C and unknown feeding 100 2.4–3.7 16 Limitinglevel
7.2 at 15◦C and production feeding 100 1.05–2.06 18.5 Limitinglevel
2.5 13–20 Limiting5–5.5 20 Limiting
9 20 FullSockeye salmon 5.6 at 15◦C and unfed 28.6
6.6 at 15◦C and 3% feeding level 28.6Channel catfish 13.4 at 30◦C and unfed 100 1.0 Limiting
19.5 at 30◦C and satiation feeding 100 3.0–5.0 FullLargemouth bass 2.7 at 20◦C and unfed 35 2.3–4.8 0–4 Limiting
2.7 at 20◦C and unfed 15015.3–19.9 at 20◦C and standard
feeding 1.6Blue tilapia 1.0 25 CriticalMalaysian prawn 36.0 at 24◦C and unfed 0.5
43.0 at 24◦C and satiation feeding 0.5
Sources: Compiled from Beamish [15], McLarney [16], and Colt and Tchobanoglous [5].
Table 9.8. Nitrogen toxicity to selected finfish species
96-hour LC50 48- or 96-hour LC50 96-hour LC50Species (mg/L NH3) (mg/L NO2-N) (mg/L NO3-N)
Pink salmon 0.08–0.1Mountain whitefish 0.14–0.47Brown trout 0.50–0.70Rainbow trout 0.16–1.1 0.19–0.39 1360Largemouth bass 0.9–1.4 140Smallmouth bass 0.69–1.8 160Common carp 2.2 2.6Red shiner 2.8–3.2Fathead minnow 0.75–3.4 2.3–3.0Channel catfish 0.5–3.8 7.1–13 1400Bluegill 0.55–3.0 80 420–2000Cutthroat trout 0.48–0.56Chinook salmon 0.88 1310Labyrinth fish 28–32Goldfish 52Green sunfish 160Guadalupe bass 190 1260Guppy 180–200
Source: Compiled from Russo and Thurston [17].

Environmental Needs of Aquatic Organisms 227
Table 9.9. Un-ionized ammonia fraction (% NH3) in total ammonia nitrogen at differenttemperatures and pH
Ammonia Fraction (% NH3) by pH LevelTemperature(◦C) 6.0 6.5 7.0 7.5 8.0 8.5 9.0 9.5 10.0
0 0.00827 0.0261 0.0826 0.261 0.820 2.55 7.64 20.7 45.31 0.00899 0.0284 0.0898 0.284 0.891 2.77 8.25 22.1 47.32 0.00977 0.0309 0.0977 0.308 0.968 3.00 8.90 23.6 49.43 0.0106 0.0336 0.106 0.335 1.05 3.25 9.60 25.1 51.54 0.0115 0.0364 0.115 0.363 1.14 3.52 10.3 26.7 53.55 0.0125 0.0395 0.125 0.394 1.23 3.80 11.1 28.3 55.66 0.0136 0.0429 0.135 0.427 1.34 4.11 11.9 30.0 75.67 0.0147 0.0464 0.147 0.462 1.45 4.44 12.8 31.7 59.58 0.0159 0.0503 0.159 0.501 1.57 4.79 13.7 33.5 61.49 0.0172 0.0544 0.172 0.542 1.69 5.16 14.7 35.3 63.3
10 0.0186 0.0589 0.186 0.586 1.83 5.56 15.7 37.1 65.111 0.0201 0.0637 0.201 0.633 1.97 5.99 16.8 38.9 66.812 0.0218 0.0688 0.217 0.684 2.13 6.44 17.9 40.8 68.513 0.0235 0.0743 0.235 0.738 2.30 6.92 19.0 42.6 70.214 0.0254 0.0802 0.253 0.796 2.48 7.43 20.2 44.5 71.715 0.0274 0.0865 0.273 0.859 2.67 7.97 21.5 46.4 73.316 0.0295 0.0933 0.294 0.925 2.87 8.54 22.8 48.3 74.717 0.0318 0.101 0.317 0.996 3.08 9.14 24.1 50.2 76.118 0.0343 0.108 0.342 1.07 3.31 9.78 25.5 52.0 77.419 0.0369 0.117 0.368 1.15 3.56 10.5 27.0 53.9 78.720 0.0397 0.125 0.396 1.24 3.82 11.2 28.4 55.7 79.921 0.0427 0.135 0.425 1.33 4.10 11.9 29.9 57.5 81.022 0.0459 0.145 0.457 1.43 4.39 12.7 31.5 59.2 82.123 0.0493 0.156 0.491 1.54 4.70 13.5 33.0 60.9 83.224 0.0530 0.167 0.527 1.65 5.03 14.4 34.6 62.6 84.125 0.0569 0.180 0.566 1.77 5.38 15.3 36.3 64.3 85.126 0.0610 0.193 0.607 1.89 5.75 16.2 37.9 65.9 85.927 0.0654 0.207 0.651 2.03 6.15 17.2 39.6 67.4 86.828 0.0701 0.221 0.697 2.17 6.56 18.2 41.2 68.9 87.529 0.0752 0.237 0.747 2.32 7.00 19.2 42.9 70.4 88.330 0.0805 0.254 0.799 2.48 7.46 20.3 44.6 71.8 89.0
Source: % NH3 values were calculated using the equations proposed by Emerson et al. [18].
important of these include genetics of the fish, the water temperature, stress on thefish, age and species of the fish, the available oxygen concentration, and level of fishactivity.
In aquaculture, maintaining dissolved oxygen in water at a level that is suitable for fishis an important activity for involved personnel. Fish oxygen-consumption rate increaseswith available oxygen concentration up to a critical concentration, as shown in Fig. 9.2.Above this critical concentration, fish engage in normal physiological activity. Dissolvedoxygen level below critical concentration may result in reduced fish growth or evenmortality. Table 9.7 shows oxygen-consumption rates of some common fish species anddissolved-oxygen concentrations corresponding to the fish activity levels.

228 Environmental Requirements
Table 9.10. Toxicity of selected metals to aquatic species
Metal 96-hour LC50 (µg/L) Safe Level (µg/L)
Cadmium 80–420 10Chromium 2000–20,000 100Copper 300–1000 25Lead 1000–40,000 100Mercury 10–40 0.10Zinc 1000–10,000 100
Source: Compiled from Boyd [19].
Table 9.11. Toxicity of selected pesticides to aquatic species
Pesticide 96-hour LC50 (µg/L) Safe Level (µg/L)
Aldrin/Dieldrin 0.20–16 0.003BHC 0.17–240 4.0Chlordane 5–3000 0.01DDT 0.24–2 0.001Endrin 0.13–12 0.004Heptachlor 0.10–230 0.001Toxaphene 1–6 0.005
Source: Compiled from Boyd [19].
Nitrogen is a principal component of amino acids, which form the building blocksof proteins available in food and feed of most living organisms. In aquaculture, proteinmetabolism by fish results in excretion of nitrogenous compounds, most of which dissolvein the culture water. Accumulation of some of these compounds, especially ammonia–nitrogen and nitrite–nitrogen, is a serious concern in aquaculture because they are highlytoxic to fish. Table 9.8 shows the nitrogen-toxicity data for various fish species. In aqua-cultural waters ammonia–nitrogen is found in two states: ionized (NH+
4 ) and unionized(NH3). These two states form an equilibrium that depends on the pH and temperature ofthe culture water. Table 9.9 shows the effect of pH and temperature on this equilibrium.An increase in pH or temperature causes an increase in the concentration of the toxicform of ammonia (un-ionized). Sum total of these two states of ammonia is referredto astotal ammonia nitrogen concentration, a routinely monitored parameter in mostintensive-production systems. Oxidation of ammonia to nitrate–nitrogen, a relativelynontoxic substance, is a two-step process and is accomplished by chemoautotrophicbacteria (Nitrosomonasand Nitrobacter). This process,nitrification, is an acidifyingprocess (causing destruction of alkalinity) and requires significant amount of oxygen.Nitrite–nitrogen, an intermediate product of this process, is very toxic to fish.
Some heavy metals and pesticides are also toxic to aquatic organisms. Depending onthe water source, metals may be present in the water used for aquaculture. Pesticides andherbicides are often used around fish ponds to control pests and vegetation. Boyd [18]provides data on toxicity of selected metals and pesticides to aquatic life (Tables 9.10and 9.11, respectively).

References 229
References
1. Wheaton, F. W. 1977.Aquacultural Engineering. John Wiley and Sons, New York.2. Stickney, R. R. 1994.Principles of Aquaculture. John Wiley and Sons, New York.3. Lawson, T. B. 1995.Fundamentals of Aquacultural Engineering. Chapman and
Hall, New York.4. Huner, J. V. and H. K. Dupree. 1984.Third Report to the Fish Farmers. Fish and
Wildlife Service, U.S. Department of Interior, Washington, DC.5. Colt, J. E. and G. Tchobanoglous. 1981. Design of aeration systems for aquacul-
ture. In: L. J. Allen and E. C. Kinney (eds.),Proceedings of the Bio-EngineeringSymposium. American Fisheries Society, Bethesda, MD, pp. 138–148.
6. Weiss, R. F. 1970. The solubility of nitrogen, oxygen, and argon in water and sea-water.Deep Sea Research17:721–735.
7. Colt, J. E. and C. Orwicz. 1991. Aeration in intensive culture. In: D. E. Brune andJ. R. Tomasso (eds.),Aquaculture and Water Quality. World Aquaculture Society,Baton Rouge, LA.
8. Meade, J. W. 1989.Aquaculture Management. Van Nostrand Reinhold, New York.9. Parker, N. C. and K. B. Davis. 1981. Requirements of warmwater fish. In: L. J. Allen
and E. C. Kinney (eds.),Proceedings of the Bio-Engineering Symposium for FishCulture. American Fisheries Society, Bethesda, MD.
10. Piper, R. G., I. B. McElwain, L. E. Orme, J. O. McCraran, L. G. Fowler, andJ. R. Leonard. 1982. Fish Hatchery Management. U.S. Fish and Wildlife Service,Washington, DC.
11. Petit, J. 1990. Water supply, treatment and recycling in aquaculture. In: G. Barnabe(ed.), Aquaculture, vol. 1. Ellis Horwood, New York.
12. Tucker, C. S. and E. H. Robinson. 1990.Channel Catfish Farming Handbook. NY:Van Nostrand Reinhold, New York.
13. Romaire, R. P. 1985. Water quality. In: J. V. Huner and E. E. Brown (eds.),Crustaceanand Mollusk Aquaculture in the United States. AVI Publishing, Westport, CT.
14. Hedgecock, D., K. Nelson, and R. A. Shleser. 1976. Growth differences amongfamilies of the lobster Homerus americanus.Proceedings of World MaricultureSociety7:347–361.
15. Beamish, F. W. H. 1970. Oxygen consumption of largemouth bass,Micropterussalmoides, in relation to swimming speed and temperature. Canadian Journal ofZoology 48:1121–1128.
16. McLarney, W. 1984.The Freshwater Aquaculture Book. Hartley and Marks, pp.450–451.
17. Russo, R. C. and R. V. Thurston. 1991. Toxicity of ammonia, nitrite, and nitrateto fish. In: D. E. Brune and J. R. Tomasso (eds.),Aquaculture and Water Quality.World Aquaculture Society, Baton Rouge, LA.
18. Emerson, K., R. C. Russo, R. E. Lund, and R. B. Thurston. 1975. Aqueous ammoniaequilibrium calculations: Effects of pH and temperature.Journal of the FisheriesResearch Board of Canada32:2379–2383.
19. Boyd, C. E. 1990.Water Quality in Ponds for Aquaculture. Auburn Univer-sity/Alabama Agricultural Experiment Station, Auburn, AL.

230
10 Materials forAquacultural Facilities
F. W. Wheaton and S. Singh
10.1 Considerations in Material Selection Process
Aquacultural facilities are profoundly different than traditional poultry or livestockproduction operations because of their unique rearing environment, water and/or saltwater. Therefore, material selection for aquacultural facilities is an important aspect of thefacilities construction. Due consideration of water quantity and quality is a prerequisitefor the material selection process. The following constraints either limit the applicabilityof many materials for aquacultural purposes or require that special precautions andmethods be used.
10.1.1 Weight of Water
More often than not aquacultural facilities handle large quantities of water. Becausewater is a relatively high-density fluid, it exerts considerable force on the structureenclosing it. This demands a careful consideration of materials strength. The componentsthat hold static or flowing water require special attention. In open systems such as pondsand net pens, static and dynamic forces induced by the weight of the water and theprevailing winds and currents are very important criteria for site selection and pondconstruction. The soil type and the topography of the selected site will also determinepond-construction cost and influence the decision on pond size. In closed or semiclosedsystems, tank or raceway walls and water conducts and associated fittings need to beproperly sized for the pressure and water flow rate.
10.1.2 Corrosion
The potential of chemical reaction between the culture water and the materials usedin the construction is a very serious concern in all aquacultural facilities. Importantfactors that may influence the chemical reaction include the environment (light, temper-ature, humidity, air, etc.), the presence of catalysts, oxygen concentration, and physicalmovement. The chemical reaction can potentially cause accelerated deterioration of thematerial and contamination of the culture water. This deteriorating effect on a material iscalledcorrosion. Fresh-water systems can be expected to be considerably less vulnerableto corrosion than salt-water systems.
231
232 Materials for Aquacultural Facilities
Fresh-Water CorrosionGenerally, fresh water from wells, lakes, rivers, streams, and municipal supplies is
noncorrosive. In fresh-water systems, probably the most common form of corrosion isrusting of steel structures and components. Rusting is basically oxidation of wet metal(steel) surfaces into oxides. Steel structures and components are rust-prone and, therefore,special precautions should be taken with them. Rust-proof paints or coatings can beapplied to ordinary steel surfaces, but this may result in an increased cost of components.Also, the rust-proof paints or coatings need to be compatible with the aquatic environmentand strong enough to avoid chipping. If coated steel is undesirable other metals, suchas aluminum or stainless steel, or plastics, such as polyvinyl chloride (PVC) or acrylic,should be considered. Additional corrosion resistance tends to increase materials cost.
Salt-Water CorrosionCorrosion is a more common problem in salt-water systems. Salt water is very cor-
rosive, and because of this special materials must be used for pipes, tanks, pumps, andother equipment coming into contact with the salt water. Most plastics, epoxy resins,and rubber compounds withstand saltwater very well. However, any materials used inaquaculture facilities growing or processing organisms for human consumption mustsatisfy government regulations with respect to toxicity, safety, and strength. Some of theepoxies, rubbers, and plastic materials contain compounds toxic to the cultured organismor to human consumers. These toxic compounds may be present either in the resin com-pound or in the hardener compound. Stainless steel may be used in most food-processingapplications, but in production systems (particularly recirculating systems) one shouldmake sure that chromium is not dissolved from the stainless steel and concentrated in thegrowing organisms. Shellfish are particularly sensitive to this, because they concentrateheavy metals in their bodies [1]. Most other metals are corroded very rapidly in saltwater. Steel/iron structures and components that remain in contact with salt water forlong periods of time may disappear altogether if proper coatings are not applied on themor corrosion rates are not allowed for by using heavier material thickness.
10.1.3 Biofouling
Biofouling, growth of unwanted attached aquatic organisms, is one of the most seriousoperational and maintenance problems encountered in most salt-water and some fresh-water culture systems. There are some 200 different species of marine-fouling organisms[2]. The size, diversity, and development pattern of the fouling community varies withthe materials used and the site environmental conditions [3]. During the setting stage intheir life cycle, many fouling organisms growing in water must attach to solid objects.The object may be a pipe, a tank, or a pump; in fact, it makes no difference to theorganisms, but to the aquaculturist such nonselectivity can present a real managementproblem. Fouling rate is most rapid in areas in which water currents are slow and generallybecomes less of a problem as salinity decreases. Thus, freshwater farms are less affectedby fouling than marine farms.
Biofouling has multiple effects on the culture system. Biofouling deposits on net orfloat structures can increase weight and drag, reduce buoyancy, and severely limit water

Considerations in Material Selection Process 233
circulation through the culture space [4]. In a cage culture, the frequency and durationof the minimum water flow directly impacts the maximum stocking density that can bemaintained. Therefore, biofouling can significantly reduce the production potential andcreate a stress-inducing environment for the cultured organisms. Also, if cage bags arefouled by algae and other organisms, the specific effective size of the mesh is decreased,increasing drag forces and adding to the weight of the cage. In addition, the decreasein mesh size reduces water exchange through the bag, reducing the rate of oxygenreplenishment and waste removal. The increased drag forces cause the bag to deform,crowding the fish. Thus, fouling can have significant effects on unit productivity. Majornet system failures, with fouling as a strong contributing factor, have already occurred inseveral large commercial marine aquaculture operations [4]. The rate of fouling is highin cages situated near thermal effluents. In land-based structures, drain pipes for effluentand other pipes and fittings can become clogged due to fouling. Fouling reduces the lifeof materials used in construction and requires frequent maintenance to reduce pressurelosses in the system, thereby increasing both capital and operating costs of the system.
Biofouling Control TechniquesWheaton [1] describes several methods that are available for dealing with fouling.
These methods can be classified as chemical, mechanical, thermal, or constructional.Each method has its advantages and disadvantages.
In chemical sterilization, a chemical that is toxic to the fouling organisms may beadded to the culture water. The chemical kills the attached organisms and prevents pipeclogging. Chlorine and ozone treatments of culture water are two examples of chemicalsterilization. The toxic chemical can be applied in two different ways: the continuousaddition of a low concentration of the toxic chemical to the water that prevents theorganisms from ever becoming attached to the structure or equipment, or an intermittentprocess in which a high-concentration, short-duration chemical treatment is followed bya relatively long period during which no chemical is added. The cycle is repeated at anecessary time interval, and this procedure becomes a part of the regular management.
Chemicals used for fouling prevention can be, and generally are, toxic to the culturedaquatic organisms or aquacultural crop as well as to the fouling organisms. A chemicaltoxic to the crop could not be used with the low-concentration, continuous chemicaltreatment. However, because the concentration used in the continuous chemical methodis low, the aquacultural crop may be able to grow in the water provided that the crop hasa higher tolerance than the fouling organism. Proper care must be taken to ensure that thecrop is not subjected to a sublethal concentration of a toxic chemical and the resultingstresses. The crop growth rate will almost always be affected under stressed conditions.
The intermittent process uses a high concentration of the treatment chemical, andthe potential for toxicity to the crop is increased. However, with planning at the timeof construction of a facility, bypass arrangements for the chemically treated water canbe made to incorporate intermittent treatment as an integral part of the facility. In thisarrangement, treated water will not come in contact with the crop but will pass throughthe bypass piping and plumbing system. After treatment and flushing to remove thechemical, water is again allowed to pass over the crop. However, it is difficult to remove

234 Materials for Aquacultural Facilities
fouling from the crop itself and from the structure in which the crop is held. Foulingcan possibly be removed by treating the growing areas during the time between crops,provided that the fouling rate is slow enough. This procedure is usually not possible withpartial harvests.
Another problem with the chemical treatment is that the chemicals may be nontoxicto the crop, but the crop may absorb some of the antifouling chemical. The crop maybecome unsuitable for human consumption, if the chemical is toxic to humans or is notcleared by health authorities for use on the crop [1].
A simple mechanical method of removing fouling may involve the use of hand laborand scraping or scrubbing devices. However, the labor cost and lack of physical access tocertain areas such as inside of long pipes and other small components severely limit thepractical application of this approach. An automated mechanical scraping system usedfor cleaning cooling tubes in power plants may be applied in aquacultural facilities. Thismethod uses spherical balls having a diameter less than that of the smallest tube or pipe.The balls are introduced into the water passing through the pipes. As the solid balls arecarried through the pipes, they scrape along the inside surface of the pipes, removing at-tached organisms. The water flow flushes the organisms away. The balls are collected afterpassing through the pipes and can be reused. This system could be employed in the pipingof many aquaculture systems. However, it would be difficult to use in those componentsof the system in which the water velocity is low, such as culture tanks. The balls can poten-tially reduce the food supply entering the system by damaging or killing food organismssuspended in the water. Also, damage to the crop by mechanical abrasion is a possibility.
Thermal fouling-control methods are somewhat similar to chemical treatments. Tem-perature change, usually employed as an intermittent process, can be used to reduce oreliminate fouling. The temperature of the water flowing into the system is increased untilit exceeds the lethal temperature of the fouling organisms, and the dead fouling agentsare flushed away by water [1]. This method has limited commercial application becausenearly always at least some fouling organisms have a lethal temperature above the lethaltemperature for the crop being grown. Raising the temperature sufficiently to kill allfouling organisms will also kill the crop. Raising the water temperature is expensive interms of heat energy. As with the chemical method, the thermal method can be usedbetween the crops if the fouling rate is slow.
Fouling can also be prevented by disinfecting the water using ultraviolet light. How-ever, water must flow past the ultraviolet light in a thin layer, because particles close tothe light will shield particles further from the light. Fouling organisms getting throughthe treatment chamber alive will contaminate the system. Some problems also have beenexperienced because of variations in lamp intensity with age. In spite of the problems,ultraviolet techniques appear to be among the best available for aquacultural enterprisesthat do not depend on living organisms in the incoming water as food for the crop [1].Treatment and maintenance costs for the ultraviolet units need to be considered.
Most fouling organisms cannot attach to a surface if the water velocity over thesurface exceeds some minimum value. If incorporated during facilities construction, thischaracteristic can be utilized to prevent fouling in many parts of an aquacultural system.The water velocities in pipes, pumps, and other components are maintained above the
Considerations in Material Selection Process 235
highest velocity at which fouling organisms can set. This antifouling system is simple,but it is difficult to employ in large components like growing tanks and at changesin direction in pipes. Maintaining high velocities in tanks calls for large volumes ofwater because of the large cross-sectional area of the tanks. The higher water volumerequired to maintain the necessary velocity increases pumping costs. In piping systemsthe velocity can be easily maintained or increased by decreasing the pipe size. However,higher pipe velocities cause a greater pressure loss per unit length of the pipe. Pumpingcosts increase as the pressure drop increases. Because pressure must be increased at thewater source to increase the velocity of flow, operating (pumping) costs of the systemgo up as the water velocity in the piping system increases. Also, the velocity on theinside of an elbow curve may be low, causing settling of fouling organisms, even if theaverage velocity in the piping system is high enough to prevent it. High water velocitiesin growing tanks or ponds can also be detrimental to the crop. For example, oystersreduce pumping or stop altogether if water velocity is too high [1]. Finfish expend moreenergy in swimming in high-velocity water, and this reduces food-conversion ratiosbecause more energy is lost to the increased metabolic needs of the fish. The higherwater velocities do help to remove waste materials and to maintain water quality in thegrowing area. Some raceway systems rely on high water-flow rates for waste removal,and therefore this method can sometimes be used with them.
Duplicate plumbing systems are often employed to prevent fouling in aquatic growingsystems. The water flow is periodically switched from one system to the other. The unusedsystem is drained and allowed to remain dry long enough to kill all fouling organismsin the system, or it is closed off and allowed to become anaerobic. By periodicallyswitching from one plumbing or piping system to the other, both systems can be keptfree of fouling organisms. Although the installation expense of this system is prohibitivein some situations, it often provides not only a pollution-free fouling control system butalso a backup pumping or plumbing system in case of breakdown or routine maintenancerequirements of the prime system. Often this aspect of the dual system makes installationcosts justifiable even if it saves one crop during the life of the system [1]. Usually thevolume or space requirements of the growing tanks or ponds make it impractical to extendthe dual system to these areas. However, growing areas are much more accessible and,therefore, easier to maintain free of fouling than other parts of the system. For example,ponds having soil as the side and bottom material are virtually fouling free if correctlyconstructed. This technique is one of the most practical and effective available.
Some copper alloys, particularly copper/nickel, have significant resistance to fouling[4]. Galvanized steel construction with anticorrosion safeguards is also fouling-resistant[2]. These alloys can sometimes be used for structures that remain in contact with waterin marine systems (cages and net pens).
10.1.4 Ozone as a Constraint in Material Selection
Ozone treatment of culture water can be used to improve water quality or disin-fection. Because ozone is a strong oxidizing agent, any materials used in an ozonetreatment system must be inert to ozone. Also, if an aquacultural facility uses ozone forwater treatment, it is important that proper materials are selected for components that
236 Materials for Aquacultural Facilities
will hold ozonated water. Operating costs of an ozone delivery system increase as thedelivery system degrades. Greater amounts of ozone must be produced in systems withsubstandard materials, because some of the ozone is lost in the oxidation of materials inthe delivery system itself. Also, as the delivery system fails, it must be replaced, addingto the overall cost of the operation. Ozone is toxic to humans and any system leakageis a serious safety hazard. Therefore, it is important to construct the ozone system frommaterials that will not corrode.
10.2 System Components and Material Selection
The type of aquacultural facility, whether pond, raceway, net pen, or tank-basedplays an important role in the material selection process. An aquacultural facility hasseveral structural components. Each component serves a different purpose. Therefore, thematerial-selection process for an individual component should consider that particularcomponent’s role in the system. Wheaton [1], Lawson [3], Beveridge [2], and Hugueninet al. [4] provide useful insights into the material-selection process for the componentsof aquacultural facilities.
10.2.1 Tanks
Tanks can be constructed from a variety of materials, including wood, concrete,plastic, fiberglass, metal, and glass [3]. Aquaculture tanks should have the followingcharacteristics: smooth interior surface to prevent abrasion, nontoxicicity, durability andportability, ease of cleaning and sterilizing, noncorrosiveness, structural strength, andeasy affordability. The choice of material should include these characteristics.
10.2.2 Raceways
Although earthen raceways are sometimes used, the majority are constructed frompoured concrete or concrete or cement blocks. Earthen raceways are sometimes linedwith waterproof liners to reduce water loss through leakage. Many small, experimentalraceways are fabricated from wood, metal, fiberglass, plastic, or other materials.
10.2.3 Waterproof Lining
Waterproof liners can be used with tanks fabricated from virtually any material. Theyare commonly used in place of expensive coatings or sealers. Liners are also used forsealing ponds. They eliminate the hazard of toxicity by heavy metals, paints, treatedwood, or other substances. Liners can be custom-made to fit any tank or pond size andshape. They must be carefully handled to avoid tearing and have a useful life of about 5–10years, depending on material and use. The life of a liner is significantly reduced by highlyacidic or alkaline water. Many modern tank or pond liners are resistant to ultraviolet raysand therefore have a relatively long life when used outdoors. Cost, service conditions,and availability are factors that must be considered in material selection for pond sealers.
Waterproof materials such as polyethylene, vinyl, and butyl rubber are gaining ac-ceptance as pond linings. These linings reduce seepage loss to essentially zero, provided

Advantages and Disadvantages of Various Materials 237
that they are not broken or punctured. They also give a more dependable seal thanwell-compacted bentonite, but for many applications cost is a significant factor. Blackpolyethylene films are less expensive than vinyl and butyl rubber for a given thickness [1].
10.2.4 Screen Mesh
Screen mesh for particulate filtration is available in a wide variety of materials in-cluding galvanized steel, carbon steel, brass, stainless steel, nylon, and other fabrics.Mesh material selection is based on characteristics of the influent and desired mesh size.For example, galvanized steel would be a poor selection for use in salt water because itcorrodes easily. Because some mesh sizes are available in a limited number of materials,mesh size desired may influence screen material selection.
10.2.5 Nets
Materials chosen for nets should have high resistance to sunlight and be able to with-stand weathering well and provide the necessary strength. A net having specific gravityin excess of 1 will sink, usually a desirable trait in fixed nets. Cost of netting is also a ma-jor consideration. Polyvinylidene chloride or vinyl chloride netting is recommended byShimozaki [5]. Polyvinyl alcohol may be used, but it has poor weathering resistance andlow specific gravity. Polyethylene also sees limited use because it is low in cost and strong,but this material has low specific gravity. Nylon’s unsatisfactory qualities such as lowspecific gravity and poor resistance to sunlight are usually outweighed by its low cost [2].
10.2.6 Ozone Unit
Hochheimer and Wheaton [6] discuss suitability of various materials for use withozone in aquacultural applications. Table 10.1 presents the list of these materials com-monly used in aquacultural facilities and their relative resistances to ozone. Polyvinylchloride (PVC) can be used for temporary ozone contact, but it is not recommendedfor long-term application. Reinforced concrete should also be used with precautions, asozone may corrode galvanized steel reinforcing bars in the structure. For best results, 304or 316 stainless steels for flanged or threaded applications and 304L or 316L for welded(tungsten inert gas) piping joints are best for all wet and dry gas-piping components andflexible couplings [8]. Valves should be made of stainless steel (both body and face)with Viton, Teflon, or Hypalon membranes and gaskets [8]. Concrete joints made fromSikaflex-1A also are recommended for use with ozone systems [8].
10.3 Advantages and Disadvantages of Various Materials
In general, an ideal material for aquacultural facilities will have the following charac-teristics: high strength; low cost; easy availability; resistance to corrosion, weather, andfouling; light weight; ease of transport, construction, and repair; nontoxicity; reusability;and smooth texture. No single material posses all these characteristics. Specific materialspresented here have certain advantages and disadvantages compared with each other andtherefore find their use in conditions requiring their positive characteristics.

238 Materials for Aquacultural Facilities
Table 10.1. Suitability of materials for use with ozone systems
Material Resistance
MetalsChromium, nickel, silver Minor effectBrass Minor effectAluminum No effectPig iron No effectGalvanized steel Minor effect304 Stainless steel Minor effect316 Stainless steel No effectCopper No effect
ElastomersBuna N (Nitrile) Not recommendedEPDM No effectHypalon No effectKel-F No effectNatural rubber No recommendedNeoprene Moderate effectSilicone No effectViton No effect
PlasticsABS Minor effectAcetel (Delrin) Moderate effectCPVC No effectHytrel Moderate effectLDPE Moderate effectNylon Not recommendedPolycarbonate No effectPolypropelene Minor effectPTFE (Teflon) No effectPVC Minor effectPVDF (Kynar) No effect
OthersConcrete No effectGlass No effectCeramics No effect
Source: Compiled from Damez [7].
10.3.1 Masonry
Concrete is widely used for constructing large tanks or pools [1, 3]. It is easy to workwith and can be formed into any shape. Properly reinforced with steel bars, concrete willlast indefinitely for use with either fresh or salt water. Because of its weight and expense,however, concrete is used for the construction of permanent facilities. The interior sur-faces of concrete tanks should be smoothed to avoid abrasion of fish skin and scales. Also,rough or porous surfaces are harder or impossible to clean and disinfect. Interior surfaces

Advantages and Disadvantages of Various Materials 239
can be coated with a sealer, many of which are commercially available. Uncoated con-crete surfaces are suitable for most aquaculture purposes, but only after a sufficient curingperiod [3]. Harmful substances can leach from newly poured concrete. Thus, concretetanks should be flushed with clean water for several days prior to use [3]. Concrete andcement blocks are widely used for raceway construction, as they offer cost and strengthadvantages over other materials for handling relatively large quantities of water.
10.3.2 Metals
Metals have several uses in aquacultural applications. One can find both large struc-tures such as tanks and smaller components such as pipes and fittings made of commonlyused metals. Durability and smoothness are two main advantages of metallic components.However, metallic components, especially tanks, are heavy and therefore difficult totransport. Also, metal parts may cost more than plastic parts and be corrosion-prone. Met-als may become toxic in waters that are poorly buffered [1]. Metal bars, rods, and sheetscan be used as supports to plastic or concrete structures. Galvanized metal tanks shouldnot be used for aquaculture purpose unless they are coated or lined. Zinc leaches from thegalvanized coating and can cause heavy-metal poisoning. Salmonids are generally quitesusceptible to zinc toxicity. The 96-hour LC50 for zinc ranges from 0.09 mg/L to 41 mg/Lfor various species [9]. It is difficult to get most paint coatings to adhere to galvanizedmetal; therefore, it is best to avoid use of this material altogether, or a liner should be used.
SteelSteel can be used for tank and other large structural constructions in freshwater
systems. Steel often is the least expensive means of providing structural support to largecomponents such as tanks. Rust and heavy weight are potential problems with steel.With proper coatings, steel can provide good service in both fresh-water and salt-watersystems. Coatings may increase cost and, particularly for saltwater systems, steel rarelyis the best choice because of corrosion. Sectional steel tanks can be easily bolted togetherto construct a large tank, offering the advantages of easy construction, transportation,and dismantling [3].
AluminumAluminum serves well in fresh water, and certain aluminum alloys provide good ser-
vice in salt-water systems. In closed-cycle or recirculating systems, all metals includingaluminum should be used with care because even limited erosion over long periods cancause an ion buildup in the culture water. Aluminum and steel are two metals that arecommonly used in the fabrication of small tanks popular in hatcheries for rearing smallfry and fingerling. If used with caution, some aluminum alloys can be used for brackishor salt-water culture. Water with a pH well into the acidic range will cause aluminum tobecome soluble and leach into the water [3].
Stainless SteelStainless steel provides good service in fresh water and fairly good service in salt
water. However, even the corrosion-resistant 300 series stainless steels will eventually

240 Materials for Aquacultural Facilities
corrode in saltwater systems. Stainless steel is expensive, but for screens and similarapplications it is a good alternative if plastic materials are not available or do not providethe necessary strength. Small stainless steel tanks are generally safe to use with eitherfresh or salt water, particularly 316 stainless steel. However, stainless steel tanks are tooexpensive for large-scale use.
Copper AlloysMany copper alloys, particularly copper–nickel (90%–10%), have considerable bio-
fouling resistance and very low corrosion rates and can, under many circumstances, beused in areas with only modest water flow without any detrimental effects on cultureorganisms [4]. Copper-based antifouling paints are commonly applied to synthetic-fiberfish cages [2, 4]. Metallic copper-alloy meshes can be used in rigid structures to givelong life and low-maintenance service and have previously been successfully used ona smaller scale for marine fish containment [4]. However, copper can be absorbed byshellfish, a characteristic that may be harmful to marketing efforts.
10.3.3 Plastics/Rubber Compounds
The use of synthetic, hydrocarbon-based materials is increasing rapidly in aquacul-tural facilities, as these materials offer several advantages over traditional materials.However, they can be expensive and vulnerable to industrial pollution. In aquaculturalapplications, plastics are most vulnerable to the ultraviolet component of solar radia-tion. The termplasticrepresents a variety of polymers including acrylics, polyethylene,polypropylene, vinyl, PVC, fiberglass, and similar materials. Each has its own set ofgood and bad features. Most plastics can be used in both fresh-water and salt-watersystems. Lawson [3] and Wheaton [1] explain several uses of plastics in aquaculturalsystems. Plastics are durable, smooth, light, inert, and easily formed into desired shapes.A major advantage of plastic tanks over other tanks is that they are lightweight and thuseasily portable. Repairs to plastic tanks are also easier. At present, almost all aquaculturalstructures and parts are available in some form of synthetic materials such as plastics andfiberglass. Plastic tanks are available in various shapes and sizes, from small bowls toaquaria up to several hundred liters capacity. Most plastics are nontoxic, but some, likepolyethylene, are initially toxic and should be conditioned with clean, running water forat least two weeks prior to use, particularly for marine culture. Initial toxicity often is aresult of the hardner used in the plastic manufacturing proces or mold release compoundsor die lubricants used during manufacture.
FiberglassFiberglass is one of most popular materials for tank construction. It is light, strong, and
relatively inexpensive. It can be molded into most desired shapes. It is inert in both freshand salt water. It can withstand the effects of ultraviolet rays if used in sun. Fiberglasstanks are normally gel-coated on the inner surfaces to provide a smooth surface thatmay be easily cleaned and disinfected. The fiberglass tanks can be easily drilled forinstallation of drains and other plumbing fixtures. A variety of tank sizes are available,from a few hundred liters up to several hundred cubic meters. Some models are available
Advantages and Disadvantages of Various Materials 241
with legs, skirts, or stands so that they can be elevated above the floor or ground. Tankssmaller than 1.0 to 2.4 m in diameter are usually available in a single molded unit, butlarger tanks may come unassembled in two or more sections that must be bolted orglued together [3]. Some manufacturers will assemble tanks on-site for an additionalfee. Fiberglass tanks are available from numerous manufacturers worldwide. Fiberglassis strongest in tension loading, and this is the stress experienced in circular tank walls.Molded fiberglass may contain fiberglass matting. In this case the mat material must becompletely covered with resin [1]. Fiberglass mat consists of very thin, sharp pieces ofglass. If this material gets into the culture water, it may enter the cultured animals’ gillsor digestive structures, causing extensive tissue damage or internal bleeding.
VinylVinyl is a flexible plastic widely used for swimming-pool liners and other applications
requiring flexibility and essentially zero permeability to water. In aquaculture facilities,vinyl is mostly used for lining purposes. In fish culture, children’s wading and swimmingpools are used to culture or hold fish. Most of these pools are constructed of some typeof vinyl. Vinyl is flexible, and thus support must be provided for the vertical walls. Insmall pools it is done with inflated circular sections of vinyl. Larger pools require morerigid support, which in commercially available units usually is some type of coated steel.The flexible properties of vinyl allow the liner to conform to nearly any shape of externalsupport as long as the support material is smooth. Because vinyl is easily puncturedand cut, care must be exercised to prevent liner contact with sharp or pointed surfaces.As a lining material for fish culture ponds, vinyl has several advantages. It is relativelyinexpensive, smooth, and easily cleaned. However, it is not very durable. Vinyl linershave also been used to seal ponds constructed in permeable soils. With a good sand baseunder the vinyl and an overlaying layer of sand for protection, vinyl will provide a longservice life.
PolyethylenePolyethylene is similar in properties to vinyl but does not elongate as much. It is also
widely used for making impermeable liners for low-cost, rigid structures. It is availablein rolls up to 6 m wide and 75 m long. Polyethylene can be purchased in many thicknessesbased upon the requirement and is quite inexpensive. However, polyethylene does nothave a long life, can be easily punctured, and sometimes may be difficult to join.
AcrylicAcrylic materials are widely used for experimental purposes in fish culture. Plexiglas
acrylic plastic has limited flexibility in thickness below about 0.35 cm. At greater thick-ness it is essentially rigid. Lexan is another acrylic trade name. For experimental work,transparent acrylics provide easy observation of the desired operation. Acrylics are avail-able in a variety of colors, as well. Acrylics can be drilled, taped, and worked with machinetools into desired shapes and dimensions. In aquariums this means that plumbing canbe threaded directly into the acrylic with drills and taps, which is impossible with glass.Acrylics will not shatter like glass, but being much softer, they scratch relatively easily.Solvent bonding can be done, or special glues designed for use on acrylics can be used.
242 Materials for Aquacultural Facilities
Acrylics are inert to both salt and fresh water. However, they swell slightly if exposed tohigh humidity. This becomes a problem if one side of a large acrylic piece is subjectedto air of high humidity and the other side is exposed to air of much lower humidity. Thehumidity difference causes the sheet to warp, and if the material is restrained, fasteners orthe acrylic itself may be severely stressed or broken. Some acrylics warp more easily thanothers, and manufacturers’ specifications should be consulted before acrylics are used inthis type of service. Immersion of one side of the plastic sheet in water does not appearto cause a similar problem. Except for small tanks, acrylics are not suitable for tank con-struction because of cost, but they can have other applications in aquacultural facilities.
PVCPVC can be used for tank construction, but structural support must be provided for all
but small tanks. PVC can be glued or heat-welded. Primary use of PVC is not for tanksbut for piping and fittings. It is inert in both fresh and salt water. As pipe and fittingsit is inexpensive, light, and quite durable if not exposed to too much solar radiation orindustrial pollution. PVC pipe and fittings are readily available in a wide range of sizesand wall thickness. Sheet PVC is more expensive.
PolypropylenePolypropylene tanks are available from various suppliers in stock sizes up to at least
1500 L. Larger tanks can be purchased on special order. Larger tanks tend to be moreexpensive than similar-size fiberglass tanks. Another problem with polypropylene is thatit is very difficult to glue anything to it. However, special heat-bonding equipment isavailable for bonding polypropylene to itself. Mechanical fittings are generally usedwith polypropylene components. Polypropylene is also inert in both sea water and freshwater.
Butyl RubberButyl rubber is suitable for lining purposes. It can be joined or patched by special
cements. In ponds, butyl-rubber linings may be used without a covering of soil except inplaces in which livestock, people, or equipment will be moving. Minimum film thicknessfor placement over clean, silty, or clayey gravels is 0.76 mm [1]. Soil sterilization isunnecessary if the butyl-rubber lining is thicker than 0.5 mm is used.
10.3.4 Wood
Inexpensive fish-culture tanks can easily be fabricated from wood. Wheaton [1] de-scribes a simple method to construct a wooden tank for aquaculture. Besides being lightin weight, wood is typically less expensive than most other construction materials andeasy to work with. Marine plywood is often used to construct wooden tanks, but othergrades can be used as well. Plywood tanks should be designed to prevent excessiveflexure of the walls when the tank is filled. The tank sides should be braced to resistthe static forces exerted by the water. Treated woods should not be used in contact withthe culture water, because many contain substances that are toxic to fish. All exposedsurfaces should be painted to seal the wood against rot. Paints containing lead or otherheavy metals that may leach into the water should never be used for aquaculture purposes.

References 243
Tank interiors can be sealed with nontoxic materials such as epoxy or fiberglass resinpaint. These materials take one to two days to cure, and, once cured, they form a hard,smooth surface. In place of paints or sealers, waterproof liners can be used in woodentanks. Wooden-tank fabrication is very site-specific; therefore, no design concepts arepresented here. Design of epoxy-coated plywood tanks cannot be based solely on allow-able stress. Strain must be minimized because many coating materials are highly brittle.Strain or flexure of the tank walls under load will crack many epoxy coatings. Thus,selection of epoxy coatings and hardners should be done with care to ensure they havesome elasticity and are nontoxic.
10.3.5 Others
GlassGlass culture units are found almost exclusively in the aquarium trade or for public-
display aquaria. Aquaria range in size from small fish bowls to over 400 L in volume.Glass is not practical for use in the fabrication of large tanks because of high cost, exces-sive weight, and the ease with which it can be damaged. In the aquarium-manufacturingindustry acrylic is rapidly replacing glass for tank construction, but acrylics are tooexpensive for large-tank construction [3].
GuniteGunite is a strong, durable, concrete-like material that has an indefinite life. It is
often used to construct small spas, swimming pools, and ornamental fish ponds. Gunitematerial is very compact and can be blown under high pressure over a support frameworkfabricated from steel reinforcing rods and small-mesh poultry fencing. The material isusually applied in a 5 to 10 cm thick layer [3]. Gunite is more expensive than liners buthas indefinite life, whereas liners must be replaced every few years. Gunite has roughsurface and porous texture, which are harmful to fish and the fish environment. Theutility of gunite as a construction material for production tanks has yet to be proven.
Natural FabricsNatural fabrics such as cotton and hemp are suitable for fish netting and cage cultures
[2]. These materials have been used historically. But, with the advances in plastics andother synthetic compounds, their use is now confined to subsistence farming. Most netmaterials today are some type of plastic, such as polypropylene, nylon, or PVC.
References
1. Wheaton, F. W. 1977.Aquacultural Engineering. John Wiley and Sons, New York.2. Beveridge, M. 1996.Cage Culture. Fishing News Books, Oxford, England.3. Lawson, T. B. 1995.Fundamentals of Aquacultural Engineering. Chapman and Hall,
New York.4. Hugugenin, J. E., S. C. Fuller, F. J. Ansuini, and W. T. Dodge. 1981. Experiences
with a fouling-resistant modular marine fish culture system. In: L. J. Allen andE. C. Kinney (eds.),Proceedings of the Bio-Engineering Symposium for Fish Culture.American Fisheries Society, Bethesda, MD.

244 Materials for Aquacultural Facilities
5. Shimozaki, Y. 1964. Production and characteristics of synthetic nets and ropes inJapan. In:Modern Fishing Gear of the World, vol. 2. Fishing News Books, London.[cited by Wheaton [1]].
6. Hochheimer, J. N. and F. W. Wheaton. 1995. Ozone Use in Aquaculture. Paperpresented at Aquaculture ’95, San Diego.
7. Damez, F. 1982. Materials resistant to corrosion and degradation in contact withozone. In: W. E. Masschelein (ed.),Ozonation Manual for Water and WastewaterTreatment. John Wiley and Sons, New York.
8. Robson, C. M. 1982. Design engineering aspects of ozonation systems. In: R. G. Riceand A. Netzer (eds.),Handbook of Ozone Technology and Applications, vol. I. AnnArbor Science Publishers, Ann Arbor, MI.
9. Piper, R. G., I. B. McElwain, L. E. Orme, J. O. McCraran, L. G. Fowler, and J.R. Leonard. 1982.Fish Hatchery Management. U.S. Fish and Wildlife Service,Washington, DC.
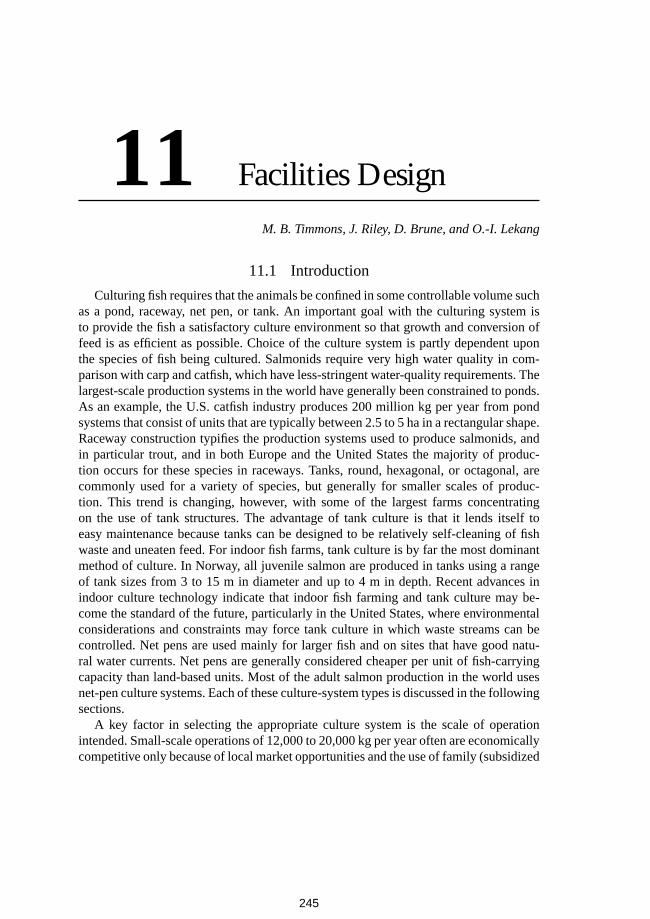
11 Facilities Design
M. B. Timmons, J. Riley, D. Brune, and O.-I. Lekang
11.1 Introduction
Culturing fish requires that the animals be confined in some controllable volume suchas a pond, raceway, net pen, or tank. An important goal with the culturing system isto provide the fish a satisfactory culture environment so that growth and conversion offeed is as efficient as possible. Choice of the culture system is partly dependent uponthe species of fish being cultured. Salmonids require very high water quality in com-parison with carp and catfish, which have less-stringent water-quality requirements. Thelargest-scale production systems in the world have generally been constrained to ponds.As an example, the U.S. catfish industry produces 200 million kg per year from pondsystems that consist of units that are typically between 2.5 to 5 ha in a rectangular shape.Raceway construction typifies the production systems used to produce salmonids, andin particular trout, and in both Europe and the United States the majority of produc-tion occurs for these species in raceways. Tanks, round, hexagonal, or octagonal, arecommonly used for a variety of species, but generally for smaller scales of produc-tion. This trend is changing, however, with some of the largest farms concentratingon the use of tank structures. The advantage of tank culture is that it lends itself toeasy maintenance because tanks can be designed to be relatively self-cleaning of fishwaste and uneaten feed. For indoor fish farms, tank culture is by far the most dominantmethod of culture. In Norway, all juvenile salmon are produced in tanks using a rangeof tank sizes from 3 to 15 m in diameter and up to 4 m in depth. Recent advances inindoor culture technology indicate that indoor fish farming and tank culture may be-come the standard of the future, particularly in the United States, where environmentalconsiderations and constraints may force tank culture in which waste streams can becontrolled. Net pens are used mainly for larger fish and on sites that have good natu-ral water currents. Net pens are generally considered cheaper per unit of fish-carryingcapacity than land-based units. Most of the adult salmon production in the world usesnet-pen culture systems. Each of these culture-system types is discussed in the followingsections.
A key factor in selecting the appropriate culture system is the scale of operationintended. Small-scale operations of 12,000 to 20,000 kg per year often are economicallycompetitive only because of local market opportunities and the use of family (subsidized
245

246 Facilities Design
or noncosted) labor [1, 2, 3]. Sedgwich [1] found that 20,000 kg of trout production wasthe smallest farm that could provide a viable income if fish production were the solesource of income. Intermediate-sized operations do not appear to offer much advantage.Easley [4] found only a 4% decrease in costs of production among farms between 12,000and 60,000 kg. Keenum and Waldrop [5] reported the costs of production for a catfishpond operation as $1.50 U.S., $1.39, and $1.32 per kilogram at yearly production levelsof 286,000, 580,000, and 1.2 million kg. In terms of commodity levels of production,scale of operation has distinct advantages. These data support sizing the fish-productionsystem carefully to the management and labor resources that are to be dedicated to theoperation. These data do not address the impact of productivity from a fixed facility,previously mentioned by Losordo and Westerman [6].
One should bear the above consideration in mind closely when selecting a culturesystem. The least cost is generally associated with tank culture systems, because theycan be made very small with size and cost basically proportional. Once experience isgained with the particulars for management of a specific species, then selection of theculture system can be reevaluated.
One of the major considerations for intensive aquaculture operations is the requiredwater-flow rates to maintain water-quality conditions that are conducive to high pro-ductivity. Generally, required flow rates are dictated by oxygen considerations, althoughammonia loading or carbon dioxide build-up can also dictate the maximum requiredflow rates. These calculations are identical for tank or raceway considerations and arepresented in the section on raceways, in Eqs. 11.2 to 11.5.
11.2 Ponds
Ponds are clearly the dominant design used for aquaculture accounting for roughly40% of the total aquaculture production [7]. Worldwide the average production fromponds is 1040 kg/ha, but the range of productivity varies by a factor of 10. High-densityshrimp ponds and carp ponds may produce in excess of 12,000 kg/ha. In such systems,artificial aeration and supplemental feeding are required.
Ponds are typically greater than 0.9 m and less than 2.4 m in depth. Pond depthis selected based on a compromise between being deep enough that light does notpenetrate to the pond bottom (this limits rooted plant growth) and shallow enough tolimit temperature stratification, reduce overall water usage, and to minimize harvestingefforts. Pond areas range from 0.3 to 7 ha for catfish and shrimp farms; size is lessimportant than maintaining a regular rectangular shape to facilitate net harvesting andefficient usage of land space. More details are given later in this section on physicaldesign parameters.
As biomass densities and feeding increase, generally water exchange through the pondis increased to maintain water quality. At some high rate of water exchange, the pondbecomes a raceway. Ponds are dominated by algal photosynthesis. Stable algal popula-tions in high-rate algal production ponds have been maintained at hydraulic detentiontimes as short as 2 days, or a water exchange of 50% per day [8]. Typical ponds, becauseof self-shading and limited mixing, should be operated on no less than a 3- to 4-day

Ponds 247
detention time (25% to 33% water exchange rates per day). Once this exchange rateis exceeded, the algal cell concentration is washed out of the pond. Water make-up forevaporation is typically between 0.25 and 1 cm per day, which for a 1.5-m pond depthamounts to less than 1% water exchange per day.
11.2.1 Pond Photosynthesis
Ponds, being photosynthetic systems, exhibit a diurnal water quality fluctuation. Thealgal photosynthesis occurring in the pond water column has been represented by Stummand Morgan [9].
106CO2+ 16NO3+ 122H2O+ HPO4→ C106H263P110N16P+ 138O2 (11.1)
This equation suggests that for every unit of oxygen added to the pond water columnby photosynthesis, an equal unit of oxygen demand will be produced by algal biomass,amounting to 0.80 g VS/g O2 produced, or 3.47 g O2/g carbon fixed. This leads toa number of important implications with regard to pond aquaculture. First, becausephotosynthesis occurs only in the light, the pond environment experiences a daily ordiurnal peak in oxygen production followed by a nighttime minimum of oxygen owingto respiration. The daily cycle of oxygen becomes a management problem for the fishfarmer as mechanical aeration is used to prevent oxygen levels in the pond from goingbelow lethal levels.
11.2.2 Diurnal Limits
The situation of the catfish pond can be used to illustrate this. If a pond contains no fishand no nutrients to drive algal production, the oxygen concentration in the pond waterwill reach the equilibrium dissolved oxygen level as defined by temperature, 8.4 mg/Lat 25◦C (Fig. 11.1a). If nitrogen and phosphorus are added to the pond at a rate equal tothe N and P in catfish feed sufficient to support 3000 kg/ha, the pond oxygen levels willbecome polarized as a result of photosynthesis with a daytime high of 10.4 mg/L and anighttime low of 6.4 mg/L (at typical pond photosynthesis rates of 2.0 g carbon/m2/d,see Fig. 11.1b). If a minimum desirable oxygen concentration in the pond is 3 mg/L,and surface re-aeration can supply 3.6 g O2/m2/d at a typical wind speed of 3 m/s,approximately 590 kg of catfish respiratory demand can be sustained (see Fig. 11.1c).The catfish farmer is able to increase the carrying capacity of the pond by eliminatingthe bottom of the nighttime diurnal curve by applying mechanical aeration when needed.Under these conditions, unless the algal crop is being harvested, photosynthesis is notsupplying oxygen to the pond. In practice, mass balances on the growing algal cropconsistently fail to account for approximately 25% of the algal cell production. Thisalgal biomass is likely leaving the water column by entering the catfish biomass throughthe food chain or exiting the pond by decomposition and seepage to the groundwater. Thisfortuitous algal harvest combined with early-morning mechanical aeration to increasepond O2 from a low of 1.3 mg/L to 3.0 mg/L allows the catfish farmer to push the carryingcapacity to 1400 kg/ha (see Fig. 11.1d).
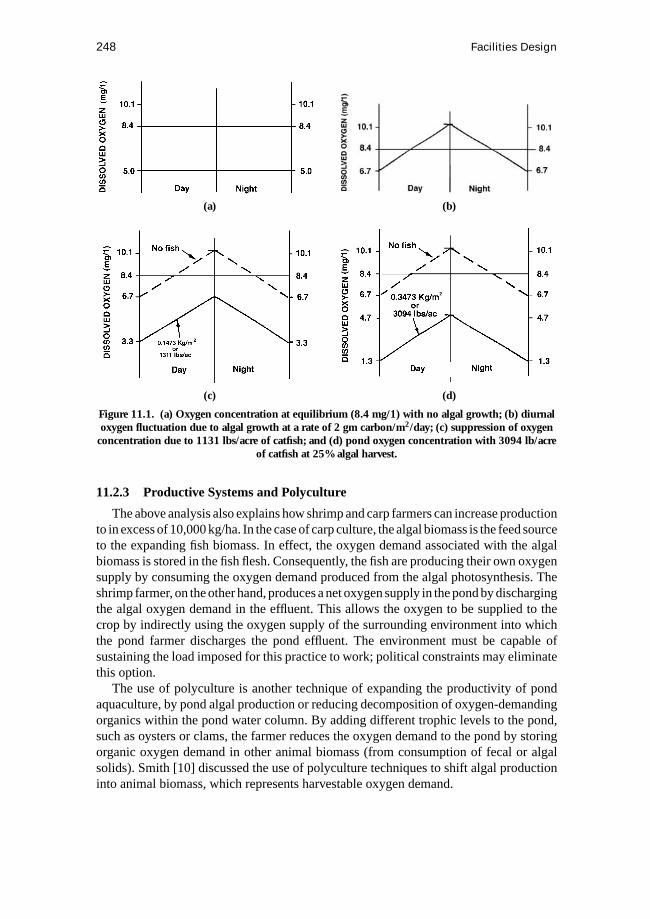
248 Facilities Design
(a) (b)
(c) (d)
Figure 11.1. (a) Oxygen concentration at equilibrium (8.4 mg/1) with no algal growth; (b) diurnaloxygen fluctuation due to algal growth at a rate of 2 gm carbon/m2/day; (c) suppression of oxygen
concentration due to 1131 lbs/acre of catfish; and (d) pond oxygen concentration with 3094 lb/acreof catfish at 25% algal harvest.
11.2.3 Productive Systems and Polyculture
The above analysis also explains how shrimp and carp farmers can increase productionto in excess of 10,000 kg/ha. In the case of carp culture, the algal biomass is the feed sourceto the expanding fish biomass. In effect, the oxygen demand associated with the algalbiomass is stored in the fish flesh. Consequently, the fish are producing their own oxygensupply by consuming the oxygen demand produced from the algal photosynthesis. Theshrimp farmer, on the other hand, produces a net oxygen supply in the pond by dischargingthe algal oxygen demand in the effluent. This allows the oxygen to be supplied to thecrop by indirectly using the oxygen supply of the surrounding environment into whichthe pond farmer discharges the pond effluent. The environment must be capable ofsustaining the load imposed for this practice to work; political constraints may eliminatethis option.
The use of polyculture is another technique of expanding the productivity of pondaquaculture, by pond algal production or reducing decomposition of oxygen-demandingorganics within the pond water column. By adding different trophic levels to the pond,such as oysters or clams, the farmer reduces the oxygen demand to the pond by storingorganic oxygen demand in other animal biomass (from consumption of fecal or algalsolids). Smith [10] discussed the use of polyculture techniques to shift algal productioninto animal biomass, which represents harvestable oxygen demand.
Ponds 249
Drapcho and Brune [11] presented a theoretical analysis of pond aquaculture sug-gesting that if algal photosynthesis could be sustained at maximum levels of 6 to 12 gcarbon/m2/d, and harvested by filter-feeding fish, sustained yields in excess of 26,000kg/ha may be possible in non-aerated ponds with limited water-exchange rates.
11.2.4 pH Limits
As oxygen cycles on a diurnal basis, so too the pH is cycling. As inorganic carbonis extracted from the water for algal carbon fixation, the pH of the water column willexperience a daily rise and then, in turn, experience a nighttime decline from CO2 release.Boyd [12] recommends a pH range of 6.5 to 9.0 as desirable range for fish production,with 4.0 to 5.0 being the acid death point and 11.0 the alkaline death point. In manycases, pH fluctuations in organically fed ponds are not a problem because CO2 is removedfrom the pond as side benefit of the gas exchange that must occur to prevent death fromoxygen depletion. However, if the pond water has an alkalinity of less than 25 mg/L anda production rate of greater than 3 g carbon/m2/d, it is possible to exceed the high endof the desirable pH scale. This is particularly true if the pond is fertilized by inorganicfertilizer so that there is no organic carbon input to the pond. Under these conditions, thepond may not have sufficient buffering capacity to prevent excessive pH shifts. Undersuch conditions, production must be limited, or additional alkalinity must be supplied tothe pond, usually in the form of lime.
11.2.5 Nitrogen Control
There is some basis for thinking that the algal crop in an aquaculture pond plays anadditional important role in preventing excessive levels of toxic NH3 and NO2 accumula-tion in the pond water. However, the relative rates of pond nitrification (bacteria-mediatedtransformation of NH3 → NO2 → NO3) compared with algal photosynthesis are notwell understood. Toxicity owing to NH3 and NO2 build-up in ponds has been docu-mented. However, frequent periods of cloudiness (and reduced photosynthesis) can oftenbe sustained with little build-up of toxic ammonia, even in ponds with carrying capacityin excess of 3000 kg/ha [13]. In general, if net oxygen production rates are maintainedby algal photosynthesis followed by algal harvest, one should expect that nitrogen accu-mulation will also be controlled by algal nitrogen fixation, combined with algal removal.
11.2.6 Pond Types
There are three common types of ponds: watershed, excavated, and embankmentponds. Watershed ponds take advantage of natural topography that includes a ravine ofnatural depression and simply require a dam across the lower end of the natural drainageoutlet to catch seasonal rainfall. This type of pond is not well suited to aquaculturebecause the harvesting of fish from such a system is not practical. Control of watersupply is undependable and unpredictable. Excavated ponds also are generally not usedfor aquaculture because they are simply holes dug into the ground and then allowed tofill from rainfall or spring flow. These ponds often result from situations in which landfillis needed and a pond depression results from removing soil for these other purposes. Atbest, these ponds represent opportunities for cage culture or sport-fishing opportunities.

250 Facilities Design
(a)
(b)
(c)
Figure 11.2. Drainage methods: (a) Turn-down drain;(b) double-sleeve turndown drain; and (c) swivel joint
on the outside of the pond.
The levee pond or embankment pond is the pond type most clearly associated withaquaculture. The pond is constructed by large dirt-moving equipment that creates arectangular structure of 0.5 to 8 hectares generally 0.9 m to 2.4 m in depth and isconstructed to minimize the difficulties associated with net harvesting and truck loadingof live product. Design should also incorporate provisions for draining the embankmenttype pond (Fig. 11.2). Figure 11.3 provides further detail on normal drainage controlfrom such ponds. Although not shown in these figures, some provision should be madefor emergency flow across the top of the levee during flooding; generally these channeldepressions might be placed on either end of the levee. One must remember also toinclude some provision to retain the fish from swimming out of the pond, or at theconclusion of the flood situation the pond owner may be short of fish! The geometry ofthe levee/embankment ponds (see Fig. 11.4) is dictated by soil materials and the actual
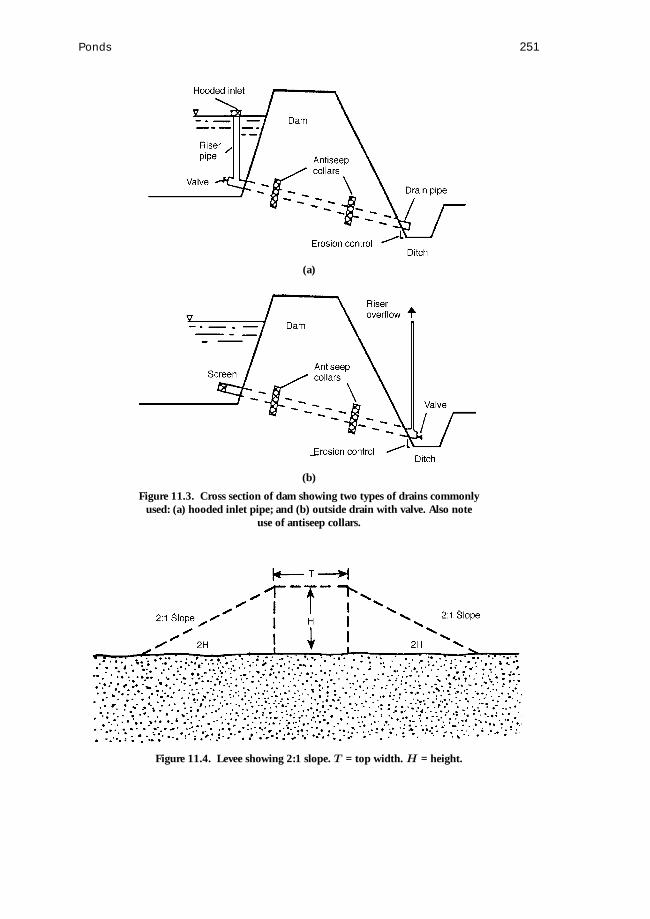
Ponds 251
(a)
(b)
Figure 11.3. Cross section of dam showing two types of drains commonlyused: (a) hooded inlet pipe; and (b) outside drain with valve. Also note
use of antiseep collars.
Figure 11.4. Levee showing 2:1 slope. T = top width. H = height.
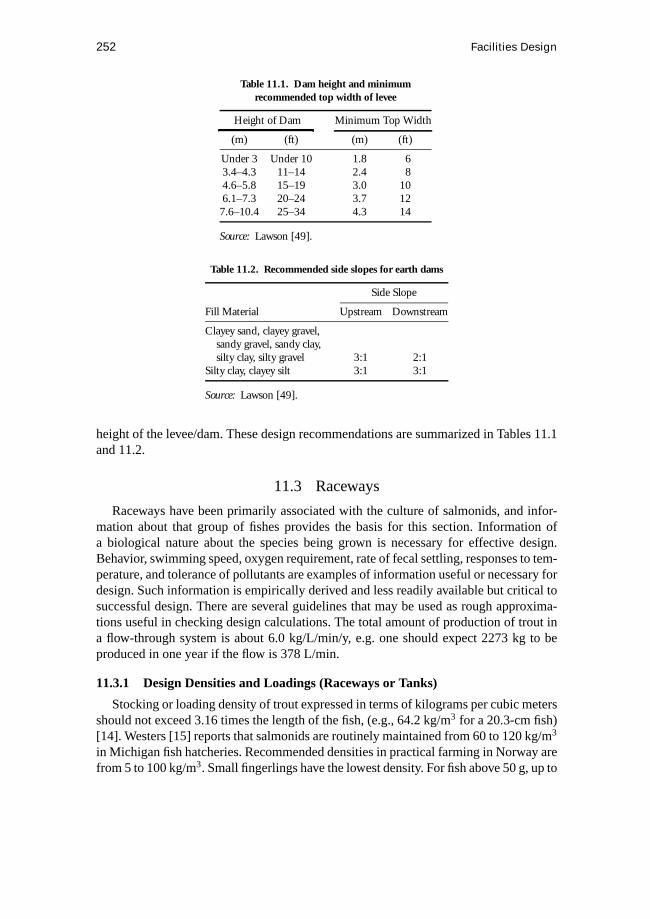
252 Facilities Design
Table 11.1. Dam height and minimumrecommended top width of levee
Height of Dam Minimum Top Width
(m) (ft) (m) (ft)
Under 3 Under 10 1.8 63.4–4.3 11–14 2.4 84.6–5.8 15–19 3.0 106.1–7.3 20–24 3.7 12
7.6–10.4 25–34 4.3 14
Source: Lawson [49].
Table 11.2. Recommended side slopes for earth dams
Side Slope
Fill Material Upstream Downstream
Clayey sand, clayey gravel,sandy gravel, sandy clay,silty clay, silty gravel 3:1 2:1
Silty clay, clayey silt 3:1 3:1
Source: Lawson [49].
height of the levee/dam. These design recommendations are summarized in Tables 11.1and 11.2.
11.3 Raceways
Raceways have been primarily associated with the culture of salmonids, and infor-mation about that group of fishes provides the basis for this section. Information ofa biological nature about the species being grown is necessary for effective design.Behavior, swimming speed, oxygen requirement, rate of fecal settling, responses to tem-perature, and tolerance of pollutants are examples of information useful or necessary fordesign. Such information is empirically derived and less readily available but critical tosuccessful design. There are several guidelines that may be used as rough approxima-tions useful in checking design calculations. The total amount of production of trout ina flow-through system is about 6.0 kg/L/min/y, e.g. one should expect 2273 kg to beproduced in one year if the flow is 378 L/min.
11.3.1 Design Densities and Loadings (Raceways or Tanks)
Stocking or loading density of trout expressed in terms of kilograms per cubic metersshould not exceed 3.16 times the length of the fish, (e.g., 64.2 kg/m3 for a 20.3-cm fish)[14]. Westers [15] reports that salmonids are routinely maintained from 60 to 120 kg/m3
in Michigan fish hatcheries. Recommended densities in practical farming in Norway arefrom 5 to 100 kg/m3. Small fingerlings have the lowest density. For fish above 50 g, up to

Raceways 253
120 kg/m3 have been reported from land-based salmon farms. Arctic charr can toleratea much higher density than Atlantic salmon. Average densities of up to 150 kg/m3
can be tolerated. In experimental conditions, densities between 200 to 300 kg/m3 havebeen attempted with good results. Poston [16] has reviewed the effects of density andoxygen consumption under high-density conditions. Under high-density carrying ca-pacities, it is important to be sensitive to CO2 control, because elevated levels oftenresult. Carrying capacity is apparently affected by more than either oxygen or ammoniaconstraints [17].
The required flow rates or allowable loading levels for oxygen supply are based uponthe available oxygen (difference between inlet and outlet concentrations in milligramsper liter), the percentage feeding rate, and the fact that roughly 220 g of oxygen arerequired to oxidize each kg of feed (100 g/lb of feed) [18]. After some iteration andsimplification, allowable loading levels subject to oxygen constraints can be expressedas (assuming feeding activity is uniformly distributed over a 24-hour period):
Ldoxygen= 1.44×1O2
2.20×%feeding rate(11.2)
where
Ldoxygen= loading level in kg fish per liter per minute of flow (multiply by 8.33to convert to lb of fish per gallon per minute)
1O2 = change in oxygen level, mg/L%feeding rate= rate of feeding in percent of body weight.
For example, if there were 5 mg/L available oxygen, and the feeding rate was 2%, thenthe loading level would beLdoxygen= 1.44×5
2.20×2 = 1.14 kg of fish per L/min (9.5 lb/gpm).Figure 11.5 provides an illustration of loading levels based upon feeding rates and changein oxygen.
Ammonia is the second primary consideration in designing allowable fish loadingdensities. Westers [15] has simplified the calculation into the following form:
Ldammonia= UAallowable× 1000
1O2×%UA of TAN(11.3)
where
Ldammonia= allowable fish weight per unit of flow to maintain unionized ammonialevels below some allowable level, kg fish per liter per minuteof flow (multiply by 8.33 to convert to pounds of fish per gpm)
UAallowable= allowable or upper design limit for unionized ammonia levels, mg/L%UA of TAN = the percent of un-ionized ammonia of the total ammonia
nitrogen (TAN), %, function of temperature and pH.A design level for un-ionized ammonia of 0.0125 to 0.020 mg/L can be used [15].Generally, the allowable loadings based upon ammonia control will be much largerthan that required for supplying oxygen. After calculating both oxygen and ammoniaallowable loading levels, one should utilize the smaller to calculate the required flow to

254 Facilities Design
Figure 11.5. Allowable fish loading (lbs per gpm; divide by 8.33 to obtain kgs perL/min) as a function of feeding rate (% of body weight) and change in oxygen contentfrom inlet to outlet (5 ppm of oxygen at the outlet is recommended for salmonids).
support the intended level of fish biomass:
Q = Weight of Fish
Ld(11.4)
whereQ = required flow rate, L/min (× 3.785 to convert to gpm).Water-exchange rate can be calculated from the fish density and loading levels (0.06
constant in the following equation is converting L/min to m3/hr):
R= D × 0.06
Ld(11.5)
R= D × 8.02
Ld(11.5.1)
where
R = water volume exchanges per hourLd = loading rate, kg/L/min (lb/gpm in English units)D = fish density, kg/m3 (lb/gpm in English units).
11.3.2 Raceway Length
Raceway length can be calculated based uponR and a minimum required averagevelocity for the raceway:
Lm= 3600× V
R(11.6)

Raceways 255
where
Lm = required raceway length, mV = minimum required raceway velocity, m/s.
Acceptable values for raceway velocity are discussed in detail elsewhere in this chapter.
11.3.3 Fish Growth
Water temperature is used in estimating, along with fish size, the amount of foodrequired and associated increases in length and weight of salmonids [19, 20]. Haskell[21] wrote that trout increased 1 cm for each 4.59 temperature units (◦C); a temperatureunit was the average monthly water temperature minus 3.67◦C:
G = T − 3.67
4.59(11.7)
where
G = fish growth per month, cmT = average monthly water temperature,◦C.
Speece (1973) summarizes and interprets information useful in design related to nitrifi-cation and waste management control.
Example. Suppose the objective is to produce 455 kg of 20.3-cm brook trout in a flow-through, rectangular raceway. Because feeding rate and dissolved oxygen are functionsof temperature, knowledge of temperature is required. We will assume a constant temper-ature of 10◦C. One should always use the maximum expected temperature, if known, fordesign purposes. Feeding charts and tables listing dissolved oxygen are given by Leitritz[22] and Piper et al. [14], for example. Brook trout 20.3 cm in length and held in 10◦Cwater require a daily amount of food equal to 1.15% of their body weight, assuming drypelleted food is being used. The 455 kg of trout will therefore be fed 5.23 kg of feed perday. Because 220 g of oxygen are required to metabolize 1.0 kg of pelleted food [18],5.23 kg of pellets would cause a removal of 1.15 kg of oxygen from the in-flowing watereach day.
The amount of oxygen available to the raceway is dependent on temperature and flowof incoming water, and on the altitude of the raceway above sea level. Assuming analtitude of 305 m and a temperature of 10◦C, the oxygen content of water in equilibriumwith air is 10.9 parts per million (ppm). Not all of this oxygen is available for fishbecause there is a minimum level necessary for satisfactory growth. Currently, an oxygenconcentration of 7 ppm is an accepted lower limit in Norwegian farms or 70% of oxygensaturation [23, 24]. In this example there are 3.9 kg (10.9−7.0=3.9) of oxygen availablefor each million kilograms of water (ppm). Thus, 294,872 kg (or liters) of water per dayprovides the 1.15 kg of oxygen required each day. A flow of 205 L/min is required forthis example. Any change in atmospheric pressure or temperature causes a change in theexact flow required. Increases in water temperature and associated decreases in incomingoxygen levels can dramatically increase water-flow requirements.

256 Facilities Design
Table 11.3. Maximum allowable velocity to prevent erosion
Soil Type na Clear Water (ft/s) Colloidal Transport (ft/s)
Sandy 0.020 1.5–1.7 2.5Loam 0.020 1.7–2.5 2.5–3.5Clay 0.025 3.7 5.0Shale/hardpan 0.025 6.0 6.0
a Manning roughness coefficient.
Equation (11.2) can also be used also to calculate the required flow for the previousexample. Using the specified feeding rate, 1.15%, and the available oxygen, 3.9 mg/L,the allowable loading level for oxygen is:
Ldoxygen(kg/L/min) = (3.9×1.44)/(2.20×1.15)
= 2.22 kg/L/min
Required flow rate to support the intended fish biomass (Eq. (11.4)) is
Q = 454 kg of fish/2.22 kg per L/min
= 205 L/min
This is the same flow rate as calculated before.
11.3.4 Design Principles and Considerations
Raceway design should be based upon the physical principles that control open chan-nel flow. Wheaton [25] provides information related to physical design of raceways.Several textbooks are available that review design of open-channel flows [26]. In design-ing an open channel, at least two factors should be considered related to average channelvelocity,Vaverage: minimum cleaning velocity and maximum allowable velocities for fishperformance.
ErosionConsiderations related to erosion are generally not important because most raceways
are constructed of concrete, metal, or wood. If a raceway is formed using natural soils(cuts), then one should refer to Table 11.3 for allowable velocities.
Cleaning VelocitiesMinimum cleaning velocities can be estimated based on the following expression [26]
Vclean= 1
2d4/9(G− 1)1/2 (11.8)
where
Vclean= cleaning velocity, ft/sG = specific gravity of the materiald = particle diameter in mm.

Raceways 257
Table 11.4. Minimum required velocityfor channel cleaning
Material Particle Size Vclean, cm/s (ft/s)
Feed/feces (G = 1.19) 100 µm 2.4 (0.08)Feed/feces 1/16 in 3.7 (0.12)Silt 0.002 mm 0.9 (0.03)Fine sand 0.05 mm 4.0 (0.13)
This expression was specifically developed from data for materials with specific gravitiesfrom 1.83 to 2.64. It is assumed to be valid as a first approximation to predict cleaningvelocities for fish feces and uneaten feed because the specific gravity of fish feces is morenear 1.2 for salmonid diets [27]. Ketola [28] determined specific gravities of commercialtrout diets to be 1.20 for #3 crumbles and 1.13 for .25-in pellets. Table 11.4 givesminimum velocities for cleaning.
Westers [15] recommends a value of 3 cm/s (0.10 ft/s) as an effective compromise toallow heavy solids to settle rapidly yet create “good” hydraulics.
Fish FatigueDesign of raceways (or round tanks) should also be done so as not to create exces-
sive water velocities that would fatigue the raceway fish. Beamish [29] summarizes aconsiderable volume of data related to burst speeds, critical speeds, prolonged speeds,and sustained speeds for various species. From a review of the data comparing sustainedspeeds at various fish lengths and critical speeds, a conservative estimate of safe race-way speeds could be made of one half the critical speed (there is considerable more dataon critical speeds than any other data, and no data on sustained speeds for fresh-waterfishes). There is a definite relationship between critical speed and fish length. Whenswimming speed is expressed as fish lengths per second, the critical speeds for sock-eye salmon decreased from 4.5 to 2.0 lengths/s as length increased from 10 to 90 cm.These data along with the assumed relationship between safe speed and critical speedwere used to develop the following relationship to calculate allowable safe velocities inraceways:
Vsafe= 5.25
length0.37 (11.9)
where
Vsafe= maximum design velocity for raceway, which is assignedto be one half the critical swimming speed, length/s
length= fish length, cm.
For example, using the above equation for a 10-cm fish, the allowable design velocitywould be 2.24 lengths/s× 10 cm/lengths= 22.4 cm/s (0.73 ft/s). Figure 11.6 illustratesthe relationship between fish length and safe swimming speed. Usually, this constraintwill not be a problem; however, it should always be checked.

258 Facilities Design
Figure 11.6. Safe raceway velocities to prevent fish fatigue as a function offish length; expressed as fish lengths per sec (l/s).
Channel GeometryMost raceways will be constructed from concrete or other man-made materials. The
bottom width for most efficient cross section and minimum volume of excavation isgiven as follows [26].
W=2d tan{ø/2} (11.10)
where
W = width, md = depth, mø= side slope angle (vertical sides are 90 degrees).
For the typical raceway which has vertical sidewalls, then
W = 2d
It can also be shown that if equation (10) is used to calculate channel width, then thehydraulic radius,R, as used in the Manning equation, is equal to one half of the depth.
If raceways are cut into the earth, allowable side slopes are given in Table 11.5.
Channel VelocityIf a flow rate in a channel is known, for example from a pumping rate or a weir
determination, then the average channel velocity can be calculated from the continuityequation,
V = Q
A(11.11)

Raceways 259
Table 11.5. Allowable side slope for soil constructedchannels up to 1.2 m
Soil Type Side Slope
Peat, muck VerticalStiff/heavy clay 0.5:1Clay silt loam 1:1Sandy loam 1.5:1Loose sand 2:1
Note. For channels wider than 1.2 m, increase the hori-zontal component by 50%; e.g., loose sandy soilsshould use a 3:1 side slope.
Table 11.6. Roughness coefficient (n) for different materials
Material n Range
Concrete 0.015Metal, smooth 0.013Metal, corrugated 0.024Plastic 0.013Wood 0.012Earth channel, rubble sides 0.032 0.025 to 0.040Natural streams, clean, straight 0.025 to 0.033
where
Q = flow, m3/secA = cross sectional area in m2.
If the potential flow rate is needed for a specific channel, with a known bottom slope andflow depth, the average velocity can be calculated using Manning’s formula (Englishunits; [26]):
Vaverage= 1.49 R2/3 s1/2
n(11.12)
where
Vaverage= average channel velocity, ft/sR = hydraulic radius (area of cross sectional flow/wetted perimeter), fts = channel slope, ft/ft decimaln = roughness coefficient.
Values for roughness coefficients are given in Table 11.6 [26].Having calculated the average channel velocity, flow rates are calculated from the con-
tinuity equation,Q=VA (Eq. (11.11)). Solutions to the Manning equation (Eq. (11.12))can be found by using Fig. 11.7. Flow rates for typically sized channels at different slopesare given in Fig. 11.8 (0.305-m channel) and Fig. 11.9 (1.8-m channel).

260 Facilities Design
Figure 11.7. Graphical solutions of the Manning equation. (Redrawn from U.S. SoilConservation Service, Engineering Handbook, Hydraulics Section 5, 1951.)

Raceways 261
Figure 11.8. Channel flow rates for a 0.305 m (1 ft) wide, rectangular, wood channel atdepths between 1.5 cm and 7.6 cm (0.05 and 0.25 feet) at slopes of 0.01, 0.02,
0.06 and 0.10%.
Figure 11.9. Channel flow rates for a 1.83 m (6 ft) wide, rectangular, concrete raceway at depthsbetween 3 cm and 61 cm (0.1 and 2.0 ft) at channel slopes of 0.01, 0.05 and 0.10%.
262 Facilities Design
Example. For the example previously given (455 kg of 20.3-cm trout), the requiredflow rate was 135 L/min and the required volume was 7.09 m3. A typical raceway inthe northeast United States would be 1.83 m wide, and a typical depth of 0.6 m wouldbe maintained. The minimum cleaning velocity of 4 cm/s can be used to determine theminimum flow requirement to prevent siltation and to clean feed and feces from theraceway:
Qclean= VcleanA
= 0.04 m/s× 1.83 m× 0.61 m× 1000 L
m3× 60
sec
min= 2679 L/min (11.13)
This is obviously a much larger quantity of water than is required to supply the oxygenneeds of the fish (136 L/min). What is seen in practice is that raceways are managed muchcloser to their design requirements for oxygen supply than for cleaning requirements. Infact, common opinion among practicing hatchery operators is that raceways do not workwell. Clearly, a significant contributing factor is that the raceways are designed belowtheir required cleaning velocities. In general, raceways should be designed to minimizecross-sectional area so as to promote maximum velocity. Also, where multiple races areneeded, raceways should be run in series flows as opposed to parallel. This approachmay require re-aeration between raceways.
If 4 cm/s is used as the minimum design velocity, then the required flow for cleaningbecomes:
Qclean= C × A (11.14)
where
Qclean= flow required for cleaning, L/min (gpm)C = 2360 L/minA = cross sectional area of channel, m2.
Raceway shapes and dimensions should in fact be designed based upon previouscalculations of fish density and loading levels. Using Eq. (11.5), the required volumetricexchange rate can be calculated, from which raceway length is calculated, Eq. (11.6):
D = 64.2 kg/m3 (20.3-cm fish)
Ld = 3.36 kg/L/min (from 1.15% feeding and 5.9 mg/L oxygen available)
R = D × 0.06
Ld= 64.2× 0.06
3.36 kg/L/min= 1.15 exchanges per hour
Lm= 36× V/R
Utilizing a design velocity of 4 cm/s,Lm is
Lm= 36× 4
1.15= 126 m

Net Pens 263
Returning to our design volume of 7.09 m3, the cross-sectional area of the racewaywould be only 0.056 m2. This of course is impractical.
Because typical raceways are a fifth to a tenth of the calculated design length, it can beseen that required flow rates must also be five to ten times the flows required for oxygenconsiderations. Equations (11.5) and (11.6) are useful in showing the inter relationshipsbetween these factors.
Practical ConsiderationsSize of raceways in practice is determined by a number of other factors such as
topography, soil type, construction material, and total water available. Because racewaysare generally outdoor structures, ease of access and protection of fish from predators mustalso be considered. This may restrict the maximum depth or width of the raceway. Thesize and species of fish could have requirements, for example maximum velocity, thatnecessitate design or operational modification. Depth of water is one dimension easilycontrolled by addition or removal of dam boards. Changing depth changes both volumeand velocity.
Raceways are normally operated in series with the discharge of the upstream racewayserving as the inflow water of the next one downstream; this is done to maintain maximumvelocities through the races as previously discussed. The quality of water obviouslydeteriorates through the accumulation of waste products and depletion of oxygen.
Separate inlets and outlets should be designed for each raceway to allow for inde-pendent operation. This arrangement allows for isolation, which is desirable in treatingdisease and cleaning waste from the system. Supply and discharge pipes need to be ofsufficient size to account for maximum flows expected during any phase of operation.Keyways are provided for screens and dam boards.
11.4 Net Pens
Floating net pens or cages have been used for fish culture in Southeast Asia for over100 years. In the Western hemisphere net-pen culture of Atlantic salmon began in Norwayand Scotland in the early 1960s [30]. Since that time the technology has been transferredto several countries including Canada, the United States, and Chile. The industry hasprogressed from small home made pens of a few cubic meters to factory-built pens withvolumes over 1000 m3. At the same time, there has been a transition from one-personor family operations with a few pens to large arrays of linked pens covering severalacres. Many of these are owned and operated by multinational corporations and includefloating feed storage and computerized feed distribution, on-shore feed production, fishhealth laboratories, net-washing facilities, and fish-processing plants.
Until quite recently, establishment of an ocean-based fish farm has been less a matter ofdesign than an exercise in dealing with lease applications and environmental regulations,obtaining financing, establishing a supply of smolt and feed, finding suitable personnel,addressing fish health concerns, and marketing the product. Design, either of the overallsystem or of the components within it, has not represented a high priority. However,in the 1980s this situation changed. As the industry grew, so did concerns over the

264 Facilities Design
environmental effects of intensive fish culture in protected in-shore waters: the fjords ofNorway, the Scottish locks, the relatively shallow waters of Washington’s Puget Sound,and the coastal sites in New Brunswick and Maine. This prompted a move to deeper-watersites with better water flow but greater exposure to harsh open-ocean conditions. Majorequipment failures occurred, resulting in some large insurance claims, and attention wasfocused on the need for proper design using sound engineering practices. The processof establishing a net-pen system can be considered in three steps, namely, site selection,component selection and/or fabrication, and system operation.
11.4.1 Site Selection
Selection of a suitable location for a net-pen system is the single most importantfactor in its potential for success or failure [31, 32, 33, 34]. Several factors need to beconsidered.
Current SpeedProduction of fish under intensive conditions requires a constant supply of clean water.
Net-pen systems rely on continuous adoption to ensure regular water changes within thepens. This is needed to provide a constant supply of oxygen to the fish and to remove theirmetabolic products and any uneaten feed. Several reports have been published studyingthe effects of different current speeds on the fish and the environment [32, 35], but sitespecificity makes it difficult to propose uniform figures. A minimum peak tidal currentspeed of 0.5 m/s has been proposed for the state of Maine, although several farms havebeen established at sites with much slower current speeds with no apparent ill effects.In Norway, it is recommended that the current speed inside the net pen should not bebelow 0.1 m/s. Maximum desirable current speed is limited initially by the energy wastedby the fish in its swimming to maintain position, and ultimately by its inability to swimcontinuously at this speed. This results in crowding of the fish to the downstream end of apen. In addition, excessively high current speeds induce high stresses in the equipment,increasing the possibility for net failure and movement of moorings with potentiallycatastrophic results. Sites with current speeds in excess of 200 cm/s are not considereddesirable. It is suggested that prior to purchase or lease of a site, local data be collectedfor that site.
Water Depth and Wave ActionMinimum water depth at low tide below the pens is a matter of some concern and
much controversy. Excess feed and fish feces falling through the bottom of a net penshould ideally be flushed away by the tides to prevent accumulation and potential anoxicconditions with negative impacts on the local benthic community of organisms. Tosome extent, high current speeds can offset the effects of too shallow a site, but ingeneral it is felt that a minimum water depth of 2 to 5 m under pens is required. Theseenvironmental effects have been studied [36, 37] and shown to be controllable by goodsite selection and avoiding excessive biomass densities. Sites are generally selected soas to offer protection from heavy wave action. Such action induces stresses on the pensystems and their moorings, as well as making daily operations difficult, dangerous,

Net Pens 265
and uncomfortable. Pens and pen systems designed for exposed offshore sites need toconsider the greater wave heights likely to be encountered.
Water TemperatureSalmon and trout in ocean net pens utilize feed most efficiently at temperatures from
12◦C to 15◦C. Higher temperatures, which can result in low oxygen and subsequentfish mortality, are generally only found in shallow bays and inlets with poor watercirculation. These sites should be avoided. In winter, water temperatures can fall below0◦C, which, when combined with extremely cold winds, can result in superchill effects.Significant mortality under such conditions can result. Other species, particularly codand haddock, have greater tolerance than salmonids for low temperatures, and attentionis now turning to culture of these alternative species. An additional problem resultingfrom these extremely low winter water temperatures is the formation of ice over the pens.Breakup of the ice by hand has been used to prevent ice formation. Structural damageto the net pens has also occurred due to ice buildup and movement, particularly in theareas prone to ice-cold waters.
WindWinds result in increased lateral forces on the superstructure of a net pen and, as
with wave action, this results in increased stresses on the structural members and on themoorings and makes operation of the system (feeding, inspection, harvesting) uncom-fortable and dangerous. Normally a net pen is installed in such a way that the part abovethe water surface is small, to minimize the effect of wind on the net pen.
AestheticsAlthough lobster boats and buoys, herring weirs, and other traditional fishing gear are
accepted as part of the coastal seascape and are in fact considered a positive feature bytourists and summer people, the appearance of ocean net pens has unleashed a fury ofobjections from these same groups. The unpredictable nature of the permitting processand the length of time required to obtain a site permit should not be underestimated.
11.4.2 Net-Pen Design and Construction
An ocean fish farm can be anything from a single homemade net pen, an outboardskiff, and an onshore feed storage shed, to a complex of pens covering several acres,with floating feed-storage and -distribution facilities and, in the case of offshore systems,accommodation for the workers.
Modern net pens are available in a wide range of sizes, materials, and designs, butall consist basically of a net, a framework or lines to give shape to the net, some meansof access to the fish, flotation to support these components, and a mooring system(Fig. 11.10).
NetsMost nets in use in commercial pen cultures today are of nylon mesh. Smaller pens
have been constructed using plastic-coated wire mesh; this material is more resistantto fouling and predator penetration and is more easily cleaned, but the greater cost and
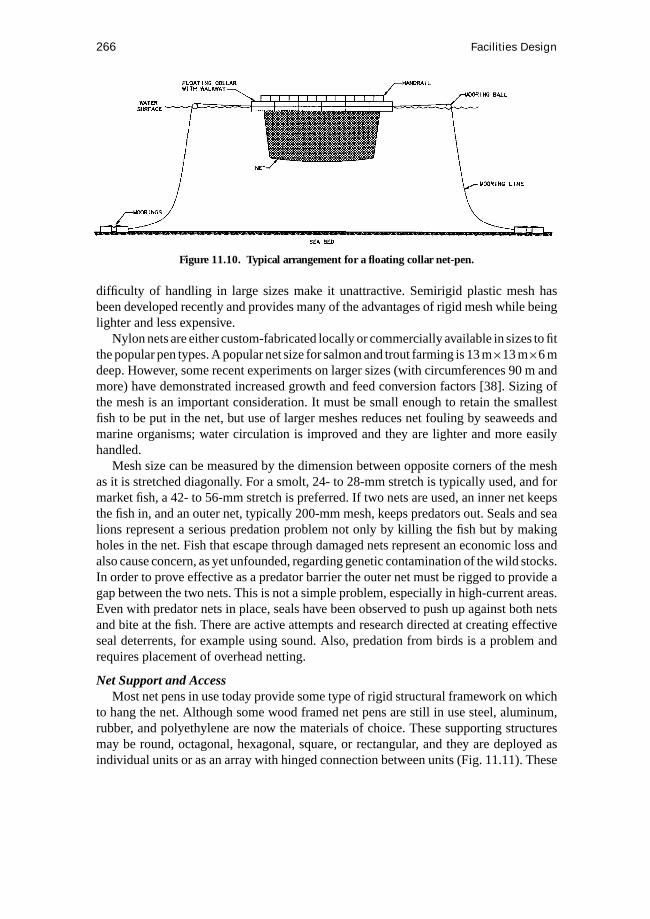
266 Facilities Design
Figure 11.10. Typical arrangement for a floating collar net-pen.
difficulty of handling in large sizes make it unattractive. Semirigid plastic mesh hasbeen developed recently and provides many of the advantages of rigid mesh while beinglighter and less expensive.
Nylon nets are either custom-fabricated locally or commercially available in sizes to fitthe popular pen types. A popular net size for salmon and trout farming is 13 m×13 m×6 mdeep. However, some recent experiments on larger sizes (with circumferences 90 m andmore) have demonstrated increased growth and feed conversion factors [38]. Sizing ofthe mesh is an important consideration. It must be small enough to retain the smallestfish to be put in the net, but use of larger meshes reduces net fouling by seaweeds andmarine organisms; water circulation is improved and they are lighter and more easilyhandled.
Mesh size can be measured by the dimension between opposite corners of the meshas it is stretched diagonally. For a smolt, 24- to 28-mm stretch is typically used, and formarket fish, a 42- to 56-mm stretch is preferred. If two nets are used, an inner net keepsthe fish in, and an outer net, typically 200-mm mesh, keeps predators out. Seals and sealions represent a serious predation problem not only by killing the fish but by makingholes in the net. Fish that escape through damaged nets represent an economic loss andalso cause concern, as yet unfounded, regarding genetic contamination of the wild stocks.In order to prove effective as a predator barrier the outer net must be rigged to provide agap between the two nets. This is not a simple problem, especially in high-current areas.Even with predator nets in place, seals have been observed to push up against both netsand bite at the fish. There are active attempts and research directed at creating effectiveseal deterrents, for example using sound. Also, predation from birds is a problem andrequires placement of overhead netting.
Net Support and AccessMost net pens in use today provide some type of rigid structural framework on which
to hang the net. Although some wood framed net pens are still in use steel, aluminum,rubber, and polyethylene are now the materials of choice. These supporting structuresmay be round, octagonal, hexagonal, square, or rectangular, and they are deployed asindividual units or as an array with hinged connection between units (Fig. 11.11). These

Figu
re11
.11.
Typi
calg
roup
ing
arra
ngem
ents
for
squa
rean
doc
tago
naln
et-p
ens.
267

268 Facilities Design
hinged connections have proved to be the weak point of net-pen systems, especially ifsystems designed for sheltered sites have been used in exposed, off-shore conditions.The individual units can either be located as single units or anchored to a walkway (Fig.11.11). The mooring system is more complicated if there is a walkway. For exposed sitessingle units are advantageous. The absence of a rigid framework tends to make the pen“invisible” to the waves, resulting in less stress on the system including the moorings.This design, however, provides no access to the fish and all servicing, feeding, and soforth must be carried out from a vessel brought alongside the net. Single units are usuallykept 50 to 100 m apart [39]. Recently moorings for circular single net pens have beendeveloped. Each pen is connected to the system by a “hen foot.”
FlotationA floating “collar” around the net is incorporated into the net-support framework. On
circular pens this can be one or two circles of styrofoam-filled polyethylene pipe, up to0.5 m in diameter with pen diameters over 30 m. Rigid bolted, flanged, watertight sectionsof galvanized steel pipe (up to 1 m diameter) are used for circular, octagonal, and hexago-nal pens up to 15 m across. In these units the flotation collar also supports the walkways.Square or rectangular pens generally utilize a galvanized steel framework enclosingplastic-coated styrofoam, with expanded metal walkways and tubular steel handrails.
In addition to these relatively conventional designs there have been several inno-vative solutions proposed but not in widespread use, such as rotating spherical cages,submersible cages, and tension leg cages.
Forces on Net PensTwo approaches are used in design of floating structures: rigid design to oppose envi-
ronmental forces and flexible structures to absorb these forces. Design of an individualnet pen for in-shore deployment does not represent a major engineering undertaking; itis the grouping of pens into a combined unit that causes problems, principally with thepen-to-pen linkages and the mooring systems needed in high sea conditions.
Design of large, floating, moored, ocean-based systems is a formidable challenge.Detailed engineering design of these ocean cage systems is beyond the scope of thischapter. The interest in deep-water, off-shore aquaculture has resulted in several interna-tional conferences on the engineering of systems for these conditions, and the reader isreferred to the proceedings of these conferences for in-depth information on the topic.1
Engineers involved in net-pen design seem to agree that net pens are not being over-designed. Moving pens further off-shore increases the stresses greatly because of greatwave heights. Fatigue failures because of cyclic loading over a long period and theoccurrence of peak storm conditions are factors that may be underestimated. Ideally,
1Conference on Engineering for Offshore Fish Farming. Thomas Telford Press, London, England, 1990.National Science Foundation Engineering Research Needs for Offshore Mariculture Systems Workshop. Uni-versity of Hawaii, Honolulu, 1991.Conference on Open-Ocean Aquaculture. University of Maine/University of New Hampshire Sea Grant,Portland, Maine, 1996.Second International Conference on Open Ocean Aquaculture. University of Hawaii Sea Grant Program, Maui,Hawaii, 1997.

Net Pens 269
long-term data on environmental conditions should be obtained. Barker [40] suggestsusing 100-year conditions in design, but if good environmental data for a particular siteis available, then 50-year conditions can be sufficient. To avoid joining of front and backwalls of a net, the depth-to-width ratio should not be much above 1. Use of large weightor other stretching systems can also maintain the shape of a net pen; however, they willexert considerable forces on the net.
Mooring DesignDesign of mooring requires the accurate prediction of the forces acting on these
floating structures. Forces acting on the fish cages are generated from three sources: wind,current, and waves. For a conservative design, it should be assumed that the maximumvalues of force due to each of these components act simultaneously. In addition, itis prudent to assume that all of these components may act in the same direction. Thisassumption simplifies the analysis, and although it may yield a very conservative estimateof the forces on the fish pen, it is not necessarily economically extravagant because themooring system is a relatively inexpensive part of the total production system.
Riley and Mannuzza [41] describe an analytical method for calculating these forces.Wind forces act only on the portion of the structure above the water surface and maybe determined as a function of maximum wind velocity, the characteristic area of thesuperstructure, and a form factor based on the shape of the structural members. Currentand waves work together to exert a significant force on the portion of the structure belowthe water surface. This part of the structure is composed mostly of the nets used to retainthe fish and the predator barriers. The frictional resistance of the water on the base of thesuperstructure is small in comparison to the drag forces on nets and may be neglected.It is assumed that the nets hang vertically from the superstructure and the current isperfectly horizontal.
As a body of water experiences the passage of a wave, the individual fluid parti-cles travel in orbital paths at the rate of one revolution per wave period. For conditionscommonly encountered in aquaculture, these orbital paths are generally circular. Thediameters of these circular paths decrease with increase in depth. The horizontal compo-nent of velocity may be calculated as a function of wave height, period and length, andwater depth. In the presence of a current the total velocity of the water is approximated byadding current velocity to wave velocity. Forces on the netting may then be computed asa function of absolute water velocity, characteristic area of the net, and drag coefficientfor the net. Drag coefficients for various types and sizes of net have been calculated(Milne [42]) together with the effect of fouling on these numbers.
With the forces on all submerged sides of the net added to the wind force on thesuperstructure, a reasonable conservative figure for total horizontal force on the sys-tem is obtained. This information represents a beginning point in determining the sizeand number of moorings required to immobilize the structure. Different mooring andanchor shapes and sizes have different holding characteristics, some of which are welldocumented for the various bottom conditions likely to be encountered at the site inquestion, such as mud, silt, gravel, and rock. Local fishermen are undoubtedly the bestconsultants as to how a particular type of mooring will hold at a particular site.
270 Facilities Design
The existing methods for calculating forces on net pens owing to wind, current, andwaves, including that developed by Riley and Mannuzza [41], consider the net pen as asingle isolated unit. In real-world situations, however, this is rarely the case. It is necessaryto develop the analysis further to calculate forces on groups of net pens, evaluating theshielding effect on current forces of downstream net pens. Aarsnes, Rudi, and Loland [43]have developed prediction equations for this shielding effect. Current velocity is reduced50% to 80% in the downstream pens, so that in a long line of pens parallel to the currentdirection, water exchange may be greatly reduced in the pens furthest downstream.Fouling of the nets will exacerbate this problem and can have a significant impact onfish health and growth rate by reducing available oxygen and affecting waste removal.
Operational AspectsFeeding
Many net pen operations still rely upon hand feeding; others have gone to timed feed-ing systems or demand feeders; and some operators use a combination of both. Computer-controlled pneumatic feeding from a central location is now in use on some of the largerfarms. Ideally, fish are fed to satiation, which requires great skill in observing feedingbehavior. Some commercial systems employ feed wastage monitoring devices at the bot-toms of the net pens to assist in feeding management. Feed represents approximately 40%of total production costs for net-pen salmon operations and requires careful management.
Net CleaningFouling of nets by silt, marine animals, and a wide variety of marine algae can result in
flow restriction to the captive fish. In addition, the stresses on the nets and superstructureare increased, both from the increase in weight and greater horizontal current-inducedforces. Net pens should be cleaned regularly at least once per year, and more often ifpossible. Cleaning is done by divers equipped with brushes and scrapers and by surfacepersonnel if the net can be partially raised from the water. Under the worst conditionsthere is a need for complete removal of the net from the structure, transport to shore,and thorough cleaning by pressurized sprays and rotary net washers. In a stocked pen, anewly cleaned net pen is carefully put in place, and then the fouled one carefully removed.Control of fouling by use of companion species in the net pen, such as winkles, crabs,and flatfish, has been tried but without any great success.
Removal of Dead FishFish that die in the net pens, for whatever reason, need to be removed as soon as
possible. Many fish farmers hire divers to do this “mort” removal, but some systemsutilize mechanical retrieval, either with an airlift pump inside the pen or a collectiondevice in the center of the net bottom panel emptied from outside the pen.
11.4.3 Net-Pen Summary
Net-pen technology is constantly changing; this development is driven by the needto reduce capital and operating costs and the move to less-sheltered off-shore sites withharsher environmental conditions. Well-designed, large floating collar net pens havebeen tested in production situations in off-shore locations in Europe and Australia andare proving to be reliable and cost effective. If present trends continue we will see larger

Tanks 271
and larger net-pen systems, moving further off-shore; greater automation and computercontrol of feeding, stock assessment, and inspection using underwater video cameras andimage analysis; and mechanization of mort removal, net cleaning and other necessaryoperations.
11.5 Tanks
11.5.1 Biomass Loading
A key aspect to economical productivity for recirculating systems is to maintain thesystem biomass as near as possible to the biomass carrying capacity of the system.Flow requirements can use the same calculation techniques as presented in Section 11.3Raceways to determine flow rates through the tank for oxygen and ammonia control; seeEqs. 11.2 and 11.3.
Continuous biomass loading is a technique that carries a mixture of fish sizes withinthe same tank and removes fish by selectively sorting entire tank populations. Smallfish replace the number of fish removed, with adjustments in stocking numbers madeto account for expected mortality losses. The obvious advantage is that a tank receivesapproximately the same amount of fish feed on a continuous basis, which maximizesthe potential output from a fixed physical resource. From an operational perspective,such a system is easier to manage because the water quality demands also remain fixed,increasing reliability and robustness of the system. A primary disadvantage is increasedsorting requirements, potentially causing additional stress and possible fish-behavioralproblems. This technique has been employed successfully for trout [44, 45]. CornellUniversity has employed this technique successfully, maintaining tilapia biomass densi-ties exceeding 200 kg/m3; in the Cornell system, a minimum size fish for mixed rearingwas 90 g at tank introduction. Continuous biomass loading is similar in principle toraising fish in a series of stages within each of which the fish biomass is increased to themaximum biomass carrying capacity at each independent stage. McNown and Seireg[46] found that fish production costs were reduced by 30% to 40% when the number ofstages was increased from one to eight, with the largest reductions being obtained overthe first three stage additions.
11.5.2 Labor Requirements
Ley et al. [47] reported a range of labor requirements from 0.5 to 2 man-hours perday to manage a single 4.2-m (12-ft) diameter tank of trout; similar time requirementsexisted to manage a 2.7-m (9-ft) diameter tank. In general, it can be assumed that time-management requirements are independent of tank size. In effect, it is the number of tanksand not the size of tanks that is important in determining management hours required.Current experience suggests that a series of tanks can be managed averaging 20 minper day per tank; labor includes daily water chemistry measurements, fish feeding, filtermaintenance, and tank cleaning. A weekly maintenance of two to three additional man-hours per tank system for major cleaning activities and preventative maintenance isalso necessary. Assuming a 40-hour work week, this suggests one person could manageeight tank systems. Because many operations on a farm require two people, a facility
272 Facilities Design
should be designed assuming two full-time employees/owners. Hourly or contract laborcan be employed for special tasks, such as harvesting, hauling, processing. This thendefines the size of a basic production unit as a 16-tank system. Some adjustments inlabor requirements might be allowed depending upon the tank size. Round tanks areassumed because of their self-cleaning attributes and uniform water quality. Losordoand Westerman [6] assigned 8 hours per day to manage an eight-tank growout facilitywith a three-tank nursery.
11.5.3 Tank Shapes and Sizes
Tanks are designed in a variety of shapes and sizes. Normally, they are designedwith the objective of achieving uniformity of water recirculation within the entire tankwater column. Design of the inlet and outlet structures has the major impact on water-flow uniformity. Tank geometry and tank diameter-to-depth ratios also impact water-recirculation uniformity. With uniform conditions in the tank, fish will also occupy allportions of the tank water column, maximizing efficient use of the rearing space. Designof the inlet and outlet structure is also the primary factor controlling settleable solids andalgae removal from tank culture systems.
The first basic principle of tank design is the flushing rate of the tank based upon theintroduction of new water. Mathematically, the water-exchange rate can be expressed asfollows:
F(%)= (1− e−t/th) ∗100 (11.15)
where
F = water exchange rate in percentth = theoretical holding time (time necessary to fill one tank volume
with a given water flow)t = time.
Inserting numbers into Eq. (11.15) shows that by adding a water amount equal to thetank volume during a given timet (t = th), 63.2% of the old water volume in the tank isexchanged with new water provided that water mixing is uniform.
Self-CleaningSelf-cleaning is one of the most important attributes of any tank design in order to
minimize the potential for large labor requirements for manual cleaning. With properdesign of both the inlet and outlet structures, two flows will be created within the tank.Figure 11.12 shows these two flow patterns, with a primary flow to ensure good waterdistribution of the inlet water throughout the tank and a secondary flow that ensurescleaning of the walls and floor of the tank. Experiments have shown that effective floorcleaning requires a bottom velocity of at least 6 to 8 cm/s [48]. Such floor velocities aregenerally created if the water velocities in the tank are between 12 and 15 cm/s. Highfish densities promote self cleaning of the floor by resuspending settled solids so that thesecondary flow pattern within the tank moves solids to a center drain.
Attention by the culturist should be given to measuring water velocities within thewater column. A small propeller type velometer can be used and placed at different
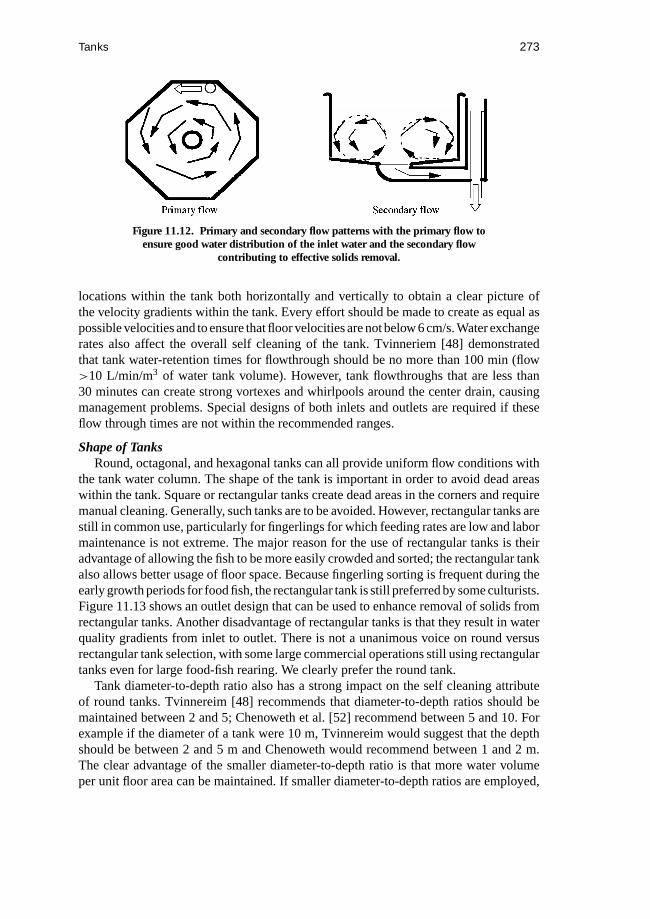
Tanks 273
Figure 11.12. Primary and secondary flow patterns with the primary flow toensure good water distribution of the inlet water and the secondary flow
contributing to effective solids removal.
locations within the tank both horizontally and vertically to obtain a clear picture ofthe velocity gradients within the tank. Every effort should be made to create as equal aspossible velocities and to ensure that floor velocities are not below 6 cm/s. Water exchangerates also affect the overall self cleaning of the tank. Tvinneriem [48] demonstratedthat tank water-retention times for flowthrough should be no more than 100 min (flow>10 L/min/m3 of water tank volume). However, tank flowthroughs that are less than30 minutes can create strong vortexes and whirlpools around the center drain, causingmanagement problems. Special designs of both inlets and outlets are required if theseflow through times are not within the recommended ranges.
Shape of TanksRound, octagonal, and hexagonal tanks can all provide uniform flow conditions with
the tank water column. The shape of the tank is important in order to avoid dead areaswithin the tank. Square or rectangular tanks create dead areas in the corners and requiremanual cleaning. Generally, such tanks are to be avoided. However, rectangular tanks arestill in common use, particularly for fingerlings for which feeding rates are low and labormaintenance is not extreme. The major reason for the use of rectangular tanks is theiradvantage of allowing the fish to be more easily crowded and sorted; the rectangular tankalso allows better usage of floor space. Because fingerling sorting is frequent during theearly growth periods for food fish, the rectangular tank is still preferred by some culturists.Figure 11.13 shows an outlet design that can be used to enhance removal of solids fromrectangular tanks. Another disadvantage of rectangular tanks is that they result in waterquality gradients from inlet to outlet. There is not a unanimous voice on round versusrectangular tank selection, with some large commercial operations still using rectangulartanks even for large food-fish rearing. We clearly prefer the round tank.
Tank diameter-to-depth ratio also has a strong impact on the self cleaning attributeof round tanks. Tvinnereim [48] recommends that diameter-to-depth ratios should bemaintained between 2 and 5; Chenoweth et al. [52] recommend between 5 and 10. Forexample if the diameter of a tank were 10 m, Tvinnereim would suggest that the depthshould be between 2 and 5 m and Chenoweth would recommend between 1 and 2 m.The clear advantage of the smaller diameter-to-depth ratio is that more water volumeper unit floor area can be maintained. If smaller diameter-to-depth ratios are employed,
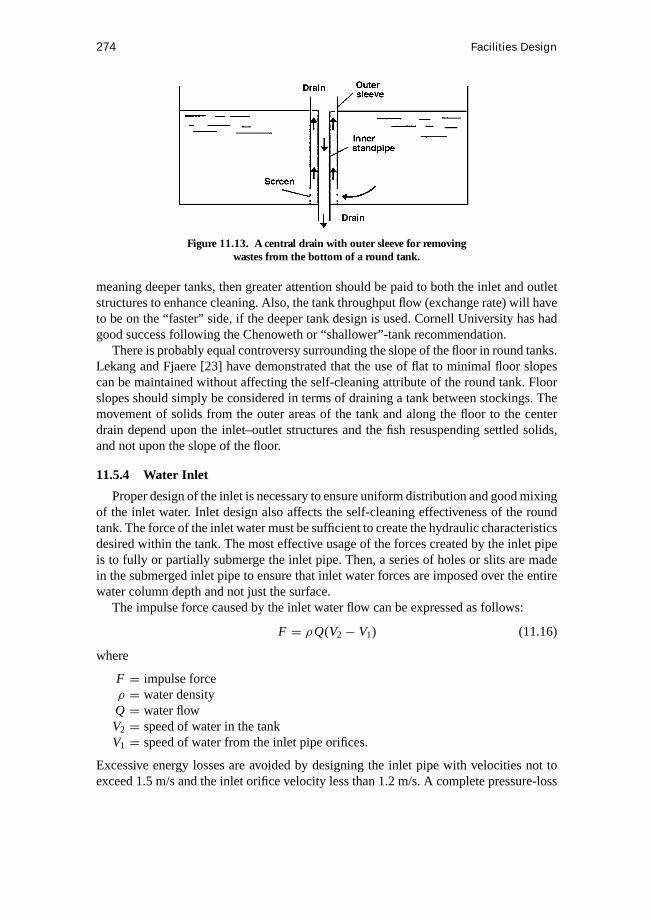
274 Facilities Design
Figure 11.13. A central drain with outer sleeve for removingwastes from the bottom of a round tank.
meaning deeper tanks, then greater attention should be paid to both the inlet and outletstructures to enhance cleaning. Also, the tank throughput flow (exchange rate) will haveto be on the “faster” side, if the deeper tank design is used. Cornell University has hadgood success following the Chenoweth or “shallower”-tank recommendation.
There is probably equal controversy surrounding the slope of the floor in round tanks.Lekang and Fjaere [23] have demonstrated that the use of flat to minimal floor slopescan be maintained without affecting the self-cleaning attribute of the round tank. Floorslopes should simply be considered in terms of draining a tank between stockings. Themovement of solids from the outer areas of the tank and along the floor to the centerdrain depend upon the inlet–outlet structures and the fish resuspending settled solids,and not upon the slope of the floor.
11.5.4 Water Inlet
Proper design of the inlet is necessary to ensure uniform distribution and good mixingof the inlet water. Inlet design also affects the self-cleaning effectiveness of the roundtank. The force of the inlet water must be sufficient to create the hydraulic characteristicsdesired within the tank. The most effective usage of the forces created by the inlet pipeis to fully or partially submerge the inlet pipe. Then, a series of holes or slits are madein the submerged inlet pipe to ensure that inlet water forces are imposed over the entirewater column depth and not just the surface.
The impulse force caused by the inlet water flow can be expressed as follows:
F = ρQ(V2− V1) (11.16)
where
F = impulse forceρ = water densityQ = water flowV2 = speed of water in the tankV1 = speed of water from the inlet pipe orifices.
Excessive energy losses are avoided by designing the inlet pipe with velocities not toexceed 1.5 m/s and the inlet orifice velocity less than 1.2 m/s. A complete pressure-loss

Tanks 275
Figure 11.14. Various inlet pipe arrangements.
analysis should be performed on all the pipe systems supplying the tank to ensure properflow delivery and to properly match the pump system with the water-delivery system.
The inlet pipe system can be arranged in several ways (Fig. 11.14). A horizontal-spray inlet pipe has an advantage of creating an effective water-distribution entry, but thesecondary flow is generally weak. The vertical submerged inlet pipe creates both effectiveprimary and secondary flows. A combined vertical and horizontal inlet arrangement isalso possible and is recommended if possible (Fig. 11.14). Normally, the vertical inlet isplaced near the tank wall about a fish’s width away. However, as the tank diameter-to-depth ratio reduces (deeper tanks), the submerged inlet can be moved farther away fromthe outer tank wall towards the center drain. Compared with the current speed from theinlet orifices, the current speed in the tank should be targeted towards 0.15 to 0.25 cm/s[48]. Of course, the higher the tank current speed, the higher the floor velocities andimproved solids removal. Care should be taken, however, not to overexercise the fish.Refer to a previous section for swimming speed allowances.
11.5.5 Water Outlet
The outlet function is to remove settled waste from the tank water column and tomaintain water-column levels within the tank. The outlet design also affects the efficiencyof the removal of settled solids. An undersized outlet or improper design can requirehigher water-column elevations to achieve a balance between inlet and outlet flow. Arestricted outlet will result in a tank overflowing and losing water and possibly fish.Velocity in the outlet pipe will affect the sedimentation rate of settleable solids in theoutlet flow. Properly designed, the outlet pipe will collect minimal solids and ideallynone. This can be checked quite easily by removing the outside standpipe that controlsthe water level in the tank. Removing this standpipe will result in a large increase in flowwhich should result in any settled solids being flushed, which can be easily observed.If solids flushing is observed in this case, then either the outlet pipe must be redesigned(made smaller) or flushing of the outlet pipe as part of a daily maintenance schedule (ormore often) must be implemented. Retention of solids in the outlet pipe contributes toan overall degradation in water quality for the tank and therefore should be avoided ifpossible. The outlet pipe should be sized to create a velocity of at least 0.3 m/s but lessthan 1.5 m/s, which can result in break-up of solids, making their removal more difficult.
Various outlet-structure arrangements are shown in Fig. 11.15. The most typicalarrangement is the flat outlet pot in the tank with a screen covering the pot to preventfish escaping. The outlet pot connects to an outlet pipe to a standpipe where the waterlevel in the tank is controlled. It is important to increase the speed through the holes of
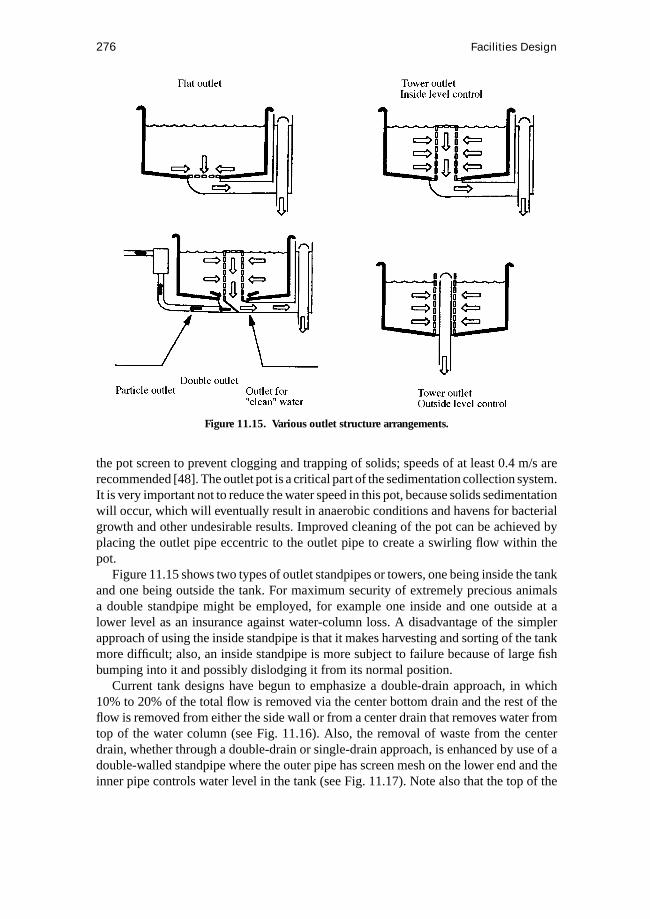
276 Facilities Design
Figure 11.15. Various outlet structure arrangements.
the pot screen to prevent clogging and trapping of solids; speeds of at least 0.4 m/s arerecommended [48]. The outlet pot is a critical part of the sedimentation collection system.It is very important not to reduce the water speed in this pot, because solids sedimentationwill occur, which will eventually result in anaerobic conditions and havens for bacterialgrowth and other undesirable results. Improved cleaning of the pot can be achieved byplacing the outlet pipe eccentric to the outlet pipe to create a swirling flow within thepot.
Figure 11.15 shows two types of outlet standpipes or towers, one being inside the tankand one being outside the tank. For maximum security of extremely precious animalsa double standpipe might be employed, for example one inside and one outside at alower level as an insurance against water-column loss. A disadvantage of the simplerapproach of using the inside standpipe is that it makes harvesting and sorting of the tankmore difficult; also, an inside standpipe is more subject to failure because of large fishbumping into it and possibly dislodging it from its normal position.
Current tank designs have begun to emphasize a double-drain approach, in which10% to 20% of the total flow is removed via the center bottom drain and the rest of theflow is removed from either the side wall or from a center drain that removes water fromtop of the water column (see Fig. 11.16). Also, the removal of waste from the centerdrain, whether through a double-drain or single-drain approach, is enhanced by use of adouble-walled standpipe where the outer pipe has screen mesh on the lower end and theinner pipe controls water level in the tank (see Fig. 11.17). Note also that the top of the

Tanks 277
Figure 11.16. Double drain approach for enhancing solids removal while reducing tank effluentfor solids removal to 10 to 20% of total flow.
(a)
(b)
Figure 11.17. Dam boards for drawing fish wastes frombottom of raceway.

278 Facilities Design
outer pipe is below the lip of the tank walls so that if the screen plugs, water overflowsinto the center drain pipe, instead of onto the floor. Screening should also be placedover the top of the outer standpipe to prevent fish jumping into the center pipe area andplugging the exit flow; this can and will happen if not prevented.
References
1. Sedgwick, S. D. 1985.Trout Farming Handbook, 4th ed. Fishing News Books,Farnham, Surrey, 160 pp.
2. Stevenson, J. P. 1987.Trout Farming Manual, 2nd ed. Fishing News Books,Farnham, Surrey, 259 pp.
3. Shepherd, C. J. and N. R. Bromage. 1988.Intensive Fish Farming. BSP ProfessionalBooks, Oxford, 404 pp.
4. Easley, J. E., Jr. 1977. Response of costs and returns to alternative feed prices andconversion in aquaculture systems.Mar. Fish. Rev.39(5):15–17.
5. Keenum, M. E. and J. E. Waldrop. 1988. Economic analysis of farm-raised cat-fish production in Mississippi. Technical Bulletin 155, Mississippi Agricultural andForestry Experiment Station, Mississippi State, MS 39762.
6. Losordo, T. M. and P. W. Westerman. 1994. An analysis of biological, economic, andengineering factors affecting the cost of fish production in recirculating aquaculturesystems.Journal of the World Aquaculture Society25:193–203.
7. Nash, C. E. 1988. A global overview of aquaculture production.Journal of the WorldAquaculture Society19(2).
8. Shelf, G. and C. J. Soeder (eds.). 1980.Algae Biomass. Elsevier Press, New York.9. Stumm, W. and J. J. Morgan. 1981. Aquatic Chemistry. John Wiley and Sons, New
York.10. Smith, D. W. 1985. Biological control of excessive phytoplankton growth and
the enhancement of aquaculture production.Can J. Fish Aquat. Science42:1940–1945.
11. Drapcho, C. M. and D. E. Brune. 1989. Design of a partitional Aquaculture System.ASAE paper 89-7527. American Society of Agricultural Engineers, St. Joseph, MI.
12. Boyd, C. E. 1979.Water Quality in Warm-Water Fish Ponds. Auburn University,Auburn, AL.
13. Tucker, C. S. (ed.). 1985.Channel Catfish Culture. Elsevier Press, New York.14. Piper, R. G., I. B. McElwain, L. E. Orme, J. P. McCraren, L. G. Fowler, and J. R.
Leonard. 1982. Fish Hatchery Management. U.S. Department of the Interior, Fishand Wildlife Service, Washington, DC.
15. Westers, H. 1991. Modes of operation and design relative to carrying capacities offlow-through systems. In:Proceedings: Engineering Aspects of Intensive Aquacul-ture, April 4–6. Cornell University, Ithaca, NY.
16. Poston, H. A. 1983. Effect of population density of lake trout in cylindrical jars ongrowth and oxygen consumption.Progressive Fish-Culturist45(1):8–13.
17. Meade, J. W. 1991. Intensity of aquaculture production: definitions, meanings, andmeasures. In:Proceedings: Engineering Aspects of Intensive Aquaculture, April4–6. Cornell University, Ithaca, NY.

References 279
18. Willoughby, H. 1969. A method for calculating carrying capacities of hatcherytroughs and ponds.Progressive Fish-Culturist30:173–174.
19. Austreng, E., T. Storbakken, and T. Asgaard. 1987. Growth rate estimate of culturedAtlantic salmon and rainbow trout.Aquaculture60:157–160.
20. Jobling, M., E. H. Jorgensen, A. M. Arnesen, and E. Ringo. 1993. Feeding, growthand environmental requirements of arctic charr: a review of the aquaculture potential.Aquaculture International1:20–46.
21. Haskell, D. C. 1959. Trout growth in hatcheries. New York Fish and Game Journal6(2):204–237.
22. Leitritz, E. 1959. Trout and salmon culture. California Department of Fish and GameFish Bulletin no. 107.
23. Lekang, O. I. and S. O. Fjaera. 1997.Technology for Aquaculture[in Norwegian].Landbruksforlaget, Oslo, Norway.
24. Christiansen, J. S., M. Jobling, and E. H. Jorgensen. 1990. Oxygen and water re-quirements of salmonids [in Norwegian].Norsk Fiskeoppdrett10:28–29.
25. Wheaton, F. W. 1977.Aquacultural Engineering. John Wiley and Sons, New York.26. Schwab, G. O., R. K. Frevert, T. W. Edminster, and K. K. Barnes. 1966.Soil and
Water Conservation Engineering. (2nd ed.). John Wiley and Sons, New York.27. Chen, S. 1991. Theoretical and experimental investigation of foam separation ap-
plied to aquaculture. Ph.D. thesis, Cornell University, Ithaca, NY.28. Ketola, G. 1991. Personal communication (unpublished data). Research Scientist,
U.S. Fish and Wildlife Service, Cortland, NY.29. Beamish, F. W. H. 1978. Swimming capacity. In: W. S. Hoar and D. J. Randall (eds.),
Fish Physiology, vol. 7. New York, Academic Press, pp. 101–187.30. Beveridge, M. 1987.Cage Aquaculture. Fishing News Books Ltd. Farnham, Eng-
land.31. Edwards, D. J. 1978.Salmon and Trout Farming in Norway. Fishing News Books
Limited, Farnham, Surrey, England.32. Gowne, R. J. and A. Edwards. 1990. Interaction between physical and biological
processes in coastal and offshore fish farming: an overview. In:Proceedings of theConference on Engineering for Offshore Fish Farming. Thomas Telford, London.
33. Kennedy, W. A. 1978. Handbook of Rearing Pan-Sized Pacific Salmon Using Float-ing Sea-Pens. Canadian Fisheries and Marine Science Report no. 107.
34. Rudi, H. and E. Dragesund. 1993. Localization strategies. In: Reinertsen et al. (eds.),Fish Farming Technology. A. A. Balkema, Rotterdam.
35. Washington Department of Fisheries. 1990. Fish Culture in Floating Net-Pens. FinalProgrammatic Environmental Impact Statement. Olympia, WA.
36. Findlay, R. and L. Watling. 1990. Effects of salmon net pen aquaculture on mi-crobenthic and macrobenthic communities. Maine Aquaculture Innovation CenterReport no. 90-6. Bower, Maine.
37. Bayer, R. and R. Hamill. 1990. A study of fishpen aquaculture and the local lobsterharvest. Maine Aquaculture Innovation Center Report.
38. Guldberg, B., A. Kittelsen, M. Rye, and T. Asgard. 1993. Improved salmon pro-duction in large cage systems. In Reinertsen et al. (eds.),Fish Farming Technology.A. A. Balkema, Rotterdam.

280 Facilities Design
39. Karlsen, L. 1993. Development in salmon aquaculture technology. In: K. Heen,R. L. Monhan, and F. Utter (eds.),Salmon Aquaculture. Fishing News Books,Oxford.
40. Barker, C. J. 1990. Classification society rules for fish farms.Proceedings of theConference on Engineering for Offshore Fish Farming. London: Thomas Telford.
41. Riley, J. and M. Mannuzza. 1989. Hydrodynamic Forces on Floating Fish Cages.Paper no. 89-7558. American Society of Agricultural Engineers, St. Joseph, MI.
42. Milne, P. H. 1967. Interim report of water forces on fish netting. Department of CivilEngineering, Univ. Strathclyde, Glasgow. 8 pp.
43. Aarsnes, J. V., H. Rudi, and G. Loland. 1990. Current forces on cages and netdeflection. In:Proceedings of the Conference on Engineering for Offshore FishFarming. Thomas Telford, London.
44. Summerfelt, S. T., J. A. Hankins, S. R. Summerfelt, and J. M. Heinen. 1993. Model-ing continuous culture with periodic stocking and selective harvesting to measure theeffect on productivity and biomass capacity of fish culture systems. In:Techniquesfor Modern Aquaculture, Proceedings of an Aquacultural Engineering Conference,June 21–23, 1993. ASAE Publication 02-93. American Society of Agricultural En-gineers, St. Joseph, MI.
45. Hickling, C. F. 1960.The Malacca Tilapia hybrids. J. Genet. 57:1–10.46. McNown, W., and Seireg, A. 1983. Computer aided optimum design and control of
staged aquaculture systems.J. World Aquaculture14:417–433.47. Ley, D. R., M. B. Timmons, and W. D. Youngs. 1993. The Northern Fresh Fish
Cooperative. Bulletin 465. Department of Agricultural and Biological Engineering,Cornell University, Ithaca, NY.
48. Tvinnereim, K. 1994. Hydraulic Shaping of Tanks for Aquaculture [in Norwegian].SINTEF Report STF60 A94046, Trondheim, Norway.
49. Lawson, T. B. 1995.Fundamentals of Aquacultural Engineering. Chapman and Hall.50. Maine Aquaculture Innovation Center. 1990. Development of a Benthic Threshold
Environmental Impact Model for Net-pen Salmon Culture Mutually Beneficial toAquaculture. National Marine Fisheries Service.
51. Speece, R. E. 1973. Trout metabolism characteristics and the rational design of nitri-fication facilities for water reuse in hatcheries. Trans. Am. Fish. Soc. 102:323–334.
52. Chenoweth, H. H., J. D. Larmoyevx, and R. G. Piper, 1973. Evaluation of circulartanks for salmonid production.Prog. Fish-cult. 35, 122–131.

12 Equipment andControls
J. Hochheimer
12.1 Feeding Equipment
Feeding is usually the largest operational cost of growing fish in aquaculture. Thefeed can represent greater than 50% of the variable costs in growing fish. Labor andfeeding equipment must also be considered as contributors to the total cost of feedingthe aquacultural crop. Delivering the feed to fish at the right time, in the correct form, andin the right amount is necessary for optimal growth. The choice of feeding equipmentdepends on factors such as type and life stage of fish, type and size of feed, size of theoperation, available labor, and the type of culture system. Therefore, a careful analysisof these factors is essential for successful and profitable fish culture.
Feeding regimes in aquaculture can be classified in one of the following three cate-gories [1]:
1. Natural food produced in the growing system: Growing larval stages of many car-nivorous fish (for example striped bass) to a size that will accept a formulated diet ismost successfully done in ponds in which the fish are presented with natural food.See Geiger and Turner [2] for a more in-depth discussion of pond managementtechniques for producing live foods. When fish reach the fingerling size (about2.5 cm), they are trained to feed on a formulated diet for grow-out. If omnivores orherbivores are cultured, the plankton bloom in a pond is manipulated with fertilizeradditions similarly to that for carnivores. However, this bloom is continued as thefish grow to provide food for the larger fish.
2. A combination of natural and formulated food: In some extensive or semiextensivesystems, fish are allowed to graze on natural foods available in the water and arealso fed formulated feed to supplement their diet.
3. All formulated food: Fish in intensive systems are fed their complete nutritionalrequirements in a formulated diet that has been found to meet desired growthrequirements.
Proper nutrition is not only a function of feed composition—the fish will not grow un-less they get and consume the feed [3]. For manycultured species, dry, pelleted formulateddiets have been developed to meet total or supplemental dietary requirements. There aresome special cases in which feeds other than natural or formulated dry diets are used, butthese are beyond the scope of this review. This section focuses on the delivery of dry diets.
281

282 Equipment and Controls
Specific feeding-rate requirements depend on the size of fish being cultured and watertemperatures. For example, feeding rates vary from 7% to 10% of body weight for firstfeedings of fry to 1% to 6% for fingerlings and larger fish [4]. However, both under-feeding and overfeeding are common in aquaculture, and care must be taken to feed theproper amount. Overfeeding wastes feed and degrades water quality; underfeeding leadsto lost production.
Particle size is another important factor in feeding. Smaller fish require smaller feedparticles, whereas larger fish generally require larger particle sizes. Dry feeds are com-mercially available in particle sizes ranging from less than 200µm for larval fish to 1 cmor larger for bigger fish. These particles can also be made to sink or float, depending onthe pelleting process used. Often floating diets are preferred by culturists so that theycan observe feeding behaviors, but the choice of floating versus sinking pellets shouldbe made with feeding preferences of the fish in mind.
Feeding frequency also depends on life stage and temperature. Larval fish generally re-quire many feedings per day so that they can be trained to accept the dry diet. Additionally,larval fish have smaller gastrointestinal tracts and require frequent feedings to maintainsatiation. Failure to feed frequently enough in the larval stages typically results in canni-balism, poor growth, and low survival rates. As fish grow, the frequency of feeding can bereduced, with the subsequent frequencies determined by species-specific requirements.
The feeding frequency also affects the operation of some aquacultural systems, es-pecially the more intensive ones. Oxygen requirements may become critically high inhighly intensified systems that are fed only once or twice per day. Around feeding timeand up to several hours after, activity and metabolic rates increase dramatically, whichleads to increased oxygen consumption. If the total biomass in a system is near thesystem carrying capacity, oxygen levels can sag below critical levels and stress the fish.Ammonia production may also become a critical factor if large, infrequent feedings areoffered, especially in recirculating systems.
There are three groups of feeders and feeding methods—hand, automatic, and de-mand—used to deliver formulated diets. The type of feeding system depends on thelife stage of fish being cultured, size of operation, type of diet, available resources, andpersonal preferences. Because larval and smaller fish require frequent feedings, they areoften fed with automated feeders that can be set to feed throughout the day at regularintervals (Fig. 12.1). Smaller aquacultural operations may have sufficient labor to feedall stocks by hand. Most larger operations feed so much feed that hand feeding becomesa materials-handling problem unless larger, automated equipment is used. Often larger-scale fish farmers use demand or automatic feeders for feeding about 70% to 80% of thedaily ration and then hand feed the remaining ration. This allows for the farmer to observedaily feeding patterns and to feed close to satiation [5]. Regardless of which method isused to facilitate feeding, the operator must periodically check for feeding effectivenessby sampling and weighing fish, calculating feed-conversion ratios, and adjusting feedingrates to reflect newly estimated biomass determinations.
When feeding ponds, distributing the feeds to as much of the pond surface as possibleenables more fish to get the feed. For shrimp, feeding as much of the entire pond aspossible is essential because the shrimp are less mobile and may not get to the feed.Under windy conditions, or if using floating pellets, feed on at least two sides with the

Feeding Equipment 283
Figure 12.1. Automatic feeder (right) and electronic controller(upper left) for feeding small fish.
wind blowing away from shore. Some fish farmers use a feeding ring, especially forfloating feeds, to keep the feed concentrated in one spot. When feeding a cage or netpen, a feed ring keeps floating feeds inside of the structure, thus available only for thecultured fish and not “wild” fish that may congregate around the structure.
12.1.1 Hand Feeding
Manual or hand feeding can be used in all types of aquacultural systems—cage,net, pond, flowthrough, and recirculating—and is often the method of choice for smallsystems [6]. Hand feeding can reduce capital expenditures for equipment, providedsufficient labor is available to perform the feeding duties. There are other advantages tohand feeding. The fish can be observed at each feeding for feeding behavior to determineif they are actively eating all of the food presented to them. Floating pellets or foodplatforms (flat-surface mounted about 30 cm below the surface) make observationseasier. Fish can only be routinely fed to satiation by hand feeding and observation ofthe feeding behaviors. Observing the fish during feeding can also be critical in the earlydetermination of disease or parasite problems.
An adaption of hand feeding is a mechanical blower system (Fig. 12.2) used in feedinglarger systems, especially ponds and raceways. Feed is loaded into a hopper fixed on topof a blower. When the operator desires to feed, the feed pellets are allowed to drop intothe path of the exhausting air stream and are blown out to the desired target. Mechanicalblowers and hoppers are fixed to an axle and pulled around ponds or along raceways bya tractor. The power for the blower can be from either power take-off of the tractor or a
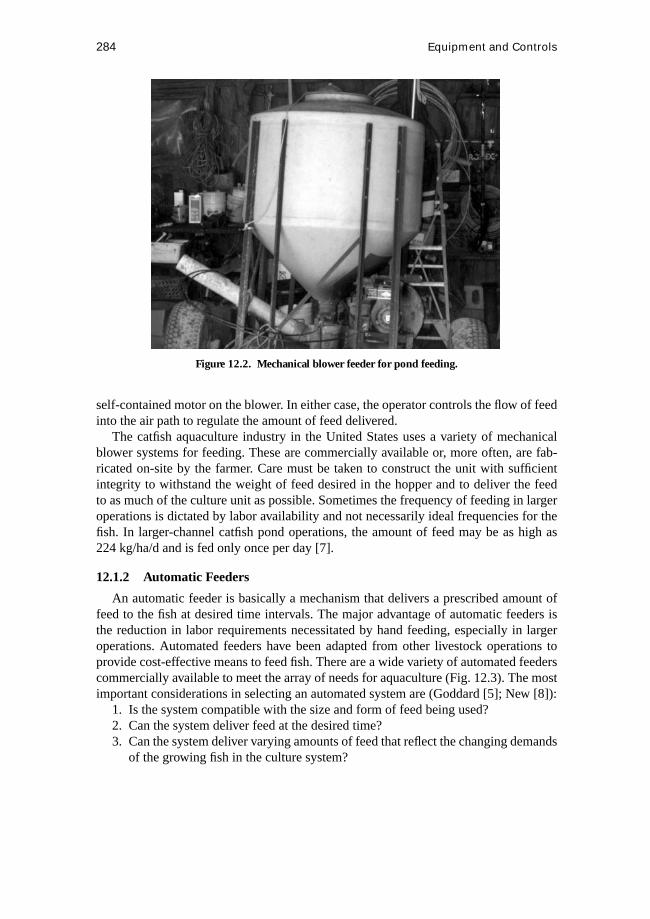
284 Equipment and Controls
Figure 12.2. Mechanical blower feeder for pond feeding.
self-contained motor on the blower. In either case, the operator controls the flow of feedinto the air path to regulate the amount of feed delivered.
The catfish aquaculture industry in the United States uses a variety of mechanicalblower systems for feeding. These are commercially available or, more often, are fab-ricated on-site by the farmer. Care must be taken to construct the unit with sufficientintegrity to withstand the weight of feed desired in the hopper and to deliver the feedto as much of the culture unit as possible. Sometimes the frequency of feeding in largeroperations is dictated by labor availability and not necessarily ideal frequencies for thefish. In larger-channel catfish pond operations, the amount of feed may be as high as224 kg/ha/d and is fed only once per day [7].
12.1.2 Automatic Feeders
An automatic feeder is basically a mechanism that delivers a prescribed amount offeed to the fish at desired time intervals. The major advantage of automatic feeders isthe reduction in labor requirements necessitated by hand feeding, especially in largeroperations. Automated feeders have been adapted from other livestock operations toprovide cost-effective means to feed fish. There are a wide variety of automated feederscommercially available to meet the array of needs for aquaculture (Fig. 12.3). The mostimportant considerations in selecting an automated system are (Goddard [5]; New [8]):
1. Is the system compatible with the size and form of feed being used?2. Can the system deliver feed at the desired time?3. Can the system deliver varying amounts of feed that reflect the changing demands
of the growing fish in the culture system?

Feeding Equipment 285
Figure 12.3. Examples of automatic feeders—from left, demand feeder, vibratingfeeder, belt feeder.
4. Does the system protect the feed from degradation and spoilage due to rain, ex-cessive heat, and moisture?
5. Are the power source, timer, and drive mechanism reliable under adverse environ-mental conditions?
6. Does the delivery system prevent grinding and crushing of pellets?7. Do the capital and operational costs of the system justify the expense over hand
feeding?Automatic feeders can be powered by a variety of means, including mechanical clock
mechanisms, electricity (line-powered or battery-powered), pneumatic, and hydraulic(water-powered). The choice of power source depends on availability and reliability. Inremote areas in which line-powered electricity would be expensive, mechanical clockmechanisms and battery-powered systems may be the appropriate choice. Belt-typefeeders with clock mechanisms as power sources are ideal for feeding continuously.Battery-powered systems can also be fitted with solar panels to maintain battery chargesand increase reliability. Line-powered systems should be the most reliable, given thatincoming power is consistent and that proper back-up power generation is operational.Other systems, with primary power sources such as pneumatic or hydraulic, are not ascommon but can be adapted to certain configurations to provide an economical system.
Some innovative feeders have been reported in the literature that are adapted to remoteor environmentally harsh conditions. For example, Baldwin [9] reported on a novel feederfor minnow production in Hawaii. The automatic feeder used closed compartmentsarranged around a stationary axle and used a weighted float located inside of a slowlydraining reservoir. As the water drains from the reservoir, the weighted float drops andpulls a cable attached to the compartments. As the compartments rotate past a trippingmechanism, a bottom trap door opens and dumps feed into the fish system. Baldwin[9] reports over three of years of operational experience with this device in often harshconditions.

286 Equipment and Controls
One key feature of automatic feeders is some kind of programmable device that allowsthe operator to vary the frequency and amount of feeding. This may be a combination ofelectrical and mechanical components that broadcast feed into the culture system. Somesystems use electrical timers to determine the frequency, which are available from mostaquacultural equipment suppliers (see Fig. 12.1). Examples can also be found in theliterature—see Mortensen and Vahl [10] for an easy-to-construct electronic controller.Other aquaculturists may use some kind of mechanical clock system. Ideally, the settingsfor frequency will allow enough flexibility to meet the needs of the fish. For smaller fish,the frequency may need to be several times per hour, and for larger fish the frequencycould be hourly or longer.
Automatic feeders use some kind of mechanical or pneumatic delivery system topresent feed to the fish. Mechanical systems use vibration, sliding mechanisms, augers,rotating plate, belts, tipping buckets, or controlled orifices to determine the amount anddelivery of feed. Pneumatic systems use compressed air or blowers to broadcast feed tothe fish. There are several systems that use a combination of mechanical and pneumaticdelivery systems.
Vibrating systems use either motor-driven or electromagnetic sources. The simplestform of vibrating system uses a hopper with a plate fixed to the bottom (see Fig. 12.1).An electromagnet is attached to the bottom plate and vibrates at prescribed intervals. Thegap between the plate and hopper sides roughly determines the amount of feed, based onthe duration of vibration. Feed amounts are regulated by increasing the gap and durationof vibration. This type of vibrating system can be small, holding less than 1 kg of feedfor larvae or small fingerlings, or larger, designed to hold several kilograms of feed.
Several versions of sliding mechanisms are available [8]. One system uses a sliderinside of a larger tube. The entire mechanism is fixed to a hopper that holds feed. Theslider has a chamber, which is typically fixed in size but can be variable. The feedchamber normally rests below the hopper and is gravity-filled. When feeding is desired,the chamber slides inside of the outer tube and moves the prescribed amount of feedfrom the hopper opening to an orifice that allows the feed to drop into the culture system.The feeding cycle is complete when the slider returns to its resting position with thechamber under the hopper. Power for the system is used to move the slider and can beeither electromagnetic or electromechanical.
Augers or endless screws can be used to deliver feed directly to fish or to pneumaticblowers for broadcast to fish in larger systems. Screw-type augers connected to a motorcan be turned on and off to present a prescribed amount of feed to the fish. Feed is usuallygravity-fed to the auger. Some auger systems use disks attached to an endless cable thatis pulled through a pipe or tube. An advantage of the cable and disk system can be lessgrinding of feed as it is conveyed through the tube. For larger feeds, pellet integritybecomes a major consideration, as excessively fine pellets are wasteful when uneaten.Some augers deliver feed to a blower or compressed air tube for increased broadcastingof feed to larger areas.
Automatic feeders that use belts driven by mechanical clock mechanisms (Fig. 12.3)are well-suited for feeding fry and fingerlings, as they can provide continuous or frequentfeedings. Belt feeders are ideal for training swim-up fry and first-feeding fish to accept
Feeding Equipment 287
dry, formulated diets. By providing small amounts of food over the major portion of aday, the fish are more readily trained to accept the dry food and less likely to cannibalizeeach other. Typically an 18- to 20-hour photo period is provided to these early life stagesto maximize feed adaptation [4].
Larger belt systems can be attached to a hopper and motor driven to deliver largeramounts of feed. Feed falls from a hopper to the belt and is carried over the tank anddrops off into the water. The frequency and duration of belt operation determines thefrequency and amount fed.
Another feeder that is particularly well suited for smaller feeds is the rotating-platefeeder [5]. This type uses a disk or plate on which feed is placed. The plate slowly rotates,and feed is pushed into an opening with a stationary arm. The amount placed on the plateand the speed of rotation determines the amount delivered to the fish. Because the plateis constantly moving, this feeder can provide continuous feeding. An adaption of thismethod uses a rotating arm instead of plate. For feeds that are excessively oily or sticky,this method may present problems.
Tipping buckets can also be used to deliver prescribed amounts of feed to a culturesystem. A series of buckets are hinged and placed under a revolving spindle with a seriesof spikes used to tip the buckets. The spindle is rotated at a frequency that determinesthe timing of tipping. Each bucket is filled with the desired amount of feed for a givenfeeding. Winfree and Stickney [11] report on the design and operation of a small tippingbucket-type feeder.
12.1.3 Demand Feeders
The cultured fish can be allowed to determine for themselves how much feed is madeavailable when demand feeders are used. Demand feeders can be used to make foodcontinuously available and allow for the fish to feed to satiation. Typically, fish fed withdemand feeders consume amounts of feed similar to what they would eatad libitumby hand [6]. The demand feeders must, however, be readily accessible to the fish, andsufficient numbers of feeders must be strategically located around larger systems.
Most demand feeders consist of a feed hopper with an opening controlled by a triggerthat extends into the water (Fig. 12.3). The hopper is designed to hold from about 1 kg forsmaller models to over 450 kg in larger models [12]. Demand feeders are commerciallyavailable from a variety of aquacultural suppliers (seeAquaculture Magazine’s AnnualBuyer’s Guidefor sources) and many have been constructed from materials found aroundmost fish farms. Materials such as plastic jugs, 2-L soft drink bottles, plexiglass disks,plastic balls, and welding rods have been fabricated into demand feeders.
Fish are trained to hit the trigger of a demand feeder when hungry and then becomeself-feeding. Some demand systems use a touch-sensitive trigger to activate some kind ofmechanical delivery system (such as those described in the section on automatic feeders).Other modifications of the demand feeder use an in-water feed tray that activates feedrelease as feed is eaten from the tray. Typically all of the demand feeders are adjustablefor food size and amount released per trigger activation. Goddard [5] reported that ittypically takes about 7 to 10 days for rainbow trout to train and feeding to stabilize ondemand feeders.

288 Equipment and Controls
Avault [13] summarized the advantages of demand feeders for rainbow trout. Demandfeeders make feed available 24 hours per day and result in less size variability in theharvested fish. Trout fed with demand feeders can have up to 10% better feed conversionthan in hand-fed systems. Other advantages from demand feeders are lower productioncosts from reduced labor requirements and increased feeding efficiency. Trout on demandfeeders showed fewer disease problems and fewer problems with dissolved oxygen sagsand ammonia spikes from heavy feedings. One other significant finding was a shortergrowout—8 to 9 months as compared with 10 to 12 months using hand-feeding methods.
McElwain [12] reported that in tests at the Hagerman National Fish Hatchery(Hagerman, ID, U.S. Fish and Wildlife Service) demand-fed fish showed weight gains30% greater and lower food conversions than those fed by hand. Additionally theHagerman tests showed that over 45,000 kg of steelhead trout were raised for $4200(1981 dollars) less than hand-fed fish. At the Lamar Hatchery, (Lamar, PA, U.S. Fishand Wildlife Service), demand-fed brook trout were twice the length of trout hand-fedunder similar conditions. Stickney [6] reported thatTilapia aureagained about 72%more weight when fed by demand feeders than when fed by hand.
Some of the disadvantages reported by Avault [13] include a build-up of wastes underthe demand feeders, with some increased incidence of bacterial gill disease. It was postu-lated that other feeding methods presented feed over a wider area and stimulated the fishto keep the water stirred to reduce build-up of wastes in the tanks. Conventional demandfeeders are suitable for dry feeds only. Adjusting the feed output from demand feedersrequires constant attention, as does adjusting filling rates (McElwain [12]). Excessivemoisture around the feed opening can cause crusting and prevent food from dropping outof the feeder. Wind and waves can trigger the demand feeder and release unwanted food.Many commercial feeders have wind screens around the feeder outlet to help reducewind-induced triggering.
12.2 Pumps
Moving water is an essential operation in most aquacultural operations. Some aqua-culturists have the luxury of using gravity to move essentially all of their water, but thesefacilities are rare. Pumps are pieces of mechanical equipment that add energy to fluids.Pumps in aquacultural facilities are primarily used to move water from one point to an-other (e.g., draining ponds and tanks, circulating water in tanks, flowing water throughraceways, or filtering water to remove ammonia or solids). Like many other mechanicalsystems, proper design and selection of pumping systems is essential for the desiredoutcome. Improperly selected pumps can lead to increased costs and, in some cases,catastrophic failures in part or all of a system.
There are several definitions that are important in the understanding of pumps andpump selection (Wheaton [14]; Lawson [15]).
1. Head(or pressure head) is the total pressure that the pump must work against.Often expressed as a height of water, head includes the sum of discharge pressure(the vertical distance from the pump to the point of discharge), static pressure atthe discharge (any pressure on the fluid as it leaves the pumping system), velocity

Pumps 289
head (pressure in the system from movement of the fluid), friction head (pressurelosses due to friction in the components of the system), and net positive-suctionhead (the absolute total head at the inlet to the pump, which can be positive ifbelow atmospheric pressure or negative if above atmospheric pressure).
2. Brake poweris the power available at the output of the unit powering the pump.3. Water horsepoweris the power imparted to the fluid.4. Efficiencyis the ratio of the water horsepower to the brake power; this provides a
value to compare pumps for an application.5. Flow is the volume output of the pumping system.Selecting the proper pump requires knowledge about total system head, desired flow
rates, suction lift, and properties of the fluid [16]. The piping components of the pumpingsystem are also included in a proper evaluation. Water is the primary fluid found inaquacultural operations, although some other fluid applications may be present, notablyair and hydraulic oil. This section focuses on pumping water.
A wealth of information is available from pump manufacturers about their pumpsand how to select the proper pump. Descriptions about the pump and its operationalrequirements are found in manufacturers’ literature. Pressure and flow-rate informationis presented in tabular form or as a pump curve. Additionally, pump efficiencies aregenerally presented as a part of the pump data. Net positive-suction head information isprovided by the manufacturer for each pump.
The properties of water that are important include temperature, salinity, and theamount of solids present in the fluid. As temperature changes, so do flow and net positive-suction head characteristics of the water. Water temperature is also important for com-patibility with the pump’s component materials. Salinity (or other corrosive factors) canplay an important role in determining compatibility with pump materials. For example,in salt-water systems, wetted pump materials must be plastic, stainless steel, fiberglass,or other noncorrosive materials. Pump specifications will generally indicate compati-bility with corrosive fluids. Some pumps are well suited to pumping solids; others arenot. Again, the manufacturers’ data will provide some useful information related tosolids-handling capabilities.
12.2.1 Types of Pumps
Different pumping applications require different types of pumps, depending on pa-rameters such as the flow and pressure desired, the fluid being pumped, and the pumpingenvironment. There are a variety of pump types used in aquacultural applications, al-though centrifugal and airlift pumps are the predominant types. Other major categories ofpumps include rotary and reciprocating. Table 12.1 gives examples of the different typesof pumps that are available. Table 12.2 compares some of the characteristics of centrifu-gal, rotary, and reciprocating pumps. It is important to remember that the manufacturer’sspecifications should be followed when deciding on a model for a particular application.
CentrifugalCentrifugal pumps use some type of rotating vane to pressurize and move water.
Figure 12.4 illustrates two types of centrifugal pump. As water is directed from the inlet

290 Equipment and Controls
Table 12.1. Examples of pumps used in aquaculture (afterWheaton [14] and Lawson [15])
Centrifugal Rotary Reciprocating
Volute Propeller PistonDiffuser Regenerative turbine DiaphragmDeep-well turbine Sliding vane Rotary pistonJet GearMixed flow Lobe
ScrewFlexible tube
Sources: Lawson [15]; Wheaton [14].
Table 12.2. Comparison of pump characteristics
Characteristic Centrifugal Rotary Reciprocating
Use on suction lift Poora to excellentb Limited; pump must be Limited; pump must befilled with fluid filled with fluid
Pump life Excellentc Poor for dry fluids, Goodexcellent for lubricatingfluidsd
Quiet operation Yes No NoPressure relief Unnecessary unless Bypass valve required Bypass valve required
flow is shut offFlow (L/min) 7 to 2400 4 to 150 7 to 50Pressure (kPa) 0 to 1400 130 to 2100 340 to 25,000Viscosity of fluid Low High at lower RPM Lowe to High f
Typical power range 3 to 12,000 180 to 3700 250 to 7500(watts)
Pipe sizes inlet/outlet 0.3 to 10 0.3 to 3.8 1.3 to 1.9(cm)
Common Cast iron, aluminum, Cast iron, bronze, Cast iron, bronze,construction bronze; naval bronze; aluminum; Ni-resist; aluminum;
types 304 and 316 silvercast; type 304 polypropylenestainless steel; stainless steelthermoplastic
Typical applications General water transfer, High-pressure spraying, High-pressure spraying,pond draining, liquid transfer, washing liquid transfer, washingrecirculation, tank operations operations, high solidsdraining and circulation transfers
a Straight centrifugal—about 2 m with suction hose completely full.b Self-priming can be up to 6 m with initial fill of pump casing.c When used with compatible, nonabrasive materials.d For parts that touch, the better the lubricating the fluid, the longer the pump life.e With twin piston or plunger pump.f With diaphragm pump.

Pumps 291
Figure 12.4. Centrifugal pumps—closed impeller (left) and open impeller (right).
to the center of the rotating vane (impeller), centrifugal forces move the water outwardalong the vanes of the impeller. The outwardly moving water picks up speed and isdirected away from the impeller by the pump casing to the discharge. The dynamic head(velocity) is converted to static head as the water backs up in the piping system at thedischarge. Water moving away from the center of the impeller creates a pressure dropand allows more water to be drawn in from the inlet. The amount of pressure developedin a centrifugal pump is a function of the pump characteristics, the inlet pressure, andthe outlet configuration.
Important characteristics of a centrifugal pump for use in aquaculture include theimpeller, casing, and power source. Impellers are classified asopen, semienclosed, andclosed, describing the exposure of the impeller vanes inside of the pump. Open impellersuse vanes attached to a small hub and have large clearances between the impeller andpump walls. Thus, open impellers are better suited for pumping water with high solidscontent. The trade-off for solids-pumping ability when using an open impeller is areduction in efficiency compared with other pump types. Semienclosed impellers havevanes that are attached to a single full face plate. A semienclosed impeller can alsohandle solids, but not as well as open designs. The advantage of a semienclosed impelleris the increase in efficiency over the open impeller. Closed impellers have vanes betweentwo full face plates. Closed impellers have the highest efficiencies but lack the ability topump solids.
The casing design of a centrifugal pump also determines its operating characteristics.A volute casing has a spiral-shaped water path that increases in area as it approaches theoutlet. This allows for the velocity to decrease smoothly and for the energy to transfersmoothly from dynamic head to static head. Single volute pumps are better for use insituations in which the pump will be operated at peak efficiency. Double volute pumpsperform better when the pump output is throttled back for long periods of time [15].Diffusion-type casings have stationary vanes located radially around the impeller. Thediffusion vanes reduce turbulence as the water transitions from dynamic to static headwithin the pump, which results in greater efficiencies [14]. Diffuser casings are bettersuited to water with a low solids content, and volute casings are the choice for applicationswith higher solids contents.

292 Equipment and Controls
Rotary PumpsRotary pumps have a rotating unit within a casing that forces the fluid from the inlet
or low-pressure side to the outlet or high-pressure side. Most rotary pumps have positivedisplacement—the discharge is directly related to the speed of the pump. Two exceptionsto this are propeller and regenerative turbines [14]. All rotary pumps should be operatedat designed output flows and pressures to avoid inefficiencies and possible damage tothe pump. All positive-displacement pumps should have pressure relief in the outlet toavoid damage to the pump in the event of discharge throttling or shut off.
The most common rotary pump used in aquaculture is the propeller pump, whichis aptly suited for applications with low head and high volume outputs [15]. A simplepropeller pump consists of a pipe with an internally mounted propeller that draws waterfrom one end and discharges it out the other. The power required for the propeller pumpis directly related to the desired output. Propeller pumps have been used for movingwater from ponds and for circulating water within larger tank systems. Care must betaken to protect the fish in the system from the moving propeller blades. Screened inletsare often used.
Some other rotary pumps that may be used in aquacultural applications includesliding-vane, gear, and flexible-tube pumps. Sliding-vane pumps consist of an eccen-tric rotor with radially mounted vanes that slide. As the rotor moves, the vanes arepushed outward to contact the casing. The volume between two vanes is pressurizedas it flows from the inlet to outlet port by decreasing the area between the vanes andcasing because of the eccentricity. A modification of this technique is the flexible-vanepump. Gear pumps trap fluids between rotating gear teeth and pressurize the fluid. Theflexible-tube pump (orperistaltic pump) can be used to deliver smaller volumes of liq-uids at constant rates (Fig. 12.5). Rotating rollers pinch flexible tubing against a casingwall to move the fluid through the tubing. Because the fluid only contacts the tubing,
Figure 12.5. Peristaltic or tubing pump and controller.

Pumps 293
flexible-tubing pumps are ideal for corrosive fluids or in applications that require thepumping system to be sterilized.
Reciprocating PumpsOne type of reciprocating pump that can be very useful in some aquacultural appli-
cations is the diaphragm pump. A flexible membrane is fitted into a cavity and flexedback and forth. The vacuum created on the up stroke of the diaphragm draws the fluidthrough a valve and into the chamber. The pressurized downstroke forces the fluid out ofthe chamber and through a second valve. Diaphragm pumps are bulky and rather heavybut have several desirable operational characteristics. For applications that require aself-priming pump, have high levels of solids, or may result in the pump running dry formore than a few moments, the diaphragm pump is ideal.
Airlift PumpsAn airlift pump is simply a rising column of air bubbles in a tube submerged in the
water (Fig. 12.6). An airlift pump can be an efficient means to aerate and circulate waterin a variety of aquacultural systems, provided that the water does not have to be pumpedvery high above the surface. The bubble/water mixture inside of the airlift creates a fluidof lower specific gravity then the water alone. The amount of lift is a function of thedifference in specific gravity between the fluid inside of the tube and that outside. Aslong as sufficient air is injected into the submerged tube, water will flow.
The submergence ratio of the lift tube is the primary factor in determining the amountof lift available. Submergence ratio is defined as the ratio of the total length of the lift tubeto the length that is below the water surface [15]. As the submergence ratio increases,more of the lift tube is below the surface and the airlift pump is more efficient. SeeWheaton [14] and Reinemann and Timmons [17] for more complete information on thedesign and operation of airlift pumps.
Airlift pumps have been used in many applications, including circulating water inponds and tanks, pumping water from tanks, and enhancing aeration with air or pureoxygen. In fact, airlifts are excellent for circulating water in tank and pond systems ifplaced at 100% submergence. Turk and Lee [18] found a $200 labor savings and $2000difference in yearly electrical costs in a comparison of hatchery and grow-out productionof squids and cuttlefish using airlift pumps and centrifugal pumps. The airlift systemsperformed as good or better than the traditional pumped systems in the areas of watercirculation, water quality, animal performance, labor for maintenance, equipment andmaterial replacement, and energy usage.
12.2.2 Power Source
Selecting the power source for a pump is also an important consideration when de-signing a pumping system for aquaculture. Power to the pump shaft must be efficientand at the correct speed for the operating characteristics of the pump. Typical powersources used in aquaculture include electric motors, internal combustion engines, andair (for airlift pumps). The selection of a power source will require an evaluation of thefollowing [14]:
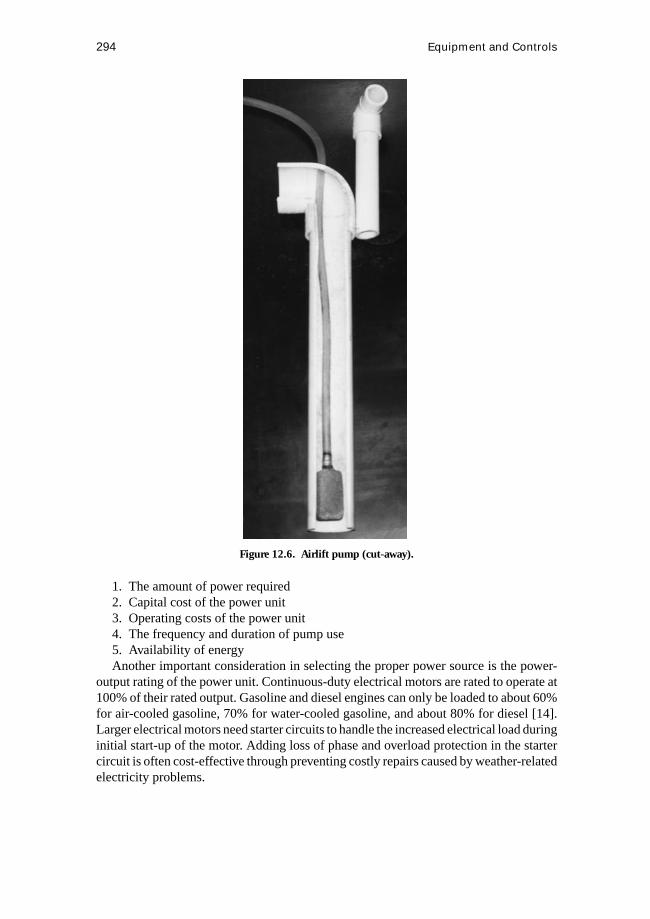
294 Equipment and Controls
Figure 12.6. Airlift pump (cut-away).
1. The amount of power required2. Capital cost of the power unit3. Operating costs of the power unit4. The frequency and duration of pump use5. Availability of energyAnother important consideration in selecting the proper power source is the power-
output rating of the power unit. Continuous-duty electrical motors are rated to operate at100% of their rated output. Gasoline and diesel engines can only be loaded to about 60%for air-cooled gasoline, 70% for water-cooled gasoline, and about 80% for diesel [14].Larger electrical motors need starter circuits to handle the increased electrical load duringinitial start-up of the motor. Adding loss of phase and overload protection in the startercircuit is often cost-effective through preventing costly repairs caused by weather-relatedelectricity problems.
Harvest Equipment 295
12.3 Harvest Equipment
Harvesting fish from aquacultural systems represents the most labor-intensive partof the operation [19]. Harvesting of the crop requires specialized equipment and site-specific modifications to concentrate the fish, remove them from the water, and then sortthe crop according to market requirements [20]. Throughout a typical production cycle,fish are harvested several times for restocking, sorting and grading, health and feedingassessment, and shipment to markets. Many food fish and all fish being sold for grow-outor stocking purposes must be alive and relatively stress-free to be able to survive afterharvest. Different species and life stages may also require unique harvesting methods.Larger operations, such as ponds, raceways, or tank systems, require the operator tohandle many kilograms of fish at a time. Safe and efficient harvesting equipment isneeded to handle the large quantities of fish produced in these large systems. In allharvest operations, minimizing stress and mechanical damage to the fish is essential.Therefore a harvesting method must allow easy and safe handling for both the harvestcrew and the fish.
Harvesting and handling fish causes stress to the animals. Too much stress to the fishweakens their immune systems and can lead to poor performance and even death. Typicalharvest operations crowd fish into confined spaces and remove them from water for aperiod of time. Care must be taken to provide adequate water quality during the crowding.Additionally, the time out of water must be minimized. It is also very important to preventmechanical damage to the fish during the harvest. Fish with bruises, cuts, punctures fromspines and fins, and missing scales look bad and are less desirable for live- and whole-fishmarkets.
Proper planning and equipment preparation is essential for an efficient and safe har-vest. Ponds and culture systems should be planned and constructed with harvesting inmind. Ponds must be accessible to the harvest equipment, including tractors and trucksfor larger harvests. Shuttling fish from a pond to a hauling tank and then to a haulingtruck adds extra handling and stress. Make sure the pond berms are wide enough for thekinds of equipment that will be on them. Roads on berms must also be protected withgravel to prevent erosion and rutting from the heavy equipment. Tucker and Robinson[7] summarize planning considerations for successful harvesting fish:
1. Develop a plan prior to harvesting.2. Maintain all equipment in good working order.3. Check for off-flavor in food fish.4. Do not harvest sick fish.5. Stop feeding 24 hours prior to harvest.6. Try to avoid harvesting in hot weather.7. Do not harvest when water quality is poor.8. Conduct the harvest as efficiently as possible.In most larger ponds used for food-fish and shrimp production, concentrating the
crop is done with seines. Matching the proper seine to the particular harvest is essentialfor efficient harvest of a pond. The seine must be deep enough to form a bag sufficientto carry all of the catch. Additionally, maintaining the depth of the seine in the watercolumn by properly pulling it through the water will keep fish like carp and tilapia from

296 Equipment and Controls
burrowing under the seine and fish such as grass carp and milkfish from jumping overthe net. The mesh size of the net should be as large as possible to minimize drag, butsmall enough to contain the fish to be harvested. Some seines also have a larger bag inthe center for containing the fish or may have a smaller bag fitted with a drawstring toattach to a livecar. As the fish are corralled by the seine, they eventually end up in thebag. Jensen and Brunson [21] summarize the seining process for larger ponds.
The harvesting efficiency (measured as the percentage of harvestable fish that areharvested live) in ponds varies according to the experience of the crew, the type andcondition of the pond, the condition of the equipment, and the water temperature [7]. Askilled crew is likely to harvest more fish with less stress than a novice crew. Experienceat harvesting builds the skill level. Newer ponds tend to have harder bottoms and reducethe amount of mud collected in the net. Older ponds also tend to have more irregularitiesin the bottom from aeration equipment and other pond operations. Older, unrepairedequipment will allow more fish to escape or add to stress if components breakdown. Fishbecome more lethargic in colder water and are less likely to become stressed than thosein warmer water. Under ideal conditions, a seining can probably harvest about 80% to90%; three seine hauls can typically harvest up to 99% of the fish in a pond [7]. If all ofthe fish must be harvested the pond must be drained and fish picked out of the mud tocomplete the job.
12.3.1 Types of Harvesting Equipment
There are many different types of harvest equipment available for pond and tankculture systems. A variety of nets, seines, and traps can be used to harvest from ponds.Jensen and Brunson [21] provide an excellent summary of harvest equipment for pondculture. Fish pumps and piscilators are mechanical devices used to move fish fromcrowded areas in ponds and tanks to transport tanks. Other equipment found in harvestingoperations includes livecars, boom trucks, loading baskets or nets, transport trucks andtanks, sorting and grading equipment, small boats, and tractors. Tanks and raceways mayuse crowders to concentrate fish for easy removal.
NetsNetting for harvesting equipment is available in a variety of materials and sizes.
Materials should be selected that are compatible with the fish to be harvested and aresufficiently durable to last many years. Most netting used in aquaculture is made fromknotted polyethylene or nylon. Knotted nets are suitable for fish like catfish and carp.Woven or knotless netting is more suited for scaled fish, as it is softer and less likelyto abrade fish or knock off scales. Nylon netting should be treated with a tar-based orplastic coating to prevent sun damage and deterioration and snagging of spines and finsfor some species [7]. Some nets, such as cast or gill nets, are made from monofilament.The mesh size should be sufficiently small to keep the desired size of fish contained, butlarge enough to minimize drag as the net is pulled though the water. Smaller meshes tendto retain mud as well. Consult net manufacturers for additional information on sizingand materials for nets.

Harvest Equipment 297
Cast NetsCast nets are circular nets usually made from monofilament nylon of various mesh
sizes. Cast nets are relatively inexpensive and are useful for sampling fish from ponds.When samples are needed for determining feeding rates, growth rates, and fish size, castnets are an easy and effective tool. Shrimp are also easily sampled with cast nets. Infact, shrimp broodstock are easily and less stressfully caught with cast nets [22]. Manyspecies easily entangle in cast nets. Practice and patience are required to develop theskill to properly throw a cast net [21].
Lift NetsLift nets are small square nets that are placed on the bottom or suspended with a
bridle below the surface. By using soft, small meshed netting, the lift net is useful incatching and sampling small fish, fingerlings and fry with minimal injury [21]. Fish arelured over the lift net with food or light and then the net is rapidly lifted out of the water.An adaptation of the lift net is the float net, which is placed on the bottom and releasedto float to the surface, trapping the fish.
SeinesSeines are rectangular nets with floats along the top and weights at the bottom. The
weights and floats keep the net suspended through the depth of the water and the seineis pulled through the water to crowd fish. Seines work best in ponds with flat, regularlyshaped bottoms, in which there are no obstructions [21]. Seines can be used in pondsthat are not drained, such as many catfish ponds. For ponds that are drained or requirecomplete harvest, seines can also be used to harvest the majority of fish prior to draining.This is considered less stressful to the fish than draining alone.
The floats are usually made from cork or foam and keep the net at the top of the watercolumn. The weighted bottom or lead line is usually done with lead weights or leadcored ropes. Often the lead line also has a mud line attached to help the lead line moveefficiently along the bottom without digging into the mud. The mud line is made from aloosely fitting water-absorbing rope line braided along the lead line. Rope mud lines areoften used on regular, hard-bottomed ponds. Other designs for mud lines include rubberrollers, which have been found to be better suited for soft, irregular bottoms (Jensen andBrunson, 1992).
The recommended length of the seine used to harvest an entire pond is usually 1.5times the width of the pond, but some farmers prefer longer seines. Shorter seines areused to sample fish from a pond by pulling the seine across a corner and then to shore.The height of the seine should be about 1.5 times the maximum depth. For most pondsgreater than 0.2 ha, a mechanically drawn seine is preferred because of the drag resistancefrom the area of the seine in the water. Trucks, tractors, and other motorized vehicles areused to pull larger seines through ponds for harvest.
Gill NetsGill nets can be placed in ponds to selectively harvest larger fish. The gill net is made
from monofilament and placed across the pond. The mesh size determines the size of fish

298 Equipment and Controls
captured. Some farmers drive the fish to the net with a boat, and most prefer nighttimeharvesting to limit the visibility of the net in the water. Gill nets are extremely stressfulto the fish and must be checked often.
TrapsTraps can be used to capture smaller fish, such as fingerlings or fry. Some of the
advantages to trapping include [3]:1. Better condition of the harvested fish, because they are not subjected to silty, poor
quality water2. Reduced injury to the fish by handling smaller numbers of fish at a time3. That draining the pond is not necessary4. Successful harvests in ponds with abundant vegetation5. Avoidance of nuisance organisms such as tadpoles and crayfish6. Reduced labor
One major disadvantage to trapping is that supplies of fish may be variable in the trappingprocess; also, the entire pond is not harvested at a single time.
One popular trap is the V-trap, which is placed in front of the drain. The V-trap consistsof a mesh or screen box for collecting the fish and a V-shaped opening that directs thefish into the box. The V can be constructed from mesh or glass. Fish swim into the glassor mesh wing that extends from the apex of the V outward. When they encounter thewing, the fish tend to swim along it and enter the trap through a narrow opening in theapex of the V. Once inside the trap, the fish have difficulty exiting through the narrowopening. The trap is placed in the water and submerged so that about 10% of the heightis above the water line. Moving current and collecting food organisms attract larval fishto the trap. For species that are attracted to cooler water, the V-trap can be placed at theoutlet of a pipe flowing water. There are many modifications to the V-trap and its use inponds; see Piper et al. [3] for other examples.
Seine ReelsLarger seines (>60 m) are difficult to manually handle and are typically stored and
transported on hydraulically operated reels (Fig. 12.7). A seine reel is primarily used tostore the seine, but some are modified with second reels to assist in collecting the netduring the harvest when the net is pulled in to concentrate the fish. Reels are commerciallyavailable or can be fabricated from materials found on many farms. A 1.5-m diameterseine reel can typically hold up to a 365-m seine [21].
LivecarOnce a pond is seined and fish concentrated along one berm, they are often transferred
to a livecar (sometimes called asock). The livecar consists of an open-topped net bagwith a tunnel-shaped opening in one end terminating at a metal frame that fits into thebag end of a seine [21]. The seine has a drawstring at the terminus of the bag that allowsthe metal frame of the livecar to be connected. The harvested fish are crowded into thelivecar for holding until they are dipped from the pond. About 2200 kg of fish can beheld in each 3-m section of approximately 1-m wide livecar when water temperaturesare below 27◦C [21].

Harvest Equipment 299
Figure 12.7. Seine reel with feed storage bin on right.
Loading BasketIf many fish are to be harvested, a boom with a dip net or loading basket is used. The
loading basket is made of a hoop-shaped net with a bottom trap door for dumping the fishfrom the net. A boom truck or backhoe fitted with an extension arm is used to maneuverthe loading basket. Most harvesters use an in-line scale to determine the weight of fishas they are removed from the pond.
Other Harvest GearIn tanks or raceways, harvesting is generally easier because the structure is smaller
and regularly shaped. Some systems continuously harvest by grading and selectivelyharvesting the fish. For fish that grade easily, bar or other adjustable graders can bepushed through the tank to crowd fish and allow smaller fish to pass through the grader.Once the fish have been graded, the desired fish are dipped from the tank for transport.Tanks can also be partially or completely drained to aid in fish removal. In net pens orcages, the fish can be crowded and dipped out of the structure.
Some fish farmers are using some mechanical equipment for harvesting from pondsand tanks, especially once the fish have been crowded. Fish pumps and piscilators canbe used to lift fish from ponds or tanks for sorting and loading onto transport trucks.
Fish pumps are usually either centrifugal pumps, airlifts, or vacuum pumps. Thecentrifugal-type fish pump has specially designed impellers that allow the fish to passthrough the pump relatively unharmed. The size of the fish will generally determinethe amount of damage. Some fish pumps have the capability of dewatering some of thefish as they are moved through the pump and piping system. Airlift pumps are similar

300 Equipment and Controls
in design to those used in moving water in other aquacultural tasks, only the piping islarger to accommodate the fish. Varadi [20] shows some designs for fish airlifts. Mostcommercially available vacuum fish pumps operate by intermittently sucking up a batchof fish and water into a container during each duty cycle [20].
Piscilators, orfish screws, have been used recently to move fish from ponds and tanks.A piscilator is either a large rotating drum with internally attached vanes or a fixed drumwith an moving auger. Water and fish are gently moved up through the drum. Piscilatorsare becoming a popular method of moving and sorting fish, especially fingerlings. Theprimary advantage of piscilators is the minimal physical damage done to the fish duringtransport. A disadvantage is the increased time required to remove a large group of fishfrom a pond or tank.
Grading EquipmentGrading boxes are used frequently in aquaculture to sort fish according to size. Boxes
with either fixed or variable openings in the bottom are used to allow smaller fish to passthrough the voids. Fish are placed in the box that is floating in a tank or pond, and smallerfish are allowed to pass into the water under the grader. Some commercially available bargraders have mechanisms that easily allow the user to vary the slot width. For smallerfish, screens with oval holes can be effective for sorting (see [23] for an easy-to-constructgrader for smaller fish). In general, rounder fish tend to work better in graders than dofish that are flatter-shaped. The flat fish tend to hang up in the grader and not pass throughuntil the slot width is large enough to allow some of the larger fish to pass as well.
In tanks and raceways, moving or fixed graders can be used to sort fish. A movinggrader can be mechanically or manually pushed through a tank or raceway and smallerfish allowed to swim through the grate. Stationary graders are placed in the tanks andallow smaller fish to freely move through while confining larger fish to one side.
12.4 Monitoring Equipment
As the intensity of aquacultural systems increases, the need for monitoring of criticalcomponents and processes becomes more necessary. Many fish are lost in aquaculturalsystems because of the tripping of a circuit breaker due to an electrical overload, shortingof a motor starter from the loss of one phase in a three-phase system, or the inopportunefailure of a relatively simple component, such as a pipe fitting or airline. The proper designof a culture system should include an analysis of the critical components and processesto determine which are essential in the monitoring plan. The critical components andprocesses include anything that will cause undue stress or loss of fish in the event of asystem or component failure.
Oxygen levels in the culture system are usually the primary concern, because a failureof the oxygenation system could rapidly lead to mortality. Other possible critical compo-nents include temperature, water levels in tanks that could drain, water flows, electricity,and ammonia and nitrite levels.
A monitoring system may consist of a variety of components, including both auto-mated and manually monitored parameters. The monitoring system can also be used
Monitoring Equipment 301
to control equipment to provide better water quality without operator intervention. Forexample, oxygen monitoring can be coupled with controls to turn on and off additionaloxygen injectors. Then as the need for oxygen increases and decreases, the proper amountis added. This provides better water quality and growing conditions for the fish, as wellas more economical operation for the owner.
The analysis of the monitoring requirements should consider the necessity of eachparameter to be monitored and the frequency of monitoring. It should look at boththe direct and indirect effects of a system component failure to determine monitoringrequirements. For example, clogging of a solids filter might directly affect solids removal,but could indirectly lead to overflow of a tank. Only those parameters that are essential tothe operation and safety of the fish should be considered in a monitoring program. Oneshould determine the need for automated monitoring of each parameter versus manuallymonitoring using test kits or portable meters.
Extra parameters add to the overall cost and labor requirements of the aquaculturalsystem. Some parameters are also very expensive to monitor reliably in an automatedsystem, and the need for these should be carefully justified. Maintenance of sensorsin the harsh environment of an aquacultural system is time-consuming and costly interms of replacement parts and labor. Redundancy and reengineering of some parts ofthe system to reduce or eliminate the need for monitoring should be considered. Forexample, one could put external and internal standpipes on tanks to eliminate the needfor level sensors in tanks. These sensors foul easily and will give false readings if notimpeccably maintained.
Kaiser and Wheaton [24] summarized the design considerations for a monitoringsystem:
1. Formulate clear objectives: List the desired functions of the monitoring system forboth present and future.
2. Evaluate the economic feasibility of each objective: The monitoring system shouldhelp to increase profitability. Determine the capital and operational costs of eachoption.
3. Determine the system inputs: Assess the parameters to be monitored, includingthe level and frequency of monitoring.
4. Determine the hardware and software needs: Evaluate sensors and data collec-tion equipment available for the task. Determine availability and compatibility ofsoftware for the hardware.
12.4.1 Sensors
Sensors are the part of the monitoring system that measure the critical variable(Fig. 12.8). Simply defined, a sensor converts a physical property into an electricalsignal [24]. Sensors can be simple switches that open or close a circuit depending ona certain condition, or they can measure a voltage change that relates to changes in aparticular parameter of concern.
Specifications provided by the manufacturer provide important information for theselection of sensors. Some of the more important considerations about a particular sensorinclude [24]:

302 Equipment and Controls
Figure 12.8. Examples of sensors—clockwise from top left, pH,dissolved oxygen, thermocouple, ammonia, flow, level.
1. Measurement range: The level of the measured variable in the culture system mustfall in the range of measurements for the sensor.
2. Measurement sensitivity: The minimum detectable change of the measured vari-able by the sensor must be at a level sufficient to provide meaningful monitoringinformation.
3. Sensor drift: The frequency of changes in the output signal without changes in theinput should be small.
4. Response time: How long will the sensor take to stabilize on a measurement?5. Calibration frequency and procedure: Sensors that require frequent calibrations
will need automatic calibration processes. Determine the procedure for calibrationand evaluate the suitability of materials with the aquaculture system.
6. Operating conditions: Check with the manufacturer to determine if the sensor issuitable for the intended environment.
7. Interferences: Are there substances in the system water or environment that willinterfere with the measurement? Check for therapeutants and any chemicals thatmay be added.
8. Maintenance: What steps and supplies are needed for maintenance?9. Expected life: What is the life expectancy of the sensor?Sensors are typically the weakest components of a monitoring system. The harsh
environment of the fish tanks and system water tend to corrode or foul most sensors

Monitoring Equipment 303
rather quickly. Some sensors are inherently unstable and require constant recalibration.Manufacturers of sensors are using a variety of new techniques to make the sensors morestable and reliable. Sensors available today are much more sensitive and reliable thanthose of a few decades ago.
The critical parameters that should have serious consideration for frequent or constantmonitoring are oxygen, temperature, ammonia, and possibly electricity levels. Otherparameters such as pH, water flow, or water level may in some systems require morefrequent monitoring. System pH is relatively easy to monitor using a pH meter and probeor wet chemistry. Probes for pH are very reliable and can be adapted to an automatedsystem with ease. Manufacturers of pH equipment should be consulted for details. Waterlevel and flow are also relatively easy to monitor with readily available sensors. Oneshould consider fouling and the need to routinely clean the sensors prior to purchasingand installing. Most water level and flow sensors can be of the simple on/off switch typeand therefore can be set up on an automated system to detect an open or closed circuit.
Oxygen SensorsMost dissolved-oxygen sensors are polarographic sensors that measure a current
produced by the consumption of oxygen between two electrodes. The consumptionof oxygen is proportional to the amount present, which is a function of how muchoxygen diffuses across a permeable membrane. The sensor can be connected to metersspecifically designed for monitoring oxygen or can be connected to a computerized datacollection system. The manufacturers specifications give additional details.
Oxygen sensors can be air-calibrated and typically require calibration at long (>24-hour) intervals. Maintenance of the membrane and filling with a potassium chloridesolution are the usual maintenance procedures in clean water. For prolonged exposure toculture water, additional maintenance will require cleaning of the membrane periodically.
For many aquacultural operations, monitoring dissolved oxygen several times perday will provide sufficient information about the status of oxygen. For ponds and manytanks culture systems, the oxygen levels may not change very rapidly. Pond systems arereasonably well understood and can usually be monitored two or three times per day.Manual readings are probably cost-effective for many pond systems. For more intensivesystems, a failure of an oxygenation component could mean extensive mortality in lessthan an hour. These very intensive systems require either redundant components orautomated readings of oxygen several times per hour. Control circuits that use dissolvedoxygen readings to administer the amount of oxygen in a system can be cost-effective ifhigh densities are cultured.
TemperatureTemperature sensors come in a variety of configurations, including thermocouples,
resistance temperature detectors, and thermistors. See the Omega Temperature Handbookfor a more detailed discussion on temperature measurement and sensors [25].
A thermocoupleis two dissimilar metal wires connected together. If exposed to chang-ing temperatures, the wires generate a current that is proportional to the temperature.Thermocouples are well studied and available from a variety of sources. One should be

304 Equipment and Controls
careful to select thermocouples that measure temperatures within the desired temperaturerange and are made from materials compatible with the environment.
Resistance temperature detectors (RTDs) rely on the fact that resistance in metalschanges with changing temperatures. Most RTDs are made from platinum, nickel, ornickel alloys. RTDs tend to be more linear than thermocouples and much more stable,but they are more fragile and require a small current to provide a voltage to be measured[25].
Thermistors are semiconductors that have an inverse relationship between temperatureand resistance. Thermistors have the advantage of being much more sensitive than RTDsor thermocouples. The construction of the thermistor makes it more fragile than RTDs,and thermocouples and are less tolerant to large temperature differences, which is not aproblem in aquaculture [25].
Ammonia SensorsAmmonia levels can become critical in many aquacultural systems and need to be
routinely monitored in intensive culture systems. Although ammonia is a critical variableto monitor, careful consideration should be given to the type of monitoring system. Foroperations that will only require routine checks on ammonia, test kits and small spec-trophotometers should be sufficient. However, for heavily loaded recirculating systems,frequent ammonia monitoring may be necessary to ensure efficient biofilter operationand fish health.
Kaiser and Wheaton [24] reported on an automated system for monitoring ammonia inrecirculating aquacultural systems. The sensor used in this application was an ammoniagas–sensing electrode. This electrode measures the free ammonia gas in a solution usinga selective membrane. To measure total ammonia in a water sample, the sample pHis increased to greater than 11 to ensure that all ammonia in solution is in the formof ammonia and not ionized as ammonium. An automated system must take this intoaccount and have a measurement chamber capable of automatically adjusting the samplepH for each measurement.
12.4.2 Monitoring and Control Systems
With the advent of relatively inexpensive personal computer systems and data acqui-sition systems, automated monitoring is becoming much more affordable than even adecade ago. Fast computers coupled with data-acquisition boards and data-monitoringsoftware are making the task of developing a custom monitoring and control system easyand economical.
There are several data-acquisition and -control systems commercially available foraquacultural applications. Kaiser and Wheaton [24] and Ebeling [26], [27] present de-scriptions of data acquisition and control systems.
System ComponentsParts of a monitoring system include sensors to measure the desired variables, an
interface to convert the electrical information into a form readable by a computer ormicroprocessor, a computer, software to run the system, and displays. Matching thecomponents is the most important step in deciding what to use in a monitoring system.

Monitoring Equipment 305
Kaiser and Wheaton [24] present several key considerations in selecting the monitoringsystem components:
1. Determining the inputs: Are the signals analog or digital?2. Accuracy and resolution: What is the desired accuracy and resolution of the mea-
surements and can the data conversion and computer provide this resolution?3. Determining system outputs: Does the control function require analog or digital
output? What displayed and stored data will be required?4. Selecting a computer: Is the computer rugged enough for the aquacultural envi-
ronment? Is it compatible with the other components?5. Selecting software: Does the computer software easily interface with the user and
components?
Alarms and Calling SystemsOne of the most important functions of a monitoring system is to provide alerts to
the system operator in the event of malfunctions and problems. If critical variables aresensed to be outside of acceptable limits, alarms need to be sent out for corrective actionto be initiated. It is important to design and test the monitoring and alarm system so thatfalse alerts are not sent out too frequently. Too many false alarms usually results in theoperator becoming less likely to respond.
Alarms must be constructed and operated so that the proper individuals are alertedto adverse conditions. Visual and audible alarms can be placed in key areas within afacility to alert workers of problems (Fig. 12.9). Loud and obnoxious audible alarmsplaced outside of a facility are not likely to be very effective during hours when thereare no onsite workers. Instead, remote alarms need to be employed. All alarm systemsmust also be capable of routine testing to ensure that the systems are working properly.
Figure 12.9. Alarm box and phone dialer.

306 Equipment and Controls
One external alarm that has shown promise is the automatic phone dialer. This deviceis commercially available and quite simple to use. Most of the inexpensive models weredesigned for monitoring open/closed contacts, the presence of line-powered electricity,temperature, and noise levels. Basically they are inexpensive burglar alarms. The unitsaccept either four or eight on/off inputs, which can be microswitches or analog outputsfrom a computer monitoring system. Each input to the dialer is then routinely scannedby the unit, and an alert conditions exists if one is triggered. Also, if temperature exceedsa preset limit, a noise above a threshold is detected, or electricity goes off, the unit goesinto alert status. The unit is programmed to dial one or more phone numbers and willcontinue to cycle through the number list until an acknowledgment is accepted. The usercan also call into the system and poll the unit for a status.
Sometimes pagers are used with the dialers to give the operator mobility with constantavailability to the dialer. A variety of more complex dialers are also available withmore features and capabilities. The system needs and compatibility with other systemcomponents must be evaluated prior to purchase.
References
1. Swift, D. 1993.Aquaculture Training Manual. Fishing News Books, BlackwellScientific Publications, Oxford, England.
2. Geiger, J., and C. Turner. 1990. Pond fertilization and zooplankton managementtechniques for production of fingerling striped bass and hybrid striped bass. In: R.Harrell, J. Kerby, and V. Minton (eds.),Culture and Propagation of Striped Bassand Its Hybrids. Striped Bass Committee, Southern Division, American FisheriesSociety, Bethesda, MD, pp. 79–98.
3. Piper, R., I. McElwain, L. Orme, J. McCraren, L. Fowler, and J. Leonard. 1982.FishHatchery Management. United States Department of the Interior, Fish and WildlifeService, Washington, DC.
4. Shepherd, C., and N. Bromage. 1988.Intensive Fish Farming. Blackwell ScientificPublications Professional Books, Oxford, England.
5. Goddard, S. 1996.Feed Management in Intensive Aquaculture. Chapman and Hall,New York.
6. Stickney, R. 1994.Principles of Aquaculture. John Wiley and Sons, New York.7. Tucker, C., and E. Robinson. 1990.Channel Catfish Farming Handbook. Van Nos-
trand Reinhold, New York.8. New, M. 1987.Feed and Feeding of Fish and Shrimp: A Manual on the Preparation
and Presentation of Compound Feeds for Shrimp and Fish in Aquaculture. UnitedNations Development Programme, Food and Agriculture Organization of the UnitedNations, Rome, Italy.
9. Baldwin, W. 1983. The design and operation of an automatic feed dispenser.Aqua-culture34:151–155.
10. Mortensen, W., and O. Vahl. 1979. A programmed controller for automatic feeders.Aquaculture17:73–76.
11. Winfree, R., and R. Stickney. 1981. Automatic trough feeder developed.AquacultureMagazine, May–June:18–19.

References 307
12. McElwain, I. 1981.The Use of Self Feeders in Fish Culture. Lamar InformationLeaflet 81-01. U.S. Fish and Wildlife Service, Lamar Fish Culture DevelopmentCenter, Lamar, PA.
13. Avault, J. 1981. Feeding methods affect production and profit.Aquaculture Maga-zine, May–June:38–39.
14. Wheaton, F. 1977.Aquacultural Engineering. John Wiley and Sons, New York.15. Lawson, T. 1995.Fundamentals of Aquacultural Engineering. Chapman and Hall,
New York.16. Bankston, J., Jr., and F. Baker. 1994. Selecting the Proper Pump. SRAC Publication
no. 372. Southern Regional Aquaculture Center, Stoneville, MS.17. Reinemann, D., and M. Timmons. 1986. Airpump. Northeast Regional Agricultural
Engineering Service, Cornell University, Ithaca, NY.18. Turk, P., and P. Lee. 1991. Design and economic analysis of airlift versus electrical
pump driven recirculating aquacultural systems. In:Engineering Aspects of IntensiveAquaculture, Proceedings from the Aquaculture Symposium, Cornell University,April 4–6, 1991, NRAES-9. Northeast Regional Agricultural Engineering Service,Cornell University, Ithaca, NY.
19. Pillay, T. 1990.Aquaculture Principles and Practices. Fishing News Books, Black-well Scientific Publications, Oxford, England.
20. Varadi, L. 1985. Mechanized harvesting in fish culture. In: T.V.R. Pillay (ed.),United Nations Development Program:Inland Aquaculture Engineering.ADCP/REP/84/21. Food and Agriculture Organization of the United Nations, Rome.
21. Jensen, G., and M. Brunson. 1992. Harvesting Warmwater Fish. SRAC Publicationno. 394. Southern Regional Aquaculture Center, Stoneville, MS.
22. Lee, J., and M. Newman. 1992.Aquaculture: An Introduction. Interstate Publishers,Danville, IL.
23. Schipp, G. 1995. A simple, adjustable grading box for small fish,Progressive Fish-Culturist 57:245–247.
24. Kaiser, G., and F. Wheaton. 1991. Engineering aspects of water quality monitoringand control. In:Engineering Aspects of Intensive Aquaculture, Proceedings from theAquaculture Symposium, Cornell University, April 4–6, 1991, NRAES-9. NortheastRegional Agricultural Engineering Service, Cornell University, Ithaca, NY.
25. Omega. 1992.The Temperature Handbook. Omega Engineering, Stamford, CT.26. Ebeling, J. 1991. A computer based water quality monitoring and management sys-
tem for pond aquaculture. In:Engineering Aspects of Intensive Aquaculture, Pro-ceedings from the Aquaculture Symposium, Cornell University, April 4–6, 1991,NRAES-9. Northeast Regional Agricultural Engineering Service, Cornell Univer-sity, Ithaca, NY.
27. Ebeling, J. 1995. Engineering design and construction details of distributed moni-toring and control systems for aquaculture. In:Aquacultural Engineering and WasteManagement, NRAES-90. Northeast Regional Agricultural Engineering Service,Cornell University, Ithaca, NY.

308

13 Waste-HandlingSystems
Steven T. Summerfelt
13.1 Introduction
In the past, intensive fish-farming practices were often developed without much con-sideration for either the real or perceived effect of their waste on the farm’s surroundingenvironment. Intensive fish-farming practices used water resources for two reasons: tocarry oxygen to the fish and to receive the waste produced in the system (metabolicby-products and other materials) and disperse or carry these wastes away so that theydid not accumulate in or around the fish farm to harmful and undesirable levels [1].Therefore, in an unregulated environment, the carrying capacity of a fish-farming wa-ter resource is only limited by either the amount of oxygen that can be delivered orby the rate of dispersal or removal of metabolic wastes [1]. Recently, however, theincreased emphasis on reducing, managing, and controlling effluents, as well as thegrowing competition for and conservation of water resources, have created a moredifficult regulatory, economic, and social environment for existing aquaculture facili-ties to operate under [2]. Also, it is clearly much more difficult to locate and permitproposed aquaculture facilities with today’s environmental awareness, more stringentregulations, and scarce untapped water resources. Therefore, technologies and strate-gies to manage or reduce the wastes generated during aquaculture production are be-ing developed to reduce its demand for water resources and abate its effect on theenvironment.
Increased aquaculture production efficiencies, reduced waste, or reduced water usehave resulted from improved feed and feeding strategies, application of aeration andoxygenation technologies, water-reuse technologies, and more widely used effluent-treatment technologies.
Technological advances now make it possible to culture a wide variety of species inalmost any location. Recent trends have been towards an increase in the use of tech-nologies to intensify production within larger intensive systems, including cage culturesystems, single-pass or serial reuse systems, pond systems, and enclosed recirculatingsystems.
More stringent water-pollution control and water-use permitting has made systemsthat reuse water more attractive, because these systems reduce the volume of water to
309

310 Waste-Handling Systems
be treated and thus the size of water-treatment facilities, concentrating the wastes suf-ficiently for their economical removal [3]. Water-reuse systems typically use clarifiersor filters to remove particulate solids, biological filters to reduce dissolved wastes, strip-pers or aerators to add oxygen and decrease carbon dioxide or nitrogen gas levels, andoxygenation units to increase oxygen concentrations above saturation. Depending uponthe level of reuse and water-quality requirements, processes to provide pH control andadvanced oxidation may also be required.
Reductions in production costs within recirculating systems have been achievedthrough increases in intensification and scale [4, 5]. Even so, not all water-treatmenttechnologies scale up equally well, and the more functional and less costly technologiesfor treating large flows are being adopted [4, 5]. As methods are developed to reducethe higher cost of production within these systems, recirculating systems are being morewidely adopted commercially. However, it is still unclear how many of the new producersusing large recirculating systems will be profitable in several years.
This chapter briefly summarizes regulation governing aquaculture wastewater, re-views the amount and type of aquaculture metabolic by-products generated, and de-scribes several procedures for collection and disposal of these by-products, reducingtheir environmental impact or allowing for the water to be directly reused. The informa-tion provided includes descriptions of technologies that are used for treating water forreuse or for treating aquaculture wastewater just before it is discharged.
13.1.1 Effluent Regulations
The disposal or beneficial reuse of aquacultural effluents and solids wastes is regulatedat the federal level and often at the state level. The purpose of the discharge regulationsis “to restore and maintain the chemical, physical, and biological integrity of the nationswaters.” In the U.S., federal regulations fall primarily under the Environmental ProtectionAgency (EPA), which, under the Clean Water Act, has the authority to regulate alldischarges of pollutants, including both point-source and non–point source effluents.
The EPA, under the Clean Water Act, provides National Pollution Discharge Elim-ination Systems (NPDES) permits to control point-source discharges to waters of theUnited States, but these are often administered by individual states under the oversightof the EPA. NPDES permits broadly define pollution in wastewater discharges so thatit may include suspended solids, nutrients (phosphorus and nitrogen), biochemical oxy-gen demand, dissolved oxygen, pH, bacteria, toxic chemicals, volatile organic molecules,metals, pesticides, and other material. In order to minimize waste output or recycle wasteproducts, EPA policy supports the use of best available technology (BAT) and best man-agement practices (BMPs), the use of effluent for irrigation water, and the use of organicsolids for soil enrichment, fertilizer, or animal feed [6, 7].
The EPA has not formally established technical standards for discharges from aqua-culture facilities, but it does provide guidelines in the Clean Water Act [7]. Regulationsunder section 40 of the Code of Federal Regulations require NPDES permits for farmingcold-water aquatic organisms when annual harvests exceed 9090 kg and the rearing unitsdischarge for more than 30 days annually. Similarly, NPDES permits are required for

Materials to Remove 311
farming warm-water aquatic animals when annual harvests exceeds 45,454 kg and therearing units discharge for more than 30 days annually.
Regulations may suggest a best available technology (BAT) or limit either the con-centration or total mass of a given constituent discharged per day.
13.2 Materials to Remove
Beveridge et al. [8] define aquaculture wastes as “the materials used in aquatic animalproduction which are not removed during harvesting and which may eventually find theirway into the environment at large.” These wastes may include feed and feed fines, thefish’s metabolic by-products, and chemicals used to treat fish disease, disinfect water orequipment, or control fouling, aquatic vegetation, or other nuisance organisms.
Water-quality parameters are of concern in fish culture if they cause stress, reducegrowth rate, or produce mortality. Water quality is also of concern if the effluent character-istics (e.g., biochemical oxygen demand, suspended solids, phosphorus, or nitrogenouscompounds) of the culture facility must be controlled to meet water-pollution require-ments [1]. Water-quality limitations reduce the profitability of fish production, becausethe reduction in water quality that leads to stress and the deterioration of fish healthreduces growth and increase the risk of disease and catastrophic loss of fish [9, 10, 11].
The water-quality criteria required for maintaining a healthy and rapid growth envi-ronment (Table 13.1) are the basis for designing and managing aquaculture systems, andthe parameters of primary concern are oxygen, nitrogenous and phosphorus compounds,carbon dioxide, solids, total gas pressure, chemotherapeutants, and pathogens. Theirproduction or reduction can lead to concentrations that affect the growth and health ofthe fish and that may require treatment before the water is used, reused, or discharged.Each of these parameters is discussed subsequently here.
Table 13.1. Suggested water quality criteria for optimum fish health in freshwater
Losordo [20] onPiper et al. [12] Laird and Needham General Guidelines for
Water Quality Parameter on Trout and Salmonids [19] on Atlantic salmon Recirculating Systems
Maximum concentrationCarbon dioxide 10 mg/L 10 mg/L 20 mg/LUn-ionized ammonia 0.0125 mg/L 0.0125 mg/L 0.02–0.5 mg/LNitrite 0.1 mg/L 0.02 mg/L 0.2–5.0 mg/LNitrate 3.0 mg/L 1000 mg/LTotal suspended and 80 mg/L 80 mg/L
settleable solidsOzone 0.005 mg/L 0.005 mg/L
Optimum rangepH 6.5–8.0 5.5–8.5 6.0–9.0Dissolved oxygen 5.0 mg/L to saturation >6 mg/L >6.0
Source: Noble and Summerfelt [11].

312 Waste-Handling Systems
13.2.1 Nitrogenous Compounds
Nitrogen is present in the protein used in fish feeds. Once introduced into the fish farm,the nitrogen in the protein in the feed can be converted to ammonia, nitrite, nitrate, andnitrogen gas. Ammonia and nitrite are the two forms of nitrogen that most often presentproblems to the fish. However, the total nitrogen (including proteinatious nitrogen) andnitrate concentrations may be regulated in aquaculture discharges.
AmmoniaAmmonia is a metabolic by-product of protein metabolism and is the primary nitroge-
nous metabolite excreted by fish. Production of ammonia, however, is dependent uponfactors including the type and life stage of fish, feed type, and even the feeding frequency.Approximately 30 mg of total ammonia nitrogen (NH3+NH+4 ) is produced by fish pergram of feed consumed [12, 13]. Ammonia is also produced by three additional reac-tions in recycle systems using biological treatment: biological deamination of organiccompounds (waste feed and feces), endogenous respiration, and cell lysis [14]. At highlevels, un-ionized ammonia (NH3) is toxic to fish (LD50 = 0.32 mg/L for rainbow troutand 3.10 mg/L for channel catfish; [15]) and at lower concentrations (0.05 to 0.2 mg/Lof un-ionized ammonia) it causes a significant reduction in growth [16]. For salmonidfishes, optimal conditions for growth requires an un-ionized ammonia concentration lessthan 0.0125 mg/L [12]. Therefore, ammonia must be removed from aquaculture systemsbefore it can accumulate to toxic levels.
Un-ionized ammonia is the toxic form of ammonia; it associates with water to formhydroxide (OH−) and ammonium (NH+4 ):
NH3+ H2O⇔ NH+4 +OH− (13.1)
The equilibrium of ammonia is a function of the water’s pH,
[NH3]/[
NH+4] = 10(pH−pKa) (13.2)
where pKa is a function of temperature (T in degrees Kelvin),
pKa = 0.09018+ 2729.92/T (13.3)
such that decreasing pH or temperature shifts the equilibrium to form more ammonium.
NitriteNitrite (NO−2 ) is an intermediate formed during the biological oxidation of ammonia
to nitrate (nitrification). The 96-hour LC50 value of the nitrite ion to rainbow trout is 0.20to 0.40 mg/L as nitrite-N [17]. However, the toxicity depends upon the concentration ofcalcium or chloride ions, which can increase the tolerance of rainbow trout to nitrite bya factor of 20 to 30 times [16]. To maintain a healthy, growth-promoting environment,nitrite concentrations of less than 0.012 and 0.1 mg/L were recommended by Westin[18] and Wedemeyer [10], respectively (Table 13.1). Incomplete nitrification causesaccumulations of higher nitrite concentrations in recirculating systems, and [20] providesguidelines of less than 0.2 to 5.0 mg/L nitrite, which would depend upon species and life
Materials to Remove 313
stage. Aqueous nitrite is in equilibrium with nitrous acid, which is more toxic to aquaticorganisms than nitrite [21]
HNO2+ H2O⇔ H3O+ +NO−2 (13.4)
The equilibrium of nitrite with nitrous acid (Ka=4.5×10⁻⁴ at 25◦C) is dependent uponpH (according to an equilibrium relationship similar to Eq. (13.2)), and a shift to lower pHvalues shifts the equilibrium towards nitrous acid and thus increases the nitrite toxicity.At normal culture pH, however, equilibrium favors essentially only the nitrite ion.
13.2.2 Solids
Aquatic organisms are affected by solids in suspension and by settleable solids asthey are deposited by sedimentation. The effect of the solids on fish is dependent onthe species, age and stage of the reproductive cycle [22]. Suspended and settleablesolids may affect reproductive behavior, gonad development, and the survival of theegg, embryo, and larval stages of warmwater fishes [22]. In certain intensive systems,suspended solids have been cited as one of the major factors limiting production [23].Suspended solids have been associated with environmentally induced disease problems[24, 25, 26] and have been reported to cause sublethal effects such as fin rot [27] anddirect gill damage [24, 25] in rainbow trout.
Solids are produced in aquaculture systems as uneaten feed, feed fines, fish fecalmatter, algae, and sloughed biofilter cell mass (in recirculating systems). Uneaten feedand feed fines, which can represent 1% to 30% of the total feed fed [8], have a large effecton the total solids production. However, feed waste can be controlled with new feedingtechniques [28, 29, 30, 31, 32], and feed fines can be reduced by careful handling andseparation techniques. If waste feed is minimal, solids production is about 30% to 50%of the daily feed input [12, 13].
Shear forces (water turbulence, fish motion, pumps, etc.) can break apart fecal matter,uneaten feed, and feed fines soon after they are deposited, allowing them to disintegrateinto much finer and more soluble particles [33]. For example, as much as 30% to 40%of the total suspended solids generated in a recirculating system will decay if solidsare filtered and stored in a pressurized-bead filter (a type of granular-media filtrationunit) between 24-hour backwash cycles [34]. The rapid dissolution and breakup of fecalmatter, waste feed, and feed fines releases ammonia, phosphate, and dissolved and fineparticulate organic matter, which are harder to remove (when dissolved or as a fineparticulate) and deteriorate the water quality within the system and in the dischargedeffluent [35, 36, 37].
Because of the detrimental effects of solids on the receiving water, fish health in theculture environment, and the performance of other unit processes within recirculatingsystems, solids management is one of the most critical process in aquaculture systems[38, 34, 39, 23]. To improve solids management, the freshly produced solids should berapidly flushed from the fish culture tank, without pumping, directly to a solids-removalunit that does not store solids within the recirculating flow.

314 Waste-Handling Systems
Particulate SizeSolids are classified according to size as soluble (<0.001µm); colloidal (0.001–
1.0µm), supracolloidal (1.0–100µm); and settleable (>100µm). Dissolved solids canbe removed by biological conversion to cell mass or by chemical oxidation. Colloidaland supracolloidal solids can be clarified if they can be flocculated by chemical addition(aluminum and iron salts, polymers, or ozone) or if they can be floated. However, with theexception of ozone (discussed in the section on ozonation), which shows great promise,the use of flocculant aids for enabling clarification of colloids has not been common.Larger supracolloidal solids can be clarified by filtration or flotation, and their removalefficiency can be increased by flocculation. Settleable solids can be removed with orwithout flocculation by sedimentation or by filtration.
Shear ResistanceThe shear resistance of aquaculture solids is generally better than that of flocculant
particles found in water and wastewater-treatment plants. The shear resistance of aqua-culture solids, however, is still low enough to cause serious consideration when selectingthe best clarification process [33].
Specific GravityThe specific gravity of fish fecal matter is likely to vary depending upon conditions.
Suspended solid specific gravity values of 1.005, 1.13 to 1.20, and 1.19 were reportedby Robertsen [40], Timmons and Young [41], and Chen et al. [39], respectively.
Chemical Make-upThe general chemical make-up of the particulate stream should be known to select
the clarification process properly. The process selection can depend on whether theparticulate matter is relatively organic or inorganic, hydrophobic or hydrophilic, proteinor fat, reactive or inert, positively or negatively charged, temperature-stabilized, or pH-stabilized. Knowledge of the particulate composition can provide insight into whichclarification mechanisms are beneficial (precipitation, flocculation, flotation) or warn ofproblems that may occur (biofouling, scale deposition, corrosion, abrasion, flotation).
13.2.3 Dissolved Matter
Dissolved organic matter can accumulate within recirculating systems, because it isnot readily biodegradable owing to its size or chemical nature and because daily replace-ment of water is usually low (5% to 50%). Dissolved organic matter promotes growthof heterotrophic microorganisms, which increase system total oxygen demand and in-hibit nitrification by competing for space and oxygen in a biofilter. Some heterotrophic(saprotrophic) microorganisms in the system may consist of facultative pathogens (i.e.,aeromonas) that can result in epizootics if the fish are stressed by handling or sublethalwater-quality conditions [11].
13.2.4 Carbon Dioxide
Fish excrete carbon dioxide through their gills as a function of both ventilation rate(which depends upon the blood’s oxygen concentration [42]) and the carbon dioxide–concentration gradient across the gill [43, 10]. The volume of carbon dioxide produced

Materials to Remove 315
during respiration is about the same as the volume of oxygen consumed [44], effectivelyabout 0.3 to 0.4 g of carbon dioxide per gram of feed for salmon and trout [13].
Although carbon dioxide is a gas, it is not a major contributor to gas-bubble diseasebecause it does not contribute significantly to gas supersaturation [45]. Aqueous carbondioxide concentrations of 20 to 40 mg/L reduce the capacity of fish blood to transportoxygen [46] and contribute to the deposition of calcium in their kidneys, with highercarbon-dioxide concentrations corresponding to increasing deposition [47]. Smart et al.[47] found reduced growth and higher feed conversion ratios in rainbow trout reared atconcentrations of 55 mg/L carbon dioxide. Rainbow trout seem tolerant of 30 to 35 mg/Lcarbon dioxide concentrations, but 55 mg/L was found to cause death [48]. However,actual toxicity levels vary according to fish species, fish age, and other water qualityvariables such as oxygen concentration, alkalinity, or pH [10, 48]. The recommendedlimit on the carbon-dioxide concentration in trout or salmon culture is 20 mg/L [49].The 20 mg/L recommended safe level may be conservative, especially if oxygen in thewater is high [45, 10].
The concentration of carbon dioxide in water depends upon the pH and the amount ofinorganic carbon (carbonic acid, bicarbonate, and carbonate) present (discussed in thesection on carbon-dioxide removal).
13.2.5 Pathogens and Chemicals Used in Aquaculture
Disease and the use of chemicals to treat fish disease, disinfect water or equipment, andcontrol fouling, aquatic vegetation, and other nuisance organisms are important issuesin aquaculture [8, 50, 51]. To avoid introduction or spread of fish diseases, in certaininstances there are strict regulations on fish transport, fish escapement, and effluentdisinfection. In addition, use of certain chemotherapeutics is restricted to protect thecultured fish or the environment that would be contacted by the chemotherapeutics.
Management practices designed to prevent water-quality degradation and the occur-rence of diseases are critical to a successful aquaculture facility, especially facilities thatreuse a large portion of water [52, 11]. Use of chemotherapeutants in the water or feed aremethods for treating disease that act on the symptom but present special considerationsif the water is to be discharged, reused serially for fish culture, or treated in biologicalfilters. To avoid introducing pathogens in the first place, aquaculture facilities shoulddevelop protocols for disease prevention and control. A sound protocol would limit en-try of disease carried on fish being introduced to the system and make provisions toexclude pathogens carried by the water supply, facility personnel, visitors, or unwantedanimals [11].
13.2.6 Nutrients
Phosphorus and nitrate do not become growth-limiting in intensive systems. Phospho-rus and nitrate are primarily a concern as they result in effluent discharge problems. Feedand fecal matter can rapidly leach phosphorus and disintegrate and should be removedfrom the flow as rapidly as possible [53, 54, 8, 55, 35, 56, 50, 57, 37].
Phosphorus and nitrogen can be either soluble or bound with particulate matter. Mostof the effluent nitrogen released (75% to 80%) is in the form of dissolved ammonia

316 Waste-Handling Systems
or nitrate [55, 58], depending on the effective use of feed and how much nitrificationhas occurred. The fecal solids contain about 1% to 4% phosphorus (on a dry-weightbasis) and about 2% to 5% nitrogen (on a dry-weight basis) [58]. Literature reviewsindicate that the filterable or settleable solids contain most (50% to 85%) of the effluentphosphorus, but relatively little (about 15%) of total effluent nitrogen [55, 58]. The largevariability in the phosphorus fractionation between dissolved and particulate matter islargely due to the variability within the type and level of phosphorus in the feed, whichin turn influence the phosphorus solubility and availability (to the fish).
13.3 Methods to Remove Ammonia
In once-through or single-pass aquaculture systems, ammonia is flushed away withfresh water. In reuse systems, however, insufficient ammonia is removed through simpledilution with fresh water, and ammonia must be removed from the system in anothermanner [59, 13]. The primary method for treating ammonia in recirculating aquaculturesystems is by bacterial oxidation [60, 21, 61].
Biofiltration, a term coined for labeling attached-growth biological-treatment pro-cesses, uses microorganisms to biologically oxidize a portion of the ammonia nitrogenand the biodegradable organic matter in a waste stream. Retention of the microbe popu-lation is obtained by its attachment to the wetted or submerged surfaces of the biofiltermedium. Ammonia is oxidized by autotrophic bacteria callednitrifying bacteria. Bio-logically degradable organic compounds are oxidized by heterotrophic microorganisms(i.e., bacteria, protozoa, and micrometazoa). Typically, the autotrophic and heterotrophicmicrobes coexist on the media surface in the biofilter.
A wide range of biofilter types are used to treat dissolved wastes in aquaculture,but the most common include submerged filters, trickling filters, rotating biologicalcontactors, pressurized-bead filters, and fluidized-sand biofilters (Fig. 13.1). These unitsare discussed after microbial action in biofilters and biofilter media are reviewed.
13.3.1 Microbial Action
The oxidation of organic compounds and ammonia in static-bed biofilters does nottake place simultaneously, as it can in a suspended-growth treatment process (suchas activated sludge), but successively [14, 62]. If sufficient BOD is present, organiccompounds will be oxidized preferentially before ammonia is utilized as heterotrophicmicroorganisms outcompete autotrophic bacteria for space on the media at the inlet ofthe biofilter [63, 64, 62]. The larger heterotrophic microorganisms may also prey uponthe population of nitrifying bacteria [62] and the carbonaceous oxygen demand exertedby the heterotrophic organisms can limit the autotrophic nitrifiers located down-filter[13, 65, 63, 64].
Bacteria convert ammonia into nitrate in a two-step process callednitrification. Twodifferent groups of nitrifying bacteria, both believed to be obligate autotrophs (that is,they consume carbon dioxide as their primary carbon source) and obligate aerobes (which

Methods to Remove Ammonia 317
(a)
(b)
Figure 13.1. Biofilters used in aquaculture. (a) An upflowsubmerged filter with back-wash capabilities; (b) a trickling filter;(c) a rotating biological contactor; (d) a bead filter with propeller
wash; (e) a fluidized-sand biofilter;
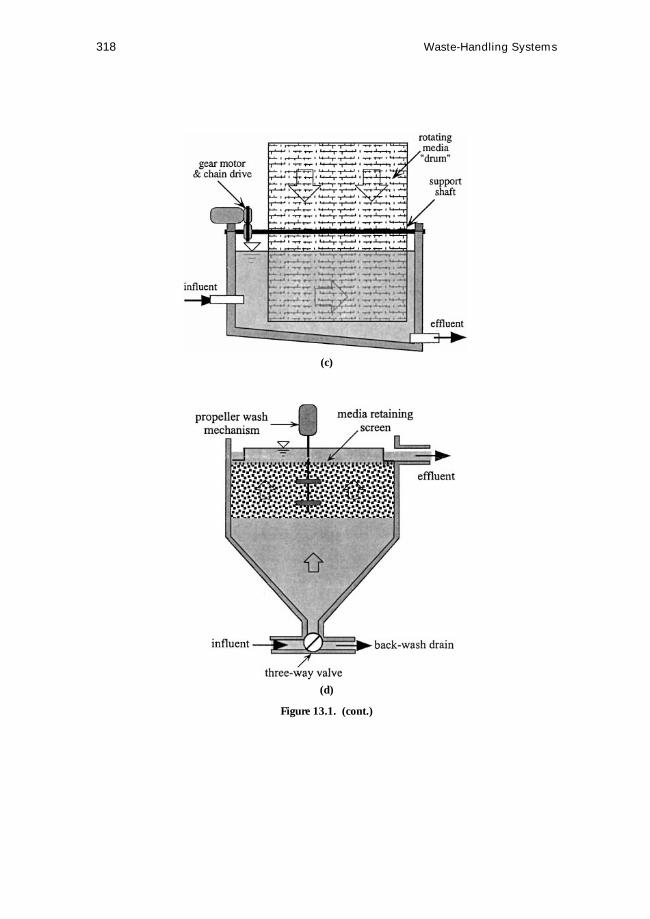
318 Waste-Handling Systems
(c)
(d)
Figure 13.1. (cont.)
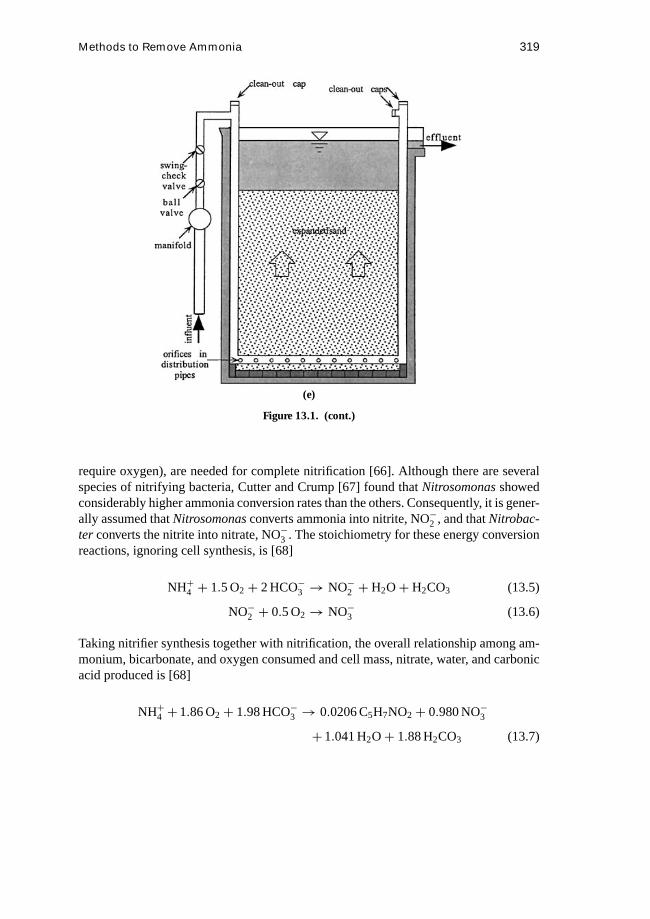
Methods to Remove Ammonia 319
(e)
Figure 13.1. (cont.)
require oxygen), are needed for complete nitrification [66]. Although there are severalspecies of nitrifying bacteria, Cutter and Crump [67] found thatNitrosomonasshowedconsiderably higher ammonia conversion rates than the others. Consequently, it is gener-ally assumed thatNitrosomonasconverts ammonia into nitrite, NO−2 , and thatNitrobac-ter converts the nitrite into nitrate, NO−3 . The stoichiometry for these energy conversionreactions, ignoring cell synthesis, is [68]
NH+4 + 1.5 O2+ 2 HCO−3 → NO−2 + H2O+ H2CO3 (13.5)
NO−2 + 0.5 O2→ NO−3 (13.6)
Taking nitrifier synthesis together with nitrification, the overall relationship among am-monium, bicarbonate, and oxygen consumed and cell mass, nitrate, water, and carbonicacid produced is [68]
NH+4 +1.86 O2+ 1.98 HCO−3 → 0.0206 C5H7NO2+ 0.980 NO−3
+1.041 H2O+ 1.88 H2CO3 (13.7)

320 Waste-Handling Systems
As given by the stoichiometry, nitrification and nitrifier synthesis requires consumptionof about 4 mg of oxygen and between 6.0 and 7.4 mg of alkalinity (as CaCO3) for everymg of ammonia as nitrogen converted to nitrate [68].
13.3.2 Media
The ammonia and organic oxidation capacity of biological filters is largely dependentupon the total surface area available for biological growth and the efficiency of the areautilization. Ideally, increasing the surface area of the media will result in a correspondingincrease in ammonia-removal capacity. The efficiency of nitrification per unit surfacearea is dependent upon the accessibility of the media surface, the mass-transfer rate intothe biofilm, the growth phase of the biofilm (lag, log, stationary, or death phase), andthe competition with heterotrophic microbes for space and oxygen [69, 70]. Nitrificationrates reported for different filter types range from 0.04 to 0.78 g total ammonium nitrogenremoved per day per square meter of surface area [71].
To work effectively in recycle systems, the media used in attached growth systemsmust have a relatively high specific surface area (i.e., surface per unit volume) and anappreciable voids ratio. The specific surface area is important, as it controls the amountof bacterial growth that can be supported in a unit volume. The voids ratio is criticalfor adequate hydraulic performance of the system. The voids ratio characterizes howmuch space is provided for the water to pass through the media in close contact with thebiofilm. In some cases (e.g., trickling filters and rotating biological contactors) the voidsmust also provide space for air ventilation so that oxygen can be transferred to the flowwithin the bed.
The media used in the biofilters must be inert, noncompressible, and not biologicallydegradable. Typically, relatively large structured or randomly packed media are used insubmerged filters, trickling filters, and rotating biological contactors. Randomly packedmedia can be sand, crushed rock or river gravel, or some form of plastic or ceramicmaterial shaped as small beads, or larger spheres, rings, or saddles. Structured mediacan be crossed stacks of redwood slats, or more commonly plastic blocks composed ofcorrugated plates or tubes. Pressurized-bead filters and fluidized-bed filters use a finelygraded plastic or sand media with average equivalent diameters generally from 1 to 3 mmand from 0.1 to 1.5 mm, respectively.
Biofilter start-up can take 4–12 weeks, depending on conditions. Biofilter function canbe impaired if a biofilter has too little oxygen or is overloaded with solids, biochemicaloxygen demand, or ammonia. Increased loading can reduce the capacity of the biofilter tocomplete the two-step bacterial conversion of ammonia to nitrate, because increasing theloading increases the competition for space and oxygen among heterotrophic organismsandNitrosomonasandNitrobacter. Nitrobacter require the nitrite produced byNitro-somonasand tend to be located towards the outlet end of the biofilter. If space and oxygenbecome limiting when loading is increased,Nitrobacterare generally the first to be dis-placed, as they are the last in the line of microbial consumers, butNitrosomonascan alsobe displaced or suffer from oxygen-limiting conditions. Conditions that cause a reduction
Methods to Remove Ammonia 321
in the relative amount ofNitrobactercompared withNitrosomonaswill cause the nitriteconcentration across the biofilter to increase, which can become toxic within the recir-culating system water. Two approaches have been applied (sometimes simultaneously)to counter the problem of insufficient ammonia and nitrite removal in large recirculatingsystems. Biofilters are sized with more available surface area for microbial treatment andwith consideration of oxygen requirements, so that the biofilter has both the space andoxygen capacity to handle higher organic and ammonia loading rates; and ozone is addedto the system to oxidize excess nitrite to nitrate (as discussed in the section on ozonation).
13.3.3 Submerged Filters
The submerged filter consists of a bed of media through which the wastewater passesin an upward (Fig. 13.1) or downward direction. The media is generally large (5–10 cmrock, or 2–5 cm random or structured plastic media) so as to provide large void spaces.Also, the upward (or submerged downward) flow allows control of the hydraulic deten-tion time.
The submerged filter also captures some of the biological solids [72, 73, 74]. Sub-merged filters may have problems that result from heavy loading of organic mattercoupled with improper solids flushing or underdrain design. Solids accumulate in staticfilter beds based on both physical and biological mechanisms. Physically, suspended orsettleable solids are entrapped within the filter voids because of settling, sieving, and in-terception. Biologically, cell mass is produced by the microbial metabolism of substrates(primarily organics and ammonia) passing through the filter, both on the surface of themedia and in the voids between the media. Cell mass resulting from nitrifying bacteria isdesirable. Cell mass resulting from heterotrophic organisms, although required to someextent, increases plugging problems in static-media filters. Therefore, conditions thatallow the filter to plug or to exhaust the dissolved oxygen that is available in the watermust be avoided.
The characteristics of the media in a static-media filter ultimately influence the re-moval of suspended, settleable, and dissolved organics as well as the head loss generatedand the success of flushing the filter. Media with sufficient voids for use in biofilters canbe random media such as uniform crushed rock over 5 cm (2 in) in diameter, or plasticmedia over 2.5 cm (1 in) in diameter, or structured media such as plates or tubes thathave large voids. Providing adequate flushing of solids from the filter is critical [73, 74].Solids sometimes have to be flushed from the submerged biofilter media voids daily byreversed-flow flushing and less often by air scour coupled with reversed-flow flushing.A drainable filter, a properly designed underdrain, a high velocity of a reversed flow ofwater, and a means for air scouring are all required for good solids flushing. Underdrainsmust provide a support for the media and force the water, during regular operation orduring flushing, to flow uniformly through the bed.
Two innovative modifications of submerged filters have been developed to reduce twocommon operational problems: low available dissolved oxygen and plugging problems.The operational problems can be alleviated with supplemental oxygenation and bubble

322 Waste-Handling Systems
aeration. Both modifications raise the level of available oxygen, and serve to break-up clogging to a variable extent. Vigorous aeration strips off thick growths of biofilm,thus helping to prevent biofilm growth from clogging the pores in the filter media [75].These aerated biofilters have been effectively used to maintain good water quality inrecirculating systems [71].
13.3.4 Trickling Filters
Trickling filters appear similar to the down-flow submerged biofilters, except that thewater level in the trickling filter vessel is kept below the media and the downflow keepsthe media wet but not submerged (Fig. 13.1). Because it is not submerged, air ventilatesthrough the wet media, carrying oxygen to the bacteria and providing opportunity forcarbon dioxide to strip.
Trickling filters have been used extensively in wastewater treatment throughout thetwentieth century. The most important reason for the popularity of the trickling filters istheir ease of operation, self-aerating action, and moderate capital cost. Modern tricklingfilters use plastic media because they are light and offer high specific surface areas (100–300 m2/m3) and void ratios of more than 90%. Trickling filters have been widely usedto remove dissolved wastes in recirculating systems [76, 61, 77], and a range of designcriteria has been reported: hydraulic-loading rates of 100 to 250 m/d, media depths of 1to 5 m, media specific surface area of 100 to 300 m2/m3, and ammonia-removal rates of0.1 to 0.9 g/m2/d.
As with most of the attached growth biofilters, trickling filters with high specificsurface areas can sometimes be less efficient than filters of lower specific surface areasbecause of channeling, regional plugging, or a hydraulic load that is not sufficient tomoisten all the area of the densely packed media.
13.3.5 Rotating Biological Contactors
Rotating biological contactors function by rotating honeycombed or corrugated disksor tubes on a shaft through a tank containing the wastewater. Rotation of the mediathrough the atmosphere provides oxygen transfer to the flow and the microbial film, whichhelps to maintain aerobic conditions for nitrification. Rotating biological contactors haveattracted attention because of their low head requirement, ability to maintain an aerobictreatment environment, and relatively low operating costs [78]. However, the capitalcost of rotating biological contactors is typically much more than that of trickling filters,submerged filters, or fluidized-sand biofilters.
Typical rotating biological contactors have disks submerged to 40% of the diameterand rotational speeds of 1.5 to 2 rpm [79]. Rotating biological contactors can treat smallflows, but they also scale to lengths of 8 m (25 ft) and total surface areas of approximately8400 m2 (85,000 ft2) to treat large flows [79]. Catastrophic failure of either the disks orthe shaft due to heavy biomass growth were major problems in early units [79]. However,most of the problems were mechanical and recent (properly designed) rotating biologicalcontactors have been more reliable.

Methods to Remove Ammonia 323
13.3.6 Pressurized-Bead Filters
The pressurized-bead filter passes flow upward through floating plastic beads (Fig.13.1). A screen at the top of the vessel prevents the beads from washing out. Operatingpressures are typically 35 to 100 kPa (5–15 psi).
The pressurized-bead filter has become a popular biofilter to treat small or moderateflows (less than 1000 L/min). It is modular, compact, and straightforward and effectivelyremoves ammonia if operated properly [80]. The pressurized-bead filter also effectivelyremoves solids from a flow and is sometimes used only for solids removal or as a hybridfilter that combines both nitrification and solids removal. The bead filter is typically eitherbubble-washed or propeller-washed during the backwash procedure, which ensures thattrapped solids are broken free from the beads.
Nitrifying bacteria and heterotrophic microorganisms grow on the floating plasticbeads, which are cylinders about 3 mm long, and in the void spaces surrounding thebeads. Because the pressurized-bead filter removes solids so effectively, large populationsof heterotrophic microorganisms can grow in the bead filter and must be periodicallyremoved with the trapped solids in order to maintain nitrification [81]. Too frequent andvigorous back-flushing, however, has been reported to remove to much of the nitrifyingbacteria, so it is important that frequency and intensity of back-flushing be controlledproperly [81]. Nitrification in pressurized-bead filters is still best when a majority of thesolids have already been removed from the flow.
13.3.7 Fluidized-Bed Biofilters
Fluidized-sand biofilters have been shown to be reliable [82] and especially cost-effective [83, 4, 5] units for treating dissolved waste in large-scale recycle productionsystems; they have also found wide application in industrial and municipal wastewatertreatment [84, 85, 86]. Understanding of the use of fluidized-sand biofilters to treatdissolved wastes within recirculating aquaculture systems has been improved as a resultof recent studies, as reviewed by Summerfelt and Wade [5].
Fluidized-sand beds operate by injecting an equal distribution of water across thebiofilter’s cross-section at the bottom of the granular bed. Water flows up through voidspaces between the granules in the bed. The bed expands, becoming fluidized, when thevelocity of water through the bed is sufficiently large to result in a pressure loss greaterthan the apparent weight (actual weight less buoyancy) per unit cross-sectional area of thebed. Sands have a specific gravity 2.65 times that of water (1.0); therefore, the headlossacross an expanded sand bed is about 0.9 to 1.0 m of water head for every 1.0 m of initiallystatic sand depth (Summerfelt and Cleasby, 1996). Once the bed has been fluidized, thepressure drop across the bed remains constant at all bed expansions. During fluidization,the relative amount of bed expansion is dependent upon the media’s shape (i.e., sphericity)and diameter, and the superficial velocity and temperature of the water [87].
Size grades of filter sand are available commercially and are usually specified bya sand’s effective size (D10= the sieve-opening size that will pass only the smallest10%, by weight, of the granular sample) and uniformity coefficient (UC=a quantitative
324 Waste-Handling Systems
measure of the variation in particle size of a given media, defined as the ratio of D60
to D10). The D10, an estimate of the smallest sand in the sample, is the sand that willexpand the most at a given velocity. The D90, an estimate of the sieve size that will retainonly the largest 10% of sand in the sample, is the sand fraction that will expand the leastat a given velocity. The D90 can be estimated from the effective size and the uniformitycoefficient [88]
D90 = D10 · (101.67·log(UC)) (13.8)
Fluidized-sand biofilters in aquaculture typically use an extremely hard, whole-graincrystalline silica sand, which is finely graded and has a mean effective diameter of 0.2to 1.0 mm and a uniformity coefficient between 1.3 to 1.8. Fluidized-sand biofilters areoften operated at expansions of 20% to 100% (based on clean sand). Biofilm developmentincreases bed expansion. Because sands are not perfectly uniform, larger sands moveto the bottom of the fluidized beds, where they expand less than the smaller sands thathave migrated to the top of the bed. The average expansion of a bed at a given velocitydepends upon the size gradation within the bed (i.e., uniformity coefficient), which makesit important to predict expansion of both the largest and smallest fractions of sand [89].In particular, the largest fraction of sand must expand at the velocity selected.
Filter sand is inexpensive ($40 to $70/m3) and has a high specific surface area (4000to 45,000 m2 surface area per cubic meter of volume), which reduces the cost per unit ofsurface area ($0.02 to $0.001 per square meter surface area) and makes fluidized-sandbiofilters compact (Table 13.2). The low cost and high density of sand surface area makesit relatively inexpensive to build fluidized-sand biofilters with excess surface area and,thus, excess nitrification capacity.
The design of the flow-distribution mechanism is most critical for reliable operationof fluidized-sand biofilters. The flow-distribution system must deliver an equal amountof flow across the base of the bed, prevent loss of media, operate without detrimentalfouling (or have a fouling prevention system) and, in some cases, support the bed. Thereare a wide variety of distribution mechanisms used to inject water into the bottom oflarge fluidized-sand biological filters. Each mechanism differs in how flow is transportedand distributed. However, most mechanisms used in recirculating aquaculture systemstransport the flow through a manifold, starting at the top of the biofilter, that runs downthe inside of the reactor to the base of the sand [87]. Summerfelt et al. [82] describe onemethod for designing flow distribution mechanisms for large-scale fluidized-sand beds.
Because of practical considerations based on biofilter geometry, pressure drop, andreactor oxygen demand, the depth of sand in aerobic fluidized-sand biofilters is gen-erally designed to be 1 to 2 m, unexpanded. The total head pressure required acrossa commercial-scale fluidized-sand biofilter is moderate (generally 3.5–7.0 m of waterhead [5–10 psi], depending upon the height of the biofilter).
Nitrification rates and biofilter bed maintenance requirements are both dependentupon the sand size, water temperature, and ammonia and organic loading rates. Ni-trification rates reported range from 0.2 to 0.4 kg/d ammonia per cubic meter of ex-panded bed volume in cold-water systems [90] to 0.6 and 0.8 kg per day per cubicmeter expanded bed volume in warm-water systems [80, 91]. The nitrification rates

Methods to Remove Ammonia 325
Table 13.2. Relative characteristics of two fluidized-sand biofilters constructed at different farmscompared with a hypothetical plastic media trickling filter
Fluidized-sand Fluidized-sand Plastic MediaBiofilter #1 Biofilter #2 Trickling Fliter
Flow capacity (L/min) 1520 2280 2000Media size, sand size = D10 (mm) 0.24 0.24 25Media specific surface area (m2/m3) 11,300 11,300 180Hydraulic loading rate (cm/s) 1.0 1.0 0.17a
Media depth (m) 1.00b 0.76b 2.5a
Design TAN removal rate (g/d/m2 surface area) 0.06c 0.06c 0.2c
Design feed loadd (kg/day) 58 64 59Fiberglass vessel ID× height (m×m) 1.8× 3.7 2.1× 3.0 5.0× 3.0Media volume (m3) 2.5 2.7 49.0Media cost per unit volume including
shippping ($/m3) 150 153e 420Cost of media ($) 380 415e 20,600Cost of fiberglass vessel w/shipping ($) 3100 2360e 6300Cost of pipe laterals, manifold, valves, fittings,
support frame, and bricks ($) 1500 1685e 400Cost of assembly ($) 1100 1085 700Total biofilter cost ($) 6080 5545e 28,000 f
Source: Summerfelt and Wade [5].a The design criteria for the tickling biofilter were taken from Nijhof (1995).b The depth of clean sand when unfluidized.c As a safety margin for a commercial system, the design total ammonia nitrogen (TAN) removal rate
listed here is at least 50% lower than the nitrification rate for (1) fluidized-sand biofilters as measuredduring research at the Freshwater Institute (unpublished data) and (2) trickling biofilters as extrapolatedfrom data reported by Nijhof (1995).
d Assuming that 0.03 kg TAN are produced per 1.0 kg of feed fed.e Costs were provided by Robert Freeman (Glacier Springs Fish Farm, Gunton, Manitoba, personal
communication).f This biofilter was not constructed and these costs are best estimates.
in cold-water and warm-water systems compare favorably if compensations are madefor the differences in reaction rate owing to temperature. Sand size also influencesbiofilm growth and bed management [90]. The optimum effective sand size (D10) isabout 0.2 to 0.25 mm for cold-water systems, about 15◦C [90], and about 0.5 to 0.7 mm(20–40 mesh sand to 16–30 mesh sand) for warm-water systems, about 25◦C to 30◦C[92, 91].
Plastic pellets can also be used to make fluidized-bed biofilters [93, 94]. These pelletstypically come from the plastic molding industry and can be obtained from suppliers ofbulk plastics. The pellets are roughly spherical or cylindrical, and range in size from 1 to3 mm. Plastic pellets can be used unmodified, although surface-modified pellets are avail-able. Plastic pellets can be purchased in different molecular formulations, or in formula-tions containing a heavy filler such as silica. Such pellets will have a specific gravity equalto, just greater than, or just less than 1.0. Using plastic beads having a specific gravitygreater than or less than water allows for either up-flow expanded (specific gravity>1) or

326 Waste-Handling Systems
down-flow expanded (specific gravity<1) beds. Compared with fluidized-sand biofil-ters, fluidized-plastic bead filters have lower headloss (<7 kPa [<1 psi]) and lowerrequirements for expansion velocity and for delivering oxygen due to their lower spe-cific surface area.
13.3.8 Biofilter Comparison
Each of the different biofilters has advantages and disadvantages that can affect its use.For example, trickling filters and rotating biological contactors have the advantage thatthey both aerate the flow during treatment, which strips some carbon dioxide and ensuresthat aerobic conditions are maintained for nitrification. Submerged filters (without aer-ation), fluidized-bed biofilters, and pressurized-bead biofilters do not provide aeration,and the only available oxygen for biofilter respiration is carried in the influent flow.
The pressurized-bead filter, if operated under the right conditions, has the advantage offiltering solids from the flow at the same time ammonia is removed [80]. However, storingsolids in any biofilter may not be desired (as discussed previously). And, nitrification canbe reduced by back-flushing pressurized-bead filters too frequently or vigorously [81].
An advantage of fluidized-bed biofilters is that they trap and store few solids relativeto submerged static media biofilters, such as large media biofilters and pressurized sandor bead filters. Additionally, biosolids within fluidized-sand biofilters can be managed byselection of sand size or by more frequent sand replacement, so that about 50% (some-times more) of the biofilter’s oxygen demand goes towards nitrification [90; unpublisheddata, Michael Timmons, Cornell University, Ithaca, NY, personal communication].
Use of low–surface area media is a disadvantage in rotating biological contactors,trickling filters, and submerged filters because it results in larger and typically more costlybiofilters. Conversely, pressurized-bead biofilters and fluidized-bed biofilters use smallgranular media with high surface areas, which allows the use of smaller and sometimesless costly biofilters to treat the same flow (compared with rotating biological contactors,trickling filters, and submerged filters). It is critical not to cut back media surface area onbiofilters to reduce their cost and space requirements; biofilters with insufficient surfacearea to meet the ammonia removal demands will produce nitrite and fail often.
Trickling filters, rotating biological contactors, submerged biofilters, and fluidized-bed biofilters have been scaled to treat very large flows (>4000 L/min). On the otherhand, the pressurized-bead filter is typically not been scaled to treat more 1000 L/min,although a unit to treat between 1000 and 2000 L/min has been reported [95]. Becauseof the relatively low cost of filter sand, the fluidized-sand biofilter scales up especiallycost-effectively to treat very large flows [4].
The two lowest-cost and most reliable biofilters for treating large flows (>4000 L/min)may arguably be the fluidized-sand biofilter and the trickling filter. However, becauseof the lower cost and higher surface area of sand, fluidized-sand biofilters are aboutone fifth the cost of plastic media trickling or submerged biofilters [5]. And, althoughfluidized-sand biofilters do not aerate, as is the case with trickling filters, the likelihood ofoxygen limitations within fluidized-sand biofilters is reduced because of their relativelylarge hydraulic loading rate, short hydraulic retention time, and efficient use of oxygenfor ammonia removal.

Methods to Remove Solids 327
13.4 Methods to Remove Solids
Solids influence the efficiency of all the other component functions as well as thepotential for disease within recirculating systems [23]. Therefore, solids removal isoften considered the most critical process to manage in recirculating aquaculture systems.Ideally, solids should be removed from the system as soon as possible and with a minimumexposure to turbulence, mechanical shear, or microbiological degradation.
Waste solids can be removed from aquaculture flows by either settling within therearing tank or through the use of a solids removal unit following the rearing tank.Several unit process options are available for removing waste solids from aquacultureflows: settling basins, granular media filters, microscreen filters, and flotation or foamfractionation. Solids removal can also be enhanced by ozone addition [123].
13.4.1 Settling Basins
In sedimentation, particles having a specific gravity greater than the surroundingwater settle out and are removed from the water column. As clarified water passes outof the basin the settled particles collect and form a sludge blanket on the bottom of thebasin. Settling basins are typically designed with hydraulics that minimize turbulence andprovide time for interception of the particle with the bottom of the clarifier (Fig. 13.2).
Unthickened solids in aquaculture usually settle as discrete particles [96]; that is, theydo not change in size, shape, or density and thus settle at a constant rate. The settlingvelocity of very small discrete particles can be modeled by Stoke’s law:
νp = g · (ρp − ρL ) · D2
18 · µL(13.9)
in which vp is the settling velocity,ρp is the particle density,D is the diameter of theparticle,ρ is the water density,µ is viscosity of the water, andg is acceleration due to
(a)
Figure 13.2. Sedimentation units can be (a) a settling basin, (b) a swirl separator, or (c) a plate settler.

328 Waste-Handling Systems
(b)
(c)
Figure 13.2. (cont.)

Methods to Remove Solids 329
gravity. Stoke’s law holds only if the settling velocity of the particle is in the laminarregion. Intact feces of rainbow trout settle at 1 to 2.5 m/min, depending upon fish size,which is relatively fast [97].
Once the characteristic settling velocity is known, the removal of discrete particulatesuspended matter in an ideal settling basin can be related to its flow rate and the horizontalplan area of the tank [98]. Fish-farm settling basins are designed using at least one (ormore) of the following criteria: overflow rate (vo), hydraulic retention time (τ ), and/ormean fluid velocity (v).
vo = Q/Ah (13.10)
τ = V/Q (13.11)
v = L/τ = Q/Acs (13.12)
in which Q is the volumetric flow rate of water andV , L, Ah, andAcs are the settlingbasin volume, length, surface area, and cross-sectional area, respectively.
Overflow rates reported are less than 5 m3/m2/h [13], 1.7 m3/m2/h [102], 2.4 m3/m2/h[97], and 1.7 to 3.3 m3/m2/h [99, 100]. Hydraulic retention times measured at sixteencommercial fish farms averaged 30 to 40 min [101] and others recommended designingsettling ponds with a theoretical hydraulic retention time of at least 15 to 30 min [13,102, 103]. Henderson and Bromage [101] recommended that mean fluid velocities acrosssettling ponds should be less than 4 m/min, and if possible less than 1 m/min; Warren-Hansen [97] recommend mean fluid velocities of less than 1.2 to 2.4 m/min.
The geometry of settling basins should be designed to promote plug flow and reduceshort circuiting of flow; therefore, settling pond length-to-width ratios should be greaterthan 4:1 to 8:1 [104]. Liao and Mayo [13] recommended that settling basins be designedwith at least 1 m water depth.
Unfortunately, dissolution of nutrients and the resuspension of solids settled andcollected on the bottom of settling basins can reduce the expected performance of theseclarifiers [57]. Henderson and Bromage [101] estimated that settling ponds could capturean estimated 97% of their solids loading if resuspension of settled solids was not a factor.However, due to resuspension of settleable solids, they report that settling ponds do noteffectively remove solids if inlet concentrations of solids are less than 10 mg/L and thatattaining effluent concentrations of less than 6 mg/L is difficult.
Two variations on the principle of clarification by sedimentation have been used in anattempt to increase the efficiency of solids removal (Fig. 13.2): hydrocylcones and tubeor plate settlers.
Swirl SeparatorSwirl separators (Fig. 13.2) are also calledtea-cup settlersandhydrocyclonesand
operate by injecting the water at the outer radius of a conical tank so that the waterspins around the tank’s center axis [105]. The spinning creates a centrifugal force (radialacceleration) that moves the larger or denser particulates towards the wall where theysettle and can be removed. The strong primary rotating flow also creates a secondary radial

330 Waste-Handling Systems
flow that moves along the bottom towards the tank center. To obtain strong centrifugalforces in wastewater treatment applications, water must be injected into hydrocyclonesat high velocities, and this can result in high pressure losses. Hydrocyclones have beenused primarily for treating municipal or industrial wastewater flows that contain particlesof high specific gravity; for example, sand and grit have a specific gravity 2.65 times thatof water. In aquaculture, however, swirl separators are used in low-head applicationsto concentrate solids in a smaller underflow (5%–10% of total flow) [97, 106, 107,108, 53, 109, 110]. Compared with the removal efficiencies for sand and grit, the swirlseparator is less effective in aquaculture applications because of the low specific gravityof aquaculture solids. However, with an upper and a lower drain, swirl separators do notstore the solids in the flow, which is an advantage over a settling basin.
Tube or Plate SettlersTube or plate settlers consist of a sequence of inclined tubes or plates that are stacked
several inches apart (Fig. 13.2). Use of tube or plate settlers increases the effective settlingarea per unit volume and reduces the depth to which a particle must settle to contact asurface [111, 112]. These settlers have been used to increase solids removal (particularlywhen space is limited) in the drinking-water treatment industry [113], and occasionallyin the wastewater-treatment industry [111] and in aquaculture facilities [114, 97, 115].Tube or plate settlers effectively remove solids from aquaculture systems; however,they are relatively expensive, and the periodic backwashing of the solids from the unitrequires labor and results in lost water (sometimes a problem in warm-water recirculatingsystems).
13.4.2 Microscreen Filters
Microscreen filters are sieves. They strain water-bound particles larger than the filter-screen (mesh) openings. A cleaning mechanism is necessary to remove solids from thefilter. Depending on the type of microscreen filter, the filter is cleaned by either hydraulicflushing, pneumatic suction, mechanical vibration, or raking. Cleaning of the sieve canoccur continuously, periodically, or on demand. The drum (Fig. 13.3), Triangel, and diskmicroscreen filters are the three main variations used. Microscreen filters are now usedby many fish farms to remove solids from aquaculture influents [116], effluents [108,53, 103, 117, 118, 109, 119, 120, 57], and from the flows in water-reuse systems [115,121, 58, 48, 122, 123]. Microscreen filters also require little space, have a high hydrauliccapacity and an acceptable pressure drop, and are relatively easy to install.
Microscreen filters are especially attractive when used to remove solids from largeflows due to economies of scale [4]. Also, microscreen filters backwash several hundredto several thousand times daily [115, 121], which makes them one of the few devicesthat do not store the solids removed within the flow. Frequent backwashing comes withan operating cost, a pressure-wash system (400–700 kPa [60–100 psi]) that requiresmaintenance and that produces a sludge water volume of between 0.2% and 2% ofthe total passing flow [124, 121]. In warm-water recirculating aquaculture systems,the cost of heating make-up water can be relatively high [125], and replacing water

Methods to Remove Solids 331
Figure 13.3. Functional mechanism of a drum filter (courtesy of Hydro Tech). Arrowsindicate the path taken by the treated flow and the filterable solids as they pass
through the unit.
lost from the system during filter backwash may become cost-prohibitive. Bergheimand Forsberg [124] reported using a vacuum to suck solids from the microscreens andreduced sludge water production by 50- to 100-fold compared with a typical pressurizedwashing mechanism.
The performance of a microscreen filter is largely dependent on the size of the micro-screen panel openings, influencing the unit’s hydraulic capacity, the fraction of particlesremoved, the sludge-water production rate and concentration, and the filter-wash fre-quency [121, 119, 120]. Finer openings remove more solids; however, selection of theminimum opening size through the microscreen is a compromise between treatment re-quirements and operational factors, such as hydraulic loading and backwash requirements[121, 119]. Summerfelt et al. [121] demonstrated that microscreen filters with panelscontaining 60-µm openings removed more TSS but also required much more frequentwashings than filter panels having 110- and 200-µm openings. This study showed thatfiner microscreen openings increased backwash frequency nearly four-fold, produced tentimes more backwash volume, and reduced the concentration of TSS in the backwashabout 3.5-fold. The optimum microscreen opening size may be situation-specific, but mi-croscreen panel openings of 60 to 100 and 80 to 110µm have been recommended by Kellyet al. [120] and Summerfelt et al. [121], respectively, and the majority of panel openingssizes that have been reported are in this range: 55 to 80µm [103], 60µm [117], 60µm[118], 60µm [124], 60µm [109], 65µm [108], 80µm [58], 80µm [48], and 80µm [123].

332 Waste-Handling Systems
The majority of particles by mass discharged from a single-pass system are larger than30 to 40µm and can be removed by microscreen filtration [124, 118, 119]. Microscreenfilters can also remove more than half of the solids concentration approaching the filterunit in recirculating fish-culture systems [48, 123], which amounts to more than 97% ofthe solids discharged from the system within the filter-backwash water.
Sizing of the microscreen filter unit is ultimately based on the system flow rate, fishloading, characteristics of the waste solids to be removed, and the desired microscreenopening size. Unfortunately, the aquacultural engineering literature does not provide aprecise method for sizing microscreen filters, and selection of filter units must be basedlargely on discussions with commercial distributors or those with microscreen filterexperience.
13.4.3 Granular Media Filters
Solids removal in granular media filters occurs if particles are smaller than the poreopenings at the granular media surface, or are too weak to sustain the hydraulic shear atthe pore entrance, and pass into the void spaces occurring within the granular media bed.Once within the bed the particles can be removed by straining, sedimentation, absorption,or chemical bridging mechanisms. Periodically, the granular media bed must be flushedof entrapped particles, which involves backwashing with water, possibly supplementedwith a prior air wash.
Granular media filters include sand filters, plastic-bead filters, and diatomaceous earthfilters. Plastic-bead filters are widely used in recirculating aquaculture systems to removeammonia and/or solids from relatively small flows (< 1000–2000 L/min).
Granular media filters are commonly used in drinking-water treatment plants and fol-lowing the secondary clarifiers in wastewater treatment. Depth filtration is used in somefish hatcheries for reducing the entry of pathogens and often follows a chemical oxidationprocess used for disinfection [126]. In addition, large gravity sand filters (Fig. 13.4) areused to treat aquaculture effluents before they are discharged [53, 57]. If strict effluentdischarge limits are imposed, the improved and more consistent solids-removal potentialthat can be achieved with granular media filters may make them obligatory to removetotal phosphorus levels from fish farm discharges. However, granular media filters area technology of last resort in aquaculture because they require a complex backwashmechanism and have relatively larger capital and operating costs per unit of flow treated.
13.4.4 Dissolved Air Flotation and Foam Fractionation
Flotation and foam fractionation are two options for removing solids. Flotation can beused as an alternative to sedimentation for removal of biosolids, grease, hydrocarbons,protein, fibers, and algae [127, 128]. In this process, the solids attach to air bubbles, floatto the surface, become concentrated, and are removed. The fine bubbles, when attachedto a solid particle, increase the density difference between the biosolid and water (bychanging the particle’s specific gravity from just over 1.0 to conserably<1.0). Flotationcan produce a greater density difference between the water and rising air-entrained

Methods to Remove Solids 333
Figure 13.4. Illustration of a gravity sand filter.
sludge than what is obtained between water and sinking biosolids, which makes flotationpromising.
There are three basic mechanisms used to produce bubbles for flotation: dispersed air,dissolved gas, and electrolytic flotation. The primary difference among the three flotationmechanisms is the bubble diameter produced; systems using dispersed air (often calledfoam fractionation) generate bubbles larger than 100µm; and systems using eithersupersaturations of dissolved gas or electrolytic cleavage of water can precipitate bubblesin the 10- to 100-µm size range and are calleddissolved air flotation[129]. The flotationof solids is highly dependent upon the bubble diameter, solids concentration, air-to-waterratio, surface chemistry of the solids, and surfactant concentration in the water [130].Chemical addition (a strong oxidant such as ozone, or a salt or polymers) can aid in theformation of a cohesive froth to improve the quality of the treated water. Dispersed airflotation removes mostly particles smaller than 30µm [131], which are the fine particlesthat the more standard solids-removal processes miss.
Clarification of solids with foam fractionation has been demonstrated in recirculatingaquaculture systems using dispersed air [132, 131, 133, 23, 134, 135] and with a dispersedozonated-air mix [136, 137, 138, 139]. However, because foam fractionation does notremove many of the particles greater than 30µm, it is usually used in parallel with asettling tank or filter.
13.4.5 Ozonation
Dissolved organic matter, including refractory compounds, and fine particulate organicmatter that accumulates in recirculating systems can be removed by increasing the dailywater-exchange rates or by introducing oxidizing agents. To avoid high water-exchange
334 Waste-Handling Systems
rates, ozone is added to some recirculating systems in order to improve water qual-ity. Ozone and its reaction by-products are capable of oxidizing a great many organicsubstances [140, 141]. Ozone also has a rapid reaction rate and produces few harmfulreaction by-products (in freshwater), and oxygen is produced as a reaction end-product.However, ozone is toxic to both humans and aquatic organisms and must be used withcare.
Ozone breaks refractory and relatively nonbiodegradable organic compounds intosmaller, more biodegradable compounds [142] and precipitates dissolved organic molec-ules and microflocculating fine particulate matter [143]. Ozone’s action on fine particulatematter improves its removal by settling, filtration, or flotation, as discussed by Summerfeltet al. [123] and Summerfelt and Hochheimer [144].
Ozone is also added to recirculating systems to improve nitrite removal and to reducefish disease by improving water quality (which reduces or eliminates environmentalsources of stress) and disinfecting the water. Although ozone can cause large reductionsin microorganisms, the rapid reaction of ozone with nitrite and organic matter can, inpractice, limit its effective disinfecting power (i.e., the disinfecting power is a functionof the product of ozone residual concentration multiplied by its contact time). Therefore,achieving large microbial reductions in recirculating systems requires much greaterozone dosages than are required for water quality control alone and requires much higherozone dosages than are typically required for disinfecting single-pass inflows [145a, 144].
13.4.6 Discussion of Solids-Removal Options
Traditionally, settling basins have been the most prevalent unit process used to removesolids from aquaculture effluents, if an effluent treatment unit has been used at all [145b].Sedimentation has been an attractive effluent-treatment process because it is simple,requires little maintenance or water head, and has a moderate cost. On the other hand,treating large-volume aquaculture discharges with settling ponds requires a considerableamount of flat area (much more space than the other treatment units require), and,due to dissolution and resuspension of solids, settling basins are not as effective inachieving effluent TSS concentration of less than 6 mg/L [101]. Therefore, effluenttreatment with settling basins may not meet strict regulations on the discharge of TSS.Nor is sedimentation an ideal method for removing suspended solids encountered inrecirculating aquaculture systems. For these reasons, and to avoid storing solids in theflow, there has been a definite trend towards use of microscreen filters for rapid solidsremoval from aquaculture effluents [53, 57].
Ozonation and foam fractionation are two processes that are commonly added tosupplement solids removal in recirculating systems.
13.5 Methods to Dispose of Solids
The settleable fraction of solids from clarifier backwash often is concentrated withinsettling basins [102, 145, 124, 117]. Thickening occurs in the bottom of the settling basinto solids concentrations of about 5% to 10%. Other sludge-thickening methods are sand

Methods to Remove Dissolved and Colloidal Organic Matter 335
and wedgewire beds, filter presses, centrifuges, vacuum filters, and reed beds [146, 147,148, 149].
Biosolids removed from aquaculture effluents are a residual product of wastewatertreatment; therefore, many governments classify and regulate aquaculture solids as anindustrial or municipal waste [7]. Other locations, however, consider aquaculture solidsto be an agricultural waste, because these solids are composed of fish manure and uneatenfeed and are considered a nontoxic nutrient source [7].
There are at least four options for beneficial reuse and disposal of the biosolidsproduced from an aquaculture facility [147, 150, 148, 149]: agricultural application,composting, vermiculture, and reed drying beds.
Land application of manure and other organic wastes (including wastewater) to fer-tilize agricultural crops is governed in most states by guidelines or regulations that limitthe amount of pathogens, heavy metals, and other contaminants, nutrient-content, soiltype, and plant nutrient-uptake characteristics to prevent run-off or groundwater contam-ination [151, 147, 7]. Applying the waste solids to on-site agricultural fields is almostalways the cheapest method of solids disposal if adequate agricultural land is availableon-site [150, 57].
Composting uses thermophilic bacteria to stabilize waste solids while producing avaluable soil amendment [150, 149]. Aerated static piles are the most common methodused to compost biosolids [150, 149].
Vermiculture is an alternative for disposing of waste solids that uses earthworms(brandling or red worms) rather than bacteria to stabilize sludge [150, 149]. Sludgeorganics pass through the worm gut and emerge as dry, virtually odorless castings.Impetus exists for vermiculture, because there can be a substantially greater market forworm castings than for standard compost.
Wetlands planted on underdrained sand drying beds have been used at wastewaterfacilities for more than 20 years to dewater and stabilize sludges [152, 150, 149] and havebeen used to dewater and stabilize the biosolids from an aquaculture clarifier–backwasheffluent [153]. Invervals between sludge addition allow for dewatering, drying, andstabilization of solids. Stabilized sludge is stored in these wetlands for as long as 10 years.
Hauling the collected sludge to the landfill is the most expensive alternative for sludgedisposal. However, landfill disposal of waste aquaculture biosolids may be required instates in which they are classified as an industrial waste or when there are no otherdisposal options available.
13.6 Methods to Remove Dissolved and Colloidal Organic Matter
Dissolved organic matter (mostly nonbiodegradable) and color (i.e., refractory organicmolecules) can become a problem in recirculating systems, if low water-exchange ratesallow elevated levels to accumulate [142, 154].
There are three unit processes for reducing dissolved organic matter and color: ozona-tion, foam fractionation, and activated carbon adsorption. Activated carbon adsorptionis not often used for treating color in large aquaculture production farms because of

336 Waste-Handling Systems
its relatively high cost. Use of activated carbon adsorption in industrial and municipalwater and wastewater treatment industries has been described by many environmentalengineering texts (Montgomery [130] and Metcalf and Eddy [147] to name a few).
13.7 Methods to Remove Carbon Dioxide
Accumulation of high levels of carbon dioxide can become a limiting toxicity factorwith high fish densities and inadequate water exchange, that is, with high fish loadings[155, 156]. Carbon dioxide toxicity is more likely to occur in intensive aquaculturesystems that inject pure oxygen because oxygen-injection processes use insufficient gasexchange to strip carbon dioxide [157]. Additionally, more carbon dioxide is usuallyproduced in systems that inject pure oxygen because these systems have the oxygento support higher fish loading rates. If aeration is used to supply oxygen to aquaculturesystems, fish-loading levels are lower than can be obtained with pure oxygen, and enoughair–water contact is generally provided to keep carbon dioxide from accumulating to toxiclevels [59].
High levels of carbon dioxide can be reduced by stripping during aeration or byneutralization produced by alkaline addition.
13.7.1 Air Stripping
Air stripping and aeration are mass-transfer processes that occur together if water iscontacted with air to bring its concentration of dissolved gases (such as nitrogen, carbondioxide, and oxygen) into equilibrium with the partial pressures of these gases in thesurrounding atmosphere.
If water is in contact with the atmosphere, the equilibrium concentration of carbondioxide in water will depend on the amount of carbon dioxide in the air. At standard tem-perature and pressure, air contains about 0.032% carbon dioxide by volume (320 ppm),[158]—a mole fraction of about 0.00032 and a partial pressure of 0.00032 atm. Henry’slaw can be assumed to predict gas–liquid equilibrium because, for dilute solutions, thegas–liquid equilibrium relationship is linear. Henry’s constant for carbon dioxide de-creases with increasing temperature according to [159]:
KH = 10(6.73− 1042T ), (13.13)
whereT is temperature in degreesK .Water in contact with the atmosphere, therefore, would normally have an equilibrium
concentration of 10−5 mol carbon dioxide per liter—about 0.5 mg/L at 20◦C.The rate of mass transfer (J), as defined by Fick’s Law, is equal to the product of the
overall mass-transfer coefficient (KL ), the total interfacial contact area per unit systemvolume (a), and the concentration gradient [160]:
J = KL ·a · (X − Xeq) (13.14)
The concentration gradient is the driving force for mass transfer; that is, the rate of carbondioxide stripping is greatest when the mole fraction of carbon dioxide in the water (X)is much greater than the carbon dioxide saturation mole fraction (Xeq).
Methods to Remove Carbon Dioxide 337
Oxygen and carbon dioxide can be transferred to or from water with any nonclosedaeration system [155, 161, 162]. However, enormous quantities of air are required toachieve substantial carbon-dioxide transfer rates when compared with the airflow ratesrequired for oxygen transfer alone. Therefore, aeration/stripping units that pass waterthrough air are typically used to remove carbon dioxide, because in these units it is easierto provide the larger ratio of air to water volume needed for carbon-dioxide exchange [45].
The obvious way to let water fall through air is by a gravity drop, which can be overa weir, onto a splash board, through plastic media or stacked splash screens, down aninclined corrugated sheet (with or without holes), or down a stair-stepped surface. Graceand Piedrahita [163, 164] and Summerfelt [74] have reviewed and reported models andcriteria that can be used to estimate carbon dioxide stripper performance and to designcarbon-dioxide strippers for aquaculture systems. The general criteria for air stripping inforced ventilation columns are: a hydraulic fall of 1 to 1.5 m, a hydraulic loading of 1.0 to1.4 m3/min/m2, and a volumetric air : water ratio of 6 : 1 to 10 : 1. High porosity packingor splash screens are needed to avoid flooding or gas hold-up. If high solids loadings areexpected, a stripping tower with screens or media that resist biofouling should be used.
13.7.2 Chemical Addition
Alkalinity and pH play an important role in aquaculture. The pH of water controlsacid/base chemistry, and alkalinity is a measure of the acid neutralizing capacity of thewater. Alkalinity depends on the concentrations of the bicarbonate, carbonate, hydroxide,and hydrogen ions:
Alk
50,000= [HCO−3
]+ 2[CO=3
]+ [OH−] − [H+] (13.15)
Alkalinity is not a function of carbon dioxide, so alkalinity does not change whencarbon dioxide is produced or removed. In recirculating systems, an alkalinity of at least100 mg/L as calcium carbonate is recommended to maintain nitrification and reducerapid swings in pH [80].
The influence of pH on the equilibrium of the carbonic acid and ammonia systems isimportant in aquaculture because ammonia (un-ionized) and carbon dioxide are muchmore toxic to aquatic organisms than ammonium and other species in the carbonic-acidsystem.
Dissolved carbon dioxide can combine with water in a hydrolysis reaction to formcarbonic acid (Table 13.3). The equilibrium relationship that describes the hydrolysis ofcarbon dioxide indicates that there is about 633 times as much carbon dioxide in wateras carbonic acid under equilibrium conditions.
The equilibrium alkalinity and carbon dioxide concentrations are related according to:
Alk
50,000= [CO2] ·
(K0K1
[H+]+ K0K1K2
[H+]2
)+ Kw
[H+]+ [H+]; (13.16)
where the equilibrium constantsK0 andK1 are defined in Table 13.3.The equilibrium concentration of carbon dioxide in water can be estimated from
alkalinity and pH using Eq. (13.16).

338 Waste-Handling Systems
Table 13.3. Equilibrium relationships and constants in the inorganic carbon system
Equilibrium Reactions Equilibrium Relationship Equilibrium Constant
CO2 (aq)+H2O(l)⇔ H2CO3 (aq) K0 = [H2CO3][CO2] 1.58× 10⁻³@25◦C
H2CO3 (aq)⇔ H+ (aq)+HCO−3 (aq) K1 =[H+][HCO−3 ]
[H2CO3] 2.56× 10⁻⁴ mol/L@20◦Ca
HCO−3 (aq)⇔ H+ (aq)+ CO=3 (aq) K2 =[H+][CO=3 ]
[HCO−3 ]4.20× 10⁻¹¹ mol/L@20◦Ca
H2O (l) = H+ (aq)+OH− (aq) Kw = [H+][OH−] 0.68× 10⁻¹⁴ mol2/L2@20◦Ca
a Larson and Buswell [166].
Figure 13.5. Percentage of carbon dioxide and ammonia as afunction of pH at 25◦C (after Summerfelt, [122]).
The range of pH values at which ammonia and carbon dioxide coexist indicates thatthe smallest fractions of both carbon dioxide and ammonia coexist at a pH of 7.5 to 8.2(Fig. 13.5). Changing the system pH only one unit changes the corresponding equilibriumcarbon dioxide or ammonia concentration ten-fold. Chemical treatment can be used tomaintain a pH that will minimize the potentially toxic effects of ammonia and carbondioxide in fish-culture systems. The treatment process consists of adding a supplementalsource of alkalinity such as lime, caustic soda, soda ash, or sodium bicarbonate to thewater [165]. Lime, caustic soda, and soda ash react with carbon dioxide to producebicarbonate alkalinity and increase the pH of the water. Adding sodium bicarbonate issimply a source of bicarbonate alkalinity and a means to increase pH.

References 339
References
1. Phillips, M. J., M. C. M. Beveridge, and R. M. Clarke. 1991. Impact of aquacultureon water resources. In: D. E. Brune and J. R. Tomasso (eds.), Aquaculture andWater Quality.Advances in World Aquaculture, vol. 3. World Aquaculture Society,Baton Rouge, LA, pp. 568–591.
2. MacMillan, R. 1992. Economic implications of water quality management for acommercial trout farm. In:National Livestock, Poultry, and Aquaculture WasteManagement (Proceedings of the National Workshop). American Society of Agri-cultural Engineers, St. Joseph, MI.
3. Timmons, M. B. and T. M. Losordo. 1994.Aquaculture Water Reuse Systems:Engineering Design and Management. Elsevier Science B.V., New York.
4. Wade, E. M., S. T. Summerfelt, and J. A. Hankins. 1996. Economies ofscale in recycle systems. In: G. Libey and M. Timmons (eds.),Successes andFailures in Commercial Recirculating Aquaculture (Conference Proceedings),NRAES-98. Northeast Regional Agricultural Engineering Service, Ithaca, NY,pp. 575–588.
5. Summerfelt, S. T. and E. M. Wade. 1997. Recent advances in water treatment pro-cesses to intensify fish-production in large recirculating systems. In M. Timmons(ed.),Advances in Aquacultural Engineering (Proceedings). Northeast RegionalAgricultural Engineering Service, Ithaca, NY, pp. 350–367.
6. Bastian, R. K. 1992. Overview of federal regulations pertaining to aquaculturewaste management and effluents. In: J. Blake, J. Donald, and W. Magette (eds.),National Livestock, Poultry, and Aquaculture Waste Management. American So-ciety of Agricultural Engineers, St. Joseph, Michigan, pp. 220–226.
7. Ewart, J., J. A. Hankins, and D. Bullock. 1995. State Policies for Aquaculture Ef-fluents and Solid Wastes in the Northeast Region. Northeast Regional AquacultureCenter, University of Massachusetts, Dartmouth, MA.
8. Beveridge, M. C. M., M. J. Phillips, R. M. Clarke. 1991. A quantitative assessmentof wastes from aquatic animal production. In: D. E. Brune and J. R. Tomasso (eds.),Aquaculture and Water Quality.Advances in World Aquaculture, vol. 3. WorldAquaculture Society, Baton Rouge, LA, pp. 506–533.
9. Wedemeyer, G. A. and G. W. Wood. 1974. Stress as a predisposing factor infish disease. Fish Disease Leaflet No. 38. U.S. Department of Interior, Fish andWildlife Service, Division of Fisheries Research, Washington, DC.
10. Wedemeyer, G. A. 1996.Physiology of Fish in Intensive Culture. InternationalThompson Publishing, New York.
11. Noble, A. C. and S. T. Summerfelt. 1996. Diseases encountered in rainbow troutreared in recirculating systems.Annual Review of Fish Diseases6:65–92.
12. Piper, R. G., I. B. McElwain, L. E. Orme, J. P. McCraren, L. G. Fowler, andJ. R. Leonard. 1982.Fish Hatchery Management. U.S. Fish and Wildlife Service,Washington, DC.
13. Liao, P. B. and R. D. Mayo. 1974. Intensified fish culture combining water recon-ditioning with pollution abatement.Aquaculture3:61–85.
340 Waste-Handling Systems
14. Kruner, G. and H. Rosenthal. 1987. Circadian periodicity of biological oxidationunder three different operational conditions.Aquacultural Engineering6:79–96.
15. Meade, J. W. 1985. Allowable ammonia for fish culture.Progressive Fish-Culturist 47:135.
16. Colt, J. E. and D. A. Armstrong. 1981. Nitrogen toxicity to fish, crustaceansand mollusks. In: L. J. Allen and E. C. Kinney (eds.),Proceedings of the Bio-engineering Symposium for Fish Culture. American Fisheries Society, Fish Cul-ture Section, Bethesda, MD, pp. 39–42.
17. Russo, R. C. and R. V. Thurston. 1977. The acute toxicity of nitrite to fishes. In:R. A. Tubb (ed.),Recent Advances in Fish Toxicology. EPA-600/3-77-085. U.S.Environmental Protection Agency, Ecological Research Service, Corvallis, OR,pp. 118–131.
18. Westin, D. T. 1974. Nitrate and nitrite toxicity to salmonid fishes.ProgressiveFish-Culturist36(2):86.
19. Laird, L. M. and T. Needham. 1988.Salmon and Trout Farming. Ellis HorwoodLimited, New York.
20. Losordo, T. M. 1991. Engineering considerations in closed recirculating systems.In: P. Giovannini (session chairman),Aquaculture Systems Engineering. Ameri-can Society of Agricultural Engineers, St. Joseph, MI, pp. 58–69.
21. Wheaton, F., J. Hochheimer, and G. E. Kaiser. 1991. Fixed-film nitrification filtersfor aquaculture. In: D. E. Brune and J. R. Tomasso (eds.),Aquaculture and WaterQuality. World Aquaculture Society, Baton Rouge, LA, pp. 272–303.
22. Muncy, R. J., G. J. Atchison, R. V. Bulkley, B. W. Menzel, L. G. Perry, and R. C.Summerfelt. 1979. Effects of suspended solids and sediment on reproduction andearly life of warmwater fishes: A review. EPA-600/3-79-042. National TechnicalInformation Service, Springfield, VA, p. 101.
23. Chen, S., D. Stechey, and R. F. Malone. 1994. Suspended solids control in recircu-lating aquaculture systems. In: M. B. Timmons, T. M. Losordo (eds.),AquacultureWater Reuse Systems: Engineering Design and Management. Elsevier ScienceB.V., New York, pp. 61–100.
24. Chapman, P. E., J. D. Popham, J. Griffin, and J. Michaelson. 1987. Differentiationof physical from chemical toxicity in solid waste fish bioassay.Water Air Soil Poll.33:295–308.
25. Klontz, G. W. 1993. Environmental requirements and environmental diseases ofsalmonids. In: M. K. Stoskopf (ed.),Fish Medicine. WB Saunders, Philadelphia,pp. 333–342.
26. Bullock, G. L., R. Herman, J. Heinen, A. Noble, A. Weber, and J. Hankins. 1994.Observations on the occurrence of bacterial gill disease and amoeba gill infestationin rainbow trout cultured in a water recirculation system.J. Aquat. Anim. Health6:310–317.
27. Herbert, D. W. M., and J. C. Merkens. 1961. The effects of suspended mineralsolids on the survival of trout.Air Water Poll. 5:46–50.
28. Juell, J. E., D. M. Furvik, and A. Bjordal. 1993. Demand feeding in salmonfarming by hydroacoustic food detection.Aquaculture Engineering12:155–167.

References 341
29. Hankins, J. A., S. T. Summerfelt, and M. D. Durant. 1995. Impacts of feeding andstock management strategies upon fish production within water recycle systems.In: M. B. Timmons (ed.),Aquacultural Engineering and Waste Management.Northeast Regional Agricultural Engineering Service, Ithaca, NY, pp. 70–86.
30. Mayer, I. and E. McLean. 1995. Bioengineering and Biotechnology Strategies forReduced Waste Aquaculture.Water Science and Technology31:85–102.
31. Thorpe, J. E. and C. Y. Cho. 1995. Minimizing waste through bioenergeticallyand behaviorally based feeding strategies.Water Science and Technology31:29–40.
32. Goddard, S. 1996.Feed Management in Intensive Aquaculture. Chapman andHall, New York.
33. Clark, E. R., J. P. Harman, and J. R. M. Forster. 1985. Production of metabolic andwaste products by intensively farmed rainbow trout (Salmo gairdneri) Richardson.J. Fish Bio. 27:381–393.
34. Chen, S., D. E. Coffin, and R. F. Malone. 1993. Production, characteristics, andmodeling of aquaculture sludge from a recirculating aquaculture system using agranular media biofilter. In J.-K. Wang (ed.),Techniques for Modern Aquaculture.American Society of Agricultural Engineers, St. Joseph, MI, pp. 16–25.
35. Seymour, E. A. and A. Bergheim. 1991. Towards a reduction of pollution fromintensive aquaculture with reference to the farming of salmonids in Norway.Aquacultural Engineering10:73–88.
36. Mathieu, F. and M. B. Timmons. 1993. Time dependent BOD of aquaculturalwastes in recirculating rainbow trout systems. In: J.-K. Wang (ed.),Techniquesfor Modern Aquaculture. American Society of Agricultural Engineers, St. Joseph,MI, pp. 44–47.
37. Garcia-Ruiz, R., and G. H. Hall. 1996. Phosphorus fractionation and mobility inthe food and faeces of hatchery reared rainbow trout (Onchorhynchus mykiss).Aquaculture145:183–193.
38. Muir, J. F. 1982. Recirculating systems in aquaculture. In: J. F. Muir and R. J.Roberts (eds.),Recent Advances in Aquaculture, vol. 1. Croom Helm and West-view Press, London, pp. 358–446.
39. Chen, S., M. B. Timmons, D. J. Aneshansley, and J. J. Bisogni, Jr. 1993. Sus-pended solids characteristics from recirculating aquaculture systems and designimplications.Aquaculture112:143–155.
40. Robertson, W. D. 1992. Assessment of filtration and sedimentation systems fortotal phosphorus removal at the Lake Utopia Fish Culture Station. Canadian FishCulture Operations, Aquaculture Division, Connors Bros., Limited., Blacks Har-bour, New Brunswick, Canada.
41. Timmons, M. B. and W. D. Young. 1991. Considerations on the design of race-ways. In:Aquaculture Systems Engineering, Publication 02-91. American Societyof Agricultural Engineers, S. Joseph, MI, pp. 34–46.
42. Randall, D. J. and C. Daxboeck. 1984. Oxygen and carbon dioxide transfer acrossfish gills. In: W. S. Hoar and D. J. Randall (eds.),Fish Physiology, vol. 10A.Academic Press, New York, pp. 263–314.
342 Waste-Handling Systems
43. Walsh, P. J. and R. P. Henry. 1991. Carbon dioxide and ammonia metabolismand exchange. In: P. W. Hochachka and T. P. Mommsen (eds.),Biochemistryand Molecular Biology of Fishes: Phylogenetic and Biochemical Perspectives.Elsevier Science B.V., New York, pp. 181–207.
44. Kutty, M. N. 1968. Respiratory quotients in goldfish and rainbow trout.J. Fish.Res. Board Can. 25:1689–1728.
45. Colt, J. E. and K. Orwicz. 1991. Aeration in intensive culture. In: D. E. Brune andJ. R. Tomasso (eds.),Aquaculture and Water Quality. World Aquaculture Society,Louisiana State University, Baton Rouge, LA, pp. 198–271.
46. Basu, S. P. 1959. Active respiration of fish in relation to ambient concentrationsof oxygen and carbon dioxide.J. Fish. Res. Board Can. 16:175–212.
47. Smart, G. R., D. Knox, J. G. Harrison, J. A. Ralph, R. H. Richards, and C. B.Cowey. 1979. Nephrocalcinosis in rainbow troutSalmo gairdneriRichardson:The effect of exposure to elevated CO2 concentrations.J. Fish Dis. 2:279–289.
48. Heinen, J. M., J. A. Hankins, A. L. Weber, and B. J. Watten. 1996. A semi-closedrecirculating water system for high density culture of rainbow trout.ProgressiveFish-Culturist58:11–22.
49. SECL (Sigma Environmental Consultants, Limited). 1983. Summary of waterquality for salmonid hatcheries, SECL 8067. Prepared for Department of Fisheriesand Oceans, Vancouver, British Columbia, Canada.
50. Bergheim, A. and T.Asgard. 1996. Waste production from aquaculture. In: D.Baird, M. C. M. Beveridge, L. A. Kelly, and J. F. Muir (eds.),Aquaculture andWater Resource Management. Blackwell Science, Osney Mead, Oxford, UnitedKingdoms, pp. 50–80.
51. Stewart, J. E. 1997. Environmental impacts of aquaculture.World Aquaculture28(1):47–52.
52. Munro, A. L. S. and N. Fijan. 1981. Disease prevention and control. In: K. Tiews(ed.),Aquaculture in Heated Effluents and Recirculation Systems, vol. 2. Heene-mann Verlagsgesellschaft mbH, Berlin, pp. 20–32.
53. NCC (Nature Conservancy Council). 1990.Fish Farming and the Scottish Fresh-water Environment. Nature Conservancy Council, Edinburgh.
54. Bergheim, A., J. P. Aabel, and E. A. Seymour. 1991. Past and present approachesto aquaculture waste management in Norwegian net pen culture operations. In:C. B. Cowey and C. Y. Cho (eds.),Nutritional Strategies for Aquaculture Waste.University of Guelph, Guelph, Ontario, Canada, pp. 117–136.
55. Braaten, B. 1991. Impact of pollution from aquaculture in six Nordic countries:release of nutrients, effects, and waste water treatment. In: N. DePauw and J.Joyce (eds.),Aquaculture and the Environment. EAS Special Publication No. 16.European Aquaculture Society, Gent, Belgium, pp. 79–101.
56. Phillips, M. J., R. Clarke, and A. Mowat. 1993. Phosphorus leaching from Atlanticsalmon diets.Aquacultural Engineering12:47–54.
57. Cripps, S. J. and L. A. Kelly. 1996. Reductions in wastes from aquaculture. In:D. Baird, M. C. M. Beveridge, L. A. Kelly, and J. F. Muir (eds.),Aquaculture and
References 343
Water Resource Management. Blackwell Science, Osney Mead, Oxford, UnitedKingdoms, pp. 166–201.
58. Heinen, J. M., J. A. Hankins, and P. R. Adler. 1996. Water quality and wasteproduction in a recirculating trout-culture system with feeding of a higher-energyor a lower-energy diet.Aquaculture Research27:699–710.
59. Speece, R. E. 1973. Trout metabolism characteristics and the rational designof nitrification facilities for water reuse in hatcheries.Trans. Amer. Fish. Soc.102(2):323–334.
60. Kaiser, G. E., and F. W. Wheaton. 1983. Nitrification filters for aquatic culturesystems: State of the art.J. World Maricult. Soc.14:302–324.
61. Wheaton, F. W., J. N. Hochheimer, G. E. Kaiser, M. J. Krones, G. S. Libey,and C. C. Easter. 1994. Nitrification filter principles. In: M. B. Timmons and T.M. Losordo (eds.),Aquaculture Water Reuse Systems: Engineering Design andManagement. Elsevier, New York, pp. 101–126.
62. Schlegel, S. 1984. The use of submerged biological filters for nitrification.WaterScience Technology20:177.
63. Wanner, O. and W. Gujer. 1984. Competition in biofilms.Water Science Technol-ogy17:27–44.
64. Harremoes, P. 1982. Criteria for nitrification in fixed film reactors.Water ScienceTechnology14:167–187.
65. Bovendeur, J., A. B. Zwaga, B. G. J. Lobee, and J. H. Blom. 1990. Fixed-biofilmreactors in aquacultural water recycle systems: Effect of organic matter elimina-tion on nitrification kinetics.Wat. Res.24(2):207–213.
66. Sharma, B. and R. C. Ahlert, 1977. Nitrification and nitrogen removal.WaterResearch11:897–925.
67. Cutter, D. W. and L. M. Crump. 1983. Some aspects of the physiology of certainnitrite forming bacteria.Ann. Appl. Biol. 20:291–296.
68. EPA (Environmental Protection Agency). 1975. Process Design Manual for Ni-trogen Control. Office of Technology Transfer, Washington, DC.
69. Alleman, J. E. and K. Preston. 1991. Behavior and physiology of nitrifying bac-teria. In: L. Swann (ed.),Proceedings of Regional Workshop on Commercial FishCulture Using Water Recirculating Systems. Illinois State University, Normal, IL,pp. 1–13.
70. Manem, J. A. and B. E. Rittman. 1992. The effects of fluctuations in biodegradableorganic matter on nitrification filters.Journal AWWA. 84(4):147–151.
71. Eikebrokk, B. and R. H. Piedrahita. 1997. Nitrification performance and ammoniaexcretion from salmonids, calculated from nitrogen mass balances in water reusesystems under field and laboratory conditions.Journal of Applied Aquaculture7(4): 15–32.
72. Haug, R. T. and P. L. McCarty. 1972. Nitrification with submerged filters.J. WaterPollut. Control Fed. 44:2086.
73. Lomax, K. M., and F. W. Wheaton. 1978. Pretreatment of fish culture wastewaterfor nitrification.Trans. ASAE197–200.

344 Waste-Handling Systems
74. Summerfelt, S. T. 1993. Low-Head Roughing Filters for Enhancing Recycle WaterTreatment for Aquaculture. Doctoral diss., Iowa State University, Ames, IA.
75. Rusten, B. 1984. Wastewater treatment with aerated submerged biological filters.J. Water Pollut. Control Fed., 56:424–431.
76. Anderson, D. 1974. Biological trickling filter system for water reuse in troutrearing. Investigational report no. 322. Minnesota Division of Fish and Wildlife,Section of Fisheries, St. Paul, MN.
77. Nijhof, M. 1995. Bacterial stratification and hydraulic loading effects in a plug-flow model for nitrifying trickling filters applied in recirculating fish culture sys-tems.Aquaculture134:49–64.
78. Tanaka, K., A. Oshima, and B. E. Rittmann. 1987. Performance evaluations ofrotating biological contactor process.Water Sci. Tech. 19:483–494.
79. Tchobanoglous, G. and E. D. Schroeder. 1985.Water Quality. Addison-Wesley,Reading, MA, p. 168.
80. Malone, R. F., B. S. Chitta, and D. G. Drennan. 1993. Optimizing nitrification inbead filters for warmwater recirculating aquaculture systems. In: J.-K. Wang (ed.),Techniques for Modern Aquaculture. American Society of Agricultural Engineers,St. Joseph, MI, pp. 315–325.
81. Golz, W., K. A. Rusch, and R. F. Malone. 1996. Developing backwash proto-cols for floating bead filters: A model of solids-loading and biofilm retentioneffects on nitrification. In: G. Libey and M. Timmons (eds.),Successes andFailures in Commercial Recirculating Aquaculture (Conference Proceedings),NRAES-98. Northeast Regional Agricultural Engineering Service, Ithaca, NY,pp. 196–205.
82. Summerfelt, S. T., J. A. Hankins, M. D. Durant, and J. N. Goldman. 1996. Re-moving obstructions: Modified pipe-lateral flow distribution mechanism reducesbackflow in fluidized-sand biofilters.Water Env. and Tech.8(11): 39–43.
83. Burden, D. G. 1988. Development and Design of a Fluidized Bed/Upflow SandFilter Configuration for Use in Recirculating Aquaculture Systems. Master’s the-sis, Louisiana State University, Baton Rouge, LA.
84. Cooper, P. F. and B. Atkinson. 1981.Biological Fluidized Bed Treatment of Waterand Wastewater. Water Research Centre, Ellis Horwood Ltd., Chichester, Eng-land.
85. Jewell, W. J. 1990. Fundamentals and advances in expanded bed reactors forwaste-water treatment. In: R. D. Tyagi and K. Vembu (eds.),Wastewater Treatmentby Immobilized Cells. CRC Press, Boca Raton, FL, pp. 223–252.
86. Sutton, P. M. and P. N. Mishra. 1991. Biological fluidized beds for waste-water treatment: A state-of-the-art review.Water Environment Technology3(8):52–56.
87. Summerfelt, S. T. and J. L. Cleasby. 1996. A review of hydraulics in fluidized-bedbiological filters.Trans. ASAE39:1161–1173.
88. Cleasby, J. L. 1990. Filtration. In: F. W. Pontius (ed).Water Quality and Treatment,American Water Works Association, 4th ed. McGraw-Hill, New York, pp. 455–560.

References 345
89. Cleasby, J. L. and K. S. Fan. 1981. Predicting fluidization and expansion of filtermedia.Journal of the Environmental Engineering Division, American Society ofCivil Engineers 107:455–471.
90. Tsukuda., S. M., S. T. Summerfelt, T. K. Sawyer, G. L. Bullock, and C. P. Marshall.1997. Effects of sand size on fluidized-bed biofilter performance in cold-watersystems. In:World Aquaculture ’97 Book of Abstracts. World Aquaculture Society,Baton Rouge, LA, pp. 467–468.
91. Monaghan, T. J., A. A. Delos Reyes, T. M. Jeansonne, and R. F. Malone. 1996.Effects of media size on nitrification in fluidized sand filters. In:AquacultureAmerica ’96 Book of Abstracts. World Aquaculture Society, Baton Rouge, LA,p. 110.
92. Thomasson, M. P. 1991. Nitrification in Fluidized Bed Sand Filters for Use inRecirculating Aquaculture Systems. Master’s thesis, Louisiana State University,Baton Rouge, LA.
93. Cooley, P. E. 1979. Nitrification of Fish-Hatchery Reuse Water Utilizing Low-Density Polyethylene Beads as a Fixed Film Media Type. Master’s thesis, IdahoState University, Moscow, Idaho.
94. Wimberly, D. M. 1990. Development and Evaluation of a Low-Density MediaBiofiltration Unit for Use in Recirculating Finfish Culture Systems. Master’sthesis, Louisiana State University, Baton Rouge, LA.
95. Delos Reyes, A. A. and R. F. Malone. 1996. Design and evaluation of acommercial-scale, paddle-washed floating bead filter. In: G. Libey and M. Tim-mons (eds.),Successes and Failures in Commercial Recirculating Aquaculture(Conference Proceedings), NRAES-98. Northeast Regional Agricultural Engi-neering Service, Ithaca, NY, pp. 183–195.
96. Chesness, J. L., W. H. Poole, and T. K. Hill. 1975. Settling basin design forraceway fish production systems.Trans. ASAE18(5):159–162.
97. Warren-Hansen, I. 1982. Methods of treatment of waste water from trout farm-ing. In: J. Alabaster (ed.), EIFAC Technical Paper No. 41. Report of the EIFACWorkshop on Fish-Farm Effluents, Silkeborg, Denmark, 26–28 May, 1981. FAO,Rome, pp. 113–121.
98. Camp, T. R. 1936. A study of the rational design of settling tanks.Sewage WorksJournal8:742–758.
99. Stechey, D. and Y. Trudell. 1990. Aquaculture waste water treatment: waste wa-ter characterization and development of appropriate treatment technologies forthe Ontario trout production industry. PIBS 1319, Log # 90-2309-041. OntarioMinistry of the Environment, Toronto, Ontario, Canada.
100. Stechey, D. 1991. Build your own settling pond.Northern Aquaculture7(5):22–29.
101. Henderson, J. P. and N. R. Bromage. 1988. Optimising the removal of suspendedsolids from aquaculture effluents in settlement lakes.Aquacultural Engineering7:167–188.
102. Mudrak, V. A. 1981. Guidelines for economical commercial fish hatchery waste-water treatment systems. In: L. J. Allen and E. C. Kinney (eds.),Proceedings
346 Waste-Handling Systems
of the Bio-engineering Symposium for Fish Culture. American Fisheries Society,Fish Culture Section, Bethesda, MD, pp. 174–182.
103. Michelsen, K. 1991. Past and present approaches to aquaculture waste manage-ment in danish pond culture operations. In: C. B. Cowey and C. Y. Cho (eds.),Nutritional Strategies and Aquaculture Waste.Proceedings of the First Interna-tional Symposium on Nutritional Strategies in Management of Aquaculture Waste.University of Guelph, Guilph, Ontario, Canada, pp. 155–161.
104. Arceivala, S. J. 1983. Hydraulic modelling for waste stabilisation ponds.Journalof Environmental Engineering109(5):265–268.
105. Paul, T. C., S. K. Sayal, V. S. Sakhuja, and G. S. Dhillon. 1991. Vortex-settlingbasin design considerations.J. Hydraul. Eng.117:172–189.
106. Scott, K. R. and L. Allard. 1983. High-flowrate water recirculation system in-corporating a hydrocyclone prefilter for rearing fish.Progressive Fish-Culturist45:148–153.
107. Scott, K. R. and L. Allard. 1984. A four-tank water recirculating system with ahydrocyclone prefilter and a single water reconditioning unit.Progressive Fish-Culturist 46:254–261.
108. Makinen, T., S. Lindgren, and P. Eskelinen. 1988. Sieving as an effluent treatmentmethod for aquaculture.Aquacultural Engineering7:367–377.
109. Eikebrokk, B. and Y. Ulgenes. 1993. Characterization of treated effluents fromlandbased fish farms. In: H. Keinertsen, L. A. Dahle, L. Jorgensen, and K. Tvin-nereim (eds.),Fish Farming Technology. Balkema, Rotterdam, pp. 361–366.
110. Jenkins, M. R., E. M. Wade, and C. W. Yohn. 1996. The opportunity for small-scale aquaculture as an alternative farm enterprise: An economic analysis of asmall-scale partial reuse trout production system in West Virginia.Journal of theASFMRA81–89.
111. Yao, K. M. 1970. Theoretical study of high rate sedimentation.Journal WaterPollution Control Federation42:218–228.
112. Yao, K. M. 1973. Design of high rate settlers.J. Env. Engn. Div. ASCE99:621–636.
113. Smethurst, G. 1979. Settling basins: Practical considerations and choice. In:BasicWater Treatment. Published by Thomas Telford Ltd., available from the AmericanSociety of Civil Engineers, New York.
114. McLaughlin, T. W. 1981. Hatchery effluent treatment: U.S. fish and wildlife ser-vice. In: J. A. Lochie and E. C. Kinney (eds.),Bioengineering Symposium forFish Culture. American Fisheries Society, Bethesda, MD, pp. 167–173.
115. Libey, G. S. 1993. Evaluation of a drum filter for removal of solids from arecirculating aquaculture system. In: J.-K. Wang (ed.),Techniques for ModernAquaculture. American Society of Agricultural Engineers, S. Joseph, MI, pp.519–532.
116. Liltvedt, H. and B. R. Hansen. 1990. Screening as a method for removalof parasites from inlet water to fish farms.Aquacultural Engineering9:209–215.
117. Bergheim, A., R. Kristiansen, and L. Kelly. 1993. Treatment and utilization ofsludge from landbased farms for salmon. In: J.-K. Wang (ed.),Techniques for

References 347
Modern Aquaculture. American Society of Agricultural Engineers, St. Joseph,MI, pp. 486–495.
118. Bergheim, A., S. Sanni, G. Indrevik, and P. Holland. 1993. Sludge removalfrom salmonid tank effluent using rotating microsieves.Aquacultural Engineering12:97–109.
119. Cripps, S. J. 1995. Serial particle size fractionation and characterization of anaquaculture effluent.Aquaculture133:323–339.
120. Kelly, L. A., A. Bergheim, and J. Stellwagen. 1997. Particle size distribution ofwastes from freshwater fish farms.Aquaculture International5:65–87.
121. Summerfelt, S. T., J. A. Hankins, J. M. Heinen, A. L. Weber, and J. D. Morton.1994. Evaluation of the TriangelTM microsieve filter in a water-reuse system.In: World Aquaculture ’94 Book of Abstracts. World Aquaculture Society, BatonRouge, LA, p. 45.
122. Summerfelt, S. T. 1996. Engineering design of a water reuse system. In:TheWalleye Culture Manual. North Central Regional Aquaculture Center, MichiganState University, East Lansing, MI, pp. 277–309.
123. Summerfelt, S. T., J. A. Hankins, A. Weber, and M. D. Durant. 1997. Ozonation ofa recirculating rainbow trout culture system: II. Effects on microscreen filtrationand water quality.Aquaculture, 158:57–67.
124. Bergheim, A. and O. I. Forsberg. 1993. Attempts to reduce effluent loadingsfrom salmon farms by varying feeding frequencies and mechanical effluent treat-ment. In: G. Barnab´e and P. Kestemont (eds.),Production, Environment andQuality: Proceedings of the International Conference Bordeaux Aquaculture ’92.Special Publication No. 18. European Aquaculture Society, Ghent, Belgium,pp. 115–124.
125. Singh, S. and Marsh, L. S. 1996. Modeling thermal environment of a recirculatingaquaculture facility.Aquaculture139:11–18.
126. Cryer, E. 1992. Recent applications of ozone in freshwater fish hatchery systems.In: W. J. Blogoslawski (ed.),Proceedings of the 3rd International Symposiumon the Use of Ozone in Aquatic Systems. International Ozone Association, PanAmerican Committee, Stamford, CT, pp. 134–154.
127. Baeyens, J., I. Y. Mochtar, S. Liers, and H. De Wit. 1995. Plugflow dissolved airflotation.Water Environment Research67:1027–1035.
128. Liers, S., J. Baeyens, and I. Mochtar. 1996. Modeling dissolved air flotation.WaterEnvironment Research68:1061–1075.
129. Kemmer, F. N. 1979.The NALCO Water Handbook. Nalco Chemical Company.McGraw-Hill Book Company, New York.
130. Montgomery, J. M. (Consulting Engineers, Inc.). 1985.Water Treatment Princi-ples and Design. John Wiley and Sons, New York.
131. Chen, S., M. B. Timmons, J. J. Bisogni, Jr., and D. J. Aneshansley. 1993.Suspended-solids removal by foam fractionation.Progressive Fish-Culturist55:69–75.
132. Weeks, N. C., M. B. Timmons, and S. Chen. 1992. Feasibility of using foamfractionation for the removal of dissolved and suspended solids from fish culturewater.Aquacultural Engineering11:251–265.

348 Waste-Handling Systems
133. Chen, S., M. B. Timmons, J. J. Bisogni, Jr., and D. J. Aneshansley. 1993. Proteinand its removal by foam fractionation.Progressive Fish-Culturist55:69–75.
134. Chen, S., M. B. Timmons, J. J. Bisogni, Jr., and D. J. Aneshansley. 1994. Modelingsurfactant removal in foam fractionation: I. Theoretical development.Aquacul-tural Engineering13:163–181.
135. Chen, S., M. B. Timmons, J. J. Bisogni, Jr., and D. J. Aneshansley. 1994. Mod-eling surfactant removal in foam fractionation: II. Experimental investigations.Aquacultural Engineering13:183–200.
136. Sander, E. and H. Rosenthal. 1975. Application of ozone in water treatmentfor home aquaria, public aquaria, and for aquaculture purposes. In: W. J. Blo-goslawski and R. G. Rice (eds.),Aquatic Applications of Ozone. InternationalOzone Institute, Stamford, CT, pp. 103–114.
137. Otte, G. and H. Rosenthal. 1979. Management of a closed brackish water systemfor high density fish culture by biological and chemical treatment.Aquaculture18: 169–181.
138. Williams, R. C., S. G. Hughes, and G. L. Rumsey. 1982. Use of ozone in a waterreuse system for salmonids.Progressive Fish-Culturist44:102–105.
139. Gargas, J. 1989. Fresh water ozonation and foam fractionation in a discus hatchery.Tropical Fish Hobbyist38(3):114–122.
140. Rice, R. G., C. M. Robson, G. W. Miller, and A. G. Hill. 1981. Uses of ozone indrinking water treatment.Journal of American Water Works Association73:1–44.
141. Bablon, G., W. D. Bellamy, M.-M. Bourbigot, F. B. Daniel, M. Dor´e, F. Erb, G.Gordon, B. Langlais, A. Laplanche, B. Legube, G. Martin, W. J. Masschelein,G. Pacey, D. A. Reckhow, and C. Ventresque. 1991. Fundamental aspects. In: B.Langlais, D. A. Reckhow, D. R. Brink (eds.),Ozone in Water Treatment: Applica-tion and Engineering. American Water Works Association Research Foundation.Denver, CO, pp. 11–132.
142. Rosenthal, H. and G. Otte. 1980. Ozonation in an intensive fish culture recyclingsystem.Ozone: Science and Engineering1:319–327.
143. Maier, D. 1984. Microflocculation by ozone. In: R. G. Rice and A. Netzer (eds.),Handbook of Ozone Technology and Applications, vol. 2. Butterworth Publishers,Boston, pp. 123–140.
144. Summerfelt, S. T. and J. N. Hochheimer. 1997. A review of ozone processesand applications as an oxidizing agent in aquaculture.Progressive Fish-Culturist59:94–105.
145a. Bullock, G. L., S. T. Summerfelt, A. Noble, A. Weber, M. D. Durant, and J.A. Hankins. 1997. Ozonation of a recirculating rainbow trout culture system: I.Effects on bacterial gill disease and heterotrophic bacteria.Aquaculture158:43–55.
145b. Westers, H. 1991. Operational waste management in aquacultural effluents. In: C.B. Cowey and C. Y. Cho (eds.), Nutritional Strategies and Aquaculture Waste.Pro-ceedings of the First International Symposium on Nutritional Strategies in Man-agement of Aquaculture Waste. University of Guelph, Guelph, Ontario, Canada,pp. 231–238.
References 349
146. EPA (Environmental Protection Agency). 1987. Dewatering Municipal Wastew-ater Sludges. Center for Environmental Resarch Information, Cincinnati, OH.
147. Metcalf and Eddy, Inc. 1991.Wastewater Engineering: Treatment, Disposal, andReuse, 3rd ed. McGraw-Hill, New York.
148. Black and Veatch, Inc. 1995. Wastewater Biosolids and Water Residuals: Refer-ence Manual on Conditioning, Thickening, Dewatering, and Drying. CEC ReportCR-105603. The Electric Power Research Institute, Community EnvironmentCenter, Washington University, St. Louis, MO.
149. Reed, S. C., R. W. Crites, and E. J. Middlebrooks. 1995.Natural Systems forWaste Management and Treatment, 2nd ed. McGraw-Hill, New York.
150. Outwater, A. B. 1994.Reuse of Sludge and Minor Wastewater Residuals. LewisPublishers, Boca Raton, FL.
151. Chen, S., D. E. Coffin, and R. F. Malone. 1991. Suspended solids control in recir-culating aquaculture systems. In:Engineering Aspects of Intensive Aquaculture.Northeast Regional Agricultural Engineering Service, Cooperative Extension,Ithaca, NY, pp. 170–186.
152. Riggle, D. 1991. Reed bed system for sludge.Biocycle32(12):64–66.153. Summerfelt, S. T., P. R. Adler, D. M. Glenn, and R. N. Kretschman. 1996. Aqua-
culture sludge removal and stabilization within created wetlands. In:5th IAWQConference on Constructed Wetland Systems for Water Pollution Control(Vienna,Austria). Institute for Water Provision, Water Ecology and Waste Management,Unversitaet fuer Bodenkultur Wien, pp. 2–1 to 2–7.
154. Hirayama, K., H. Mizuma, and Y. Mizue. 1988. The accumulation of dissolvedorganic substances in closed recirculation culture systems.Aquacultural Engi-neering7:73–87.
155. Colt, J. E. and V. Tchobanoglous. 1981. Design of aeration systems for Aquacul-ture. In: L. J. Allen and E. C. Kinney (eds.),Proceedings of the Bio-engineeringSymposium for Fish Culture. American Fisheries Society, Bethesda, MD, pp. 138–148.
156. Colt, J. E., K. Orwicz, and G. Bouck. 1991. Water quality considerations andcriteria for high-density fish culture with supplemental oxygen. In: J. Colt andR. J. White (eds.),Fisheries Bioengineering Symposium 10. American FisheriesSociety, Bethesda, MD, pp. 372–385.
157. Watten, B. J., J. E. Colt, and C. E. Boyd. 1991. Modeling the effect of dissolvednitrogen and carbon dioxide on the performance of pure oxygen absorption sys-tems. In: J. Colt and R. J. White (eds.),American Fisheries Society Symposium10: Fisheries Bioengineering Symposium. Bethesda, MD, pp. 474–481.
158. Giddings, J. C. 1973.Chemistry, Man and Environmental Change. Canfield, SanFrancisco.
159. Cornwell, D. A. 1990. Air stripping and aeration. In: F. W. Pontius (ed.),WaterQuality and Treatment. American Water Works Association, 4th ed. McGraw-Hill, New York, pp. 229–268.
160. Treybal, R. E. 1980.Mass-Transfer Operations, 3rd ed. McGraw-Hill Book Com-pany, New York.
350 Waste-Handling Systems
161. Speece, R. E. 1981. Management of dissolved oxygen and nitrogen in fish hatcherywaters. In: L. J. Allen and E. C. Kinney (eds.),Proceedings of the Bio-engineeringSymposium for Fish Culture. American Fisheries Society, Bethesda, Maryland,pp. 53–62.
162. Boyd, C. E. and B. J. Watten. 1989. Aeration systems in aquaculture.Reviews inAquatic Sciences1:425–473.
163. Grace, G. R. and R. H. Piedrahita. 1993. Carbon dioxide control with a packed col-umn aerator. In: J. K. Wang (ed.),Techniques for Modern Aquaculture. AmericanSociety of Agricultural Engineers, St. Joseph, MI, pp. 496–505.
164. Grace, G. R. and R. H. Piedrahita. 1994. Carbon dioxide control. In M. B.Timmons and T. M. Losordo (eds.),Aquaculture Water Systems: EngineeringDesign and Management. Elsevier Science, New York, pp. 209–234.
165. Bisogni, J. J., Jr. and M. B. Timmons. 1991. Control of pH in closed cycle aqua-culture systems. In: Engineering Aspects of Intensive Aquaculture:Proceedingsfrom the Aquaculture Symposium. Northeast Regional Agricultural EngineeringService, Ithaca, NY, pp. 33–348.
166. Larson, T. E. and A. M. Buswell. 1942. Calcium carbonate saturation index andalkalinity interpretations.Journal American of Water Works Association34:1667.

Index
acrylic, 241activity, 50, 51, 52admixtures, 5adsorption, principle of, 216advantages, 6aeration, 213, 216, 309, 310, 320, 322, 326,
336–7aerators
diffusers, 216surface, 216
aerobic conditions, 165, 168aerobic lagoon, 182, 183, 184aerobic systems, 164, 182, 183, 184,Africa, 200, 202, 206, 207Africa donkeyes, 206aggregate, 4air distribution, 74air quality, 167air resource
effect of manure on, 167–70odors, 168–9, 184
air stripping, 310, 336–7air, solubility, 223alfalfa, 147algae, 213alkalinity, 224
carbon dioxide interactions, 315, 337–8control, 320, 337–8nitrification interactions, 320, 337supplements, 338
alley, 119aluminum, 224, 239ammonia, 94, 169, 170, 216, 224
acid-base equilibrium, 312, 337–8ionized, 228production, 312, 313, 315removal methods (see alsobiofiltration,
nitrification), 316–26, 332removal rates, 320, 322, 324suggested levels, 311, 312total, 224toxicity, 312, 337unionized, 228
ammonia loading, 253ammonia, pond uptake, 249anaerobic, 186anaerobic conditions, 168, 169anaerobic lagoon, 164, 168, 182, 183, 184, 186anaerobic systems, 164, 169, 182, 183, 184, 186animal resource-effect of manure on, 170
animal traction logger, 199, 203aquacultural systems, 211–12
classification, 212aquaculture, 211aquariums, 214arches, 16ard, 200, 201, 202area units, 93arsenic, 224as-excreted, 176as-excreted manure characteristics, 174as-excreted swine manure, 177as-excreted poultry manure, 178Asia, 202, 207attached, 167attached phosphorus, 167automatic feeders
cattle, 118autotrophs, 216
bacteria, 164, 167bale wrap, 151Bangladesh, 205barium, 224bass, hybrid striped, 211bead filters, 313, 316, 318, 320, 326beams, 16beef, 176, 183beef manures, 177bentonite, 237best available technology (BAT), 310–11best management practices (BMPs), 310biochemical oxygen demand (BOD), 310,
311, 316, 320biofilm, 320, 322biofilters, 215, 216, 316–26
efficiency, 216media, 216, 320–1operation, 216oxygen/space limitations, 316, 320–1, 323,
326solids, and, 320, 321, 322, 326start-up, 320types, 216, 316–26
biofiltration (see alsobiofilters), 310, 316–22biogas, 193biological filters, 216
operational parameters, 216blacksmith, 200, 201blocks, 9
351

352 Index
body surface area, 35, 36bolts, 20bos indicus, 198bovine, 197, 202bowl, 133, 136broilers, 128building, 7building systems, 96bullock, 202, 203butyl rubber, 241
cadmium, 224cage culture, 211–12, 214cages, 214calcium, 224camelid, 197, 202, 205capacity, 188carbon dioxide, 50, 52, 169, 170, 224
acid-base equilibrium, 315, 337, 338production, 314–15removal (see alsoaeration, pH control,
stripping columns), 322, 326, 336–8suggested levels, 311, 315toxicity, 315
carbon, activated, 216carbon-to-nitrogen ratio, 174carrying capacity (see alsooxygen), 309cart, 202, 205cascade aeration equipment (seeaeration)catfish, 219cement, 3, 4, 5Centre for Tropical Veterinary Medicine, 199,
203channel/racewace, cleaning velocity, 256channel/raceway
characteristics, 176, 177geometry raceway, 258roughness coefficient, 259side slope, 259
chemicals, 310, 311, 314, 315, 332, 333,337–8
chemical composition, 147chemical filters, 216chemotherapeutants, 315chlorine, 224CIRAD-SAR, 203circular opening, 68clarifiers (seesolids removal processes)Clean Water Act, 310closed, system, 212coefficient for convection, 36coefficient for radiation, 36
cold water, 223coliforms, 167columns, 16concrete, 3, 4, 5, 6, 238condition, 200, 203, 204, 206conductivity, thermal, 220constraints (in aquacultural systems), 219construction material, 10copper, 224, 238, 240copper alloys, 235corrosion, 8, 231Costa Rica, 205cow, 203, 206critical level, oxygen concentration, 225crushing, 202cubes, 152cultivator, 197, 200, 201
dairy, 181, 188DAP, 200, 206, 207density (of water), 220dentrification processes, 165detoxification, 216diffuser, 216discharge of jet, 74disease, gas-bubble, 221, 225disinfection, ozone, 216dissolved air flotation (seeflotation)dissolved matter, 313, 314, 316
methods to remove (see alsoozonation,biofiltration), 321, 333–6
dissolved oxygen, 224diurnal rhythm, 32, 50donkey, 200, 202, 203, 205, 206doors, 25downflow, 216draught animal power (DAP), 197, 200, 201,
206, 207draught capability, 198, 203drinking facility, 138drinking system
pig, 138poultry, 141
drinking water requirements, 138cattle, 133goats, 135poultry, 140turkeys, 141
dry weight basis, 174
Earth, 9–10effective size (mesh), 233
Index 353
effluent, 187, 190regulations, 309–11, 315, 334treatment technologies, 309–10, 316–36
energy, 193–4energy consumption, 79, 84Environmental Protection Agency (EPA), 310equal-pressure system, 67equid, 197, 198, 202equilibrium moisture, 159ergometer, 203ergometer CTVM, 199, 203ergonomics, 205erosion, channel, 256erosion velocity, 256estuaries, 236Europe, 202evaporation losses, 212
fan capacity, 80, 82farm buildings, 10farming system, 200, 205, 206–7fasteners, 19fatigue, 202, 203fatigue, fish swimming, 257fecal coliform, 167feed
barriers, 116–17metabolite production relationships, 312,
313, 315waste, 313
feed requirements, 204feeders
automatic, 282, 284broilers, 128demand, 282, 287laying hens
auger, 127pig
dry feeding, 125liquid system, 126
turkeys, 128feeding alley, 115feeding alley width
cattle, 115goat, 122sheep, 119
feeding method, 3feeding space, 122feeding trailers, 130feeds and feeding
frequency, 282particle size, 282
rate, 282, 297regime, 281
feeds barriercattle, 116
fertilization, 189–90fiberglass, 240fibreboards, 21fields, 188filters, 216filter media, 216filtration (seegranular media filters,
microscreen filters)finishing, 23fish culture tank, 215fixed feeding system, 132floor, 6, 7flotation, 314, 317, 332–4flowrate, dimensioning, 83fluidized-bed biofilter, 316, 319, 320, 322,
323–6fluidized-bed biofilter applications, 113–16fluidized bed filters, 216foam fractionation, 327, 332–5forage, 147for maintenance, 204fouling, 232foundation, 6free jet, 68–9frequency, 72freshwater production, 211frost, 135frost protection, 135functional areas, 94functional sector, 105
galvanization, 7, 8galvanized steel, 235Gambia, 205gas transfer (seeair stripping)gas-bubble disease, 221, 225glass, 243glued joints, 20glue-laminated timber, 13goat, 122granular media filters, 313, 326, 327, 332, 333gravity sand filters (seegranular media filters)growth, fish, 255Gujarat, 202gunite, 243
hardness (of water), 220, 224harness, 198

354 Index
harnessing, 197, 198harrow, 201, 205harvest, 201, 206harvesting (fish), 214hay racks, 118
cattle, 118, 128sheep, 121
heart rate, 203heat balance, 32, 33, 34, 38, 40heat balance, from a building, 56heat balance house level, 46heat of fusion (of water), 220heat of vaporization (of water), 220heterotrophic organisms, 316, 320, 321,
323heterotrophs, 216hoe, 200, 201horse, 202, 203, 204, 205human labor, 62–5, 197, 200, 201, 207husbandry, 200hydrogen cyanide, 224hydrogen sulfide, 169, 171, 224hyperthermia, 32hypothermia, 32
ice-accumulation cooler, 143incineration of solid manure, 193India, 202Indonesia, 205inlet, 68–70
porous, 71inlet ducts, 73–4intensity of, 2ion exchange, 216iron, 224
jet, circular openings, 69jet, discharge, 74jet, free, 68jet, nonisothermal, 71jet, obstructions, 74jet, wall, 70joints, 18–20
labile P, 167labor, 201labor, effiency, 246lagoon, 184, 186land preparation, 197, 200, 201, 205, 206latent heat, 32, 34, 37, 38, 39, 44, 45, 46Latin America, 200, 202, 207layer and broiler, 178
LC50, 228, 239lead, 224length, 116, 119lethal temperature, 234lift, 87liquid, 182, 184liquid manure 171, 183, 184, 185, 186litter, 171, 174, 185, 186livecar, 296, 298livestock, 188live weight, 197, 202load, 6loading capacity, 252losse hay, 156losses, 148lower critical temperature, 33, 38, 39, 40, 41,
45
magnesium, 224maintenance, 200, 204maize, 202, 204manganese, 224manning equation, 259manure, 9, 163, 164, 167, 168, 169, 171, 174,
175, 176, 178, 179, 180, 182, 183, 184,187, 188, 189, 191, 192, 193
manure characteristics, 170–8beef-as excreted, 176–7beef-feedlot, 177dairy, 175–6litter, 171, 178, 185–6poultry-as excreted, 178swine, 177–8units of measure, 174–6
manure characterization, 175manure consistency, 171, 179, 180
liquid, 171, 182, 183, 184, 186semi-liquid (seeslurry)semi-solid, 171, 182, 183, 184slurry, 171, 182, 183, 184solid, 171, 182, 183
manure management functions, 179–81collection, 180production, 179storage, 180–1transfer, 181treatment, 181utilization, 181
manure management systems, 171, 179, 180,181–6
beef, 183–4dairy, 181–3

Index 355
poultry, 176, 185–6swine, 184–5
manure-handling equipment, 171manure-storage pond, 184media, 316, 321, 322, 324, 326, 332mercury, 224metabolic activity, 204metabolic by-products (seewastes, carbon
dioxide, ammonia, nutrients, solids,dissolved matter)
metabolic rate, 202, 203, 204metabolism, 32, 33methane, 169, 185, 186methemoglobinemia, 165microscreen filters, 327, 330–2, 334milk, 206milk storage
direct-accumulation cooler, 143direct-distension cooler, 143refrigeration, 142
milking, 188milling, 202mixer trailers, 131moisture production, 44, 46, 50mold, 152mortar, 9mule, 202, 203
nails, 19nail plates, 20National Pollution Discharge Elimination
System (NPDES) permit, 310negative-pressure system, 67Nepal, 205net forces, 58net pens, 214, 263
aesthetics, 265construction, 265current speed, 264disadvantages, 214flotation, 268mooring design, 269net forces, 268net support, 266operational aspects: dead fish removal, 270operational aspects: feeding, 270operational aspects: net cleaning, 270permit, 214site selection, 264–5size, 214water depth, 264water temperature, 265
wave action, 264wind, 265
net retaining structures, 214nets, 237
cast, 297gill, 297lift, 297seine, 297
net support, 56nitrate, 14, 224, 311, 312, 315–16, 319–21
acid-base equilibrium, 313production, 312, 319, 326removal methods (see alsobiofiltration,
nitrification, ozonation), 319–21, 334suggested levels, 311, 312toxicity, 312
nitrification (see alsoammonia removal,biofilters), 165, 228, 312, 314, 316,319–26, 337
nitrogen, 164, 165, 174, 187, 189, 224, 228,nitrosomonas, 228nitrobacter, 228, 319–21nitrosomonas, 319–21noise, 81nutrition, 202nutrients (see alsophosphorus, nitrate), 163,
164, 174, 185, 188, 189, 216, 310,315–16, 329, 335
nitrogen, 164–6, 171–5phosphorus, 166–7, 171–5
nylon, 237
odors, 167, 168, 169operator, 199, 200optimum temperature (for common aquatic
species), 225outdoor systems, 220, 223outlet, 68, 76–7outlet diffusor, 82ox, 200–206oxygen, 202
carrying capacity, and, 309, 310, 315, 336consumption (by fish), 225–7nitrification, and, 319–22, 324, 326pure, 223solubility, 221–3suggested levels, 311
oxygen consumption, 202oxygen loading, 253, 254oxygen transfer, 221
rate, 221

356 Index
oxygenation (see alsoaeration, air stripping),309, 310, 321
oxylog, 203oyster production, 211ozonation (see alsoozone), 333–4, 335ozone, 311, 314, 321, 333–4, 335ozone treatment, 216, 235, 237
panel products, 20–3particle boards, 21particleboards and fibreboards, 21particulates, 216
removal devices, 216pathogenic, 167pathogens, 167–8pathogens, fish, 311, 314, 315, 332, 335paving, 7PCB’s, 224pellets, 154per unit area, 3peristaltic, 82pesticides, 228pH, 224
control, 310, 337–8interactions, 312, 315, 337–8suggested levels, 310, 311, 313, 315, 338
pH, range for production, 249phosphorus, 164, 166, 167, 174, 187, 188,
189, 310, 311, 315–6, 332photosynthesis, 37pig breeding center, 105pig housing, 101piscilator, 300plastic, 240plough, 197, 198, 199, 200, 201, 202plywood, 20–1pollution, 187polyculture, 248polyethylene, 216, 237, 241polypropylene, 241polyvinyl chloride (PVC), 216, 241ponds, 182, 212, 246, 281, 282, 283–4, 288,
292–3, 295–9depth, 212design types, 249dirurnal water quality, 247embankment, 213excavated, 213feeding method, 213photosynthesis, 247site selection, 213size, 212
stocking, 213types, 213water losses, 212water supply, 212
porous, 68, 70portal frames, 16positive-pressure system, 68post and beam construction, 16potassium, 224poultry, 185poultry manure, 186power, 199, 203, 205power tiller, 205preservatives, 27–8pressure, 70pressure loss, 68, 72production of
carp and tilapia, 211catfish, 211finfish, 211freshwater, 211intensity of, 212per unit area, 213salmon and trout, 211shrimp and prawn, 211world aquacultural, 211, 212
production intensification, 309, 310productivity, 246puddler, 201pump
airlift, 293centrifugal, 289peristaltic, 292reciprocating, 293rotary, 292
Q10 factor, 219
raceways, 212, 213, 252parallel, 213series, 213water supply, 213, 236
raceways, design, 254racks, 121recirculating aquacultural systems, 214, 215
advantages, 215components, 215recycle ratio, 215replacement time, 215residence time, 215turnover time, 215wastewater discharge, 215

Index 357
recirculating systems (seewater-reusesystems)
recovery, 203recycle ratio, 5refrigeration, 142regulators, 200reinforcing, 6, 9relative humidity, 158replacement time, 5residence time, 5ridger, 201roof coverings, 25–6Rotating Biological Contactors (RBCs), 316,
318, 320, 322, 326rotating biological contractors, 216round bale, 150roundwood, 13
salinity (of water), 212, 220, 221, 224salmon, 213sand, 216
cost, 324, 325effective size (D10), 323–5fluidized-bed biofilter applications, 323–6granular media filter applications, 332–3surface area, 324, 325uniformity coefficient (D60/D10), 323–4
sand filters, 213, 332, 333sawn timber, 12–13sealers (of pond), 213sedimentation (seesettling basins, swirl
separators, tube or plate settlers)sedimentation chamber, 216seeder, 200, 201seepage, 188, 212seine reel, 298selenium, 224semi-solid, 182, 183, 184, 185sensible heat, 32, 34, 35, 37, 44, 45, 46, 47,
48, 49sensor
ammonia, 304oxygen, 303pH, 303temperature, 303
settleable solids, 311, 313, 314, 316, 321, 329,334
settling basins, 327, 328, 329, 330, 334shear resistance, 103, 104sheep housing, 89Silsoe Research Institute, 203silver, 224
single-pass (flow-through) systems, 309, 316,332, 334
slopes, 213slurry, 182, 183, 184, 185, 188slurry manures, 182smallholder farmer, 197, 200, 201, 202, 206smallholders, 202socioeconomic, 207sodium, 224soil, 213soil quality, 200solids, 182, 184, 185, 186
total dissolved, 224total suspended, 224
solids characteristicschemical make-up, 313, 314dissolution, 313, 329, 334particulate size, 313, 314, 327, 332, 333settling rate, 327, 329shear resistance, 313, 314specific gravity and density, 314, 327, 330,
332solids disposal, 310, 334–5
composting, 335land application, 310, 335landfill, 335process optionsregulations (see alsoeffluent regulations),
310, 335vermiculture, 335wetland, 335
solids effect on culture systems, 313, 320, 321,322, 326, 337
solids effect on fish health, 313solid manure, 171, 176, 182, 184solid or slurry, 184solids production, 313solids removal
options discussed, 313, 314, 329, 330, 334ozone, and, 321, 327, 333–4, 335processes, 310, 313, 314, 321, 327–34
solid, slurry, or liquid, 184solids thickening (see alsosettling basins;
microscreen filters), 334–5soluble P, 167soluble phosphorus, 166spatial elements, 91spatial module, 105specific flow, 83specific gravity and density, 104, 117, 120, 122specific heat (of water), 219–20spilled feed, 171, 175, 177, 182

358 Index
spreading, 190, 191spreading manure, 190square bale, 148stainless steel, 237–9statistics, 149steel, 216, 238, 239Stoke’s law, 327–8storage, 188storage capacity for livestock wastes, 188storage facilities, 169storage stability, 150storing alfalfa, 156stratification, 219streams, 212strength, 3, 4structural systems, 13submerged biofilters, 316, 317, 320, 321–2,
326sulfate, 224sulfur, 224sunlight, 212surface aerators, 216swathing, 148swine, 184swine manure, 177, 184, 185swirl separator, 327, 328, 329, 330systems, 141systems planning, 105
tank, 191, 192, 271, 287, 288, 292–3, 295–6,299–300
aquaculture, 214biomass loading, 271cleaning behavior, 272desirable characteristics, 216inlet and outlet design, 274, 275labor requirements, 271shapes, 216size and shape, 272, 273
tanks, 236temperature, 93temperature (of water), 219, 221, 225temperature ranges (for common aquatic
species), 225thermal conductivity (of water), 220thermal insulance, 35, 36thermal insulation, 28–9thermal resistance, 35, 37, 38thermoneutral zone, 32, 33, 38, 39, 43thermoregulatory, 33, 34, 37, 38threshing, 202tilapia, 211timber, 11–12
timber connections, 18tool bar, 201topography, 213total coliforons, 167total dissolved, 14total heat production, 33, 34, 39, 41, 43, 44,
45, 46, 47, 48, 49, 50total kjeldehl nitrogen, 164total phosphorus, 166toxicity, 102, 105, 216, 226, 228tractor, 197, 200, 201, 206, 207trailer, 130training, 200transport, 202, 206transportation, 157trap, 298treatment, 169trickling biofilter, 316, 317, 320, 322, 325, 326trickling filters, 216trough, 116trough length
cattle, 116goat, 122sheep, 119
trout, 213truss buildings, 16tsetse, 200tube or plate settler, 327, 328, 329, 330turnover time, 215
u-tube, 216ultraviolet (UV) light, 234underfloor suction, 76–7upflow, 216upper critical temperature, 33, 45uranium, 224
vacuum, 192vanadium, 224vasoconstriction, 37, 46vasodilation, 37, 46ventilation, automatically controlled natural,
55ventilation, equal pressure, 68, 79ventilation, forced, 68ventilation, mechanical, 54ventilation, natural, 54
continuity of mass flow, 55ventilation, natural, combined effects of
thermal buoyancy and wind, 62–5ventilation, natural, due to thermal buoyancy,
55–9neutral plane, 55

Index 359
ventilation, natural, due to wind, 59–62pressure coefficients, 59–63
ventilation, negative pressure, 68, 78ventilation, positive pressure, 68, 79vinyl, 241viscosity, 219void fraction, 216volume expansion, 158
wagon, 202wall coverings, 23–8walls, 7–8warmwater, 223waste (see alsosolids, ammonia, nitrate,
phosphorus, chemotherapeutants,effluent regulations, solids removalprocesses), 103, 188, 189, 221
defined, 311disposal, 334, 335minimization technologies, 309–10, 313treatment technologies, 310, 313, 314,
315–38types of, 310, 311
water, 5, 141properties of, 219temperature, 219
water bowlcattle, 133goats and sheep, 136, 137(F)
water depth, 54water equipment, 138
water quality criteria, 224, 310–12, 315water requirements, 133, 135water resources, 309water resources, effect of manure on, 163–7water reuse (recirculating) systems, 309–16,
321–4, 327, 330, 332–5, 337water supply, 212water trough, 134water use, 309, 310, 316water-raising, 202weather boardings, 23weed control, 197, 200, 201, 206weeder, 200weeding, 201, 206welfare code, 31wet-weight basis, 174wheeled tool-carrier, 201windbreakers, 72wood, 10–14wood (as tank material), 216, 241wood protection, 26work, 202, 205work output, 198, 202, 205, 206work schedule, 205working depth, 199world aquacultural, 1, 2
yoke, 197, 198
Zimbabwe, 202zinc, 224zirconium, 224