chuck wagner manufacturing technology division afrl/mlm phone # 937-904-4583...
TRANSCRIPT
Chuck WagnerManufacturing Technology Division AFRL/MLM Phone # 937-904-4583
An Orientation to: Manufacturing Readiness Levels and Manufacturing Readiness Assessments

2
Purpose and Background• Manufacturing Readiness Levels (MRLs)• IPT Tools for Evaluating MRLs• Manufacturing Readiness Assessment (MRA)
Process• Assessment Example• Discussion
Session Outline

3
Why MRLs? Manufacturing & Industrial Base Challenge
• Consensus among Congress, OSD, CSAF, GAO:“Advanced weapon systems cost too much, take too long to field, and are too
expensive to sustain”
• Recent GAO study of 54 weapons programs:– Core set of 26 programs: RDT&E costs up by 42% and schedule
slipped by 20%• $42.7B total cost growth• 2.5 years slip on average
– Characteristics of successful programs (GAO):• Mature technologies, stable designs, production processes in control• S&T organization responsible for maturing technologies, rather than
program or product development manager
• Defense Science Board evaluated ManTech roles/impacts for AT&L– ManTech can significantly impact across all acquisition phases
– Facilitates manufacturing/industrial base readiness for S&T transition and acquisition

4
Up to 85% of Costs are committed during design and development – At Milestone B, up to 90% of costs could be locked in!
Why MRLs? Life Cycle Cost Commitment
Idea Validation Design Development Production Support
100
80
60
40
20
Cu
mu
lati
ve P
erce
nt
of
Co
st
Life-Cycle Cost Determination
Cost-Reduction Opportunities
Source: DARPA Rapid Design Exploration and Optimization (RaDEO) Project
22%
35%
70%
85%
95%
5
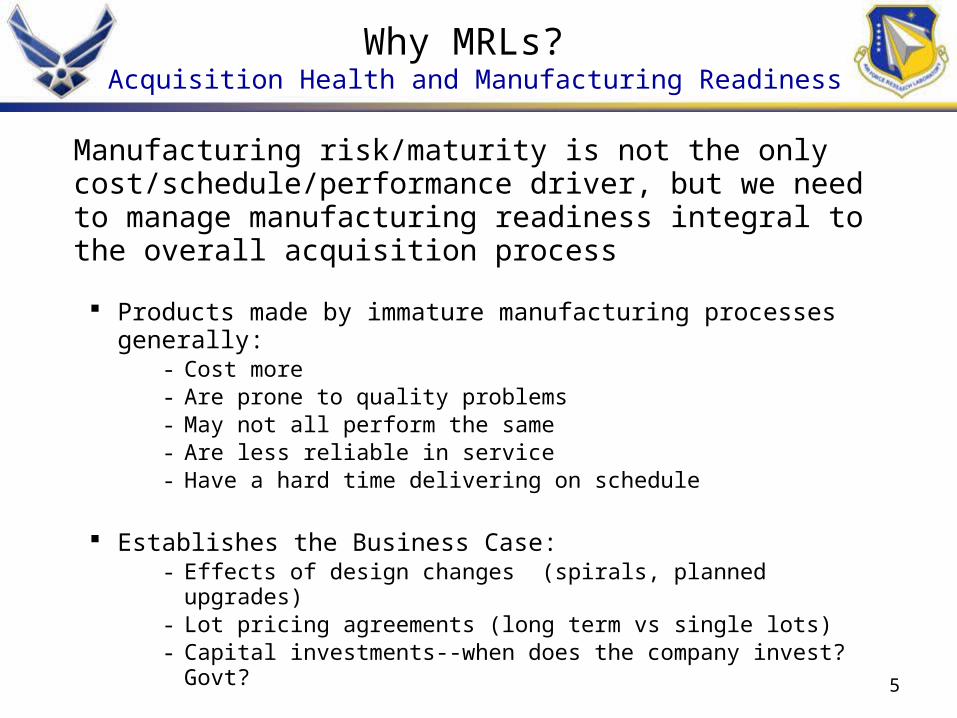
Why MRLs? Acquisition Health and Manufacturing Readiness
Manufacturing risk/maturity is not the only cost/schedule/performance driver, but we need to manage manufacturing readiness integral to the overall acquisition process Products made by immature manufacturing processes generally:
- Cost more- Are prone to quality problems- May not all perform the same- Are less reliable in service- Have a hard time delivering on schedule
Establishes the Business Case:- Effects of design changes (spirals, planned upgrades)- Lot pricing agreements (long term vs single lots)- Capital investments--when does the company invest? Govt?

6
Elements of Manufacturing Readiness
• Process planning• Manufacturing
instructions• Process selection• Manufacturing technology• Quality assurance• Production
planning/scheduling• Equipment
• Facilities and layout• Maintenance• Materials management• Supply chain management• Workforce development• Tooling development• Safety and ergonomics• Product testing• Product/process integration
Demands a Disciplined Methodology to Assess, Track, and Manage Manufacturing Readiness

7
MRL Current & Future State
• Current– ManTech is establishing the capability to conduct manufacturing
readiness assessments for AFRL ATDs– Conducted MRAs and incorporated MRLs into approximately 10
key AFRL ATDs; 10 more planned through FY06 – Developing MRL training curriculum focused on MRL 3-6– In partnership with JDMTP, developing DAU tools for program
managers and working final MRL definitions & policy changes– Preparing to conduct MRAs on acquisition pilots
• Desired Future State
– Manufacturing maturity considerations a normal part of acquisition milestone decision-making processes
– Program managers possess a working understanding of manufacturing issues and associated risk
– Acquisition plans and tech transition cost estimates incorporate manufacturing maturity considerations

8
MRL TrainingActivities
• Developing training for ManTech cadre and program IPTs– Train and “certify” ManTech personnel to lead manufacturing
readiness assessments (MRA) and risk mitigation plans– Train IPTs to understand and apply basic MRL concepts
• Current training program– 1 hour Executive Orientation– 8 hour ATD/IPT Introductory Training – 4 day MRA Training (principally for ManTech personnel)
• Training program leveraging selected external activities– DAU Courses
• Topic introduced concurrent with existing PM and Mfg training courses• More focused training under development
– Univ of Tenn Industrial Preparedness Training (3 week duration)• MBA style look at a company business viability and production capability
Will Evolve to Encompass Full Acquisition Spectrum and Institutionalize in AFIT and DAU

9
• Purpose and Background Manufacturing Readiness Levels IPT Tools for Evaluating MRLs • Manufacturing Readiness Assessment
Process • Assessment Example • Discussion
Session Outline

10
Manufacturing Readiness Levels (MRLs)
• Common language and standard for
– Assessing the manufacturing maturity of a technology or product and plans for its future maturation
– Understanding the level of manufacturing risk in trying to produce a weapon system or transition the technology into a weapon system application
• Designed to complement TRLs
• Designed to help set the agenda for manufacturing risk mitigation

11
Manufacturing Readiness & Technology Transition
Success in manufacturing affects– Performance Success of the Technology– Defects and Reliability of the Technology
Consider all these elements equally for Readiness
PRODUCT
MATERIALPropertiesReliability
ProcessingCost
Quality
DESIGNLoads
Use ConditionsProcesses AvailableMaterial Selection
Quantity
PROCESSINGEquipment
Effect on MaterialsConfiguration (layout)
ToolingQuantityQuality

12
Provide a common language and widely-understood standard for
• Assessing the performance maturity of a technology and plans for its future maturation
• Understanding the level of performance risk in trying to transition the technology into a weapon system application
Technology Readiness Levels (TRLs)

13
TRLs Leave Major Transition Questions Unanswered
PERFORMANCE,
SCHEDULE & COST RISK
SCHEDULE & COST RISK
• Is this level of performance reproducible in items 2 - 1000?
• What will these cost in production?
• Can these be made in a production environment by someone without a PhD?
• Are the key materials and components available?
PERFORMANCE,
SCHEDULE & COST RISK
PERFORMANCE,
SCHEDULE & COST RISK
QUESTIONS CONCERNS
TRL 6/7 – Prototype in Relevant/Service Environment

14
TRL 9MissionProven
TRL 8System
Qual
TRL 7Prototype
in OpsEnvironmt
TRL 6Prototype
in RepEnvironmt
TRL 5Breadbrd
in RepEnvironmt
TRL 4Breadbrd
inLab
TRL 3Proof
of Concept
TRL 2ConceptFormulat
TRL 1Basic
PrinciplesObserved
MRL 10Lean Mfg
Proc’s
MRL 9Mfg
Proc’s In Place for
FRP
MRL 8Mfg
Proc’s In Place for
LRIP
MRL 7Mfg
Proc’s Maturing for LRIP
MRL 6Mfg
Proc’s In Prod
Rep Environmt
MRL 5Mfg
Proc’s In Relevant Environmt
MRL 4Mfg
Proc’sIn Lab
Environmt
MRL 3Mfg
ConceptsIdentified
Production & Deployment
System Development & Demonstration
Technology Development
Concept Refinement
Relationship To System Milestones
Relationship To Technology Readiness Levels
CBA
MRL Relationships
15
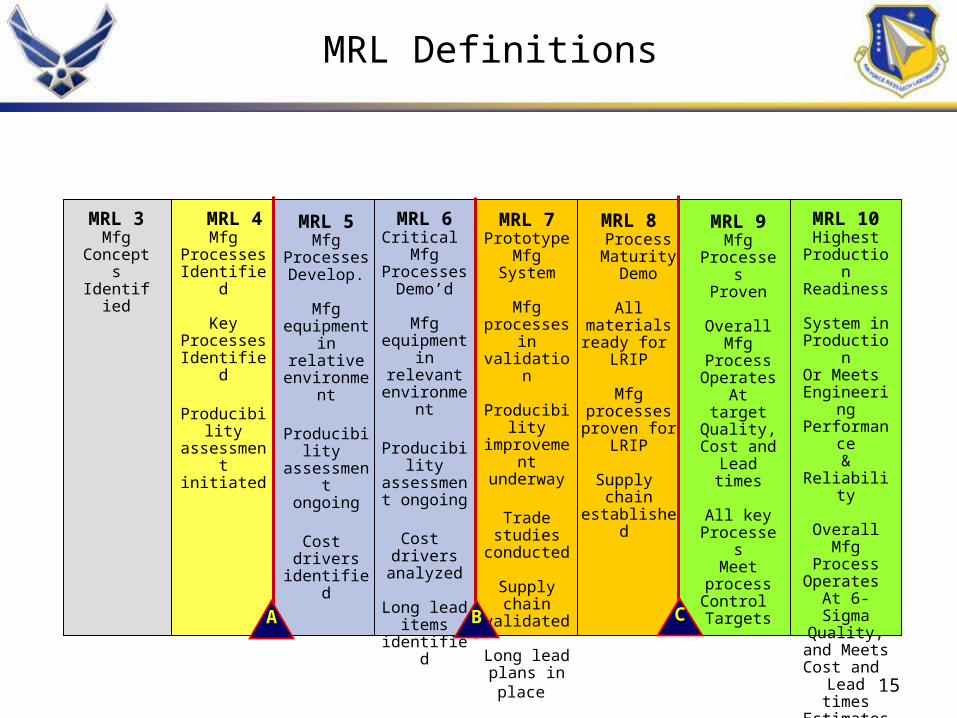
MRL 4Mfg
ProcessesIdentified
KeyProcessesIdentified
Producibility assessment
initiated
MRL 5Mfg
Processes Develop.
Mfgequipment in
relativeenvironment
Producibility assessment
ongoing
Cost drivers
identified
MRL 3Mfg
ConceptsIdentified
MRL 6Critical
MfgProcesses
Demo’d
Mfgequipment in relevant
environment
Producibility assessment
ongoing
Cost drivers
analyzed
Long lead items
identified
MRL 7Prototype
Mfg System
Mfg processes in
validation
Producibility improvement
underway
Trade studies
conducted
Supply chain validated
Long lead plans in place
MRL 8 Process Maturity
Demo
All materials ready for
LRIP
Mfg processes proven for
LRIP
Supply chain
established
MRL 9Mfg
ProcessesProven
OverallMfg
ProcessOperates At targetQuality,
Cost and Lead times
All keyProcesses
Meet processControl Targets
MRL 10Highest
Production Readiness
System in ProductionOr Meets
EngineeringPerformance& Reliability
OverallMfg
ProcessOperates At 6-SigmaQuality, and Meets Cost
and Lead timesEstimates
A B C
MRL Definitions

16
MRL Evaluation Criteria
• Technology and Industrial Base• Design• Materials• Cost and Funding• Process Capability and Control• Quality Management• Manufacturing Personnel• Facilities• Manufacturing Management

17
Evaluating MRLs
The Best Way to Ensure Manufacturing Readiness:
• Know what Processes are Being Used for Manufacturing and
• Know that these Manufacturing Processes are Capable and Controlled (Stable)

18
• Purpose and Background• Manufacturing Readiness Levels IPT Tools for Evaluating MRLs • Manufacturing Readiness Assessment
Process • Assessment Example • Discussion
Session Outline

19
MRL Tools Use to Evaluate…
3 Process Flow Charts Basic manufacturing concepts
4 Detailed Process Flow Key manufacturing processesCharts
5 Value Stream Mapping Mapping the current stateand identifying waste
6-10 Value Stream Mapping Mapping the future state and eliminating waste
Mapping Tools for MRL

20
MRL Tools Use to Evaluate…
4-6 Key Characteristics Requirements and Tolerances
4 Process Variables Map Which Variables to Control
5-9 Process Capability Predictability of ProcessPerformance
5-9 Design of Experiments Multiple factors and levels ofindependent variables
6-9 Failure Modes and Risks associated with failuresEffects Analysis
Process Control Tools for MRL

21
Process Flow Charts
Value Stream Maps
Key Char.;Variables Mapping
Process Capability; DOE
FMEA
Process & Sources at Deeper Levels& Custom / Tailored Tools
MRL 4Mfg
ProcessesIdentified
KeyProcessesIdentified
Producibility assessment
initiated
MRL 5Mfg
Processes Develop.
Mfgequipment in
relativeenvironment
Producibility assessment
ongoing
Cost drivers
identified
MRL 3Mfg
ConceptsIdentified
MRL 6Critical
MfgProcesses
Demo’d
Mfgequipment in relevant
environment
Producibility assessment
ongoing
Cost drivers
analyzed
Long lead items
identified
MRL 7Prototype
Mfg System
Mfg processes in
validation
Producibility improvement
underway
Trade studies
conducted
Supply chain validated
Long lead plans in place
MRL 8 Process Maturity
Demo
All materials ready for
LRIP
Mfg processes proven for
LRIP
Supply chain
established
MRL 9Mfg
ProcessesProven
OverallMfg
ProcessOperates At targetQuality,
Cost and Lead times
All keyProcesses
Meet processControl Targets
MRL 10Lean
System Production
Meets EngineeringPerformance& Reliability
OverallMfg
ProcessOperates At 6-SigmaQuality, and Meets Cost
and Lead timesEstimates
A B C
Tools for MRL Overlaid on Definitions

22
Manufacturing state of the art definedManufacturing science initiatives defined
10
9
8
7
6
5
4
1-3
SD
DLR
IPF
RP
TD
CR
PR
E-
CR
Manufacturing technology voids/initiatives identified
Critical manufacturing process capability needs defined. Yield/rate issues identified. Manufacturing technology development underway.
Process yield/capability for all critical processes evaluated ina production representative environment.
Manufacturing processes controlled to 3 sigma level. Yields and ratesdemonstrated to meet LRIP needs. Improvement ongoing
Manufacturing processes controlled to 6 sigma level. Yields and ratesmeeting rate production needs. Continuous improvement on-going.
Process capability demonstrated on SDD articles. Required Manufacturing technology solutions demonstrated.
Process yields and capability validated as sufficient to meet LRIP requirements. Required Manufacturing technology validated.
MRL Characteristics
Process Control and CapabilityData Captured at Each Level

23
Process Flow Charts
MRL 4Mfg
ProcessesIdentified
KeyProcessesIdentified
Producibility assessment
initiated
MRL 5Mfg
Processes Develop.
Mfgequipment in
relativeenvironment
Producibility assessment
ongoing
Cost drivers
identified
MRL 3Mfg
ConceptsIdentified
MRL 6Critical
MfgProcesses
Demo’d
Mfgequipment in relevant
environment
Producibility assessment
ongoing
Cost drivers
analyzed
Long lead items
identified
MRL 7Prototype
Mfg System
Mfg processes in
validation
Producibility improvement
underway
Trade studies
conducted
Supply chain validated
Long lead plans in place
MRL 8 Process Maturity
Demo
All materials ready for
LRIP
Mfg processes proven for
LRIP
Supply chain
established
MRL 9Mfg
ProcessesProven
OverallMfg
ProcessOperates At targetQuality,
Cost and Lead times
All keyProcesses
Meet processControl Targets
MRL 10Lean
System Production
Meets EngineeringPerformance& Reliability
OverallMfg
ProcessOperates At 6-SigmaQuality, and Meets Cost
and Lead timesEstimates
Tools for MRL 3 Data Collection
24
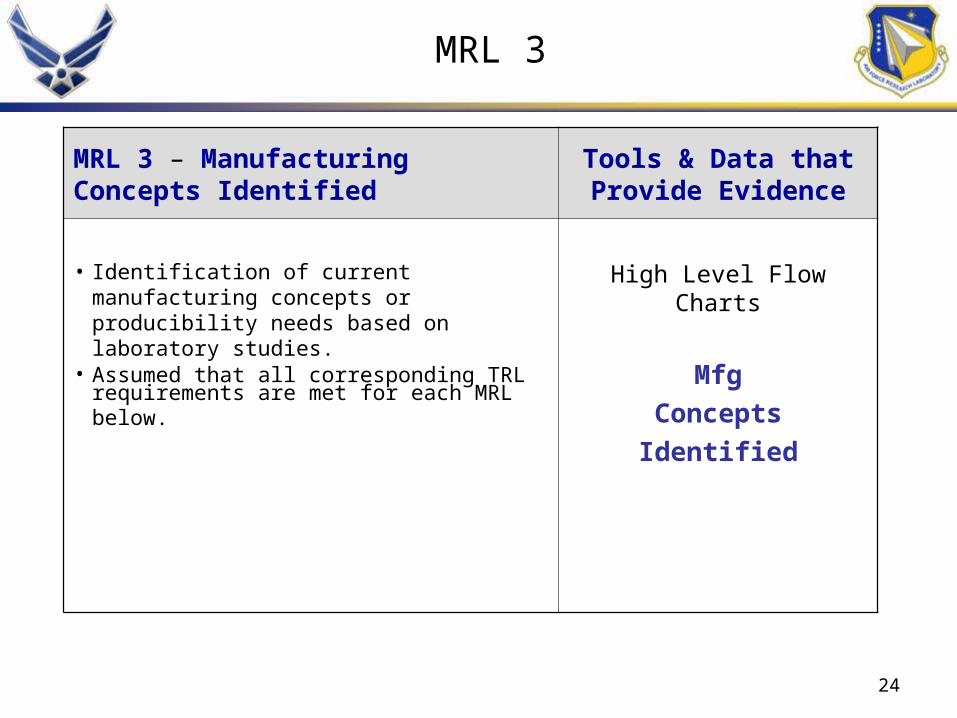
MRL 3 – Manufacturing Concepts Identified
Tools & Data that Provide Evidence
• Identification of current manufacturing concepts or producibility needs based on laboratory studies.
• Assumed that all corresponding TRL requirements are met for each MRL below.
High Level Flow Charts
Mfg
Concepts
Identified
MRL 3

25
Things to look for in Flow Charts at this level:
• Major Processes Identified
• Any Duplication/Repeated Processes
• Any Special Processes
• Any Uncertain/Unknown Processes
• Material or Design Issues
• Potential Equipment/Supply Issues
• Miscommunication/Misinterpretation
MRL 3 Evidence in Flow Charts

26
Process Flow Charts
Key Char.;Variables Mapping
MRL 4Mfg
ProcessesIdentified
KeyProcessesIdentified
Producibility assessment
initiated
MRL 5Mfg
Processes Develop.
Mfgequipment in
relativeenvironment
Producibility assessment
ongoing
Cost drivers
identified
MRL 3Mfg
ConceptsIdentified
MRL 6Critical
MfgProcesses
Demo’d
Mfgequipment in relevant
environment
Producibility assessment
ongoing
Cost drivers
analyzed
Long lead items
identified
MRL 7Prototype
Mfg System
Mfg processes in
validation
Producibility improvement
underway
Trade studies
conducted
Supply chain validated
Long lead plans in place
MRL 8 Process Maturity
Demo
All materials ready for
LRIP
Mfg processes proven for
LRIP
Supply chain
established
MRL 9Mfg
ProcessesProven
OverallMfg
ProcessOperates At targetQuality,
Cost and Lead times
All keyProcesses
Meet processControl Targets
MRL 10Lean
System Production
Meets EngineeringPerformance& Reliability
OverallMfg
ProcessOperates At 6-SigmaQuality, and Meets Cost
and Lead timesEstimates
A
Tools for MRL 4 Data Collection

27
MRL 4 – Manufacturing Processes In LabEnvironment
Tools & Data that Provide Evidence
• Conceptual design completed.• Requirement validation underway and there are large
numbers of engineering/design changes.• Required investments, such as manufacturing
technology identified.• Component physical and functional interfaces have not
been defined.• Processes to insure producibility, manufacturability and
quality are in place and are sufficient to produce technology demonstrators.
• Manufacturing cost drivers emerging.• Producibility assessments have been initiated.• Key technologies at least at TRL 4.
More Detailed Flow Charts
Key Characteristics
Process Variables Map
Manufacturing processes identified
Key processes identified
Producibility assessment initiated
MRL 4

28
Things to look for in Flow Charts at this level:
• Process steps identified
• Any training needs
• Duplication/repeated steps
• Material or design issues
• Unnecessary work
• Equipment needs
• Miscommunication or misinterpretations
• Undefined steps
• Technology needs
MRL 4 Evidence in Flow Charts

29
Milestone “ A ”Key Manufacturing Considerations
Process Capability and Control– Areas where manufacturing technology advancements will be required
adequately addressed in Technology Development Phase plans?
Design and Technology– Key technologies at least at TRL 4 level of maturity?– Producibility challenges associated with this concept adequately addressed in
plans for Technology Development Phase?
Industrial Base Capability and Materiel– Industrial base gaps/risks identified for key technologies? – Single sole/source or foreign source dependencies identified?– Risks associated with exotic, critical, unproven or hazardous materials identified?
– Strategies in place to mitigate?
Costs/Funding and Manufacturing/Quality Management– Funding for manufacturing readiness improvement sufficient to reach MRL 6?– Potential manufacturing cost drivers identified?– Manufacturing and quality strategies adequate to produce technology
demonstrators?– Unusual special tooling and test equipment requirements identified?
A

30
Process Flow Charts
Value Stream Maps
Key Char.;Variables Mapping
Process Capability; DOE
MRL 4Mfg
ProcessesIdentified
KeyProcessesIdentified
Producibility assessment
initiated
MRL 5Mfg
Processes Develop.
Mfgequipment in
relativeenvironment
Producibility assessment
ongoing
Cost drivers
identified
MRL 3Mfg
ConceptsIdentified
MRL 6Critical
MfgProcesses
Demo’d
Mfgequipment in relevant
environment
Producibility assessment
ongoing
Cost drivers
analyzed
Long lead items
identified
MRL 7Prototype
Mfg System
Mfg processes in
validation
Producibility improvement
underway
Trade studies
conducted
Supply chain validated
Long lead plans in place
MRL 8 Process Maturity
Demo
All materials ready for
LRIP
Mfg processes proven for
LRIP
Supply chain
established
MRL 9Mfg
ProcessesProven
OverallMfg
ProcessOperates At targetQuality,
Cost and Lead times
All keyProcesses
Meet processControl Targets
MRL 10Lean
System Production
Meets EngineeringPerformance& Reliability
OverallMfg
ProcessOperates At 6-SigmaQuality, and Meets Cost
and Lead timesEstimates
A
Tools for MRL 5 Data Collection

31
MRL 5 – Manufacturing Processes In Relevant Environment
Tools & Data that Provide Evidence
• Most initial manufacturing requirements defined and validated (key characteristics)
• Manufacturing technology initiatives ongoing.• Component physical and functional interfaces have not
yet been defined. Significant engineering changes • Producibility assessments ongoing• Key materials, machines and tooling, personnel skills,
and inspection and test equipment have been demonstrated in a relevant environment
• Most manufacturing/quality plans, processes and procedures are in development
• Cost drivers identified.
Key Characteristics
Value Stream Map
Process Capability Study
Design of Experiments
Mfg Processes in Development
Mfg equipment inrelative environment
Producibility assessmentsongoing
Cost drivers identified
MRL 5

32
• Mapping and analyzing the entire set of activities from raw material to finished product will help you evaluate MRL 5
Final Customer
Process, activity, or function
Material
MRL 5 and Value Stream Analysis

33
• More detailed map of the manufacturing process
– Creates a baseline against which to measure improvements
– Quantifies technical, cycle time and cost drivers
• Provides baseline data for assessing scale-up
– Determines capacity required for expected production rates
– Quantifies capacity/resource constraints
• Defines facilitization/equipment required
• Often includes supply chain processes
• Creates a forum for evaluating manufacturing options
– Enables the redesign of an improved process
• Excellent Tool for any IPT
VSA for MRL 5 Evidence

34
Product/Product Family
Collect Data/Draw Current State
Opportunities & Implementation
Set Goals/Draw Future State
Understand how the processcurrently operates
Design an improved process
Define and make changes to realize the Future State
Choose a product/family
Repe
atValue Stream Mapping Process

35
• Frequently occurring VSA opportunities:– Manual processing– High scrap/defect or low yield rates– Rework– Long setup times– Scale-up constraints - facility, training
(learning curve), equipment, tooling– Product design constraints– Material cost and availability (maturity)– Inventory build-up throughout the process
Opportunities/Constraints

Shipping
I
Station 43
90/60/30 day Forecasts
Weekly Fax
Forwardfuselage1 week
1 week1 hour
7 hours10 min
0.5 hours40 min
2.7 hours40 min
2 hours20 min
1.0 dayProduction Lead time
Processing Time
=8.5 days
=170 min
Weekly Schedule
Station 45
4 pcs/mo
2 shifts
I
C/O=0
Debur
C/T=20 min
Uptime=100%
1 day
Staging
C/O=0
Countersink
C/T=40 min
Uptime=100%
2 hoursC/O=10 minutes
Drill
C/T=40 min
Uptime=80%
2.7 hoursC/O=10 minutes
Locate
C/T=10 min
Uptime=100%
0.5 hoursC/O= 1 hour
Prep
C/T=1 hour
Uptime=85%
7 hours
1 1 1 1 1
6-week Forecast
Production Control
MRP
Forward
Fuselage
Current State Value Stream Map Example (Hole Drilling)
Station 44

37
PeopleEquipmentMaterialMethodsMeasurementEnvironmentInformation
PeopleEquipmentMaterialMethodsMeasurementEnvironmentInformation
InputsInputs OutputsOutputs
Co
ntr
ols
Co
ntr
ols
Process Control & Capability

38
1. The features or mechanisms that control the execution of a Process (including process initiation, selection of process steps, selection of alternative steps, iteration of steps within a loop, and process termination).
2. Controlling mechanisms that ensure that a Process is conducted to maximum cost-effectiveness (including entry criteria, formal procedure specifications, and exit criteria).
Degree to which a process is defined, formalized and followed
will help to predict the rate of Variation and potential Defects.
Process Control Defined

39
• Process Control monitors the extent to which our products meet specifications.
• Two "enemies" of product quality: – (1) deviations from target specifications – (2) excessive variability around target specifications
• Designed Experiments are used during the earlier stages of developing the production process to optimize these two quality characteristics
• Quality Control Methods are on-line or in-process quality control procedures to monitor an on-going production process.
Process Control and Readiness

40
• “In control“ or stable process behavior is consistent over the time when compared against itself.
• Process capability compares the process output against a specification that assumes defect-free production
• Good capability needs stability ("in control") first. • If the process is stable, you can compare its actual
performance against the required performance and take corrective action.
Example:If the process is stable but not capable you can predict the level of scrap. You also know where you are and where you need to go for acceptability.
If the process is not stable, then you don't know what you will get, where you are, and where to steer, except that you need to stabilize the process first.
Process Capability

41
• A process can be considered ‘stable’ if the observed average behavior and the observed variance is ‘consistent’ and ‘predictable’ over time.
• An unstable process is caused by
‘unusual’ variation. The output of an unstable process is ‘unpredictable’.
Process Stability

42
Purpose of capability studies– to define process capability– to help identify limiting causes– to demonstrate capability to customers– to improve process capability
• reduce defects, waste, cost, customer returns• undertake higher spec. work
– to employ statistical process controls
• Capability measured by Cp /Cpk
Capability Studies

43
Assessing Process Capability
• Compare the variability of the process output to the desired tolerance range
• You may also include a comparison between the process average and some nominal or target value
Process Capability on a pilot process prior to ramp-up will show whether actual performance meets or exceeds required performance

44
What is a good Cpk ratio?
– Minimum normally 1.33 Cpk• Based on 4 sigma spread
• Extra sigma compensates for
– Larger spread over time & larger population
– Particularly mean shift
• Equivalent to 63 DPM
– Many companies now looking for 2.0 Cpk• Consistent with 6 sigma concept
• Equivalent to 0 DPM– Based on centered process– Allowing up to 2 sigma shift
Capability Studies
45
• When analyzing a process, experiments are often used to evaluate which process inputs have a significant impact on the process output, and what the target level of those inputs should be to achieve a desired result (output).
• Experiments can be designed in many different ways to collect this information.
Design of Experiments (DOE)

46
• The Design of an experiment addresses the questions outlined by your organization by stipulating the following: – The factors to be tested – The levels of those factors – The structure and layout of experimental runs or
conditions.
• A well-designed experiment is as simple as possible - obtaining the required information in a cost effective and reproducible manner.
DOE Guidelines

47
Process Flow Charts
Value Stream Maps
Key Char.;Variables Mapping
Process Capability; DOE
FMEA
MRL 4Mfg
ProcessesIdentified
KeyProcessesIdentified
Producibility assessment
initiated
MRL 5Mfg
Processes Develop.
Mfgequipment in
relativeenvironment
Producibility assessment
ongoing
Cost drivers
identified
MRL 3Mfg
ConceptsIdentified
MRL 6Critical
MfgProcesses
Demo’d
Mfgequipment in relevant
environment
Producibility assessment
ongoing
Cost drivers
analyzed
Long lead items
identified
MRL 7Prototype
Mfg System
Mfg processes in
validation
Producibility improvement
underway
Trade studies
conducted
Supply chain validated
Long lead plans in place
MRL 8 Process Maturity
Demo
All materials ready for
LRIP
Mfg processes proven for
LRIP
Supply chain
established
MRL 9Mfg
ProcessesProven
OverallMfg
ProcessOperates At targetQuality,
Cost and Lead times
All keyProcesses
Meet processControl Targets
MRL 10Lean
System Production
Meets EngineeringPerformance& Reliability
OverallMfg
ProcessOperates At 6-SigmaQuality, and Meets Cost
and Lead timesEstimates
A B
Tools for MRL 6 Data Collection

48
MRL 6 – Manufacturing Processes In Production Representative Environment
Tools & Data that Provide Evidence
• Majority of manufacturing requirements have been preliminarily defined and validated, to include key characteristics, but there are still significant engineering/design changes.
• Preliminary design of critical components completed. Component physical and functional interfaces have not yet been defined.
• Materials, machines and tooling, personnel skills, and Inspection and test equipment have been demonstrated in a relevant environment but most manufacturing processes and procedures are in development (or manufacturing initiatives ongoing).
• Producibility assessments ongoing. • Production cost drivers/goals analyzed.• System level DTC goals set. • Long lead needs and key supply chain elements
identified.
Key Characteristics
Value Stream Maps and Analyses
Process Capability Study
Design of Experiments
Failure Modes & Effects Analysis
Critical Mfg Processes Demo’d
Mfg equipment
in relevant environment
Producibility assessment ongoing
Cost drivers analyzed
Long lead items identified
MRL 6

49
• Consider the demand requirements for scale-up• Draw the ideal process
– Steps, equipment, manning • Identify the constraints to realizing the ideal state• Quantify the constraints and the expected impact
of removing them– Time, cost, etc.
• Determine capacity required for expected production rates
• Define facilities and equipment required• Include key suppliers
Developing the Future State VSA

Station 44
Shipping
I
Station 43
90/60/30 day Forecasts
Weekly Fax
Forwardfuselage
1 day
1 day60 min
.5 dayProduction Lead time
Processing Time
=1.6 days
=140 min
Weekly Schedule
Station 45
30 pcs/mo
2 shifts
I
C/O=0
Inspect
C/T=20 min
Uptime=100%
.5 day
Staging
C/O=0
Drill, Countersink,
debur
C/T=60 min
Uptime=100%
45 minC/O= 1 hour
Inspect, Prep, &Locate
C/T=60 min
Uptime=85%
45 min
1 3
1
6-week Forecast
Production Control
MRP
Forward
Fuselage
Future State Value Stream Map Example (Hole Drilling)
45 min
60 min
45 min
20 min

51
1. Identify all probable failure modes
2. Assign a value on a 1-10 scale for the Severity, Probability of Occurrence, and Probability of Detection for each of the potential failure modes.
3. After assigning a value, the three numbers for each failure mode are multiplied together to yield a Risk Priority Number (RPN).
4. The RPN becomes a priority value to rank the failure modes with the highest number demanding the most urgent improvement activity.
5. Error-proofing, or “poka-yoke” actions are often an effective response to high RPN's.
How to Conduct FMEA
52
Milestone “ B ”Key Manufacturing Considerations
Process Capability and Control- Demonstrated yields and capabilities of key processes support the inclusion of essential technologies or design features in system design?- Essential manufacturing technology development well advanced?
Design and Technology- Key technologies at least at TRL 6 level of maturity?- Known producibility challenges associated with the chosen technologies and basic design features of this system being addressed?- Is there an effective process planned or in place for assuring producibility of design?
Industrial Base Capability and Materiel- Sufficient industrial base capability to support manufacture of SDD articles?- Effective plans in place to address
Long-lead materialsSole or foreign source issues special handling issuesMaturity of new materials
Costs/Funding and Manufacturing/Quality Management- Funding and planning for manufacturing readiness improvement sufficient to reach MRL 8?- Credible production costs goals set and effective plans in place to control/reduce production costs?- Key special tooling and test equipment demonstrated in production representative environment?
B

53
Process Flow Charts
Value Stream Maps
Key Char.;Variables Mapping
Process Capability; DOE
FMEA
Process & Sources at Deeper Levels
MRL 4Mfg
ProcessesIdentified
KeyProcessesIdentified
Producibility assessment
initiated
MRL 5Mfg
Processes Develop.
Mfgequipment in
relativeenvironment
Producibility assessment
ongoing
Cost drivers
identified
MRL 3Mfg
ConceptsIdentified
MRL 6Critical
MfgProcesses
Demo’d
Mfgequipment in relevant
environment
Producibility assessment
ongoing
Cost drivers
analyzed
Long lead items
identified
MRL 7Prototype
Mfg System
Mfg processes in
validation
Producibility improvement
underway
Trade studies
conducted
Supply chain validated
Long lead plans in place
MRL 8 Process Maturity
Demo
All materials ready for
LRIP
Mfg processes proven for
LRIP
Supply chain
established
MRL 9Mfg
ProcessesProven
OverallMfg
ProcessOperates At targetQuality,
Cost and Lead times
All keyProcesses
Meet processControl Targets
MRL 10Lean
System Production
Meets EngineeringPerformance& Reliability
OverallMfg
ProcessOperates At 6-SigmaQuality, and Meets Cost
and Lead timesEstimates
A B
Tools for MRL 7 Data Collection

54
MRL 7 – Manufacturing Processes Maturing for LRIP
Tools & Data that Provide Evidence
• Manufacturing processes in final validation test • Engineering/design changes decreasing. System
transitioned to formal configuration control• Physical and functional interfaces clearly defined • Initial producibility improvements underway. Producibility
risk assessments and trade studies ongoing.• All raw materials and components are fully understood, in
production and available to meet planned LRIP schedule.• Supply chain being validated • Long lead readiness plans in place. • DTC estimates and detailed production estimates being
established• Manufacturing/quality procedures in final validation tests
Key CharacteristicsValue Stream Maps and AnalysesProcess Capability StudyDesign of ExperimentsFailure Modes and Effects Analysis
Prototype Mfg SystemMfg processes in validationProducibility improvement underwayTrade studies conductedSupply chain validatedLong lead plans in place
MRL 7
55
Process Flow Charts
Value Stream Maps
Key Char.;Variables Mapping
Process Capability; DOE
FMEA
Process & Sources at Deeper Levels
MRL 4Mfg
ProcessesIdentified
KeyProcessesIdentified
Producibility assessment
initiated
MRL 5Mfg
Processes Develop.
Mfgequipment in
relativeenvironment
Producibility assessment
ongoing
Cost drivers
identified
MRL 3Mfg
ConceptsIdentified
MRL 6Critical
MfgProcesses
Demo’d
Mfgequipment in relevant
environment
Producibility assessment
ongoing
Cost drivers
analyzed
Long lead items
identified
MRL 7Prototype
Mfg System
Mfg processes in
validation
Producibility improvement
underway
Trade studies
conducted
Supply chain validated
Long lead plans in place
MRL 8 Process Maturity
Demo
All materials ready for
LRIP
Mfg processes proven for
LRIP
Supply chain
established
MRL 9Mfg
ProcessesProven
OverallMfg
ProcessOperates At targetQuality,
Cost and Lead times
All keyProcesses
Meet processControl Targets
MRL 10Lean
System Production
Meets EngineeringPerformance& Reliability
OverallMfg
ProcessOperates At 6-SigmaQuality, and Meets Cost
and Lead timesEstimates
A B C
Tools for MRL 8 Data Collection

56
MRL 8 – Manufacturing Processes In Place for LRIP
Tools & Data that Provide Evidence
• Design sufficiently stable to enter into low rate initial production.
• Physical and functional interfaces clearly defined. • All materials are in production and available to meet
planned LRIP schedule. • Manufacturing and quality processes and procedures
have been proven, are under control and ready for low rate initial production.
• Initial producibility risk assessments completed.• Production cost estimates meet DTC goals.• Supply chain established and stable.• Key technologies at least at TRL 8.
Key Characteristics
Value Stream Maps and Analyses
Process Capability Study
Design of Experiments
Failure Modes and Effects Analysis
Process Maturity Demo
All materials ready for
LRIP
Mfg processes proven for LRIP
Supply
chain established
MRL 8

57
Milestone “ C ”Key Manufacturing Considerations
Process Capability and Control• Critical manufacturing processes mature enough to produce production-representative
test articles during LRIP?• Key program manufacturing processes mature enough to support LRIP cost and
schedule requirements?• Key manufacturing technology advancements complete?
Design and Technology• Key technologies at least TRL 8?• Design stable enough such that:
- Items produced in LRIP will be production-representative?- LRIP schedule can be met?
• Effective trade studies been performed to assure proper balance between producibility (cost) and performance?
• Ability to produce all design “key characteristics” with existing processes been verified in a production-representative environment?
Industrial Base Capability and Materiel• Sufficient industrial base capability in place to support production of LRIP articles?• Long-lead materials and sole/foreign source materiel risks adequately managed to
support LRIP cost and schedule?• New materials been proven to be mature enough to support LRIP and be
representative of production?
Costs/Funding and Manufacturing/Quality Management• Funding and planning for manufacturing readiness improvement sufficient to reach
MRL 9?• Production cost estimates meet design to cost goals?• Special tooling, test equipment and key manufacturing quality procedures validated and
in place to support LRIP?
C

58
Process Flow Charts
Value Stream Maps
Key Char.;Variables Mapping
Process Capability; DOE
FMEA
Process & Sources at Deeper Levels& Custom / Tailored Tools
MRL 4Mfg
ProcessesIdentified
KeyProcessesIdentified
Producibility assessment
initiated
MRL 5Mfg
Processes Develop.
Mfgequipment in
relativeenvironment
Producibility assessment
ongoing
Cost drivers
identified
MRL 3Mfg
ConceptsIdentified
MRL 6Critical
MfgProcesses
Demo’d
Mfgequipment in relevant
environment
Producibility assessment
ongoing
Cost drivers
analyzed
Long lead items
identified
MRL 7Prototype
Mfg System
Mfg processes in
validation
Producibility improvement
underway
Trade studies
conducted
Supply chain validated
Long lead plans in place
MRL 8 Process Maturity
Demo
All materials ready for
LRIP
Mfg processes proven for
LRIP
Supply chain
established
MRL 9Mfg
ProcessesProven
OverallMfg
ProcessOperates At targetQuality,
Cost and Lead times
All keyProcesses
Meet processControl Targets
MRL 10Lean
System Production
Meets EngineeringPerformance& Reliability
OverallMfg
ProcessOperates At 6-SigmaQuality, and Meets Cost
and Lead timesEstimates
A B C
Tools for MRL 9 Data Collection

59
MRL 9 – Manufacturing Processes In Place for FRP
Tools & Data that Provide Evidence
• During LRIP all systems engineering/design requirements are met and there are only minimal system engineering/design changes.
• Materials are in production and available to meet planned production schedules.
• Manufacturing processes and procedures are established and controlled in production to three-sigma or some other appropriate quality level.
• Personnel, machines, tooling and inspection and test equipment deliver three-sigma or some other appropriate quality level in production.
• Production risk monitoring is ongoing. • LRIP actual costs meet estimates
Key Characteristics
Value Stream Maps and Analyses
Process Capability Study
Design of Experiments
Failure Modes and Effects Analysis
Mfg Processes Proven
Overall Mfg Process Operates At target Quality, Cost and Lead times
All key Processes Meet process Control Targets
MRL 9

60
Process Capability and Control– All key program manufacturing processes mature enough to support rate
production cost and schedule requirements?
Design and Technology– Key technologies at TRL 9?– Design been proven to be producible and stable?
Industrial Base Capability and Materiel– Sufficient industrial base capability in place to support program FRP needs?– Long-lead materials and sole or foreign source materials issues do not pose a
significant risk to FRP cost or schedule?– New materials fully mature? (controlled to specification)
Costs/Funding and Manufacturing/Quality Management– Funding and planning for manufacturing readiness sufficient to reach MRL 10?– LRIP actual costs support production cost estimates?– Special tooling, test equipment plans adequate to support FRP?– Quality and manufacturing procedures adequate for FRP?
Manufacturing Considerations forFull Rate Production Decision (MRL 9)

61
Process Flow Charts
Value Stream Maps
Key Char.;Variables Mapping
Process Capability; DOE
FMEA
Process & Sources at Deeper Levels& Custom / Tailored Tools
MRL 4Mfg
ProcessesIdentified
KeyProcessesIdentified
Producibility assessment
initiated
MRL 5Mfg
Processes Develop.
Mfgequipment in
relativeenvironment
Producibility assessment
ongoing
Cost drivers
identified
MRL 3Mfg
ConceptsIdentified
MRL 6Critical
MfgProcesses
Demo’d
Mfgequipment in relevant
environment
Producibility assessment
ongoing
Cost drivers
analyzed
Long lead items
identified
MRL 7Prototype
Mfg System
Mfg processes in
validation
Producibility improvement
underway
Trade studies
conducted
Supply chain validated
Long lead plans in place
MRL 8 Process Maturity
Demo
All materials ready for
LRIP
Mfg processes proven for
LRIP
Supply chain
established
MRL 9Mfg
ProcessesProven
OverallMfg
ProcessOperates At targetQuality,
Cost and Lead times
All keyProcesses
Meet processControl Targets
MRL 10Lean
System Production
Meets EngineeringPerformance& Reliability
OverallMfg
ProcessOperates At 6-SigmaQuality, and Meets Cost
and Lead timesEstimates
A B C
Tools for MRL 10 Data Collection

62
MRL 10 – Lean Manufacturing Processes
Tools & Data that Provide Evidence
• This is the highest level of production readiness.• There are minimal engineering/design changes.• System, component or item is in production or
has been produced meeting all engineering, performance, quality and reliability requirements.
• All materials, manufacturing processes and procedures, inspection and test equipment, controlled in production to six-sigma or some other appropriate quality level in production.
• A proven, affordable product able to meet required schedule.
• Production actual costs meet estimates
Key Characteristics
Value Stream Maps and Analyses
Process Capability Study
Design of Experiments
Failure Modes and Effects Analysis
Lean System Production
Meets Engineering Performance
& Reliability
Overall Mfg Process Operates At 6-Sigma Quality, and Meets Cost and Lead times Estimates
MRL 10

63
• Purpose and Background• Manufacturing Readiness Levels• IPT Tools for Evaluating MRLs Manufacturing Readiness Assessment
Process • Assessment Example • Discussion
Session Outline

64
INTRODUCE
TRAIN
ASSESS
MANAGE
INCORPORATE
• Meet with AFRL ATD PM to get buy in and gather program info• Customize MRL approach for ATD
• Train ATD IPT on manufacturing tools to support manufacturing maturity efforts
• Current MRL and TRL level• Final MRL/TRL if current plan is followed (no MRL)• Plan, actions, and costs to get them to MRL 5
• Incorporate MRL into ATD analogous to TRL
• Manage overall process• Manage risk identification and reduction process• Manage manufacturing maturity to graduation
Approach

65
• Assessment Lead Briefs PM on Manufacturing Assessment Efforts/Expectations
• Works with PM to• Determine appropriate level for Manufacturing Readiness
Assessment(s) (MRAs) -- System may contain several critical technologies
• Schedule on-site MRA with contractor(s)• Send Orientation Package to contractor(s)• Define Assessment Team Membership• Define Deliverables of Assessment Results• Conduct on-site assessment with contractor(s)• Deliver final report
MRL Assessment Process

66
• Select the company(ies) for review – Highest manufacturing risk– Highest manufacturing value added
• Notify companies and send orientation package– Purpose, approach, questions, strawman agenda– Address contract issues if any
• Select Assessment team(s)– Typically 2-6 members per team– Appropriate members (include Gov’t customer)
• Specialists for key technologies (if needed)• Trainees (First MRA experience should not be in leading one)
– May include contractor responsible product design decisions• Schedule On-site assessments
– Months prior to key milestone decisions to establish a baseline and allow time to develop/implement risk mitigation plans
– Balance team and contractor convenience• Team Orientation – Meet prior to on-site assessment
– Review the logistics; the process; special issues– Review basic member responsibilities
Preparations

67
• Introduce team and highlight specific roles – Purpose of assessment and how results will be used– Assessment process– Expectations
• Contractor will:– Introduce contractor participants – highlight responsibilities– Provide detailed responses to questions provided in orientation package– Indicate who is available to work with team counterparts in later meetings for detailed discussions
• Based on team member needs, follow-up meetings with contractor counterparts will be arranged
– Assessment team members need to be ready to identify their needs/desires– Team members meet with contractor counter parts
• Have detailed discussions (status, plans, risks, issues)• Review documents• See shop-floor status
• Prepare feedback for contractor and identify any action items– Each team member shares insights
• Initial assessment of current MRL (their area or overall)• Key strengths/risks/issues• Key missing data (if any)• Proposed action items
• Team lead presents feedback briefing for contractor
On-Site Activity

68
• Gather key missing data• Convene team meeting -- Typically within 2 weeks of
on-site assessment– Discuss and finalize assessment – Examine current program and manufacturing risk reduction
plans– Agree on likely MRL level at completion of milestone if
current plan is followed
• Share results with contractor• Identify the specific risk reduction activities necessary
to reach the next milestone• Identify the funding, time-phasing and approach to
carrying out each activity• Prepare and submit final report
Follow-on Activities

69
MRA Deliverables
Provide briefing and/or written report • Identify current MRL• Identify key factors where manufacturing readiness falls
short of target MRL– Define driving issues
• Identify programs and plans to reach target MRL• Assess type and significance of risk to cost, schedule or
performance• Assess effectiveness of mitigation plans
– Address right issues?– Timely? Adequately funded?– Probability of success?– Options for increased effectiveness
Gather additional information if requested

70
• Purpose and Background• Manufacturing Readiness Levels• IPT Tools for Evaluating MRLs Manufacturing Readiness Assessment
Process Assessment Example • Discussion
Session Outline

71
An Assessment Example

72
Shredder CONOPS

73
Shredder Features

74
Shredder Components

75
Burst TubeRemmele Engineering Inc.

76
A ll W e ld ingto be pe r A W SD 1 7 .1 C la ss B
K e ep C on e S e ct& T ub e S e ctC o n cen tric toE a ch O th er
W e ld T ub e to Co n e S ec tion W e ld B a ffle P la te s in P la ce A lo ngM e cha n ica l T u be
A fte r C o verP a ss is
C o m p le teS tre ss R e lie ve
T h e n C o m p le teC o ver P a ss
A fte r R o o t P a ss isC o m ple te S tre ss-
re lieve a t 5 00D e g fo r 2 H rs.
P re h e a t P rio rto R o o t P a ss
T o b e 90(D e g A p a rt)
W a tch A lig n m e nto f A ft C losu re P la te
K e yw a y to W e ldS e am s o f C on e S e ct
W e ld A ft C lo su re P la te to C o n e S e ct
A fte r C o ve r P a ss isC o m ple te , S tre ss re lieve a t
8 5 0 D e g fo r 2 H rs &T h e n W ra p in In su l to C o o l S lo w ly
S tre ss re lie ve A ft C lo su re P la te
& T he n F ill b e tw e enS titch w e ld s on B a ff le P la tes
w ith A TK su p p lie d R TV
P re ssu re Te s t a t1 4 .7 +/-2 p si
fo r 5 M inu tes
P e r A S TME 5 15 -95
P re ssu re Te s t Tu b e W e ldm e ntF o r A n y Le a ks
F in a l L e ak Te s t & S ea lin g o f C o ne
2 8 07 36 90 M fg
B u rs t T u be M fg
REI Burst Tube Assembly Process Flow

77
Weld Cone toTube
Weld Baffles totube
Gross leakcheck
• Weld BTF per AWS spec
Dye PenetrantInspection
Heat Treat
Visual WeldInspection
REI BTF Weldment; Cone to Mechanical Tube Control Process

78
Form ConeSections
Weld Cone
Grind ID ofCones
Smooth
Turn BurstTube
Laser Cut BafflePlate
REI Burst Tube Flare (BTF)Part Preparation and Control Process

79
• Send BT SubAssy to Heat Treat
• Receive BT SubAssy from Heat Treat
REI Burst Tube Sub-AssemblyControl Process

80
Dye PenetrantInspection
Weld onBulkheadEndcap
Weld onModified ACP
Stress Relieve
Final Dye Check
Final Leak Check
REI Finish Weld BT SubAssy to Modified ACP Process Control

81
REI Adds RTV-11 to Start Bomb Body Integration Process

82
TorqueRetaining
Ring
Seal WeldRetaining Ring/
Bomb Body/ACP
Seal WeldArming Well
Stress Relieve
Final Inspection
REI Integrates BT Sub-Assy into Bomb Body & prepares for Finish Weld Process

83
BLU-109 Bomb Body/Aft Closure Plate - Elwood National Forge

84
I f T a r L in er o r P a in t p rese n t,U se N a pth a in s id e a lo ng the
F ro n t M o s t 15 " to re m o ve
W a sh & C le a n P e ne tra to r H ou s ing
W ith Th is in foB e ing S u pp lied
B y A T K
F ill F ro n t E n d o fP e n etra to r W ith
th e C o rre c t a m ou nto f R TV
P re p a re R T V P erN o te #4
T h e n U sin g A TKS u p p lie d R TV
in B u lk
U se A T K su p p lied P rim er
W ith P e ne tra to r S to o d U prig h tF irs t A p p ly S ilico n P rim er
(P e r n o te # 3)
S ta nd P e n etra to r on E nd & F ill
C u re R T V1 2 H rs . B e fo re
W e ld ing
T h ru fill P ort O p en in g ,D ra w V a cuu m on
C o m p le te A sse m b lyfo r 1 H r.
S e a l A rm in g W e llC o ver & A lt P e n e tra to r
O pe n in g a nd
T h e n In s ta ll A rm ingW e ll in s ide O pe n ing
o f Ca s ing
A n d T orq ue to 45to 55 Ft lbs
T h e n S c re w R e ta in erR in g in P la ce O verA ft C lo su re P la te
L o w er B urs t T ub e W e ldm e ntin P la ce
In s ta ll B urs t T ub e W e ldm e nt
A fte r A ll W e ld ingis C o m p le te ,
S tre ss re lie ve B o th o fT h e se W e ld Jo in ts
C o m ple te S e a l W e ldsA ro un d th e R e ta in in g R ing
C o m ple te S e a l W e ldsA ro u nd T h e A rm ing W e ll
S tre ss R e lie v in g E ffo rtIs C o m p le te
P re he a t W e ld Jo in ts &M a in ta in P re he a t C o nd itionD u rin g & A fte r W e ld ing U n it
F in a l L e ak T e st & S e a lin g o f A C P
0 7 3 7 71 A S S E M B LY M FG
F in a l A ssy o f P e n etra to r
REI Bomb Body Integration Process Flow

85
• White Phosphorous fill takes place in a water tank. • The bomb assembly is submerged, filling the WP chamber with water. • WP is piped in, forcing out the water. • Excess WP is aspirated • Fill port plug is pressed in place and sealed
Fill Port
100% Leak Proof Tested for Safety
White Phosphorus Fill Process (US Army Pine Bluff Arsenal)

86
ShredderWP Fill, Close and Palletize
Flow Chart
PrepareComponents
WP fillWeigh empty
container
Aspirate excess WP Install seal plug Weigh filledcontainer
Leak test containerClean & palletize
container forshipment
Weld theweld plug
PBA Manufacturability - WP Fill Process Control Flow

87
•Tool Description •Qty •Tool
•Casting Stands •4 •Adapt
•Casting Arrangement •4 •New
•Handling Rings •4 •New
•Mold Disassy Equip •1 •Adapt
•Horizontal Lifting Lug •1 set •New
•Horizontal Transport Skid •4 •Adapt
•Weight & CG Fixture •1 •Adapt
•Aft Closure Spanner Wrench •1 •New
•X-Ray Rotating Cart •1 •Adapt
•Fuse Cup Spanner Wrench •1 •New
•Spreader Bar •1 •As Is
Casting Stand
Receive/UnpackCases
Store Containers forPackout
Set unit on CartAttach Handling Ring
Apply MIL-C-450C
Liner to Interior
Set Up Casting Pit
Mold Assembly
Cast Explosive
Cure ExplosiveTest Explosive
Properties
Remove ToolingSet on Cart
Stencil, Paint,Touchup
Final Assembly
X-Ray Unit
Packout
Store, Ship
Mix Explosive
Prepare Ingredients
BLDG 356 BLDG 378
BLDG 356
BLDG 356
BLDG 308
BLDG 308
BLDG 308
BLDG 362
BLDG 356
BLDG 356
BLDG 356
BLDG 360
BLDG 356
BLDG 173
Research Labs
BLDG 311
BLDG 373
HE Loading – ATK Tactical Systems/Allegheny Ballistic Lab.

88
Loaded Shredder Warheads

89
Fuse and FZU – COTS
90Interface Connector, Pigtail, & Bracket similar
to BLU-116 Approach
FZU cable mated to connector on bracket
Flange for attaching conduit to BLU-109 body
Pigtail and Connector for FMU-143 Bomb Fuze
Modified Hardback
External Fuze/FZU/Aircraft Interfaces

Manufacturing Readiness Assessment
Fabrication & Assembly• Remmele Engineering Inc.
(Big Lake, MN)• Processes defined and
sequencing established• Iterative improvements
documented• Current capacity adequate,
potential constraints known
White Phosphorus Fill• Army (Pine Bluff Arsenal, AR)• Uses established process
(under water fill)• Current capacity limited to
1 unit/day
High Explosive Loading• ATK Tactical Systems (Rocket
Center, WV)• Processes steps defined Iterative
improvements documented• Process to apply new MIL-C-450C
asphaltic liner material needs to mature
• Production mock-ups to identify planned improvements
Remaining Items• Developing yield data (processes
represent current state-of-the-practice)• Planning for tooling/fixtures, if necessary
MRL 10Lean Mfg
Proc’s
MRL 9Mfg
Proc’s In Place for
FRP
MRL 8Mfg
Proc’s In Place for
LRIP
MRL 7Mfg
Proc’s Maturing for LRIP
MRL 6Mfg
Proc’s In Prod
Rep Environmt
MRL 5Mfg
Proc’s In Relevant Environmt
MRL 4Mfg
Proc’sIn Lab
Environmt
MRL 3Mfg
ConceptsIdentified
Desired at completion of ATD

92
• Purpose and Background• Manufacturing Readiness Levels• IPT Tools for Evaluating MRLs• Manufacturing Readiness Assessment
Process• Assessment Example• Discussion
Session Outline

93
Backup
BACKUP

94
• Scope– Primary focus in areas where new technology being transitioned – Will interview DCMA and review Company and PM management metrics/reports
to see if extra effort required anywhere else– Any areas of special interest to SAF/AQR
• AQR notifies AFRL/MLM– Program information (Name, POC, Approaching Milestone, Special
considerations, MRA due date)• ManTech
– Assemble team– Contact program – get/give orientation– Review program management metrics– Conduct DCMA interviews– Participate as observer in SPO or contractor reviews if applicable– Conduct on-site reviews at key sites (OEM, key suppliers)– Prepare findings
• Review findings with PM – Assure errors of fact, if present, are corrected– No surprises
• Provide results to SAF/AQR
Basic MRA Process

95
Provide briefing and written report to SAF/AQR• Identify key factors where manufacturing readiness falls
short of target MRL. Define driving issues• Assess type and significance of risk to cost, schedule or
performance (Nature and estimated scope of consequences if issues not effectively mitigated)
• Assess effectiveness of mitigation plans– Address right issues?– Timely? Adequately funded?– Probability of success?– Options for increased effectiveness
Gather additional information if requested
MRA Deliverables

96
• Commercial product developers can’t afford to be late to market or miss their product cost target
• Industry adopted concurrent engineering principles to consider manufacturing early in the design cycle
Industry Commercial Model
Manufacturing risk assessment, mitigation and capability development
Technology Development Product Development Production
Concurrent Engineering Concepts

97
AFRL Technology Development Models
Current AFRL Model
Manufacturing risk assessment, mitigation and capability development
Technology Development Product Development Production
Future AFRL Model
Technology Development Product Development Production
Manufacturing risk assessment, mitigation and capability development
AFRL funded Other funded Co-funded
Industry Commercial Model
Manufacturing risk assessment, mitigation and capability development
Technology Development Product Development Production

98Air Force funded Other funded
Current Perception of Air Force Acquisition
Production
Technology Development
Product Development
Manufacturing risk assessment, mitigation and capability development
Acquisition Development Models
Industry Commercial Model
Manufacturing risk assessment, mitigation and capability development
Technology Development Product Development Production