chronic hmg-coa reductase inhibitor treatment … · pravastatin (pravastatin or atorvastatin...
TRANSCRIPT

저 시-비 리- 경 지 2.0 한민
는 아래 조건 르는 경 에 한하여 게
l 저 물 복제, 포, 전송, 전시, 공연 송할 수 습니다.
다 과 같 조건 라야 합니다:
l 하는, 저 물 나 포 경 , 저 물에 적 된 허락조건 명확하게 나타내어야 합니다.
l 저 터 허가를 면 러한 조건들 적 되지 않습니다.
저 에 른 리는 내 에 하여 향 지 않습니다.
것 허락규약(Legal Code) 해하 쉽게 약한 것 니다.
Disclaimer
저 시. 하는 원저 를 시하여야 합니다.
비 리. 하는 저 물 리 목적 할 수 없습니다.
경 지. 하는 저 물 개 , 형 또는 가공할 수 없습니다.

Chronic HMG-CoA Reductase Inhibitor
Treatment Contributes to Dysglycemia by
Upregulating Hepatic Gluconeogenesis
through Autophagy Induction
Hye Jin Wang
Department of Medical Science
The Graduate School, Yonsei University

Chronic HMG-CoA Reductase Inhibitor
Treatment Contributes to Dysglycemia by
Upregulating Hepatic Gluconeogenesis
through Autophagy Induction
Directed by Professor Eun Seok Kang
The Doctoral Dissertation
submitted to the Department of Medical Science,
the Graduate School of Yonsei University
in partial fulfillment of the requirements for the degree of
Doctor of Philosophy
Hye Jin Wang
December 2015

This certifies that the Doctoral
Dissertation of Hye Jin Wang is approved.
______________________________________________
Thesis Supervisor: Eun Seok Kang
______________________________________________
Thesis Committee Member#1: Chul Hoon Kim
______________________________________________
Thesis Committee Member#2: Hyang Kyu Lee
______________________________________________
Thesis Committee Member#3: Jae Woo Kim
______________________________________________
Thesis Committee Member#4: Je Wook Yu
The Graduate School
Yonsei University December 2015

ACKNOWLEDGEMENTS
If there was no help from many people, I could never write this
doctoral thesis. First of all, I feel lucky to be a student of prof. Eun
Seok Kang. He supported me through everything. And I would
like to appreciate teaching and professional advice of prof. Chul
Hool Kim and prof. Hyang Kyu Lee. I would like to thank all my
friendly people. My doctoral course was more valuable with you.

TABLE OF CONTENTS
ABSTRACT………………………………..…………………………...…...1
I. INTRODUCTION…………………………….………………....………..3
II. MATERIALS AND METHODS……………..………………….....…...6
1. Cell culture and drug treatments……………………..………….………6
2. Analysis of autophagy by confocal microscopy……………..............….6
3. RNA extraction and real-time qRT-PCR………………....……..………7
4. Immunoblotting…………………………….……………..………...…..9
5. Glucose output assay………………………………………………......10
6. BECN1 RNA interference……………………………..……………….10
7. Animals……………………………..……………………………....….11
8. Oral glucose tolerance, insulin tolerance, and pyruvate tolerance
tests………………………………………………………………….…12
9. Plasma glucose, cholesterol, triglyceride, and free fatty acid
measurement……………………………………………………….......12
10. Transmission electron microscopy…………………………..……….12
11. Statistical analysis………………………………….…………………13
III. RESULTS……………………...………….………….………………...14
1. Statins increase gluconeogenic enzyme expression in HepG2 cell.....14
2. Statins induce autophagic flux leading to enhanced expression of
gluconeogenic enzymes………………………………….…………….18
3. Blockage of autophagic flux attenuates stat in’s effect on
gluconeogenesis……………………………………………….……….21

4. ATG7 is necessary for statin-induced gluconeogenesis in the liver…...24
5. Akt-FoxO1 pathway has no effect on statin induced gluconeogenesis but
decrease mTOR phosphorylation …………………………………...26
6 . Statins increase hepatic gluconeogenesis, leading to hepatic insulin
resistance in high-fat diet-fed mice……………………………...….....31
7. Statins increase hepatic gluconeogenesis and autophagy in high-fat diet-
fed mice………………………………………………..………………36
IV. DISCUSSION……………………..……......………………………….40
V. CONCLUSION………………………………...…………..……………44
REFERENCES……………………………………………………....…….45
ABSTRACT (IN KOREAN)……………………………...…………..…...51
PUBLICATION LIST…………………………………………..……..…..53

LIST OF FIGURES
Figure 1. Schematic illustration of glycolysis and
gluconeogenesis...............………….............................14
Figure 2. Insulin inhibits gluconeogenic gene expression and
enhances glycolytic gene expression in HepG2 cells...15
Figure 3. Statins increase gluconeogenic gene expression in
HepG2 cells.……..........................................................16
Figure 4. Statin has no direct effect on glycolytic gene expression
in HepG2 cells…………………..………....................17
Figure 5. Statins induce autophagic vacuoles in HepG2 cells.....18
Figure 6. Statins increase autophagy flux in HepG2 cell..……...19
Figure 7. Stains increase autolysosome formation in HepG2 cells
…………..………………………………………...….20
Figure 8. Chloroquine decrease gluconeogenic gene expression
and glucose concentration in culture media.………....21
Figure 9. Bafilomycin A1 decrease gluconeogenic gene
expression and glucose concentration in culture media
......................................................................................22
Figure 10. Statin has no effect on gluconeogenic gene expression
without autophagic related beclin 1 expression.….....23

Figure 11. The gluconeogenic effect of statins is attenuated in
primary hepatocytes derived from liver-specific Atg7-
deficient mice……………………..…………………25
Figure 12. Glucogenic amino acid, alanine, enhances glucose
output of HepG2 cell treated with statins…………...27
Figure 13. Elevated FoxO1 phosphorylation by statins in primary
hepatocyte...…………………………………………28
Figure 14. Akt phosphorylation was decreased with statin
treatment in primary mouse hepatocyte……………..29
Figure 15. Down-regulation of mTOR signaling by statin
treatment………………………………………….....30
Figure 16. Statin treatment increases body weight of high-fat diet-
fed mice whereas did not affect amount of food intake
…………....................................................................31
Figure 17. Fasting blood glucose levels were elevated in statin-
treated mice......……………………………………...32
Figure 18. Statin treatment impairs insulin and pyruvate tolerance
in high-fat diet-fed mice…………………...………..34
Figure 19. Statins decrease lipid profile in mouse serum…........35
Figure 20. Gluconeogenic and glycolytic gene expression in
mouse liver…...….......................................................36

Figure 21. Electron microscopy analysis of autophagosomes in
the livers of statin-treated mice……………………...39

LIST OF TABLE
Table 1. Primer sequences for qPCR of G6PC, PCK1 GCK,
PKLR and Atg7.................................................................8

1
ABSTRACT
Chronic HMG-CoA Reductase Inhibitor Treatment Contributes to
Dysglycemia by Upregulating Hepatic Gluconeogenesis through
Autophagy Induction
Hye Jin Wang
Department of Medical Science
The Graduate School, Yonsei University
(Directed by Professor Eun Seok Kang)
Statins (3-hydroxy-3-methyl-glutaryl-CoA [HMG-CoA] reductase inhibitors) are
widely used to lower blood cholesterol levels but have been shown to increase the
risk of type 2 diabetes mellitus. However, the molecular mechanism underlying
diabetogenic effects remains to be elucidated. Here we show that statins
significantly increase the expression of key gluconeogenic enzymes (such as glucose
6-phosphatase and phosphoenolpyruvate carboxykinase 1) in vitro and in vivo and
promote hepatic glucose output. Statin treatment activates autophagic flux in HepG2
cells. Acute suppression of autophagy with lysosome inhibitors in statin treated
HepG2 cells reduced gluconeogenic enzymes expression and glucose output.
Importantly, statins’ ability to increase gluconeogenesis was impaired when
autophagy-related 7 protein and beclin 1 were absent, suggesting that autophagy
plays a critical role in the diabetogenic effects of statins. Moreover autophagic
vacuoles and gluconeogenic genes expression in the liver of diet-induced obese mice
were increased by statins, ultimately leading to elevated hepatic glucose production,

2
hyperglycemia, and insulin resistance. Together, these data demonstrate that chronic
statin therapy results in insulin resistance through the activation of hepatic
gluconeogenesis, which is tightly coupled to hepatic autophagy. These data further
contribute to a better understanding of the diabetogenic effects of stains in the
context of insulin resistance.
___________________________________________________________________
Key words: HMG-CoA reductase inhibitor, statin, gluconeogenesis, diabetes,
autophagy

3
Chronic HMG-CoA Reductase Inhibitor Treatment Contributes to
Dysglycemia by Upregulating Hepatic Gluconeogenesis through
Autophagy Induction
Hye Jin Wang
Department of Medical Science
The Graduate School, Yonsei University
(Directed by Professor Eun Seok Kang)
I. INTRODUCTION
Statins (3-hydroxy-3-methyl-glutaryl-CoA [HMG-CoA] reductase inhibitors) are
the most widely prescribed drugs for the primary and secondary prevention of
cardiovascular diseases. Statins are a class of cholesterol lowering drugs that inhibit
the enzyme HMG-CoA reductase which plays an important role in the production of
cholesterol. Hypercholesterolemia have been related with cardiovascular disease.1
Statins have been discovered to prevent cardiovascular disease.
Although these drugs effectively reduce circulating cholesterol levels, numerous
studies have demonstrated that statin therapy is linked to side effects include muscle
pain, increased risk of diabetes mellitus, and abnormalities in liver enzyme tests.2 In
this study, we focused on how statin can develop of type 2 diabetes mellitus
(T2DM). Increased incidence of diabetes was observed in clinical trials evaluating
pravastatin (Pravastatin or Atorvastatin Evaluation and Infection Therapy),3
simvastatin (Heart Protection Study),4 atorvastatin (Anglo-Scandinavian Cardiac
Outcomes Trial—Lipid-Lowering Arm),5 and rosuvastatin (Controlled Rosuvastatin

4
Multinational Trial in Heart Failure; Justification for the Use of Statins in Prevention:
an Intervention Trial Evaluating Rosuvastatin).6,7 Recent meta-analyses of major
statin trials also demonstrated that the risk for T2DM is higher in statin users than in
non-users.8,9 This effect is dose-dependent10: the risk of developing diabetes is 12%
higher in patients on intensive-dose statin therapy than those on moderate-dose
therapy, and this effect is likely to be class-dependent rather than drug-specific.
Given that numerous well-designed clinical studies have reported the diabetogenic
effect of statins, elucidating the underlying mechanism is of great importance.
The major site of therapeutic action for statins is the liver. Studies in rats have
demonstrated that statins are selectively taken up by the liver11 and transported into
hepatocytes by a high-affinity process.12 The hepatic specificity of statins may be
due to efficient first-pass metabolism.13 The liver plays a critical role in regulating
blood glucose levels, especially under a fasting state, maintaining glucose
homeostasis through glycogenolysis and gluconeogenesis. Statins have been shown
to increase fasting plasma glucose levels in individuals with or without diabetes14
and induce gluconeogenic gene expression in primary cultured human hepatocytes.15
These results suggest that statins raise fasting blood glucose levels in vivo by
stimulating gluconeogenesis in the liver.
Autophagy is the catabolic mechanism by which cells regulate the turnover of
cellular organelles and proteins. Also autophagy is a scavenging process that
disassembles through a tightly regulated pathway, unnecessary or dysfunctional
cellular components. During this process, targeted cytoplasmic ingredients are
isolated from the rest of the cell within a double-membrane vesicle known as an
autophagosome. The autophagosome then fuses with a lysosome and the contents
are degraded and recycled.16 There are three different forms of autophagy that are
commonly described, namely macroautophagy, microautophagy and chaperone-
mediated autophagy.17 In the context of disease, autophagy has been seen as an
adaptive response to stress which promotes survival, whereas in other cases it

5
appears to promote cell death and morbidity.16 This process also supplies various
substrates for energy generation, leading to alterations in cell metabolism.18 In
carbohydrate metabolism, autophagy contributes to glycogen breakdown in
lysosomes19 and the maintenance of pancreatic β-cell mass and function.20 In the
liver, autophagy appears to play an important role in glucose homeostasis by
promoting the conversion of amino acids to glucose.21
Statins have been shown to induce autophagy in various cell types (e.g.,
macrophages, cancer cells, coronary arterial myocytes),22-25 therefore, we postulate
that statins induce autophagy in the liver, thereby stimulating hepatic
gluconeogenesis, which manifests clinically as diabetes. In this study we
investigated this potential molecular mechanism underlying the diabetogenic effect
of statins. Our results show that induction of liver autophagy is integral to statin-
induced upregulation of hepatic gluconeogenesis, leading to dysglycemia in mice.

6
II. MATERIALS AND METHODS
1. Cell culture and drug treatments
Primary hepatocytes were isolated from male liver-specific Atg7 knockout mice26
and wild type mice (9 weeks old) using a previously described method.27 The
primary hepatocytes and hepatocellular carcinoma HepG2 cell lines were cultured in
Dulbecco’s modified Eagle’s medium (Thermo Scientific Inc., San Jose, CA)
containing 10% fetal bovine serum (Thermo Scientific Inc., San Jose, CA), 100
U/ml penicillin, and 100 µg/ml streptomycin (Thermo Scientific Inc., San Jose, CA)
in a 5 %CO2 incubator at 37°C. The statin drugs rosuvastatin (Sigma-Aldrich Co.,
St. Louis, MO), fluvastatin (Sigma-Aldrich Co., St. Louis, MO), pravastatin (Sigma-
Aldrich Co., St. Louis, MO), and atorvastatin (Sigma-Aldrich Co., St. Louis, MO)
were dissolved in dimethyl sulfoxide before dilution in the culture medium. In all
experiments the final statin concentration was 20 µM, and final dimethyl sulfoxide
concentration was ≤ 0.1%. Chloroquine (Sigma-Aldrich Co., St. Louis, MO) and
Bafilomycin A1 (Sigma-Aldrich Co., St. Louis, MO) were dissolved in distilled
water before treatments. The final concentrations were 50 uM and 20 nM,
respectively.
2. Analysis of autophagy by confocal microscopy
HepG2 cells were transfected with the expression vector GFP-LC3 and mRFP-
GFP-LC3 using Lipofectamine 2000 (Invitrogen, CA) for 48 hours. The cells were
then treated with statins for 24 hours and fixed in 4% paraformaldehyde in 0.1 M
phosphate buffer (pH 7.4) for 10 min. After fixation, HepG2 cells were washed in
phosphate buffered saline three times for 5 min and then observed using an LSM
700 and LSM780 confocal microscopes (Zeiss, Gottingen, Germany).

7
3. RNA extraction and real-time RT-PCR (quantitative PCR)
Total RNA was extracted from HepG2 cells using the RNeasy Mini Kit (Qiagen,
CA, United States) and from primary hepatocytes using TRIzol (Invitrogen, CA,
United States). Reverse transcription was carried out with 2 μg total RNA using the
QuantiTect Reverse Transcription kit (Qiagen, CA, United States) according to the
manufacturer’s instruction. Expression of target genes G6PC, PCK1, GCK, and
PKLR was analyzed by qPCR using SYBR Premix Ex Taq (Clontech, USA) and
gene-specific primers designed from sequences submitted to the NCBI nucleotide
sequence database. Amplification was carried out using the Takara Thermal Cycler
Dice® Real-Time system (Otsu, Shiga, Japan) and the following cycling conditions:
40 cycles of 95°C for 5 sec, 58°C for 10 sec, and 72°C for 20 sec. All reactions were
performed in triplicate, and target gene expression was normalized to that of the
internal control glyceraldehyde 3-phosphate dehydrogenase.

8
Table 1. Primer sequences for qPCR of G6PC, PCK1, GCK, PKLR and ATG7
Target Species Direction Sequence
G6PC Human Forward 5’-GGGTGTAGACCTCCTGTGGA-3’
Reverse 5’-GAGCCACTTGCTGAGTTTCC-3’
PCK1 Human Forward 5’-AGGCGGCTGAAGAAGTATGA-3’
Reverse 5’-ACGTAGGGTGGATCCGTCAG-3’
GCK Human Forward 5’-GCAGAAGGGAACAATGTCGTG-3’
Reverse 5’-CGTAGTAGCAGGAGATCATCGT-3’
PKLR Human Forward 5’-TCAAGGCCGGGATGAACATTG-3’
Reverse 5’- CTGAGTGGGGAACCTGCAAAG-3’
G6pc Mouse Forward 5’-ACTCCAGCATGTACCGGAAG-3’
Reverse 5’-AAGAGATGCAGGAGGACCAA-3’
Pck1 Mouse Forward 5’-TGACAGACTCGCCCTATGTG-3’
Reverse 5’-TGCAGGCACTTGATGAACTC-3’
Gck Mouse Forward 5’-AAAGATGTTGCCCACCTACG-3’
Reverse 5’-TCTGGTGTTTCGTCTTCACG-3’
Pklr Mouse Forward 5’-GTTTGTGCCACACAGATGCT-3’
Reverse 5’-ATACAGTCAGCCCCATCCAG-3’
Atg7 Mouse Forward 5’-TGGAGCAGTCAGCAAATGAG-3’
Reverse 5’-CGAAGGTCAGGAGCAGAAAC-3’

9
4. Immunoblotting
Cells were lysed in buffer consisting of 50 mM Tris HCl (pH 8.0), 5 mM EDTA,
150 mM NaCl, 0.5 % sodium deoxycholate, 1 % Nonidet P-40, 0.1 % sodium
dodecyl sulfate, 1 mM phenylmethylsulfonyl fluoride, 1 mM sodium fluoride, 1 mM
sodium orthovanadate, and protease inhibitor cocktail (Roche, Mannheim,
Germany). Equivalent amounts of each protein extract were separated on 10 %
polyacrylamide gels and electrophoretically transferred onto polyvinylidene fluoride
membrane (Millipore, Darmstadt, Germany). After blocking, the membranes were
incubated with primary antibodies against PEPCK (Santa Cruz Biotechnology, Inc.,
Santa Cruz, CA), G6Pase (Santa Cruz Biotechnology, Inc., Santa Cruz, CA), FoxO1
(Cell Signaling Technology, Inc., Danvers, MA), phospho-FoxO1 (S256) (Cell
Signaling Technology, Inc., Danvers, MA), Akt (Cell Signaling Technology, Inc.,
Danvers, MA), phospho-Akt (S473) (Cell Signaling Technology, Inc., Danvers,
MA), LC3B (Sigma-Aldrich Co., St. Louis, MO), β-actin (Sigma-Aldrich Co., St.
Louis, MO), Beclin 1 (Santa Cruz Biotechnology, Inc., Santa Cruz, CA) mTOR
(Santa Cruz Biotechnology, Inc., Santa Cruz, CA), phospho-mTOR (S2448) (Santa
Cruz Biotechnology, Inc., Santa Cruz, CA), p70 S6 kinase α (Santa Cruz
Biotechnology, Inc., Santa Cruz, CA), and phospho-p70 S6 kinase α (T389) (Santa
Cruz Biotechnology, Inc., Santa Cruz, CA) followed by horseradish peroxidase-
conjugated IgG (Santa Cruz Biotechnology, Inc., Santa Cruz, CA) and anti-rabbit
IgG (Santa Cruz Biotechnology, Inc., Santa Cruz, CA). The blots were developed
using an enhanced chemiluminescent detection kit.

10
5. Glucose output assay
Glucose output from HepG2 cells was quantified using a colorimetric glucose
assay kit (BioVision Technologies, Inc, Exton, PA) according to the
manufacturer’s instructions. Briefly, HepG2 cells were treated with or without statin
for 24 hours. The conditioned medium was then collected and incubated with the
reaction mix for 30 min at room temperature. Absorbance at 450 nm was measured
in a 96-well plate reader (Molecular Devices, Sunnyvale, CA).
6. BECN1 RNA interference
Electroporation of shRNA-expressing plasmids in HepG2 cells was performed
using the Neon® transfection system (Invitrogen, CA, USA) according to the
manufacturer’s protocol. Briefly, trypsinized HepG2 cells (1 × 10⁶ cells) were
washed in PBS and then resuspended in Neon Resuspension Buffer R. The cell
suspension was mixed with 2 µg shRNA against BECN1 (Santa Cruz Biotechnology,
Inc., Santa Cruz, CA) or a scrambled shRNA sequence (Santa Cruz Biotechnology,
Inc., Santa Cruz, CA) as a negative control and pulsed twice at 1200 V for 50 msec.
After electroporation, cells were quickly seeded into six-well-plates and grown in
culture medium for further experiments. Successful inhibition of BECN1 expression
was verified by Western blot analysis.

11
7. Animals
Four week-old male C57BL/6J mice were housed under controlled conditions
(21 °C ± 2 °C, 60% ± 10% humidity, 12-hour light/12-hour dark cycle) with ad
libitum access to food and water. After 1 week, the mice were divided into five
groups according to treatment (untreated control, n=9; rosuvastatin, n=7; fluvastatin,
n=7; pravastatin, n=11; atorvastatin, n=11). Beginning at 5 weeks of age, all mice
were fed a high-fat diet that included 45 % lipids (Research Diets, Inc., New
Brunswick, NJ). The food given to each treatment group was supplemented with
0.01 % (w/w) of the appropriate statin. Food intake and body weight of the mice
were evaluated two times a week at the same time of day. Fasting blood glucose
level was measured weekly in the evening after an 8-hour fast. After 16 weeks, the
mice were anesthetized with zolazepam and tiletamine (Zoletil, 50 mg/kg; Virbac
France GTIN: 03597132126045), and blood was collected by cardiac puncture. The
animal protocol was approved by the institutional animal care and use committee at
Yonsei University College of Medicine.

12
8. Oral glucose tolerance, insulin tolerance, and pyruvate tolerance tests
To perform the oral glucose tolerance test, 40 % glucose (2 g/kg body weight) was
administered via oral gavage after a 6-hour fast. Blood was collected from the tail
vein at 0, 30, 60, 90, and 120 min after glucose administration. To assay insulin
tolerance, fasting glucose was measured 4 hours after fasting, and then mice were
intraperitoneally injected with 0.75 U/kg human insulin-R (Sigma-Aldrich Co., St.
Louis, MO) dissolved in PBS. Blood glucose was measured at 15, 30, 60, 90, and
120 min after injection. To assay pyruvate tolerance, mice were intraperitoneally
injected with 2 g/kg sodium pyruvate (Sigma-Aldrich Co., St. Louis, MO) dissolved
in phosphate buffered saline after an 18-hour fast. Blood was collected from the tail
vein before pyruvate injection (0 hour) and at 15, 30, 60, 90, and 120 min after
injection. Glucose levels were determined using an Accu-Chek Performa®
glucometer (Boehringer-Mannheim, Indianapolis, IN).
9. Plasma glucose, cholesterol, triglyceride, and free fatty acid measurement
Blood was collected in microcentrifuge tubes and centrifuged to obtain serum,
which was divided into aliquots and stored at –80°C for subsequent assays. Serum
glucose, cholesterol, triglyceride, and free fatty acid levels were measured with the
respective assay kits (Bioassay Systems, Hayward, CA) according to the
manufacturer’s instructions.
10. Transmission electron microscopy
Autophagic vacuoles in the liver were visualized by transmission electron
microscopy. Glutaraldehyde-fixed mouse liver tissues were post-fixed in 2%
osmium tetroxide, dehydrated in graded alcohol, and flat embedded in Epon 812
(Electron Microscopy Sciences, Hatfield, PA). Ultrathin tissue sections (300 nm)
were stained with uranyl acetate and lead citrate and examined with an electron
microscope (JEM-1011, JEOL/MegaView III, Olympus, Tokyo, Japan).

13
11. Statistical analysis
Data are presented as mean ± standard error of the mean. Groups were compared
using Student’s t test or one-way analysis of variance followed by Dunnett’s
multiple comparison test, where appropriate; p<0.05 was considered significant.
Data analysis was carried out using Prism 5.0 software (GraphPad Software, La
Jolla, CA).

14
III. RESULTS
1. Statins increase gluconeogenic enzyme expression in HepG2 cells
To evaluate whether hepatic gluconeogenesis is involved in the diabetogenic
effects of statins, we tested the effects of rosuvastatin, fluvastatin, pravastatin, and
atorvastatin on the expression of key enzymes involved in gluconeogenesis and
glycolysis in HepG2 hepatocellular carcinoma cells (Fig. 1).
Figure 1. Schematic illustration of glycolysis and gluconeogenesis. Glycolysis is
the metabolic pathway that converts glucose into pyruvate. Gluconeogenesis is the
pathway that results in the generation of glucose from non-carbohydrate carbon
substrates such as pyruvate.

15
To validate the system, we treated HepG2 cells with insulin to confirm that insulin
promotes glycolysis in these cells. Results of real-time quantitative reverse
transcription-polymerase chain reaction (qRT-PCR) confirmed that insulin
decreased expression of genes encoding the gluconeogenic enzymes glucose 6-
phosphatase (G6PC) and phosphoenolpyruvate carboxykinase (PCK1) and increased
expression of genes encoding the glycolytic enzymes glucokinase (GCK) and
pyruvate kinase (PKLR) (Fig. 2).
Figure 2. Insulin inhibits gluconeogenic gene expression and enhances
glycolytic gene expression in HepG2 cells. HepG2 cells were treated with 100nM
insulins for 6hr and harvested for RNA extraction. *p<0.05, **p<0.01 compared
with control. (n=5)
16
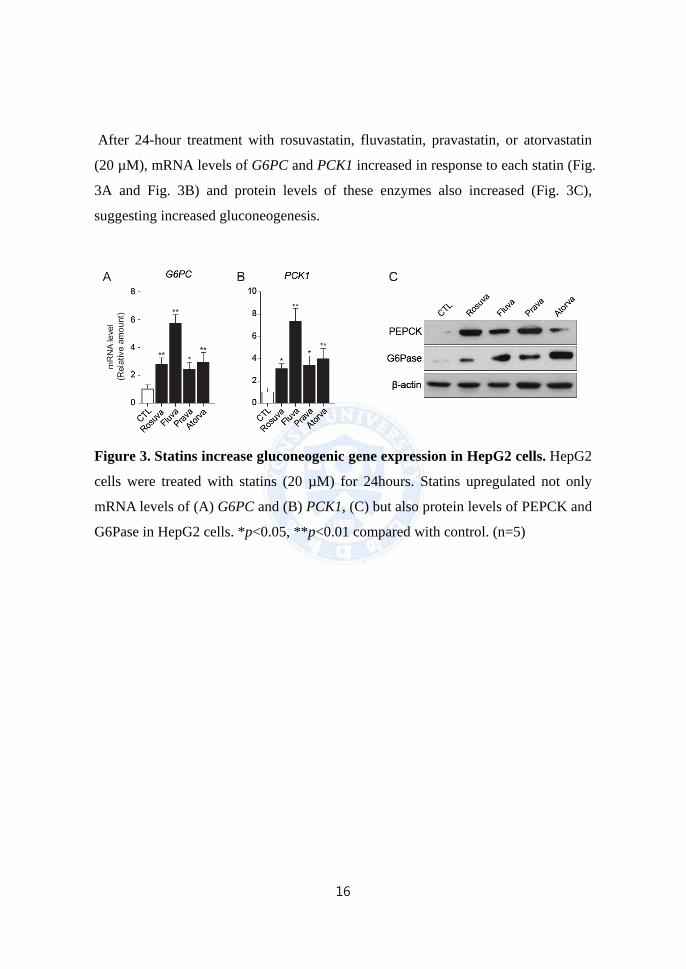
After 24-hour treatment with rosuvastatin, fluvastatin, pravastatin, or atorvastatin
(20 µM), mRNA levels of G6PC and PCK1 increased in response to each statin (Fig.
3A and Fig. 3B) and protein levels of these enzymes also increased (Fig. 3C),
suggesting increased gluconeogenesis.
Figure 3. Statins increase gluconeogenic gene expression in HepG2 cells. HepG2
cells were treated with statins (20 µM) for 24hours. Statins upregulated not only
mRNA levels of (A) G6PC and (B) PCK1, (C) but also protein levels of PEPCK and
G6Pase in HepG2 cells. *p<0.05, **p<0.01 compared with control. (n=5)

17
In contrast, statins had little or no effect on mRNA levels of GCK and PKLR (Fig.
4A and Fig. 4B). These data indicate that statins specifically affect the expression of
gluconeogenic enzymes in HepG2 cells.
Figure 4. Statin has no direct effect on glycolytic gene expression in HepG2 cells.
HepG2 cells were treated with statins 24hours. But statins little effected on mRNA
levels of GCK (A) and PKLR (B) in HepG2 cells. *p<0.05, **p<0.01 compared with
control. (n=5)

18
2. Statins induce autophagic flux leading to enhanced expression of
gluconeogenic enzymes
Because autophagy has been reported to promote gluconeogenesis in the liver,21
we tested whether statins increase autophagy in hepatocytes by transfecting HepG2
cells with a vector expressing the autophagy marker, microtubule-associated protein
1 light-chain 3 isoform A (LC3A) fused to green fluorescent protein (GFP). We
found that statin treatment increased the number of GFP-LC3A fluorescent puncta
representing autophagosomes in the cytosol (Fig. 5A and Fig. 5B). In contrast,
puncta were barely discernible in control cells (Fig. 5A and Fig. 5B).
Figure 5. Statins induce autophagic vacuoles in HepG2 cells. HepG2 cells were
transfected with the autophagy sensor GFP-LC3A then treated with rosuvastatin,
fluvastatin, pravastatin, or atorvastatin (20 µM) for 24 hours. (A) Fluorescent images
were obtained by confocal microscopy. Green dots indicate autophaic vacuoles;
Scale bars indicate 1μm at x400 magnification. (B) Columns in the histogram
represent the number of LC3A puncta per cell. At least six random fields were
chosen from each sample. *p<0.05, **p<0.01 compared with control. (n=8)

19
To confirm this result, we evaluated LC3B-II expression by Western blot analysis,
which showed increased LC3B-II levels in statin-treated cells compared with
controls, suggesting that statins promote autophagy in HepG2 cells (Fig. 6). We
treated cells with bafilomycin A1 (Baf A1), a lysosomal blocker, to block autophagy
and treated with statins to reveal whether increased LC3B with statin is due to
autophagy induction or autophagy flow blockade. Statin additionally increased
LC3B-II in cells pretreated with Baf A1 which suggests that statin induces
autophagy rather than blocking autophagy flow (Fig. 6).
Figure 6. Statins increase autophagy flux in HepG2 cell. HepG2 cells were
treated with statins for 22hours after then bafilomycin A1 for 2 hours with statins.
Results of Western blot analysis showed increased LC3B-II levels in statin-treated
cells. Bafilomycin-treated group showed that statins induced autophagy flux. (n=4)
Then we transfected mRFP (red fluorescence protein)-GFP-LC3 tandem construct
encoding LC3 fused to mRFP and GFP to HepG2 cells to evaluate autophagic flux.
GFP protein is degraded in acidic condition inside the lysosome, leading to lose of
green fluorescent signal whereas RFP is more stable in acidic condition, maintaining
red fluorescent signal. Therefore autophagosomes show yellow fluorescent signal
(merged signal of mRFP and GFP) and autolysosomes show only red signals

20
(mRFP). The number of red and yellow puncta increased in HepG2 cells treated
with statin, indicating that stains indeed induce autophagosome and autolysosome
formation, representing increase in autophagic flux (Fig. 7A and Fig. 7B). The
possibility that the statins’ effect is due to mere inhibition of lysosomal degradation
is ruled out based on the result that Baf A1 increased number of yellow puncta
without increase in red puncta (Fig. 7A and Fig. 7B).
Figure 7. Stains increase autolysosome formation in HepG2 cells. After
transfecting HepG2 cells with mRFP-GFP-LC3B, statins were treated for 24 hours.
(A) Fluorescent images were obtained by confocal microscopy. GFP protein is
unstable in low pH inside of lysosome thereby degraded. In contrast, RFP is more
stable in acidic condition thereby could maintain red fluorescence; Scale bars
indicate 5μm at x800 magnification. (B) Columns in the histogram represent the
ratio of mRFP and GFP LC3B puncta. **p<0.01 compared with control. (n=5)

21
3. Blockage of autophagic flux attenuates statin’s effect on gluconeogenesis.
To see whether statin’s gluconeogenic effect is mediated by autophagic process,
we treated a lysosomal inhibitor such as chloroquine (CQ) or Baf A1 with statin.
Increased G6PC and PCK1 expression with statin treatment were attenuated by CQ
(Fig. 8A and Fig. 8B) and glucose production was also decreased (Fig. 8C).
Figure 8. Chloroquine decrease gluconeogenic gene expression and glucose
concentration in culture media. After treatment with 20 μM statins for 22 hours,
50μM chloroquine was treated to HepG2 cells for 2 hours with statins. HepG2 cells
treated with statins and CQ (A) G6PC and (B) PCK1 were analyzed with qRT-PCR.
(C) Glucose production by HepG2 cells treated with statins and CQ. *p<0.05,
**p<0.01 compared with no CQ group. (n=5)

22
Inhibition of autophagic process with Baf A1 treatment resulted in attenuation of
increased G6PC and PCK1 expression with statin (Fig. 9A and Fig. 9B). In addition
glucose production was also decreased with Baf A1 (Fig. 9C).
Figure 9. Bafilomycin A1 decrease gluconeogenic gene expression and glucose
concentration in culture media. HepG2 cells treated with statins and 20 nM
bafilomycin A1 for 2hours to confirm autophagy-dependent gluconeogenesis. (A)
G6PC and (B) PCK1 were analysed with qRT-PCR. (C) Glucose production was
measured. *p<0.05, **p<0.01 compared with no Baf A1 group. (n=5)

23
To better understand the effect of statins on autophagy, we transfected HepG2
cells with short hairpin RNAs (shRNAs) against the gene encoding beclin-1
(BECN1), which plays an important role in autophagy induction.28 After confirming
the knockdown of BECN1 (Fig. 10A), we observed statin-dependent increases in
G6PC and PCK1 mRNA levels in transfected cells (Fig. 10B and Fig. 10C). These
data support the role of autophagy in statin-induced gluconeogenesis.
Figure 10. Statin has no effect on gluconeogenic gene expression without
autophagic related beclin 1 expression. HepG2 cells were transfected with BECN1
shRNA. (A) After 48hours, knockdown of BECN1 was confirmed by Western blot
analysis. Inhibition of autophagy by BECN1 knockdown decreased expression of
(B) G6PC and (C) PCK1. *p<0.05, **p<0.01 compared with control cells
transfected with scrambled shRNA. (n=5)
24
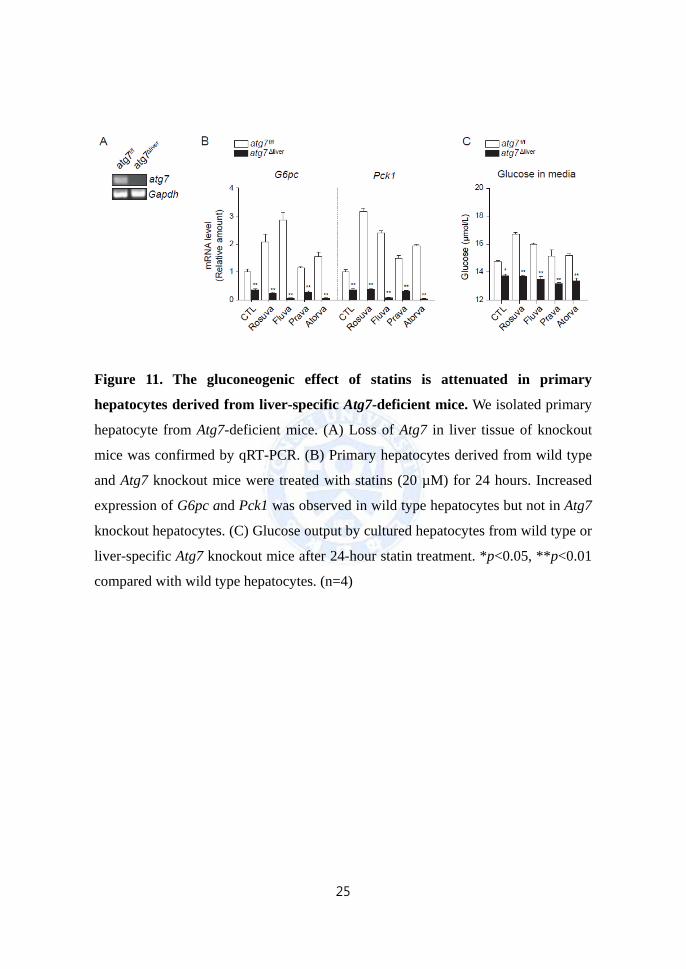
4. ATG7 is necessary for statin-induced gluconeogenesis in the liver
To further evaluate the role of autophagy in regulating the expression of
gluconeogenic enzymes, ex vivo studies were performed with primary hepatocytes
isolated from liver-specific autophagy-related 7 (Atg7) knockout mice. After the loss
of Atg7 in the liver was confirmed by RT-PCR (Fig. 11A), the cultured hepatocytes
were treated with statins for 24 hours. Our results showed that the statin-induced
increase in expression of gluconeogenic enzymes (G6pc and Pck1) was blocked in
Atg7 knockout hepatocytes (Fig. 11B). In addition, glucose output did not increase
in response to statins in hepatocytes lacking Atg7 (Fig. 11C). Collectively, these data
suggest that ATG7, the core autophagy regulator, is required for statin-induced
gluconeogenesis in the liver, supporting the role of autophagy in statin-induced
hepatic gluconeogenesis.
25
Figure 11. The gluconeogenic effect of statins is attenuated in primary
hepatocytes derived from liver-specific Atg7-deficient mice. We isolated primary
hepatocyte from Atg7-deficient mice. (A) Loss of Atg7 in liver tissue of knockout
mice was confirmed by qRT-PCR. (B) Primary hepatocytes derived from wild type
and Atg7 knockout mice were treated with statins (20 µM) for 24 hours. Increased
expression of G6pc and Pck1 was observed in wild type hepatocytes but not in Atg7
knockout hepatocytes. (C) Glucose output by cultured hepatocytes from wild type or
liver-specific Atg7 knockout mice after 24-hour statin treatment. *p<0.05, **p<0.01
compared with wild type hepatocytes. (n=4)

26
5. Akt-FoxO1 pathway has no effect on statin induced gluconeogenesis but
decrease mTOR phosphorylation.
To check gluconeogenesis was accelerated by statins, we tested whether
glucogenic amino acid, alanine, could enhance glucose output of HepG2 cell treated
with statins. We found that treatment of HepG2 cells with alanine significantly
increased glucose output in the absence of statin. In addition synergistic effects were
seen when alanine and statins were treated simultaneously (Fig. 12). These data
suggested that statin-induced gluconeogenesis is working.

27
Figure 12. Glucogenic amino acid, alanine, enhances glucose output of HepG2
cell treated with statins. For glucose production assay, primary hepatocytes were
incubated with statins for 18 hours in hepatocyte medium (DMEM with glucose and
phenol red). Then we changed the medium with glucose production medium
with/without alanine. After 6 hours, we collected glucose production medium and
measured glucose concentration using glucose assay kit. Glucose production
medium (DMEM without glucose and without phenol red; GIBCO A14430-01, 2
mM sodium pyruvate, 20 mM sodium lactate, 2 mM L-glutamine and 15mM
HEPES) **P<0.01 for –Ala vs. +Ala, ##P<0.01 for control vs. statins in the no alanine
treatment group, §P<0.05 and §§P<0.01 for control vs. statins in the alanine treatment
group (n=8).

28
G6PC and PCK1 are FoxO1 target genes and they could be regulated by FoxO1.
Therefore we examined whether FoxO1 phosphorylation is altered by statins. We
found that statin increased FoxO1 phosphorylation in primary mouse hepatocytes
(Fig. 13).
Figure 13. Elevated FoxO1 phosphorylation by statins in primary hepatocyte.
FoxO1 phosphorylation level was increased with insulin treatment and decreased
with Wortmannin, a PI3K inhibitor in primary mouse hepatocyte. Cells were treated
with statins for 24 hours, and treated with insulin and Wortmannin for 6 hours.

29
The canonical insulin signaling pathway for regulation of glucose metabolism
involves phosphorylation and export of the transcription factor FoxO1 out of the
nucleus. Staying FoxO1 in the nucleus induces the transcriptional induction of
gluconeogenic enzymes. Increased phosphorylation of FoxO1 by statins in primary
mouse hepatocytes suggests that statins promote gluconeogenesis enzymes
independent of FoxO1 phosphorylation. Akt can induce the phosphorylation of
FoxO1, making it accumulated in the cytoplasm. We found that Akt phosphorylation
was decreased with by statin treatment in primary mouse hepatocyte (Fig. 14).
Figure 14. Akt phosphorylation was decreased with statin treatment in primary
mouse hepatocyte. Akt phosphorylation level was increased with insulin treatment
and decreased with Wortmannin, a PI3K inhibitor.

30
Because the role of mTOR in autophagy inhibition is well-established,25,29 and
simvastatin has been reported to suppress mTOR signaling in cardiomyocytes in
vitro and in vivo,25 we examined the effect of statins on mTOR complex 1and
downstream target in HepG2 cells. Statins attenuated the mTOR and p70 S6 kinase
α phosphorylation which are enhanced with insulin treatment in HepG2 cells (Fig.
15).
Figure 15. Down-regulation of mTOR signaling by statin treatment. Insulin
treatment increased the levels of phospho-mTOR (S2448) and phospho-p70 S6
kinase α (T389). However, these were blocked by statin treatment in HepG2 cells.

31
6. Statins increase hepatic gluconeogenesis, leading to hepatic insulin resistance
in high-fat diet-fed mice
To evaluate the in vivo effects of statins on glucose homeostasis, beginning at 5
weeks of age mice were fed a high-fat diet supplemented with rosuvastatin,
fluvastatin, pravastatin, or atorvastatin for 16 weeks. Mean body weight
significantly increased in statin-treated mice compared with untreated mice (Fig.
16A), independent of food intake (Fig. 16B).
Figure 16. Statin treatment increased body weight of high fat diet fed mice
whereas did not affect amount of food intake. 5 weeks old mice were fed a high-
fat diet with or without a statin (0.01%, w/w) for 16 weeks. (A) Mean body weight
gain was significantly higher in statin-treated mice compared with untreated control
mice. (B) Food intake did not differ among the groups. *p<0.05, **p<0.01
compared with CTL group. (untreated control, n=9; rosuvastatin, n=7; fluvastatin,
n=7; pravastatin, n=11; atorvastatin, n=11)

32
We measured fasting blood glucose levels and performed the oral glucose
tolerance test and insulin tolerance test at week 15 and pyruvate tolerance test at
week 16. Our results showed that fasting blood glucose levels were higher in mice
treated with pravastatin or atorvastatin compared with mice treated with rosuvastatin
or fluvastatin (Fig. 17).
Figure 17. Fasting blood glucose levels were elevated in statin-treated mice.
Mice were measured blood glucose after 8 hours fasting at each time points.
*p<0.05, **p<0.01 compared with CTL group. (untreated control, n=9; rosuvastatin,
n=7; fluvastatin, n=7; pravastatin, n=11; atorvastatin, n=11)
Results of the oral glucose tolerance test did not differ between pravastatin- and
atorvastatin-treated mice and control mice (Fig. 18A), indicating that pancreatic β-
cell function was not impaired at 15 weeks. However, blood glucose levels failed to
decrease upon insulin treatment in statin-treated mice, indicating insulin resistance
(Fig. 18B), and area under the curve for the insulin tolerance test differed
significantly between the control group and the statin-treated groups (Fig. 18D and
18E). To evaluate the possibility that statins induce hepatic insulin resistance by
increasing hepatic glucose production, we performed the pyruvate tolerance test,

33
which showed significantly elevated blood glucose levels in pravastatin- and
atorvastatin-treated mice over 3 hours (Fig. 18C and Fig. 18F). These data suggest
that pravastatin and atorvastatin increase blood glucose levels in vivo, at least in part,
by stimulating hepatic gluconeogenesis.

34
Figure 18. Statin treatment impairs insulin and pyruvate tolerance in high-fat
diet-fed mice. We performed OGTT and ITT after 15 weeks of statin treatment, and
PTT after 16 weeks of statin treatment. (A) Mice were fasted for 6-hour before oral
glucose tolerance test. Results of the oral glucose tolerance test performed at 20
weeks of age showed no differences among groups (pravastatin-treated, atorvastatin-
treated, and untreated control mice). (B) Mice were fasted for 4-hour before insulin
tolerance test. Results of the insulin tolerance test showed attenuated insulin
responses in statin-treated mice at 20 weeks. (C) Mice were fasted for 18-hour
before pyruvate tolerance test. Results of the pyruvate tolerance test performed at 21
weeks of age showed elevated blood glucose levels in pravastatin- and atorvastatin-
treated mice. Calculated areas under the curves of insulin tolerance test (E), and
pyruvate tolerance test (F) were significant differences between CTL and statin-
treated groups, but not oral glucose tolerance test (D). Data are presented as means
with SEM. *p<0.05, **p<0.01 compared with CTL group. (untreated control, n=9;
pravastatin, n=11; atorvastatin, n=11)

35
To determine whether statins function as HMG-CoA reductase inhibitors under
our experimental conditions, we measured serum levels of cholesterol, triglycerides,
and free fatty acids in the high-fat diet-fed mice. Serum cholesterol levels were only
marginally decreased by rosuvastatin and fluvastatin (Fig. 19A); however, serum
triglyceride and free fatty acid levels were significantly decreased in the statin-
treated groups compared with the control group (Fig. 19B and Fig. 19C). These data
suggest that under conditions in which statins increase hepatic gluconeogenesis, they
function as HMG-CoA inhibitors within hepatocytes, and these statin-induced
metabolic changes may be related to the inhibition of endogenous cholesterol
synthesis.
Figure 19. Statins decrease lipid profile in mouse serum. Statin treatments
significantly decreased serum cholesterol (A), triglyceride (B), and free fatty acid
(C) levels. *p<0.05, **p<0.01 compared with untreated mice (control, n=9;
rosuvastatin, n=7; fluvastatin, n=7; pravastatin, n=11 and atorvastatin, n=11).

36
7. Statins increase hepatic gluconeogenesis and autophagy in high-fat diet-fed
mice
To determine whether statins increase hepatic gluconeogenesis and autophagy in
vivo, expression of key gluconeogenic enzymes in the livers of high-fat diet-fed
mice was evaluated by real-time qRT-PCR. Consistent with in vitro results, statin
treatment caused a significant increase in the expression of hepatic gluconeogenic
genes (G6pc and Pck1) in mice (Fig. 20A and Fig. 20B). However, expression of
glycolytic genes (Gck and Pklr) was not affected by statins (Fig. 20C and Fig. 20D).
Figure 20. Gluconeogenic and glycolytic gene expression in mouse livers. Statin
treatment elevates expression of gluconeogenic enzymes but not glycolytic enzymes
in the livers of statin-treated mice. Results of qRT-PCR showed that statins increase
expression of G6pc (A) and Pck1 (B), which encode gluconeogenic enzymes. In
contrast, expression of Gck (C) and Pklr (D), which encode glycolytic enzymes, did
not differ between statin-treated and untreated control mice. *p<0.05, **p<0.01
compared with control. (control, n=9; rosuvastatin, n=7; fluvastatin, n=7;
pravastatin, n=11 and atorvastatin, n=11)
37
To determine whether statins induce autophagy in mouse livers in vivo, electron
microscopy analysis was performed. Transmission electron microscopy analysis
revealed prominent vacuolization and autophagosomes in the hepatocytes of statin-
treated mice (Fig. 21A). Autophagic vacuoles are increased in statin treated mouse
livers (Fig. 21B). Collectively, these data demonstrate that statin treatment leads to
insulin resistance by increasing gluconeogenesis, which is tightly coupled to
autophagy.

38

39
Figure 21. Electron microscopy analysis of autophagosomes in the liver of
statin-treated mice. (A) Hepatocytes of statin-treated mice showed prominent
vacuolization and autophagosomes, as assessed by transmission electron microscopy.
Arrows indicate double membranes of autophagosomes; scale bars indicate 2 µm at
×10,000 and 1 µm at ×30,000 magnification. (B) All statins significantly increase
autophagic vacuoles formations in mouse livers. *p<0.05, **p<0.01 compared with
control.

40
IV. DISCUSSION
Although numerous clinical trials and epidemiologic studies have demonstrated
that statin therapy increases the risk of T2DM,3-9 the molecular mechanism
underlying this unexpected drug action has not been elucidated. In this study, we
showed that statin treatment leads to insulin resistance by activating hepatic
gluconeogenesis, which is tightly coupled to hepatic autophagy.
One of this study’s most important findings is that statins induce autophagy in
hepatocytes both in vitro and in vivo. Although a recent study showed that statin
treatment blocks autophagy flux in skeletal muscle by inhibiting protein kinase D
activity,30 most previous studies have described the effects of statins on autophagy in
cultured cells.22-25 In human prostate cancer and rhabdomyosarcoma cells, statins
were shown to induce autophagy by blocking geranylgeranyl biosynthesis through
the inhibition of HMG-CoA reductase.23,24 In coronary artery myocytes, Rac1-
GTPase overexpression, which activates mammalian target of rapamycin (mTOR),
blocked simvastatin-induced autophagy.25
However, paradoxically, statins decreased the phosphorylation of Akt whereas they
increased the phosphorylation of FoxO1 in primary mouse hepatocytes. This
suggests that statin-induced increase in FoxO1 phosphorylation is independent of
insulin-Akt signaling. Insulin-PI3K-Akt-FoxO1 pathway itself is intact in primary
cultured hepatocytes because insulin could increase the phosphorylation levels of
FoxO1 and Akt, and Wortmannin could decrease both the phosphorylation. Other
mechanism rather than phosphorylation, like FoxO1 acetylation,31-34 XBP-1
mediated FoxO1 proteosomal degradation35 and/or O-GlcNAc glycation36-38 could
overcome the effect of FoxO1 phosphorylation and enhance gluconeogenesis.
Therefore our data suggest that statin-induced elevation of gluconeogenesis is
independent of FoxO1 phosphorylation.

41
Nevertheless, the mechanism by which statins affect mTOR activity is unknown. A
recent study reported a link between mTOR signaling and intracellular cholesterol
trafficking.39 In this study, pharmacological depletion of cholesterol from the plasma
membrane of endothelial cells inhibited mTOR activity, and this effect was partially
reversed by restoration of cholesterol to the membrane, suggesting that mTOR is
involved in sensing cellular membrane sterol concentrations.39 Because statins block
cholesterol synthesis in the liver,40 these drugs may cause cholesterol depletion from
the plasma membrane by suppressing de novo cholesterol synthesis. Indeed, statins
have been reported to decrease membrane cholesterol levels in various cell types.41,42
Moreover, mevalonate, the cholesterol intermediate just downstream of HMG-CoA,
reverses statin-induced inhibition of mTOR signaling,43,44 indicating that HMG-CoA
reductase inhibition is required for the suppression of mTOR activity. However,
additional studies are needed to confirm that statins reduce membrane cholesterol
level in hepatocytes and that statin-induced autophagy and gluconeogenesis are
mediated through the suppression of mTOR activity.
The mechanism by which autophagy induces gluconeogenesis is also unclear.
Autophagy is thought to be a survival mechanism during starvation that supplies
amino acids for gluconeogenesis in the liver.17,45 Accordingly, autophagy-deficient
Atg5 knockout mice generally die from hypoglycemia within 24 hours after birth,46
and liver-specific Atg7 knockout mice fed a high-fat diet show improved insulin
sensitivity and glucose tolerance compared to wild-type high-fat diet-fed mice.26 Our
results showing increased expression of G6pc and Pck1 and elevated glucose output
by statin-treated primary hepatocytes, and the blocking of these effects in the
hepatocytes of Atg7 knockout mice, strongly support the idea that statins stimulate
gluconeogenesis through autophagy. A previous study suggested the opposite role of
autophagy in gluconeogenesis with the finding that virus-mediated overexpression
of Atg7 reduced expression of G6pc and Pck1 in the livers of mice.47 However, the
induction of autophagy by Atg7 overexpression in this study was not verified;

42
therefore, it is not clear that this effect was due to autophagy induction.
In addition, our study revealed a potential new mechanism underlying autophagy-
induced gluconeogenesis: increased expression of the key gluconeogenic enzymes
G6Pase and PEPCK.
Our results showing the attenuated glucose response to exogenous insulin and
delayed glucose disposal after pyruvate loading in our mouse model provide
additional evidence for elevated hepatic gluconeogenesis with statin treatment. No
difference in oral glucose tolerance test results between treatment groups and
controls indicate that chronic statin treatment did not impair the ability of pancreatic
β-cells to secrete insulin under our experimental conditions. However, the effect of
statins on insulin secretion has been controversial.48-50 A previous study showed that
pravastatin does not affect insulin secretion in a pancreatic β-cell line,50 which is
consistent with our result. In contrast, atorvastatin and simvastatin were reported to
inhibit glucose-dependent insulin secretion by blocking calcium signaling in β-
cells,48,50 which differs from our result with atorvastatin. This discrepancy may be
due to differences in the statin concentrations used, because pravastatin and
atorvastatin clearly induced insulin resistance in high-fat diet-fed mice with normal
pancreatic β-cell function. Although increased peripheral insulin resistance and
impaired insulin secretion are considered the main pathophysiologic features of
T2DM, hepatic insulin resistance manifested by elevated gluconeogenesis is another
important aspect of diabetic pathophysiology.51 Consistent with this, our results
showed that pravastatin and atorvastatin increased fasting glucose level, which is, at
least in part, due to enhanced hepatic gluconeogenesis. Collectively, these data
showing statin-induced hepatic insulin resistance and gluconeogenesis in mice
suggest that autophagy-induced hepatic gluconeogenesis is a potential mechanism of
statin-induced T2DM in humans. In contrast to these results, one study reported that
statin can improve insulin sensitivity in liver of obese mice.52 There are some
differences between the studies. They studied with 4 week-old Wistar rat and used

43
lovastatin 6 mg/kg/day whereas we used C57BL/6J mice and the dose of statin was
0.01% weight of food. We administered statins for 16 weeks while they treated statin
for a week. Our study represents the chronic administration of statins.

44
V. CONCLUSION
In conclusion, our study found that chronic statin treatment contributes to the
development of T2DM in mice. Statin treatment upregulated the gene expression of
key enzymes involved in hepatic gluconeogenesis (G6PC and PCK1), increasing
glucose production in the liver, and ultimately leading to hepatic insulin resistance.
Our results showed that these effects are mediated through autophagy induction in
the liver. This work advances our understanding of the mechanism underlying the
effects of statins on insulin resistance and T2DM.

45
REFERENCES
1. Lewington S, Whitlock G, Clarke R, Sherliker P, Emberson J, Halsey J, et al. Blood cholesterol and vascular mortality by age, sex, and blood pressure: a meta-analysis of individual data from 61 prospective studies with 55,000 vascular deaths. Lancet 2007;370:1829-39.
2. Naci H, Brugts J, Ades T. Comparative tolerability and harms of individual statins: a study-level network meta-analysis of 246 955 participants from 135 randomized, controlled trials. Circ Cardiovasc Qual Outcomes 2013;6:390-9.
3. Sabatine MS WS, Morrow DA, McCabe CH, Canon CP. High-dose atorvastatin associated with worsening glycemic control: A PROVE-IT TIMI 22 substudy. Circulation 2004;110.
4. Collins R, Armitage J, Parish S, Sleigh P, Peto R, Heart Protection Study Collaborative G. MRC/BHF Heart Protection Study of cholesterol-lowering with simvastatin in 5963 people with diabetes: a randomised placebo-controlled trial. Lancet 2003;361:2005-16.
5. Sever PS, Poulter NR, Dahlof B, Wedel H, Collins R, Beevers G, et al. Reduction in cardiovascular events with atorvastatin in 2,532 patients with type 2 diabetes: Anglo-Scandinavian Cardiac Outcomes Trial--lipid-lowering arm (ASCOT-LLA). Diabetes Care 2005;28:1151-7.
6. Kjekshus J, Apetrei E, Barrios V, Bohm M, Cleland JG, Cornel JH, et al. Rosuvastatin in older patients with systolic heart failure. N Engl J Med 2007;357:2248-61.
7. Ridker PM, Danielson E, Fonseca FA, Genest J, Gotto AM, Jr., Kastelein JJ, et al. Rosuvastatin to prevent vascular events in men and women with elevated C-reactive protein. N Engl J Med 2008;359:2195-207.
8. Sattar N, Preiss D, Murray HM, Welsh P, Buckley BM, de Craen AJ, et al. Statins and risk of incident diabetes: a collaborative meta-analysis of randomised statin trials. Lancet 2010;375:735-42.
9. Rajpathak SN, Kumbhani DJ, Crandall J, Barzilai N, Alderman M, Ridker PM. Statin therapy and risk of developing type 2 diabetes: a meta-analysis. Diabetes Care 2009;32:1924-9.
10. Preiss D, Seshasai SR, Welsh P, Murphy SA, Ho JE, Waters DD, et al. Risk of incident diabetes with intensive-dose compared with moderate-dose statin therapy: a meta-analysis. JAMA 2011;305:2556-64.
11. McTaggart F, Buckett L, Davidson R, Holdgate G, McCormick A, Schneck D, et al. Preclinical and clinical pharmacology of Rosuvastatin, a new 3-hydroxy-3-methylglutaryl coenzyme A reductase inhibitor. Am J Cardiol 2001;87:28B-32B.

46
12. Nezasa K, Higaki K, Takeuchi M, Nakano M, Koike M. Uptake of rosuvastatin by isolated rat hepatocytes: comparison with pravastatin. Xenobiotica 2003;33:379-88.
13. Parker RA, Clark RW, Sit SY, Lanier TL, Grosso RA, Wright JJ. Selective inhibition of cholesterol synthesis in liver versus extrahepatic tissues by HMG-CoA reductase inhibitors. J Lipid Res 1990;31:1271-82.
14. Sukhija R, Prayaga S, Marashdeh M, Bursac Z, Kakar P, Bansal D, et al. Effect of statins on fasting plasma glucose in diabetic and nondiabetic patients. J Investig Med 2009;57:495-9.
15. Hafner M, Juvan P, Rezen T, Monostory K, Pascussi JM, Rozman D. The human primary hepatocyte transcriptome reveals novel insights into atorvastatin and rosuvastatin action. Pharmacogenet Genomics 2011;21:741-50.
16. Patel AS, Lin L, Geyer A, Haspel JA, An CH, Cao J, et al. Autophagy in idiopathic pulmonary fibrosis. PLoS One 2012;7:e41394.
17. Peracchio C, Alabiso O, Valente G, Isidoro C. Involvement of autophagy in ovarian cancer: a working hypothesis. J Ovarian Res 2012;5:22.
18. Singh R, Cuervo AM. Autophagy in the cellular energetic balance. Cell Metab 2011;13:495-504.
19. Zirin J, Nieuwenhuis J, Perrimon N. Role of autophagy in glycogen breakdown and its relevance to chloroquine myopathy. PLoS Biol 2013;11:e1001708.
20. Jung HS, Chung KW, Won Kim J, Kim J, Komatsu M, Tanaka K, et al. Loss of autophagy diminishes pancreatic beta cell mass and function with resultant hyperglycemia. Cell Metab 2008;8:318-24.
21. Ezaki J, Matsumoto N, Takeda-Ezaki M, Komatsu M, Takahashi K, Hiraoka Y, et al. Liver autophagy contributes to the maintenance of blood glucose and amino acid levels. Autophagy 2011;7:727-36.
22. Parihar SP, Guler R, Khutlang R, Lang DM, Hurdayal R, Mhlanga MM, et al. Statin therapy reduces the mycobacterium tuberculosis burden in human macrophages and in mice by enhancing autophagy and phagosome maturation. J Infect Dis 2014;209:754-63.
23. Parikh A, Childress C, Deitrick K, Lin Q, Rukstalis D, Yang W. Statin-induced autophagy by inhibition of geranylgeranyl biosynthesis in prostate cancer PC3 cells. Prostate 2010;70:971-81.
24. Araki M, Maeda M, Motojima K. Hydrophobic statins induce autophagy and cell death in human rhabdomyosarcoma cells by depleting geranylgeranyl diphosphate. Eur J Pharmacol 2012;674:95-103.
25. Wei YM, Li X, Xu M, Abais JM, Chen Y, Riebling CR, et al. Enhancement of autophagy by simvastatin through inhibition of Rac1-mTOR signaling pathway in coronary arterial myocytes. Cell Physiol Biochem 2013;31:925-

47
37. 26. Kim KH, Jeong YT, Oh H, Kim SH, Cho JM, Kim Y-N, et al. Autophagy
deficiency leads to protection from obesity and insulin resistance by inducing Fgf21 as a mitokine. Nat Med 2013;19:83-92.
27. Shen L, Hillebrand A, Wang DQ, Liu M. Isolation and primary culture of rat hepatic cells. J Vis Exp 2012; doi:10.3791/3917.
28. Wirawan E, Lippens S, Vanden Berghe T, Romagnoli A, Fimia GM, Piacentini M, et al. Beclin1: a role in membrane dynamics and beyond. Autophagy 2012;8:6-17.
29. Yu L, McPhee CK, Zheng L, Mardones GA, Rong Y, Peng J, et al. Termination of autophagy and reformation of lysosomes regulated by mTOR. Nature 2010;465:942-6.
30. Zhang P, Verity MA, Reue K. Lipin-1 regulates autophagy clearance and intersects with statin drug effects in skeletal muscle. Cell Metab 2014;20:267-79.
31. Matsuzaki H, Daitoku H, Hatta M, Aoyama H, Yoshimochi K, Fukamizu A. Acetylation of Foxo1 alters its DNA-binding ability and sensitivity to phosphorylation. Proc Natl Acad Sci U S A 2005;102:11278-83.
32. Frescas D, Valenti L, Accili D. Nuclear trapping of the forkhead transcription factor FoxO1 via Sirt-dependent deacetylation promotes expression of glucogenetic genes. J Biol Chem 2005;280:20589-95.
33. Singh BK, Sinha RA, Zhou J, Xie SY, You SH, Gauthier K, et al. FoxO1 deacetylation regulates thyroid hormone-induced transcription of key hepatic gluconeogenic genes. J Biol Chem 2013;288:30365-72.
34. Mihaylova MM, Vasquez DS, Ravnskjaer K, Denechaud PD, Yu RT, Alvarez JG, et al. Class IIa histone deacetylases are hormone-activated regulators of FOXO and mammalian glucose homeostasis. Cell 2011;145:607-21.
35. Zhou Y, Lee J, Reno CM, Sun C, Park SW, Chung J, et al. Regulation of glucose homeostasis through a XBP-1-FoxO1 interaction. Nat Med 2011;17:356-65.
36. Housley MP, Rodgers JT, Udeshi ND, Kelly TJ, Shabanowitz J, Hunt DF, et al. O-GlcNAc regulates FoxO activation in response to glucose. J Biol Chem 2008;283:16283-92.
37. Housley MP, Udeshi ND, Rodgers JT, Shabanowitz J, Puigserver P, Hunt DF, et al. A PGC-1alpha-O-GlcNAc transferase complex regulates FoxO transcription factor activity in response to glucose. J Biol Chem 2009;284:5148-57.
38. Kuo M, Zilberfarb V, Gangneux N, Christeff N, Issad T. O-glycosylation of FoxO1 increases its transcriptional activity towards the glucose 6-phosphatase gene. FEBS Lett 2008;582:829-34.

48
39. Xu J, Dang Y, Ren YR, Liu JO. Cholesterol trafficking is required for mTOR activation in endothelial cells. Proc Natl Acad Sci U S A 2010;107:4764-9.
40. Istvan ES, Deisenhofer J. Structural mechanism for statin inhibition of HMG-CoA reductase. Science 2001;292:1160-4.
41. Kirsch C, Eckert GP, Mueller WE. Statin effects on cholesterol micro-domains in brain plasma membranes. Biochem Pharmacol 2003;65:843-56.
42. Wei YM, Li X, Xiong J, Abais JM, Xia M, Boini KM, et al. Attenuation by statins of membrane raft-redox signaling in coronary arterial endothelium. J Pharmacol Exp Ther 2013;345:170-9.
43. Andres AM, Hernandez G, Lee P, Huang C, Ratliff EP, Sin J, et al. Mitophagy is Required for Acute Cardioprotection by Simvastatin. Antioxid Redox Signal 2013; doi:10.1089/ars.2013.5416.
44. Kou R, Shiroto T, Sartoretto JL, Michel T. Suppression of Galphas synthesis by simvastatin treatment of vascular endothelial cells. J Biol Chem 2012;287:2643-51.
45. Mortimore GE, Hutson NJ, Surmacz CA. Quantitative correlation between proteolysis and macro- and microautophagy in mouse hepatocytes during starvation and refeeding. Proc Natl Acad Sci U S A 1983;80:2179-83.
46. Kuma A, Hatano M, Matsui M, Yamamoto A, Nakaya H, Yoshimori T, et al. The role of autophagy during the early neonatal starvation period. Nature 2004;432:1032-6.
47. Yang L, Li P, Fu S, Calay ES, Hotamisligil GS. Defective hepatic autophagy in obesity promotes ER stress and causes insulin resistance. Cell Metab 2010;11:467-78.
48. Yada T, Nakata M, Shiraishi T, Kakei M. Inhibition by simvastatin, but not pravastatin, of glucose-induced cytosolic Ca2+ signalling and insulin secretion due to blockade of L-type Ca2+ channels in rat islet beta-cells. Br J Pharmacol 1999;126:1205-13.
49. Mita T, Watada H, Nakayama S, Abe M, Ogihara T, Shimizu T, et al. Preferable effect of pravastatin compared to atorvastatin on beta cell function in Japanese early-state type 2 diabetes with hypercholesterolemia. Endocr J 2007;54:441-7.
50. Ishikawa M, Okajima F, Inoue N, Motomura K, Kato T, Takahashi A, et al. Distinct effects of pravastatin, atorvastatin, and simvastatin on insulin secretion from a beta-cell line, MIN6 cells. J Atheroscler Thromb 2006;13:329-35.
51. Madiraju AK, Erion DM, Rahimi Y, Zhang XM, Braddock DT, Albright RA, et al. Metformin suppresses gluconeogenesis by inhibiting mitochondrial glycerophosphate dehydrogenase. Nature 2014;510:542-6.
52. Lalli CA, Pauli JR, Prada PO, Cintra DE, Ropelle ER, Velloso LA, et al.

49
Statin modulates insulin signaling and insulin resistance in liver and muscle of rats fed a high-fat diet. Metabolism 2008;57:57-65.

50
ABSTRACT (IN KOREAN)
HMG-CoA 환원효소 억제제의 장기적 사용에 따른 Autophagy의
유발에 의한 간의 당신생 증가와 고혈당
<지도교수 강 은 석>
연세대학교 대학원 의과학과
왕 혜 진
스타틴 (3-hydroxy-3-methyl-glutaryl-CoA [HMG-CoA] 환원효소 억제제) 은
혈중 콜레스테롤을 낮추기 위해 널리 쓰이는 약이지만 최근 제 2형 당뇨병의
발병을 증가시키는 것이 문제가 되고 있다. 그러나 이러한 당뇨병을
일으키는 분자적 기전은 아직 알려져 있지 않다. 우리는 이번 연구를 통해
스타틴이 in vitro와 in vivo 에서 당신생에 관련된 중요한 효소들 (glucose 6-
phosphatase; G6Pase 와 phosphoenolpyruvate carboxykinase 1; PEPCK) 의 발현을
증가 시키고 간에서 당생성을 증가 시킨다는 것을 발견하였다. HepG2
세포에 스타틴을 처리 했을 때 autophagy 흐름이 증가 하였다. 또한 HepG2
세포에 lysosome 억제제를 처리하여 autophagy 를 억제 한 경우 당신생
효소들의 발현과 당분비가 줄어들었다. 스타틴이 당생성을 증가시키는
작용은 Atg7 (autophagy-related protein 7)과 beclin 1이 없을 경우에는
나타나지 않았고, 이것은 autophagy가 스타틴의 당뇨병 유발 효과에 중요한

51
역할을 한다는 것을 의미한다. 식이 유발 비만 마우스에게 스타틴을 투여한
경우 마우스의 간에서 autophagic vacuoles 과 당신생 유전자의 발현이
증가하였고, 결국 간에서 당생성이 증가하고 고혈당증이 생기며 인슐린
저항성이 생기게 된다. 종합적으로, 이 결과들은 스타틴의 장기적인 사용이
간에서 autophagy 를 증가시켜 당신생을 증가시키는 것과 연관이 되어 있고,
그 결과 인슐린 저항성이 생긴다는 것을 증명하였다. 이 결과들은 스타틴의
당뇨병을 발병시키는 기전을 인슐린 저항성 측면에서 좀더 잘 이해 할 수
있게 기여할 것이다.
___________________________________________________________________
핵심되는 말: HMG-CoA 환원효소 억제제, 스타틴, 당신생, 당뇨병, autophagy

52
PUBLICATION LIST
Wang HJ, Park JY, Kwon O, Choe EY, Kim CH, et al. Chronic
HMGCR/HMG-CoA Reductase Inhibitor Treatment Contributes to
Dysglycemia by Upregulating Hepatic Gluconeogenesis through Autophagy
Induction. Autophagy 11(11):2089-2101, 2015