chromosome investigation of individuals living in areas of southern germany contaminated by fallout...
TRANSCRIPT

Mutation Research, 319 (1993) 189-196 189 © 1993 Elsevier Science Publishers B.V. All rights reserved 0165-1218/93/$06.00
MUTGEN 01927
Chromosome investigation of individuals living in areas of Southern Germany contaminated by fallout from the Chernobyl reactor accident
G. Stephan and U. Oestreicher Institute for Radiation Hygiene of the Federal Office for Radiation Protection, Neuherberg, Germany
(Received 30 October 1992) (Revision received 7 May 1993)
(Accepted 11 May 1993)
Keywords: Chernobyl fallout; Chromosome aberrations; Peripheral lymphocytes
Summary
One specific area in the Federal Republic of Germany experienced a particularly high contamination by fallout from the Chernobyl reactor accident in 1986. The individuals living there received an additional radiation exposure from the fallout of about 0.8 mSv in 1986, which had decreased to about 0.2 mSv in 1989. Blood samples for chromosome analyses were collected from 29 different individuals during the period 1987-1991. About 44 000 cells were scored. The individuals were subdivided according to sampling time. In 1987/88, the mean frequency of dicentrics and centric rings (dic + R c) was 2.45 + 0.42 per 1000 cells and that for excess acentrics (ace) was 8.20 + 0.90 per 1000 cells. In the following 2 years the mean yields per 1000 cells for dic + R c were 1.60 + 0.40 and 1.79 + 0.42, respectively, and that for ace 8.18 + 0.90 and 6.92 + 0.83, respectively. The mean yields for chromatid breaks (cbr) per 1000 cells in the same periods were 4.96 + 0.60, 6.79 + 0.82, and 5.14 + 0.71, respec- tively. In addition, individuals were investigated as controls in two different areas where the exposure doses from the Chernobyl fallout were lower by one order of magnitude. In one control area, the mean frequency of structural chromosome aberrations was found to be 2.58 + 0.36 dic + Re, 9.62 + 0.69 ace, and 6.54 + 0.57 cbr per 1000 cells (20 individuals, = 20 000 cells). In the other control area, the mean yields were 1.91 + 0.42, 8.63 + 0.89, and 5.90 + 0.73, respectively, per 1000 cells (11 individuals, = 11000 cells). These yields show no significant trend, either with sampling time or with contamination level for any of the three aberration types.
Five individuals from the highly contaminated area who were investigated in 1987, were reinvestigated in 1991. On the basis of about 10,000 cells, the mean yield of d i c + R c per 1000 cells decreased significantly from 2.69 + 0.52 to 1.40 + 0.37 (p < 0.05).
In nine individuals from the contaminated area, the content of cesium nuclides was measured using a whole body counter. No relation between the physically calculated radiation doses to blood and the frequency of dicentrics determined in 1987/88 was found (r = 0.41).
Correspondence: Dr. G. Stephan, Institute for Radiation Hy- giene of the Federal Office for Radiation Protection, Ingolst~idter Landstr. 1, D-85764 Neuherberg, Germany.
In a previous paper we reported on chromoso- mal investigations of German citizens who had returned to the Federal Republic of Ge rmany from different places of residence in the USSR

190
approximately one week after the reactor acci- dent in Chernobyl. The physically calculated ab- sorbed doses of these persons (0.1 mGy) were too low to cause a measurable increase in chromo- some aberrations, taking in vitro experiments into account (Lloyd et al., 1992). However, a signifi- cant increase was observed in the comparison against laboratory control (Stephan and Oest- reicher, 1989). Cristaldi et al. (1991) reported a positive correlation between the increase of mi- cronucleated polychromatic erythrocytes and the radiation exposure in bank voles inhabiting areas in Sweden that were contaminated by the Cher- nobyl fallout. The estimated doses absorbed by these wild rodents were far lower than those required for the production of the same effect in laboratory experiments. The authors have no ex- planation for the discrepancy between estimated dose and measured frequency of micronuclei. A paper by Pohl-Riiling et al. (1991) contains cyto- genetic findings from Salzburg (Austria) resi- dents. An increase in chromosomal aberrations was found, although the additional radiation ex- posure from the Chernobyl fallout was very low (0.612 mGy/year) . Furthermore, a decrease in the frequency of dicentrics was observed with increasing time after the Chernobyl accident. Braselmann et al. (1992) carried out chromosome analyses of persons from the region Berchtes- gaden which is located near Salzburg. Blood was sampled in 1989. No elevation was found in com- parison to the pre-Chernobyl control group.
This paper describes the results from chromo- some analyses in peripheral lymphocytes of indi- viduals living in Berchtesgaden, the most heavily contaminated area in the Federal Republic of Germany, where the contamination is similar to that in Salzburg. Individuals from two areas in the Federal Republic of Germany with very low contamination were investigated as controls. Blood sampling was started in 1987, one year after the accident in Chernobyl, and terminated in 1991.
Individuals from contaminated and control areas
C o n t a m i n a t e d area
Berchtesgaden is located in the southern part of the Federal Republic of Germany. The local
natural radiation exposure (external and internal) is about 1.1 mSv/year . This area experienced the highest contamination from the Chernobyl fallout in the FRG (SSK, 1987) as well as in Western Europe (WHO, 1986). The additional external radiation exposure from fallout was 0.56 mSv in 1986 and the mean additional internal exposure about 0.25 mSv (BMU, 1986). In the following years, these exposures decreased to about 0.2 mSv/year from both sources by 1989 (BMU, 1989). A total of 29 persons were investigated during the course of this study and subdivided into four groups, according to the time of blood sampling. Blood was sampled from nine individu- als (four women, mean age: 33 years; three men, mean age: 25 years; two children, mean age 5.5 years) between March 1987 and April 1988 (Ta- ble 1, sampling period I, group Ba). Between May 1988 and the end of April 1989 (Table 1, sam- pling period II, group B c) 10 persons (men only, mean age: 50 years) were investigated. Sampling period III (Table 1, group B d) between May 1989 and October 1989 included 10 persons (six women, mean age: 41 years; four men, mean age: 40 years). A second investigation was performed on five people from sampling period I (group Bb). The first blood sampling was done between April and December 1987, and a second blood sample taken between November 1990 and February 1991 (Table 1, sampling period IV).
Control areas
Individuals living in areas with low contamina- tion were selected as controls against the Bercht- esgaden group. One such area is Baden-Baden in Southwest Germany, with a natural radiation ex- posure (external + internal) of about 1.1 mSv/ year (SSK, 1987). The contamination from the Chernobyl fallout contributed to an additional external exposure of < 0.03 mSv in 1986, de- creasing to about 0.01 mSv by 1989. The addi- tional internal exposure was 0.03 mSv in 1986 and < 0.01 mSv in 1989 (BMU, 1986, 1989). Blood was sampled during the time between May 1988 and April 1989, from seven men (mean age: 38 years) and 13 women (mean age: 40 years).
The second control population is from Tirschenreuth. The total natural radiation expo- sure was about 1.5 mSv/year (SSK, 1987). In this

area, the contamination from the Chernobyl fall- out was similar to that in Baden-Baden. Blood was sampled from 11 individuals (five women, mean age: 23 years; six men, mean age: 38 years) during the time between May and October 1989.
On a questionnaire, all individuals were asked to indicate previous radiation exposures, intake of pharmaceuticals and viral infections, in order to exclude this kind of chromosome breaking influence.
Calculation of blood dose
The individuals of sampling period I from Berchtesgaden (Table 1, group B a) were mea- sured by whole body counter. The variation of the radiocesium content with time after the Cher- nobyl accident could be clearly demonstrated (ex- ample shown in Fig. 1). The measured content of cesium-134 and cesium-137 was used to calculate the individual blood dose with transfer coeffi- cients for the time between the arrival of the radioactive cloud in the southern part of the FRG (1 May) and the time of blood sampling. These coefficients show the monthly dose per 1000 Bq of incorporated radiocesium, depending on age. For adults, the coefficients are 4.7 /zSv/1000 Bq (cesium-134) and 3.1 lzSv/1000 Bq
191
(cesium-137). For children (5 and 6 years) the coefficients are 12 /zSv/1000 Bq and 11 /zSv/1000 Bq, respectively, for cesium-134 and 9.1 ~Sv/1000 Bq and 8.4 /zSv/1000 Bq, respec- tively, for cesium-137 (based on Christy and Eck- erman, 1987). For most individuals, whole body examinations started during the first part of 1987 and ended about 1 year later. The mean number of examinations within this time was nine. Miss- ing data, especially in 1986, were calculated ac- cording to the time-dependent course of radioce- sium incorporation, as shown in Fig. 1. The blood doses per month were summed up for each indi- vidual. The calculated blood doses for the nine people were between 0.2 mSv and 0.5 mSv.
Chromosome analysis
Most of the blood samples used for chromo- s o m e analysis were taken in our Institute, some of them were mailed in. Lymphocyte cultures were set up under standard laboratory conditions (Oestreicher et al., 1990). Metaphase spreads with 45 and 46 centromeres were analyzed. The fre- quencies of dicentric + ring chromosomes (dic + Re), excess acentric fragments (ace), and chro- matid breaks (cbr) are reported. The aberration
TABLE 1
STRUCTURAL CHROMOSOME ABERRATIONS IN PERIPHERAL LYMPHOCYTES OF INDIVIDUALS LIVING IN THE HIGHLY CONTAMINATED AREA OF BERCHTESGADEN (B), AND IN TWO AREAS WITH VERY LOW CONTAMINATION (BADEN-BADEN, B-B; TIRSCHENREUTH, T)
The Berchtesgaden collective is subdivided according to the time of blood sampling. The other two groups (B-B, T) are listed in chronological order.
Period Group Number of Number Chromosome aberrations
of blood individuals of cells D i c + R c ~_+SEM * Ace ,~_+ SEM *
sampling /1000 cells /1000 cells Cbr ~_+ SEM *
/1000 cells
I B a 9 13904 34 + 2.45+0.42 114 8.20_+0.77 69 4.96_+0.60 B b 5 10032 27 + 2.69_+0.52 76 7.58_+0.87 46 4.59_+0.68
II B c 10 10019 16 1.60_+0.40 82 8.18_+0.90 68 6.79_+0.82 B-B 20 20173 52 + 2.58_+0.36 194 9.62_+0.69 132 6.54_+0.57
III B a 10 10119 18 + 1.79_+0.42 70 6.92_+0.83 52 5.14_+0.71 T 11 11010 21 1.91_+0.42 95 8.63_+0.89 65 5.90_+0.73
IV B b 5 10000 14 1.40+0.37 61 6.10_+0.78 57 5.70_+0.75
I, March '87-April '88; II, May '88-April '89; III, May '89-Oct. '89; IV, Nov. '90-Feb '91. All persons in the Berchtesgaden groups (B a'c'd) are independent. The five persons labeled B b are part of B a and were sampled again in period IV. + Contains 1 R c. * SEM based on Poisson statistics.

192
frequencies shown in Tables 1 and 2 were tested for statistical differences using Fisher 's exact test (dic + Re) or the t-test (ace, cbr).
Results
In accordance with the time of blood sampling, the frequency of structural chromosome aberra- tions as determined for individuals living in the highly contaminated area and in the control areas is shown in Table 1. For the Berchtesgaden groups B a, B c, and B d, there is no significant difference in the mean frequency of dic + Rc, ace or cbr, with blood sampling time.
For five individuals from sampling period I (B b) of the Berchtesgaden group B a, the chromo- some analysis was repeated about 3 years later
Bq x 1000
I I - I - ~ . a . 1 ~'71
MJ J A S O N D J FMAMJ J A S O N D J F M A M J
Months, years after 'Ghernobyl'
Fig. 1. Radiocesium content of one individual living in Bercht- esgaden. Incorporated cesium nuclides were determined in a whole body counter by H. Schmier and K. K6nig of the Institute for Radiation Hygiene. Arrow indicates time of
blood sampling.
(period IV). The dic + R c had decreased during that time by nearly a factor 2. There is a signifi- cant difference between 2.69 and 1.40 d i c + Re/1000 cells (p < 0.05). The mean yields of ace and cbr did not show any significant change.
In the Baden-Baden (B-B) and the Tirschen- reuth (T) group, the mean frequencies of dic + R c and ace are not markedly different from those in the B groups during corresponding time periods. The frequency of cbr is likewise not significantly different between the B, B-B, and T groups in relation to the time of blood sampling.
The number of individuals showing the same frequency of structural chromosome aberrations in relation to the time of blood sampling is shown in Fig. 2 for the B groups (B a, B c, B~). In period I (1987/88), there are four individuals with 0 -2 dic + Re/1000 cells, in period II (1988/89) and in period I I I (1989/90) eight and six individuals, respectively, showing the same frequency of dic + R c. In period I, there is one individual in the class of 0-5 ace. In period II, there are four individuals and in period III there are three who belong in this class. Concerning the cbr, in period I and III there are six individuals with 0 -5 cbr, and in period II there are two individuals with the same frequency. In group B b (Fig. 3) no individuals with 0-1 d i c + Rc/1000 cells are found in period I, whereas about 3 years later this yield of dic + Rc was observed in three individu- als. Concerning the ace, the situation was similar. In period I, the mean yield of ace exceeded 5/1000 ceils in all individuals. About 3 years later the mean frequency was lower than 5 ace/1000 cells in three individuals. In period I, there are two individuals with > 1-3 cbr, whereas all indi- viduals show higher yields in period IV.
Of the B-B group, 13 individuals (65%) showed a frequency for dic + Rc of 0 - 2 per 1000 cells. The other individuals showed a relatively high number of up to 7 per 1000 cells for dic. The most frequent rate for ace was 6-10 per 1000 cells and is also that of cbr. Of the T group, eight individuals (73%) showed 0 - 2 dic/1000 ceils. There was one individual with 5 and one with 6 dic per 1000 cells. The most frequent yield of ace in these individuals was 0-5 per 1000 cells and that of cbr 6-10 per 1000 cells. In the B group, cells with 2 dic occurred six times: five times in

Number of Indivlduele
. p e r i o d I
!fuumn, 0 - I • l - t . t - • • 8 - 4 • 4 - e
N u m b e r of Indiv lduule
. • - 1 o . I • - I e
Number of I n d i v i d u a l s
• • * s o , l o - l e • 1 1 t o
193
Number of Individuals
period II
mmu l
o * I , 1 - 1 , a - • . 8 - 4 I
. ° . o . -'.•
Number of individuals
:t I •l"
f e
o - e , • - 1 o . t O * s • . t e - | o
Number Of Individuals
O ' O ' O ° l O ' I S ' I S " I O ' | O
Number of individuals
period III
i
o - t , t - a . a - • . o - • • • - e * o - e
Number of Individuals
4 ~ 'FN • - e . O - I S , s o - I s
Number Of Individuals e
. 11 l O O - ! . o - I ! , S O - I S . l • - • o
y / -
e
D I c + R e / 1 0 0 0 C e l l s A c e / l O 0 0 C e l l s C b r / l O 0 0 C e l l s
Fig. 2. Number of individuals with the same frequency of structural chromosome aberrations living in Berchtesgaden (Table 1, groups B a, B c, Bd).
Number of Individuals
e - s , I - | • l - • . 0 - 4
Number of individuele Number of Indlvlduele
, 0 - ~ . ~ - O . o - I S . S - i . O - I S . l - S . • - • • • - 7 ' ~ o 0
Number of Individuals
m o - I
per iod IV
m m , t = S . • - e • •
Number of individuals Number of Indlvldualu
, S - O , o - e ' • - Y " - 0 . O - I t
D i ¢ + R ¢ / 1 0 0 0 C e l l s A c e / l O 0 0 C e l l s C b r / l O 0 0 C e l l s
Fig. 3. Number of individuals with the same frequency of structural chromosome aberrations living in Berchtesgaden, who were investigated in 1987 and in 1991 (Table 1, group Bb).
194
D i c + R c / l O 0 0 cel ls 4
3.5 . . . . . . . .
3 ~ . . . . .
2.5 . . . . . . . . . x : ~ . . . . . .
2 . . . . . . . . . . . . . . . . . . . . .
1.5 . . . . . . . :~.
1 . . . . . . . . . . . • • . . . .
0.5 . . . . . . . . . . .
0 I I I I I I
0.15 0.2 0.25 0.3 0.35 0.4 0.45 0.5
B lood Dose [mSv]
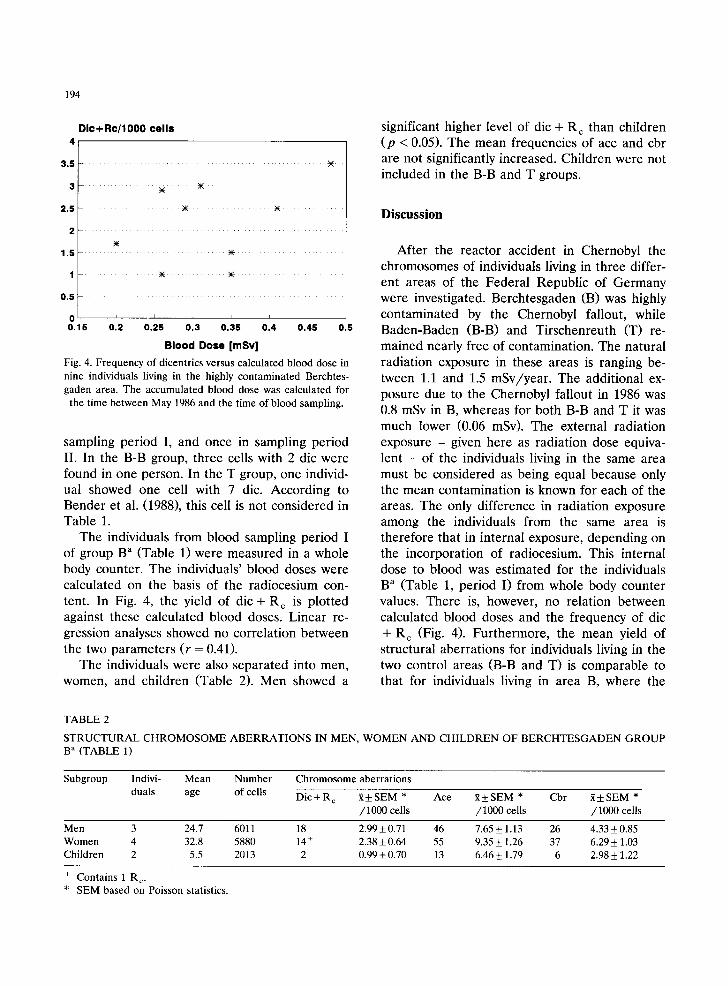
Fig. 4. Frequency of dicentrics versus calculated blood dose in
nine individuals living in the highly contaminated Berchtes-
gaden area. The accumulated blood dose was calculated for
the time between May 1986 and the time of blood sampling.
sampling period I, and once in sampling period II. In the B-B group, three ceils with 2 dic were found in one person. In the T group, one individ- ual showed one cell with 7 dic. According to Bender et al. (1988), this cell is not considered in Table 1.
The individuals from blood sampling period I of group B a (Table 1) were measured in a whole body counter. The individuals' blood doses were calculated on the basis of the radiocesium con- tent. In Fig. 4, the yield of dic + R c is plotted against these calculated blood doses. Linear re- gression analyses showed no correlation between the two parameters (r = 0.41).
The individuals were also separated into men, women, and children (Table 2). Men showed a
significant higher level of dic + R c than children (p < 0.05). The mean frequencies of ace and cbr are not significantly increased. Children were not included in the B-B and T groups.
Discussion
After the reactor accident in Chernobyl the chromosomes of individuals living in three differ- ent areas of the Federal Republic of Germany were investigated. Berchtesgaden (B) was highly contaminated by the Chernobyl fallout, while Baden-Baden (B-B) and Tirschenreuth (T) re- mained nearly free of contamination. The natural radiation exposure in these areas is ranging be- tween 1.1 and 1.5 mSv/year . The additional ex- posure due to the Chernobyl fallout in 1986 was 0.8 mSv in B, whereas for both B-B and T it was much lower (0.06 mSv). The external radiation exposure - given here as radiation dose equiva- lent - of the individuals living in the same area must be considered as being equal because only the mean contamination is known for each of the areas. The only difference in radiation exposure among the individuals from the same area is therefore that in internal exposure, depending on the incorporation of radiocesium. This internal dose to blood was estimated for the individuals B a (Table 1, period I) from whole body counter values. There is, however, no relation between calculated blood doses and the frequency of dic + R c (Fig. 4). Furthermore, the mean yield of structural aberrations for individuals living in the two control areas (B-B and T) is comparable to that for individuals living in area B, where the
TABLE 2
STRUCTURAL C H R O M O S O M E A B E R R A T I O N S IN MEN, W O M E N AND C H I L D R E N OF B E R C H T E S G A D E N G R O U P B a (TABLE 1)
Subgroup Indivi- Mean Number Chromosome aberrations
duals age of cells D i c + R c ~ + S E M * Ace ~ + S E M * Cbr ~ + S E M *
/1000 cells /1000 cells /1000 cells
Men 3 24.7 6011 18 2.99 + 0.71 46 7.65 + 1.13 26 4.33 + 0.85 Women 4 32.8 5880 14 ÷ 2.38 + 0.64 55 9.35 _+ 1.26 37 6.29 + 1.03 Children 2 5.5 2013 2 0.99 + 0.70 13 6.46 _+ 1.79 6 2.98 + 1.22
+ Contains 1 R c. • SEM based on Poisson statistics.

radiation exposure was actually one order of magnitude higher. Thus, the reported results show no correlation with the physically calculated doses from external or internal radiocesium exposure. These findings agree with those by Braselmann et al. (1992) who also investigated individuals living in Berchtesgaden. They had not found a statisti- cal difference against their laboratory control. It should be mentioned that blood samples from eight individuals taken in October 1989 were divided and blood was cultured in our and the Braselmann et al. laboratories. These eight indi- viduals are not indentical with those reported by Braselmann et al. (1992). In 8119 scored cells we found 7 dic. The mean frequency of 0.86 dic/1000 ceils is higher, although not significantly, than the mean value of 0.42 reported by Braselmann et al. (1992). In contrast to our and Braselmann et al.'s (1992) findings, Pohl-Riiling et al. (1991) and Cristaldi et al. (1991) found a dose relationship between external and internal Chernobyl fallout exposure and the measured biological endpoints. Furthermore, Pohl-Riiling et al. (1991) reported a decrease of dicentrics with increasing time after the Chernobyl accident. In our investigations, the mean frequency of dic + R c did not markedly decrease for groups B a, B c, and B °, meaning within 1.5-2 years. There may, however, be a downward trend from the higher mean frequency to a lower one which is possibly reflected by the number of individuals showing the same fre- quency of dicentrics. With increasing time after Chernobyl, the number of individuals with 0 -2 dic + R c per 1000 cells increases (Fig. 2). The number of individuals is, however, too low for statistical validation. On the other hand, for group B b there is a significant reduction in the mean frequency of dic + Rc by nearly a factor 2 within a 3-year interval of time (Table 1). This fact is underlined by the increasing number of individu- als with 0-1 dic + Re per 1000 cells in period IV in comparison to period I (Fig. 3). The decrease by a factor 2 agrees with the half-life time of dicentrics (Bender et al., 1988). Again, the statis- tical material (five individuals) is scanty and cau- tion is needed in interpreting the results.
Concerning the ace, there seems to be a shift in the number of individuals toward a lower fre- quency with increasing time where all B groups
195
are concerned (Figs. 2, 3). Such a trend is not observed in the mean yield of cbr, and would not be expected to be seen if the individuals were actually exposed to radiation because peripheral lymphocytes are in the G O stage of the cell cycle.
It should be noted that the mean frequency of dic + R c was higher in men and women than in children (Table 2). Comparable results were re- ported for Svetlogorsk and Mogilev as areas of residence at the time of the Chernobyl accident and shortly thereafter (Stephan and Oestreicher, 1989). However, the number of children or the respective number of scored cells is too low to permit a definitive statement on whether this effect is systemic or a random occurrence.
Conclusion
The described results show no statistical dif- ference in the mean frequency of chromosome aberrations between individuals living in the highly contaminated area and those living in the two control areas where the radiation exposure is lower by nearly a factor 10. Furthermore, there is no relation between calculated blood doses and the frequency of dic + R c. Therefore, we assume no influence of radiation exposure by radioce- sium on the frequency of chromosome aberra- tions which is in agreement with the findings reported by Braselmann et al. (1992) in spite of a discrepancy between the mean frequencies of dic + R c. In 1989, we determined a mean value of 1.79 per 1000 cells, whereas Braselmann et al. (1992) found a mean frequency of 0.49. The mean yield of only dicentrics as determined in 1987 (2.40 dic/1000 cells) is in agreement with the results of Pohl-Rfiling et al. (1991) who reported a mean value of 2.43 dic per 1000 cells (38 dic in 15,600 cells). The same authors also reported a decline in chromosome aberrations with increas- ing time after the Chernobyl accident. This can- not be statistically supported by our results. Nev- ertheless, the trend should be mentioned indicat- ing a decrease in the frequency of dic + R c and ace with time after the accident whereas a time- related behavior is not seen in the yield of cbr. If the above described systematic trends should be related with ionizing radiation, then rad ionu- clides other than those of cesium might be the cause of exposure.

196
Acknowledgements
The investigations were partly supported by the Bayerisches Staatsministerium fOr Landesent- wicklung und Umweltfragen. The authors are grateful for excellent technical assistance by B. Ackermann, U. Imhof-Bachofner, C. K6rner- Krysa. Thanks are due to Dr. J. Burkhardt for providing blood samples. The results were pre- sented at the International Conference on Low Dose Irradiation and Biological Defense Mecha- nisms, Kyoto, Japan, 12-16 July 1992.
References
Bender, M.A, A.A. Awa, A.L. Brooks, H.J. Evans, P.G. Groer, L.G. Littlefield, C. Pereira, R.J. Preston and B.W. Wacholz (1988) Current status of cytogenetic procedures to detect and quantify previous exposures to radiation, Mutation Res., 196, 103-159.
BMU, Bundesminister ffir Umwelt, Naturschutz und Reaktor- sicherheit (1986) Umweltpolitik, Umweltradioaktivit~it und Strahlenbelastung, Jahresbericht 1986.
BMU, Bundesminister ffir Umwelt, Naturschutz und Reaktor- sicherheit (1989) Umweltpolitik. Bericht des Bun- desregierung an den Deutschen Bundestag fiber Umwelt- radioaktivitiit und Strahlenbelastung im Jahr 1989.
Braselmann, H., E. Schmid and M. Bauchinger (1992) Chro- mosome analysis in a population living in an area of Germany with the highest fallout deposition from the Chernobyl accident, Mutation Res., 283, 221-225.
Christy, M., and K.F. Eckerman (1987) Specific absorbed fractions of energy at various ages from internal photon sources, ORNL/TM-8381/V1-7, Oak Ridge National Laboratory, Oak Ridge, TN.
Cristaldi, M., L.A. Ieradi, D. Mascanzoni and T. Mattei (1991) Environmental impact of the Chernobyl accident: mutagenesis in bank voles from Sweden, Int. J. Radiat. Biol., 59, 31-40.
Lloyd, D.C., A.A. Edwards, A. Leonhard, G.L. Deknudt, L. Verschaeve, A.T. Natarajan, F. Darroudi, G. Obe, F. Palitti, C. Tanzarella and E.J. Tawn (1992) Chromosomal aberrations in human lymphocytes induced in vitro by very low doses of X-rays, Int. J. Radiat. Biol., 61,335-343.
Oestreicher, U., G. Stephan and M. Glatzel (1990) Chromo- some and SCE analyses in peripheral lymphocytes of per- sons occupationally exposed to cytostatic drugs handled with and without use of safety covers, Mutation Res., 242, 271-277.
Pohl-Rfiling, J., O. Haas, A. Brogger, G. Obe, H. Lettner, F. Daschil, C. Atzmfiller, D. Lloyd, R. Kubiak and A.T. Natarajan (1991) The effect on lymphocyte chromosomes of additional radiation burden due to fallout in Salzburg (Austria) from the Chernobyl accident, Mutation Res., 262, 209-217.
SSK, Strahlenschutzkommission (1987) Auswirkungen des Reaktorunfalls in Tschernobyl auf die Bundesrepublik Deutschland (Ed. Bundesminister flit Umwelt, Naturschutz und Reaktorsicherheit), Fischer, Stuttgart.
Stephan, G., and U. Oestreicher (1989) An increased fre- quency of structural chromosome aberrations in persons present in the vicinity of Chernobyl during and after the reactor accident. Is this effect caused by radiation expo- sure?, Mutation Res., 223, 7-12.
WHO (1986) Summary Report No. ICP/COR 129 (S) Rev. 1.5134 V, WHO, Geneva.