chromatic and achromatic vision of macaques: role of the p … · 2003-09-25 · chromatic and...
TRANSCRIPT

The Journal of Neuroscience, March 1989, g(3): 776-783
Chromatic and Achromatic Vision of Macaques: Role of the P Pathway
William H. Merigan
Department of Ophthalmology, University of Rochester Medical Center, Rochester, New York 14642
Chromatic and achromatic contrast sensitivity were mea- sured in a human observer, 2 normal macaque monkeys, and 3 monkeys with severe toxicant-induced damage to the par- vocellular projecting retinogeniculate pathway (P cell-defi- cient monkeys). Damage to the P pathway was produced by the oral administration of acrylamide monomer (Eskin and Merigan, 1988). Contrast sensitivity was measured in all sub- jects with isochromatic luminance gratings, as well as isolu- minant chromatic gratings, modulated along several direc- tions of a color space that represents color-opponent and luminance contrast (Krauskopf et al., 1988). The chromatic and achromatic sensitivity of the control monkeys was vir- tually identical to that of the human observer. Chromatic sensitivity of the P cell-deficient monkeys, measured at a low spatial frequency (0.3 c/deg), along a constant-blue col- or axis, was 0.9-1.5 log units lower than that of controls. Similar losses were seen along a tritanopic confusion axis and along 2 intermediate axes of color direction. Chromatic thresholds measured at higher spatial frequency (2.0 c/deg) were similarly reduced. Counterphase-modulated chromatic gratings were used to test color sensitivity over a range of temporal frequencies up to 15 Hz, and the loss of color vision was substantial over the entire range of frequencies. The luminance contrast sensitivity of the P cell-deficient mon- keys for stationary gratings decreased after exposure by 0.5-0.8 log units.
These results indicate that the chromatic and achromatic spatial vision of macaques is very similar to that of humans. They also suggest that the P pathway plays an important role in macaque chromatic sensitivity at all spatial frequen- cies, as well as achromatic sensitivity at high spatial and lower temporal frequencies.
Parallel retinogeniculate visual pathways have been demon- strated by both anatomical and physiological studies in macaque monkeys (see Lennie, 1980; Shapley and Perry, 1986), and by anatomical methods in humans (Rodieck et al., 1985). The very different characteristics of neurons in the 2 major parallel path-
Received Apr. 20, 1988; revised Aug. 11, 1988; accepted Aug. 12, 1988. This work was supported by NSF Grant BNS-85 18858 and by Grants ES-O 1247
and EY-0139. We thank Thomas A. Eskin, William J. Vaughn, Cheryl Ruff-Neri, and James Lynch for assistance in conducting the experiments, and Peter Lennie, David R. Williams, and Tatiana Pastemak for critically reading the manuscript. Donald D. Johnson. NTID Eve and Ear Clinic. kindlv tested the human observer for congeniial color’defects. I
I ~
Correspondence should be addressed to William H. Merigan, Department of Ophthalmology, Box 3 14, University of Rochester Medical Center, Rochester, NY 14642.
Copyright 0 1989 Society for Neuroscience 0270-6474/89/030776-08$02.00/O
ways suggest that these pathways may play different roles in visual function. The M pathway (which projects to magnocel- lular layers of the geniculate) includes about 10% of retinal ganglion cells (Perry et al., 1984) and these have large retinal dendritic fields, large cell bodies, and stout axons. Physiologi- cally, neurons of this pathway have high luminance contrast sensitivity and excellent temporal frequency resolution and are responsive to low luminance stimuli (Kaplan and Shapley, 1982; Hicks et al., 1983; Virsu et al., 1987; Purpura et al., 1988). On the other hand, the P (parvocellular projecting) pathway includes about 80% of retinal ganglion cells, and these have small somata, small compact dendritic fields, and a dense spatial distribution across the retina (Leventhal et al., 1981; Perry et al., 1984). Physiologically, P pathway neurons show color opponency, low sensitivity, and only moderate temporal resolution (Gouras and Zrenner, 1979; Kaplan and Shapley, 1982; Derrington et al., 1984).
Consideration of their anatomical and physiological proper- ties suggests that the P pathway may be specialized for color vision and acuity, and the M pathway for temporal resolution and the detection of low-luminance stimuli. At present, the only direct evidence for such specialization is Merigan and Eskin’s (1986) observation of achromatic spatiotemporal vision in mon- keys with severe damage to the P pathway. They concluded that the P pathway plays an important role in visual acuity as well as contrast detection at low temporal frequencies.
Damage to the P retinal ganglion cells by acrylamide mono- mer produces reliable inactivation of the P pathway. We have reported detailed observations of selective P cell degeneration in 2 acrylamide-dosed monkeys (Eskin and Merigan, 1986) and have confirmed these observations in 7 additional monkeys. Severe damage to P retinal ganglion cells over much of the retina is shown by greatly reduced anterograde transport of wheat germ agglutinin-conjugated horseradish peroxidase (WGA-HRP), lit- tle or no cytochrome oxidase activity, and marked neuronal atrophy and gliosis in parvocellular layers of the lateral genic- ulate. However, continued activity of small numbers of par- vocellular neurons in the geniculate is suggested by preserved cytochrome oxidase activity in a few scattered neurons in some monkeys. Relative sparing of the M pathway was shown by the same morphological measures and by physiological recording of single cell responses in magnocellular layers of the geniculate of one acrylamide dosed monkey (G. Sklar and W. H. Merigan, unpublished observations). The reliability of these findings sug- gests that monkeys in the present study will show the same pattern of selective degeneration when they are examined mor- phologically.
The present study used acrylamide-exposed monkeys to ex- amine the role ofthe P pathway in the chromatic and achromatic

The Journal of Neuroscience, March 1989, 9(3) 777
Luminance axis B
90” Stimulates SW cones
MW & LW cones
Figure 1. A, CIE coordinates of the 0” (constant-blue) and 90” (tritanopic confusion) axes of the color space used here. The CIE coordinates of the 3 phosphors of the color monitor are shown asJilled circles. B, Color space used in the present study. This space was described by Krauskopf and coworkers (e.g., Krauskopf et al., 1986) and is based on the earlier work of MacLeod and Boynton (1979). The circle represents the isoluminant plane, the major axes of this plane being the tritanopic confusion (90”) axis, which provides no modulation of the middle wavelength (Ml+long wavelength (Lw) opponent mechanism, and the constant-blue (O”) axis, which provides no modulation of short-wavelength-sensitive cones (SlY) [and therefore no modulation of the SW-(MW-LW) opponent mechanism]. The luminance axis is orthogonal to the isoluminant plane and passes through the white point. The elevation of any color axis in this space is the angle between it and the isoluminant plane (0”); the luminance axis has an elevation of 90”.
vision of the primate. The sensitivity of normal monkeys was compared with that of a human observer and that of monkeys with severe, toxicant-induced damage to their P pathway. The color vision of normal macaques and humans was very similar, as would be expected from previous comparisons of their re- ceptor sensitivity (Bowmaker et al., 1978; Dartnall et al., 1983; Nunn et al., 1984; Schnapf et al., 1987), and color vision (DeValois et al., 1974). Results from P cell-deficient monkeys support physiological evidence in indicating that the P pathway plays a dominant role in the primate’s color vision, as well as an important role in its achromatic vision.
Materials and Methods Animals. Five feral, adult, female macaque monkeys (Macaca nemes- trina) were used. Two (112 and 4 10) served as normal controls. The other 3 (56 1, 117, and 3 10) were given 10 mg/kg/d acrylamide monomer orally 5 d/week until marked peripheral neuropathies were evident (dos- ing is summarized in Table l), a treatment regimen that results in severe damage to P retinal ganglion cells (Eskin and Merigan, 1986). The acrylamide administration also produces, over the last few days of dos- ing, a transitory limb weakness and loss of interest by the monkey in its surroundings. Each monkey’s status was monitored closely during this period by its appetite and fluid intake, and highly palatable nutri- tional supplements were provided as needed.
When visual thresholds were tested, each monkey had free access to Purina monkey chow, supplemented regularly with fresh fruit, and was water-deprived for approximately 20 hr before daily testing.
The human subject was a corrected myope with normal color vision as measured by the Nagel anomaloscope, the Farnsworth-Munsell 1 OO- hue test and the Ishihara test plates.
Apparatus and procedures. The monkeys were seated in an acrylic chair facing a 19 inch color monitor (Conrac 72 11) at a distance of 152 cm. An unilluminated white mask surrounded two 14 cm high by 9 cm wide (9” x 6”) oval stimulus areas separated by 2 cm. Stimuli were presented in one of these areas on each trial. Two circular response switches, located on the panel in front of the monkey, could be pressed to indicate whether the stimulus was presented in the right or left stim- ulus area. The monkeys were rewarded with fruit juice for correct re- sponses, and each session consisted, of 200 stimulus presentations.
Stimuli were horizontal sinusoidal gratings modulated in luminance, chromaticity, or both, within a color space derived from the work of MacLeod and Boynton (1979) (Krauskopf et al., 1986). Stimuli were
generated at 60 Hz frame rate by an Adage 3006 raster display unit, controlled by a PDP-1 l/73 computer. Figure 1 illustrates this color space and its location in CIE coordinates. Between trials, both stimulus panels were a uniform white (20 lL, CIE coordinates x = 0.315, y = 0.3 15). After a 4 set intertrial interval, a grating stimulus was presented randomly on either the right or left display. Contrast onset was smoothed in time, its waveform was i/z cycle of a raised cosine of 0.25 Hz. A tone, indicating the opportunity to respond, was turned on 1 set after the start of stimulus onset, and remained on until a response was made. For all threshold measurements described below, the mean luminance and the spatial and temporal frequency of the stimulus remained con- stant within a session, and either the chromatic or luminance contrast was varied according to a staircase that increased stimulus contrast after every error and reduced stimulus contrast with probability 0.25 after every correct choice. Daily thresholds were determined by interpolation to 0.75 on the resulting psychometric function, and at least 3 deter- minations were made for each stimulus condition.
In calculating contrast we made an attempt to compare the various stimulus conditions in terms of the stimulation they provided to gan- glion cells. For luminance contrast, or the luminance component of a non-isoluminant chromatic stimulus, we calculated the contrast deliv- ered to any cone or ganglion cell type as the Michelson contrast CL ~ Llm) / Lax + LA where La, was the point of highest lu- minance and L,,, the point of lowest luminance in the grating. For chromatic contrast along a constant-blue (reddish-greenish) axis, we calculated, from the response spectrum of human cones (cone funda- mentals) of Smith and Pokomy (1975), the contrast delivered to middle- wavelength cones (i.e., the Michelson contrast of a chromatic stimulus for such cones) and that delivered to long-wavelength cones, and added the absolute value of these contrasts. This approach rests on the as- sumption (which has not as yet been examined) that both excitatory and inhibitory inputs into reddish-greenish chromatically opponent gan- glion cells arise from single cone types. Chromatic contrast along the tritanopic confusion axis (approximately yellowish-bluish) was taken as the contrast delivered to the short-wavelength cones. Chromatic contrast for intermediate directions in color space were taken as the vector sum of the 2 above measures. Mixed chromatic and luminance contrasts were calculated as the vector sum of the individual contrasts.
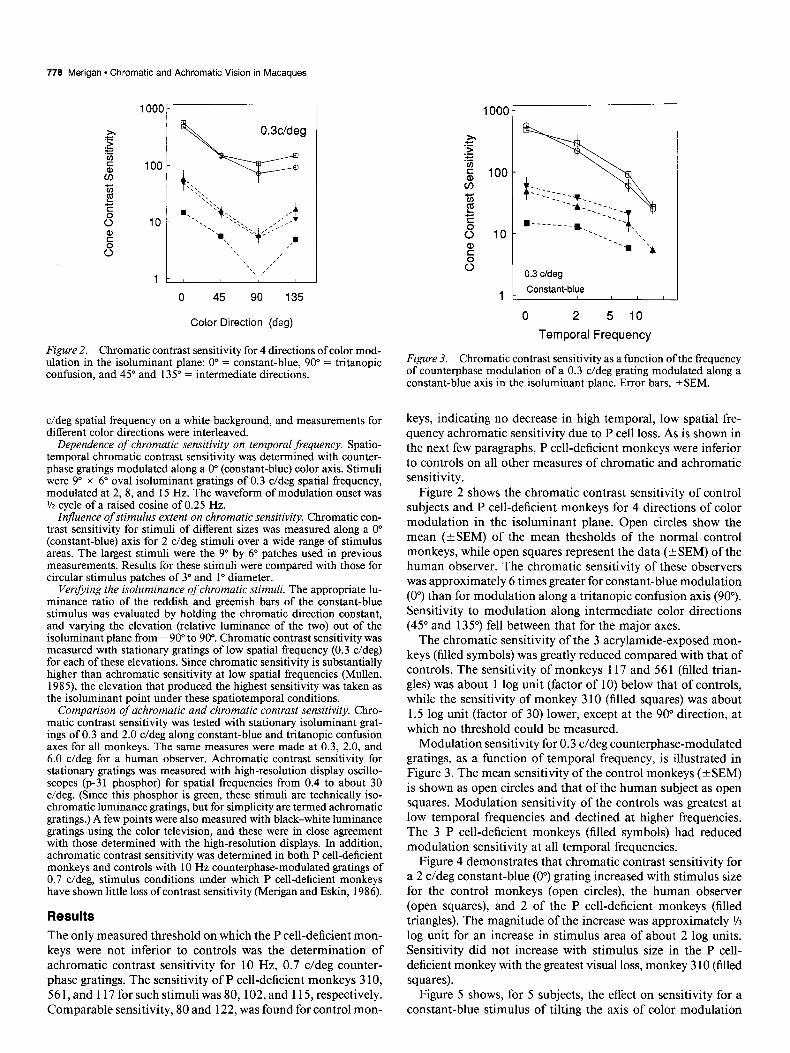
Sensitivity along dz&ent color directions. Chromatic contrast sensi- tivity was measured along the 4 color directions of the isoluminant plane shown in Figure 1 (00,45”, 90”, and 135”). Color directions 0” and 90” appear to stimulate separate second-stage color-opponent mecha- nisms (Krauskopf et al., 1982; Derrington et al., 1984), while directions 45” and 135” each stimulate both of these opponent mechanisms (Kraus- kopf et al., 1986). Stimuli were 9” x 6” oval stationary gratings of 0.3
778 Merigan * Chromatic and Achromatic Vision in Macaques
Color Direction (deg)
Figure 2. Chromatic contrast sensitivity for 4 directions of color mod- ulation in the isoluminant plane: 0” = constant-blue, 90” = trltanopic confusion, and 45” and 135” = intermediate directions.
c/deg spatial frequency on a white background, and measurements for different color directions were interleaved.
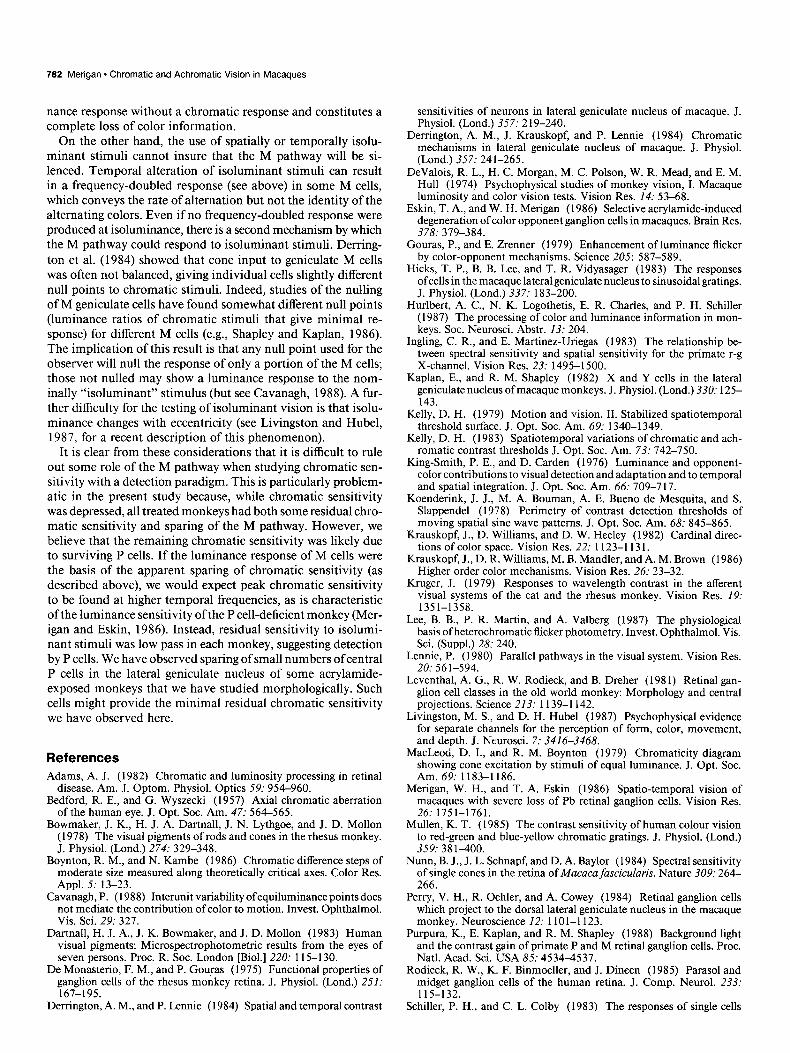
Dependence of chromatic sensitivity on temporal frequency. Spatio- temporal chromatic contrast sensitivity was determined with counter- phase gratings modulated along a 0” (constant-blue) color axis. Stimuli were 9” x 6” oval isoluminant gratings of 0.3 c/deg spatial frequency, modulated at 2, 8, and 15 Hz. The waveform of modulation onset was % cycle of a raised cosine of 0.25 Hz.
Influence of stimulus extent on chromatic sensitivity. Chromatic con- trast sensitivity for stimuli of different sizes was measured along a 0” (constant-blue) axis for 2 c/deg stimuli over a wide range of stimulus areas. The largest stimuli were the 9” by 6” patches used in previous measurements. Results for these stimuli were compared with those for circular stimulus patches of 3” and 1” diameter.
Verijying the isoluminance of chromatic stimuli. The appropriate lu- minance ratio of the reddish and greenish bars of the constant-blue stimulus was evaluated by holding the chromatic direction constant, and varying the elevation (relative luminance of the two) out of the isoluminant plane from -90” to 90”. Chromatic contrast sensitivity was measured with stationary gratings of low spatial frequency (0.3 c/deg) for each of these elevations. Since chromatic sensitivity is substantially higher than achromatic sensitivity at low spatial frequencies (Mullen, 1985), the elevation that produced the highest sensitivity was taken as the isoluminant point under these spatiotemporal conditions.
Comparison of achromatic and chromatic contrast sensitivity. Chro- matic contrast sensitivity was tested with stationary isoluminant grat- ings of 0.3 and 2.0 c/deg along constant-blue and tritanopic confusion axes for all monkeys. The same measures were made at 0.3, 2.0, and 6.0 c/deg for a human observer. Achromatic contrast sensitivity for stationary gratings was measured with high-resolution display oscillo- scopes (p-31 phosphor) for spatial frequencies from 0.4 to about 30 c/deg. (Since this phosphor is green, these stimuli are technically iso- chromatic luminance gratings, but for simplicity are termed achromatic gratings.) A few points were also measured with black-white luminance gratings using the color television, and these were in close agreement with those determined with the high-resolution displays. In addition, achromatic contrast sensitivity was determined in both P cell-deficient monkeys and controls with 10 Hz counterphase-modulated gratings of 0.7 c/deg, stimulus conditions under which P cell-deficient monkeys have shown little loss of contrast sensitivity (Merlgan and E&in, 1986).
Results The only measured threshold on which the P cell-deficient mon- keys were not inferior to controls was the determination of achromatic contrast sensitivity for 10 Hz, 0.7 c/deg counter- phase gratings. The sensitivity of P cell-deficient monkeys 3 10, 56 1, and 117 for such stimuli was 80, 102, and 115, respectively. Comparable sensitivity, 80 and 122, was found for control mon-
1000
)r C 2 .%J f 100 cn zi i! E s 10
E s
1
0.3 cldeg
Constant-blue
0 2 5 10
Temporal Frequency
Figure 3. Chromatic contrast sensitivity as a function of the frequency of counterphase modulation of a 0.3 c/deg grating modulated along a constant-blue axis in the isoluminant plane. Error bars, *SEM.
keys, indicating no decrease in high temporal, low spatial fre- quency achromatic sensitivity due to P cell loss. As is shown in the next few paragraphs, P cell-deficient monkeys were inferior to controls on all other measures of chromatic and achromatic sensitivity.
Figure 2 shows the chromatic contrast sensitivity of control subjects and P cell-deficient monkeys for 4 directions of color modulation in the isoluminant plane. Open circles show the mean (*SEM) of the mean thesholds of the normal control monkeys, while open squares represent the data (+SEM) of the human observer. The chromatic sensitivity of these observers was approximately 6 times greater for constant-blue modulation (0”) than for modulation along a tritanopic confusion axis (90”). Sensitivity to modulation along intermediate color directions (45” and 135”) fell between that for the major axes.
The chromatic sensitivity of the 3 acrylamide-exposed mon- keys (filled symbols) was greatly reduced compared with that of controls. The sensitivity of monkeys 117 and 561 (filled trian- gles) was about 1 log unit (factor of 10) below that of controls, while the sensitivity of monkey 3 10 (filled squares) was about 1.5 log unit (factor of 30) lower, except at the 90” direction, at which no threshold could be measured.
Modulation sensitivity for 0.3 c/deg counterphase-modulated gratings, as a function of temporal frequency, is illustrated in Figure 3. The mean sensitivity of the control monkeys (? SEM) is shown as open circles and that of the human subject as open squares. Modulation sensitivity of the controls was greatest at low temporal frequencies and declined at higher frequencies. The 3 P cell-deficient monkeys (filled symbols) had reduced modulation sensitivity at all temporal frequencies.
Figure 4 demonstrates that chromatic contrast sensitivity for a 2 c/deg constant-blue (0”) grating increased with stimulus size for the control monkeys (open circles), the human observer (open squares), and 2 of the P cell-deficient monkeys (filled triangles). The magnitude of the increase was approximately %
log unit for an increase in stimulus area of about 2 log units. Sensitivity did not increase with stimulus size in the P cell- deficient monkey with the greatest visual loss, monkey 3 10 (filled squares).
Figure 5 shows, for 5 subjects, the effect on sensitivity for a constant-blue stimulus of tilting the axis of color modulation

The Journal of Neuroscience, March 1989, 9(3) 779
2cfdeg
1 10 100
Stimulus area(deg2)
Figure 4. Chromatic contrast sensitivity along the 0” (constant-blue) color axis in the isoluminant plane as a function of stimulus extent. Abscissa values refer to the area of the stimulus in degrees2 of visual angle. The largest stimulus was oval in shape and subtended 9” vertically by 6” horizontally. The 3” and 1” diameter stimuli were circular.
out of the calculated isoluminant plane. The elevation marked 0 represents sensitivity measured in the calculated isoluminant plane, while positive elevations represent greater brightness of the reddish bars of the grating, and elevations less than 0 rep- resent greater brightness of greenish bars. At elevations of 90 and -90, the stimuli contained only luminance contrast. Open circles and triangles show data of 2 control monkeys, and open squares that of a human observer. All had peak chromatic sen- sitivity for this low spatial frequency at the calculated isolu- minant point. Acrylamide-treated monkey 117 (filled squares) also showed greater sensitivity for chromatic stimuli (near el- evation 0) than achromatic stimuli, while monkey 3 10 (filled circles) had approximately equal sensitivity to chromatic and achromatic gratings.
The chromatic and achromatic contrast sensitivity of 6 sub- jects for stationary gratings is compared in Figure 6. The upper half of the figure shows results for 2 normal monkeys and a human subject (WM). The lower half of the figure shows results for 3 monkeys (117, 56 1, and 3 10) after acrylamide exposure. Achromatic contrast sensitivity of controls is indicated by open triangles and a dotted curve. Achromatic contrast sensitivity of the P cell-deficient monkeys before acrylamide exposure is in- dicated by a dotted curve, and after acrylamide exposure by filled triangles and a solid curve. The chromatic sensitivity of controls along the 0” direction of color modulation is shown by open circles and a solid line. The range of chromatic sensitivities of these 2 normal monkeys is shown by stippling on the figures for the treated monkeys, while the chromatic sensitivity of the treated monkeys after acrylamide exposure is shown by filled circles and a solid line. The achromatic contrast sensitivity of the treated monkeys was about 0.5-0.8 log units lower than that of controls. Chromatic contrast sensitivity was about 0.9-1.5 log units lower.
Figure 7 compares the peak chromatic to the peak achromatic contrast sensitivity of control subjects and P cell-deficient mon- keys. Results for 3 control monkeys and the human observer are shown as open symbols, and those for the P cell-deficient monkeys as filled symbols. Figure 7 illustrates a parallel decline in chromatic and achromatic contrast sensitivity in all subjects
1000
.c
.z ‘E 100 5 cn 5 F! E
8 E 10
s
1
-90 -45 0 45
Elevation (deg)
90
Figure 5. Chromatic contrast sensitivity for a 0.3 c/deg (constant-blue) grating as a function of elevation in the color space. The 0” elevation represents the calculated isoluminant plane and 90”, the luminance axis. Thresholds were measured at elevations of -go”, -45”, - 15”, 0”, 15”, 45”, and 90”. Contrast threshold was calculated as the vector sum of the luminance and chromatic contrast. Error bars, ?SEM.
except monkey 3 10. This one monkey had a profound loss of chromatic sensitivity, but its loss of achromatic sensitivity was no greater than that seen in other acrylamide-exposed monkeys.
Discussion Neurotoxicant-induced degeneration of retinal ganglion cells of the P pathway resulted in a profound, and apparently perma- nent, disruption of macaque color vision. Color vision was se- verely reduced over a 3 octave range of spatial frequencies and a wide range of both temporal frequencies and stimulus sizes. The magnitude of sensitivity loss was similar along both of the major axes of the color space used, as well as along the 2 in- termediate axes. The loss of color vision was accompanied by a substantial reduction in achromatic contrast sensitivity at low, but not at higher, temporal frequencies. The relative sparing of achromatic sensitivity at higher temporal frequencies supports other evidence in indicating a lack of major damage to the M visual pathway. The close relationship observed across monkeys between the loss of chromatic sensitivity and that of low tem- poral frequency achromatic sensitivity suggests that the P visual pathway may mediate both of these capacities.
Nature of the observed color vision loss The color space used in this study describes chromatic stimuli in terms of their effects on color-opponent mechanisms and, thus, is well suited to studying the effects of loss of color-op- ponent ganglion cells. It has recently been shown that the ma- jority of P cells in the macaque lateral geniculate respond best to chromatic stimuli modulated along a constant-blue (O”) axis, and the remainder to modulation along a tritanopic confusion (90”) axis (Derrington et al., 1984; Young, 1986). That these 2 color directions are fundamental for primate color vision was demonstrated by Krauskopf et al. (1982) with the observation that chromatic vision along these 2 dimensions was indepen- dent, that is, did not undergo cross-adaptation.
While the extent of chromatic loss in the P cell-deficient mon- keys varied from about 1 to 1.5 log units, there was no sub-

780 Merigan - Chromatic and Achromatic Vision in Macaques
561
Figure 6. Chromatic and achromatic contrast sensitivity of one human sub- ject (WM), 2 control monkeys (112,4 10, and 3 acrylamide-exposed macaques (561, 117, 3 10). Normal achromatic sensitivity is shown with open triangles and dotted lines, and achromatic sen- sitivity after acrylamide dosing with jilled triangles and solid lines. Chro- matic sensitivity (plotted as the recip- rocal of cone contrast) is shown for the constant-blue axis ofcontrols (open cir- cles in the upper plots and stippling in the lower plots) and a&amide-dosed 1c
310 ‘.i., ... ..,.. . . . . . . ‘.‘:::: . . . . . . ‘...:j:: ,:’ . ..- . ...,.
;.__.... 1’ ‘A.,. . ..’
: y!!r
monkeys (filled circles). Error bars, LSEM.
0.5 510 50 0.5 510 50 0.5 510 50
Spatial Frequency (cideg)
stantial evidence of a selective effect on 1 of these 2 directions of color space. This finding suggests that neither of the 2 types of color-opponent retinal ganglion cell was selectively vulner- able to acrylamide exposure, although sensitivity along a tri- tanopic confusion axis does appear to be especially vulnerable in certain retinal diseases (e.g., Adams, 1982).
Chromatic sensitivity along intermediate axes of this color space has been studied by Krauskopf et al. (1986), who con- cluded that such performance reflected the action of higher- order mechanisms combining signals from the constant-blue
J I
10 50 100 500
Chromatic Contrast Sensitivity
Figure 7. Peak achromatic sensitivity of each subject is plotted as a function of its chromatic sensitivity at 0.3 c/deg.
ir
and tritanopic confusion mechanisms. In this study, we found that sensitivity along these intermediate axes was reduced by approximately the same amount as along the major axes.
Although the present study measured loss of chromatic vision with sensitivity measures, it is useful to extend these results to deficits in color discriminations. Any 2 color stimuli could be represented in the color space used in this experiment (Kraus- kopf et al., 1982) and their separation along constant-blue and tritanopic confusion axes determined. Pairs of stimuli should be discriminable if their separation along either axis exceeds that of the observer’s threshold along that axis. The greatly elevated thresholds of the acrylamide-exposed monkeys in this study suggest a severe loss of color discrimination ability. Quan- titative prediction of such losses would require that chromatic thresholds be independent of absolute location along the 2 chro- matic axes (i.e., of chromatic adaptation). Boynton and Kambe (1986) have shown that this assumption is true to a first ap- proximation.
Relation of chromatic to achromatic vision
The most striking difference between chromatic (van der Horst and Bouman, 1969; Kelly, 1983) and achromatic (Koenderink et al., 1978; Kelly, 1979) spatiotemporal vision is that chromatic sensitivity peaks at lower spatial frequencies than does achro- matic sensitivity (also see Sperling and Harwerth, 197 1; King- Smith and Carden, 1976; Thornton and Pugh, 1983). When stimuli are not stabilized, chromatic vision is low pass and achromatic vision bandpass across spatial frequency, and chro- matic vision falls off much more rapidly at higher temporal and spatial frequencies than achromatic vision. In addition, chro- matic sensitivity is slightly greater than achromatic sensitivity

The Journal of Neuroscience, March 1989, 9(3) 781
at lower spatial and temporal frequencies, when both are mea- sured in units of cone contrast (Vamer et al., 1984; Stromeyer et al., 1987). All ofthe above features were present in the thresh- olds of normal macaques and the human subject in the present study, although chromatic thresholds were not measured at high spatial frequencies because of the difficulty of controlling, in macaques, the chromatic aberration in the retinal image (Bed- ford and Wyszecki, 1957).
The shift of chromatic, relative to achromatic, vision toward lower spatial frequencies may be partly accomplished at the level of individual P cells. Ingling and Martinez-Uriegas (1983) have pointed out that any cell with chromatically opponent center and surround will show only luminance sensitivity at higher spatial frequencies. Further, the response of such a cell to chro- matic gratings will not show the low-frequency falloff in sensi- tivity that is typical of the response to luminance gratings. Thus, the behavior of individual chromatically opponent P cells may account, in part, for the low-pass spatial frequency tuning and the lower spatial resolution of chromatic than luminance vision.
On the other hand, the reduced chromatic sensitivity at higher temporal frequencies is less clearly connected to P cell prop- erties. Psychophysical chromatic sensitivity declines sharply at temporal frequencies of lo-20 Hz (Kelly, 1983) whereas the chromatic response of individual color-opponent P cells de- creases more slowly at high temporal frequencies (B. B. Lee, personal communication). Thus, the poor sensitivity of primates to color at higher temporal frequencies may reflect temporal filtering of P cell responses by later structures in the visual system.
Role of P and M pathways in achromatic vision
The present results suggest that the P pathway plays an impor- tant role in the detection of achromatic contrast at both high spatial and low temporal frequencies. This finding and the evi- dence outlined below are inconsistent with the identification of achromatic vision with the M pathway and chromatic vision with the P pathway (Shapley and Perry, 1986). Physiological studies have established that the P pathway carries both lumi- nance and chromatic information (Wiesel and Hubel, 1966; Shapley and Kaplan, 1982; Derrington et al., 1984) and there is every reason to believe that both are utilized.
A major role for the P pathway in the detection of high spatial frequency luminance stimuli is suggested by the approximately S-fold higher density of P cells in the macaque retina (Perry et al., 1984) by the smaller dendritic fields of P cells in macaque (Perry et al., 1984) and human (Rodieck et al., 1985) and by the smaller P cell receptive field centers in macaque retina (De Monasterio and Gouras, 1975) and geniculate (Derrington and Lennie, 1984). Indeed, Thibos (1986) has reported that the vi- sual acuity of humans at different eccentricities from the fovea is well matched to the spatial sampling density of P ganglion cells in the primate. As pointed out below, there is a transition of P cell response from luminance and chromatic response at low spatial frequencies to only luminance at higher spatial fre- quencies (Ingling and Martinez-Uriegas, 1983). Thus, the pres- ent finding of reduced achromatic sensitivity at high spatial frequencies due to loss of the P pathway is not unexpected.
That loss of P cells should cause a severe reduction in ach- romatic sensitivity at low temporal frequencies is less expected. The sensitivity of individual M cells in the retina or lateral geniculate is substantially higher than that of P cells, and several reports have concluded, possibly on this basis, that the P path-
Table 1. Dosing history of P cell-deficient monkeys
Doses Doses first Interval second
Monkey period (weeks) period
310 50 - -
117 39 20 39 561 50 41 50
way is not responsive to low contrasts (Tootell, 1982; Livingston and Hubel, 1987). There are 2 difficulties with this conclusion.
First, M cells appear to show a greater low spatial frequency falloff in sensitivity than do P cells (Hicks et al., 1983; Der- rington and Lennie, 1984). Thus, the superiority of M cell over P cell sensitivity is most marked at middle to higher temporal frequencies-in fact, at the very temporal frequencies at which contrast sensitivity was virtually normal in the acrylamide-ex- posed monkeys of this study.
Second, it has been argued that probability summation among low-sensitivity P cells can result in high, P cell-mediated, psy- chophysical luminance sensitivity (Merigan and Eskin, 1986). It is noteworthy that the chromatic sensitivity of individual P cells is also substantially lower than chromatic sensitivity mea- sured psychophysically (Derrington et al., 1984; Shapley and Kaplan, 1986). Thus, probability summation among P cells ap- pears to be important in chromatic as well as achromatic vision.
Role of the P and A4 pathways in chromatic vision Findings in the present study indicate that the P pathway plays a dominant, and perhaps exclusive, role in the perception of chromatic stimuli. This is certainly in keeping with physiological findings of color-opponent properties in P, but not M, cells (De Monasterio and Gouras, 1975; Derrington et al., 1984; Lee et al., 1987) and the relation of the major or “cardinal” direc- tions of color opponency in human psychophysical measure- ments to the response of geniculate P neurons (Krauskopf et al., 1982; Derrington et al., 1984). The most obvious difficulty with this account, the finding that the chromatic sensitivity of in- dividual P cells is very low compared with that measured psy- chophysically (see above), may reflect substantial probability summation among individual P cells.
An alternative approach to the study of P and M cell roles in color vision would be to examine the chromatic sensitivity that could be mediated by the M pathway. The physiological sig- nature of color opponency is that the phase of a cell’s response to chromatic alternation is not reversed when the luminance ratio of the alternated colors is manipulated. For example, a color-opponent cell might respond with an increase in firing to a reddish stimulus and a decrease in firing to a greenish stimulus despite great variation in the relative luminance of these stimuli. Reversal of the phase of response (for example, greater firing to a reddish stimulus under some conditions and to a greenish stimulus under others) does occur in nonopponent cells of the M pathway when the luminance ratio of alternated colors is varied, giving a nulling of the cell’s response (Kruger, 1979; Lee et al., 1987) or appearance of a frequency-doubled response (Schiller and Colby, 1983; Hurlbert et al., 1987) at some lu- minance ratio. This phase reversal is characteristic of a lumi-
782 Merigan * Chromatic and Achromatic Vision in Macaques
nance response without a chromatic response and constitutes a complete loss of color information.
On the other hand, the use of spatially or temporally isolu- minant stimuli cannot insure that the M pathway will be si- lenced. Temporal alteration of isoluminant stimuli can result in a frequency-doubled response (see above) in some M cells, which conveys the rate of alternation but not the identity of the alternating colors. Even if no frequency-doubled response were produced at isoluminance, there is a second mechanism by which the M pathway could respond to isoluminant stimuli. Derring- ton et al. (1984) showed that cone input to geniculate M cells was often not balanced, giving individual cells slightly different null points to chromatic stimuli. Indeed, studies of the nulling of M geniculate cells have found somewhat different null points (luminance ratios of chromatic stimuli that give minimal re- sponse) for different M cells (e.g., Shapley and Kaplan, 1986). The implication of this result is that any null point used for the observer will null the response of only a portion of the M cells; those not nulled may show a luminance response to the nom- inally “isoluminant” stimulus (but see Cavanagh, 1988). A fur- ther difficulty for the testing of isoluminant vision is that isolu- minance changes with eccentricity (see Livingston and Hubel, 1987, for a recent description of this phenomenon).
It is clear from these considerations that it is difficult to rule out some role of the M pathway when studying chromatic sen- sitivity with a detection paradigm. This is particularly problem- atic in the present study because, while chromatic sensitivity was depressed, all treated monkeys had both some residual chro- matic sensitivity and sparing of the M pathway. However, we believe that the remaining chromatic sensitivity was likely due to surviving P cells. If the luminance response of M cells were the basis of the apparent sparing of chromatic sensitivity (as described above), we would expect peak chromatic sensitivity to be found at higher temporal frequencies, as is characteristic of the luminance sensitivity of the P cell-deficient monkey (Mer- igan and Eskin, 1986). Instead, residual sensitivity to isolumi- nant stimuli was low pass in each monkey, suggesting detection by P cells. We have observed sparing of small numbers of central P cells in the lateral geniculate nucleus of some acrylamide- exposed monkeys that we have studied morphologically. Such cells might provide the minimal residual chromatic sensitivity we have observed here.
References Adams, A. J. (1982) Chromatic and luminosity processing in retinal
disease. Am. J. Optom. Physiol. Optics 59: 954-960. Bedford, R. E., and G. Wyszecki (1957) Axial chromatic aberration
of the human eye. J. Opt. Sot. Am. 47: 564-565. Bowmaker, J. K., H. J. A. Dartnall, J. N. Lythgoe, and J. D. Mollon
(1978) The visual pigments of rods and cones in the rhesus monkey. J. Physiol. (Lond.) 274: 329-348.
Boynton, R. M., and N. Kambe (1986) Chromatic difference steps of moderate size measured along theoretically critical axes. Color Res. Appl. 5: 13-23.
Cavanagh, P. (1988) Interunit variability ofequiluminance points does not mediate the contribution of color to motion. Invest. Ophthalmol. Vis. Sci. 29: 327.
Dartnall, H. J. A., J. K. Bowmaker, and J. D. Mollon (1983) Human visual pigments: Microspectrophotometric results from the eyes of seven persons. Proc. R. Sot. London [Biol.] 220: 115-l 30.
De Monasterio, F. M., and P. Gouras (1975) Functional properties of ganglion cells of the rhesus monkey retina. J. Physiol. (Lond.) 251: 167-195.
Derrington, A. M., and P. Lennie (1984) Spatial and temporal contrast
sensitivities of neurons in lateral geniculate nucleus of macaque. J. Physiol. (Lond.) 357: 2 19-240.
Derrington, A. M., J. Krauskopf, and P. Lennie (1984) Chromatic mechanisms in lateral geniculate nucleus of macaque. J. Physiol. (Lond.) 357: 241-265.
DeValois, R. L., H. C. Morgan, M. C. Poison, W. R. Mead, and E. M. Hull (1974) Psvchonhvsical studies of monkev vision. I. Macaaue luminosity and color-vision tests. Vision Res. i4: 53-68. -
Eskin, T. A., and W. H. Merigan (1986) Selective acrylamide-induced degeneration of color opponent ganglion cells in macaques. Brain Res. 378: 379-384.
Gouras, P., and E. Zrenner (1979) Enhancement of luminance flicker by color-opponent mechanisms. Science 205: 587-589.
Hicks, T. P., B. B. Lee, and T. R. Vidyasager (1983) The responses of cells in the macaque lateral geniculate nucleus to sinusoidal gratings. J. Physiol. (Lond.) 337: 183-200.
Hurlbert, A. C., N. K. Logothetis, E. R. Charles, and P. H. Schiller (1987) The processing of color and luminance information in mon- keys. Sot. Neurosci. Abstr. 13: 204.
Ingling, C. R., and E. Martinez-Uriegas (1983) The relationship be- tween spectral sensitivity and spatial sensitivity for the primate r-g X-channel. Vision Res. 23: 1495-1500.
Kaplan, E., and R. M. Shapley (1982) X and Y cells in the lateral geniculate nucleus of macaque monkeys. J. Physiol. (Lond.) 330: 125- 143.
Kelly, D. H. (1979) Motion and vision. II. Stabilized spatiotemporal threshold surface. J. Opt. Sot. Am. 69: 1340-l 349.
Kelly, D. H. (1983) Spatiotemporal variations of chromatic and ach- romatic contrast thresholds J. Opt. Sot. Am. 73: 742-750.
King-Smith, P. E., and D. Carden - (1976) Luminance and opponent- color contributions to visual detection and adaptation and to temporal and spatial integration. J. Ont. Sot. Am. 66: 709-7 17.
Koenderink, J. J.:M. A. Bouman, A. E. Bueno de Mesquita, and S. Slappendel (1978) Perimetry of contrast detection thresholds of moving spatial sine wave patterns. J. Opt. Sot. Am. 68: 845-865.
Krauskopf, J., D. Williams, and D. W. Heeley (1982) Cardinal direc- tions of color space. Vision Res. 22: 1123-l 13 1.
Krauskopf, J., D. R. Williams, M. B. Mandler, and A. M. Brown (1986) Higher order color mechanisms. Vision Res. 26: 23-32.
Kruger, J. (1979) Responses to wavelength contrast in the afferent visual systems of the cat and the rhesus monkey. Vision Res. 19: 1351-1358.
Lee, B. B., P. R. Martin, and A. Valberg (1987) The physiological basis of heterochromatic flicker photometry. Invest. Ophthalmol. Vis. Sci. (Suppl.) 28: 240.
Lennie, P. (1980) Parallel pathways in the visual system. Vision Res. 20: 561-594.
Leventhal, A. G., R. W. Rodieck, and B. Dreher (198 1) Retinal gan- glion cell classes in the old world monkey: Morphology and central projections. Science 213: 1139-l 142.
Livingston, M. S., and D. H. Hubel (1987) Psychophysical evidence for separate channels for the perception of form, color, movement, and depth. J. Neurosci. 7: 3416-3468.
MacLeod, D. I., and R. M. Boynton (1979) Chromaticity diagram showing cone excitation by stimuli of equal luminance. J. Opt. Sot. Am. 69: 1183-l 186.
Merigan, W. H., and T. A. Eskin (1986) Spatio-temporal vision of macaques with severe loss of Pb retinal ganglion cells. Vision Res. 26: 1751-1761.
Mullen, K. T. (1985) The contrast sensitivity of human colour vision to red-green and blue-yellow chromatic gratings. J. Physiol. (Lond.) 359: 381-400.
Nunn, B. J., J. L. Schnapf, and D. A. Baylor (1984) Spectral sensitivity of single cones in the retina of Macaca fascicularis. Nature 309: 264- 266.
Perry, V. H., R. Oehler, and A. Cowey (1984) Retinal ganglion cells which project to the dorsal lateral geniculate nucleus in the macaque monkey. Neuroscience 12: 1101-l 123.
Purpura, K., E. Kaplan, and R. M. Shapley (1988) Background light and the contrast gain of primate P and M retinal ganglion cells. Proc. Natl. Acad. Sci. USA 85: 453a537.
Rodieck, R. W., K. F. Binmoeller, and J. Dineen (1985) Parasol and midget ganglion cells of the human retina. J. Comp. Neural. 233: 115-132.
Schiller, P. H., and C. L. Colby (1983) The responses of single cells

The Journal of Neuroscience, March 1989, 9(3) 783
in the lateral geniculate nucleus of the rhesus monkey to color and Thornton, J., and E. N. Pugh (1983) Red/green color opponency at luminance contrast. Vision Res. 23: 163 l-l 64 1. detection threshold. Science 219: 19 l-l 93.
Schnapf, J. L., T. W. Kraft, and D. A. Baylor (1987) Spectral sensitivity of human cone photoreceptors. Nature 325: 439-441.
Shapley, R. M., and E. Kaplan (1986) What are the P and M cells of the monkey visual system sensitive to? Sot. Neurosci. Abstr. 12: 7.
Shapley, R., and V. H.-Perry (1986) Cat and monkey retinal ganglion cells and their visual functional roles. Trends Neurosci. 9: 229-235.
Smith, V. C., and J. Pokomy (1975) Spectral sensitivity of the foveal cone photopigments between 400 and 500 nm. Vision Res. 15: 16 l- 171.
Sperling, H. G., and R. S. Harwerth (197 1) Red-green cone interactions in the increment-threshold spectral sensitivity of primates. Science 172: 180-184.
Stromeyer, C. F., G. R. Cole, and R. E. Kronauer (1987) Chromatic suppression of cone inputs to the luminance flicker mechanism. Vi- sion Res. 27: 1113-l 137.
Thibos, L. N., F. E. Cheney, and D. J. Walsh (1987) Retinal limits to the detection and resolution of gratings. J. Opt. Sot. Am. 4: 1524- 1529.
Tootell, R. B. H., S. I. Hamilton, E. Switkes, and R. L. De Valois (1985) 2 DG as a “functional HRP” in macaque striate cortex. Invest. Op- thalmol. Vis. Sci. (Suppl.) 26: 9.
van der Horst, G., and M. A. Bouman (1969) Spatiotemporal chro- maticity discrimination. J. Opt. Sot. Am. 5% 1482-1488.
Vamer. D.. D. Jameson. and L. M. Hurvich (1984) Temnoral sensi- tivities related to color theory. J. Opt. Sot. Am. i: 474-48 1.
Virsu, V., B. B. Lee, and 0. D. Creutzfeldt (1987) Mesopic spectral responses and the purkinje shift of macaque lateral geniculate nucleus cells. Vision Res. 27: 19 l-200.
Wiesel, T. N., and D. H. Hubel (1966) Spatial and chromatic inter- actions in the lateral geniculate body of the rhesus monkey. J. Neu- rophysiol. 29: 1115-l 156.
Young, R. A. (1986) Principal-component analysis of macaque lateral geniculate nucleus chromatic data. J. Opt. Sot. Am. 3: 1735-l 742.