christopher goyne university of virginia 02/20/2015 final
TRANSCRIPT

AFRL-OSR-VA-TR-2015-0187
Premixed Supersonic Combustion
Christopher GoyneUNIVERSITY OF VIRGINIA
Final Report02/20/2015
DISTRIBUTION A: Distribution approved for public release.
AF Office Of Scientific Research (AFOSR)/ RTEArlington, Virginia 22203
Air Force Research Laboratory
Air Force Materiel Command

REPORT DOCUMENTATION PAGE Form Approved OMB No. 0704-0188
The public reporting burden for this collection of information is estimated to average 1 hour per response, including the time for reviewing instructions, searching existing data sources, gathering and maintaining the data needed, and completing and reviewing the collection of information. Send comments regarding this burden estimate or any other aspect of this collection of information, including suggestions for reducing the burden, to the Department of Defense, Executive Service Directorate (0704-0188). Respondents should be aware that notwithstanding any other provision of law, no
person shall be subject to any penalty for failing to comply with a collection of information if it does not display a currently valid OMB control number.
PLEASE DO NOT RETURN YOUR FORM TO THE ABOVE ORGANIZATION.
1. REPORT DATE (DD-MM-YYYY)
29-04-2015 2. REPORT TYPE
Final Report (Revised) 3. DATES COVERED (From - To)
01-08-2013 - 14-09-2014
4. TITLE AND SUBTITLE
Premixed Supersonic Combustion
5a. CONTRACT NUMBER
5b. GRANT NUMBER
FA9550-13-1-0146
5c. PROGRAM ELEMENT NUMBER
6. AUTHOR(S)
C. Goyne, R. Rockwell, B. Rice, H. Chelliah, J. McDaniel, J. Edwards and P. Danehy
5d. PROJECT NUMBER
5e. TASK NUMBER
5f. WORK UNIT NUMBER
7. PERFORMING ORGANIZATION NAME(S) AND ADDRESS(ES)
University of Virginia
1001 North Emmet Street
P.O. Box 400195
Charlottesville, VA
8. PERFORMING ORGANIZATIONREPORT NUMBER
Ver. 2
9. SPONSORING/MONITORING AGENCY NAME(S) AND ADDRESS(ES)
AFOSR
875 North Randolph Street, Suite 325
Arlington, VA 22203
10. SPONSOR/MONITOR'S ACRONYM(S)
11. SPONSOR/MONITOR'S REPORTNUMBER(S)
12. DISTRIBUTION/AVAILABILITY STATEMENT
Distribution A
13. SUPPLEMENTARY NOTES
Added Sections II, V(1) and VII
14. ABSTRACT
Hypersonic air-breathing engines rely on scramjet combustion processes, which involve high
speed, compressible, and highly turbulent flows. The combustion environment and the turbulent
flames at the heart of these engines are difficult to simulate and study in the laboratory under
well controlled conditions. Typically, wind-tunnel testing is performed that more closely
approximates engine testing rather than a careful investigation of the underlying physics that
drives the combustion process. The experiments described in this report, along with companion
data sets developed separately, aim to isolate the chemical kinetic effects from the fuel-air
mixing process in a dual-mode scramjet combustion environment. A unique fuel injection
approach is taken that produces a uniform fuel-air mixture at the entrance to the combustor.
15. SUBJECT TERMS
High-speed, premixed, combustion, scramjet
16. SECURITY CLASSIFICATION OF: 17. LIMITATION OFABSTRACT
18. NUMBEROFPAGES
28
19a. NAME OF RESPONSIBLE PERSON
C.P. Goyne a. REPORT
U
b. ABSTRACT
U
c. THIS PAGE
U 19b. TELEPHONE NUMBER (Include area code)
4349825355
Standard Form 298 (Rev. 8/98) Prescribed by ANSI Std. Z39.18
Adobe Professional 7.0
ResetDISTRIBUTION A: Distribution approved for public release.

INSTRUCTIONS FOR COMPLETING SF 298
1. REPORT DATE. Full publication date, including
day, month, if available. Must cite at least the year and
be Year 2000 compliant, e.g. 30-06-1998; xx-06-1998;
xx-xx-1998.
2. REPORT TYPE. State the type of report, such as
final, technical, interim, memorandum, master's thesis,
progress, quarterly, research, special, group study, etc.
3. DATES COVERED. Indicate the time during which
the work was performed and the report was written,
e.g., Jun 1997 - Jun 1998; 1-10 Jun 1996; May - Nov
1998; Nov 1998.
4. TITLE. Enter title and subtitle with volume number
and part number, if applicable. On classified
documents, enter the title classification in parentheses.
5a. CONTRACT NUMBER. Enter all contract numbers
as they appear in the report, e.g. F33615-86-C-5169.
5b. GRANT NUMBER. Enter all grant numbers as
they appear in the report, e.g. AFOSR-82-1234.
5c. PROGRAM ELEMENT NUMBER. Enter all
program element numbers as they appear in the report,
e.g. 61101A.
5d. PROJECT NUMBER. Enter all project numbers as
they appear in the report, e.g. 1F665702D1257; ILIR.
5e. TASK NUMBER. Enter all task numbers as they
appear in the report, e.g. 05; RF0330201; T4112.
5f. WORK UNIT NUMBER. Enter all work unit
numbers as they appear in the report, e.g. 001;
AFAPL30480105.
6. AUTHOR(S). Enter name(s) of person(s)
responsible for writing the report, performing the
research, or credited with the content of the report. The
form of entry is the last name, first name, middle initial,
and additional qualifiers separated by commas, e.g.
Smith, Richard, J, Jr.
7. PERFORMING ORGANIZATION NAME(S) AND
ADDRESS(ES). Self-explanatory.
8. PERFORMING ORGANIZATION REPORT NUMBER.
Enter all unique alphanumeric report numbers assigned by
the performing organization, e.g. BRL-1234;
AFWL-TR-85-4017-Vol-21-PT-2.
9. SPONSORING/MONITORING AGENCY NAME(S)
AND ADDRESS(ES). Enter the name and address of the
organization(s) financially responsible for and monitoring
the work.
10. SPONSOR/MONITOR'S ACRONYM(S). Enter, if
available, e.g. BRL, ARDEC, NADC.
11. SPONSOR/MONITOR'S REPORT NUMBER(S).
Enter report number as assigned by the sponsoring/
monitoring agency, if available, e.g. BRL-TR-829; -215.
12. DISTRIBUTION/AVAILABILITY STATEMENT. Use
agency-mandated availability statements to indicate the
public availability or distribution limitations of the report. If
additional limitations/ restrictions or special markings are
indicated, follow agency authorization procedures, e.g.
RD/FRD, PROPIN, ITAR, etc. Include copyright
information.
13. SUPPLEMENTARY NOTES. Enter information not
included elsewhere such as: prepared in cooperation
with; translation of; report supersedes; old edition number,
etc.
14. ABSTRACT. A brief (approximately 200 words)
factual summary of the most significant information.
15. SUBJECT TERMS. Key words or phrases identifying
major concepts in the report.
16. SECURITY CLASSIFICATION. Enter security
classification in accordance with security classification
regulations, e.g. U, C, S, etc. If this form contains
classified information, stamp classification level on the top
and bottom of this page.
17. LIMITATION OF ABSTRACT. This block must be
completed to assign a distribution limitation to the abstract.
Enter UU (Unclassified Unlimited) or SAR (Same as
Report). An entry in this block is necessary if the abstract
is to be limited.
Standard Form 298 Back (Rev. 8/98) DISTRIBUTION A: Distribution approved for public release.

1
Final Report
AFOSR Grant FA9550-13-1-0146
Premixed Supersonic Combustion
Submitted to
Chiping Li Air Force Office of Science and Research 875 Randolph Street Suite 325 Room 3112 Arlington, VA 22203
Submitted by
Christopher Goyne Department of Mechanical and Aerospace Engineering University of Virginia Charlottesville, VA 22904
DISTRIBUTION A: Distribution approved for public release.

2
Abstract:
Hypersonic air-breathing engines rely on scramjet combustion processes, which involve high speed, compressible, and highly turbulent flows. The combustion environment and the turbulent flames at the heart of these engines are difficult to simulate and study in the laboratory under well controlled conditions. Typically, wind-tunnel testing is performed that more closely approximates engine testing rather than a careful investigation of the underlying physics that drives the combustion process. The experiments described in this report, along with companion data sets developed separately, aim to isolate the chemical kinetic effects from the fuel-air mixing process in a dual-mode scramjet combustion environment. A unique fuel injection approach is taken that produces a uniform fuel-air mixture at the entrance to the combustor. This approach relies on the precombustion shock train upstream of the dual-mode scramjet combustor. A stable ethylene flame anchored on a cavity flame holder with a uniformly mixed combustor inflow was achieved in these experiments, allowing numerous companion studies involving coherent anti-Stokes Raman scattering (CARS), particle image velocimetry (PIV), and planar laser induced fluorescence (PLIF) to be performed
DISTRIBUTION A: Distribution approved for public release.

3
I. Introduction Sustained hypersonic flight via scramjet propulsion presents considerable capabilities for future space access and high speed weapons. However, in order for this technology to become a practical and reliable propulsion method, there is a need for improved understanding and prediction of the reacting flow of the scramjet combustor, which is highly compressible and highly turbulent. The fundamental processes in the combustor include the injection, mixing, and reaction of a fuel in a supersonic or high speed airstream. For certain fuels, such as hydrogen, the chemical kinetic time scales are much shorter than the flow time scales, and the rate-controlling process is the fuel-air mixing. While hydrocarbon fuels have longer kinetic time scales than hydrogen, the mixing can still be rate-controlling if the flow temperature is high or if a flame holder is present and there is an adequate source of combustion radicals. In order to focus on a process that is fundamental to scramjet combustion, the present study examines high speed premixed fuel-air flows. In this way, the mixing may be decoupled from the turbulent combustion and the chemical kinetics become rate-controlling. This allows the turbulent combustion physics to be isolated. Models of turbulence-chemistry closures can then be developed and validated. Investigations of the effect of turbulent fluctuations on flame structure, including eddy sizes and distributions, can also be conducted. Furthermore, complications, such as the effect of jet mixing on flame propagation, can be avoided.
Unlike in non-premixed turbulent combustion, where there is no meaningful time scale based on velocity, in premixed turbulent combustion the velocity fluctuations, v', play a critical role in defining the turbulent combustion regimes. For low density ratio variations, the dependence of normalized turbulent velocity fluctuations with respect to laminar burning velocity, v'/sL, to the normalized integral turbulent length, l/lL are well established, and are given by
(1) where Rel is the Reynolds number based on integral length scale, Kaη is the Karlovitz number based on Kolmogorov length scale, and Dal is the Damkohler number based on integral length scale [1]. For large Rel numbers, the above relationships yield four distinct turbulent combustion regimes identified as wrinkled flamelets, corrugated flamelets, distributed reaction zones, and well-stirred reaction zones [2]. It is currently not known in which regime a scramjet with premixed combustion operates. Therefore, a high speed premixed combustion capability is desirable in order to conduct experiments to identify the combustion regime of these flames.
For scramjet combustion that involves turbulent compressible reacting flows with large density variations, the turbulent combustion regimes are influenced by an additional parameter characterized by , (2)
DISTRIBUTION A: Distribution approved for public release.

4
where ΔTs is the change in temperature associated with kinetic energy and ΔTc is the change in temperature associated with the chemistry [3]. If the rise in temperature associated with kinetic energy is approximated by , (3) then the parameter S becomes
(4) where ΔTc /T0 can be identified as a heat release parameter, α, with typical values ranging from 1 to 10 [4]. If typical values of α = 6 and γ = 1.3 are selected, then M = 6 flow yields S = 1, indicating that velocity fluctuations can introduce temperature fluctuations close to the increase in temperature by chemical reactions. This demonstrates how closely coupled velocity fluctuations and chemical reactions can be in the high speed combustion environment of a scramjet. By decoupling the mixing from the turbulent combustion process, the experiments described in this report offer an opportunity to examine the turbulence-chemistry coupling in a scramjet relevant environment.
Therefore, the main goal of the present research is to develop a high speed premixed combustion capability to enable investigation of the strong coupling between flow compressibility, turbulence, and heat release. By applying advanced diagnostics, the exact turbulent combustion regime of the scramjet combustor may be identified. Such measurements have not been previously published for scramjet combustors nor has stable high speed premixed combustion been demonstrated. The specific objectives of the present study are: 1) design and construct fuel-air premix hardware for a series of high speed combustion experiments, 2) demonstrate stable premixed combustion in a scramjet combustor, and 3) examine the effects of equivalence ratio and inflow gas temperature on flame ignition, propagation, and flameout.
This study was performed in collaboration with the National Center for Hypersonic Combined Cycle Propulsion (NCHCCP). The Center work is aimed at examining combustion in a dual-mode scramjet with flight Mach numbers in the range of 4 to 6. Here, a theoretical flight vehicle would be expected to transition from a subsonic ramjet mode of combustion to a supersonic scramjet mode of combustion. As part of this larger effort, a suite of advanced instream diagnostics are available including coherent anti-Stokes Raman scattering (CARS), OH and CH2O planar laser induced fluorescence (PLIF), and particle image velocimetry (PIV) [5-7]. Together with conventional measurement techniques, these diagnostics enable the study of both the cavity flow (operability limits, residence time, internal cavity flame structure, and shear layer characterization) and the main flame (flame surface area, local strain rate/stretch and flame propagation angle). The experiments described in this report have resulted in databases that are leading to the validation of advanced time averaged and time accurate numerical models [8]. Details and status of the CARS and PIV measurements are presented elsewhere by Gallo and Kirik, respectively [9,10]. Edwards presents results of the numerical modeling efforts [11]. The purpose of this report is to document the development and demonstration of the premixed capability and the initial experimental results.
DISTRIBUTION A: Distribution approved for public release.

5
II. Relationship to National Center for Hypersonic Combined Cycle Propulsion Research during the first three years of the Center focused on combustion in non-premixed
flow. In addition, this work was performed mostly with hydrogen as the fuel. Work in years four and five were devoted primarily to combustion using ethylene. The present project represented additional effort that was devoted in year four to prepare for the premixed experiments to be conducted in year five of the Center. This was done in parallel with the experiments in year four by personnel who were partially supported by the Center and partially supported by the present project. According to the Statement of Work as defined in the original Center proposal, year five was to be devoted to shock wave control and innovative fuel injection schemes. While these investigations are important, it was felt that the premixed experiments were an appropriate and important replacement. Since the premixed experiments were outside the original scope of the Center, the budget for the present project supported the additional costs to prepare for and conduct the premixed combustion experiments.
III. Experimental Approach Three focus areas have been identified to guide the experimental approach of the Center: 1) measurement of reacting flow turbulence statistics and novel fuel-air mixing and flame holding schemes through the development and application of advanced diagnostics, 2) development of benchmark data sets with quantified experimental uncertainty for the purposes of developing accurate RANS, hybrid LES/RANS, and LES computational models, and 3) generation of performance improvements of combined cycle systems and the development of methods for controlling combined cycle mode-transition [12].
The dual-mode scramjet experiments are being conducted with the aim of examining the flow processes that take place in the isolator and combustor in the flight Mach number regime of 4 to 6. Specifically, the experiments employ a direct connect scramjet combustor that is operated at Mach 5 enthalpy (total temperature of 1200 K) using the University of Virginia Supersonic Combustion Facility (UVaSCF). The test-section hardware has been designed to accommodate the application of multiple advanced flow diagnostic techniques [13]. In particular, the combustor section incorporates a modular construction approach that provides substantial access for optical laser diagnostics. In addition to static wall pressure and temperature measurements, a number of advanced, instream diagnostics have been applied in the facility, including CARS, OH PLIF (Hz), CH2O PLIF (Hz and kHz), stereoscopic and planar PIV (Hz and kHz), and high speed chemiluminescence imaging (Hz and kHz). Combined, these diagnostics result in the measurement of: wall static pressure, temperature, species concentration (N2, O2, H2, CO, CO2, H2O, C2H4, and qualitative OH), scalar correlations, three-component velocity, three-component turbulence intensity (RMS), and Reynolds stresses.
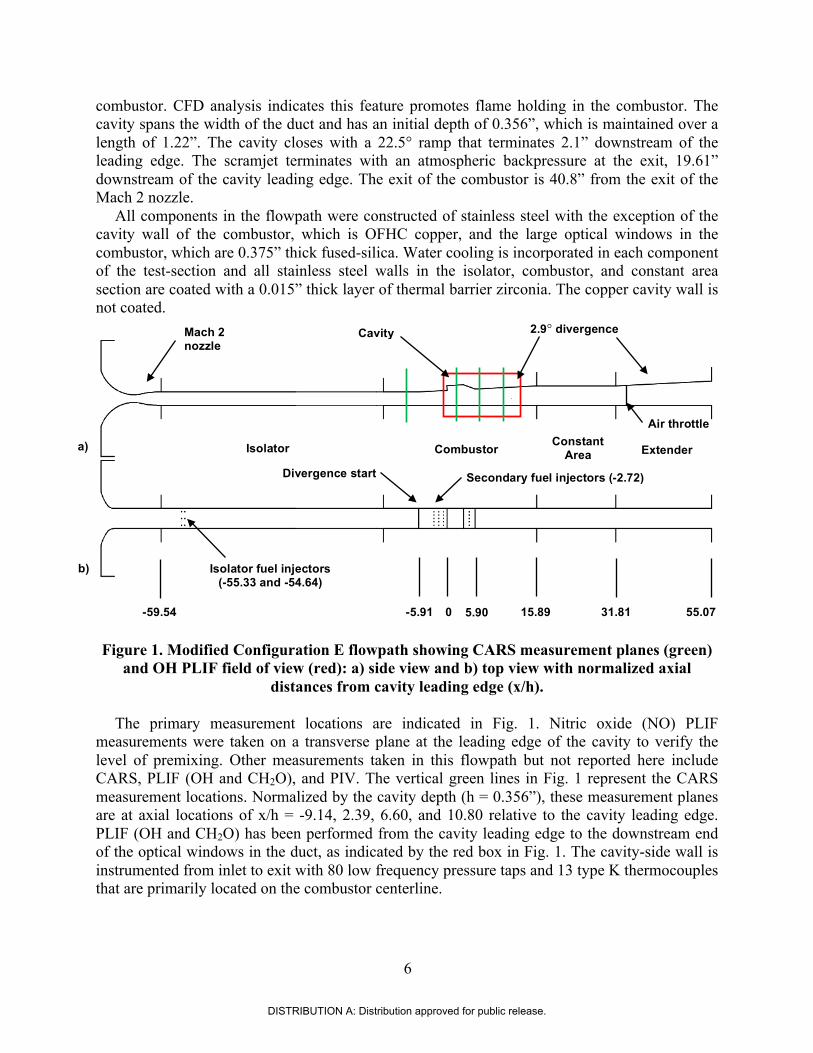
The experiments described in this report have used ethylene fueling in what is termed the modified Configuration E (Fig. 1). The flowpath starts with a Mach 2 facility nozzle and incorporates a long, constant-area isolator upstream of the combustor that contains any precombustion shock train. Injecting fuel at the upstream end of the isolator allows for significant mixing of the fuel into the freestream ahead of the cavity flame holder. The isolator is a 15.97” long rectangular duct with a 1” x 1.5” cross-section. A 2.9° divergence on the cavity-side wall starts 2.1” upstream of the cavity leading edge. This divergence is maintained through the combustor and extender sections of the flowpath. A constant area section downstream of the combustor compresses the flow inducing a thermal throat when the flowpath is operating in the dual-mode with a precombustion shock train in the isolator and subsonic flow through the
DISTRIBUTION A: Distribution approved for public release.
6
combustor. CFD analysis indicates this feature promotes flame holding in the combustor. The cavity spans the width of the duct and has an initial depth of 0.356”, which is maintained over a length of 1.22”. The cavity closes with a 22.5° ramp that terminates 2.1” downstream of the leading edge. The scramjet terminates with an atmospheric backpressure at the exit, 19.61” downstream of the cavity leading edge. The exit of the combustor is 40.8” from the exit of the Mach 2 nozzle.
All components in the flowpath were constructed of stainless steel with the exception of the cavity wall of the combustor, which is OFHC copper, and the large optical windows in the combustor, which are 0.375” thick fused-silica. Water cooling is incorporated in each component of the test-section and all stainless steel walls in the isolator, combustor, and constant area section are coated with a 0.015” thick layer of thermal barrier zirconia. The copper cavity wall is not coated.
Figure 1. Modified Configuration E flowpath showing CARS measurement planes (green) and OH PLIF field of view (red): a) side view and b) top view with normalized axial
distances from cavity leading edge (x/h).
The primary measurement locations are indicated in Fig. 1. Nitric oxide (NO) PLIF measurements were taken on a transverse plane at the leading edge of the cavity to verify the level of premixing. Other measurements taken in this flowpath but not reported here include CARS, PLIF (OH and CH2O), and PIV. The vertical green lines in Fig. 1 represent the CARS measurement locations. Normalized by the cavity depth (h = 0.356”), these measurement planes are at axial locations of x/h = -9.14, 2.39, 6.60, and 10.80 relative to the cavity leading edge. PLIF (OH and CH2O) has been performed from the cavity leading edge to the downstream end of the optical windows in the duct, as indicated by the red box in Fig. 1. The cavity-side wall is instrumented from inlet to exit with 80 low frequency pressure taps and 13 type K thermocouples that are primarily located on the combustor centerline.
a)
b)
-59.54 -5.91 0 5.90 15.89 31.81 55.07
Combustor Extender Isolator
Mach 2 nozzle
Constant Area
Isolator fuel injectors (-55.33 and -54.64)
2.9° divergence Cavity
Divergence start Secondary fuel injectors (-2.72)
Air throttle
DISTRIBUTION A: Distribution approved for public release.
7
IV. Facility and Flow Conditions The experiments were conducted using the UVaSCF. This facility is an electrically heated, continuous flow, direct-connect scramjet wind tunnel. It is capable of simulating up to Mach 5 flight enthalpy and provides a clean test flow that is free of contaminates such as those from a vitiation heater. Facility run times are on the order of hours with steady-state heating and fuel conditions. Because CARS is a point-by-point measurement technique, the extended run time provides for high spatial resolutions using a finely-spaced measurement grid [5]. Likewise, PIV and PLIF require non-correlated image counts on the order of 500 to 1000 or more for calculating average turbulence statistics and other parameters to a reasonable degree of accuracy [7,14,15]. Coupled with the optical access in the tunnel and proximity to laser diagnostics labs, the facility is well suited to the application of the advanced optical diagnostics required by the NCHCCP. The facility flow conditions are presented in Table 1. The uncertainties given in the table are calculated by standard propagation of error and include temporal variability as well as instrumentation uncertainty. Tunnel air flow conditions were typically maintained to less than ±1% during a run and across multiple runs. The facility is fully described elsewhere [16-18].
An air throttle is available downstream of the combustor, near the upstream end of the extender (at x/h = 37.52), which allows the duct to be back pressured independently or in conjunction with a combustion process to simulate the pressure rise associated with combustion. The throttle consists of two slotted, high pressure air injectors, one in each side wall, that are used to restrict flow at that location. The slots are 0.125” wide and extend over the full height of the duct. Although air throttle pressures and flow rates are not generally measured directly, the isolator pressures were monitored in real time with adjustments made to the throttle to maintain the desired shock location. Through use of the air throttle, it is possible to accurately locate and stabilize the leading edge of the isolator shock train at any point in the duct.
Table 1. Test conditions for main air flow.
Parameter Air Uncertainty Total pressure (kPa) 300 ± 1%
Total temperature (K)
1200 ± 0.8%
Mach number* 2.03 ± 1%
* Property at nozzle exit determined using nozzle area ratio and assuming isentropic flow (γ=1.36 for air).
A NetScannerTM pressure scanner and remote NetScannerTM thermocouple unit were used to
acquire wall pressures and temperatures along the centerline of the fuel injector wall in the scramjet flowpath. Typically, a scan of 20 samples was acquired over 2 seconds at a sample rate of 10 Hz for each pressure tap and thermocouple. This data was then averaged and normalized by the measured pressure at the most upstream pressure tap (located 0.25 in. downstream of the facility nozzle exit) prior to plotting. Wall pressure and temperature were typically measured to within ±0.5% and average quantities had a 95% confidence interval of no more than ±1.5%.
DISTRIBUTION A: Distribution approved for public release.

8
V. Fuel Injection and Mixing
1. Injector Design
a. Details of the injector design process The primary objective for the fuel injection scheme developed in this work was to generate a
uniform mixture of ethylene fuel and air across the duct at the combustor entrance (which was defined as the leading edge of the cavity). It was assumed that placing the fuel injectors close to the exit of the facility nozzle, well upstream of the cavity flame holder, would allow the maximum time and distance for fuel/air mixing in the isolator. Although introducing fuel into the isolator carries the risk of the flame flashing forward of the combustor, it was not clear at the outset how likely this would be in the UVASCF, whether it was a controllable phenomenon, or what the repercussions for the facility would be.
Several injection strategies were considered including injection through a single row of injectors distributed laterally across the duct, staged injection through two or more closely-spaced rows of injectors, and angled injection at 30 or 45 degrees. In addition to the level of mixing, a tradeoff to be considered was the potential for blockage of the freestream air flow, which could unstart the facility nozzle.
Three sonic fuel injectors per row, each with a diameter of 0.049 inches produced a reasonable mechanical design for the facility. A single row of injectors can deliver sufficient fuel for a global equivalence ratio of 0.5 at a total pressure of about 1900 kPa, which is near the limit for existing upstream components in the fuel system. Table 2 lists the potential combinations of fuel injectors available at each injector bank in the facility along with the estimated fuel dynamic pressure and dynamic pressure ratio for each injector. There are a total of four such banks available in the isolator hardware of the facility located at the upstream and downstream ends of the isolator, on the cavity-side and opposite-side walls (see Fig. 1).
Figure 2 shows results from a RANS CFD study of several potential strategies based on fuel injection at the upstream end of the isolator. In all cases, the total amount of fuel being injected produces a global equivalence ratio of 0.5 and the fuel mass flow through each injector is identical. Thus, with two rowed injection (90/90, 45/90, or 30/45), the mass flow and dynamic pressure of fuel injected through any one injector are half of what they would be in the case of single row injection. The numbers in the left hand column refers to the angle of fuel injection with respect to the incoming air flow. It can be seen that the use of normal injection, either through two closely spaced rows or a single row, produces the most uniform distribution of fuel in the cavity with a local equivalence ratio in the middle of the cavity of about 1. Based on these results, a decision was made to focus on the normal fuel injectors. Further, two rowed injection was chosen as the primary injection scheme over single rowed injection because it requires lower fuel pressures to deliver the same amount of fuel while producing a nearly identical mixing profile in the cavity.
Figure 3 shows results from a RANS CFD study that looked at the effect of an isolator shock train on free stream fuel/air mixing. Here, the global equivalence ratio was set at 0.35, which is close to the lean flame out limit. The shock train clearly enhances the fuel/air mixing process leading to a decreased local equivalence ratio in the cavity.
From these CFD studies it was determined that achieving a uniformly premixed flow at the cavity entrance plane would be possible, most likely by using a combination of distributed fuel injection at the upstream end of the isolator from both the cavity-side and opposite-side walls of
DISTRIBUTION A: Distribution approved for public release.

9
the duct along with a sufficiently long precombustion shock train. This approach precludes generating a fully premixed flow for scram combustion experiments, but poses significantly less risk than introducing fuel into the plenum upstream of the facility nozzle.
Table 2. Potential ethylene fuel injection configurations and dynamic pressures for the UVaSCF.
Number of Each Jet Global φ Rows Jets Q (kPa) Q ratio
0.2 1 3 270.65 2.54
2 6 135.33 1.27
3 9 90.22 0.85
4 12 67.66 0.64 0.4 1 3 541.30 5.09
2 6 270.65 2.54
3 9 180.43 1.70
4 12 135.33 1.27 0.6 1 3
2 6 405.98 3.82
3 9 270.65 2.54
4 12 202.99 1.91 0.8 1 3
2 6 541.30 5.09
3 9 360.87 3.39
4 12 270.65 2.54 1 1 3 2 6 676.63 6.36
3 9 451.08 4.24
4 12 338.31 3.18
Notes: Table assumes injection upstream of the precombustion shock train and all jets are identical with a discharge coefficient per row of 0.40. (Measured discharge coefficients on fabricated hardware are 0.64 to 0.66 per row.)
DISTRIBUTION A: Distribution approved for public release.

10
Figure 2. RANS CFD investigation of several potential mixing strategies showing local equivalence ratio at crossplanes in the isolator and cavity as well as axial distribution in the immediate vicinity of the injector.
C2H4 mass fraction in the isolator and cavity (cavity entrance)(cavity middle)
Figure 3. RANS CFD investigation of the effect of an isolator shock train on mixing, global equivalence ratio = 0.35.
Local equivalence ratio
DISTRIBUTION A: Distribution approved for public release.

11
b. Lessons learned There were three main lessons learned in the development of the fuel injection scheme: 1. Fuel injection through two rows of injectors is as effective as a single row operating at a
higher dynamic pressure.
Figure 4 shows two PLIF images of the NO distribution at the cavity leading edge due to normal fuel injection through the upstream injector banks with no shock train in the isolator. In both cases, the cavity-side injectors (top edge of image) are operating with a simulated equivalence ratio of 0.17 while the opposite-side injectors (lower edge) are at 0.11 for the two rowed injection (image a) and 0.17 for single row injection (image b). The distribution of NO in the top half of the images (on the cavity side wall) is nearly identical, confirming that two rows of injectors is as effective as a single row operating at twice the pressure. The opposite-side wall shows a more intense NO PLIF signal with single row injection because of the increased equivalence ratio from those injectors.
Figure 4. Averaged NO PLIF images of fuel simulant distribution at the cavity leading edge for a) two rowed injection from both walls with equivalence ratio = 0.17 from the cavity-side wall and 0.11 from the opposite-side wall and b) single row injection from both walls with equivalence ratio = 0.17 from the cavity-side wall and 0.17 from the opposite-side wall. Cavity side is at the top of the image.
2. Global equivalence ratios on the order of 0.4 or higher (> 0.2 from each side) would be
required to produce a uniform premix without the benefit of a precombustion shock train.
Also of note in Fig. 4 is the band of lean fueling in the middle of the duct. This indicates that injection at these fuel flow rates is not sufficient to produce a uniform fuel/air mixture in the cavity without the benefit of an isolator shock train. 3. A longer precombustion shock train produces better fuel/air mixing.
Figure 5 shows a sequence of NO PLIF images illustrating the effect of isolator shock train length on fuel/air mixing. In this study, fuel was injected through two rows of injectors on both the cavity-side and opposite-side walls at equivalence ratios of 0.25 and 0.14, respectively. As the length of the shock train is increased from 0 to nearly the full length of the isolator, the
a) b)
DISTRIBUTION A: Distribution approved for public release.

12
distribution of fuel at the cavity leading edge becomes increasingly uniform, confirming the CFD result shown in Fig. 3.
Figure 5. Averaged NO PLIF images of fuel simulant distribution at the cavity leading edge for two rows of fuel injection from both walls with global equivalence ratio = 0.39 and shock train leading edge at a) x/h = 0, b) x/h = -15, c) x/h = -30, and d) x/h = -45. Cavity side is at the top of the image. Image artifacts from window damage can be disregarded. 2. Adopted Injection Configuration As indicated in Fig. 1b, the adopted ethylene fuel injection is through two banks of six sonic, flush-wall injectors located at the upstream end of the isolator, 1.5 inches downstream of the facility nozzle exit on opposite walls of the duct. Injection at this location allows the fuel to be processed by the isolator shock train ideally resulting in a fully premixed flow at the cavity leading edge. Each bank comprises two rows of three equally spaced 0.049 inch diameter injectors oriented normal to the freestream flow. The total fuel pressure and temperature for each set of injectors is monitored and controlled to provide the desired fuel split and flow rate. Table 3 lists the primary fueling conditions used in these experiments. As will be discussed later, the first fuel condition represents the maximum fuel rate that can be accommodated by the flowpath without unstarting the isolator. The second fuel condition is close to the lean flameout point of the flowpath with a fully premixed combustor inflow. There is a difference in the fuel injection pressures between the cavity-side bank and the opposite-side bank, which is due to a small difference in the discharge coefficients of the two injector banks (0.60 for the cavity-side bank and 0.56 for the opposite-side bank). Control valves in the fuel system allow the fuel to be evenly split between the two injector banks as shown in Table 3 or adjusted such that a larger proportion of fuel is delivered through the cavity-side injector bank. Also shown in Fig. 1b, a secondary fuel injection location is through a row of five equally spaced 0.021 inch diameter sonic, flush-wall injectors located 0.97 inches upstream of the cavity leading edge. The secondary injectors are too close to the cavity for the fuel injected through them to fully mix with
a) b)
c) d)
DISTRIBUTION A: Distribution approved for public release.

13
the freestream and instead provide a means for more directly fueling the cavity. This allows the flowpath to operate in the scram mode with either a short or nonexistent precombustion shock train.
Table 3. Test conditions for ethylene fuel.
Parameter Fuel Condition 1
Cavity-Side Opposite-Side
Fuel Condition 2 Cavity-Side
Opposite-Side
Uncertainty
Equivalence ratio 0.20 0.20 0.17 0.17 ± 5% Total pressure (kPa) 260 270 207 223 ± 3%
Total temperature (K) 288 288 288 288 ± 3%
Mach number* 1.0 1.0 1.0 1.0 ± 0.5% * Property at nozzle exit determined using nozzle area ratios and assuming isentropic flow
(γ=1.36 for air, 1.24 for C2H4).
The static fuel temperatures listed in Table 3 are below the autoignition temperature of ethylene. However, following ignition by an outside source, the flame is self-sustaining. Ignition is achieved by using the air throttle to pressurize the cavity while injecting hydrogen through a port in the base of the cavity. Under these conditions the hydrogen autoignites and ethylene fuel can then be introduced through the upstream injectors. Once a sufficient flow rate of ethylene is established (typically a global fuel equivalence ratio greater than 0.33), the hydrogen can be turned off. The air throttle may be maintained or not depending on the nature of the particular experiment being performed. NO PLIF measurements were used to evaluate the level of fuel premixing at the leading edge of the cavity. A mixture of 10% (molar) NO in nitrogen was used as a surrogate for the ethylene fuel. Note that combustion by-products, such as OH or C*, are not present upstream of the combustion region. Importantly, the molar weight of this NO/N2 gas mixture is nearly identical to that of ethylene, which allows the fuel system operation, including injection pressures, to be the same for equivalent mass flow rates of NO and ethylene. With no combustion process present, the air throttle was used to generate a combustor back pressure equivalent to that due to combustion at a given fuel equivalence ratio and thus drive the isolator shock train. A full description of the NO PLIF measurements is given elsewhere [15]. Uniform fuel premixing for the case with both banks of isolator injectors operating and a precombustion shock train in the isolator has been confirmed with NO PLIF as shown in Fig. 6. Figure 6a is a single-shot instantaneous image and Fig. 6b shows the average distribution. These images present a qualitative representation of the fuel distribution at the cavity leading edge and, within the uncertainty of the NO PLIF measurement, represent a uniform fuel-air mix. The left to right variation presumably due to attenuation of the laser sheet as laser light is absorbed by the NO molecules [15]. For comparison, Fig. 7 shows the fuel distribution from a single isolator fuel injector located on the centerline of the cavity-side wall with no shock train to promote mixing. In this case, the
DISTRIBUTION A: Distribution approved for public release.

14
dark region along the lateral edges and on the wall opposite the active fuel injector shows that NO has not propagated to fill the duct.
Figure 6: Instantaneous (a) and averaged (b) NO PLIF images of fuel simulant distribution for two rows of fuel injection from both walls with global equivalence ratio = 0.42 and shock train leading edge at x/h = -45 (adapted from [15]).
Figure 7: Instantaneous (a) and averaged (b) NO PLIF images of fuel simulant distributions for a single fuel injector with equivalence ratio = 0.09 and no shock train (adapted from [15]).
a) b)
a) b)
DISTRIBUTION A: Distribution approved for public release.

15
VI. Results Figures 8 and 9 show the axial distribution of static pressure on the cavity-side wall for global
fuel equivalence ratios, φ, of approximately 0.40 and 0.34, respectively. The measured pressures have been normalized by the static pressure at the exit of the facility nozzle, Pref, and the axial locations are normalized by the cavity depth (0.356 in.). The cavity leading edge is at x/h = 0. Results for the case with all fuel being delivered through the cavity-side bank of injectors are shown along with two different fuel split ratios. The solid square symbols represent an equal fuel split between the cavity-side injector bank and the opposite-side injector bank. This fueling scenario is equivalent to that shown in Fig. 6 above and represents a uniform fuel-air premix. Also shown in the figures are the pressure distributions for the NO PLIF measurements, represented by a dashed line. In these cases the air throttle, rather than a combustion process, was used to generate the back pressure that drives the shock train in the isolator. It can be seen that the pressure rise in the isolator is the same whether it is due to a combustion process or the air throttle giving confidence in the NO PLIF mixing study. The fuel off case is also shown for reference.
Figure 8. Normalized wall pressures at fuel condition 1. In the legend, the numbers in parentheses indicate the cavity-side and opposite-side fuel equivalence ratio, respectively.
DISTRIBUTION A: Distribution approved for public release.

16
Figure 9. Normalized wall pressures at fuel condition 2. In the legend, the numbers in parentheses indicate the cavity-side and opposite-side fuel equivalence ratio, respectively.
For both global fuel equivalence ratios, delivering all of the fuel through the cavity-side
injectors alone will result in some level of fuel stratification across the duct with a higher density of fuel on the cavity-side wall. All fuel conditions shown in Figs. 8 and 9 result in a stable dual-mode scramjet flame anchored on the cavity that can be maintained for one to two hours in this facility with depletion of the fuel tanks being the limiting factor.
It can be seen that while the pressures in the isolator and onset of the precombustion shock train are nearly the same for all three fuel splits, pressures are noticeably different in the combustor section between the cavity and the thermal throat (from x/h = 5 to 35). Here, the flow is subsonic in a one-dimensional sense and heat released in the flame drives the pressure down. It is evident that the stratified cases, with all the fuel delivered through the cavity-side injector bank, results in an initially steeper drop in pressure in the vicinity of the cavity closeout ramp (x/h = 5), perhaps due to more robust combustion in the vicinity of the cavity. However, the more uniformly mixed cases result in higher combustor pressures overall and presumably would generate more thrust. All of the fueled cases shown in Figs. 8 and 9 represent operation of the scramjet flowpath in the dual-mode with separated flow and a precombustion shock train in the isolator. Using a one-dimensional model of the separated flow in the isolator [19], the one-dimensional Mach number at the cavity leading edge is estimated to be 0.70 for the φ = 0.40 case and 0.72 for the φ = 0.34 case. A thermal throat can be seen at the downstream end of the constant area section (x/h = 35), which represents the transition back to supersonic flow and indicates that the combustion process is isolated from the atmospheric back pressure. Note that at global fuel equivalence ratios above 0.4, the leading edge of the precombustion shock train is approaching the isolator fuel injection location. Care must be taken during these experiments to avoid impingement of the shock train directly on the fuel injectors as that results in ignition of the fuel in the isolator leading to a large
DISTRIBUTION A: Distribution approved for public release.
17
pressure spike in the flowpath and likely damage or breakage of the windows. Thus, to provide some margin and avoid damaging tunnel hardware, a practical upper fueling limit for continuous testing is a global equivalence ratio of 0.42 with an absolute upper bound of 0.45.
An important aspect of these experiments was to determine the limits of operability of the flowpath. As mentioned above, the upper limit on equivalence ratio has been determined to be 0.45 to avoid impingement of the shock train on the upstream fuel injectors. In order to determine the lower flame holding limits, a number of lean and low temperature flameout tests were performed by slowly lowering either the fuel flow rate (lean flameout) or heater temperature (low temperature flameout) until the flame was no longer sustained. Figure 10 shows the results of these tests with each data point representing an observed flameout. Although there is some variability in the data, flameout consistently occurs at a global equivalence ratio just above 0.3 when the total temperature is 1200 K. Thus, the maximum range of equivalence ratio is about 0.14 or a little over 30%. At lower temperatures between 1000 K and 1100 K, the fuel equivalence ratio required to sustain combustion rises to between 0.35 and 0.39 resulting in a range of operability of only 0.06 or 15%. Additional tests were performed with the air throttle on to provide additional back pressure such that the leading edge of the precombustion shock train was maintained at x/h = -45. At a total temperature of 1200 K, the incremental increase in static temperature behind the longer shock train sustains combustion down to an equivalence ratio between 0.26 and 0.29. This represents approximately 10% less fuel than with the air throttle off and gives an operability range in equivalence ratio of 0.16 to 0.19, which is between 40% and 50%.
Figures 11 is an instantaneous, high speed chemiluminescence image taken at a global equivalence ratio of 0.41 with approximately 2/3 of the fuel from the cavity-side injector bank and 1/3 from the opposite-side bank. Figure 12 is the same image taken at a global equivalence ratio of 0.31. The chemiluminescence is primarily due to emission from excited CH in the active reaction zone. Both images were taken with a 0.6 ms exposure. At both equivalence ratios, the flame is anchored on the cavity with combustion initiating along the shear layer between the cavity and the freestream air, impinges on the sloped cavity closeout surface, and propagates downstream expanding away from the cavity-side wall. There is little to no chemiluminescence near the cavity leading edge in either case. As would be expected, the higher fuel rate results in a somewhat more robust and brighter flame. The field of view is limited to 6.6 cavity depths (2.35 inches) downstream of the cavity leading edge and at that point the flame propagates a little over halfway across the duct in Fig. 11 and little less than halfway in Fig. 12. Figure 13 illustrates scramjet mode transition from a purely scram mode of operation with no pressure rise upstream of the cavity to the dual-mode discussed above. In this test, the fuel was delivered through both the primary fuel injectors in the isolator as well as the secondary injectors immediately upstream of the cavity. Only the cavity-side injectors in the isolator were used. The lower equivalence ratios (seen in blue) represent the purely scram mode of operation with no pressure rise upstream of the cavity and a one-dimensional Mach number of 1.49 at the leading edge of the cavity. Using a combination of the primary and secondary injectors in this fashion ensures some proportion of fuel-air premixing. However, the slope of the pressure curves in the combustor are more similar to that of the stratified fuel cases than the fully premixed cases in Figs. 8 and 9. Nevertheless, the data show that the facility and flowpath are capable of supporting scramjet mode transition with ethylene fueling.
DISTRIBUTION A: Distribution approved for public release.

18
Figure 10. Facility Operability Limits for Premixed Ethylene Combustion (lean and low
temperature flameout points).
Figure 11. Chemiluminescence image (0.6 ms capture) at global φ = 0.41 (cavity-side = 0.27, opposite-side = 0.15).
DISTRIBUTION A: Distribution approved for public release.

19
Figure 12. Chemiluminescence image (0.6 ms capture) at global φ = 0.31 (cavity-side = 0.20, opposite-side = 0.11).
Figure 13. Normalized wall pressures illustrating mode transition with primary and secondary fuel injection. In the legend, the numbers in parentheses indicate the primary (cavity-side) and secondary fuel equivalence ratio, respectively.
DISTRIBUTION A: Distribution approved for public release.

20
VII. Current Facility Capabilities
Table 4 summarizes the current capabilities of the UVASCF with respect to stable, premixed ethylene combustion. Fully uniform premixing is achieved by utilizing the precombustion shock train in the isolator and is therefore only currently possible in a ram combustion mode with a one-dimensional Mach number of approximately 0.7 at the leading edge of the cavity. Partially premixed combustion refers to the use of two sets of fuel injectors with one set located at the isolator entrance and another set immediately upstream of the cavity. This allows a portion of fuel to penetrate the freestream air flow while keeping the local equivalence ratio in the cavity high enough to sustain combustion. The injectors immediately upstream of the cavity are referred to as the secondary or cavity pilot injectors in this document. Sustained scram combustion with one-dimensional Mach numbers up to 1.8 at the cavity leading edge has been achieved in this facility using varying ratios of upstream to cavity pilot injection. The minimum cavity pilot equivalence ratio for sustained scram combustion is 0.02 with the majority of the fuel (equivalence ratio of 0.15) injected through the cavity-side injectors at the isolator entrance).
Table 4. Current UVASCF capabilities for high-speed, premixed ethylene combustion.
Level of Premixing Combustor Mach Number (1-D)
Global Equivalence Ratio
Cavity Static Pressure (kPaa)
Fully premixed 0.69 – 0.72 0.31 – 0.45 134.0 – 154.4 Partially premixed 0.65 – 1.79 0.12 – 0.48 65.5 – 157.7
Note: M2 facility nozzle with simulated M5 flight enthalpy (T0 = 1200 K, P0 = 300 kPaa), and facility freestream air flow ≈ 185 g/s. a. Fully premixed combustion in the ram mode
As mentioned above, stable ethylene combustion with a fully premixed inflow has been achieved in the ram mode by distributed fuel injection through the primary fuel injectors at the upstream end of the isolator. These injectors comprise two banks of six sonic, flush-wall injectors located 1.5 inches downstream of the facility nozzle exit on opposite walls of the duct. Injection at this location allows the fuel to be processed by the isolator shock train. NO PLIF imaging confirmed a nearly uniform fuel-air premix across the duct at the cavity leading edge for global equivalence ratios of 0.35 and above where the shock train leading edge is located between x/h = -30 and -45 (e.g. see Fig. 6). Lower global equivalence ratios, with a commensurate shorter precombustion shock train, leave the middle of the duct somewhat fuel lean compared to the perimeter (see Figs. 14 and 15).
Unfortunately, the range of global fuel equivalence ratios over which combustion can be sustained in the fully premixed ram mode is somewhat limited. Global equivalence ratios above 0.45 result in direct impingement of the isolator shock train leading edge on the upstream fuel injector location. This inevitably ignites the fuel in the isolator leading to a large pressure spike in the flowpath and likely damage or breakage of the windows. Thus, a practical upper limit in equivalence ratio for continuous testing of 0.42 has been established in order to provide some operating margin and avoid damaging hardware.
DISTRIBUTION A: Distribution approved for public release.

21
Figure 14. Instantaneous (a) and averaged (b) NO PLIF images of fuel simulant distribution at the cavity leading edge for two rows of fuel injection from both walls with global equivalence ratio = 0.35 and shock train leading edge at x/h = -30.
Figure 15. Instantaneous (a) and averaged (b) NO PLIF images of fuel simulant distribution at the cavity leading edge for two rows of fuel injection from both walls with global equivalence ratio = 0.29 and shock train leading edge at x/h = -15. Note: Cavity side is at the top and laser sheet was delivered from left to right in all images.
a) b)
a) b)
DISTRIBUTION A: Distribution approved for public release.

22
Lower flame holding limits in this mode are somewhat less precise. Figure 10 shows measured lean and low temperature flameout points. With a nominal total temperature of 1200 K, stable combustion is maintained to equivalence ratios of about 0.31. At lower temperatures, the equivalence ratio required to sustain combustion rises to approximately 0.39. The minimum temperature at which stable ethylene combustion has been achieved in this facility is 1040 K. b. Premixed combustion in the scram mode
Stable ethylene combustion in the scram mode, with supersonic flow at the entrance to the combustor, has only been achieved in this facility with a partially premixed inflow. Figure 16 shows measured pressures in the combustor for a range of equivalence ratios from 0.15 to 0.25. This experiment involved a slightly different version of the flowpath with a shorter isolator (10 in. vs. 16 in.) than was used in the majority of the premixed combustion testing. Also, in this experiment the fuel was delivered through a combination of the upstream injectors on the cavity-side wall and a set of five secondary injectors on the diverging wall, 0.97 inches upstream of the cavity leading edge. This serves to place more of the fuel on the cavity-side wall of the combustor and prevents the cavity itself from becoming too fuel lean for flame holding (see Fig. 17 for fuel distribution).
At global equivalence ratios below about 0.2, there is no pressure rise upstream of the cavity leading edge indicating a scram mode of combustion with no precombustion shock train. As the equivalence ratio is increased above 0.2, an oblique shock train forms upstream of the cavity. Significantly, it was not possible to sustain combustion in the scram mode without at least a small amount of fuel being injected at the secondary, cavity-pilot injector location. Furthermore, at a global equivalence ratio of 0.27, enhanced mixing of the upstream fuel plume due to a longer precombustion shock train caused the flame to go out, presumably because the local equivalence ratio in the cavity dropped below a critical threshold.
DISTRIBUTION A: Distribution approved for public release.

23
Figure 16. Normalized wall pressures for Configuration E with primary and secondary fuel injection. In the legend, the numbers in parentheses indicate the primary (cavity-side) and secondary (cavity pilot) fuel equivalence ratios, respectively.
Figure 17. Instantaneous (a) and averaged (b) NO PLIF images of fuel simulant distribution at the cavity leading edge for global equivalence ratio = 0.17 (0.15 through the primary injectors on the cavity-side wall and 0.01 through the secondary injectors) and no shock train forward of the cavity.
Figure 18 shows the Mach number at the cavity leading edge for a range of global fuel
equivalence ratios as calculated using the 1-D separated flow model for the isolator described in Heiser and Pratt (Ref. 19). Several curves are shown. The green curve corresponds to the data shown in Fig. 16 for Configuration E. At low equivalence ratios, the Mach number is very close to the non-combusting value of 1.8. This is slightly less than the facility exit Mach number of
a) b)
DISTRIBUTION A: Distribution approved for public release.

24
2.03 due to boundary layer growth in the upstream portion of the isolator. With the formation of an isolator shock train, the combustor entrance Mach number approaches one at the highest equivalence ratio of 0.25. It can also be seen in Fig. 16 that for this fuel rate a thermal throat is just beginning to form downstream (at x/h = 35) as the combustor is transitioning to the ram mode of combustion.
The blue curve shows the 1-D Mach number at the cavity leading edge for the mode transition experiment performed in the Modified Configuration E with the 16 inch isolator (as for the data in Fig. 13). Here the fuel was split evenly between the primary injectors on the cavity-side wall of the isolator and the secondary injectors just upstream of the cavity in order to prevent the cavity from becoming too lean as the shock train moves forward in the isolator. The lower Mach number in the fuel off case is due to increased boundary layer growth in the longer isolator. Transition to ram combustion occurs at a global equivalence ratio between 0.21 and 0.24. As before, this transition is associated with the formation of thermal throat downstream at x/h = 35 (see Fig. 13). Finally, the red curve shows the combustor entrance Mach number for the fully premixed combustion cases with the shock train well forward in the isolator (see data in Figs. 8 and 9).
Figure 18. 1-D Combustor Entrance Mach Number for Several Fueling Conditions
DISTRIBUTION A: Distribution approved for public release.
25
c. Summary of current capabilities
Combustion in the ram mode with a fully premixed inflow is stable in this facility for global equivalence ratios between approximately 0.31 and 0.45 and a total temperature of 1200 K. The lean flame out limit can be extended to between 0.26 and 0.29 by maintaining the leading edge of the precombustion shock train at x/h = -45, which incrementally increases the static temperature at the cavity. This is done by employing a downstream air throttle to provide additional back pressure to the combustor as the equivalence ratio is reduced.
Combustion in the scram mode with a fully premixed inflow has not been achieved in this facility, although scram combustion is possible by utilizing a secondary set of cavity-pilot fuel injectors. The challenge to be overcome is maintaining sufficient fuel in the cavity for flame holding while keeping the global equivalence ratio low enough for scram mode combustion. As can be seen in Figs. 13 and 16, a pressure rise upstream of the cavity is observed at global equivalence ratios as low as 0.17 and, from Fig. 18, the flow at the cavity leading edge becomes subsonic in a one-dimensional sense at a global equivalence ratio of about 0.24. However, the lean flame out limit for the fully premixed cases were consistently above 0.3 and a uniform fuel/air premix is not possible with current facility hardware without the benefit of a precombustion shock train for global equivalence ratios less than approximately 0.4.
A possible alternative that has been suggested is to use an existing Mach 3.2 facility nozzle instead of the current M2 nozzle. While this would allow operation of the facility at higher equivalence ratios, it is not clear that stable, premixed scram combustion could be achieved without modifications to the flowpath itself. Previous testing with the M3.2 nozzle and hydrogen fuel did not produce a scram combustion mode without a precombustion shock train and the range of global equivalence ratios for which scram combustion with an oblique shock train was possible was small (~0.37 – 0.41).
VIII. Conclusion This report documents the development of a dual-mode scramjet flowpath and fuel injection scheme that is capable of sustaining a high speed, uniformly premixed, turbulent flame with a combustor inlet Mach number of about 0.7. The work relies on a precombustion shock train in the isolator to enhance the fuel-air mixing. The resulting fuel-air premix uniformity at the leading edge of the cavity flame holder has been verified with NO PLIF. Furthermore, the flowpath is also capable of supporting a purely scram mode of combustion with no precombustion shock train as well as a transitional scram mode with a short shock train and supersonic combustor inflow. Within the operability limits of the flowpath documented in this report, the scramjet flame is stably anchored on the cavity and is highly repeatable. This presents a suitable test environment for time-intensive diagnostics such as fine-grid CARS as well as PLIF and PIV, which can be performed in sufficient quantity to yield statistically meaningful quantitative results.
DISTRIBUTION A: Distribution approved for public release.

26
Acknowledgments This report was developed in collaboration with the National Center for Hypersonic Combined Cycle Propulsion and with the assistance of Robert D. Rockwell, Brian E. Rice, Harsha Chelliah, James C. McDaniel from the University of Virginia, Jack R. Edwards from North Carolina State University, Luca M. L. Cantu , Emanuela C. A. Gallo and Andrew D. Cutler from The George Washington University, and Paul M. Danehy from NASA Langley.
DISTRIBUTION A: Distribution approved for public release.

27
References
[1] Peters, N., Turbulent Combustion, Cambridge University Press, 2000. [2] Borghi, R., “Turbulent Combustion Modeling,” Progress in Energy and Combustion Science,
Vol. 14, No. 4, 1988, pp. 245-292. [3] Bray, K., Libby, P., Williams, F., High Speed Turbulent Combustion in Turbulent Reacting
Flows (eds. Libby, P.A. and Williams, F.A.), Academic Press, London, UK, 1994. [4] Williams, F.A., Combustion Theory, Westview Press, 1985. [5] Cutler, A.D., Magnotti, G., Cantu, L., Gallo, E., Rockwell, R.D., and Goyne, C.P., “Dual-
Pump Coherent Anti-Stokes Raman Spectroscopy Measurements in a Dual-Mode Scramjet,” Journal of Propulsion and Power, Vol. 30, No. 3, 2014, pp. 539-549.
[6] Johansen, C.T., McRae, C.D., Danehy, P.M., Gallo, E.C., Cantu, L.M., Magnotti, G., Cutler, A.D., Rockwell, R.D., Goyne, C.P., and McDaniel, J.C., “OH PLIF of UVa Supersonic Combustion Experiment: Configuration A,” Journal of Visualization, Vol. 17, No. 2, 2014, pp. 131-141.
[7] Rice, B.E., Goyne, C.P., McDaniel, J.C., and Rockwell, R.D., “Characterization of a Dual-Mode Scramjet via Stereoscopic Particle Image Velocimetry,” AIAA 2014-0986, 52nd AIAA Aerospace Sciences Meeting, National Harbor, MD, Jan. 2014.
[8] Fulton, J.A., Edwards, J.R., Hassan, H.A., McDaniel, J.C., Goyne, C.P., Rockwell, R.D., Cutler, A.D., Johansen, C.T., and Danehy, P.M., “Large-Eddy/Reynolds-Averaged Navier-Stokes Simulations of Reactive Flow in Dual-Mode Scramjet Combustor,” Journal of Propulsion and Power, Vol. 30, No. 3, 2014, pp. 558-575.
[9] Gallo, E.C., Cantu, L.M., Cutler, A.D., Danehy, P.M., Rockwell, R.D., Goyne, C.P., and McDaniel, J.C., Oral Presentation: Coherent Anti-Stokes Raman Spectroscopy (CARS) in a Dual-Mode Scramjet with Premixed Fueling, 53rd AIAA Aerospace Sciences Meeting, Kissimmee, FL, Jan. 2015.
[10] Kirik, J.W., Goyne, C.P., McDaniel, J.C., Rockwell, R.D., Johnson, R.F., and Chelliah, H.K., “Velocimetry Using Graphite Tracer Particles in a Scramjet Flowpath,” 53rd AIAA Aerospace Sciences Meeting, Kissimmee, FL, Jan. 2015.
[11] Kumar, K., Edwards, J.R., Goyne, C.P., and McDaniel, J.C., “Large Eddy Simulation of High-Speed, Premixed Ethylene Combustion,” 53rd AIAA Aerospace Sciences Meeting, Kissimmee, FL, Jan. 2015.
[12] McDaniel, J.C., Chelliah, H., Goyne, C.P., Edwards, J.R., Givi, P., Cutler, A.D., “US National Center for Hypersonic Combined Cycle Propulsion: An Overview,” AIAA-2009-7280, 16th AIAA/DLR/DGLR International Space Planes and Hypersonic Systems and Technologies Conference, Bremen, Germany, Oct 2009.
[13] Rockwell, R.D., Goyne, C.P., Rice, B.E., Kouchi, T., McDaniel, J.C., and Edwards, J.R., “Collaborative Experimental and Computational Study of a Dual-Mode Scramjet Combustor,” Journal of Propulsion and Power, Vol. 30, No. 3, 2014, pp. 530-538.
[14] Ullum, U., Schmidt, J.J., Larsen, P.S., and McCluskey, D.R., “Statistical Analysis and Accuracy of PIV Data,” Journal of Visualization, Vol. 1, No. 2, 1998, pp. 205-216.
[15] Cantu, L.M., Gallo, E.C., Cutler, A.D., Bathel, B.F., Danehy, P.M., Rockwell, R.D., Goyne, C.P., and McDaniel, J.C., “Nitric Oxide PLIF Visualization of Simulated Fuel-Air Mixing in a Dual-Mode Scramjet,” 53rd AIAA Aerospace Sciences Meeting, Kissimmee, FL, Jan. 2015.
DISTRIBUTION A: Distribution approved for public release.

28
[16] Rockwell, R.D., Goyne, C.P., Haw, W., Krauss, R.H., McDaniel, J.C., and Trefny, C.J., “Experimental Study of Test-Medium Vitiation Effects on Dual-Mode Scramjet Performance and Power,” Journal of Propulsion and Power, Vol.27, No.5, 2011, pp. 1135-1142.
[17] Krauss, R.H., McDaniel, J.C., Scott J.E., Whitehurst, R.B., Segal, C., Mahoney, G.T., and Childers, J.M., “Unique, clean-air, continuous-flow, high-stagnation-temperature facility for supersonic combustion research,” AIAA Report 88-3059, 1988.
[18] Krauss, R.H. and McDaniel, J.C., “A Clean Air Continuous Flow Propulsion Facility,” AIAA Report 92-3912, 1992.
[19] Heiser, W.H. and Pratt, D.T., Hypersonic Airbreathing Propulsion, AIAA Education Series, AIAA, Washington, D.C., 1994, pp. 332-346.
DISTRIBUTION A: Distribution approved for public release.

Response ID:4523 Data
1.
1. Report Type
Final Report
Primary Contact E-mailContact email if there is a problem with the report.
Primary Contact Phone NumberContact phone number if there is a problem with the report
4349825355
Organization / Institution name
University of Virginia
Grant/Contract TitleThe full title of the funded effort.
Premixed Supersonic Combustion
Grant/Contract NumberAFOSR assigned control number. It must begin with "FA9550" or "F49620" or "FA2386".
FA9550-13-1-0146
Principal Investigator NameThe full name of the principal investigator on the grant or contract.
Christopher Goyne
Program ManagerThe AFOSR Program Manager currently assigned to the award
Chiping Li
Reporting Period Start Date
08/01/2013
Reporting Period End Date
09/14/2014
Abstract
Hypersonic air-breathing engines rely on scramjet combustion processes, which involvehigh speed, compressible, and highly turbulent flows. The combustion environment andthe turbulent flames at the heart of these engines are difficult to simulate and study in thelaboratory under well controlled conditions. Typically, wind-tunnel testing is performedthat more closely approximates engine testing rather than a careful investigation of theunderlying physics that drives the combustion process. The experiments described in thisreport, along with companion data sets developed separately, aim to isolate the chemicalkinetic effects from the fuel-air mixing process in a dual-mode scramjet combustionenvironment. A unique fuel injection approach is taken that produces a uniform fuel-airmixture at the entrance to the combustor. This approach relies on the precombustionshock train upstream of the dual-mode scramjet combustor. A stable ethylene flameanchored on a cavity flame holder with a uniformly mixed combustor inflow was achievedin these experiments, allowing numerous companion studies involving coherent anti-Stokes Raman scattering (CARS), particle image velocimetry (PIV), and planar laserinduced fluorescence (PLIF) to be performed.DISTRIBUTION A: Distribution approved for public release.

Distribution StatementThis is block 12 on the SF298 form.
Distribution A - Approved for Public Release
Explanation for Distribution StatementIf this is not approved for public release, please provide a short explanation. E.g., contains proprietary
information.
SF298 FormPlease attach your SF298 form. A blank SF298 can be found here. Please do not password protect or secure
the PDF The maximum file size for an SF298 is 50MB.
AFD-070820-035 Goyne Ver 2.pdf
Upload the Report Document. File must be a PDF. Please do not password protect or secure thePDF . The maximum file size for the Report Document is 50MB.
Premixed Supersonic Combustion Final Report Ver 2.pdf
Upload a Report Document, if any. The maximum file size for the Report Document is 50MB.
Archival Publications (published) during reporting period:
Changes in research objectives (if any):
Change in AFOSR Program Manager, if any:
Extensions granted or milestones slipped, if any:
Added Sections II, V(1) and VII to report
AFOSR LRIR Number
LRIR Title
Reporting Period
Laboratory Task Manager
Program Officer
Research Objectives
Technical Summary
Funding Summary by Cost Category (by FY, $K)
Starting FY FY+1 FY+2
Salary
Equipment/Facilities
Supplies
Total
Report Document
Report Document - Text Analysis
Report Document - Text Analysis
Appendix Documents
2. Thank You
E-mail user
Apr 29, 2015 10:41:13 Success: Email Sent to: [email protected]
DISTRIBUTION A: Distribution approved for public release.