christine b. williams bentley college waltham, massachusetts the harvard networks in political...
TRANSCRIPT

CHRISTINE B. WILLIAMSBENTLEY COLLEGE
WALTHAM, MASSACHUSETTS
THE HARVARD NETWORKS IN POLITICAL SCIENCE CONFERENCE
JUNE 13-14, 2008
The Internet as a Grassroots Organizing Tool:
Exploring the Role of Social Networks in the 2008 Presidential Nomination
Contest

Studying the Role of Social Networks

The Research Project
Previous studies Which kinds of candidates activated their Facebook profiles?
(Gubernatorial candidates, competitive races, better financed, challengers, Democrats)
Is there a relationship between the number of Facebook supporters and candidates’ vote share?
(Yes: especially for open seats, youth vote and caucus outcomes)
Current study What does the number of supporters a candidate has within
a social network tell us?1. How do supporter numbers track over time, across candidates?2. How do supporter numbers relate to other traditional and online
indicators of candidate strength?3. How do supporter numbers relate to candidates’ vote shares?

Findings
1. The number of supporters for each candidate on MySpace and Facebook was highly consistent from July 2007 to June 2008, but showed more variation over time for YouTube. Candidates with a strong social network presence see
it erode, albeit slowly, after successive electoral losses (Paul, Edwards); victories build candidates’ supporter base much more quickly (McCain, Huckabee).

Figure 1
Data provided by tubemogul.com

Figure 2

Figure 3
Top 10 Candidate Rankings: October 16
Rank $3rdQ OctPolls #DonorsQ3 WebTraffic BlogBuzz MySpace Facebook YouTube Meetups
1 Clinton Clinton Obama Paul Clinton Obama Obama Paul Paul
2 Obama Giuliani Clinton Obama Paul Clinton Clinton Obama Obama
3 Romney Obama Romney Clinton Giuliani Paul Paul Edwards Edwards
4 Thompson Thompson Giuliani Edwards Romney Edwards Edwards Clinton Kucinich
5 Giuliani McCain Edwards Romney Obama McCain Romney Romney Clinton
6 Edwards Gore McCain Thompson McCain Kucinich Thompson Gravel Gore
7 McCain Romney Richardson Kucinich Edwards Romney Kucinich Kucinich Clark
8 Richardson Edwards Thompson Giuliani Gore Richardson McCain Richardson Hunter
9 Paul Huckabee Paul McCain Thompson Biden Richardson Giuliani Huckabee
10 Biden Paul Dodd Huckabee Richardson Thompson Giuliani Biden Thompson
Data Sources:
$3rdQ- Opensecrets
OctPolls- USA Today/Gallup, Oct. 12-14
# Donors contributing $200 or more, 3rd Q, Open Secrets
Web Traffic- Alexa.com rankings, Oct 16
BlogBuzz- wonkosphere.com Oct 16 (24 hours)
MySpace- Tech President (Oct. 16)
Facebook- TechPresident
YouTube- Tech President
Meetups- Meetup.com

Figure 4
Top 10 Candidate Rankings: January 31
Rank $4thQ JanPolls #DonorsQ4 WebTraffic BlogBuzz MySpace Facebook YouTube Meetups
1 Clinton Clinton Obama Paul Obama Obama Obama Obama Paul
2 Obama Obama Clinton Obama Clinton Clinton Clinton Paul Huckabee
3 Paul McCain Romney Clinton McCain Paul Paul Clinton Obama
4 Giuliani Romney McCain Huckabee Romney McCain Huckabee Edwards Kucinich
5 Romney Huckabee Paul Romney Paul Romney Romney Huckabee Edwards
6 Thompson Paul Huckabee Edwards Edwards Huckabee McCain Romney Clinton
7 McCain Edwards Keyes McCain Giuliani Gravel Edwards Giuliani Gore
8 Huckabee Giuliani Gravel Kucinich Thompson Kucinich Kucinich Hunter
9 Edwards Thompson Huckabee Giuliani McCain McCain
10 Richardson Giuliani Richardson Thompson Gravel Gravel
Data Sources:
$4thQ- Opensecrets
JanPolls- USA Today/Gallup, Jan. 31
# Donors contributing $200 or more, 4th Q, Open Secrets
Web Traffic- Alexa.com rankings, Jan. 31
BlogBuzz- wonkosphere.com Jan. 27 – Feb. 2 (average)
MySpace- Tech President (Jan. 31)
Facebook- TechPresident
YouTube- Tech President
Meetups- Meetup.com
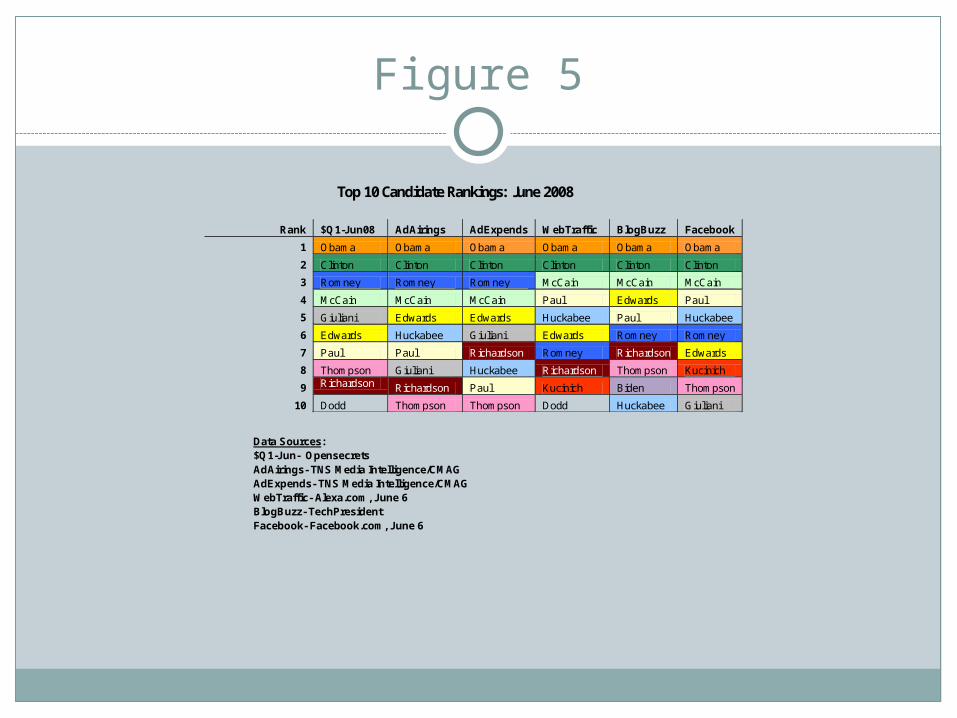
Figure 5
Top 10 Candidate Rankings: June 2008
Data Sources: $Q1-Jun- Opensecrets AdAirings- TNS Media Intelligence/CMAG AdExpends- TNS Media Intelligence/CMAG WebTraffic- Alexa.com, June 6 BlogBuzz- TechPresident Facebook- Facebook.com, June 6
Rank $Q1-Jun08 AdAirings AdExpends WebTraffic BlogBuzz Facebook
1 Obama Obama Obama Obama Obama Obama
2 Clinton Clinton Clinton Clinton Clinton Clinton
3 Romney Romney Romney McCain McCain McCain
4 McCain McCain McCain Paul Edwards Paul
5 Giuliani Edwards Edwards Huckabee Paul Huckabee
6 Edwards Huckabee Giuliani Edwards Romney Romney
7 Paul Paul Richardson Romney Richardson Edwards
8 Thompson Giuliani Huckabee Richardson Thompson Kucinich
9 Richardson Richardson Paul Kucinich Biden Thompson
10 Dodd Thompson Thompson Dodd Huckabee Giuliani

Findings (continued)
2. Facebook supporter numbers should be interpreted as responses to the external political environment, not as previewing and documenting shifts in momentum on the ground. In general, the winning candidate or an unexpected strong
showing nets a surge in Facebook supporters and YouTube viewership after the primary or caucus victory, but even losers benefit from increased interest in the early contests.
Conclusion: These trends suggest that new media and social networks
in particular mirror traditional media effects: frontrunners benefit more than maverick challengers or those in the lower tier.

Table 1
Facebook Supporters, Pre- and Post- Iowa, N. Hampshire and Super Tuesday
pre-Iowa: post-Iowa % change post-NH % change post-ST % change
mid-Dec. Jan. 1-7 pre/post IA Jan. 7-14 pre/post NH pre/post ST
Democrats Obama 171,205 205,872 20.25% 222,812 8.23% 634,802 94.12%
Clinton 56,209 61,360 9.16% 67,414 9.87% 124,438 44.84% Edwards 25,743 33,067 28.45% 34,698 4.93% 31,022 -13.46% Kucinich 18,233 21,911 20.17% 22,727 3.72% 22,411 -4.36% Biden 8,772 8,534 -2.71% 8,296 -2.79% 6,935 -6.69% Richardson 8,188 8,801 7.49% 8,816 0.17% 6,758 -8.24% Gravel 7,615 7,687 0.95% 7,867 2.34% 8,801 3.54%
Dodd 2,371 2,309 -2.61% 2,258 -2.21% 1,992 -3.21% TOTAL: 298,336 349,541 17.16% 374,888 7.25% 837,159 68.25%
Republicans Paul 44,738 67,677 51.27% 70,411 4.04% 84,806 5.04%
Romney 22,661 25,437 12.25% 26,610 4.61% 36,020 -7.73% F. Thompson 19,290 18,479 -4.20% 18,610 0.71% 12,810 -16.19% Huckabee 16,308 33,637 106.26% 37,813 12.41% 56,892 1.40% McCain 15,058 19,219 27.63% 21,971 14.32% 74,597 95.00% Giuliani 12,548 16,357 30.36% 16,964 3.71% 15,622 -23.43% Hunter 1,270 1,542 21.42% 1,620 5.06% 1,381 -6.31% TOTAL: 131,873 182,348 38.28% 193,999 6.39% 282,128 12.27%

Figure 6
Data provided by tubemogul.com
Candidates’ YouTube Viewers Pre-, Post- and Day of Nomination Contest
KEY: Dark blue= highest # views
Med. Blue= middle # views Lite Blue= lowest # views
Cell of contest winner’s highest # of views is outlined in black
LA-pre LA-day LA-post
MD/VA-pre
MD/VA-day
MD/VA-post O/TX-pre O/TX-day
O/TX-post PA-pre PA-day PA-post
Obama 226459 204159 513945
185628 1645723 143734 84123 111481 312545 206835 177765
Clinton 157466 87434 39678 111229 71802 103654 46580 45177 33321 112982 152131 91381
McCain 23359 16149 18748 23064 17082 17464 19316 20584 20531 10334 10374 12056
Huckabee 16799 13218 32242 29859 17775 15660 8330 7824 5328 1268 942 1182

Findings (continued)
3. In the lead up to Iowa and New Hampshire, social network supporter numbers provide insights into candidate viability on a par with national poll standings and campaign fundraising. The relationships among indicators of candidate
standing strengthen and converge over time. By the conclusion of the nomination contest in June, intercorrelations are all about +.9.

Table 2
Correlations of October Candidate Strength Indicators
RaisedQ3 PollOct15
# DonorsQ3 OctTraffic BlogsOct MySpcOct FacebkOct YouTubeOct
RaisedQ3
PollOct15 .831**
#DonorsQ3 .898** .726**
OctTraffic .336 .575* .331
BlogsOct .735** .776**
.607* .716*
MySpcOct .754** .537*
.819** .250 .600
FacebkOct .646** .365
.780** .199 .307 .906**
YouTubeOct .498* .201
.538* .199 .525 .738** .640**
MeetupOct18 -.005 -.115 -.064 .161 .312 .271 .179 .715**
** Correlation is significant at the 0.01 level (2-tailed). * Correlation is significant at the 0.05 level (2-tailed).

Table 3
Correlations of January 31 Candidate Strength Indicators
Raised4Q JanPoll #DonorsQ4 JanTraffic BlogsJan MySpcJan FacebkJan UTubeJan Raised4Q JanPoll .405 #DonorsQ4
.788 .730
AxJanTraffic
.241 .274 .269
BlogsJan
.844** .864** .957** .277
MySpcJan
.899* .427 .868* .688 .814*
FacebkJan
.717** .418 .778 .527 .782** .882*
UTubeJan
.761** .128 .582 .231 .745** .816* .867**
MeetupJan
.348 -.402 -.190 .127 .107 .131 .099 .566*
** Correlation is significant at the 0.01 level 2-tailed. * Correlation is significant at the 0.05 level 2-tailed.

Table 4
Correlations of June 6 Candidate Strength Indicators
$thruJun adairings adspend AxJune08 BlogsJun adairings
.963**
adspend .971** .990(**) AxJune08 .205 .223 .216 BlogsJun .945** .928(**) .897(**) .205
FacebkJun08 .816** .907(**) .864(**) .219 .846(**)
** Correlation is significant at the 0.01 level (2-tailed).

Findings (continued)
4. In Super Tuesday primaries, the strongest relationships with vote share are national poll standings, volume of traditional media coverage and Blog Buzz.
5. Grassroots media are in tune with grassroots election vehicles. The national polls and volume of traditional media coverage
got Super Tuesday caucus outcomes wrong: Blog Buzz and Facebook were the ones actually “on the money” showing the highest correlations with candidates’ actual vote shares.
6. Weak correlations between fundraising and election outcomes for both caucus and primary states belie conventional wisdom that only the best financed candidates can compete effectively when many states hold their contests on the same day.

Table 5
Correlations of January Candidate Strength Indicators with Super Tuesday Vote Percentages
** Correlation is significant at the 0.01 level (2-tailed). * Correlation is significant at the 0.05 level (2-tailed).
TuesCaucus TuesPrimary TuesPrimary .872(**) Raised4Q .646(*) .640(*) JanPoll .700 .985** #DonorsQ4 .799* .836* MediaCovFeb .703(**) .910(**) AxJanTraffic .575(*) .546(*) BlogsJan .836(**) .905(**) FacebkJan31 .856(**) .654(**) MySpaceJan .691 .548

Next Steps
Continue data collection and analysisAcademic papers, reports & press releases archived at
http://blogsandwikis.bentley.edu/politechmedia/American Political Science Association annual meeting,
Boston, Massachusetts, August 28-31, 2008. “What Is a Social Network Worth?
Facebook and Vote Share in the 2008 Presidential Primaries”
Workshop on "YouTube and the 2008 Election Cycle" to be held at the University of Massachusetts Amherst in late Spring 2009 and intended to lead to a special issue of the Journal of Information Technology & Politics.