chp-enabled renewable energy microgrids in …
TRANSCRIPT

CHP-ENABLED RENEWABLE ENERGY MICROGRIDS IN PENNSYLVANIA
1 | P a g e
CHP-ENABLED RENEWABLE ENERGY
MICROGRIDS IN PENNSYLVANIA:
A Guidance Document for Conceiving Feasible Systems
Prepared for:
Authors:
Jim Freihaut, Ph.D.
David Riley, Ph.D.
Mark Stutman, M.S.
Parhum Delgoshaei, Ph.D.
Lisa Shulock, MBA
Scott Wagner, B.S.
Department of Architectural Engineering
The Pennsylvania State University
at The Philadelphia Navy Yard
v. 3.3 September 20, 2018

CHP-ENABLED RENEWABLE ENERGY MICROGRIDS IN PENNSYLVANIA
2 | P a g e
Acknowledgments
The Pennsylvania State University would like to thank the Pennsylvania Department of
Environmental Protection for their financial and professional support of this project in
Building 7R at The Navy Yard in Philadelphia. This material is based upon work
supported by the Department of Energy, Office of Energy Efficiency and Renewable
Energy (EERE), under the State Energy Program Award Number DE-EE0006994
through a grant from the Pennsylvania Department of Environmental Protection.
Thanks to Eric Stein from PECO/Exelon, who generously provided financial support for
the Building 7R microgrid installation and the lithium-ion battery bank. Chris Fraga
from Alternative Energy Development Group provided invaluable insights into financing
distributed energy projects, and generously provided the table of representative
counterparty agreements required for a typical distributed energy project.
Special thanks to Kevin Wright, Andy Mackey and Lou Tenney from ProtoGen Energy
for their patience and technical support over the long course of this and related projects at
Penn State at The Navy Yard. Their contributions to the content and structure of this
Guide greatly enhanced the result.
Disclaimer
This report was prepared as an account of work sponsored by an agency of the United
States Government. Neither the United States Government nor any agency thereof, nor
any of their employees, makes any warranty, express or implied, or assumes any legal
liability or responsibility for the accuracy, completeness, or usefulness of any
information, apparatus, product, or process disclosed, or represents that its use would not
infringe privately owned rights. Reference herein to any specific commercial product,
process, or service by trade name, trademark, manufacturer, or otherwise does not
necessarily constitute or imply its endorsement, recommendation, or favoring by the
United States Government or any agency thereof. The views and opinions of authors
expressed herein do not necessarily state or reflect those of the United States Government
or any agency thereof.

CHP-ENABLED RENEWABLE ENERGY MICROGRIDS IN PENNSYLVANIA
3 | P a g e
Contents
Acknowledgments............................................................................................................... 2
Purpose ................................................................................................................................ 4
Introduction ......................................................................................................................... 5
CHP-Enabled Renewable Electric Microgrids (CHPERMG) ............................................ 6
Microgrids, Value Streams and Business Models of Microgrid Systems .......................... 8
Value Streams and Revenue Sources .............................................................................. 8
Business Models and Microgrids .................................................................................. 10
Economics and Financing ................................................................................................. 11
Subsidies and Tax Credits ............................................................................................. 11
Critical Success Factors and De-Risking ...................................................................... 11
Financing ....................................................................................................................... 14
Modeling Tools ............................................................................................................. 14
Conceiving and Assessing Feasibility of CHP-Enabled Renewable Energy Microgrids . 15
Feasibility Assessment Methodology ........................................................................... 15
Spreadsheet Tool Inputs ................................................................................................ 20
Case Study Example – Berks County Industrial/Commercial Park.................................. 27
Municipal Scale Microgrids .............................................................................................. 33
Conclusions ....................................................................................................................... 35
Appendix A. Additional DER Modeling Tools ............................................................... 36
Appendix B: Penn State University’s Microgrid Testbed at The Navy Yard.................. 37
Glossary ............................................................................................................................ 44
Resources and References................................................................................................. 46

CHP-ENABLED RENEWABLE ENERGY MICROGRIDS IN PENNSYLVANIA
4 | P a g e
Purpose The purpose of this guide1 is to provide introductory guidance to those in the
Commonwealth of Pennsylvania who are interested in conceiving, developing, and
financing ‘hybrid’ fossil fuel and renewable energy systems. These systems can provide
on-site natural-gas fueled electric and thermal (e.g. hot water or steam) energy generation
(combined heat and power, CHP) in combination with renewable energy resources such
as solar photovoltaic arrays and battery storage systems. Such systems provide an
economically and environmentally attractive means to utilize Marcellus shale gas in
combination with renewable energy resources to promote economic growth, with higher
efficiency and lower emissions than conventional systems.
The target audience for such systems include owners of commercial and industrial
buildings and properties with well-defined thermal loads, including retirement
communities, multi-family buildings, hospitals, food processors and any large users of
steam or hot water; commercial, institutional and industrial parks and campuses; and
municipalities and rural co-op organizations.
New combinations of these well understood technologies are making it possible to
expand business cases. Multi-family residential, commercial, institutional and industrial
facilities may derive value from long-term predictable costs for uninterruptable power
and thermal energy for critical processes. System owners may also derive additional
value from the ability to provide resilience and continuity of critical community services
in the aftermath of storms and natural disasters that disrupt the regional electric grid with
increasing frequency.
The guide provides the reader with a discussion of what a microgrid is, why an onsite
distributed energy powered microgrid may be desired, an overview of microgrids at the
building, campus and municipal scale, and a discussion of potential business models,
economics and financing. A step-by-step procedure is outlined for conceiving and
exploring the economic feasibility of potential CHP projects. Following the feasibility
assessment process, readers will be equipped to discuss potential microgrid opportunities
with community stakeholders and system developers.
It is our hope that the guide will facilitate the exploration of potential distributed energy
microgrid installations throughout Pennsylvania and will help to increase the penetration
of renewable energy resources. We also hope that these microgrid systems will utilize
the state’s shale gas resources to foster economic development in an environmentally
responsible manner.
1 This guide and the accompanying spreadsheet may be downloaded at: https://navyyard.psu.edu/energy-
research/distributed-energy-and-smart-grids

CHP-ENABLED RENEWABLE ENERGY MICROGRIDS IN PENNSYLVANIA
5 | P a g e
Introduction Note: Certain terms in this guide are defined in a Glossary near the end of the document.
These terms are emboldened the first time that they are used in the text.
The Commonwealth of Pennsylvania has a long history of robust participation in the
development and production of primary energy and fuel resources in the USA. In
keeping with that tradition, the development and availability of abundant shale gas2 in
Pennsylvania over the past fifteen years has provided the Commonwealth with an
unexpected opportunity for economic development. Pennsylvania currently has the
largest unconventional (shale gas) field in the world; 2014 annual gross natural gas
production exceeded 4 trillion cubic feet. This resource has catapulted the
Commonwealth to be the state with largest net energy exports, second largest producer of
natural gas and nuclear generation, third largest in overall energy production, and fourth
largest in net electricity generation and coal production.
Electric generation throughout the USA and globally is shifting much fossil fueled
electricity production to this relatively inexpensive fuel, displacing coal and in some
cases nuclear electric generation. Though a fossil fuel and therefore a contributor to
greenhouse gas emissions, natural gas-fired power production does contribute fewer
GHG emissions per unit of produced electricity than coal3,4.
Distributed Energy Resources (DERs) are broadly defined as electrical generation and
storage equipment utilized in on-site electric-grid connected devices. Distributed energy
generators may be conventional stationary gas- or diesel-fired ‘back-up’ generators or
combined heat and power (CHP) systems. In addition to generating electricity, thermal
energy is recovered from the jacket of gas-fueled generators, displacing conventional
boilers that would otherwise burn additional fuel to generate steam or hot water used on-
site.
Solar photovoltaic panels are perhaps the most recognizable renewable DER in
Pennsylvania. Other renewable sources of power include small hydroelectric, wind
turbines, waves, tidal water flow, biomass/biogas systems and geothermal systems.
Conventional lead-acid or lithium-ion battery banks are the most common electric storage
component in a DER system.
DERs are typically located near the loads they serve and consequently are much smaller
in capacity than conventional centralized power plants fueled by coal, natural gas, nuclear
fission, large hydroelectric dams, wind ‘farms’ or centralized solar power stations. These
centralized power plants are served by a network of high-voltage transmission lines that
deliver power over long distances. A significant amount of electricity generated at
centralized power plants is ‘lost’ as heat during the generation and transmission process,
reducing overall efficiency. CHP systems are designed to recover and effectively utilize
2 Primarily from the Marcellus and Utica shale formations in northern and western Pennsylvania 3 https://www.ucsusa.org/clean-energy/coal-and-other-fossil-fuels/environmental-impacts-of-natural-
gas#.W2sG1LgpBaQ 4 http://www.conocophillips.com/environment/climate-change/does-natural-gas-reduce-greenhouse-gas-emissions/

CHP-ENABLED RENEWABLE ENERGY MICROGRIDS IN PENNSYLVANIA
6 | P a g e
waste ‘thermal’ energy created by the combustion of fuel in the generator. Transmission
and distribution losses are minimized due to the proximity of the loads to the generators.
By capturing and using waste heat of combustion and minimizing transmission losses,
CHP Enabled Renewable Microgrid systems significantly reducing the carbon
(greenhouse gas) emissions per unit of electricity consumed at the site.
Although not a piece of energy generating or storage equipment, energy efficiency
investments designed to economically lower the energy consumption of a microgrid
system’s loads should also be considered a DER. Investments in high-efficiency
equipment and retrofitting existing building systems, including the building envelope and
the systems within the building that consume power, are both cost-effective means of
lowering the size and therefore the installed cost of a CHP Enabled Renewable
Microgrid.
With partial funding support from the Pennsylvania Dept. of Environmental Protection
and the U.S. Department of Energy’s State Energy Program, Penn State University has
installed a building-scale microgrid in their classroom Building 7R at the Navy Yard in
Philadelphia. Appendix B contains a description of the system. In the coming years, this
system will be operated in various ways in order to document the technical issues and
economics of microgrid installation and operation. The initial list of operating modes is
contained in the section of Appendix B entitled ‘Initial List of Microgrid Operational
Modes’. Penn State plans to develop and present workshops targeted to the potential
microgrid developers and users in Pennsylvania that present and discuss the results of the
applied research into the microgrid system in order to encourage the development of
economical microgrids and economic development.
CHP-Enabled Renewable Electric Microgrids (CHPERMG)
As DERs drop in price and increase in flexibility and sophistication, it is becoming
economical in some situations to combine localized electric and thermal generation with
storage and components that may pump energy directly into the centralized electric grid.
They may also be intentionally and safely operated as an autonomous microgrid,
completely isolated from the centralized grid. These systems may be designed and
operated with a number of different potential goals and value propositions, discussed
below.
In every situation, a potential owner of a microgrid needs to grapple with and ultimately
answer the fundamental question: What problem(s) are they trying to solve with the
potential system?
The term ‘microgrid’ connotes a variety of related concepts, all involving distributed
generation resources. The DOE defines a microgrid as:
“. . . a group of interconnected loads and distributed energy resources within
clearly defined electrical boundaries that act as a single controllable entity
with respect to the grid, and that can connect and disconnect from the grid to
enable it to operate in both grid-connected and ‘island’ mode.” These systems

CHP-ENABLED RENEWABLE ENERGY MICROGRIDS IN PENNSYLVANIA
7 | P a g e
are meant to “… be operated in a controlled, coordinated way either while
connected to the main power network or while islanded5.”
A 2015 report released by the Lawrence Berkeley National Laboratory defines a
microgrid for a given application:
“By introducing on-site generation, storage, and bidirectional power flow,
microgrids can be seen as a valuable resource to the grid, while also being
more independent from it. This creates the settings for flexible operation
conditions, albeit at a cost: Microgrids are complex energy systems that
require specific infrastructure, resource coordination, and information flows,
as well as added protection and power quality assurance. Guaranteeing all of
these conditions can potentially jeopardize the economic viability of
microgrids, making it vital that design steps account for all different revenue
streams, both direct and indirect, that result from microgrid deployment6.”
The ability to readily operate in either a grid-tied or islanded (standalone) mode and
readily transition back and forth between those two modes distinguishes the vast
majority of existing interconnected loads and DERs from a true microgrid. Like the
centralized electric grid, microgrids generate, distribute and regulate the supply of
electricity, albeit on a local, small scale. The option to separate from the grid provides
a backup or emergency operation mode, as well as the opportunity for greater DER
investments and coordination.
Transforming a collection of standalone or grid-connected DERs into a functional
microgrid capable of automatically transitioning back and forth from grid-tied to islanded
operation requires a substantial increase in system complexity and therefore cost. These
costs result from several requirements dictated by the regional utility and state regulations
and typically include islanding detection, power quality and protection systems that are
not required for simpler system configurations. Fortunately, microgrids may facilitate
additional ‘value streams’ with the potential for income generation that may offset
increased costs and in some cases improve the economic viability of microgrid
development. Since every situation is unique, computer modeling tools have been
developed to assist in evaluating the economics of alternative proposed system
configurations.
Combining CHP electric and thermal energy generation with DERs results in a CHP
Enabled Renewables Microgrid (CHPERMG). The primary premise of the
CHPERMG assessment is that, due to the relatively low cost of electricity for most of the
PA and Mid-Atlantic sites, an on-site thermal demand component met by a system
integrated CHP subsystem is critical to establishing a cost effective microgrid with a
renewable energy subsystem.
If no significant thermal demand exists at the site, then the site is simply not a candidate
for CHPERMG technology implementation. But it could still be a site for a microgrid
5 Reference [8], p.4, citing https://building-microgrid.lbl.gov/microgrid-definitions 6 Reference [24], p.1

CHP-ENABLED RENEWABLE ENERGY MICROGRIDS IN PENNSYLVANIA
8 | P a g e
installation comprised of renewable solar photovoltaic electric generation and battery
storage.
Microgrids, Value Streams and Business Models of Microgrid Systems A number of emerging factors are driving the development of microgrids in
Pennsylvania. Distributed energy resources are rapidly dropping in price, broadening
their appeal to potential users. New resources, such as solar photovoltaic systems and
battery storage systems, may be combined with existing energy management systems (i.e.
building automation systems) and energy efficiency investments to create value and even
generate revenue during operation to partially offset the cost of a microgrid. More
frequent centralized grid disruptions, especially after storms and natural disasters, are
inducing some users of electricity to consider the value of resiliency, the ability to
continue to function when grid-supplied electricity is disrupted. Widespread availability
of Marcellus shale gas to fuel combined heat and power (CHP) generators can greatly
improve the economics of a microgrid system in scenarios where a well-defined thermal
load (i.e. steam and/or hot water) is present.
Potential owners of microgrids must balance a series of issues in order to arrive at an
economically feasible microgrid system. Long term decisions may be driven by the cost
and predictability of grid-tied electric and fuel costs, balanced against the capital and
operating expenses of creating an on-site microgrid system. The additional complexity of
microgrids often leads to increased investment costs, creating a barrier for widespread
adoption. These costs may result directly from specific needs for islanding detection,
protection systems and power quality assurance that would otherwise be avoided in
simpler system configurations. In the shorter term, the impact of microgrid construction
and operation on cash-flow must be balanced against the cash required to service the
financing of the system.
Operational needs such as requirements for critical system uptime and reductions in
downtime will also impact the decision to invest in an on-site microgrid. Some
downtime costs, such as lost product yield or power outages at a server farm from an
unpredicted power failure, are amenable to being quantified. Others, such as resilience of
critical municipal infrastructure (police and emergency services) are clearly important but
are difficult to quantify in an economic analysis.
Potential microgrid owners are encouraged to utilize the feasibility assessment process
and spreadsheet tool described in the ‘Conceiving and Assessing Feasibility of CHP-
Enabled Renewable Energy Microgrids’ section of the guide as a framework for
gathering information and exploring preliminary microgrid systems concepts for a site.
Once preliminary data has been gathered, users are encouraged to contact the Mid-
Atlantic Combined Heat and Power Technical Assistance program for further assistance7.
Value Streams and Revenue Sources Microgrid systems may generate revenue beyond the ‘simple’ sale of electricity by the
kilowatt-hour. Realizing these value streams depends on the system design, components,
7 http://machptap.org/

CHP-ENABLED RENEWABLE ENERGY MICROGRIDS IN PENNSYLVANIA
9 | P a g e
as well as state and regional utility level rules governing interaction with the regional
electric grid. Three broadly recognized ‘value streams’ that may be designed into
microgrids and can generate revenue are:
Export of on-site generation to the electricity grid;
Participation in ‘Demand Response’ ancillary services markets; and
Reduced or avoided costs derived from the ability to power critical operations due
to added resiliency against outages.
The generation and sale of electricity back to grid is perhaps the most readily understood
source of revenue generation from a renewable energy system or microgrid. The value of
exporting on-site power is at its greatest during periods of peak demand that stress the
regional grid, such as on the hottest and coldest days.
Demand response (DR) efforts occur when end-use consumers alter their electric
consumption patterns in response to changes in the market price of electricity over time,
or to incentive payments designed to induce lower electricity use at times of high
wholesale market prices or when system reliability is jeopardized8. This is done by
reducing energy consumption through load curtailment strategies such as ‘peak shaving’
(shifting non-critical energy consumption to different time periods), achievable by either
altering end-use loads directly or by taking advantage of on-site generation and storage
resources. Demand response strategies are typically implemented on the building scale
via building automation systems. Building scale systems typically participate in DR
programs via utility-run curtailment programs or by contracting with private curtailment
service providers (CSPs).
Other opportunities to generate revenue from a microgrid include participation in
ancillary services, especially frequency control provided by the battery storage
components of a renewable energy system. Conversely, standby tariffs assessed by the
regional utility can negatively affect the economics of a microgrid.
A benefit that results from the deployment of microgrids is the added reliability and
resilience to prolonged outages. Widespread grid disruptions from natural disasters such
as Hurricane Sandy in 2012 highlight the consideration of resiliency issues9. With their
potential to provide electric power and heat in the aftermath of such events, CHP-enabled
renewable microgrid systems can play a key role in protecting the public and provide
critical emergency services in the event of a prolonged grid outage10. Blumsack notes that
high reliability of delivered grid power can be achieved either through large scale
infrastructure investments or via increasing local resilience. CHP microgrids can provide
some resilience value to the regional grid, in some cases at a lower cost than
infrastructure hardening11.” At this time there is not yet a generally accepted method for
valuing resilience.
8 Typically, the highest prices for wholesale electricity occur in very hot and very cold weather. 9 https://www.princeton.edu/news/2014/10/23/two-years-after-hurricane-sandy-recognition-princetons-microgrid-still-
surges, October 23, 2014. 10 Reference [33] 11 Reference [1]

CHP-ENABLED RENEWABLE ENERGY MICROGRIDS IN PENNSYLVANIA
10 | P a g e
Business Models and Microgrids Currently, private ownership of a microgrid is structured in one of several ways,
depending on who owns and controls the microgrid and its component resources.
For small microgrid systems in Pennsylvania, the ‘Third-Party’ model describes systems
whose control resides with the end-user(s) and/or solution providers. The end-users may
own and operate the DERs and the distribution system, or contract to a third-party.
Today, most renewables and DER are deployed using structured finance, as outlined
within a Power Purchase Agreement (PPA). Funders generally comprise a mix of
traditional bank financing and private investors; in most PPAs, the equity partner is also
the system controller. The term of a typical commercial or utility-scale PPA is 20 years,
during which the Special Purpose Entity (SPE) owns the asset, and the asset host receives
reduced energy costs, subject to escalation and market price fluctuation. Typical SPE
investors meet ROI targets in less than 10 years, after which they capture 10+ years of net
revenues. A PPA’s expiration may result in the extension of a new term, a buyout, or the
removal of the equipment. The two main drivers in this model are perceived risk and tax
incentives; establishing municipal utilities as distributed asset owners mitigates both.
As markets develop, some third-party companies have begun to offer ‘microgrid as a
service’ products, providing design, engineering, procurement, construction, and
operations12. In this model, end-users pay a negotiated fee to utilize the microgrid, and
may host a microgrid and enjoy the benefits without having to invest capital or carry the
system on their balance sheets as a long-term asset and liability.
The smallest scale microgrid is at the individual building level, where the system might
primarily function to provide back-up power during temporary disruptions to the grid
from storms or natural disasters, allowing building residents to weather a storm, or a
manufacturing facility to avoid costly production losses from power disruptions.
The next step up in scale are ‘single-owner’ campus/community scale systems for
hospitals, retirement and health care facilities, university and institutional campuses,
which provide a measure of safety and resiliency for vulnerable building inhabitants.
At the scale of an office or industrial park, a microgrid can be a catalyst for economic
development, especially in grid constrained regions – providing power and thermal
energy for suitable tenants via long-term contracts that provide stable, predictable energy
costs. The Berks County Industrial Development Corporation case study described
below provides an example of a feasibility analysis of an opportunity at this scale.
There are approximately 35 municipal electric companies scattered across Pennsylvania
towns and boroughs. These municipalities are already in the business of selling
electricity and maintaining infrastructure for that purpose. Municipal electric company’s
business model relies on purchasing electricity in bulk, marking it up to pay for overhead
and other costs, and reselling it to end-users. Microgrids are making it possible to expand
municipal electric company’s business case to include generation and control of
12 Reference [3]

CHP-ENABLED RENEWABLE ENERGY MICROGRIDS IN PENNSYLVANIA
11 | P a g e
electricity, and thereby providing enhanced value and supporting long-term community-
specific goals like economic development.
Economics and Financing
Like any capital investment, potential owners and developers of microgrids need to
understand the economic and financial implications of proposed systems. Systems must
be financed by marketplace loans and paid for by savings and revenue generated by the
system over the term of the loans and beyond. Present and future costs of electricity and
fuel will vary unpredictably, in turn influencing the proportion of the system load served
by the microgrid vs. the utility grid.
Subsidies and Tax Credits The landscape for subsidies is quite fluid and microgrid developers should incorporate
the latest available information on subsidies, including the Federal Investment Tax
Credit, the Production Tax Credit, and the Pennsylvania Alternative Energy Portfolio
Standard13 (AEPS), as these factors strongly influence first costs of DERs. Federal and
State mandates, include emissions reduction targets and renewable portfolio standards
can significantly impact the cost of DERs; furthermore, unpredictable modifications to
these and other regulations can significantly impact the economics of microgrid
investments.
In Pennsylvania, AEPS Qualified Facilities are classified in two tiers. Tier I sources
include new and existing facilities that produce electricity from solar PV, solar thermal,
wind, low-impact hydro, geothermal, biomass, biologically derived methane gas, coal-
mine methane and fuel cell resources. Tier II sources include new and existing waste
coal, distributed generation (DG), demand-side management, large-scale hydro,
municipal solid waste, wood pulping and manufacturing byproducts, and integrated
gasification combined cycle (IGCC) coal facilities. Over the past ten years, solar
alternative energy credits have been consistently and significantly higher than Tier I
credits, and Tier I credits significantly higher than Tier II14. The value of each of these
types of credits varies considerably from year to year.
Critical Success Factors and De-Risking Fraga identified six critical factors in successful financing of microgrid projects:
1. Early, often collaboration and transparency among stakeholders
2. Technology that Solves the Customers’ Needs – Not an Experiment
3. Deliver a Strong & Measurable Customer Value Proposition
4. Achieve a Fair, Realistic and Sustainable Supplier and Investor Value Proposition
5. Develop a “Bankable” Project with strong Counterparty Contracts
6. Develop a “Risk Mitigated” Project
13 http://www.pennaeps.com/aboutaeps/ 14 http://www.pennaeps.com/reports/, section entitled ‘Pricing’

CHP-ENABLED RENEWABLE ENERGY MICROGRIDS IN PENNSYLVANIA
12 | P a g e
Cost-effective financing of a microgrid is essentially an exercise in managing and
decreasing project complexity and therefore risk. Figure 1 lists a number of complexity
factors that should be considered for their impact in financing a microgrid project15.
Microgrid systems generally require a
multitude of agreements between numerous
counterparties, including the multiple
electric and thermal loads on the system,
building energy management system(s),
solar, wind and combined heat and power
assets, energy storage (batteries), and
electric vehicles.
Fraga compiled a detailed list of
Contractual Agreements (Figure 3, below)
that are potentially applicable to a
microgrid system in the Commonwealth16.
Figure 2 (right) lists the abbreviations used
in Figure 3. The list of contractual
agreements is not meant to be exhaustive,
but certainly gives the reader a sense of the
contractual complexity of microgrid
projects.
15 See reference [10] 16 C. Fraga, Alternative Energy Development Group, personal communication, 20 June 2018.
Figure 1: Microgrid Complexity Factors
Figure 2: Abbreviations Used in Figure 3

CHP-ENABLED RENEWABLE ENERGY MICROGRIDS IN PENNSYLVANIA
13 | P a g e
Figure 3: Partial List of Counterparty Agreements Required for Typical Distributed Energy and Microgrid Systems
Agreement
CountAgreement Description Counterparty Counterparty
Site Leases / Licenses / Easements / Permits
1 Site lease - Solar PV System MCG Owner Site Owner
1 MOL - Solar System Lease MCG Owner Site Owner / Filed w County
1 SNDA - Mortgage Holders of Site upon which Solar System is installed MCG Owner Lender to Site Owner
1 Site lease - Battery Energy Storage System MCG Owner Site Owner
1 MOL - BESS System Lease MCG Owner Site Owner / Filed w County
1 SNDA - Mortgage Holders of Site upon which BESS System is installed MCG Owner Lender to Site Owner
1 Site lease - CHP system MCG Owner Site Owner
1 MOL - CHP Lease MCG Owner Site Owner / Filed w County
1 SNDA - Mortgage Holders of Site upon which CHP System is installed MCG Owner Site Owner
3 Easements/Licenses for MCG to be installed on 3rd party Property MCG Owner Site Owner(s)
4 Local AHJ Building / Electrical Permit (Construction of project) MCG Owner AHJ
Revenue Agreements with Microgrid Host Customers
3 Solar (Power Purchase Agreement) Host Customer #1, #2, #3 MCG Owner Host Customer #1, #2, #3
3 CHP (Toll Agreement) Host Customer #1, #2, #3 MCG Owner Host Customer #1, #2, #3
3 BESS (Revenue - Value Sharing agreement) Customer #1, #2, #3 MCG Owner Host Customer #1, #2, #3
1 Incentive Agreement for registering-selling Incentives generated by MCG MCG Owner Incentive Purchaser
Utility Interconnection Agreements
1 Interconnection Agreement - Solar PV MCG Owner Utility
1 Interconnection Agreement - CHP MCG Owner Utility
1 Interconnection Agreement - BESS MCG Owner Utility
Market Participant / Service Provider
1 RTO / ISO Service Provider Agreement MCG Owner Utility
Financing Agreements for the Microgrid Capital Stack
12 Construction lender Financing Agreement (12+ agreements) MCG Owner Bank/Lender
12 Bank Debt Financing Agreement (12+ agreements) MCG Owner Bank/Lender
12 Equity Financing Agreements (12+ agreements) MCG Owner Equity
12 Tax Equity Financing Agreements (12+) MCG Owner Tax Equity
Engineering, GC-EPC, O&M and Warranty Agreements
1 MCG Developer/Owner - Electrical Engineering Firm Services Agreement MCG Owner Engineering Firm
1 MCG Developer/Owner - Civil Engineering Firm Services Agreement MCG Owner Engineering Firm
1 Solar GC-EPC Agreement MCG Owner GC-EPC
1 Solar O&M Agreement (typically from GC-EPC) MCG Owner GC-EPC
1 Solar System Warranty & Performance Agreement (GC-EPC) MCG Owner GC-EPC
1 Solar Module Sale-Purchase Agreement MCG Owner Supplier
1 Solar Module Product Performance & Warranty Agreement MCG Owner Supplier
1 Solar Inverter Sale-Purchase Agreement MCG Owner Supplier
1 Solar Inverter Product Performance & Warranty Agreement MCG Owner Supplier
1 Solar Racking Sale Agreement MCG Owner Supplier
1 Solar Inverter Racking Performance & Warranty Agreement MCG Owner Supplier
1 Solar BOS Supply Agreement MCG Owner Supplier
1 Solar BOS Performance & Warranty Agreement MCG Owner Supplier
1 Solar DAS Supply Agreement MCG Owner Supplier
1 Solar DAS Performance & Warranty Agreement MCG Owner Supplier
1 CHP GC-EPC Agreement MCG Owner GC-EPC
1 CHP O&M Agreement (typically from GC-EPC) MCG Owner Supplier or GC-EPC
1 CHP System Warranty & Performance Agreement (GC-EPC) MCG Owner Supplier or GC-EPC
1 CHP Engine Sale-Purchase Agreement MCG Owner Supplier
1 CHP Engine Performance & Warranty Agreement MCG Owner Supplier
1 CHP BOS Supply Agreement MCG Owner Supplier
1 CHP BOS Performance & Warranty Agreement MCG Owner Supplier or GC-EPC
1 BESS GC-EPC Agreement MCG Owner GC-EPC
1 BESS O&M Agreement (typically from GC-EPC) MCG Owner Supplier
1 BESS System Warranty & Performance Agreement (GC-EPC) MCG Owner Supplier or GC-EPC
1 BESS Battery and Core Components Supply Agreement MCG Owner Supplier
1 Microgrid Controller Supplier Agreement MCG Owner Supplier
1 Microgrid Controller O&M and Performance Warranty Agreement MCG Owner Supplier or GC-EPC
1 Independent MCG Project Inspector (Project & Commissioning) Lenders/MCG Owner Inspection Firm
Insurance and Risk Mitigation
1 Performance & Payment Bond MCG GC-EPC
Host Customer(s), Site
Owner(s), MCG Owner
1 P&C Insurance Policy on Microgrid System MCG Owner Insurance Provider
1 GL Insurance Policy on Microgrid System MCG Owner Insurance Provider
1 Business Interruption Insurance Policy on Microgrid System MCG Owner Insurance Provider
110 Total (illustrative) agreements for a Microgrid Project

CHP-ENABLED RENEWABLE ENERGY MICROGRIDS IN PENNSYLVANIA
14 | P a g e
Financing As with any capital project, the project must be financeable with acceptable returns for all
stakeholders. In order for a project to achieve successful financing, customers, providers
and investors needs must be balanced and acceptable to each stakeholder.
Customers’ objectives are to maximize economic, strategic and tactical value, while
minimizing risks via warranties, operation and maintenance contracts, and utilization of
experienced developers, suppliers and contractors. Third-party system suppliers and
providers need to earn an adequate margin while providing the customer with a lifetime
of system value, while minimizing financial, technical and regulatory risks. Qualified
and experienced Third-Party development companies (such as Alternative Energy
Development Group in Berwyn, PA) can enable systems that otherwise are beyond the
financial resources of users.
The U.S. Dept. of Energy’s Better Buildings® website contains an online Financing
Navigator tool that helps potential non-residential energy efficiency and renewable
energy system owners to explore financing options. The Better Buildings Financing
Navigator Version 2.017 was recently introduced, updating the online tool designed to
connect users to the proven approaches and professional connections needed to finance
energy efficiency and renewable energy projects.
The Sustainable Energy Fund18 and similar regional funds in Pennsylvania provide
financing to established entities for energy efficiency and renewable energy products.
Modeling Tools
The previous sections discussed the issues that impact the feasibility of microgrids, the
challenges to developing them, and issues related to financing projects. Computer
models can assist a potential system owner to gather relevant information, analyze a
conceived system, and explore modifications to discover economically feasible systems.
Models can be used to explore various permutations and combinations of system
elements and sizes, and can guide system owners towards a microgrid configuration that
provides desired value and is also financeable. These economic modeling tools provide
potential system developers with the ability to quantify the projected economic impact of
specific system design elements, furthering the conversation and allowing users to
explore alternatives in order to push conceived systems toward economic viability.
Under the leadership of PI Jim Freihaut, the Penn State team has developed a spreadsheet
tool for use in evaluating CHP-Enabled Renewable Microgrid (CHPERMG) systems.
The tool is still under development and updated versions will be released over time.
Version 7 of the model, dated July 2018, was used to prepare the case study discussion
17 https://betterbuildingssolutioncenter.energy.gov/financing-navigator 18 https://thesef.org/index.php

CHP-ENABLED RENEWABLE ENERGY MICROGRIDS IN PENNSYLVANIA
15 | P a g e
below, and is available at no cost from Penn State investigators19. Several other useful
modeling resources are tabulated and briefly discussed in Appendix A.
Conceiving and Assessing Feasibility of CHP-Enabled Renewable
Energy Microgrids
This section describes a framework for identifying and evaluating a CHP Enabled
Renewables Microgrid opportunity. The methodology is used to gain an initial
understanding of the potential size and functions of a potential microgrid system and to
prepare a cost comparison with conventional grid supplied electricity and thermal energy
provided by conventional boilers. By utilizing the framework, the reader should be able
to knowledgably engage with stakeholders.
Assessing the potential for the application of CHPERMG to a site involves determining a
number of influencing site characteristics. The site characteristics addressed are:
site thermal demand;
site electric demand;
coincidence of the thermal and electric demands;
the local utility-provided electricity and natural gas costs;
thermal network connectivity of site thermal demand points;
wiring connectivity of site electric demand points;
the availability of areas for solar PV installation;
the public thoroughfares pattern among thermal and electric demand points;
the value of critical, point facility operations in the event of a macro grid outage.
An ideal CHPERMG site has:
a significant amount of thermal demand most of the 8760 hours of a year;
significant coincidental electric demand which is larger than the thermal demand;
expensive electric utility prices per kWh relative to natural gas prices;
a thermal distribution network or significant, stand-alone thermal demand point sites;
a radial electric distribution network or a single, electric energy source distribution
node;
appreciable available, site embedded or adjacent areas on which solar PV arrays can
be sited;
few public thoroughfare interruptions between the major site electrical and thermal
site demand points;
delineation of necessary critical facilities operational points and electric and thermal
demands.
Feasibility Assessment Methodology
To explore and evaluate the potential for a microgrid, a first step is to prepare an
inventory of existing assets and patterns of relevant energy usage, and to identify
19 ‘CHP Enabled Renewables Microgrid Feasibility v7.xlxs’ may be downloaded at https://navyyard.psu.edu/energy-
research/distributed-energy-and-smart-grids

CHP-ENABLED RENEWABLE ENERGY MICROGRIDS IN PENNSYLVANIA
16 | P a g e
potentially available sites for system placement. Reviewing the information compiled
during this process leads to dialog and discovery, where potential opportunities and
system goals are identified. One or several alternatives may be identified and further
evaluated. The goal is to arrive at a basis of design that can be refined and analyzed in
detail through discussion with stakeholders.
The flow chart shown in Figure 4 below summarizes the feasibility assessment process
modeled in the associated CHP Enabled Renewables Microgrid Feasibility spreadsheet.
Figure 4: Nine-step CHPERMG Feasibility Assessment Process
With the information collected from the Qualification and Site Data Surveys, one or more
conceptual designs can be evaluated.
The first step is to define the opportunity and problems to be solved, then determining the
sizes and elements that the system will need to incorporate into the microgrid in order to
realize the desired performance. The next step in this process is to then evaluate the
economics of the conceived system, utilizing one or more of the modeling tools described
in Appendix A. In practice, this is an iterative process – system variations are conceived,
modeled, and refined or eliminated based on the resulting impact on the economics and
financing of the project. Time invested exploring the impact of changing the values of
variables in the models can help guide system designers towards conversations and
proposed changes to the conceived system (i.e. addition or subtraction of components and
varying the sizes of units) in order to ultimately arrive at an economically viable project.
CHP-ENABLED RENEWABLE ENERGY MICROGRIDS IN PENNSYLVANIA
17 | P a g e
This step will normally be performed with the assistance of an experienced contractor,
consultant or developer. The Mid-Atlantic CHP-Technical Assistance Program (MA-
CHP-TAP), funded by the U.S. Dept. of Energy, provides such assistance, as do some
contractors and developers specializing in distributed energy systems.
At this time, there is not a simple, comprehensive modelling tool that incorporates both
CHP and renewable distributed energy systems. MA CHP-TAP Director Jim Freihaut is
currently attempting to establish a partnership with other parties including ProtoGen
Energy, Penn State’s Applied Research Laboratory, and the U.S. Dept. of Energy
National Renewable Energy Laboratory to combine several existing tools in order to
create a CHPERMG design tool. The tool would allow for the modeling of complex use
and business cases, yet be accessible to non-technical stakeholders.
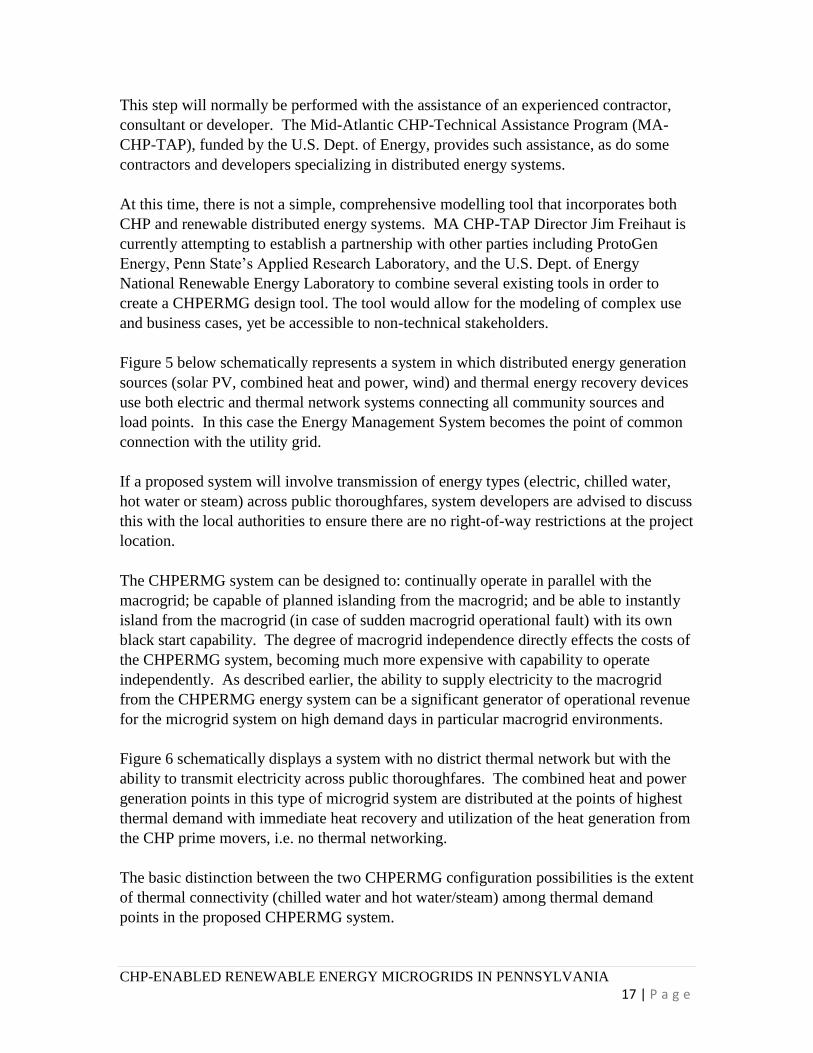
Figure 5 below schematically represents a system in which distributed energy generation
sources (solar PV, combined heat and power, wind) and thermal energy recovery devices
use both electric and thermal network systems connecting all community sources and
load points. In this case the Energy Management System becomes the point of common
connection with the utility grid.
If a proposed system will involve transmission of energy types (electric, chilled water,
hot water or steam) across public thoroughfares, system developers are advised to discuss
this with the local authorities to ensure there are no right-of-way restrictions at the project
location.
The CHPERMG system can be designed to: continually operate in parallel with the
macrogrid; be capable of planned islanding from the macrogrid; and be able to instantly
island from the macrogrid (in case of sudden macrogrid operational fault) with its own
black start capability. The degree of macrogrid independence directly effects the costs of
the CHPERMG system, becoming much more expensive with capability to operate
independently. As described earlier, the ability to supply electricity to the macrogrid
from the CHPERMG energy system can be a significant generator of operational revenue
for the microgrid system on high demand days in particular macrogrid environments.
Figure 6 schematically displays a system with no district thermal network but with the
ability to transmit electricity across public thoroughfares. The combined heat and power
generation points in this type of microgrid system are distributed at the points of highest
thermal demand with immediate heat recovery and utilization of the heat generation from
the CHP prime movers, i.e. no thermal networking.
The basic distinction between the two CHPERMG configuration possibilities is the extent
of thermal connectivity (chilled water and hot water/steam) among thermal demand
points in the proposed CHPERMG system.
CHP-ENABLED RENEWABLE ENERGY MICROGRIDS IN PENNSYLVANIA
18 | P a g e
Figure 5: Thermally Networked CHPERMG

CHP-ENABLED RENEWABLE ENERGY MICROGRIDS IN PENNSYLVANIA
19 | P a g e
Figure 6: Thermally Distributed CHPERMG

CHP-ENABLED RENEWABLE ENERGY MICROGRIDS IN PENNSYLVANIA
20 | P a g e
Spreadsheet Tool Inputs
The objective of this guide and associated CHP Enabled Renewables Microgrid
Feasibility spreadsheet tool is to determine the 1st order technical and economic
feasibility of a CHPERMG at a site.
Use of the spreadsheet begins with a site Microgrid Qualification Survey to assess the
type of CHPERMG configuration possible based on the general characteristics of the site
- microgrid with district thermal distribution network among point sites (Figure 5) versus
microgrid with CHP-based, point thermal utilization (Figure 6) if any. Table 1 below,
reproduced from the first tab of the spreadsheet, serves as a starting point for exploring a
potential microgrid opportunity. Table 1 contains site questions that should be
researched and answered as a first step when exploring a potential microgrid opportunity.
‘Go/No-Go’ questions are listed in bold type.
Users of this Guide are encouraged to invest the effort required to document the answers
to these questions for their opportunity. The resulting information, discussion and
contacts made during this process will assist the potential microgrid owner in identifying
stakeholders and in developing the assistance of consultants and contractors as the project
takes shape.
Thermal Demand Characterization
Are there constant and critical (must-be-supplied) electricity demands at the site?
Are there thermal energy demands most of the year (including hot water, steam,
chilled water) at the site which are time coincidental to the electric energy
demands?
Does your facility have an existing thermal distribution network to the major heating
and cooling demand sites?
If no district thermal network is available, are the specific thermal demands equal
to or greater than the electric demands?
Do you have access to natural gas?
Do you have access to on-site or nearby low cost fuel resources (i.e. landfill gas,
farm manure, food processing waste, etc.)?
Electric Demand Characterization
Are you concerned about power reliability? Is there a substantial financial impact to
your business if the power goes out for 1 hour? For 5 minutes?
Have you had a history of power brownouts, blackouts or equipment stressing voltage
fluctuations?
Is electricity delivered and metered from a single distribution point at your site?
Do you have multiple electricity delivery points and metering at your site?

CHP-ENABLED RENEWABLE ENERGY MICROGRIDS IN PENNSYLVANIA
21 | P a g e
Solar PV Space
Do you have significant roof area or land area that can be used for photovoltaic
solar array placement?
Existing Equipment Status
Do you expect to replace, upgrade, or retrofit central plant equipment within the next
3-5 years?
Do you anticipate a facility expansion or new construction project within the next 3-5
years?
Have you already implemented energy efficiency measures?
Critical Operations
Has your facility identified critical operations that must be maintained during a
macrogrid outage?
Do you currently have emergency backup equipment at these facilities?
Right of Way, Physical Distribution
Are there public thoroughfare (streets, alleys, etc.) between major thermal
demand points in your application area?
Are there public thoroughfare (streets, alleys, etc.) between major electrical
demand points in your application area?
Can local authorities (e.g. Municipal Authorities in Municipal Grid) determine
energy distribution right-of-way issues?
Sustainability & Environmental Drivers
Are you interested in reducing your facility's impact on the environment?
Does your site (plant, community, building complex) have any specific environmental
targets or goals?
Are there Statewide or Utility Incentive Programs for Distributed Energy,
Sustainability or Carbon Footprint Reduction?
Table 1. Microgrid Opportunity Qualification Survey
The primary premise of the CHPERMG assessment is that due to the relatively low cost
of electricity for most of the PA and Mid-Atlantic sites, a site thermal demand component
met by a system integrated CHP subsystem is essential to establishing a cost effective
microgrid with a renewable energy subsystem. Negative replies to any of the questions
in bold could indicate that the site is not suitable for a CHP-Enabled Renewable
Microgrid. If no significant thermal demand exists at a proposed site, then the site is
simply not a candidate for a CHPERMG implementation. The opportunity could still be
a site for a solar PV + Battery Storage only distributed energy microgrid implementation.
If that is the situation, site configuration programs described in Appendix A are available
to assist in feasibility assessment. The reader is referred to Appendix A for short
descriptions and access information for these models.

CHP-ENABLED RENEWABLE ENERGY MICROGRIDS IN PENNSYLVANIA
22 | P a g e
The Qualification Survey is then followed by the Site Survey sheet which calls for site
thermal and electrical demand or expected usage data, annual operating hours of each
energy demand type, site macrogrid utility electricity and utility-supplied natural gas
energy costs, thermal quality (temperature (T) and pressure (P) of hot water or steam
required), point cooling demands within the site.
The next step in the process gathers Site Information that define the magnitude of the
existing electrical and thermal heating and cooling loads present at the site, as well as
future anticipated loads (Tables 2 through 4).
Table 2: Site Information and Projected Electrical Loads Form
Annual Usage (kWh)
Operating hours per year
A
Annual Electricity Costs
Average Electricity Price $/kWh
Does Facility Have Use for Standby Power in the event of a utility failure? Back up 69 KV lines
If Yes, what is the approximate load to be served by the Microgrid system in a utility failure?
State / Province:
Primary ContactContact Name:
Facility Name
Contact Name:
Project Location
Technical Contact
Phone No.:
Email Address: Fax No.:
Servicing Utility
Type of Industrial
City:
Site Questionnaire - Microgrid Qualification
Phone No.:
Email Address: Fax No.:
General
Electrical Loads
Peak Load (kW)
Facility Use
Motivation for Mirogrid
Avg Mo. Usage (kWh)
Est Average (kW)
Base Load (kW)
Backup Combustion Genset? If yes, What size?
Service Size (Amps)

CHP-ENABLED RENEWABLE ENERGY MICROGRIDS IN PENNSYLVANIA
23 | P a g e
Table 3: Site Information - Projected Thermal Cooling Load Form
Table 4: Site Information - Projected Thermal Heating Load Form
Thermal Load - Cooling
Length of Average Cooling Season (months)
Is there an existing chilled water loop?
Please list cooling sources separately:
Type Rejection Type Size (Specify Untis) Use COP or kWh/Ton
Estimated Average Cooling Load Tons
Thermal Load - Heating
Annual Fuel Costs
Average Fuel Price $/MMBtu
Type Fuel/Energy Source Use Efficiency %
If Steam is the primary thermal medium, please complete the following section:
Please use additonal sheet for multiple systems/boilers
Size (Specify Units)
Primary Steam System Average Minimum
Please list heating sources separately:
Is there Natural Gas to the Site? What Pressure? 110 psi
Steam Production (lbs/hour)
Pressure of Steam (psig)
Temp of Steam or Enthalpy
City Makeup (gal/hour)
City Makeup Temp (F)
Condensate Return (lbs/hr)
Condensate Return Temp (F)

CHP-ENABLED RENEWABLE ENERGY MICROGRIDS IN PENNSYLVANIA
24 | P a g e
The subsequent ‘output’ sheets of the workbook enable the user to assess the feasibility
of implementing the hybrid (CHP, PV, battery storage) microgrid technology at a
potential site.
CHP ‘prime mover’ engine selection is done in the CHPERMG Screening calculation
worksheet. Using data from the Site Survey inputs, this sheet determines the type of
prime mover to be selected (GT = Gas Turbine, RE = Reciprocating Engine). The size of
the engine is based on aggregated thermal demand characteristics of the site. There is a
constraint that the average electric output of the average engine cannot exceed the
average electrical demand of the site. This constraint is based on the assumption that the
economic feasibility of the CHPERMG in Pennsylvania and the entire Mid-Atlantic
regions depends on a ‘thermal first’, that is, optimal thermal-demand-driven hybrid
configuration.
The CHP engine technology is selected to meet the largest fraction of the site thermal
load demands with minimal thermal dumping and no over production of electricity during
normal operations at the site. Another constraint on the engine is that its normal operating
state is less than design, full load electrical output. The tool sizes the generator to operate
in the ‘flat efficiency’ range of the engine output profile, normally around 60% to 70% of
rated electrical output operation.
If the site is a thermally networked microgrid based district energy system, then
installation of a thermal distribution piping system will be required if one is not already
available. Depending on the separation distance between the major thermal demand
points, this installation could add significant first costs to the system implementation and,
consequently, significantly impact ROI calculations.
Once the engine is selected, the residual electrical site demands (total site demand – CHP
electrical output) are met by a combination of solar PV and fast response (Li-ion) battery
storage components during solar availability times. Normally, non-solar irradiance times
(evenings and nights), are coincident with decreased site electrical demands. At these
times, the engine output is increased to compensate for decreased solar PV output as
needed. The fast acting battery system simply responds to rapid internal load transients, if
any, during these times. If the thermal demand sized engine + fast response battery bank
combination is insufficient to meet unexpected internal demands, then either grid
provided electricity makes up the difference, or internal demand is curtailed as necessary
according to pre-defined site priorities.
The fast acting battery sizing is based on a combination of random, but anticipated, rapid
solar array output decreases due to transient cloud cover and/or rapid increases in
occupant-activated, internal electrical demand due to activation of power intensive
equipment or subsystems (e.g. lighting, chiller, large motor startup). Solar irradiance
fluctuations combined with rapid internal demand fluctuations can be of the order of tens
of kw/sec and last for several to tens of seconds. Engine ramp speeds are slower, on the

CHP-ENABLED RENEWABLE ENERGY MICROGRIDS IN PENNSYLVANIA
25 | P a g e
order of kw/sec, therefore the fast battery bank makes up the difference until the
generator can spin up to supply the required output.
The lead-acid battery storage bank sizing is determined by the degrees of grid
independence and expected demand call ancillary service participation desired relative to
the difference in maximum engine electrical output and PV array output during normal
operation.
The electric demand operational response dynamics are illustrated in Figure 7 below.
Note the “Time Units” can vary from very short times - seconds to tens of seconds for
solar output transients or rapid internal demand changes - to minutes or even hours
depending on the use of slower lead-acid capacity battery storage system to allow
macrogrid independence or demand response ancillary services participation.
Figure 7: Time Based plot Displaying CHPERMG Combined Generation/Storage
Operation
The economics of a given system configuration is estimated on the Site Comparisons
worksheet. Typical costs for the components in both the conventional and CHPERMG
systems are provided in the Resources and References section at the end of the guide20.
First order estimated capital investment costs are the sum of the following component
costs:
CHP engine + heat recovery unit + thermal network piping installation + PV
array with inverter + Li-ion battery back + optional lead-acid battery bank.
20 See: references [29], [30], [32], and [35]

CHP-ENABLED RENEWABLE ENERGY MICROGRIDS IN PENNSYLVANIA
26 | P a g e
The annual savings from the CHPERMG is the difference between annual operation and
maintenance costs of the CHPERMG system plus revenue generated, and the operation
and maintenance costs of ‘conventional’ separate electric power (utility/macrogrid
provided electricity) and thermal systems (e.g. onsite boilers for process and space
heating demands).
The simple payback (years) is the CHPERMG first costs divided by the annual savings
(including any revenue generated via demand response and/or frequency regulation).
Annual carbon savings are calculated as the difference between the CHPERMG
associated annual CO2 emissions, and the CO2 associated with the conventional, separate
configuration using the local macrogrid generation mix and on-site boiler produced CO2.
The framework described above can assist users to conceive a preliminary microgrid
system concept and estimate economic feasibility. Once a feasible system design is
determined, users will prepare more refined system concepts and financial models
incorporating site specific equipment, operating data, and projected revenue streams from
the system. Computer models such as HybridFAST, described in Appendix A, can be
used to prepare cash flow projections for distributed energy systems. The next version of
HybridFAST is planned to incorporate the evaluation of CHP thermal and electric
generation.
Existing publications and resources provide potential microgrid owners and users with
discussion, checklists and guidance on the system procurement process21.
21 See: References [31] & [34].

CHP-ENABLED RENEWABLE ENERGY MICROGRIDS IN PENNSYLVANIA
27 | P a g e
Case Study Example – Berks County Industrial/Commercial Park
The following narrative discussion provides an example of the feasibility process
discussed above for a potential industrial park opportunity in Berks County. Using the
data collected using the general site assessment process shown in Figure 4, the energy
demands of the site are estimated. CHP system size ‘first cost’ relationships,
photovoltaic system and battery storage first costs and estimated electric and natural gas
energy prices for the site are also estimated.
Figure 8 displays an aerial view of a site proposed for a potential industrial/commercial
park employing CHPMERG outside of Reading, PA near the existing Reading Airport.
Figure 8: Proposed Industrial/Commercial Site Layout for Proposed CHPERMG
The site exists at a location where delivery of electric power from the regional utility
electric grid is constrained to approximately 3 MW of power to the site. However, there
is ample availability of utility delivered natural gas from two different pipelines operating
close to the proposed site. Any utility substation construction (estimated to be of in the
millions of dollars) to bring more power into the site would be allocated to the electricity
prices at the site. This provides a significant indirect rationale for using a CHPERMG
approach for the industrial park design.
The example site is a largely undeveloped brownfield site that is envisioned by county
economic development advocates to become an industrial park. A mix of facility types
proposed for the site includes small manufacturing, commercial services, food processing
metal fabrication, chemical manufacturing, pharmaceutical production, plastic molding
and warehousing. It is assumed here that a thermal distribution network will be installed.

CHP-ENABLED RENEWABLE ENERGY MICROGRIDS IN PENNSYLVANIA
28 | P a g e
In this case, many of the Opportunity Qualification questions in Table 5 reflect the
desired mix of potential tenants that the park proposes to recruit to the site. A basic
premise of the proposed system is to provide predictable long-term thermal and electric
energy costs at the site, which could be leveraged to attract businesses with matching
energy consumption profiles to locate at the site.
Table 5: Microgrid Opportunity Qualification data for
Proposed Industrial/Commercial Site
The site total electrical and thermal demand characteristics determined from the expected
demands of similar facilities in the Mid-Atlantic region are shown in Tables 6 and 7
below. In the initial site evaluation, the site did not have any significant thermal cooling
loads. To minimize thermal distribution piping sizes with length-of-run, the CHP
generation source(s) would be positioned near or at the facilities of greatest thermal
demand – examples of these facilities include metals fabrication, chemical
manufacturing, pharmaceutical production and plastics modeling. In the northwest corner
of the site there is approximately 3.0 acres of unallocated land that could be allocated to
solar PV electric production and battery storage.
Table 8 shows a summary of the total estimated electric and thermal energy demands for
the proposed system, prepared using estimated hour by hour calculations.
Opportunity Qualification Questions
Are you concerned about the impact of current or future energy costs on your business? YES
Are you concerned about power reliability? Is there a substantial financial impact to your business if the power goes out for 1 hour? For 5 minutes?
Have you had a history of problems with blackouts?
Yes, potential for reactor venting if power is lost. Result is air and water polution and reactor clean out cost.
Do you have thermal loads throughout most of the year (including steam, hot water, chilled water, hot air, etc.)? YES
Does your facility have an existing central heating or cooling plant? YES
Do you expect to replace, upgrade, or retrofit central plant equipment within the next 3-5 years?
Steam plant - YES. Also revising the use of equipment around the site including some new.
Do you anticipate a facility expansion or new construction project within the next 3-5 years?
YES
Have you already implemented energy efficiency measures and still have high energy costs?
In the process of studying potential save energy and other cost that will result from the AES shutdown.
Are you interested in reducing your facility's impact on the environment? Does your plant have any specific environmental targets or goals?
Depends on how this fits in with other needs. With AES out of our waste water stream we know effluent changes will be necessary.
Do you have access to on-site or nearby low cost fuel resources (i.e. landfill gas, farm manure, food processing waste, etc.)? NO

CHP-ENABLED RENEWABLE ENERGY MICROGRIDS IN PENNSYLVANIA
29 | P a g e
Table 6: Projected Electrical Loads for Proposed Industrial/Commercial Site
Table 7: Projected Thermal Loads for Proposed Industrial/Commercial Site
(note: in this example the site did not have projected cooling loads)
Annual Usage (kWh)
A
Annual Electricity Costs
Average Electricity Price $/kWh
Does Facility Have Use for Standby Power in the event of a utility failure? Back up 69 KV lines
If Yes, what is the approximate load to be served by the CHP system in a utility failure?
Servicing Utility
8500
Duequesne Lighting
Electrical Loads
Peak Load (kW) 10000
8500
3720000
0.054
Avg Mo. Usage (kWh)
Est Average (kW)
Base Load (kW)
750,00,000
Existing Genset? If yes, What size?
6250000
Service Size (Amps) 2700
Thermal Load - Heating
Annual Fuel Costs
Average Fuel Price $/MMBtu
Type Fuel/Energy Source Use Efficiency %
If Steam is the primary thermal medium, please complete the following section:
Please use additonal sheet for multiple systems/boilers
Condensate Return Temp (F)
5.19
City Makeup Temp (F)
Condensate Return (lbs/hr) 0 0
Temp of Steam or Enthalpy 1150 1050
City Makeup (gal/hour)
Steam Production (lbs/hour) 30000 7000
Pressure of Steam (psig) 140 100
Please list heating sources separately:
Is there Natural Gas to the Site? What Pressure? 110 psi
Primary Steam System Average Minimum
Size (Specify Units)
20%30 MMBTU

CHP-ENABLED RENEWABLE ENERGY MICROGRIDS IN PENNSYLVANIA
30 | P a g e
Total Estimated Demands for Proposed Industrial/Commercial Site
Electric (kW)
Thermal
(MMBTU/hr)
Thermal
(kW)
Thermal/Electric
Demand Ratio (-)
Average: 4,320.3 15.9 4,648.8 1.08
Maximum: 9,013.6 68.5 20,085.1 2.23
Minimum: 1,559.5 5.0 1,473.7 0.94
STD Dev. 1,560.3 10.9 3,204.8 0.60
Table 8: Projected Total Electric and Thermal Demands for Proposed
Industrial/Commercial Site
Table 8 shows a summary of the total estimated electric and thermal energy demands for
the proposed system, prepared using estimated hour by hour calculations.
Using hour by hour site demand data, if available, gives a better picture of the actual time
at various demand levels, as shown in Figures 9 and 10 below. Generally, historical time
dependent electricity demand data is available from ‘smart’ utility meters, whereas
natural gas (thermal) demand data is typically estimated from monthly natural gas utility
bills. If such detailed energy usages are not available, the quick assessment can be done
on average data.
Figure 9: Distribution of Electric Demand Hours.
Approximately 90% of Demand is < 6 MW

CHP-ENABLED RENEWABLE ENERGY MICROGRIDS IN PENNSYLVANIA
31 | P a g e
Figure 10: Distribution of Thermal Demand Hours.
Approximately 90% of Demand < 10 MW
Following the methodology, the engine and heat recovery system would be sized to meet
the estimated 10 MW thermal demand, which in turn determines the peak electrical
output that would be available from the engine. The estimated average thermal-to-
electrical ratio of 1.67 for this scenario is easily met by a gas turbine engine for any
quality of heat required22 and is approachable by a reciprocating engine23.
A reciprocating engine or a gas turbine that operates at full load of 6 MW can operate
efficiently down to ~3.5 MW. For the feasibility assessment, a renewable energy system
consisting of a 1 MW solar PV array mated with 1 MWh battery storage system is
evaluated. This combination would provide several critical functions: solar ‘smoothing’
(as clouds temporarily shade the array), the ability to meet rapid tenant electric demand
increases, and the ability of the CHPERMG to respond to demand-response calls on high
electric demand days. This simultaneously allows for the greatest possible reduction in
operational carbon footprint and macrogrid electric energy purchases.
22 Heat ‘quality’ is proportional to temperature. High quality heat means high temperature heat. 23 Assuming the generator converts natural gas fuel to electricity with ~30% efficiency, a generator rated at 6 MW
would also produce approximately 20 MW of ‘waste’ thermal energy. However, only a fraction of the waste heat can
be economically recovered (the higher the desired temperature of the waste heat recovered, the lower the fraction that
can be recovered economically). In the example, the assumption is that half (10MW) of the waste heat can be
economically recovered for use.
CHP-ENABLED RENEWABLE ENERGY MICROGRIDS IN PENNSYLVANIA
32 | P a g e
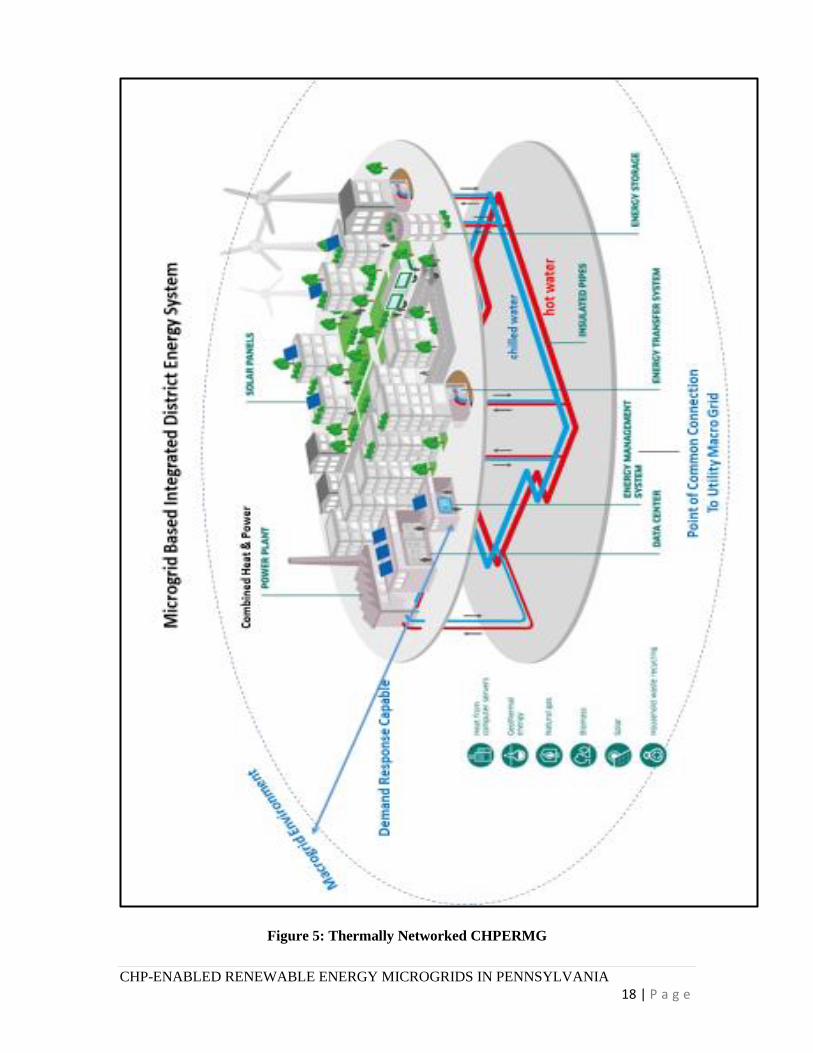
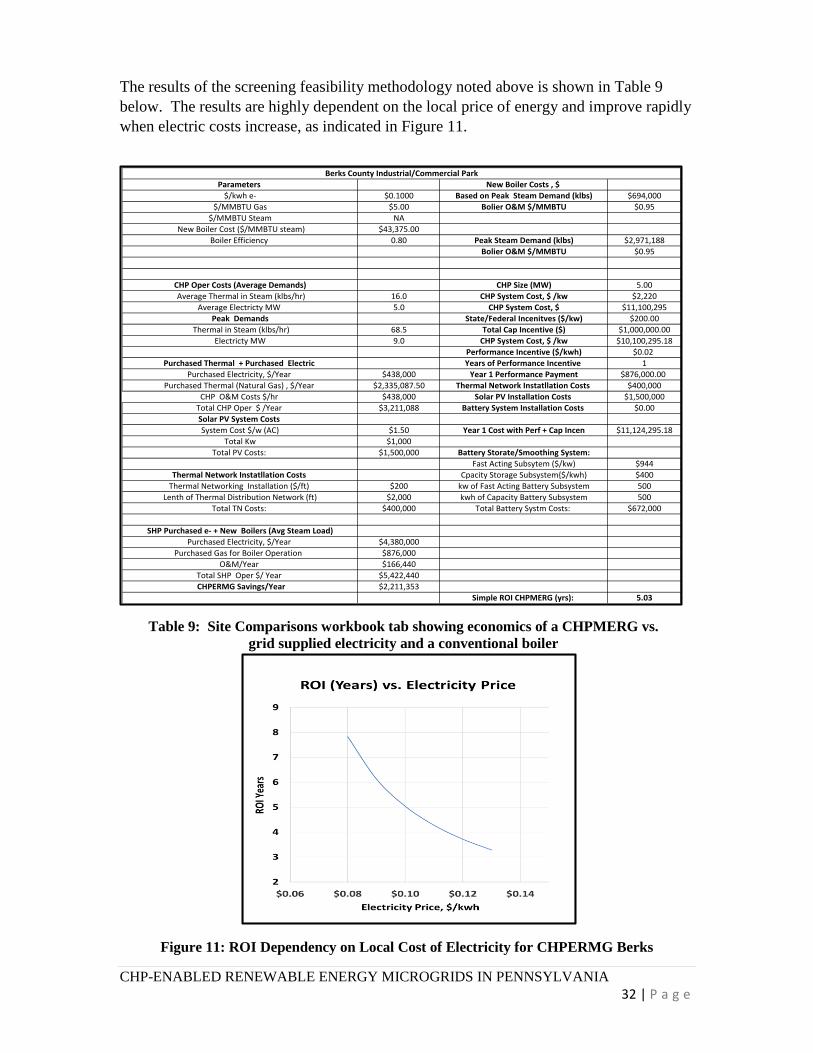
The results of the screening feasibility methodology noted above is shown in Table 9
below. The results are highly dependent on the local price of energy and improve rapidly
when electric costs increase, as indicated in Figure 11.
Figure 11: ROI Dependency on Local Cost of Electricity for CHPERMG Berks
Parameters New Boiler Costs , $
$/kwh e- $0.1000 Based on Peak Steam Demand (klbs) $694,000
$/MMBTU Gas $5.00 Bolier O&M $/MMBTU $0.95
$/MMBTU Steam NA
New Boiler Cost ($/MMBTU steam) $43,375.00
Boiler Efficiency 0.80 Peak Steam Demand (klbs) $2,971,188
Bolier O&M $/MMBTU $0.95
CHP Oper Costs (Average Demands) CHP Size (MW) 5.00
Average Thermal in Steam (klbs/hr) 16.0 CHP System Cost, $ /kw $2,220
Average Electricty MW 5.0 CHP System Cost, $ $11,100,295
Peak Demands State/Federal Incenitves ($/kw) $200.00
Thermal in Steam (klbs/hr) 68.5 Total Cap Incentive ($) $1,000,000.00
Electricty MW 9.0 CHP System Cost, $ /kw $10,100,295.18
Performance Incentive ($/kwh) $0.02
Purchased Thermal + Purchased Electric Years of Performance Incentive 1
Purchased Electricity, $/Year $438,000 Year 1 Performance Payment $876,000.00
Purchased Thermal (Natural Gas) , $/Year $2,335,087.50 Thermal Network Instatllation Costs $400,000
CHP O&M Costs $/hr $438,000 Solar PV Installation Costs $1,500,000
Total CHP Oper $ /Year $3,211,088 Battery System Installation Costs $0.00
Solar PV System Costs
System Cost $/w (AC) $1.50 Year 1 Cost with Perf + Cap Incen $11,124,295.18
Total Kw $1,000
Total PV Costs: $1,500,000 Battery Storate/Smoothing System:
Fast Acting Subsytem ($/kw) $944
Thermal Network Instatllation Costs Cpacity Storage Subsystem{$/kwh) $400
Thermal Networking Installation ($/ft) $200 kw of Fast Acting Battery Subsystem 500
Lenth of Thermal Distribution Network (ft) $2,000 kwh of Capacity Battery Subsystem 500
Total TN Costs: $400,000 Total Battery Systm Costs: $672,000
SHP Purchased e- + New Boilers (Avg Steam Load)
Purchased Electricity, $/Year $4,380,000
Purchased Gas for Boiler Operation $876,000
O&M/Year $166,440
Total SHP Oper $/ Year $5,422,440
CHPERMG Savings/Year $2,211,353
Simple ROI CHPMERG (yrs): 5.03
Berks County Industrial/Commercial Park
Table 9: Site Comparisons workbook tab showing economics of a CHPMERG vs.
grid supplied electricity and a conventional boiler

CHP-ENABLED RENEWABLE ENERGY MICROGRIDS IN PENNSYLVANIA
33 | P a g e
The screening indicates this site is likely feasible for installation of a CHPMERG system
at current electric costs of $0.10/kWh, provided a nominal payback of about 5 years is
acceptable. Modest increases in electricity prices substantially improve the economics of
the microgrid system.
This ROI may be an acceptable hurdle for businesses and entities with long-term a
business horizon and a business goal of obtaining predictable long-term energy costs,
such as industrial parks, hospitals, retirement communities, university campuses or
municipal electric providers. If this is the case, the opportunity could proceed to more
detailed engineering and economic analyses.
Municipal Scale Microgrids At a larger scale than an industrial park, several municipalities in Pennsylvania are
actively exploring the development of municipal scale microgrids. To our knowledge,
these projects have not yet progressed to the stage where publicly available data exists for
a cost-benefit discussion. The discussion below is not a Case Study per se, but rather a
vision of how municipal scale DERs and microgrids might occur in the near future.
The City of Pittsburgh has been exploring the combination of upgrading existing, legacy
district energy systems with on-site electricity generation. The goals for this ‘grid of
microgrids’ development is to provide for grid resiliency as well as long-term carbon
emissions reduction24.
At a smaller scale, there are 35 communities in PA whose municipal electric utilities
derive revenue through the retail sale of electricity which they have purchased at
wholesale25. The proceeds from this transaction are then transferred into the general fund,
where they are used for any number of municipal purposes. Thus, development of
distributed energy generation or storage assets such as those in a microgrid must be
balanced against their impact on the budget: is the investment budget-neutral? How long
until it is paid off? Is the municipality willing or able to absorb any of the capital cost or
debt service? How might electric rates be impacted?
The investment must also be aligned with the municipality’s current supplier contracts.
These supplier contracts vary but can generally be thought of as either “all-in” or “a la
carte.” All-in supplier contracts guarantee delivery of electricity to the substation 24
hours by seven days a week and may limit or prohibit the sourcing of electricity from
other means. “A la carte” contracts provide for delivery of blocks of total hourly
electricity; these can be aggregated from the market or strategic investments in offsite
generation such as wind and hydro. Choices are governed by a balance of risk and
opportunities.
Scale and reliability are two distinct advantages of the municipal DER model. By
constructing solar-assisted storage assets of sufficient size and quality, municipal utilities
24 Reference [24] 25 Wright, K., Mackey, A. and Tenney, L., ‘Municipal Basis of Business’, ProtoGen Energy LLC, August 2, 2018,
private communication.

CHP-ENABLED RENEWABLE ENERGY MICROGRIDS IN PENNSYLVANIA
34 | P a g e
will be able to deepen their partnerships with Regional Transmission Organizations
(RTOs) and gain entrance to previously inaccessible wholesale energy markets.
Enhanced participation in these markets will contribute to greater reliability and lower
variability on the larger grid. Furthermore, it will also create significant streams of
revenue that will offset the cost of investment. Once the municipality takes possession of
the asset (approximately 7-10 years, as modeled), it will have established recurring
revenue streams that can be used for further investments to benefit the community.
There are two basic ways a municipal electric utility can develop a microgrid: self-
financing and partnering with a third-party. Self-financing results in the greatest level of
benefits control, but requires a higher level of participation, consumer knowledge and
construction risk (which this guide endeavors to provide). Third-party partnership
requires less participation and knowledge and limits the municipality’s risk in exchange
for a substantial share of the project benefits. There are other financial drivers such as the
ability to monetize tax equities that create variations between these two basic models;
these drivers should be explored.
For municipalities evaluating microgrid development, the go/no-go decision would be
based on a comparison study of business as usual (i.e. buying in bulk) with alternatives
represented by the assumption of debt associated with system ownership, or an off-
balance sheet relationship with a ‘third-party’ partner. The Net Present Values26 (NPV) of
each option would be explored over several intervals (e.g. 5, 10 and 20-year periods).
An optimal study outcome would be that the equipment assets generate sufficient revenue
to service their own debt and remain budget-neutral to positive. Municipal utilities and
entities with similar organizational structures are in the business of owning and
maintaining electrical infrastructure assets and are therefore likely to be open to exploring
development with the intention of owning the microgrid equipment.
A second possible study outcome is that the investment would have a neutral to negative
impact on the budget. In this case, metrics could be developed to inform future
community decisions to reconsider the investment once a specified value or combination
of values is reached, and the project economics become viable. Such metrics might
include threshold wholesale or retail electricity prices, or threshold distributed generation
and energy storage system costs.
The third possible outcome is that a municipal utility chooses to work with a third-party
developer. While this arrangement would be very unlikely to result in a more favorable
NPV than self-financing, it would result in a combination of zero upfront cost, immediate
savings, and increased resilience options for a portion of the whole electric load (e.g. for
police, fire and critical/emergency services). This model typically offers a buyout option
at different time intervals; if not exercised, ownership would default to the municipality
after a longer term, often 20 years; the municipality could also elect to have the
equipment removed and site restored at the third party’s expense. The bounds of third-
26 NPV equals the sum of all future cash flows, positive and negative, over the entire life of the investment, discounted
to the present.
CHP-ENABLED RENEWABLE ENERGY MICROGRIDS IN PENNSYLVANIA
35 | P a g e
party ownership in terms of contract length and structure will continue to develop and
change27.
Conclusions Microgrids incorporating distributed energy assets at the point of energy consumption
can provide significant value to system owners, consumers and society at large. The
source of this value is the increased efficiency, and therefore decreased operating costs,
of distributed energy assets collocated at or near the point of consumption. Microgrid
component and system costs have been dropping in response to market forces, and are
expected to continue to do so as more systems are installed (most notably solar
photovoltaic costs have dropped far more quickly than predicted ten years ago).
Pros and cons of owner operated and third-party supplier business models are discussed.
A microgrid can provide relatively predictable costs to supply electricity and thermal
energy, compared to utility provided electricity and conventional fossil-fuel boilers.
The economics of CHP-Enabled Renewable Energy Microgrids is most favorable for
sites with relatively well-defined thermal loads. A nine Step process for evaluating
potential microgrid applications is presented. A case study example of a proposed
industrial park is discussed. Considerations for municipal scale microgrids are also
discussed.
Potential microgrid owners are encouraged to utilize the ‘CHP Enabled Renewables
Microgrid Feasibility v7.xlxs’ spreadsheet tool described in the Modeling Tools section
of the guide as a framework for gathering information and exploring preliminary
microgrid systems concepts.
Readers are invited to contact the Mid-Atlantic Combined Heat and Power Technical
Assistance program, directed by Professor Jim Freihaut, Ph.D. at Penn State, for further
assistance at: machptap.org
27 For example, these contract terms are a significant topic within the NYREV program.
CHP-ENABLED RENEWABLE ENERGY MICROGRIDS IN PENNSYLVANIA
36 | P a g e
Appendix A. Additional DER Modeling Tools
HybridFAST. This program, written in Microsoft Excel, is a free financial analysis tool
developed by Quakertown electrical contractor ProtoGen Energy28. ProtoGen Energy’s
website describes the program:
“HybridFAST was created as an internal tool for facilitating conversations around
the financial implications of grid-interactive photovoltaic (PV) systems, battery
energy storage systems (BESS), and hybrid systems utilizing both... HybridFAST
is made available for free under a Creative Commons license... ProtoGen Energy
created the tool to facilitate conversations about the future of our electrical grid…
This tool is meant to organize, unify, and enrich those conversations by providing
a framework that enables stakeholders to explore new revenue stacks for
distributed energy resources (DER) collaboratively, and with intention.”
As of this writing (July 2018), the HybridFAST model does not include the analysis of a
CHP component of a proposed microgrid system. Penn State and ProtoGen Energy are
currently discussing the addition of a CHP component to future versions of the tool.
HOMER. HOMER (Hybrid Optimization of Multiple Energy Resources) was developed
at NREL as a tool for decision making in the microgrid and distributed energy resource
(DER) space. HOMER combines engineering and economics into one powerful model,
allowing users to easily determine least-cost options. Considerable technical expertise is
required to utilize the program. Commercial versions of the program are sold and
supported by HOMER Energy LLC29.
DERCAM. DERCAM (Decision Support Tool for Decentralized Energy Systems)30 is
an economic optimization model designed to optimize energy supply solutions, and
optimize dispatch of existing energy supply technologies, for buildings and microgrids.
Users can program the model to:
Find most cost-effective mix of generation and storage + dispatch that minimizes
costs / CO2 emissions
Decisions consider load management options such as load shifting, load scheduling,
load shedding
Constrains force energy balance and technology behavior
Considerable technical expertise is required to utilize the program. One ‘branch’ of the
model accepts the input of hourly load profiles of representative day-types. The program
can then find optimal investment decisions for a representative year or up to a 20-year
investment timeline. The other ‘branch’ works in high resolution time steps (1 minute to
1 hour) to find optimal dispatch of local energy sources on a week-ahead basis, using
existing loads and weather forecasts to forecast loads. This data can in turn be input to a
Building Management System or SCADA.
28 http://protogenenergy.com/hybridfast/ 29 https://www.homerenergy.com/index.html 30 https://building-microgrid.lbl.gov/projects/der-cam

CHP-ENABLED RENEWABLE ENERGY MICROGRIDS IN PENNSYLVANIA
37 | P a g e
Appendix B: Penn State University’s Microgrid Testbed at The
Navy Yard
Penn State at The Navy Yard in Philadelphia is pleased to announce that installation of a
small electric microgrid in Building 7R is nearing completion. The system was funded
by multiple sources, including funding provided by PA Dept. of Environmental
Protection, funds from the U.S. Department of Energy, the Penn State Office of the Vice
President of Research, and generous donations from PECO/Exelon.
This system is one initiative that reflects University President Eric Barron’s 2015 vision
of Penn State as the ‘Energy University’31. As researchers and educators at a land grant
university tasked with educating students as well as providing workforce training, we
were motivated to conceive and install this microgrid system because we have to do it
ourselves first, before we can teach others. The system is an outgrowth of the GridSTAR
experience center at The Navy Yard, which among other accomplishments worked with
NECA and the IBEW to create and distribute workforce training modules addressing
distributed energy system design, installation and safety.
The concept of combining a gas-fired CHP unit with a renewable power system can result
in a highly efficient method to produce power locally, providing the flexibility to operate
day and night, and even when the central grid is unavailable.
By operating this system in the various modes possible for an electric microgrid, the team
will develop and refine broadly applicable guidelines for developing similar low-carbon
emitting CHP-Enabled Renewable Energy Microgrid systems throughout the
Commonwealth and beyond. In addition to the benefits that accrue to the user, the
expectation is that similar systems at different scales (building, campus, community) will
promote economic development from the Commonwealth’s Marcellus shale gas resource.
System Description. The Penn State Building 7R microgrid system consists of the
following components: a natural gas-fueled Capstone 65kW microturbine which is
capable of generating both electricity and hot water, 10 kW solar photovoltaic array,
lead-acid and lithium-ion battery banks, a ‘smart’ inverter, a microcontroller, and a
weather station. It is designed to operate both in tandem with the electric grid, as well as
independently in ‘islanded’ mode (simulating a grid outage).
The system will be used to research the economic and technical factors that arise from the
dynamic, interacting distributed energy resource components and their interaction with
The Navy Yard’s private unregulated electric grid32, which supplies electricity to the
buildings and businesses present on the grounds of the former two square mile Navy base
in Philadelphia.
A Capstone 65 kW combined-heat-and-power (CHP) microturbine, was selected as the
electric generator. The microturbine is fueled by natural gas. By capturing waste heat
generated by the combustion of the fuel, considerable thermal energy in the form of
31 https://trustees.psu.edu/pdf/november2015agendabotFINAL.pdf 32 See: Energy Master Plan, https://www.navyyard.org/about-the-campus/energy-innovations/energy-master-plan

CHP-ENABLED RENEWABLE ENERGY MICROGRIDS IN PENNSYLVANIA
38 | P a g e
steam or hot water may also be created. By combining these two functions and avoiding
the additional fuel and equipment that would have otherwise been required to create that
hot water, very high system efficiencies exceeding ~70% can be achieved. In contrast
central power plants are only ~40% efficient; their waste heat is not captured, and a
significant amount of generated power is lost during distribution between the power plant
and the end user.
The ‘brains’ of the 7R microgrid system consist of two major components, a Dynapower
smart inverter, and a programmable PC-based microcontroller.
The microcontroller will be programmed to safely operate each piece of equipment as it
interacts with the system, turning devices on and off according to their respective
manufacturer’s specifications. More important, it can be programmed to operate the
system with several distinctly different goals, instructing the system how to cost-
effectively interact with the electric grid, providing most or all of the power required to
operate the building if desired, supplying power to the grid when it’s profitable, and
operating independently of the grid during outages caused by storms or other causes. The
microcontroller is operating on Tridium’s Niagara Software, an open driver-based system
that can readily communicate with the building automation system.
The Dynapower inverter is a 50 kW advanced unit, consisting of three DC ports and two
AC ports, allowing power input from both the microturbine and the PV array, as well as
connections for both battery banks. Penn State has obtained source programming from
the manufacturer, and intends to develop programming instruction and project experience
for qualified students, a valuable skill they can take into the workplace.
The renewable portions of the system consist of the photovoltaic array and batteries.
Two battery banks, with different functions and characteristics are installed in this
system.
The 10 kW solar photovoltaic array on the building roof is comprised of 40 Isofoton
260 Watt panels.
The NexSys lead-acid battery bank has the capacity to supply up to 17 kW of power,
and can store 60 kWh of energy. This unit’s function is to safely store excess energy
generated by the solar array or generator, providing power when the system calls for it.
However, this type of battery chemistry cannot respond rapidly enough to changes in
solar PV output to handle some common conditions, such as when clouds abruptly shade
the PV array.
A second, lithium ion battery bank can respond very rapidly when dispatched by the
inverter. The AllCell 39 kWh / 50 kW unit also performs a less well known function, AC
frequency regulation, which can help stabilize the electric grid, and can actually generate
revenue payments from the utility.
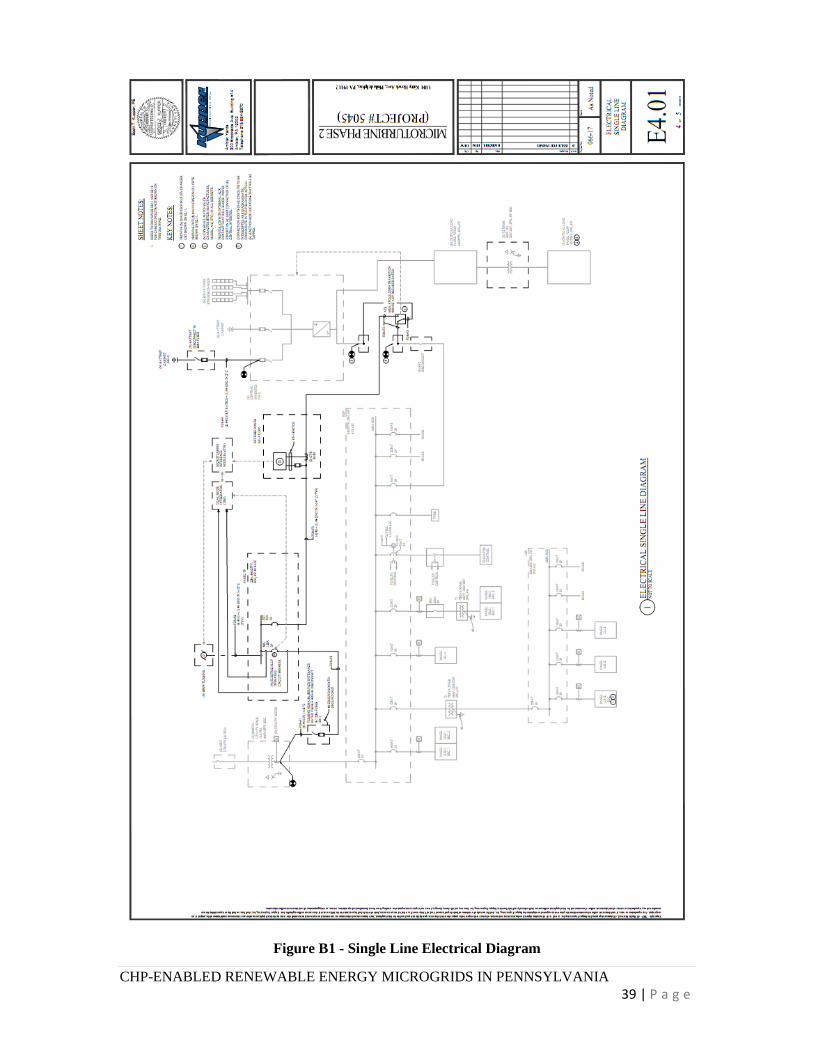
CHP-ENABLED RENEWABLE ENERGY MICROGRIDS IN PENNSYLVANIA
39 | P a g e
Figure B1 - Single Line Electrical Diagram

CHP-ENABLED RENEWABLE ENERGY MICROGRIDS IN PENNSYLVANIA
40 | P a g e
Figure B2 - 7R Microgrid System Schematic
Figure B3 - 7R Microgrid System Network/Communications Schematic

CHP-ENABLED RENEWABLE ENERGY MICROGRIDS IN PENNSYLVANIA
41 | P a g e
Planned Operational Modes for the 7R Microgrid System
Microgrids can function in a variety of different modes, depending on system elements,
purpose and budget.
Our overarching goal for the microgrid system is to demonstrate the operation of a
resilient, low-carbon footprint, ‘nano-grid’ in Penn State’s Building 7R on The Navy
Yard electric grid. Over time, and in concert with the U.S. Dept. of Energy’s Mid-
Atlantic Combined Heat and Power Technical Assistance Program (M-A CHP-TAP) led
by Dr. Jim Freihaut from Penn State’s Dept. of Architectural Engineering, we will
prepare broadly applicable guidelines for developing similar systems throughout the
Commonwealth.
There are several potential modes in which a microgrid can be configured and operated.
We intend to demonstrate and document the issues that arise in designing and operating
PSU’s microgrid on The Navy Yard electric grid in the following modes:
Building Load Following. In this mode, the smart inverter follows building energy
demand independent of how the building is controlled by the building’s automation
system (BAS). The inverter’s primary role in this mode is to maximize renewable and/or
CHP generation resources to supply power to meet the building’s needs.
Microgrid configuration #1 – Renewable Resource Only: Building is Grid-tied.
The DP33 with PV input is on in PQ mode and MT is off. Batteries can be
charged with PV power and are capable of being scheduled and dispatched by the
building operator or 3rd party provider.
Microgrid configuration #2 – All Distributed Energy Resources: Building is
Grid-tied. Both the DP with PV input and MT (with static power set point of,
e.g., a flat 20kW) are on and in PQ mode. Batteries can be charged with PV or
MT power and are capable of being scheduled and dispatched by the building
operator or 3rd party provider.
Microgrid configuration #3 – CHP Generation Only: Building is Grid-tied.
MT is on and in PQ mode. PV and batteries are off. MT is capable of being
scheduled and dispatched by building operator or 3rd party provider.
Building Load Shaping. In this mode, the microgrid will respond to grid-wide Demand
Response (DR) ‘Red Days’, which occur when regional day-ahead power consumption
projections anticipate peak demand. Under these conditions, which typically occur
during protracted excessively hot and humid or bitter cold weather, there is economic
incentive to reduce electric consumption to avoid unusually large short-term power
prices. In this mode, the inverter will instruct the BAS to invoke a pre-programmed DR
strategy, typically designed to reduce building demand in three progressively more
aggressive stages, e.g.:
Lighting reduction
33 (DP= Dynapower Inverter, PV= solar photovoltaic array, MT=Microturbine, MGC= Microgrid Controller, UF=Grid-
Forming, PQ=Grid-Following).

CHP-ENABLED RENEWABLE ENERGY MICROGRIDS IN PENNSYLVANIA
42 | P a g e
Unloading of pumps and fans
Changes in HVAC set-points
In addition, the inverter is programmed to maximize renewable and/or CHP generation
resources to supply power to the building. See Microgrid configuration #2 above.
Continuous Dynamic Control Mode. In this advanced mode, the inverter continually
instructs the BAS to invoke programming that alters building operating parameters to
maximize the use of distributed energy resources. See Microgrid configuration #2 above.
Islanded Mode. This microgrid includes switching and equipment designed to sense
grid-wide power failures and safely disconnect the system from the grid, providing
resiliency during emergencies. In islanded mode, power would typically be produced by
the CHP micro-turbine (provided natural gas is still available) along with the solar system
and/or by utilizing power stored in the batteries. The inverter instructs the BAS to invoke
“islanded” programming, which typically is intended to operate only critical building
loads for the duration of the emergency.
Microgrid configuration #4 – PV and Battery Backup: Grid goes down. MT
turns off automatically if running and Panel TP (a DC circuit breaker) opens. DP
and ATS (automatic transfer switch) disconnect from grid to support critical load
panels 1 and 2 with PV and battery only. Nothing can be scheduled by building
operator or 3rd party provider.
If the Grid power outage is prolonged and the batteries become depleted from supporting
the critical load panels, the microturbine is called upon to provide power to the building
and charge the batteries.
Microgrid configuration #5 – MT Backup: Grid goes down for extended period.
MT is disconnected from the grid via panel TP and is started. Once the MT is
operating at a programmed set-point, it forms the grid in UF mode (i.e., generates
voltage and frequency) and the ATS reconnects the MT to the DP utility
connection, thus inducing the DP into connecting to the MT in PQ mode. After
the batteries are fully charged, the MT will turn off, and the DP will switch back
to UF mode only, allowing the DP to support the critical load panels. Nothing can
be scheduled by building operator or 3rd party provider.
CHP Electric Sales. During periods of peak demand, when grid prices are higher than
the microgrid’s cost to produce power, the system will be programmed to generate and
sell electricity back to the grid. This will in effect generate a credit towards the utility
electric bill. The inverter will determine which generation resources should be used to
supply electricity to the grid (typically via the CHP micro-turbine and batteries). At the
same time, the inverter would instruct the BAS to invoke programming to reduce
building demand, allowing maximization of electricity supply to grid and revenue
generation. See Microgrid configuration #2 above.
Frequency Regulation. Operation in this mode will also generate revenue from the
microgrid resources. By utilizing the ‘fast’ (lithium-ion) battery bank to help maintain
the utility’s 60 Hz frequency, the microgrid can generate significant revenue from the

CHP-ENABLED RENEWABLE ENERGY MICROGRIDS IN PENNSYLVANIA
43 | P a g e
battery storage assets. In this mode the system operates the battery bank independent of
the BAS or building control.
Microgrid configuration #6 – Battery Operation: Building is Grid-tied. The DP
with or without PV input is on in PQ mode and MT is off. Batteries are
discharged by the MGC (via frequency regulation protocol) and dispatched by 3rd
party provider.

CHP-ENABLED RENEWABLE ENERGY MICROGRIDS IN PENNSYLVANIA
44 | P a g e
Glossary
Ancillary Services: Specialty services and functions provided by the electric grid that
facilitate and support the continuous flow of electricity so that supply will continually
meet demand. The term ancillary services is used to refer to a variety of operations
beyond generation and transmission that are required to maintain grid stability and
security. These services generally include, frequency control, spinning reserves and
operating reserves. Traditionally ancillary services have been provided by generators,
however, the integration of intermittent generation and the development of smart grid
technologies have expanded the types of equipment that can be used to provide ancillary
services.
Combined Heat and Power (CHP). Also called co-generation, CHP is the use of a
generator or turbine to generate electricity and useful heat at the same time. CHP plants
recover otherwise wasted thermal energy for heating, thereby increasing efficiency of
fuel use.
CHP Enabled Renewables Microgrid (CHPERMG). The combination of a CHP
system with renewable energy resources in a system with clearly defined electrical
boundaries that acts as a single controllable entity with respect to the grid.
Curtailment Service Providers (CSPs): Commonly referred to as aggregators, CSPs
market services including demand response, identify curtailable load, enroll customers,
manage curtailment events, and calculate payments or penalties for their customers.
Demand Response (DR): Demand response programs provide end-use electricity
customers with the ability able to manage their electricity consumption in response to
conditions in the wholesale market. They can reduce their electricity consumption when
wholesale prices are high or the reliability of the grid is threatened, receiving payments
for the reductions they make. Common examples of reductions are turning up the
temperature on the thermostat to reduce air conditioning, or slowing down, or stopping
production at an industrial facility temporarily.
Distributed Energy Resources (DERs): Electrical generation and storage performed by
a variety of small, grid-connected devices. DER systems typically use renewable energy
sources, including small hydro, biomass, biogas, solar power, wind power, and
geothermal power, but can also include conventional back-up power generators.
Distributed Generation (DG): Small-scale electricity production that is on-site or close
to the primary users and is interconnected to the utility distribution system. Sources of
distributed electricity production can include conventional fossil fuel reciprocating ‘back-
up power’ engines and turbines, as well as renewable energy sources such as solar
photovoltaic arrays, wind turbines, biomass etc.
Frequency Control: The practice of balancing the generation and consumption of
electricity on the grid in order to maintain the nominal AC frequency of 60 Hz (in North
America). Battery storage systems can be designed to provide this capability, and
generate revenue via payments from the regional utility for this service.
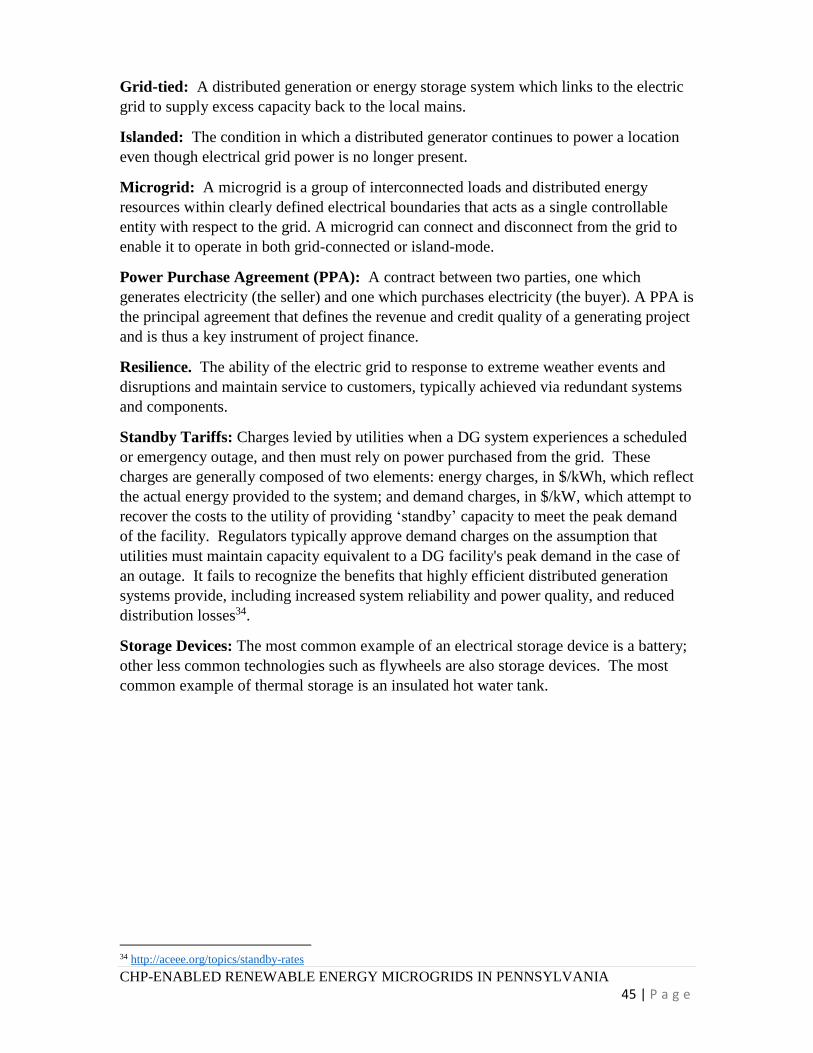
CHP-ENABLED RENEWABLE ENERGY MICROGRIDS IN PENNSYLVANIA
45 | P a g e
Grid-tied: A distributed generation or energy storage system which links to the electric
grid to supply excess capacity back to the local mains.
Islanded: The condition in which a distributed generator continues to power a location
even though electrical grid power is no longer present.
Microgrid: A microgrid is a group of interconnected loads and distributed energy
resources within clearly defined electrical boundaries that acts as a single controllable
entity with respect to the grid. A microgrid can connect and disconnect from the grid to
enable it to operate in both grid-connected or island-mode.
Power Purchase Agreement (PPA): A contract between two parties, one which
generates electricity (the seller) and one which purchases electricity (the buyer). A PPA is
the principal agreement that defines the revenue and credit quality of a generating project
and is thus a key instrument of project finance.
Resilience. The ability of the electric grid to response to extreme weather events and
disruptions and maintain service to customers, typically achieved via redundant systems
and components.
Standby Tariffs: Charges levied by utilities when a DG system experiences a scheduled
or emergency outage, and then must rely on power purchased from the grid. These
charges are generally composed of two elements: energy charges, in $/kWh, which reflect
the actual energy provided to the system; and demand charges, in $/kW, which attempt to
recover the costs to the utility of providing ‘standby’ capacity to meet the peak demand
of the facility. Regulators typically approve demand charges on the assumption that
utilities must maintain capacity equivalent to a DG facility's peak demand in the case of
an outage. It fails to recognize the benefits that highly efficient distributed generation
systems provide, including increased system reliability and power quality, and reduced
distribution losses34.
Storage Devices: The most common example of an electrical storage device is a battery;
other less common technologies such as flywheels are also storage devices. The most
common example of thermal storage is an insulated hot water tank.
34 http://aceee.org/topics/standby-rates

CHP-ENABLED RENEWABLE ENERGY MICROGRIDS IN PENNSYLVANIA
46 | P a g e
Resources and References
1. Blumsack, S., “Valuing the Contribution of CHP to Power Grid Resilience”,
presented at Statewide Microgrid Meeting, 28 February 2018, State College, PA
2. Bonner, T., “Microgrids -Economic and Regulatory Perspective”, presented at
Statewide Microgrid Meeting, 28 February 2018, State College, PA
3. Borghese, F. et.al., “Microgrid Business Models and Value Chains”, Schneider
Electric Company White Paper, 2017, #998-2095-03-10-17ARO0_EN
4. Brinley, D., “Natural Gas and Renewables: Making the Case for Microgrids,
presented at Statewide Microgrid Meeting, 28 February 2018, State College, PA
5. Chittum, A. and Relf, G., “Valuing Distributed Energy Resources: Combined Heat
and Power and the Modern Grid”, ACEEE White Paper, 25 April 2018,
http://aceee.org/white-paper/valuing-der.
6. Chowdhury, S., S.P. Chowdhury and P. Crossley, Microgrids and active distribution
networks. London [u.a.], Institution of Engineering and Technology, 2009.
7. Dill, J. & Freihaut, J. “Early Economic Feasibility of Hybrid Microgrid – California
Market Scenario”, 2017.
8. Enbar, N. et. al., “Microgrids: Expanding Applications, Implementations, and
Business Structures”, Smart Electric Power Alliance and Electric Power Research
Institute, December 2016, EPRI ID:3002008205.
9. Farhangi, H., Smart Microgrids, CRC Press, 2016.
10. Fraga, C. ‘Microgrids: A Developer, Investor/Owner/Operator’s Perspective’,
Alternative Energy Development Group, Pennsylvania Statewide Microgrid Meeting,
28 February 2018, University Park, PA.
11. Freihaut, J. “Combined Heat and Power Course Modules #1 and #2”, Dept. of
Architectural Engineering, The Pennsylvania State University, 2018.
12. J. Freihaut, J. and Brinley, D., “Utilization of Marcellus Gas for Economic Growth in
PA through CHP: CHP as the Key Driver for Hybrid Microgrids”, Association of
Energy Engineers, Globalcon 2017.
13. Fu, Q., A. Nasiri, A. Solanki, A. Bani-Ahmed, L. Weber and V. Bhavaraju,
"Microgrids: Architectures, controls, protection, and demonstration," Electric Power
Components and Systems, vol. 43, no. 12, pp. 1453-1465, Jul 21, 2015.
http://www.tandfonline.com/doi/abs/10.1080/15325008.2015.1039098.
14. R. Fu et. al., “U.S. Solar Photovoltaic System Cost Benchmark: Q1 2017”, National
Renewable Energy Laboratory, Technical Report NREL/TP-6A20-68925 September
2017.
15. Khodaei, A., Bahramirad, S., Paaso, E. A., Avendano, M., “Microgrid Economic
Viability Assessment: An introduction to MG-REVALUE”, The Electricity Journal,
Volume 30, Issue 4, May 2017, Pages 7-11.
16. Lawrence Berkeley National Laboratory, “DER-CAM Decision Support Tool for
Decentralized Energy Systems”, v. May 12 2016.
17. Mahmoud, M.S., Microgrids, San Diego, CA, USA, Elsevier Science, 2016.
18. Microgrid Knowledge newsletter, https://microgridknowledge.com/
19. Microgrid Research at Berkeley Lab, https://building-microgrid.lbl.gov/, July 9 2015.
20. Midwest CHP Application Center & Avalon Consulting, Inc., “Combined Heat &
Power (CHP) Resource Guide, 2nd. Ed., 2005, http://midwestchptap.org/resources/ .
CHP-ENABLED RENEWABLE ENERGY MICROGRIDS IN PENNSYLVANIA
47 | P a g e
21. Moran, D. and Suzuki, J., “Curtailment Service Providers: They Bring the Horse to
Water… Do We Care if It Drinks?”, 2010 ACEEE Summer Study on Energy
Efficiency in Buildings, pp. 5-287-298.
22. Navigant Consulting, “Microgrid Multi-Client Study – Public Executive Study”,
2015.
23. Panora, R., J.E. Gehret, M.M. Furse and R.H. Lasseter, "Real-world performance of a
CERTS microgrid in Manhattan," TSTE, vol. 5, no. 4, pp. 1356-1360, Oct 2014.
https://ieeexplore.ieee.org/document/6754189.
24. Reed, G. and Kelly-Pitou, K., ‘Grid Research and Infrastructure Development’,
Energy Grid Institute (www.grid.pitt.edu ), University of Pittsburgh, presented at the
Statewide Microgrid Meeting, 28 February 2018, State College, PA.
25. Stadler et. al., Value Streams in Microgrids: A literature Review, LBNL-1003608,
Oct. 2015.
26. Stanton, T., “Are Smart Microgrids in Your Future?”, NRRI Report 12-15, Oct. 2012.
27. Song U. et. al., Buildings that Rebound, 6 February 2018,
https://betterbuildingssolutioncenter.energy.gov/webinars/buildings-rebound-
resiliency-strategies-commercial-buildings-and-communities , accessed 22 May 2018.
28. U.S. Dept. of Homeland Security, National Infrastructure Protection Plan, “Joint
National Priorities for Critical Infrastructure Security and Resilience”, October 2014,
www.dhs.gov/nipp
29. U. S. Environmental Protection Agency, Combined Heat and Power Partnership,
“Catalog of CHP Technologies: Section 2. Technology Characterization –
Reciprocating Internal Combustion Engines", September 2014.
30. U. S. Environmental Protection Agency, Combined Heat and Power Partnership,
“Catalog of CHP Technologies: Section 3. Technology Characterization –
Combustion Turbines”, September 2014.
31. U. S. Environmental Protection Agency, Combined Heat and Power Partnership,
“CHP Project Development Handbook”, undated, www.epa.gov/chp.
32. U. S. Environmental Protection Agency, Combined Heat and Power Partnership,
“Fact Sheet: CHP as a Boiler Replacement Opportunity”, March 11, 2013.
33. Hampson, A. Rackley, J., “Guide to Using Combined Heat and Power for Enhancing
Reliability and Resiliency in Buildings”, U. S. Environmental Protection Agency and
U.S. Dept. of Energy, Sept. 2013.
34. U. S. Environmental Protection Agency, “Procurement Guide: Selecting a
Contractor/Project Developer”, undated.
35. U.S. Dept. of Energy, Energy Information Administration, “U.S. Battery Storage
Market Trends”, May 2018.
36. Wright, K., “The Case for Municipal DER: Why (and how) municipal utilities will
become the reliable generators of the future”, ProtoGen Energy, 2018.