chosing the appropriate_statistical_test
TRANSCRIPT
• Univariate• Bivariate• Multivariate
Descriptive Statistics
Inferential Statistics
Descriptive analysis refers to transformation of raw data into a form that will facilitate easy understanding and interpretation. The ways of summarizing data are by calculating average, range, standard deviation, frequency etc.
Inferential statistics is concerned with making predictions or inferences about a population from observations and analyses of a sample. That is, we can take the results of an analysis using a sample and can generalize it to the larger population that the sample represents. Examples of inferential statistics include t-test, regression analysis, correlation analysis, ANOVA.

the t-test compares the actual difference between two means in relation to the variation in the data.
Usually have two groups Pre-test and post–Test analysis dependent and independent variable Multiple test apply

Correlation measures the degree of association between two or more variables. There are three types of correlation:-
Positive Correlation Negative Correlation Zero Correlation
ASSOCIATED WITH CORRELATION HELP IN PREDICTING VALUES OF SINGLE OR
SET INDEPENDENT VARIABLE OR NUMERIC DEPENDENT VARIABLE TO GET CERTAIN OUTCOME

Used to two and more than two groups Compare mean scores Comparison between different groupsExp: suppose there is three groups- the
differences between 1 &2, 2 & 3, 3 &1

One- way, two way, three way ANOVA Analysis of impact of one or more
independent variable (exp: BP is higher of male)
Two types of factorial ANOVABETWEEN GROUPSDIFFERENT GROUPSREPEATED NUMBERS OF AVOVA

IDENTIFY AND DEFINE YOUR VARIABLECause and effect relationshipDependent (blood pressure and muscles pain) and
independent variables (comparison between male / female) (comparision between public sector bank and private sector banks) (comparision between football players and basket ball players)
OPERATIONAL DEFINITION OF EACH VARIABLE (exp: health measure 1.independent variables may be HAPPY OR UNHAPPY)

IDENTIFY THE NATURE OF VARIABLEi. Level of measurement of each variableii. Develop measurement scale• Normal / categorical• Ordinal- ranking on five point scale• Interval (exp: temperature, air, water temp)• Ratios (no. of books you read out in library,
number of article you read, liquidity ratio, profit earning ratio, assets turnover ratio)
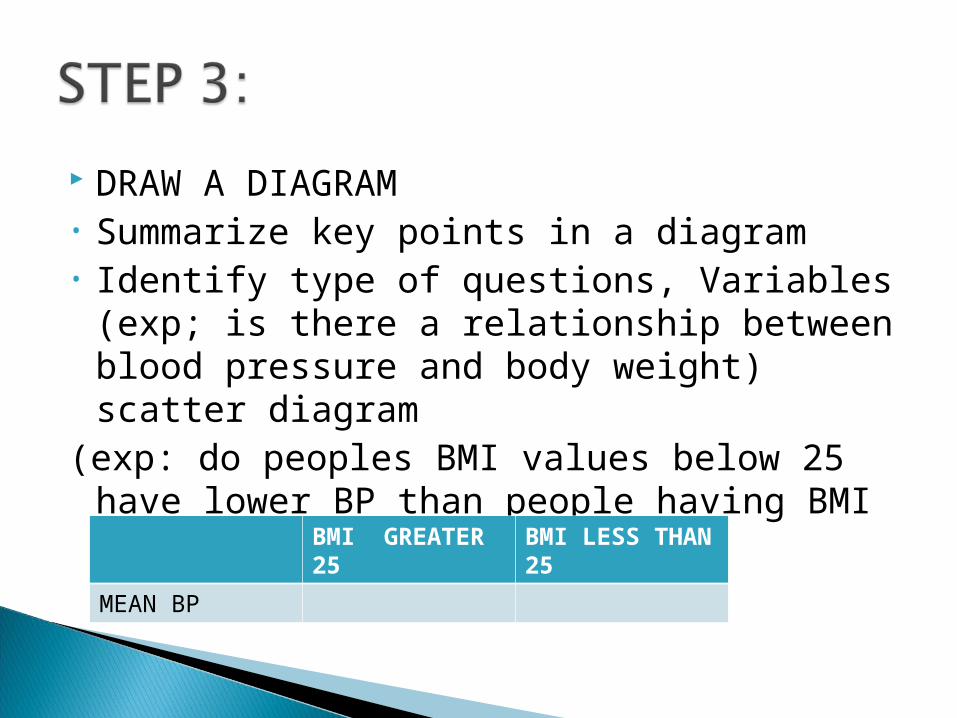
DRAW A DIAGRAM• Summarize key points in a diagram• Identify type of questions, Variables (exp; is
there a relationship between blood pressure and body weight) scatter diagram
(exp: do peoples BMI values below 25 have lower BP than people having BMI above 25)
BMI GREATER 25
BMI LESS THAN 25
MEAN BP
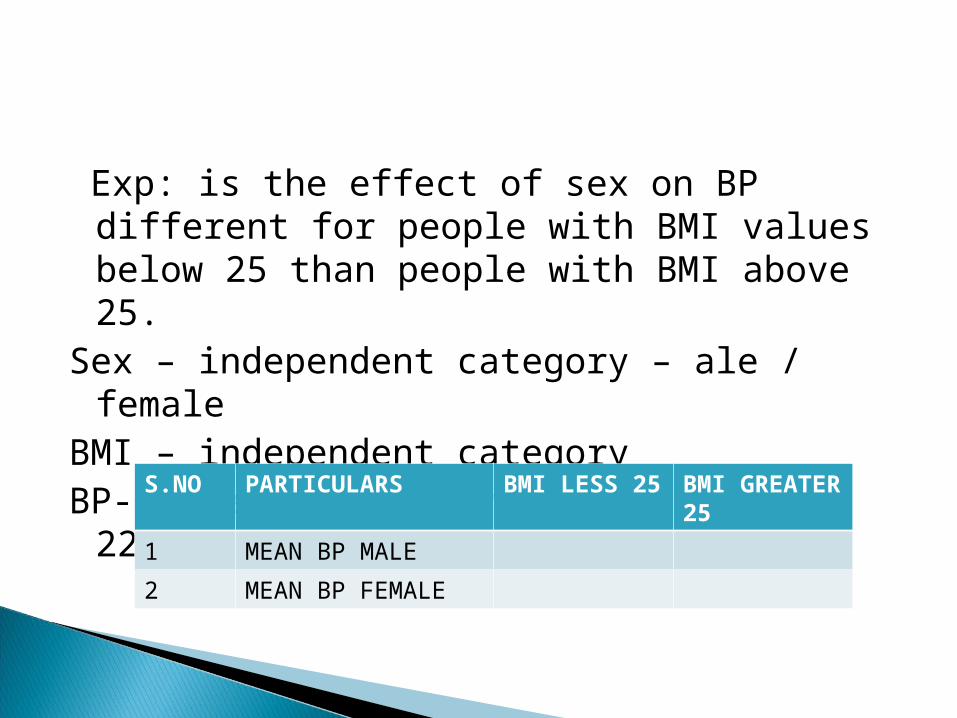
Exp: is the effect of sex on BP different for people with BMI values below 25 than people with BMI above 25.
Sex – independent category – ale / femaleBMI – independent category BP- dependent – mean range from 100- 220
S.NO PARTICULARS BMI LESS 25
BMI GREATER 25
1 MEAN BP MALE
2 MEAN BP FEMALE

DETERMINE NEED FOR PARAMATRIC AND NON-PARAMETRIC TEST
• DOES YOUR DATA MEET THE ASSUMPTION OF PARAMATRIC TESTING (exp: t’ test, ANOVA)
• What if it does’t? use parametric testing any way Possible in larger sample size Violate some assumption/ justify Data transform
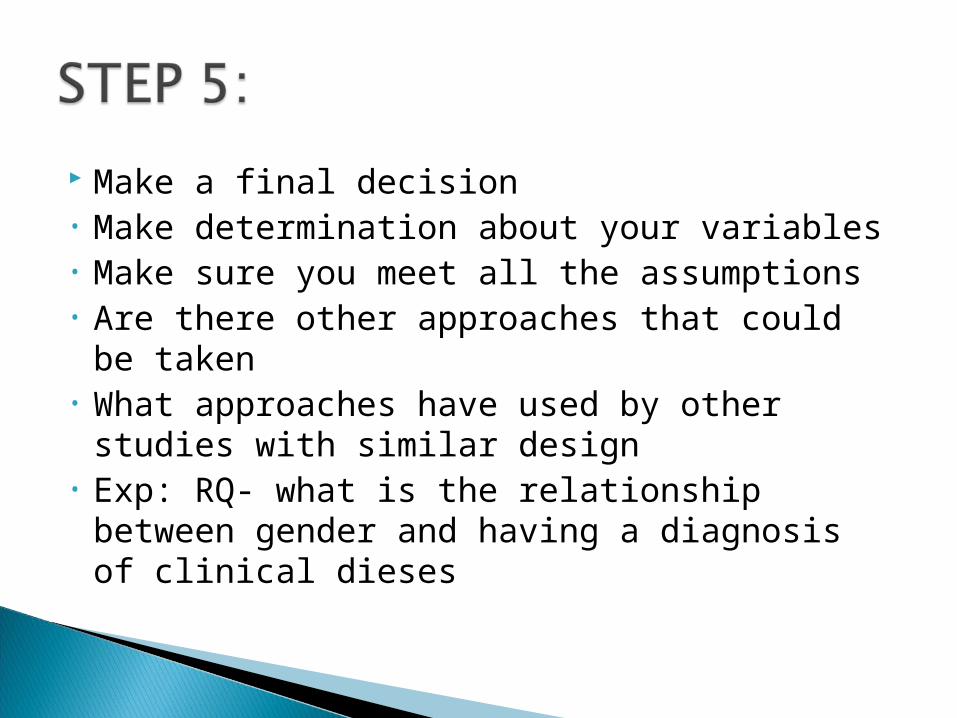
Make a final decision• Make determination about your variables• Make sure you meet all the assumptions• Are there other approaches that could be
taken• What approaches have used by other
studies with similar design• Exp: RQ- what is the relationship between
gender and having a diagnosis of clinical dieses
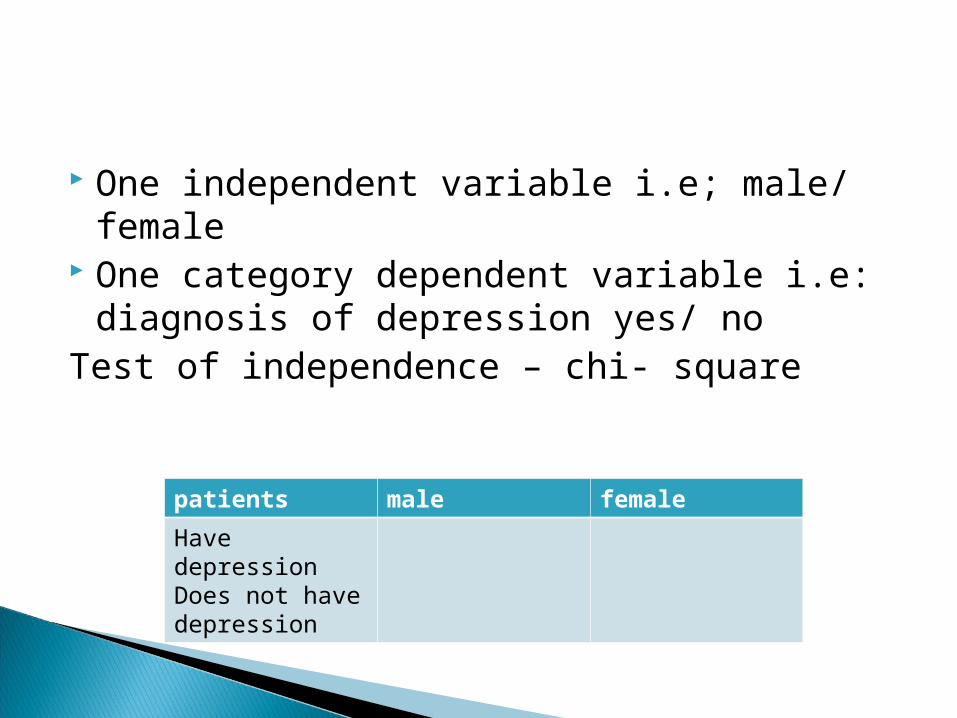
One independent variable i.e; male/ female One category dependent variable i.e:
diagnosis of depression yes/ noTest of independence – chi- square
patients male female
Have depressionDoes not have depression

Exp: RQ: is there a relationship between age and depression index? Does depression needed with age.
Pearson's correlation exp: male more depressed than female• Dependent variable- male• Independent variable- femaleParametric- Independent t’ test

Exp: will 10 week of exercise have reduced the BP
Independent variables: pre- test and post- test
Dependent variable: BP Parametric test- t’ test Non- parametric test- rank test
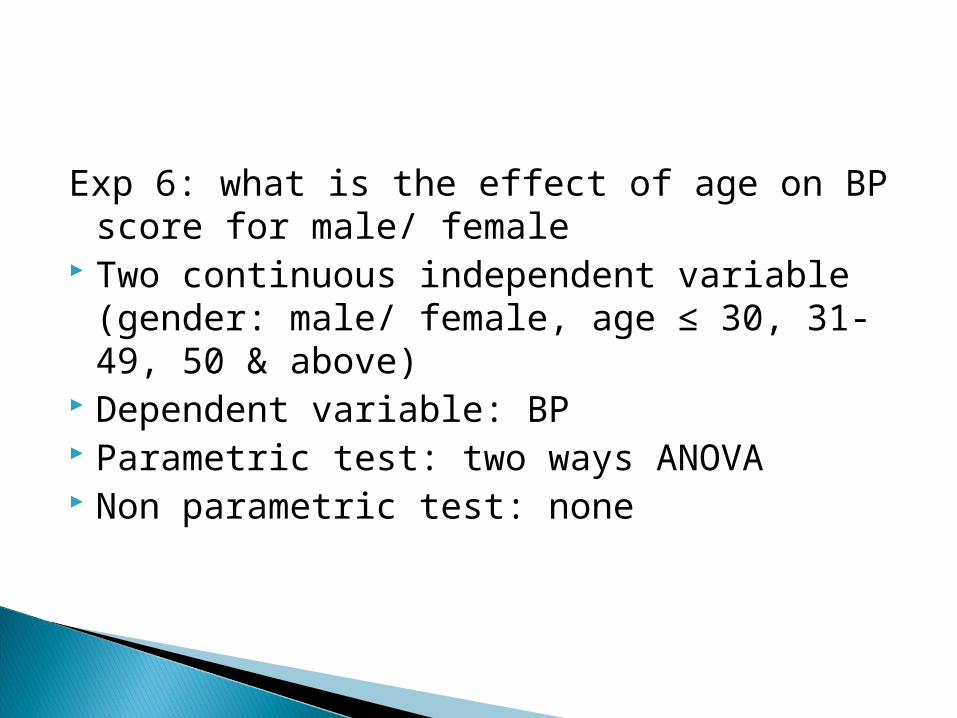
Exp 6: what is the effect of age on BP score for male/ female
Two continuous independent variable (gender: male/ female, age ≤ 30, 31-49, 50 & above)
Dependent variable: BP Parametric test: two ways ANOVA Non parametric test: none

Exp: do male have over all rating of psychological health (depression, anxiety, perceived stress) than female
Independent variable (male/ female) Dependent variable (psychological health) Parametric test- MANOVA Non-parametrictest- none
male female
Mean anxiety score
Mean depression
Mean preceived stress

THANK YOU