choice of aggregated parameters for integration of electric vehicles to grid in a times model for a...
TRANSCRIPT
Choice of aggregated parameters for integration of electric vehicles to grid in a TIMES model for a region dominated by wind power
Poul Erik Grohnheit, Cristian Cabrera, Giovanni Pantuso,
DTU Management Engineering.
Geir Brønmo, Energinet.dk
EV-STEP Workshop
66th Semi-annual ETSAP meeting, Copenhagen, Denmark
17 November 2014
Contact: [email protected] (Poul Erik Grohnheit)
DTU Management Engineering, Technical University of Denmark
Add Presentation Title in Footer via ”Insert”; ”Header & Footer”
Overview
• Electromobility+ EV-STEP
• Stepwise tutorial models in TIMES
• Technology model for electric vehicles
• Sifre. Model for operation of the Danish electricity system
• Users' profiles for electric vehicles
• Time slices in TIMES
• Parameters in aggregated models
17 Nov. 2014 2 EV-STEP Workshop, ETSAP Meeting
DTU Management Engineering, Technical University of Denmark
Add Presentation Title in Footer via ”Insert”; ”Header & Footer”
Abstract
• The set of TIMES models for stepwise introduction of new features can be used both as tutorials and for analysis of integration of technologies into a region, where the structural data are described by the model. The current set of tutorials developed for ETSAP covers EU27 as the model region.
• We shall consider modelling of integration of electric vehicles into a region with many years of experience with a day-ahead wholesale spot market for electricity. The area prices for western Denmark have been increasingly influenced by wind power since 1999. The region also have strong connections to neighbouring electricity markets with available statistics for hourly prices and volumes, while internal transmission constraints are limited.
• We shall analyse the possible values of aggregated parameters for time-slices and structural constraints for a model of technology choice for transport for some 20 years ahead. The TIMES model will be run in parallel with test of a new model for operation of the electric system with combined heat and power and heat storages.
17 Nov. 2014 3 EV-STEP Workshop, ETSAP Meeting
DTU Management Engineering, Technical University of Denmark
Add Presentation Title in Footer via ”Insert”; ”Header & Footer”
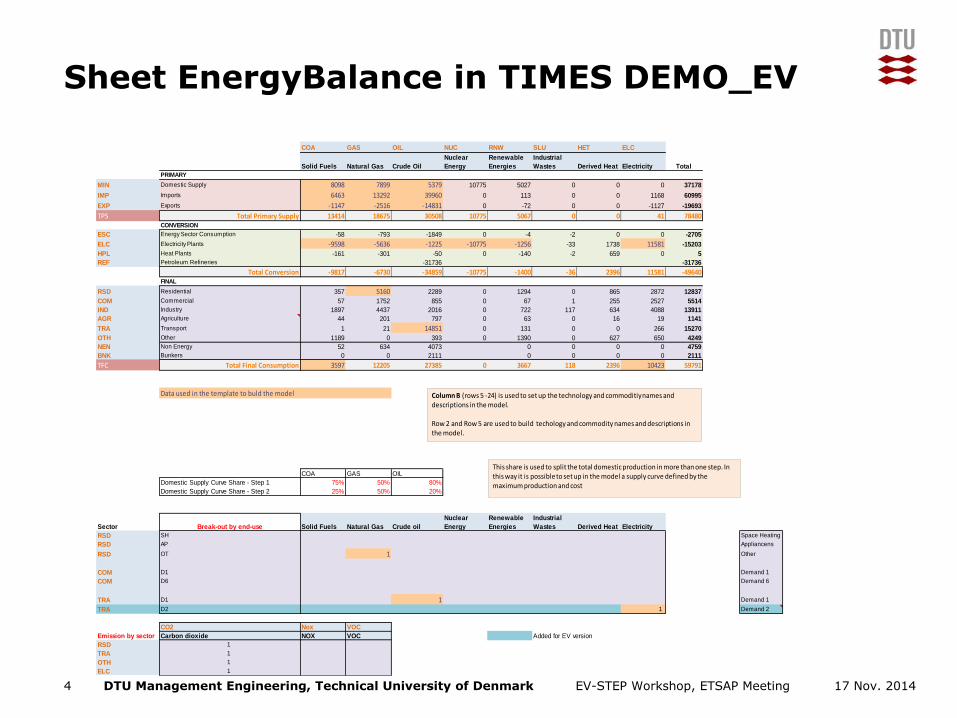
Sheet EnergyBalance in TIMES DEMO_EV
EV-STEP Workshop, ETSAP Meeting 4 17 Nov. 2014
COA GAS OIL NUC RNW SLU HET ELC
Solid Fuels Natural Gas Crude Oil
Nuclear
Energy
Renewable
Energies
Industrial
Wastes Derived Heat Electricity Total
PRIMARY
MIN Domestic Supply 8098 7899 5379 10775 5027 0 0 0 37178
IMP Imports 6463 13292 39960 0 113 0 0 1168 60995
EXP Exports -1147 -2516 -14831 0 -72 0 0 -1127 -19693
TPS Total Primary Supply 13414 18675 30508 10775 5067 0 0 41 78480CONVERSION
ESC Energy Sector Consumption -58 -793 -1849 0 -4 -2 0 0 -2705
ELC Electricity Plants -9598 -5636 -1225 -10775 -1256 -33 1738 11581 -15203
HPL Heat Plants -161 -301 -50 0 -140 -2 659 0 5
REF Petroleum Refineries -31736 -31736
Total Conversion -9817 -6730 -34859 -10775 -1400 -36 2396 11581 -49640FINAL
RSD Residential 357 5160 2289 0 1294 0 865 2872 12837
COM Commercial 57 1752 855 0 67 1 255 2527 5514
IND Industry 1897 4437 2016 0 722 117 634 4088 13911
AGR Agriculture 44 201 797 0 63 0 16 19 1141
TRA Transport 1 21 14851 0 131 0 0 266 15270
OTH Other 1189 0 393 0 1390 0 627 650 4249
NEN Non Energy 52 634 4073 0 0 0 0 4759
BNK Bunkers 0 0 2111 0 0 0 0 2111
TFC Total Final Consumption 3597 12205 27385 0 3667 118 2396 10423 59791
Data used in the template to buld the model
COA GAS OIL
Domestic Supply Curve Share - Step 1 75% 50% 80%
Domestic Supply Curve Share - Step 2 25% 50% 20%
Sector Break-out by end-use Solid Fuels Natural Gas Crude oil
Nuclear
Energy
Renewable
Energies
Industrial
Wastes Derived Heat Electricity
RSD SH Space Heating
RSD AP Appliancens
RSD OT 1 Other
COM D1 Demand 1
COM D6 Demand 6
TRA D1 1 Demand 1
TRA D2 1 Demand 2
CO2 Nox VOC
Emission by sector Carbon dioxide NOX VOC Added for EV version
RSD 1
TRA 1
OTH 1
ELC 1
Column B (rows 5 -24) is used to set up the technology and commoditiy names and descriptions in the model.
Row 2 and Row 5 are used to build techology and commodity names and descriptions in the model.
This share is used to split the total domestic production in more than one step. In this way it is possible to set up in the model a supply curve defined by the maximum production and cost
DTU Management Engineering, Technical University of Denmark
Add Presentation Title in Footer via ”Insert”; ”Header & Footer”
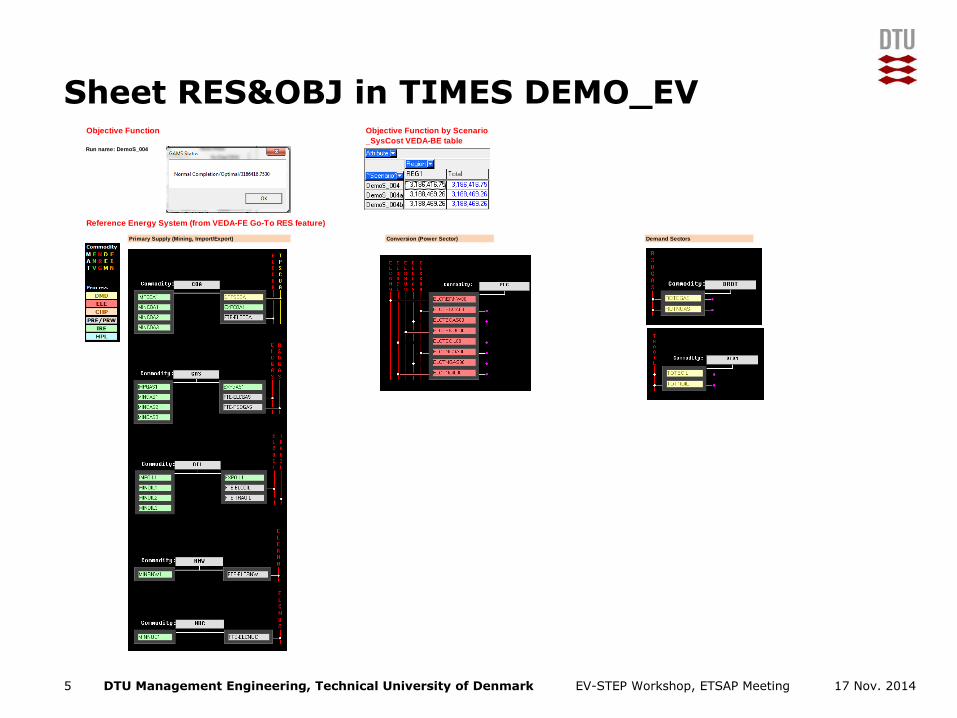
Sheet RES&OBJ in TIMES DEMO_EV
EV-STEP Workshop, ETSAP Meeting 5 17 Nov. 2014
Objective Function Objective Function by Scenario
_SysCost VEDA-BE tableRun name: DemoS_004
Reference Energy System (from VEDA-FE Go-To RES feature)
Primary Supply (Mining, Import/Export) Conversion (Power Sector) Demand Sectors
DTU Management Engineering, Technical University of Denmark
Add Presentation Title in Footer via ”Insert”; ”Header & Footer”
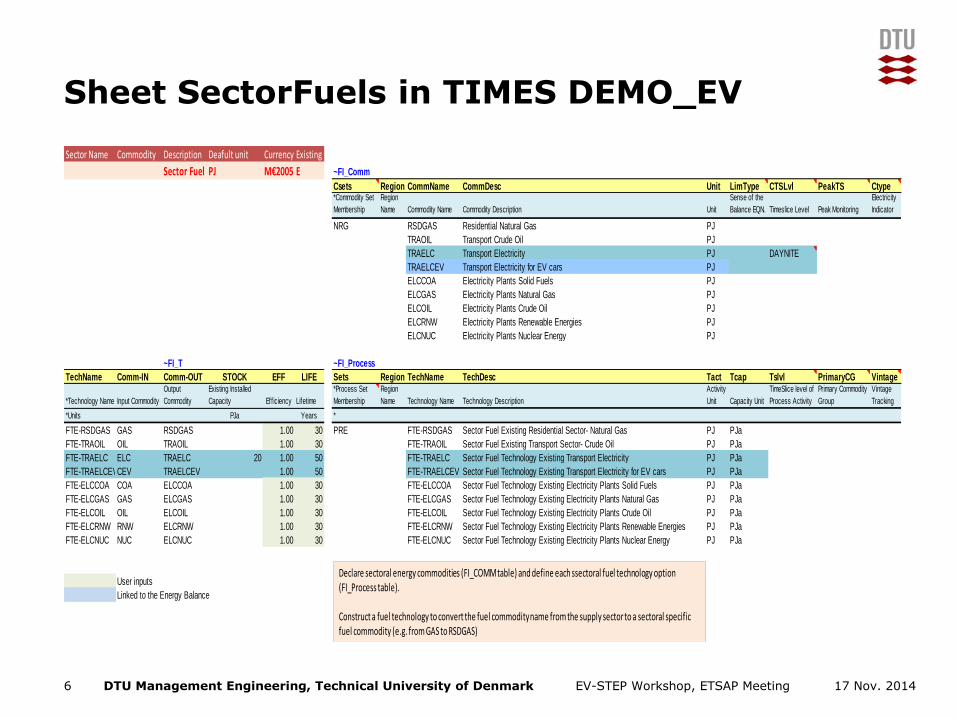
Sheet SectorFuels in TIMES DEMO_EV
EV-STEP Workshop, ETSAP Meeting 6 17 Nov. 2014
Sector Name Commodity Description Deafult unit Currency Existing
Sector Fuel PJ M€2005 E ~FI_Comm
Csets Region CommName CommDesc Unit LimType CTSLvl PeakTS Ctype*Commodity Set
Membership
Region
Name Commodity Name Commodity Description Unit
Sense of the
Balance EQN. Timeslice Level Peak Monitoring
Electricity
Indicator
NRG RSDGAS Residential Natural Gas PJ
TRAOIL Transport Crude Oil PJ
TRAELC Transport Electricity PJ DAYNITE
TRAELCEV Transport Electricity for EV cars PJ
ELCCOA Electricity Plants Solid Fuels PJ
ELCGAS Electricity Plants Natural Gas PJ
ELCOIL Electricity Plants Crude Oil PJ
ELCRNW Electricity Plants Renewable Energies PJ
ELCNUC Electricity Plants Nuclear Energy PJ
~FI_T ~FI_Process
TechName Comm-IN Comm-OUT STOCK EFF LIFE Sets Region TechName TechDesc Tact Tcap Tslvl PrimaryCG Vintage
*Technology Name Input Commodity
Output
Commodity
Existing Installed
Capacity Efficiency Lifetime
*Process Set
Membership
Region
Name Technology Name Technology Description
Activity
Unit Capacity Unit
TimeSlice level of
Process Activity
Primary Commodity
Group
Vintage
Tracking
*Units PJa Years *
FTE-RSDGAS GAS RSDGAS 1.00 30 PRE FTE-RSDGAS Sector Fuel Existing Residential Sector- Natural Gas PJ PJa
FTE-TRAOIL OIL TRAOIL 1.00 30 FTE-TRAOIL Sector Fuel Existing Transport Sector- Crude Oil PJ PJa
FTE-TRAELC ELC TRAELC 20 1.00 50 FTE-TRAELC Sector Fuel Technology Existing Transport Electricity PJ PJa
FTE-TRAELCEVCEV TRAELCEV 1.00 50 FTE-TRAELCEV Sector Fuel Technology Existing Transport Electricity for EV cars PJ PJa
FTE-ELCCOA COA ELCCOA 1.00 30 FTE-ELCCOA Sector Fuel Technology Existing Electricity Plants Solid Fuels PJ PJa
FTE-ELCGAS GAS ELCGAS 1.00 30 FTE-ELCGAS Sector Fuel Technology Existing Electricity Plants Natural Gas PJ PJa
FTE-ELCOIL OIL ELCOIL 1.00 30 FTE-ELCOIL Sector Fuel Technology Existing Electricity Plants Crude Oil PJ PJa
FTE-ELCRNW RNW ELCRNW 1.00 30 FTE-ELCRNW Sector Fuel Technology Existing Electricity Plants Renewable Energies PJ PJa
FTE-ELCNUC NUC ELCNUC 1.00 30 FTE-ELCNUC Sector Fuel Technology Existing Electricity Plants Nuclear Energy PJ PJa
User inputs
Linked to the Energy Balance
Declare sectoral energy commodities (FI_COMM table) and define each ssectoral fuel technology option (FI_Process table).
Construct a fuel technology to convert the fuel commodity name from the supply sector to a sectoral specific fuel commodity (e.g. from GAS to RSDGAS)
DTU Management Engineering, Technical University of Denmark
Add Presentation Title in Footer via ”Insert”; ”Header & Footer”
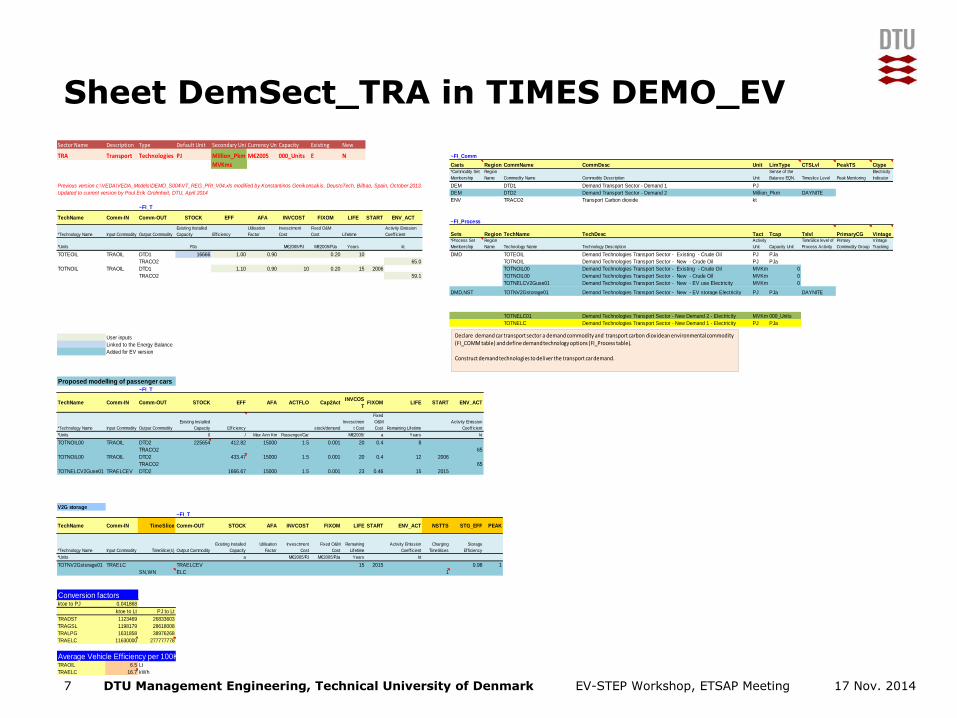
Sheet DemSect_TRA in TIMES DEMO_EV
EV-STEP Workshop, ETSAP Meeting 7 17 Nov. 2014
Sector Name Description Type Default Unit Secondary UnitsCurrency UnitCapacity Existing New
TRA Transport
Demand
Technologies PJ Million_Pkm M€2005 000_Units E N ~FI_Comm
MVKms Csets Region CommName CommDesc Unit LimType CTSLvl PeakTS Ctype*Commodity Set
Membership
Region
Name Commodity Name Commodity Description Unit
Sense of the
Balance EQN. Timeslice Level Peak Monitoring
Electricity
Indicator
Previous version c:\VEDA\VEDA_Models\DEMO_S004\VT_REG_PRI_V04.xls modified by Konstantinos Genikonsak is, DeustoTech, Bilbao, Spain, October 2013, DEM DTD1 Demand Transport Sector - Demand 1 PJ
Updated to current version by Poul Erik Grohnheit, DTU, April 2014 DEM DTD2 Demand Transport Sector - Demand 2 Million_Pkm DAYNITE
ENV TRACO2 Transport Carbon dioxide kt
~FI_T
TechName Comm-IN Comm-OUT STOCK EFF AFA INVCOST FIXOM LIFE START ENV_ACT~FI_Process
*Technology Name Input Commodity Output Commodity
Existing Installed
Capacity Eff iciency
Utilisation
Factor
Invesctment
Cost
Fixed O&M
Cost Lifetime
Activity Emission
Coefficient Sets Region TechName TechDesc Tact Tcap Tslvl PrimaryCG Vintage
*Units PJa M€2005/PJ M€2005/PJa Years kt
*Process Set
Membership
Region
Name Technology Name Technology Description
Activity
Unit Capacity Unit
TimeSlice level of
Process Activity
Primary
Commodity Group
Vintage
Tracking
TOTEOIL TRAOIL DTD1 16666 1.00 0.90 0.20 10 DMD TOTEOIL Demand Technologies Transport Sector - Existing - Crude Oil PJ PJa
TRACO2 65.0 TOTNOIL Demand Technologies Transport Sector - New - Crude Oil PJ PJa
TOTNOIL TRAOIL DTD1 1.10 0.90 10 0.20 15 2006 TOTNOIL00 Demand Technologies Transport Sector - Existing - Crude Oil MVKms 0
TRACO2 59.1 TOTNOIL00 Demand Technologies Transport Sector - New - Crude Oil MVKms 0
TOTNELCV2Guse01 Demand Technologies Transport Sector - New - EV use Electricity MVKms 0
DMD,NST TOTNV2Gstorage01 Demand Technologies Transport Sector - New - EV storage Electricity PJ PJa DAYNITE
TOTNELC01 Demand Technologies Transport Sector - New Demand 2 - Electricity MVKms000_Units
TOTNELC Demand Technologies Transport Sector - New Demand 1 - Electricity PJ PJa
User inputs
Linked to the Energy Balance
Added for EV version
Proposed modelling of passenger cars~FI_T
TechName Comm-IN Comm-OUT STOCK EFF AFA ACTFLO Cap2ActINVCOS
TFIXOM LIFE START ENV_ACT
*Technology Name Input Commodity Output Commodity
Existing Installed
Capacity Eff iciency stock/demand
Invesctmen
t Cost
Fixed
O&M
Cost Remaining Lifetime
Activity Emission
Coefficient
*Units 0 / Max Ann Km Passenger/Car M€2005/
M€2005/
a Years kt
TOTNOIL00 TRAOIL DTD2 225654 412.82 15000 1.5 0.001 20 0.4 8
TRACO2 65
TOTNOIL00 TRAOIL DTD2 433.47 15000 1.5 0.001 20 0.4 12 2006
TRACO2 65
TOTNELCV2Guse01 TRAELCEV DTD2 1666.67 15000 1.5 0.001 23 0.46 15 2015
V2G storage
~FI_T
TechName Comm-IN TimeSlice Comm-OUT STOCK AFA INVCOST FIXOM LIFE START ENV_ACT NSTTS STG_EFF PEAK
*Technology Name Input Commodity TimeSlice(s) Output Commodity
Existing Installed
Capacity
Utilisation
Factor
Invesctment
Cost
Fixed O&M
Cost
Remaining
Lifetime
Activity Emission
Coefficient
Charging
TimeSlices
Storage
Eff iciency
*Units a M€2005/PJ M€2005/PJa Years kt
TOTNV2Gstorage01 TRAELC TRAELCEV 15 2015 0.98 1
SN,WN ELC 1
Conversion factorsktoe to PJ 0.041868
ktoe to Lt PJ to Lt
TRADST 1123469 26833603
TRAGSL 1198179 28618008
TRALPG 1631858 38976268
TRAELC 11630000 277777778
Average Vehicle Efficiency per 100KmTRAOIL 6.5 Lt
TRAELC 16.7 kWh
Declare demand car transport sector a demand commodity and transport carbon dioxidean environmental commodity (FI_COMM table) and define demandtechnology options (FI_Process table).
Construct demand technologies to deliver the transport car demand.
DTU Management Engineering, Technical University of Denmark
Add Presentation Title in Footer via ”Insert”; ”Header & Footer”
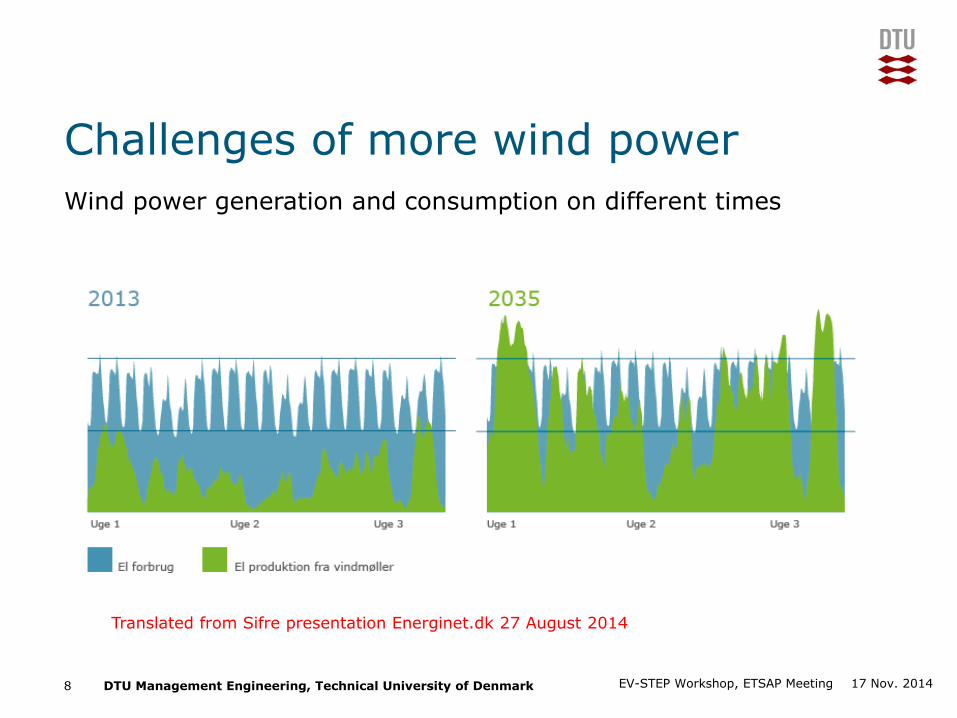
Challenges of more wind power
Wind power generation and consumption on different times
17 Nov. 2014 8 EV-STEP Workshop, ETSAP Meeting
Translated from Sifre presentation Energinet.dk 27 August 2014
DTU Management Engineering, Technical University of Denmark
Add Presentation Title in Footer via ”Insert”; ”Header & Footer”
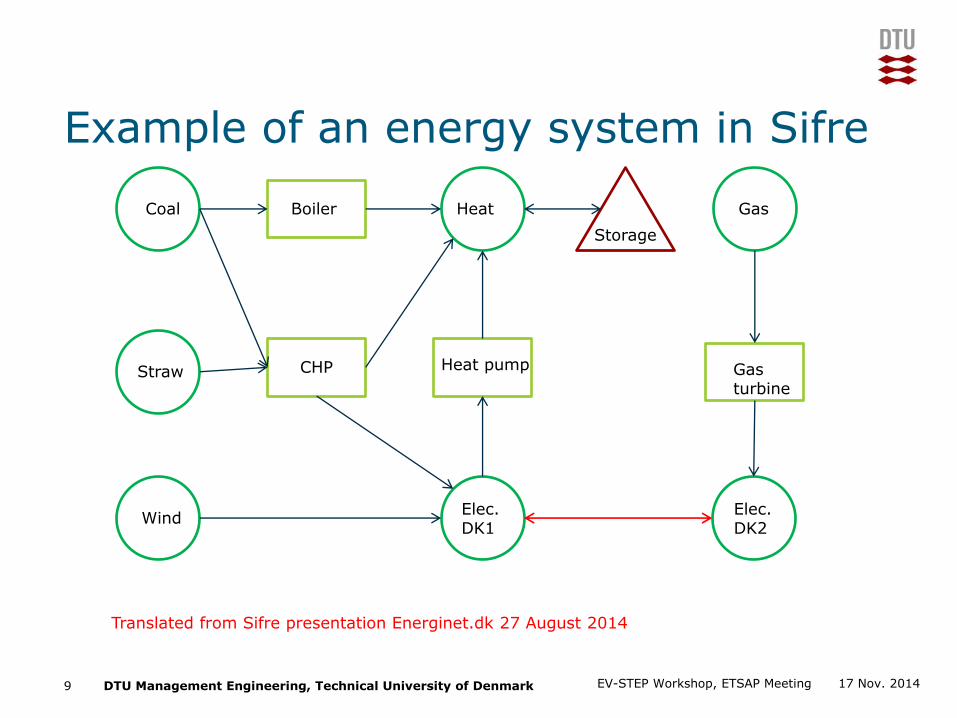
Example of an energy system in Sifre
17 Nov. 2014 9 EV-STEP Workshop, ETSAP Meeting
Coal
Straw
Wind
Boiler
CHP
Heat
Elec. DK1
Elec. DK2
Gas turbine
Gas
Storage
Heat pump
Translated from Sifre presentation Energinet.dk 27 August 2014
DTU Management Engineering, Technical University of Denmark
Add Presentation Title in Footer via ”Insert”; ”Header & Footer”
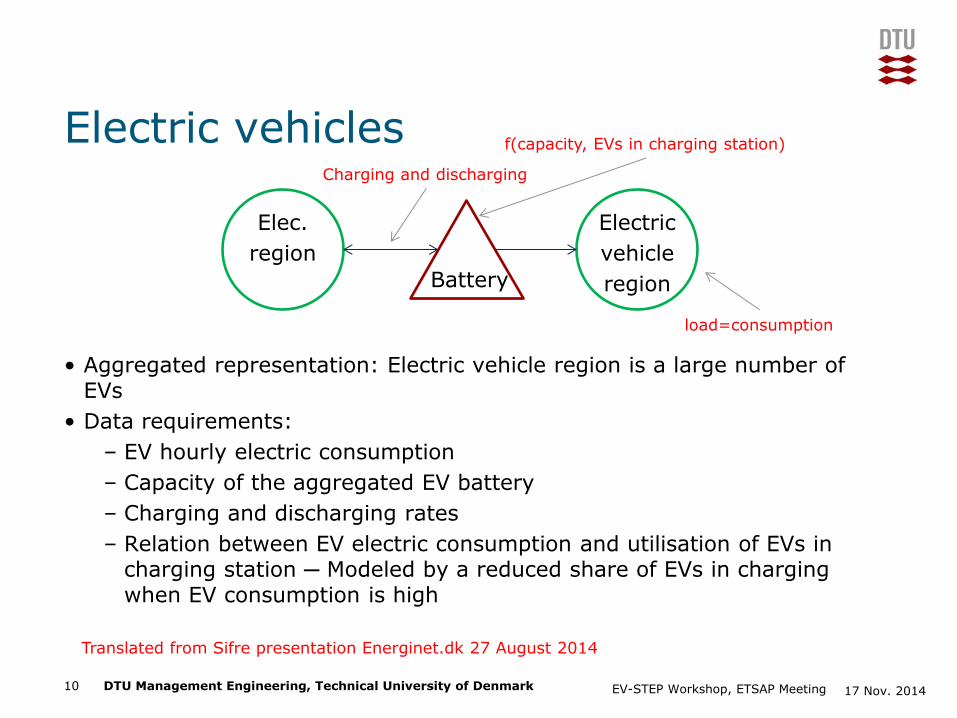
Electric vehicles
• Aggregated representation: Electric vehicle region is a large number of EVs
• Data requirements:
– EV hourly electric consumption
– Capacity of the aggregated EV battery
– Charging and discharging rates
– Relation between EV electric consumption and utilisation of EVs in charging station ─ Modeled by a reduced share of EVs in charging when EV consumption is high
17 Nov. 2014 10 EV-STEP Workshop, ETSAP Meeting
Elec.
region
Electric
vehicle
region
Charging and discharging
load=consumption
f(capacity, EVs in charging station)
Battery
Translated from Sifre presentation Energinet.dk 27 August 2014
DTU Management Engineering, Technical University of Denmark
Add Presentation Title in Footer via ”Insert”; ”Header & Footer”
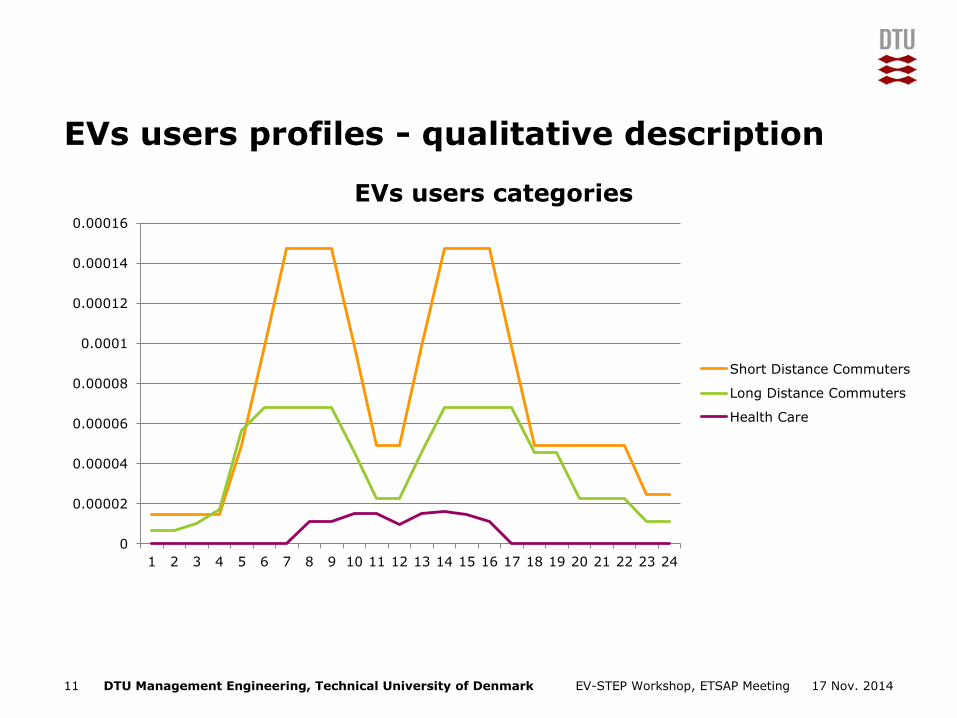
EVs users profiles - qualitative description
EV-STEP Workshop, ETSAP Meeting 11 17 Nov. 2014
0
0.00002
0.00004
0.00006
0.00008
0.0001
0.00012
0.00014
0.00016
1 2 3 4 5 6 7 8 9 10 11 12 13 14 15 16 17 18 19 20 21 22 23 24
EVs users categories
Short Distance Commuters
Long Distance Commuters
Health Care
DTU Management Engineering, Technical University of Denmark
Add Presentation Title in Footer via ”Insert”; ”Header & Footer”
EVs users profiles - qualitative description
• Short distance commuters
– Driving less than one hour to work
• Long distance commuters
– Driving more than one hour to work
– Produce thicker tails in the load curve
• Health Care Services
– Drive mainly between 8 and 17 (working hours)
– Moderate load decrease during lunch time
• Vehicle-to-grid
– Short distance commuter seem the primary target
– Only moderate availability for discharging should be expected from long distance commuters and health care services
– Hybrid vehicles users could however be more available for discharging
EV-STEP Workshop, ETSAP Meeting 12 17 Nov. 2014
DTU Management Engineering, Technical University of Denmark
Add Presentation Title in Footer via ”Insert”; ”Header & Footer”
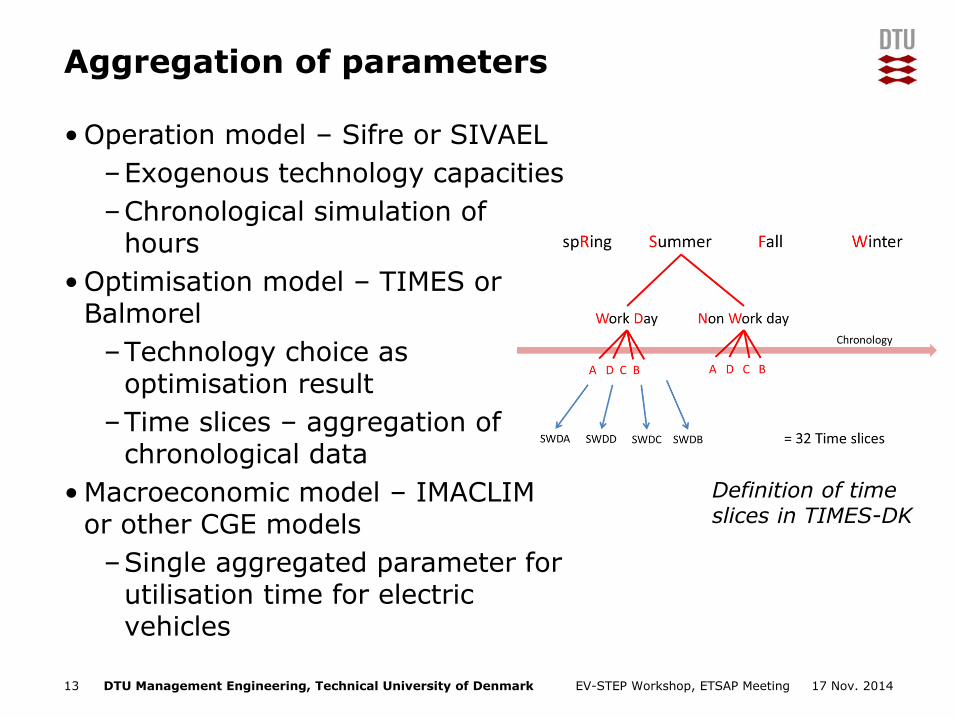
Aggregation of parameters • Operation model – Sifre or SIVAEL
–Exogenous technology capacities
–Chronological simulation of hours
• Optimisation model – TIMES or Balmorel
–Technology choice as optimisation result
–Time slices – aggregation of chronological data
• Macroeconomic model – IMACLIM or other CGE models
–Single aggregated parameter for utilisation time for electric vehicles
17 Nov. 2014 13 EV-STEP Workshop, ETSAP Meeting
Definition of time slices in TIMES-DK
DTU Management Engineering, Technical University of Denmark
Add Presentation Title in Footer via ”Insert”; ”Header & Footer”
References
• Intro_til_Sifre.pptx, Energinet.dk 27 august 2014
• Existing policies and mobility flows analysis, EV-STEP Deliverable D2.1, April 2014
• Key Technologies for Electromobility, EV-STEP Deliverable D2.2, April 2014
• Energinet.dk (2014), SImulating Flexible and Renewable Energy sources. Sifre Workshop, Energinet.dk, Ballerup 27 August 2014.
• Genikomsakis, Konstantinos N.; Gargiulo, Maurizio; Grohnheit, Poul Erik; (2013), TIMES demo models, EFDA-TIMES and ETSAP-TIAM
• EV-STEP: Electric Vehicles in TIMES. EV-STEP Research Note for Deliverable D3.1
14 EV-STEP Workshop, ETSAP Meeting 17 Nov. 2014